Numerosity Categorization by Parity in an Insect and Simple Neural Network
 Scarlett R. Howard1,2*
  Julian Greentree3
  Aurore Avarguès-Weber4
  Jair E. Garcia5
  Andrew D. Greentree6
  Adrian G. Dyer5,7
- 1Centre for Integrative Ecology, School of Life and Environmental Sciences, Deakin University, Burwood, VIC, Australia
- 2School of Biological Sciences, Monash University, Clayton, VIC, Australia
- 3School of Science, Royal Melbourne Institute of Technology (RMIT) University, Melbourne, VIC, Australia
- 4Centre de Recherches sur la Cognition Animale (CRCA), Centre de Biologie Intégrative (CBI), Université de Toulouse, CNRS, UPS, Toulouse, France
- 5Bio-Inspired Digital Sensing Lab, School of Media and Communication, Royal Melbourne Institute of Technology (RMIT) University, Melbourne, VIC, Australia
- 6Australian Research Council (ARC) Centre of Excellence for Nanoscale BioPhotonics, School of Science, Royal Melbourne Institute of Technology (RMIT) University, Melbourne, VIC, Australia
- 7Department of Physiology, Monash University, Clayton, VIC, Australia
A frequent question as technology improves and becomes increasingly complex, is how we enable technological solutions and models inspired by biological systems. Creating technology based on humans is challenging and costly as human brains and cognition are complex. The honeybee has emerged as a valuable comparative model which exhibits some cognitive-like behaviors. The relative simplicity of the bee brain compared to large mammalian brains enables learning tasks, such as categorization, that can be mimicked by simple neural networks. Categorization of abstract concepts can be essential to how we understand complex information. Odd and even numerical processing is known as a parity task in human mathematical representations, but there appears to be a complete absence of research exploring parity processing in non-human animals. We show that free-flying honeybees can visually acquire the capacity to differentiate between odd and even quantities of 1–10 geometric elements and extrapolate this categorization to the novel numerosities of 11 and 12, revealing that such categorization is accessible to a comparatively simple system. We use this information to construct a neural network consisting of five neurons that can reliably categorize odd and even numerosities up to 40 elements. While the simple neural network is not directly based on the biology of the honeybee brain, it was created to determine if simple systems can replicate the parity categorization results we observed in honeybees. This study thus demonstrates that a task, previously only shown in humans, is accessible to a brain with a comparatively small numbers of neurons. We discuss the possible mechanisms or learning processes allowing bees to perform this categorization task, which range from numeric explanations, such as counting, to pairing elements and memorization of stimuli or patterns. The findings should encourage further testing of parity processing in a wider variety of animals to inform on its potential biological roots, evolutionary drivers, and potential technology innovations for concept processing.
Introduction
Categorization is the ability to group certain objects or elements together on the basis of similar perceptual or functional properties while the objects are still distinguishable from each other (Zentall et al., 2002; Zhang et al., 2004; Benard et al., 2006). Categorization enables an efficient mechanism to group objects or events by shared properties (Troje et al., 1999; Zentall et al., 2002). For example, non-human animals can categorize visual stimuli such as photographs of humans (Herrnstein and Loveland, 1964), animals (Freedman et al., 2001), or food (Bovet and Vauclair, 1998).
Parity (odd/even grouping) is typically considered a relatively abstract mathematical property (Krueger and Hallford, 1984; Krueger, 1986; Clark and Campbell, 1991; Dehaene et al., 1993) which can be described as a form of number categorization. The task of classifying a numerosity as odd or even is defined and presumably determined by numerical calculations, for example, being able to determine whether a number is a multiple of two or not (Clark and Campbell, 1991), although other potential mechanisms are described in the “Discussion” section. Parity has been considered by some authors as a more demanding task than magnitude comparison (Dehaene and Cohen, 1991; Dehaene et al., 1993) in terms of the complexity of numerical calculations needed to determine whether a number is even or odd (Clark and Campbell, 1991). Studies of parity tasks in humans have revealed differences in physical spatial relationships (e.g., handedness) (Berch et al., 1999; Reynvoet and Brysbaert, 1999; Nuerk et al., 2004), accuracy, and reaction times between odd and even numbers (Hines, 1990; Nuerk et al., 2005; Alards-Tomalin et al., 2016). For example, when Arabic numerals were presented to participants on a computer screen and participants were required to respond using keys with their left or right hand, even numbers were responded to faster with the right hand than with the left hand. Similarly, odd numbers were responded to more quickly with the left hand than the right (Reynvoet and Brysbaert, 1999). Even numbers are also categorized more quickly and accurately than odd numbers in humans (Hines, 1990; Nuerk et al., 2005; Alards-Tomalin et al., 2016). There are linguistic effects on parity categorization; children aged between about 8–15 years old typically associate the word “even” with “right” and the word “odd” with “left” (Berch et al., 1999). These findings suggest that odd and even processing tasks potentially have a biological grounding in how numbers are processed beyond cultural transmission. However, no study to our knowledge has previously assessed the ability of non-human animals to perform a parity task.
The honeybee is an appealing comparative model species for testing visual and cognitive tasks (Zhang, 2006; Srinivasan, 2010; Avarguès-Weber et al., 2011a,b; Dyer, 2012). Honeybees can be trained to complete tasks and learn concepts including size discrimination (Avarguès-Weber et al., 2014; Howard et al., 2017a,b), same/different rules (Giurfa et al., 2001), and maze navigation (Collett et al., 1993; Zhang et al., 1996, 2000). Bees can also categorize natural visual stimuli (Zhang et al., 2004), abstract stimuli (Benard et al., 2006), and even human face-like stimuli (Avarguès-Weber et al., 2010b). For example, while human face-like stimuli are seemingly biologically irrelevant to honeybees, individuals can group either face-like or non-face-like stimuli, thereby demonstrating a capacity to categorize complex abstract stimuli using configural type processing (Avarguès-Weber et al., 2010b).
Invertebrates, including honeybees, have demonstrated widespread non-symbolic numerical abilities (Bortot et al., 2021). Free-flying honeybees have demonstrated a limited numerical ability to count and discriminate quantities of one to four (Chittka and Geiger, 1995; Dacke and Srinivasan, 2008; Gross et al., 2009) with classical appetitive conditioning methods. This limit of four is known as a “subitizing” number processing limit that appears common across species from very different taxonomic backgrounds (Jevons, 1871; Kaufman et al., 1949; Miller, 1956; Simons and Langheinrich, 1982; Trick and Pylyshyn, 1994; Chittka and Geiger, 1995; Piazza et al., 2002; Tomonaga and Matsuzawa, 2002; Saaty and Ozdemir, 2003; Agrillo et al., 2008; Dacke and Srinivasan, 2008; Gross et al., 2009; Cowan, 2010; Gómez-Laplaza and Gerlai, 2011; Rugani et al., 2013; Seguin and Gerlai, 2017), although for some species it is higher or lower than four (Hassmann, 1952; Miller, 1956; Simons and Langheinrich, 1982; Davis and Pérusse, 1988; Saaty and Ozdemir, 2003; Nieder, 2005; Cowan, 2010; Carazo et al., 2012). The existence of a numerical processing limit at about four objects/elements, suggests the underlying neural mechanism may be evolutionarily conserved (Giurfa, 2019). Using appetitive-aversive conditioning procedures, where correct choices result in a reward while errors result in an aversive outcome and thus promote visual attention (Avarguès-Weber et al., 2010a), honeybees can acquire the capacity to discriminate between quantities above the subitizing limit of four (Howard et al., 2018a, 2019c). Honeybees have become an important comparative model for understanding numerical cognition and have demonstrated an ability to order zero numerosity at the lower end of the positive number line (Howard et al., 2018b,a), perform simple addition and subtraction (Howard et al., 2019a,b), match abstract characters to small quantities (Howard et al., 2019d), relate size and number concepts (Bortot et al., 2019b), and perform quantity discrimination (Howard et al., 2018a, 2019c, 2020a; Bortot et al., 2019a).
Due to the demonstration of efficient learning of cognitive-like problems in honeybees (Zhang and Srinivasan, 2004; Srinivasan, 2010; Avarguès-Weber and Giurfa, 2013), they are also becoming a popular insect model for bio-inspired technology. Insects, such as honeybees, demonstrate many goal-directed and plastic behaviors that are currently beyond the capacity of today’s artificial systems (Helgadóttir et al., 2013). This ability makes them useful in a range of bio-inspired technologies and designs including computing, sensory processing in robots, and concept learning in machines (Helgadóttir et al., 2013; Sandin et al., 2014; Kleyko et al., 2015). The examination of honeybee flight strategies, cognition, and vision have been useful in developing artificial intelligence, flight control, aerial machine navigation, accurate distance estimation, successful landing procedures, and the regulation of flying height (Srinivasan et al., 1999; Srinivasan, 2006, 2011; Bukovac et al., 2013). Honeybee processing has also been used in the creation of computational models of biological systems, known as neuromorphic systems.
Neuromorphic systems are designed for processing real-world problems by being able to cope with uncertainty and use brain-like computations. Honeybees live in complex environments and can learn concepts to solve problems, thus they are considered an ideal model for neuromorphic systems (Helgadóttir et al., 2013; Sandin et al., 2014; Kleyko et al., 2015). More recently, some authors have shown that simple artificial neural networks consisting of a small number of neurons are able to perform some of the complex numerical tasks which honeybees have successfully learnt. For example, Vasas and Chittka (2019) were able to demonstrate that a neural network consisting of just four neurons could distinguish between numerosities up to six elements. Similarly, MaBouDi et al. (2021) created a simple neural network of nine neurons which could solve a numerosity task using spatial frequency as a cue. This recent work suggests that honeybees may be useful in designing more efficient neuromorphic computing systems which use less computational power than many current solutions. The advantage of bio-inspired neural models is that Darwinian evolution has likely enabled efficient solutions as biological brains need to be highly efficient with energy (Niven et al., 2007). For example, an integrated circuit based on the biological principle of spiking neurons is capable of operating on significantly lower energy requirements (Merolla et al., 2014), and neuromorphic computing solutions may avoid the complexity and cost of traditional computer architectures (Sandin et al., 2014).
Given the ability of honeybees to learn abstract numerical tasks, we decided to investigate whether bees may be able to learn to discriminate between odd vs. even numerosities. We employed appetitive-aversive conditioning as has previously been shown to promote visual attention and learning (Chittka et al., 2003; Avarguès-Weber et al., 2010a; Howard et al., 2019c). To elicit mechanistic solutions, it is possible to construct artificial neural networks that simulate how a low number of neurons can learn seemingly complex mathematical problems. Such work reveals that as few as four neurons are capable of processing quantities and also enable concept processing like empty sets (zero) being quantitatively less than positive integers (Vasas and Chittka, 2019).
Here we test and demonstrate the capacity of honeybees to learn to categorize odd and even numerosities of elements between one and ten, and extrapolate that acquired knowledge to categorize novel numbers in terms of parity. We then constructed a simple neural network to understand if a miniature artificial brain can have access to processing the concepts of odd and even. We discuss how such simple neural mechanisms can benefit neuromorphic computing by enabling alternative architectures that can be implemented which save time, energy, and money.
Materials and Methods
Experiment 1: Odd vs. Even Categorization by Honeybees
Study Species and Recruitment
Experiments were conducted with free-flying honeybees (Apis mellifera) in Toulouse, France during summer in 2017. Foragers (n = 26) were recruited from a gravity feeder providing ca. 10–20 % (by volume) sucrose solution, and each marked with a different color on the thorax to identify individual bees used in the experiments. Honeybees were recruited from over 25 hives maintained at Paul Sabatier University in Toulouse, France.
Apparatus
Individual honeybees were trained to visit a vertical rotating screen, 50 cm in diameter (Dyer et al., 2005). The screen allowed the spatial arrangement of stimuli to be randomly changed throughout the experiment, thus excluding positional cues. Stimuli were presented vertically on 6 × 8 cm moveable hangers with a landing platform attached below the presentation area. Hangers and surrounding screen areas were washed with 30% ethanol and then water between choices, foraging bouts, and before each test to prevent the use of olfactory cues (Zhang et al., 1996; Howard et al., 2017a,b). One bee was tested at a time during training and testing phases, which typically lasted 2–4 h per bee.
Four stimuli (two stimuli with an identical even number of elements; two stimuli with an identical odd number of elements) were presented simultaneously above landing platforms on the respective hangers. During training a 10 μL drop of either 50% sucrose solution (CS+) or 60 mM quinine solution (CS-) were placed on the platforms and used as rewarding and punishing outcomes for correct and incorrect choices, respectively, during the training phase, as this promotes enhanced visual discrimination performance (Avarguès-Weber et al., 2010a) and quantity discrimination (Howard et al., 2019c).
Stimuli
All stimuli were covered with 80 μm Lowell laminate. Stimuli were 6 × 6 cm white card squares presenting multiple black geometrical elements varying in size (Figure 1 and Supplementary Figure 1). Each stimulus was composed of elements of a single shape out of four options: circle, square, diamond, or triangle. The stimuli were changed following a pseudo-random order between bouts (return of bee to the hive), therefore a bee could make multiple choices (up to six) on the same set of stimuli in a single bout, although this was uncommon (generally 2–3 choices). During the preference test and training phase, the number of elements presented to bees ranged from 1 to 10 and only three of the four possible element shapes (circle, square, diamond, triangle) were used (Supplementary Figure 1). During the transfer test stimuli consisted of 11 or 12 elements of the same four possible element shapes (Supplementary Figure 1). The cumulated surface area of the black elements was 10 ± 0.3 cm2 regardless of shape, configuration, or number of elements. It is important to note that non-numerical cues correlating with magnitude, such as surface area, perimeter, edge length, spatial frequency, convex hull, density, or size of elements, do not predict the parity of a stimulus and thus bees were unable to use these cues to solve the task. There were 180 different stimuli available to be presented consisting of different element number, shape, and overall element configuration (Supplementary Figure 1) and additionally each stimulus could be presented at one of four rotational orientations (with the exception of symmetrical stimuli such as those containing one element). In addition, odd and even numbers were presented in a pseudo-random order, within subject, to ensure ∼50% of even numbers were higher than the odd number and ∼50% were lower than the odd number, thereby excluding bees from learning a magnitude task. Stimuli were analyzed for symmetry to determine if this could be a possible cue for bees to learn to classify numerosities as odd or even (Giurfa et al., 1996). We compared the horizontal and vertical bisections of all stimuli for symmetry scores and compared these between odd and even stimuli. There were no significant differences in symmetry between odd and even stimuli (see Supplementary Material for full details), thus this could not be a cue driving bee choices.
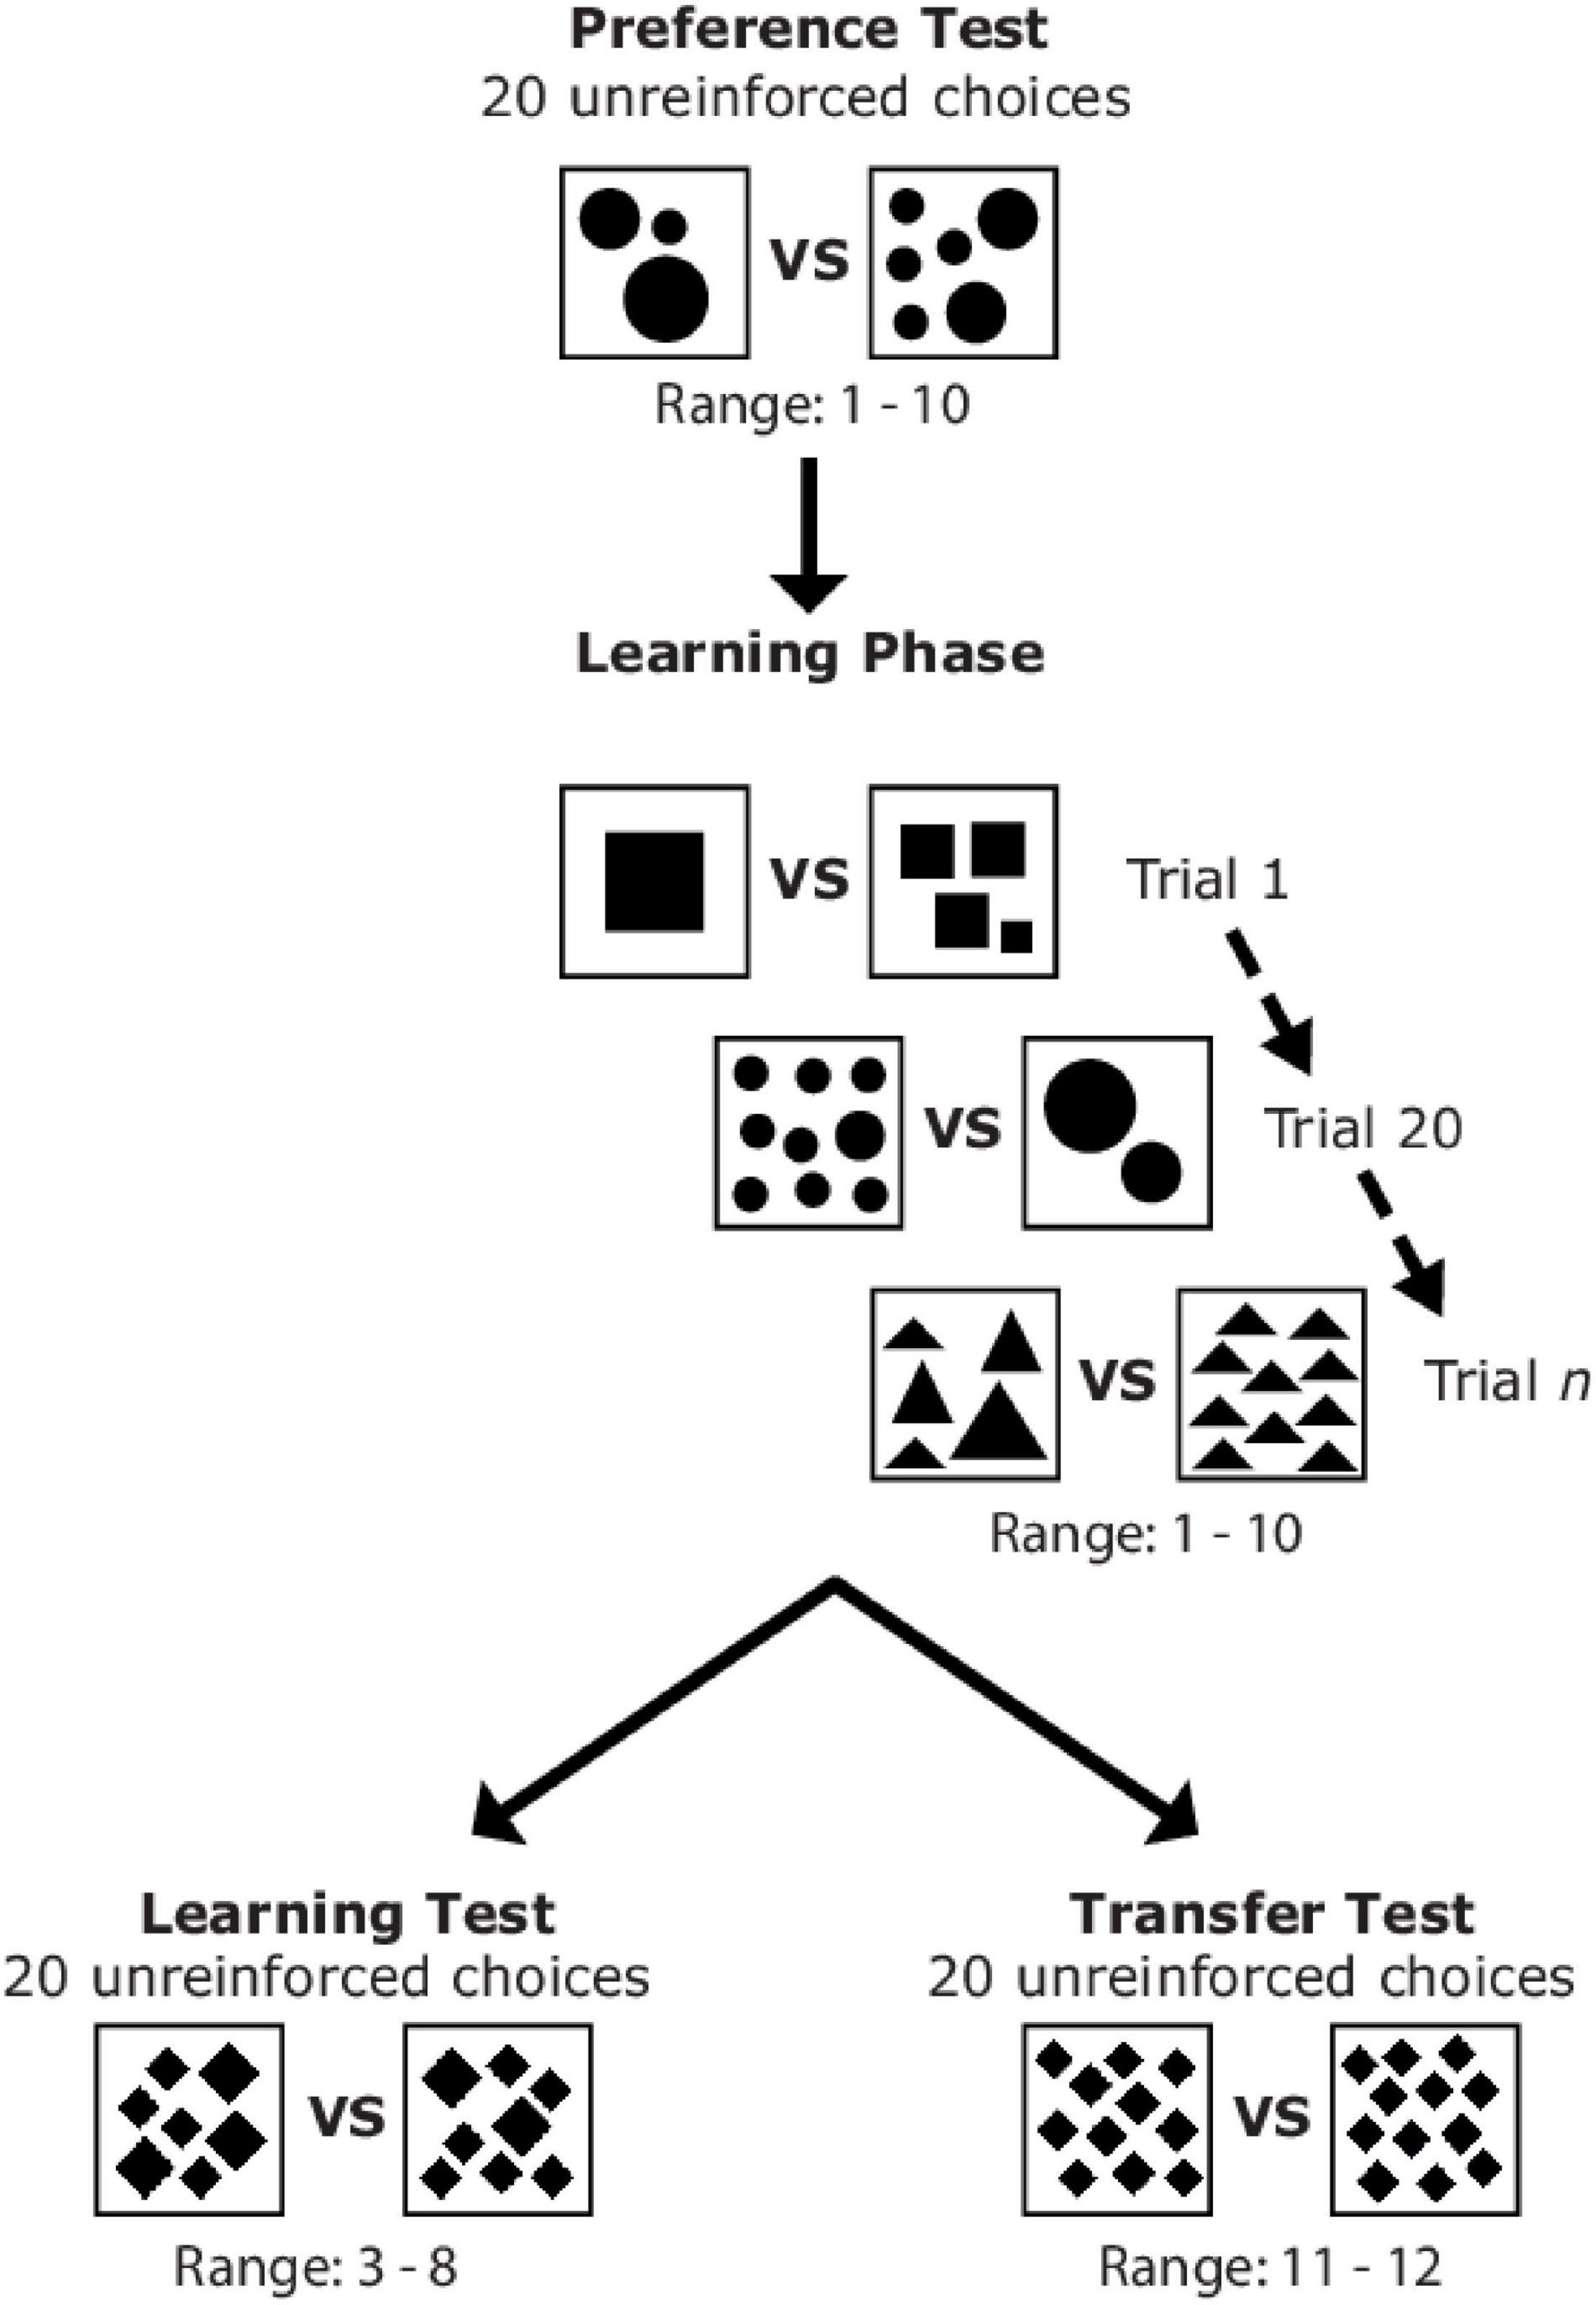
Figure 1. Sequence of the different phases of Experiment 1 and examples of stimuli which could be presented to a bee during the preference test, learning phase, learning test, and transfer test.
Overview of Learning and Testing Phases
A counter-balanced design was used for this experiment, where one group of bees was trained to associate stimuli consisting of an even number of elements with a reward (n = 13), while a second group of independent bees were trained to associate stimuli containing an odd number of elements with a reward (n = 13). Group testing order was random. The experiment consisted of four parts: Preference Test, Learning Phase, Learning Test, and Transfer Test (Figure 1). Refresher training occurred between the learning and transfer tests to maintain bee motivation to revisit the apparatus and lasted for one foraging bout (Howard et al., 2017a,b). A choice was defined as a bee touching or landing on the hanger platform and tasting the drop of sucrose or quinine for learning trials. For the tests, a choice was considered as any touch of a hanger platform or the stimulus.
Preference Test
After bees had learnt to land on the hanger platforms without stimuli present (gray background) to receive a reward of sucrose, we conducted a preference test. The preference test involved recording 20 unreinforced choices (no reward or punishment for landings) for two numbers which were randomly selected to include one even and one odd number consisting of 1–10 elements (Figure 1) using one randomly selected element shape from the four options. In this test we thus determined if bees had any prior preferences to odd or even element numbers prior to the learning phase. A 10 μL drop of water was used as a neutral substance to motivate bees to land on the platforms.
Learning Phase
Learning phase stimuli were displayed on hangers and choices of bees were recorded until individuals reached a criterion of ≥ 80% for 10 consecutive choices (one trial block) after a minimum of 20 choices had been made (Howard et al., 2018a). A choice/trial during training was defined as a visit to the stimulus including drinking/tasting the substance on the hanger platform using the proboscis, antennae, or leg (Morawetz et al., 2013). Stimuli were randomly allocated for each bee and changed between bouts and landings. Two randomly selected numbers consisting of 3–8 elements (excluding boundary numbers; one randomly selected even number and one randomly selected odd number) were not presented to bees during the learning phase so these two numbers could be used as novel test stimuli during the learning test.
Bees generally made between 2 and 6 correct choices during each bout before they became satiated and returned to the hive. When a bee made an incorrect choice, it was allowed to continue making choices until a correct choice was made. Once a bee made a correct choice, it was collected onto a plexiglass spoon providing a 10 μL drop of 50% sucrose solution and placed behind an opaque barrier one meter away from the screen to drink while the stimulus element number and positions were randomly changed, and the platforms and surrounding areas were cleaned. After this, bees could either continue making choices or return to the hive if satiated. Bees generally returned from the hive within 5 min, during which time the apparatus was cleaned, new stimuli were placed on the hangers, and drops of sucrose and quinine were placed onto the hanger platforms. After bees had reached the learning criterion, they were collected onto a plexiglass spoon with sucrose, allowed to drink until satiated and then returned to the hive so the test stimuli could be introduced. Bees could then return to the experiment for the testing phases.
Learning Test
The learning and transfer tests were conducted in a pseudo-random order, balancing the number of times the learning or transfer test occurred first. After bees had reached criterion in the learning phase, we presented a learning test using novel numbers, shape, and patterns to determine if bees had learnt to discriminate between “even” and “odd” numerosities. Numerosities used in this test were randomly chosen at the beginning of each experiment, excluding the two lowest or highest quantities in the training set (i.e., excluding 1, 2, 9, and 10; one randomly selected even number and one randomly selected odd number: 3, 5, or 7 and 4, 6, or 8). We recorded 20 unreinforced choices for this test. A 10 μL drop of water was placed on the platforms to motivate bees to land during the learning test.
Transfer Test
The transfer test to higher quantities outside of the original training set consisted of presenting bees with stimuli containing 11 and 12 elements of novel shape and pattern. This test aimed to determine if bees could differentiate between odd and even numerosities outside of the training set. We recorded 20 unreinforced choices per bee for this test. A 10 μL drop of water was placed on the platforms to motivate bees to land during the transfer test.
Time Recordings
Using a video camera, we were able to record the duration of both tests for seven of the bees (four trained to even; three trained to odd) to determine if there was a difference in the time taken to complete a test with lower numbers (learning test: 3–8 elements) and higher numbers (transfer test: 11 and 12 elements). The time was measured from the first choice to the last choice of the bee over the course of 20 choices.
Statistical Analysis
Did Bees Have an Innate Preference for Odd or Even Numerosities?
To determine whether bees had any prior preference to odd or even numerosities before training we estimated the mean of the “even number” choices, the intercept of a generalized linear mixed model (GLMM) with a binomial response, using individual bees as a random, categorical variable to account for the repeated measurements. Choice (even or odd number) was coded as a binary response (even or odd) modeled by a binomial distribution. The statistical tests and models were performed on the R environment for statistical analysis using the routine “glmer” available as part of the “lme4” package written for the R statistical language, run in R version 4.0.3 analysis (R Core Team, 2020).
Did Bees in Both Groups Learn Equally?
To determine if the bees in the two groups (trained to even; trained to odd) learnt equally, we statistically compared the number of trials required for bees to achieve criterion in both groups by means of a GLM model. The response variable included the number of trials taken to reach criteria by bees belonging to each group and stimuli group as a categorical predictor with two levels: even and odd. We initially assumed a Poisson distribution to model the response variable but the resulting model was overdispersed (overdispersion = 2.98). We thus assumed a negative binomial distribution for the response variable as usually done to alleviate overdispersion of Poisson models (Zuur et al., 2013). We used the routine “glm.nb” available in the package MASS (Venables and Ripley, 2002) for the R statistical program to fit the negative binomial model.
Could Bees Learn and Apply Odd and Even Number Categorization?
To determine whether bees could apply the concepts of odd and even in the learning and transfer tests with novel numbers, patterns, and shape, we analyzed the learning and transfer test data with the same statistic as described in section “Did Bees Have an Innate Preference for Odd or Even Numerosities?”. We estimated the mean of the “correct” choices, the intercept of a GLMM with a binomial response, using individual bee ID as a random, categorical variable to account for the repeated measurements. Choice (correct or incorrect) was coded as a binary response modeled by a binomial distribution.
Were Results Consistent Across Groups and Tests?
We implemented a GLMM to determine if there were any asymmetries within the two tests (learning test; transfer test) and between the two groups trained to “even” and “odd” numbers. The model consisted of two fixed factors: test type and experimental group both with two levels, an interaction term between these two predictors, and a random term to account for the repeated measures collected from each individual bee. The response variable of the model consisted of the outcome of bee choices for each of the 20 trials coded as correct or incorrect. A binomial distribution was assumed for the response variable. The two levels of the test factor were learning test and transfer test. The two levels of the experimental group factor were bees trained to “even” numbers and bees trained to “odd” numbers. A total of 26 bees were divided across the two levels of the experimental group factor (13 in each group), and each bee was then tested under all levels of the test factor.
The model was fitted using the routine “glmer” available in the lme4 library (Bates et al., 2015) available for the R language. Statistical significance of the model terms was tested by means of Type III Wald Chi square test using routines available in the package car (Fox and Weisberg, 2019) for R.
Was There a Difference in Time Taken to Perform the Tests?
To determine if there was a difference in the time taken for bees to complete the learning test with lower numbers ranging from 3 to 8 compared to the transfer test of higher numbers 11 and 12, we used a Wilcoxon signed-rank test comparing the two related conditions (each bee participated in both tests). We compared seven bees for the time taken to complete the learning and transfer tests. This analysis was performed on the R environment for statistical analysis (Sokal and Rohlf, 1981; R Core Team, 2020).
Analysis of the Stimuli
To determine whether there was a significant difference in the spatial information content for the odd and even stimuli, we calculated the rotational average of the power spectrum of each image to produce a frequency spectrum for each image using the fast Fourier transform routine available in MATLAB release 2016b. We then calculated the area under each spectrum corresponding to the stimuli of the odd and even sets, and compared them by means of a Wilcoxon rank-sum test.
Experiment 2: Discrimination of 11 vs. 12
Using a similar protocol as detailed above in Experiment 1, we trained and tested bees on their ability to discriminate between stimuli containing 11 and 12 elements. This experiment was performed in 2018, as their ability to categorize those numerosities during the transfer test in the Experiment 1 was unexpected considering the honeybee’s previous limit of counting and discriminating numerosities. One group (n = 5) was trained to choose 11 elements while a second group was trained to choose 12 elements (n = 5). The learning test to determine if bees could differentiate between 11 vs. 12 was conducted with stimuli similar to the training set of novel patterns while the transfer test was conducted with multiple randomized, previously unseen element shapes (Supplementary Figure 3). We have provided video footage of an example of a bee completing this task (Supplementary Video 1).
Stimuli
Stimuli were 6 × 6 cm white card squares presenting multiple black elements. All stimuli were covered with 80 μm Lowell laminate. Elements were one of four shapes: circle, square, diamond, or triangle. The stimuli were changed following a random order between bouts (return of bee to the hive). During all phases of training and testing, bees were presented with stimuli containing either 11 or 12 elements, where one numerosity was rewarding and the other was punishing (counter-balanced). There were 66 different stimuli available to be presented consisting of different element number, shape, and overall element configuration (Supplementary Figure 3) and additionally each stimulus could be presented at one of four orientations. The training and learning test stimuli were varied between having equal overall black surface area for the pattern (set 1; equal black surface area of 10 cm2) and elements all of equal surface area (set 2; each element was 1 cm2). The transfer test stimuli were random shapes and objects not previously presented to bees (set 3).
Statistical Analysis
To determine whether bees could discriminate between the quantities 11 and 12 during testing, we estimated the mean of the “even number” choices, the intercept of a GLMM with a binomial response, using individual bees as a random, categorical variable to account for the repeated measurements. Choice (11 or 12) was defined as a fixed effect with a binary response. The statistical tests and models were performed on the R environment for statistical analysis (R Core Team, 2020).
Experiment 3: Odd vs. Even Categorization by a Simple Neural Network
To understand if a simple neural network is potentially able to perform odd and even categorizations of numerosities, we built and tested a model based on five neurons. The number of neurons employed was derived by a preliminary logic analyses of what type of network might plausibly enable processing (Vasas and Chittka, 2019). Our model was implemented in Python 3 and is schematically depicted in Figure 2 by employing a simple propagation through the neural network that is iterated concurrently with the signal.
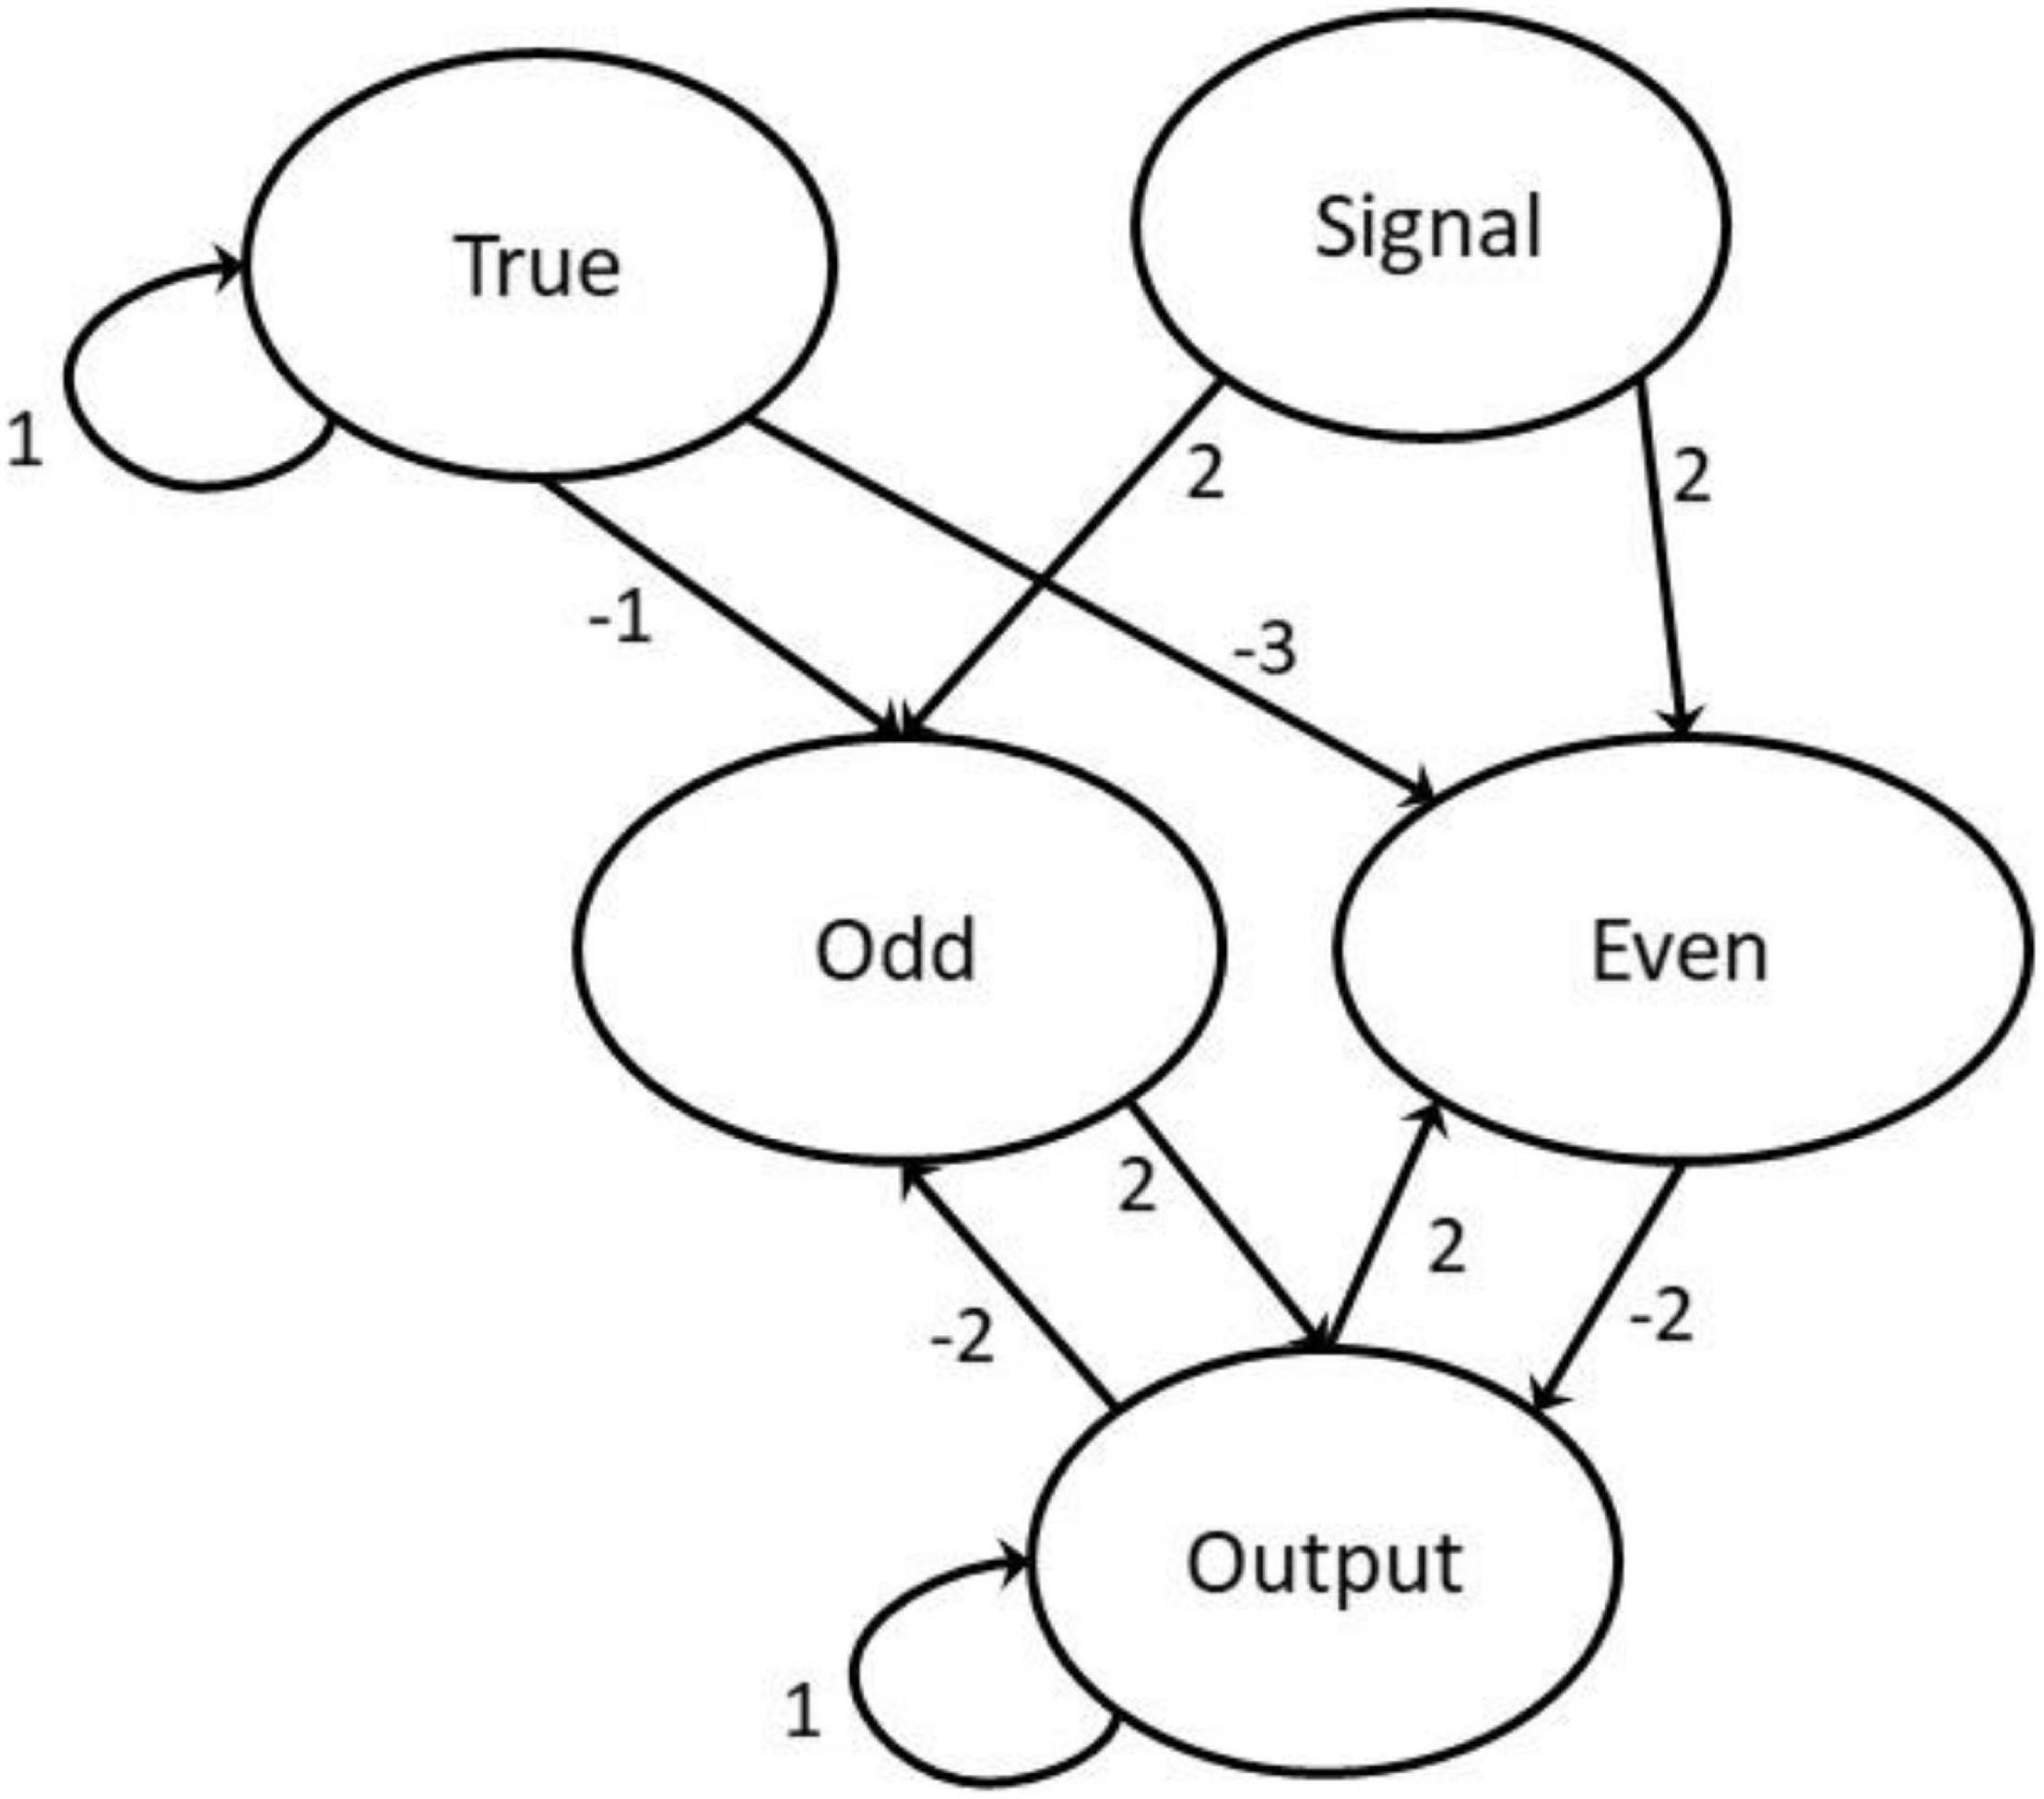
Figure 2. The neural network with weightings marked with directed arrows.
The network comprises the following five neurons: Signal, True, two intermediary neurons, and Output. The Signal neuron receives a processed string of short excitations, modeled as a list of uniform strength signals (normalized to 1) separated by dormant regions of 0 magnitude of varying lengths. The two intermediary neurons model Even and Odd, respectively, filtering out the cases where the signal is even or odd and then affect the appropriate modification to the Output neuron. This is achieved using feedback from the state of the Output neuron. The Output neuron acts as both ongoing storage and the read-out value. The True neuron is activated at all points in time and is used for filtering the required strength of inputs to elicit a reaction from the activation function. Both the True and Output have strong weightings with themselves, meaning that without outside affects they hold their values indefinitely. In the modeling experiments a signal was entered concurrently with the propagation by setting the signal neuron’s value according to a signal list. New neuron values [Xn (t + 1)] are obtained by summing the weighted values of all neurons (wmXm(t)) before passing them into the activation function.
We used the linear activation/cleaning function from Vasas and Chittka (2019), which is motivated by neurons mirroring rapidity responses between a maximum and minimum value:
The weighting values are specifically calculated to create the desired effect and not generated through a regression or optimization algorithm. The values of all neurons are initialized dormant (with a value of 0) except the True neuron which is initialized at 1.
An example of the implementation of the model can be seen in Figure 3, with the Signal (red) and complementary firings of the two intermediary neurons (Even—green, Odd—black) at a minor delay of one time step, with the Output neuron (blue) toggling states at another slight delay. The True neuron has been omitted for clarity but has a value of 1 at all times during the process.
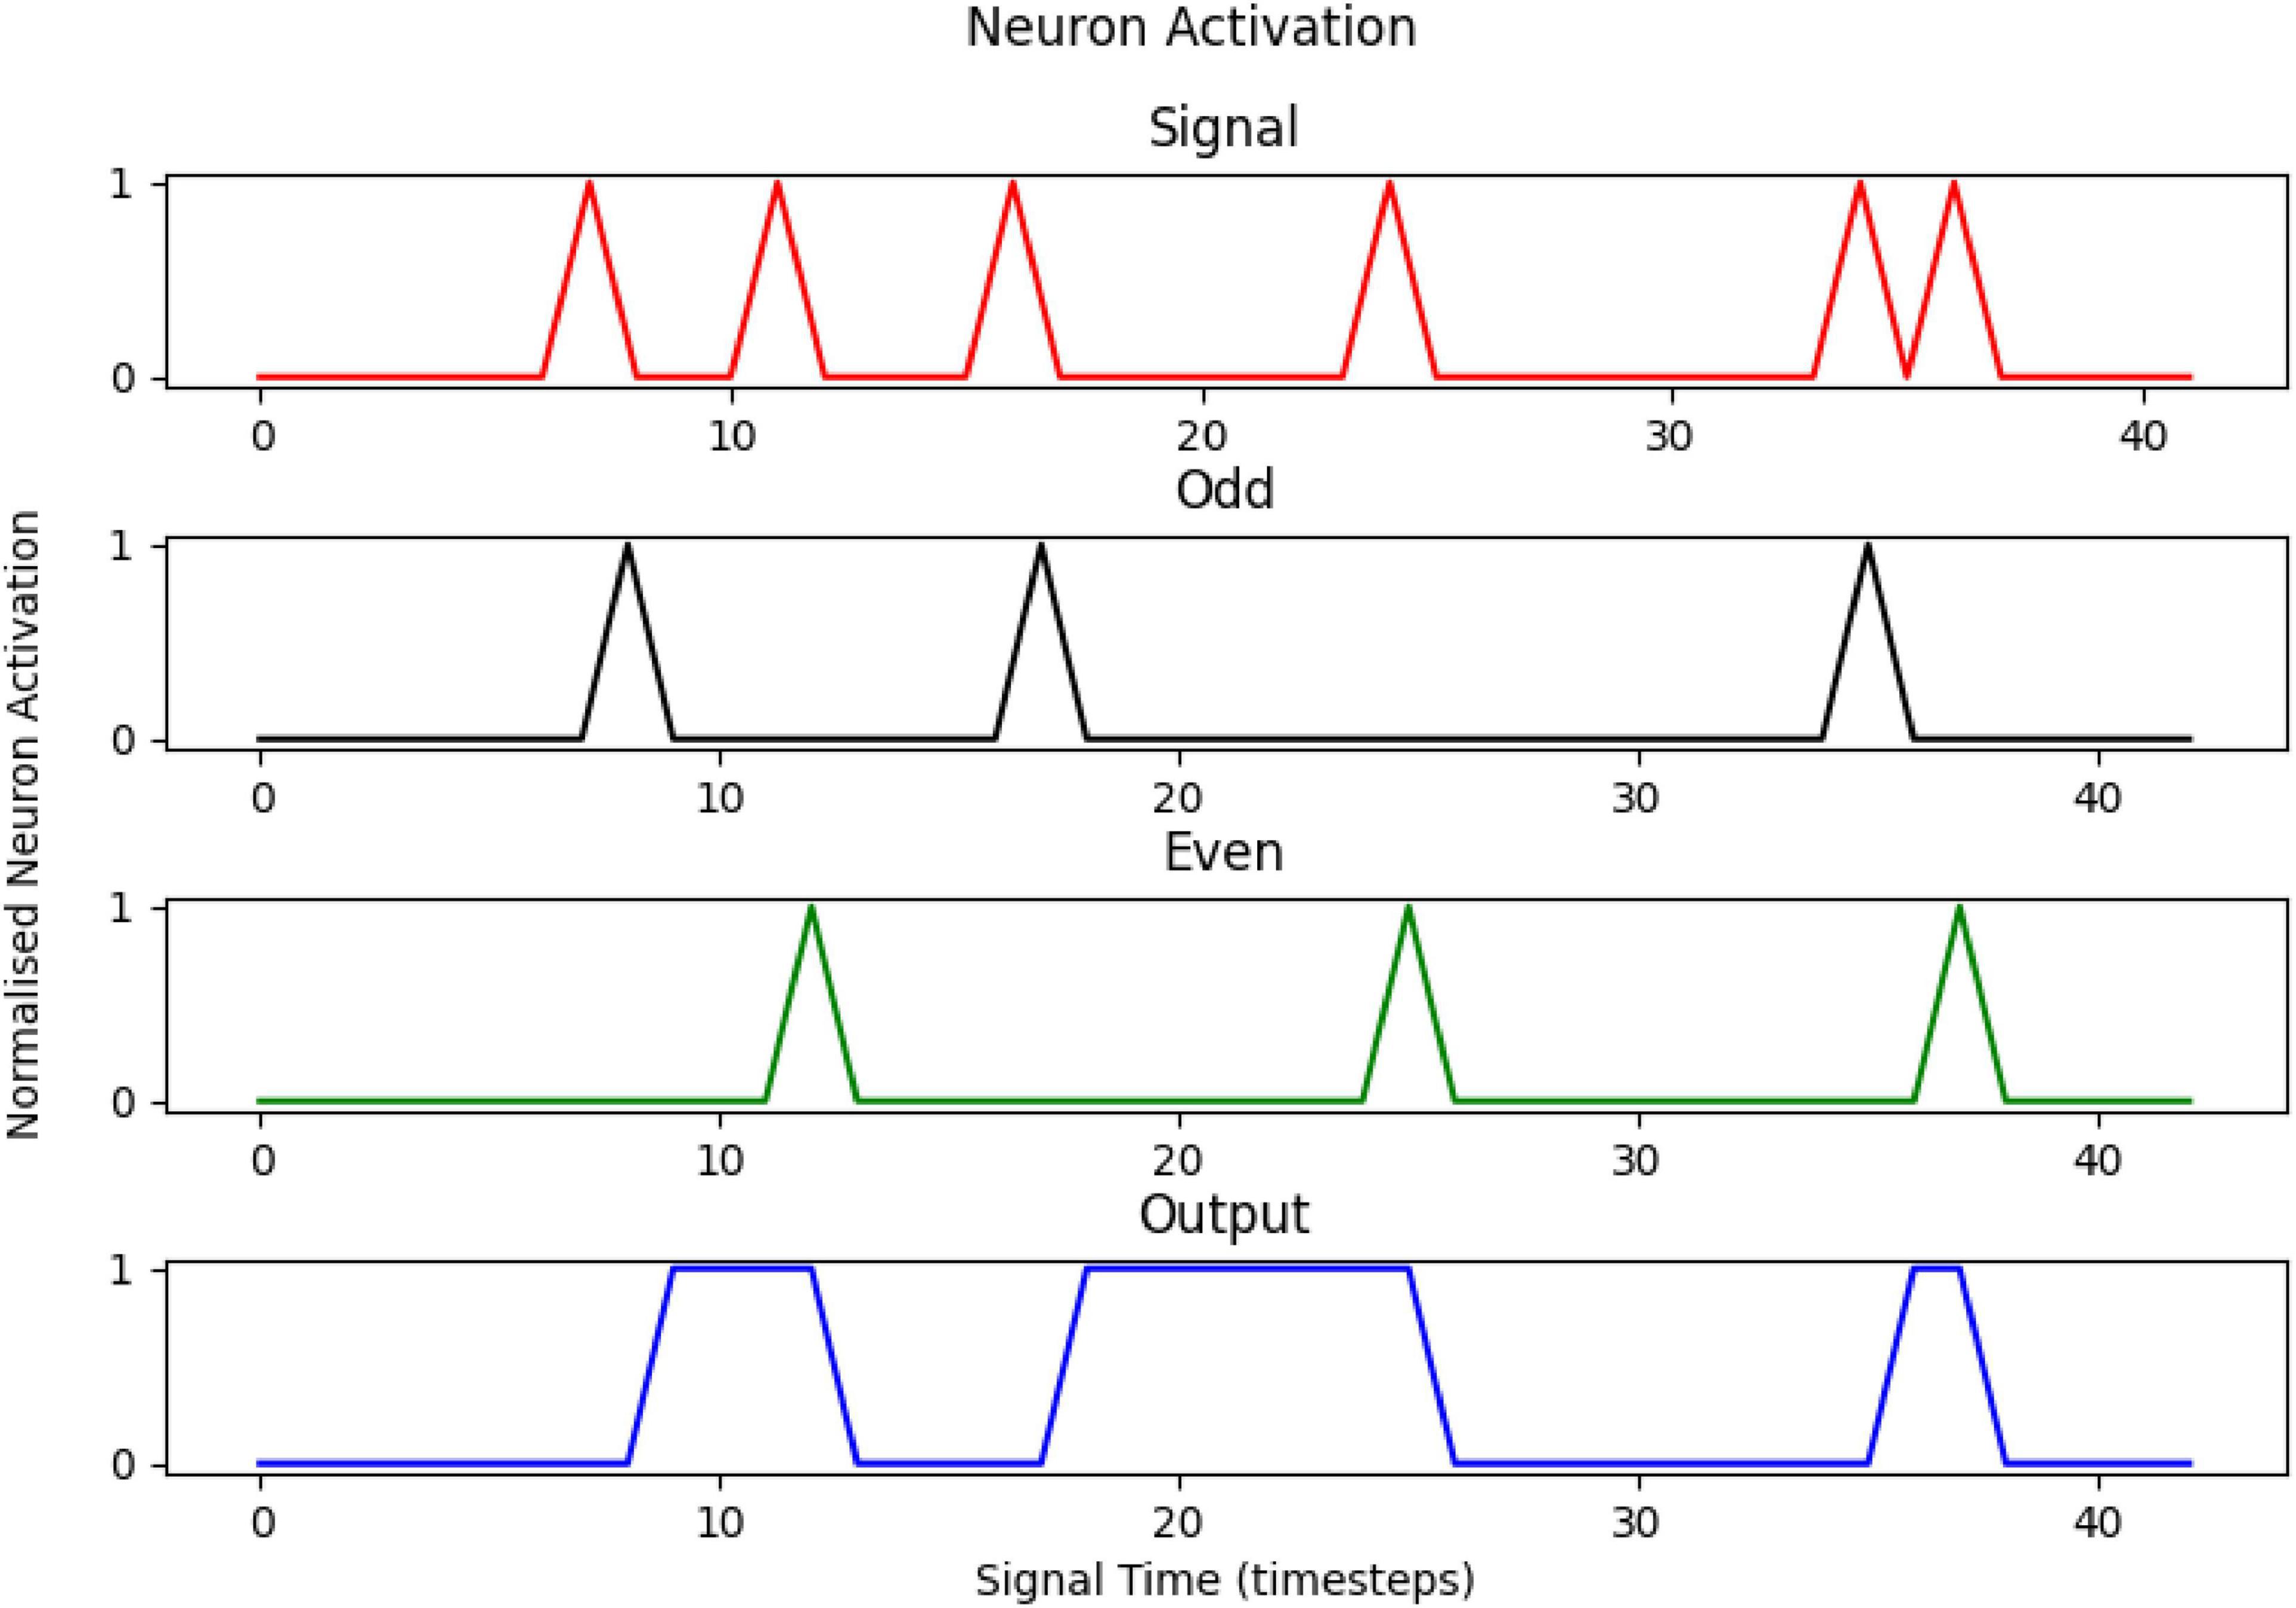
Figure 3. The activation profiles of the neurons in the artificial neural network, for a sample signal of 6 pulses. The output is 1 for an odd signal and 0 for an even one.
Because of the concurrent signal feed into the neural network through the Signal neuron the computation time scales linearly with the length of the signal and is not directly affected by the size of the number being counted (except insofar as larger numbers will likely generate longer signals, and it must be possible for a sensory system to resolve such information). It is also not related to subitization thresholds nor explicitly related to counting and memory storage, only requiring the ability to separate all the objects being counted without repetition, a task which has been demonstrated to be possible for numbers larger than the subitization threshold (Howard et al., 2019c). The characteristics of the iterative method imply an ability to extrapolate accurate results for elements outside a learning set.
Whilst we cannot maintain this simple artificial neural network is indeed how an individual honeybee might actually learn to solve odd/even categorizations, the proposed neurons are consistent with how phasic or tonic neuron responses are processed in bee brains. For example, the flow of visual information in the bee eye begins at the retina level within each ommatidia, which subsequently project inputs to visual sequential processing areas including the lamina, the medulla, and the lobula before integration processing by the mushroom body (Menzel, 1973; Hertel and Maronde, 1987; Hertel et al., 1987; Yang and Maddess, 1997; Paulk et al., 2008). In the lobula of the bumblebee brain there are six anatomically distinct layers that display different levels of phasic–tonic, phasic, tonic, and/or on–off responses following visual stimulation including motion sensitivity (Paulk et al., 2008) as might be engaged in bee scanning of patterns (Vasas and Chittka, 2019). Our model is thus biologically plausible, and demonstrates that a parity categorization task might be possible using relatively few neurons.
Results
Experiment 1: Odd vs. Even Categorization by Honeybees
Using appetitive-aversive differential (reward-aversion) conditioning (Avarguès-Weber et al., 2010a; Howard et al., 2019c), bees were trained to choose either “even” numerosities of elements (Group 1) or “odd” numerosities of elements (Group 2) as the correct option. Bees were trained to reach a criterion of ≥ 80% over 10 choices using the quantities of 1–10 (Figure 1). All bees reached criterion by 70 choices and none were discarded from analysis. Before this learning phase was conducted, bees were tested for their potential preference for even or odd numerosities of elements for 20 choices (using quantities 1–10). After training, bees were tested on their ability to categorize novel numbers within the learning set (learning test; 20 choices; 3–8 elements), and novel numbers outside of the learning set (transfer test; 20 choices; 11 vs. 12 elements; Figure 1).
Preference Test
Overall bees chose even numbers in 47.7 ± 3.8% of choices [mean ± standard error of the mean (SEM)] and odd numbers in 52.3 ± 3.8% of choices. These choices were not significant from chance (H0 = 50%, z = −0.396, P = 0.692, n = 26), therefore there was no evidence of a significant preference for odd or even numerosities among bees before training began.
Learning Phase
All bees in the group trained to even numbers (Group 1, n = 13) reached criterion within 70 choices, with an average of 49.0 ± 4.0 choices to reach criterion (Figure 4A). All bees in the group trained to odd numbers (Group 2, n = 13) reached criterion within 50 choices with an average of 36.0 ± 2.0 choices to reach criterion (Figure 4A). There was a significant difference in number of trials/choices taken to reach criteria between the two groups (z = −3.129, P = 0.002) with bees trained to associate odd numerosities with a reward reaching criterion in less choices.
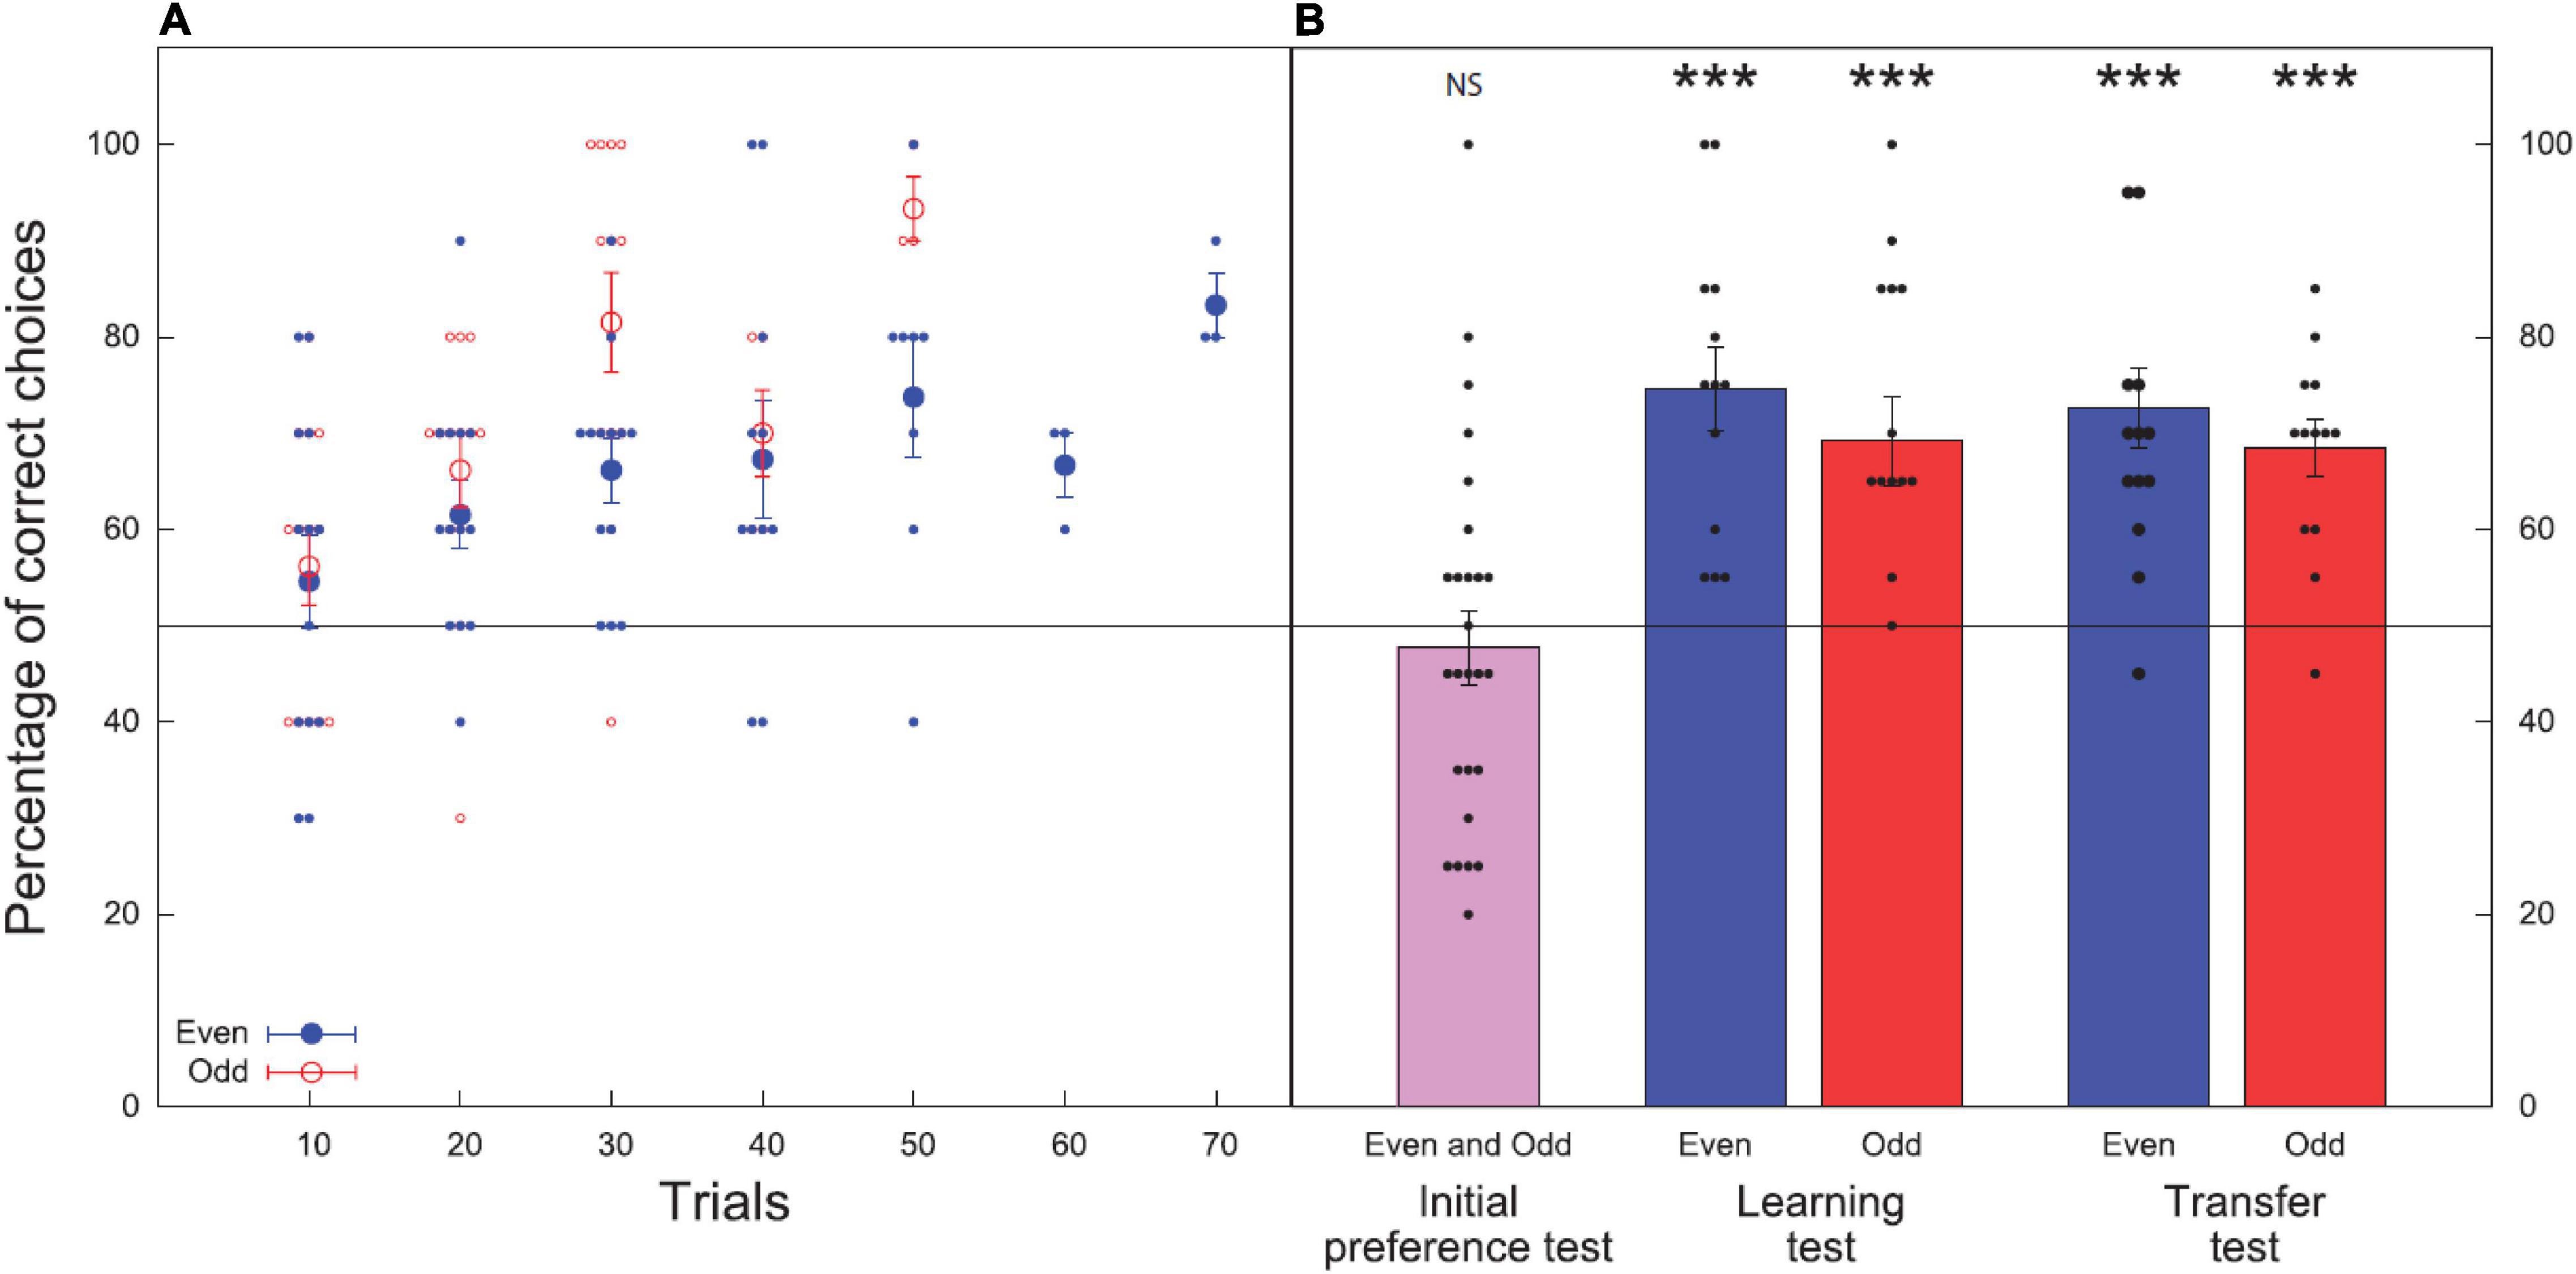
Figure 4. Bee performance during the learning and test phases: initial preference test, learning test, and transfer test. Data shown are means ± standard error of the mean (SEM) for both treatment groups (even; odd). N = 13 bees were used in each group for each test, 26 bees were tested overall. Black line at 50% indicates the chance level performance. (A) Results of the learning phase (before reaching criterion). Closed blue circles show bees trained to even numbers while open red circles show results for bees trained to choose odd numbers. Larger circles show the mean ± SEM and smaller circles show the individual results of each bee. (B) Results of the preference, learning, and transfer tests for the respective groups (even; odd). Initial preference test shows the results of all 26 bees for their initial preference (before training) for even element numbers. Black circles show the individual results of each bee for all tests. Significance from chance level performance is indicated by NS > 0.05, *** ≥ 0.001. There was no significant difference between the learning and transfer tests.
Learning and Transfer Tests
In the learning test, bees trained to even numbers (Group 1) chose the correct stimulus with an accuracy of 74.6 ± 4.3%. The number of correct choices made during the unreinforced learning test was significantly higher than the chance expectation equivalent to 50% (z = 4.599, P < 0.001, n = 13). Bees trained to odd numbers (Group 2) chose correct stimulus with an accuracy of 69.2 ± 4.7% (z = 4.742, P < 0.001, n = 13; Figure 4B).
In the transfer test, where bees were presented with odd and even numbers of novel shape and pattern from outside of the learning set boundaries, the group trained to associate even numerosities with a reward (Group 1) chose the correct stimulus with an accuracy of 72.7 ± 4.1% (z = 4.627, P < 0.001, n = 13). Bees trained to associate odd numbers with a reward (Group 2) chose the correct stimulus with an accuracy of 68.5 ± 2.9% (z = 5.693, P < 0.001, n = 13; Figure 4B).
We found no significant effect of the interaction term in the GLMM fitted to test for consistency in the accuracy of the bees performance, evidencing that the proportion of correct choices was the same between tests and groups (test × groups: χ2 = 0.010, df = 1, P = 0.920). Moreover, we found no significant difference in the proportion of correct choices obtained by bees in the learning and transfer tests (χ2 = 2.99, df = 1, P = 0.083), nor in the proportion of correct choices obtained for the even and odd groups (χ2 = 0.389, df = 1, P = 0.533). This shows that bees can learn and transfer the concepts of odd and even numbers to novel numbers within and beyond their training set with similar accuracy.
Count data from the learning test for bees trained to even [Shapiro-Wilk’s test (W) = 0.840, df = 13, P = 0.021] or odd (W = 0.844, df = 13, P = 0.022) were not normally distributed. Count data for bees trained to even (W = 0.869, df = 13, P = 0.050) and odd (W = 0.952, df = 13, P = 0.632) in the transfer test were normally distributed. We thus performed an additional robust split-plot ANOVA on 20% trimmed means (Q statistic) (Wilcox, 2011) to validate the results of the parametric test. Results supported the findings of the first analysis evidencing that there was no significant difference between the correct choices performed by bees trained to even or odd numerosities (Q = 0.006, P = 0.942), nor differences between the different tests (Q = 1.69, P = 0.213). The interaction term between the two factors was also non-significant at α = 0.05 (Q = 0.160, P = 0.695). This shows bees reliably transferred the acquired concepts from the learning set to the novel numbers of 11 and 12.
Analysis of Time
To assist in understanding potential mechanisms that might enable parity categorization in bees, we additionally compared the time taken to complete each test for seven bees (recording from the first choice of a stimulus to the last choice in the test). In the learning test with a lower number of elements, bees took an average of 45.0 ± 5.8 s to complete the task (n = 7), while in the transfer test with a higher number of elements, bees took 61.0 ± 9.3 s to finish (n = 7; Figure 5). There was a significant difference between the two test times [Wilcoxon signed-rank test value (W) = 2.000, P = 0.041], which could be due to a number of reasons including the task complexity, discussed below in the “Discussion” section.
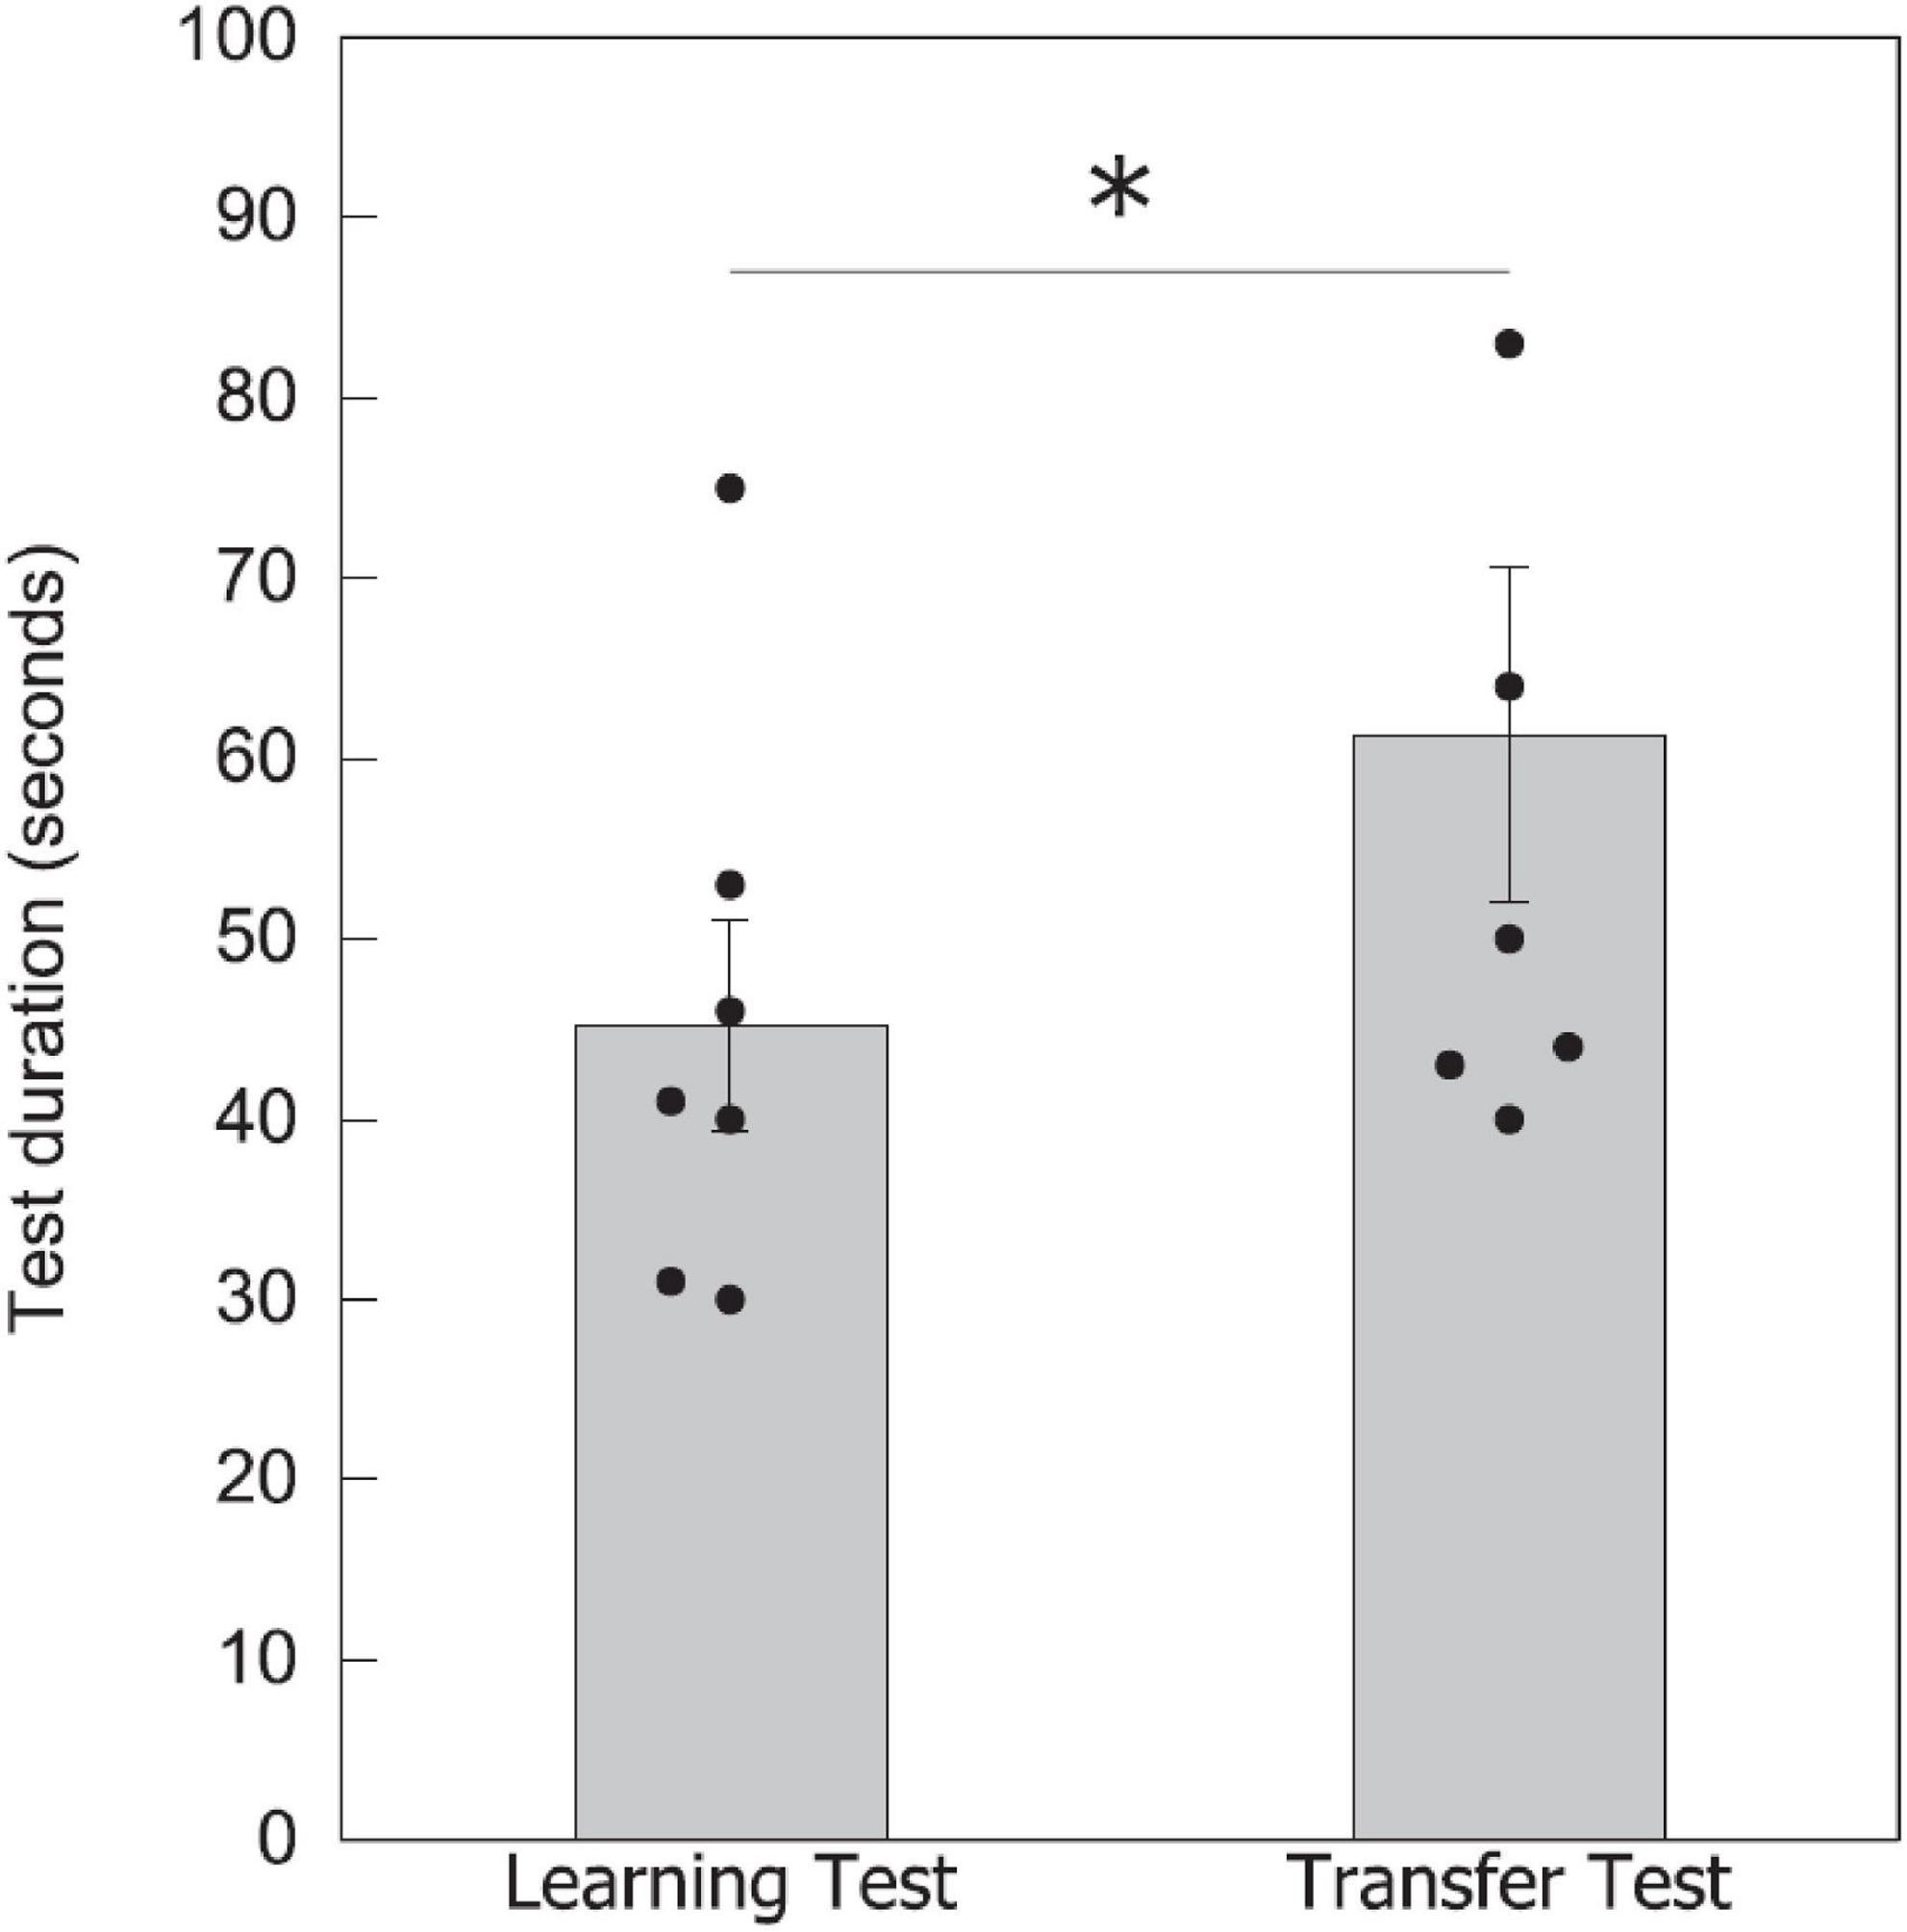
Figure 5. Test duration for completing the learning and transfer tests. Data shown are means ± SEM for the learning and transfer tests. N = 7 bees were recorded for the time taken to complete each test. Black circles show individual data for each bee. Significantly different results are indicated by *≥ 0.05.
Analysis of Stimuli
The plots of the Fourier rotational values are shown in Figure 6. We found no significant difference between the total area of the power spectra corresponding to the even and odd stimuli [Wilcoxon-rank sum statistic (W) = 3836, P = 0.545].
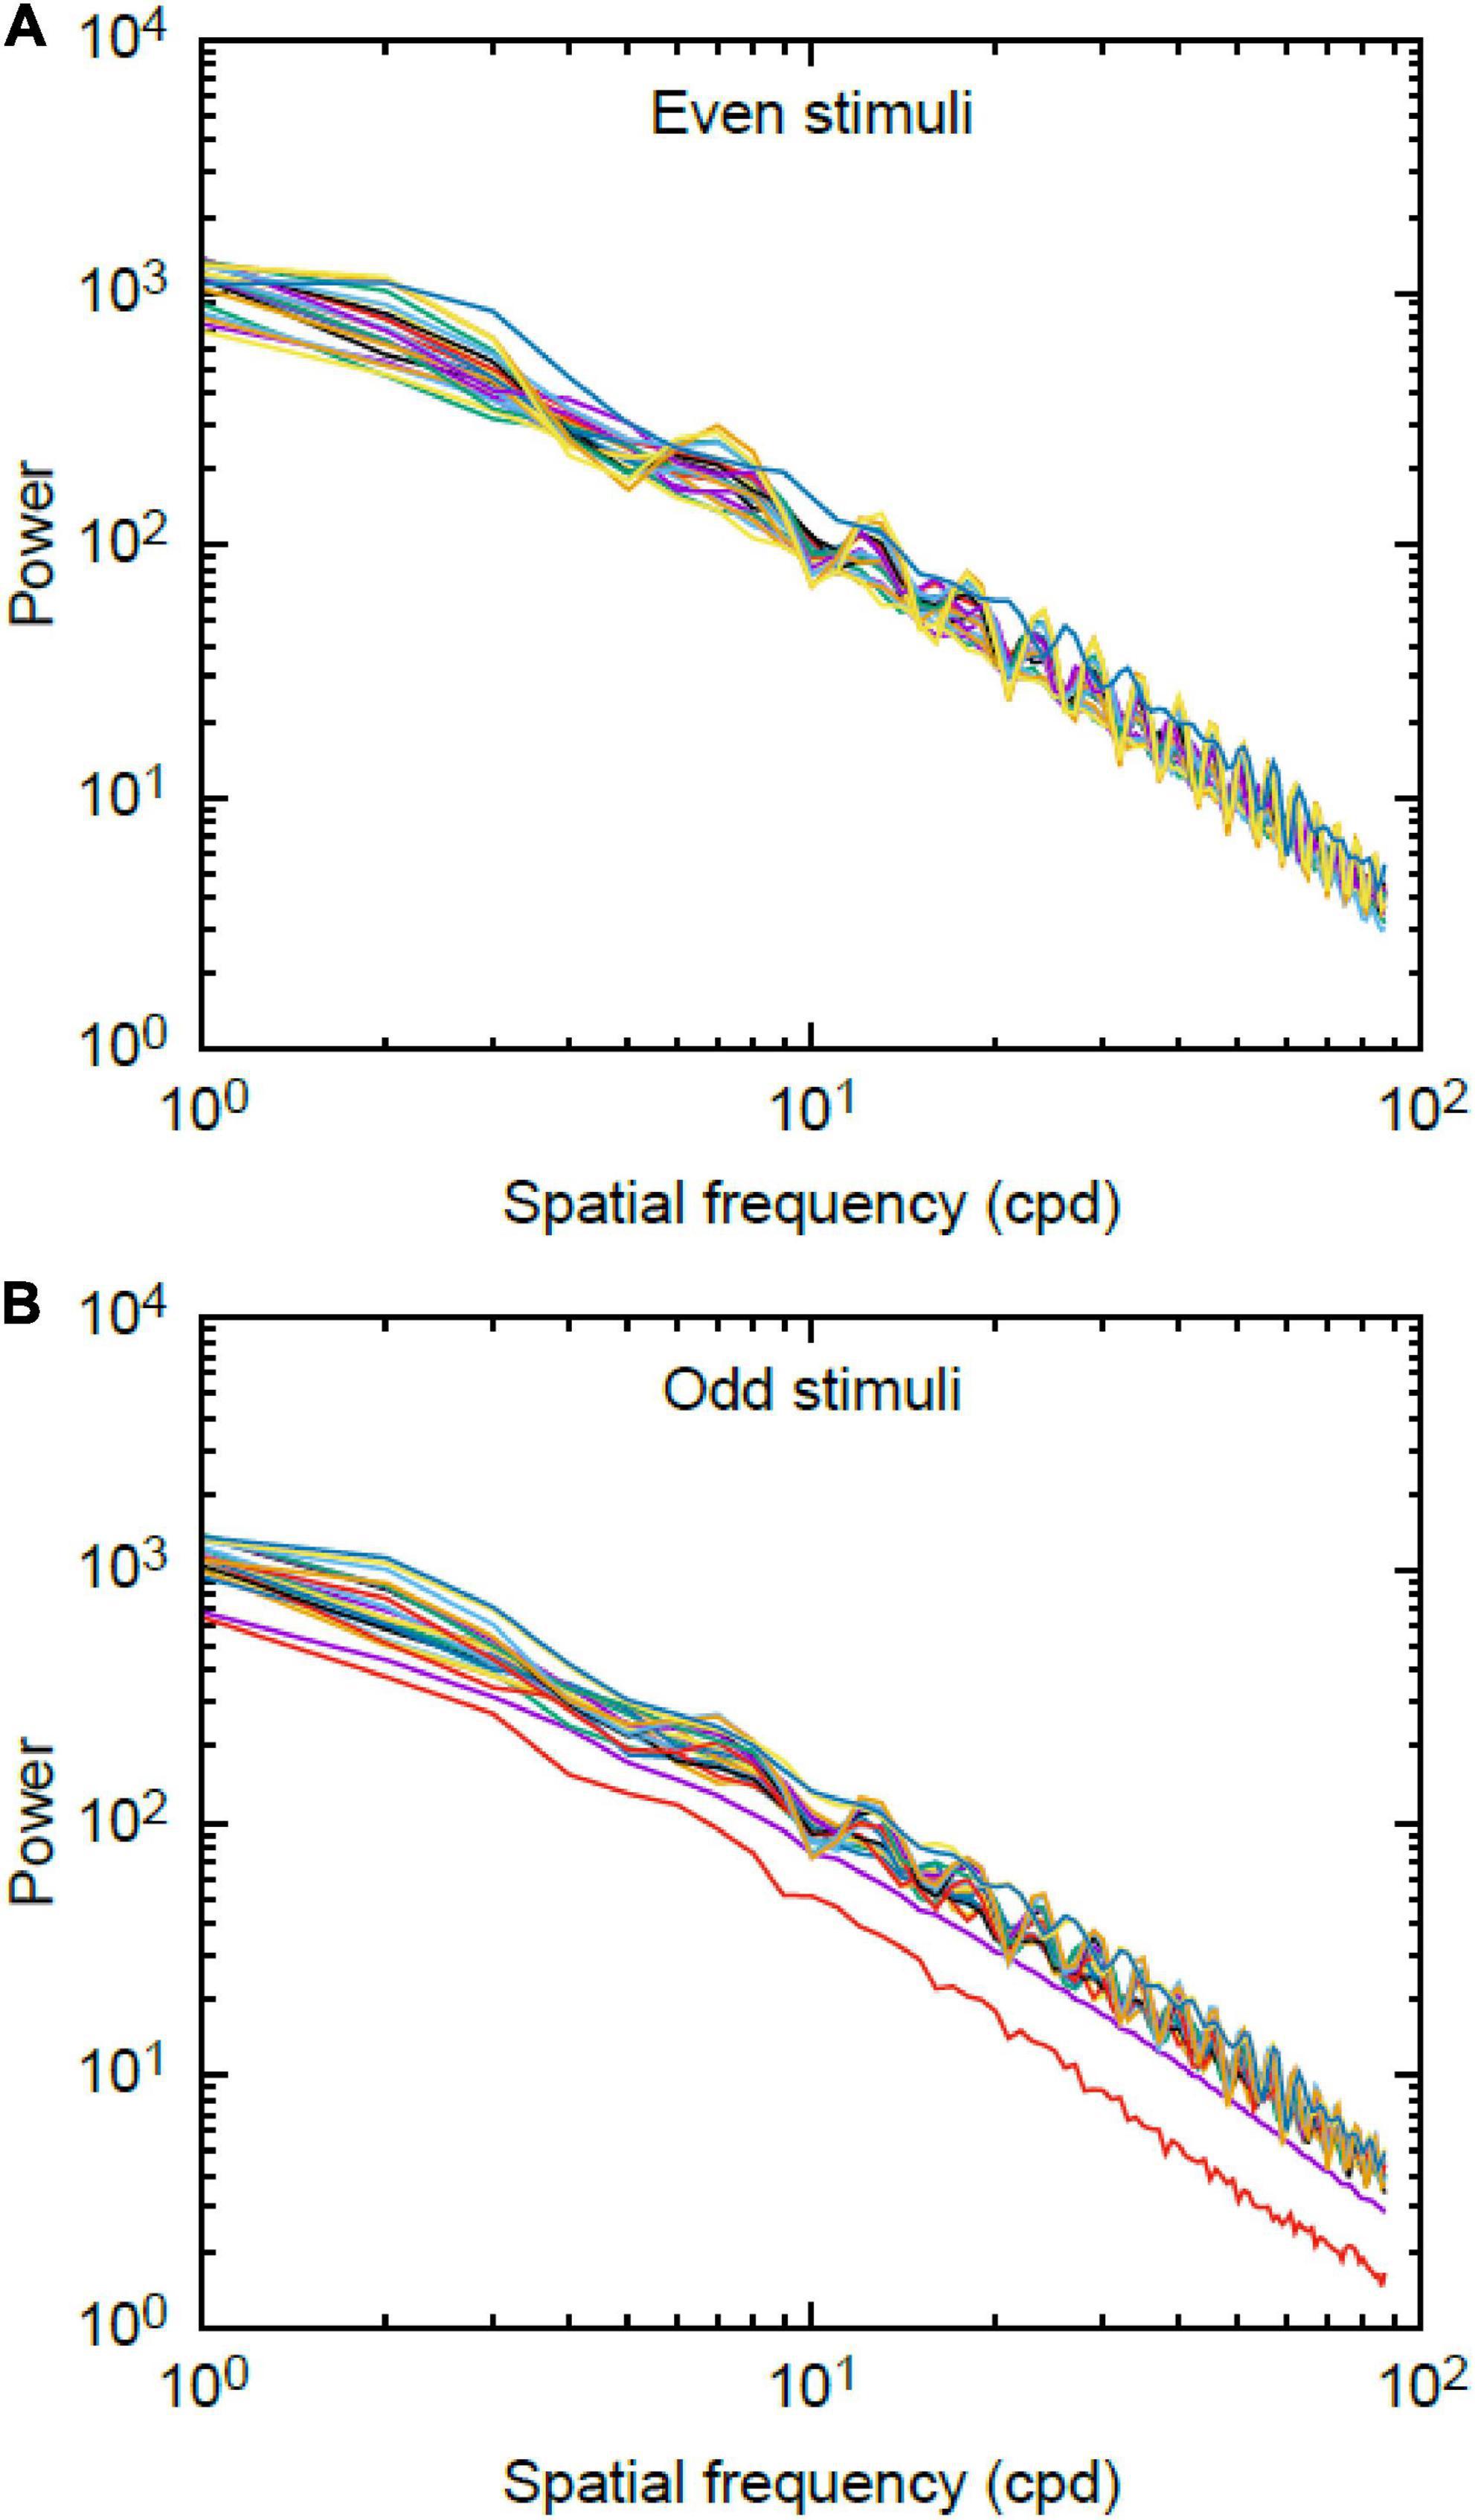
Figure 6. Log-log plot of spatial frequency spectra for (A) even and (B) odd stimuli used during experiments. Data plotted are the 92 stimuli for the even set and the 88 stimuli for the odd set. There is no significant difference between mean value of the power spectra of the odd and even stimuli.
Experiment 2: Discrimination of 11 vs. 12
As bees performed the transfer test in Experiment 1 at a level significant from chance, we tested their performance on learning and performing the numerical discrimination of 11 vs. 12 in a separate training and testing group. The results obtained in the transfer test of Experiment 1 were unexpected due to the bee’s previous limit of differentiating between numerosities of three and four using appetitive differential conditioning (Gross et al., 2009) and 4 vs. 5 elements when appetitive-aversive differential conditioning was used (Howard et al., 2019c). Thus, we aimed to look more closely at whether they were able to discriminate these numbers in a second experiment.
As there were no significant differences between bees trained to quantities of 11 or 12 in either the learning test or transfer test (one-way ANOVA; P > 0.05), the two groups were combined for statistical analysis.
Learning Phase
All bees reached criterion within 72 choices, with an average of 43.3 ± 4.6 choices to reach criterion (n = 10; Figure 7A).
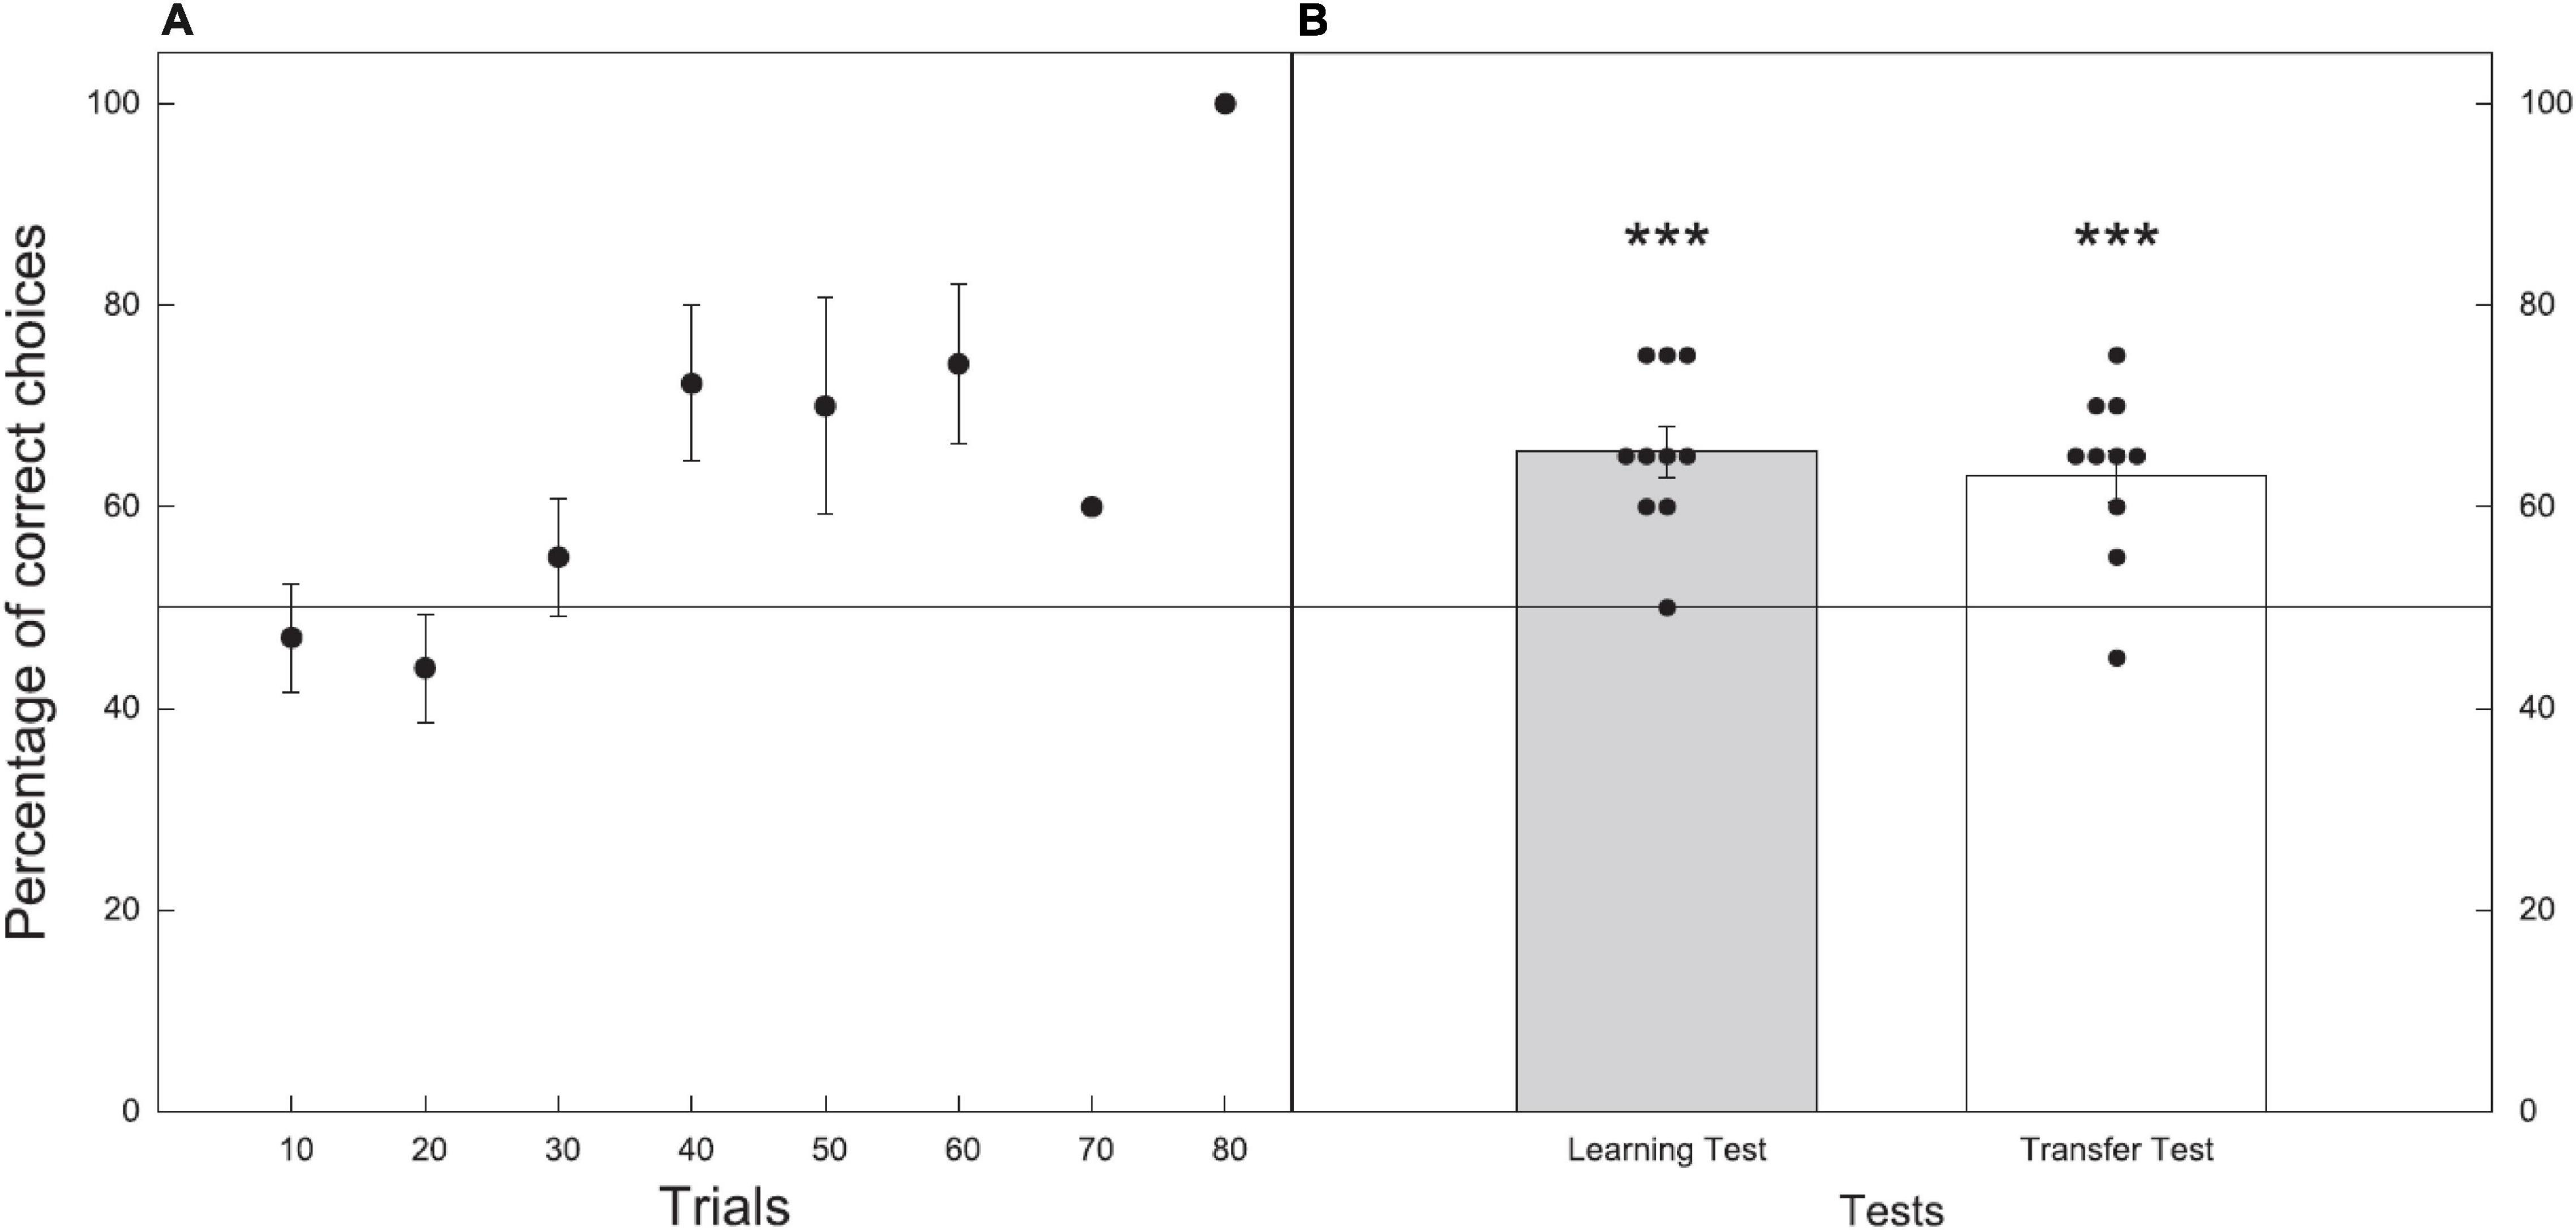
Figure 7. Performance during the learning and test phases for Experiment 2 where bees were trained and tested on their discrimination of 11 vs. 12. Data shown are means ± (SEM). N = 10 bees were used. Black line at 50% indicates the chance level performance. (A) Results of the learning phase (before reaching criterion) with just one bee still learning in trial blocks 70 and 80. (B) Results of the learning (gray) and transfer (white) tests. Black circles show individual results of each bee in the tests. Significance from chance level performance is indicated by *** ≥ 0.001. There was no significant difference between the learning and transfer tests.
Learning Test
In the learning test, bees trained to either 11 or 12 chose the correct stimulus with an accuracy of 65.5 ± 2.5%. The number of correct choices made during the unreinforced learning test were significantly higher than the chance expectation equivalent to 50% (Z = 4.300, P < 0.001, n = 10; Figure 7B).
Transfer Test
In the transfer test, where bees were presented with numerosities of 11 vs. 12 of novel shape and pattern bees chose the correct stimulus with an accuracy of 63.0 ± 2.6% (Z = 3.600, P < 0.001, n = 10; Figure 7B).
Experiment 3: Odd vs. Even Categorization by a Simple Artificial Neural Network
We tested our neural network architecture on a large range of randomly generated stimuli both in terms of separation and numerosity of signal events, with the caveat that all events are spaced by more than 1 time step. The neural network is capable of classifying all inputs as odd or even with 100% accuracy from 0 to 40 elements and pulse separation 1–10. The method can be well understood to function for arbitrary length signals of arbitrary numerosity. Our network seems to be functioning at a significantly higher level of specificity than observed in bee experiments, which implies that the architecture present in the honeybees is not as well optimized as the model presented. The Odd and Even neurons function as conditional logic gates that will activate or deactivate the Output neuron, respectively, depending on its current state, whenever a new signal pulse is detected.
Discussion
Odd and even categorization of numbers is considered an abstract and high-level numerical concept in humans (Hines, 1990; Dehaene et al., 1993; Berch et al., 1999; Reynvoet and Brysbaert, 1999; Nuerk et al., 2004, 2005; Alards-Tomalin et al., 2016), which builds upon diverse elements such as language, numerosity, symbolic representations of number, memory, and algorithms. We have shown that honeybees demonstrated an ability to learn the concepts of odd and even and were subsequently able to apply these concepts to categorize novel numbers by parity. Importantly, we also showed that honeybees were able to apply these concepts to numbers greater than the subitizing threshold. Appetitive-aversive conditioning is likely to be an important component of our finding (Chittka et al., 2003; Avarguès-Weber et al., 2010a; Howard et al., 2019c), suggesting that appropriate motivation and attention are likely to be important factors in observing numerical abilities in animals (Howard et al., 2019c, 2020a). We do not claim that honeybees were able to count all elements in the stimuli to categorize the quantities as even or odd, nor do we believe that honeybees employ the same complex mechanisms as used by humans. Below, we discuss several possibilities of how this task could potentially be performed including mathematical calculations, pattern learning, and grouping of objects.
Studies of parity tasks in humans have often shown an asymmetry between categorizing odd and even numbers. Humans made significantly fewer errors and were faster when categorizing number sequences as even when compared to odd (Hines, 1990; Nuerk et al., 2005; Alards-Tomalin et al., 2016). Our results from the current experiment show a significant difference in the number of trials taken to reach criteria between the groups. Specifically, honeybees needed a significantly lower number of trials to reach criterion when learning to choose odd numbers as the correct alternative compared to the group trained to choose even numbers. This is in contrast to what is observed in humans, who are better at categorizing numbers as even compared to odd, and suggests that honeybees find odd categorization easier to learn. However, following the learning phase, we found no difference in performance level during tests between honeybees trained to either even or odd numbers as the correct alternative.
The bees’ performance is consistent with the application of a rule-based type mechanism for problem solving (Perry and Barron, 2013; Howard et al., 2017a,b, 2018a), and would not be expected if bees were using an associative mechanism to solve the different visual problems (Howard et al., 2017a). This conclusion is evident when considering bees trained to even numbers, as an associative mechanism would predict they should choose the stimulus with 11 elements which is closest to simple predictors of the training set (i.e., 10 was the highest rewarding numerosity they encountered, thus 11 is closer to this numerosity than 12); whilst choices for the stimulus with 12 elements is consistent with the application of an “even” rule-based solution to the visual problem. Thus, we can rule out this simple associative mechanism allowing bees to successfully perform this task, and below we discuss the other potential mechanisms driving bee performance.
Interestingly, recent studies show that relatively complex cognitive-like learning demonstrated by honeybees can be achieved by simple neural networks in some cases (Cope et al., 2018; Vasas and Chittka, 2019; MaBouDi et al., 2021). We were similarly able to demonstrate that the categorization of odd or even numbers can be efficiently performed to 100% accuracy with a simple neural network, showing that it is biologically plausible that parity tasks are accessible to animals with comparatively small brains. A relatively complex numerical task, where bees must learn the concepts of “greater than vs. less than” and then value zero numerosity (Howard et al., 2018a), has been replicated by a simple artificial neural network containing four neurons (Vasas and Chittka, 2019). These studies suggest that complex cognitive-like behaviors may be accessible to assumed simple biological systems (such as the honeybee) as these tasks may demand less brain power than previously thought, or bees may be employing other mechanisms in order to solve the problem. In the current study, honeybees may be solving a task that appears relatively complex, parity categorization, in a way that does not demand a large and complex neural network (Cope et al., 2018; Vasas and Chittka, 2019; MaBouDi et al., 2021), suggesting that parity processing may potentially be learnt by other animals.
There is an important distinction that we draw between this neural network and more traditional machine learning approaches, especially in regard to its implications for biological systems. Neural network training is normally done from a naïve state to a specific state by some method based on stimulus/feedback. This implicitly draws parallels to biological states which, while not using the same training methods, still develop in response to feedback. Because this neural network was generated manually there is no evidence to suggest that similar results can be easily achievable via machine or deep learning algorithms, or actual biological processes. However, given that bees learnt odd and even categorization reasonably quickly and demonstrate an asymmetry in the number of choices to learn odd vs. even, it is reasonable to speculate that bees may have some innate neural mechanisms to help with parity processing. The asymmetry in learning suggests that bees may possess an innate processing advantage for odd quantities or have potentially previously encountered rewards linked with odd quantities, such as petal numbers on flowers. Innate neural mechanisms may recruit observed phasic–tonic, phasic, tonic, and/or on–off neural responses known to process complex visual stimulation including motion (Paulk et al., 2008) that could stimulate pre-existing neural processes that bees may have for efficiency in foraging tasks.
There are two principal mechanisms which have been suggested to potentially allow for the success in humans performing a parity task (Berch et al., 1999) and we can explore the possibility of both in relation to the current study on bees. The first is the use of a mental calculation strategy such as division by two (Clark and Campbell, 1991), and the second is the possibility of direct retrieval from semantic memory (Dehaene et al., 1993). For example, there is a possibility that humans can perform parity tasks based on memory which defines numbers ending in 0, 2, 4, 6, or 8 as an even number, and anything else as an odd number, thus bypassing the use of counting or mathematical calculations (Dehaene et al., 1993). As the numerosities used in the current study were non-symbolic, it seems unlikely that a similar mechanism could be used by honeybees to solve this task.
If success in a parity task was achieved by the use of a mental calculation, then the magnitude of the number should impact the response time, thus the greater the number, the greater the response time (Dehaene et al., 1993). In our experiment, bees did take a significantly longer time to categorize higher numbers (11 and 12) compared to lower numbers (3–8) in terms of parity, suggesting they found the transfer task more perceptually difficult in terms of cognitive processing or visual complexity. We can rule out an effect of novelty causing the difference in time between the tests as the numbers shown during both the learning and transfer tests were not previously shown to bees during training. While the time difference between tests could suggest that bees may have been counting the elements or even performing a division calculation as is observed in humans (Dehaene et al., 1993; Berch et al., 1999), we cannot discard the possibility of bees simply taking longer to process the more perceptually difficult stimuli, due to the presence of more objects to assess, before making a decision. In addition, there is no data available suggesting that honeybees may be able to perform division calculations making this hypothesis unlikely. Nevertheless, if bees are counting the elements, they may not need to perform a division calculation if an existing brain mechanism for parity categorization is present in the brain. The asymmetry observed in the learning phase for the odd vs. even groups is suggestive of the bees using some combination of pre-existing mechanisms to solve the parity task.
Increased decision-making time with more perceptually difficult tasks has been observed in bumblebees (Spaethe et al., 2001; Dyer and Chittka, 2004; Dyer et al., 2007) as well as in humans (Pachella and Fisher, 1969), and honeybees do also make speed-accuracy trade-offs (Burns and Dyer, 2008). Thus, we are unable to determine if honeybees were using numerosity skills, such as counting or calculations, to successfully perform the categorization of numbers as odd or even, or, if they were using another perceptual mechanism not requiring activation of numerosity such as semantic memorization (discussed above), pattern learning (discussed below) or pairing elements (discussed below), which we consider a more likely scenario. In human parity tasks, number magnitude, although irrelevant to the task, has a strong effect on reaction time, therefore the reaction time of bees could also be impacted by the magnitude of the numbers used in the learning and transfer tests explaining the difference in time to complete each of the tests (Dehaene et al., 1993).
There are also possibilities for completing a parity task which are not discussed in studies on humans. For example, bees may learn to pair elements and remember that a leftover unpaired element may either reward or punish them. This theory would fit with our results and the difference in time to pair lower quantities of elements in the learning test compared to higher quantities in the transfer test. Alternatively, perhaps bees could learn the odd/even pattern; if a bee was trained to choose odd numerosities, 1 is correct, but 2 is incorrect, 3 is correct and so on, increasing in magnitude by one means a stimulus is either correct or incorrect. Interestingly, bees have been observed to processes some complex patterns in brief time frames suggesting auto processing mechanisms must exist for some types of stimuli (Srinivasan et al., 1993). Bees could potentially learn the pattern of odd and even numbers as differing by one additional element through the numerical continuum as resulting in a reward or aversive outcome. In any case, many of these hypotheses require bees to process each discrete element sequentially without re-inspecting any of them. While such accurate processing has been described for small quantities of items in bumblebees (MaBouDi et al., 2020), its application to arrays of 11 or 12 objects is definitively challenging. Further work would be necessary to explore how bees could potentially perform this challenging inspection task.
As bees are known to be able to categorize stimuli by symmetry (Giurfa et al., 1996), we analyzed our stimuli using horizontal and vertical bisections to measure symmetry between the odd and even numerosities presented. Our results (Supplementary Material) show that there were no significant differences in symmetry between odd and even stimuli, either along the horizontal or vertical planes of the images. This means that odd or even stimuli were unable to be categorized as “odd” or “even” by bees through the use of symmetry cues.
Finally, while there is recent debate about continuous low-level cues impacting numerosity tasks in honeybees (Howard et al., 2020b; Shaki and Fischer, 2020; MaBouDi et al., 2021), it is interesting to note that the current task does not allow honeybees use the low-level cues of surface area, perimeter, edge length, spatial frequency, convex hull, density, or size of elements. These cues generally correlate with increasing magnitude, however, as a parity categorization task does not require quantity discrimination (although magnitude can impact accuracy and time), these cues do not predict the correct or incorrect options. In a parity task, each quantity is correct or incorrect depending on whether it is odd or even and this changes with the addition of each new element, therefore bees cannot solve the task using cues which correlate with increasing magnitude. Despite this, the task may still be solved with other low-level cues not correlated with stimuli parameters, which we have yet to determine. Further research into parity tasks in honeybees and other animals are needed to determine the exact mechanisms and method by which this task can be performed by non-human animals.
Further experiments on other animal species would be valuable in determining the connections between number, space, processing time, and numerosity in parity tasks and additionally explore whether this abstract mathematical concept is accessible to other species. As there is an innate asymmetry in parity categorization in humans (Hines, 1990; Nuerk et al., 2005; Alards-Tomalin et al., 2016) and during training with honeybees, such a phenomenon could also be explored in other animals to determine whether odd and even recognition occurs as an innate preference in any other species. Further work would also be useful in determining exactly how honeybees are able to learn to categorize numerosities by parity and if it is cognitively complex, simple, or if pre-existing neural mechanism allow them to do it. In humans, we know the cortex plays a major role in both number processing (Dehaene et al., 1998; Hubbard et al., 2005; Tang et al., 2006; Piazza et al., 2007), for example the parietal cortex (Dastjerdi et al., 2013), and categorization (Peelen et al., 2009). However, we show here that honeybees are capable of number parity categorization without a cortex, strongly suggesting that alternative brain structures can facilitate such abilities. The current results, and other evidence that bees can reliably categorize stimuli (Zhang et al., 2004; Benard et al., 2006; Avarguès-Weber et al., 2010b), suggest that building neuromorphic computing solutions with very simplified mechanisms is possible. The advantage of such systems is that they require less information processing resulting in reducing both time and energy costs, thus enabling efficient deployment to operate in complex environments.
Data Availability Statement
The original contributions presented in the study are included in the article/Supplementary Material, further inquiries can be directed to the corresponding author/s. The data sets analyzed in this study can be found in the Supplementary Material.
Author Contributions
SRH, JG, and ADG collected the data. SRH, JG, AA-W, JEG, and ADG analyzed the data. All authors gave final approval for submission and contributed to experimental design, interpretation of the data and editing the manuscript.
Funding
SRH acknowledges the Australian Government Research Training Program (RTP) Scholarship, HDR Candidate Funding from the School of Media and Communication at RMIT University, the Fyssen Foundation, the L’Oréal-UNESCO for Women in Science Young Talents French Award, and the Alfred Deakin Postdoctoral Research Fellowship from Deakin University. AGD acknowledges financial support from the Australian Research Council (FT160100357).
Conflict of Interest
The authors declare that the research was conducted in the absence of any commercial or financial relationships that could be construed as a potential conflict of interest.
Publisher’s Note
All claims expressed in this article are solely those of the authors and do not necessarily represent those of their affiliated organizations, or those of the publisher, the editors and the reviewers. Any product that may be evaluated in this article, or claim that may be made by its manufacturer, is not guaranteed or endorsed by the publisher.
Acknowledgments
We thank Martin Giurfa for his comments on the study. We also thank the editor, Guy Gilles Beauchamp, and three reviewers for their constructive comments and suggestions, which improved the study.
Supplementary Material
The Supplementary Material for this article can be found online at: https://www.frontiersin.org/articles/10.3389/fevo.2022.805385/full#supplementary-material
References
Agrillo, C., Dadda, M., Serena, G., and Bisazza, A. (2008). Do fish count? Spontaneous discrimination of quantity in female mosquitofish. Anim. Cogn. 11, 495–503. doi: 10.1007/s10071-008-0140-9
Alards-Tomalin, D., Walker, A. C., Nepon, H., and Leboe-Mcgowan, L. C. (2016). Dual-task interference effects on cross-modal numerical order and sound intensity judgments: the more the louder? Q. J. Exp. Psychol. 70, 1943–1963. doi: 10.1080/17470218.2016.1216139
Avarguès-Weber, A., and Giurfa, M. (2013). Conceptual learning by miniature brains. Proc. R. Soc. B 28:20131907. doi: 10.1098/rspb.2013.1907
Avarguès-Weber, A., D’amaro, D., Metzler, M., and Dyer, A. G. (2014). Conceptualization of relative size by honeybees. Front. Behav. Neurosci. 8:80. doi: 10.3389/fnbeh.2014.00080
Avarguès-Weber, A., Portelli, G., Benard, J., Dyer, A., and Giurfa, M. (2010b). Configural processing enables discrimination and categorization of face-like stimuli in honeybees. J. Exp. Biol. 213, 593–601. doi: 10.1242/jeb.039263
Avarguès-Weber, A., De Brito Sanchez, M. G., Giurfa, M., and Dyer, A. G. (2010a). Aversive reinforcement improves visual discrimination learning in free-flying honeybees. PLoS One 5:e15370. doi: 10.1371/journal.pone.0015370
Avarguès-Weber, A., Deisig, N., and Giurfa, M. (2011a). Visual cognition in social insects. Annu. Rev. Entomol. 56, 423–443. doi: 10.1146/annurev-ento-120709-144855
Avarguès-Weber, A., Dyer, A. G., and Giurfa, M. (2011b). Conceptualization of above and below relationships by an insect. Proc. R. Soc. Lond. B 278, 898–905. doi: 10.1098/rspb.2010.1891
Bates, D., Mächler, M., Bolker, B., and Walker, S. (2015). Fitting linear mixed-effects models using lme4. J. Stat. Softw. 67, 1–48. doi: 10.18637/jss.v067.i01
Benard, J., Stach, S., and Giurfa, M. (2006). Categorization of visual stimuli in the honeybee Apis mellifera. Anim. Cogn. 9, 257–270. doi: 10.1007/s10071-006-0032-9
Berch, D. B., Foley, E. J., Hill, R. J., and Ryan, P. M. (1999). Extracting parity and magnitude from Arabic numerals: developmental changes in number processing and mental representation. J. Exp. Child Psychol. 74, 286–308. doi: 10.1006/jecp.1999.2518
Bortot, M., Stancher, G., and Vallortigara, G. (2019b). Transfer from number to size reveals abstract coding of magnitude in honeybees. Iscience 23:101122. doi: 10.1016/j.isci.2020.101122
Bortot, M., Agrillo, C., Avarguès-Weber, A., Bisazza, A., Miletto Petrazzini, M. E., and Giurfa, M. (2019a). Honeybees use absolute rather than relative numerosity in number discrimination. Biol. Lett. 15:20190138. doi: 10.1098/rsbl.2019.0138
Bortot, M., Regolin, L., and Vallortigara, G. (2021). A sense of number in invertebrates. Biochem. Biophys. Res. Commun. 564, 37–42. doi: 10.1016/j.bbrc.2020.11.039
Bovet, D., and Vauclair, J. (1998). Functional categorization of objects and of their pictures in baboons. Learn. Motiv. 29, 309–322. doi: 10.1006/lmot.1998.1009
Bukovac, Z., Dorin, A., and Dyer, A. (2013). A-bees see: a simulation to assess social bee visual attention during complex search tasks. Artificial Life Conf. Proc. 13, 276–283.
Burns, J. G., and Dyer, A. G. (2008). Diversity of speed-accuracy strategies benefits social insects. Curr. Biol. 18, R953–R954. doi: 10.1016/j.cub.2008.08.028
Carazo, P., Fernández-Perea, R., and Font, E. (2012). Quantity estimation based on numerical cues in the mealworm beetle (Tenebrio molitor). Front. Psychol. 3:502. doi: 10.3389/fpsyg.2012.00502
Chittka, L., and Geiger, K. (1995). Can honey bees count landmarks? Anim. Behav. 49, 159–164. doi: 10.1016/0003-3472(95)80163-4
Chittka, L., Dyer, A. G., Bock, F., and Dornhaus, A. (2003). Psychophysics: bees trade off foraging speed for accuracy. Nature 424, 388–388. doi: 10.1038/424388a
Clark, J. M., and Campbell, J. I. (1991). Integrated versus modular theories of number skills and acalculia. Brain Cogn. 17, 204–239. doi: 10.1016/0278-2626(91)90075-j
Collett, T., Fry, S., and Wehner, R. (1993). Sequence learning by honeybees. J. Comp. Physiol. A 172, 693–706. doi: 10.1016/j.cub.2005.05.033
Cope, A. J., Vasilaki, E., Minors, D., Sabo, C., Marshall, J. A., and Barron, A. B. (2018). Abstract concept learning in a simple neural network inspired by the insect brain. PLoS Comput. Biol. 14:e1006435. doi: 10.1371/journal.pcbi.1006435
Cowan, N. (2010). The magical mystery four: how is working memory capacity limited, and why? Curr. Dir. Psychol. Sci. 19, 51–57. doi: 10.1177/0963721409359277
Dacke, M., and Srinivasan, M. V. (2008). Evidence for counting in insects. Anim. Cogn. 11, 683–689. doi: 10.1007/s10071-008-0159-y
Dastjerdi, M., Ozker, M., Foster, B. L., Rangarajan, V., and Parvizi, J. (2013). Numerical processing in the human parietal cortex during experimental and natural conditions. Nat. Commun. 4:2528. doi: 10.1038/ncomms3528
Davis, H., and Pérusse, R. (1988). Numerical competence in animals: definitional issues, current evidence, and a new research agenda. Behav. Brain Sci. 11, 561–579. doi: 10.1017/s0140525x00053437
Dehaene, S., and Cohen, L. (1991). Two mental calculation systems: a case study of severe acalculia with preserved approximation. Neuropsychologia 29, 1045–1074. doi: 10.1016/0028-3932(91)90076-k
Dehaene, S., Bossini, S., and Giraux, P. (1993). The mental representation of parity and number magnitude. J. Exp. Psychol. 122:371. doi: 10.1037/0096-3445.122.3.371
Dehaene, S., Dehaene-Lambertz, G., and Cohen, L. (1998). Abstract representations of numbers in the animal and human brain. Trends Neurosci. 21, 355–361. doi: 10.1016/s0166-2236(98)01263-6
Dyer, A. G. (2012). The mysterious cognitive abilities of bees: why models of visual processing need to consider experience and individual differences in animal performance. J. Exp. Biol. 215, 387–395. doi: 10.1242/jeb.038190
Dyer, A. G., and Chittka, L. (2004). Bumblebees (Bombus terrestris) sacrifice foraging speed to solve difficult colour discrimination tasks. J. Comp. Physiol. A 190, 759–763. doi: 10.1007/s00359-004-0547-y
Dyer, A. G., Neumeyer, C., and Chittka, L. (2005). Honeybee (Apis mellifera) vision can discriminate between and recognise images of human faces. J. Exp. Biol. 208, 4709–4714. doi: 10.1242/jeb.01929
Dyer, A. G., Whitney, H. M., Arnold, S. E., Glover, B. J., and Chittka, L. (2007). Mutations perturbing petal cell shape and anthocyanin synthesis influence bumblebee perception of Antirrhinum majus flower colour. Arthropod Plant Interact. 1, 45–55. doi: 10.1007/s11829-007-9002-7
Fox, J., and Weisberg, S. (2019). An R Companion To Applied Regression. Thousand Oaks, CA: Sage publications.
Freedman, D. J., Riesenhuber, M., Poggio, T., and Miller, E. K. (2001). Categorical representation of visual stimuli in the primate prefrontal cortex. Science 291, 312–316. doi: 10.1126/science.291.5502.312
Giurfa, M. (2019). An insect’s sense of number. Trends Cogn. Sci. 23, 720–722. doi: 10.1016/j.tics.2019.06.010
Giurfa, M., Eichmann, B., and Menzel, R. (1996). Symmetry perception in an insect. Nature 382, 458–461. doi: 10.1038/382458a0
Giurfa, M., Zhang, S., Jenett, A., Menzel, R., and Srinivasan, M. V. (2001). The concepts of ‘sameness’ and ‘difference’ in an insect. Nature 410, 930–933. doi: 10.1038/35073582
Gómez-Laplaza, L. M., and Gerlai, R. (2011). Can angelfish (Pterophyllum scalare) count? Discrimination between different shoal sizes follows Weber’s law. Anim. Cogn. 14, 1–9. doi: 10.1007/s10071-010-0337-6
Gross, H. J., Pahl, M., Si, A., Zhu, H., Tautz, J., and Zhang, S. (2009). Number-based visual generalisation in the honeybee. PLoS One 4:e4263. doi: 10.1371/journal.pone.0004263
Hassmann, M. (1952). Vom erlernen unbenannter anzahlen bei eichhörnchen (Sciurus vulgaris). Z. Tierpsychol. 9, 294–321. doi: 10.1111/j.1439-0310.1952.tb01855.x
Helgadóttir, L. I., Haenicke, J., Landgraf, T., Rojas, R., and Nawrot, M. P. (2013). “Conditioned behavior in a robot controlled by a spiking neural network,” in Proceedings of the 2013 6th International IEEE/EMBS Conference on Neural Engineering (NER), (Piscataway, NJ: IEEE), 891–894.
Herrnstein, R. J., and Loveland, D. H. (1964). Complex visual concept in the pigeon. Science 146, 549–551. doi: 10.1126/science.146.3643.549
Hertel, H., and Maronde, U. (1987). The physiology and morphology of centrally projecting visual interneurones in the honeybee brain. J. Exp. Biol. 133, 301–315. doi: 10.1186/s12868-016-0283-6
Hertel, H., Schäfer, S., and Maronde, U. (1987). The physiology and morphology of visual commissures in the honeybee brain. J. Exp. Biol. 133, 283–300. doi: 10.1002/cne.902460302
Hines, T. M. (1990). An odd effect: lengthened reaction times for judgments about odd digits. Mem. Cogn. 18, 40–46. doi: 10.3758/bf03202644
Howard, S. R., Avarguès-Weber, A., Garcia, J. E., Greentree, A. D., and Dyer, A. G. (2018a). Numerical ordering of zero in honey bees. Science 360, 1124–1126. doi: 10.1126/science.aar4975
Howard, S. R., Garcia, J., and Dyer, A. (2018b). Chasing the meaning of zero. Australasian Sci. 39:20.
Howard, S. R., Avarguès-Weber, A., Garcia, J. E., Greentree, A. D., and Dyer, A. G. (2019c). Surpassing the subitizing threshold: appetitive–aversive conditioning improves discrimination of numerosities in honeybees. J. Exp. Biol. 222:jeb205658. doi: 10.1242/jeb.205658
Howard, S. R., Avarguès-Weber, A., Garcia, J. E., Greentree, A. D., and Dyer, A. G. (2019b). Numerical cognition in honeybees enables addition and subtraction. Sci. Adv. 5:easv0961. doi: 10.1126/sciadv.aav0961
Howard, S. R., Avarguès-Weber, A., Garcia, J. E., Greentree, A. D., and Dyer, A. G. (2019a). Achieving arithmetic learning in honeybees and examining how individuals learn. Commun. Integr. Biol. 12, 166–170. doi: 10.1080/19420889.2019.1678452
Howard, S. R., Avarguès-Weber, A., Garcia, J. E., Greentree, A. D., and Dyer, A. G. (2019d). Symbolic representation of numerosity by honeybees (Apis mellifera): matching characters to small quantities. Proc. R. Soc. B 286:20190238. doi: 10.1098/rspb.2019.0238
Howard, S. R., Schramme, J., Garcia, J. E., Ng, L., Avarguès-Weber, A., Greentree, A. D., et al. (2020a). Spontaneous quantity discrimination of artificial flowers by foraging honeybees. J. Exp. Biol. 223:jeb223610. doi: 10.1242/jeb.223610
Howard, S. R., Avarguès-Weber, A., Garcia, J. E., Greentree, A. D., and Dyer, A. G. (2020b). Reply to comment on Howard et al. (2019): ‘Nothing to dance about: unclear evidence for symbolic representations and numerical competence in honeybees’. Proc. R. Soc. B 287:20200095. doi: 10.1098/rspb.2020.0095
Howard, S. R., Avarguès-Weber, A., Garcia, J., and Dyer, A. G. (2017a). Free-flying honeybees extrapolate relational size rules to sort successively visited artificial flowers in a realistic foraging situation. Anim. Cogn. 20, 627–638. doi: 10.1007/s10071-017-1086-6
Howard, S. R., Avarguès-Weber, A., Garcia, J. E., Stuart-Fox, D., and Dyer, A. G. (2017b). Perception of contextual size illusions by honeybees in restricted and unrestricted viewing conditions. Proc. R. Soc. B 284:20172278. doi: 10.1098/rspb.2017.2278
Hubbard, E. M., Piazza, M., Pinel, P., and Dehaene, S. (2005). Interactions between number and space in parietal cortex. Nat. Rev. Neurosci. 6:435. doi: 10.1038/nrn1684
Jevons, W. S. (1871). The power of numerical discrimination. Nature 3, 281–282. doi: 10.1038/003281a0
Kaufman, E. L., Lord, M. W., Reese, T. W., and Volkmann, J. (1949). The discrimination of visual number. Am. J. Psychol. 62, 498–525.
Kleyko, D., Osipov, E., Gayler, R. W., Khan, A. I., and Dyer, A. G. (2015). Imitation of honey bees’ concept learning processes using Vector Symbolic Architectures. Biol. Inspired Cogn. Architectures 14, 57–72. doi: 10.1016/j.bica.2015.09.002
Krueger, L. E. (1986). Why 2 × 2 = 5 looks so wrong: on the odd-even rule in product verification. Mem. Cogn. 14, 141–149. doi: 10.3758/bf03198374
Krueger, L. E., and Hallford, E. W. (1984). Why 2+ 2= 5 looks so wrong: on the odd-even rule in sum verification. Mem. Cogn. 12, 171–180. doi: 10.3758/bf03198431
MaBouDi, H., Barron, A. B., Li, S., Honkanen, M., Loukola, O. J., Peng, F., et al. (2021). Non-numerical strategies used by bees to solve numerical cognition tasks. Proc. R. Soc. B 288, 20202711. doi: 10.1098/rspb.2020.2711
MaBouDi, H., Galpayage Dona, H. S., Gatto, E., Loukola, O. J., Buckley, E., Onoufriou, P. D., et al. (2020). Bumblebees use sequential scanning of countable items in visual patterns to solve numerosity tasks. Integr. Comp. Biol. 60, 929–942. doi: 10.1093/icb/icaa025
Menzel, R. (1973). Spectral response of moving detecting and “sustaining” fibres in the optic lobe of the bee. J. Comp. Physiol. 82, 135–150. doi: 10.1007/bf00696149
Merolla, P. A., Arthur, J. V., Alvarez-Icaza, R., Cassidy, A. S., Sawada, J., Akopyan, F., et al. (2014). A million spiking-neuron integrated circuit with a scalable communication network and interface. Science 345, 668–673. doi: 10.1126/science.1254642
Miller, G. A. (1956). The magical number seven, plus or minus two: some limits on our capacity for processing information. Psychol. Rev. 63:81. doi: 10.1037/h0043158
Morawetz, L., Svoboda, A., Spaethe, J., and Dyer, A. G. (2013). Blue colour preference in honeybees distracts visual attention for learning closed shapes. J. Comp. Physiol. A 199, 817–827. doi: 10.1007/s00359-013-0843-5
Nieder, A. (2005). Counting on neurons: the neurobiology of numerical competence. Nat. Rev. Neurosci. 6, 177–190. doi: 10.1038/nrn1626
Niven, J. E., Anderson, J. C., and Laughlin, S. B. (2007). Fly photoreceptors demonstrate energy-information trade-offs in neural coding. PLoS Biol. 5:e116. doi: 10.1371/journal.pbio.0050116
Nuerk, H. C., Iversen, W., and Willmes, K. (2004). Notational modulation of the SNARC and the MARC (linguistic markedness of response codes) effect. Q. J. Exp. Psychol. Sec. A 57, 835–863. doi: 10.1080/02724980343000512
Nuerk, H.-C., Wood, G., and Willmes, K. (2005). The universal SNARC effect: the association between number magnitude and space is amodal. Exp. Psychol. 52, 187–194. doi: 10.1027/1618-3169.52.3.187
Pachella, R. G., and Fisher, D. F. (1969). Effect of stimulus degradation and similarity on the trade-off between speed and accuracy in absolute judgments. J. Exp. Psychol. 81:7. doi: 10.1037/h0027431
Paulk, A. C., Phillips-Portillo, J., Dacks, A. M., Fellous, J. M., and Gronenberg, W. (2008). The processing of color, motion, and stimulus timing are anatomically segregated in the bumblebee brain. J. Neurosci. 28, 6319–6332. doi: 10.1523/JNEUROSCI.1196-08.2008
Peelen, M. V., Fei-Fei, L., and Kastner, S. (2009). Neural mechanisms of rapid natural scene categorization in human visual cortex. Nature 460:94. doi: 10.1038/nature08103
Perry, C. J., and Barron, A. B. (2013). Honey bees selectively avoid difficult choices. Proc. Natl. Acad. Sci. U.S.A. 110, 19155–19159. doi: 10.1073/pnas.1314571110
Piazza, M., Mechelli, A., Butterworth, B., and Price, C. J. (2002). Are subitizing and counting implemented as separate or functionally overlapping processes? Neuroimage 15, 435–446. doi: 10.1006/nimg.2001.0980
Piazza, M., Pinel, P., Le Bihan, D., and Dehaene, S. (2007). A magnitude code common to numerosities and number symbols in human intraparietal cortex. Neuron 53, 293–305. doi: 10.1016/j.neuron.2006.11.022
R Core Team (2020). R: A Language And Environment For Statistical Computing. Vienna: R Foundation for Statistical Computing.
Reynvoet, B., and Brysbaert, M. (1999). Single-digit and two-digit Arabic numerals address the same semantic number line. Cognition 72, 191–201. doi: 10.1016/s0010-0277(99)00048-7
Rugani, R., Cavazzana, A., Vallortigara, G., and Regolin, L. (2013). One, two, three, four, or is there something more? Numerical discrimination in day-old domestic chicks. Anim. Cogn. 16, 557–564. doi: 10.1007/s10071-012-0593-8
Saaty, T. L., and Ozdemir, M. S. (2003). Why the magic number seven plus or minus two. Math. Comput. Modelling 38, 233–244. doi: 10.1016/s0895-7177(03)90083-5
Sandin, F., Khan, A. I., Dyer, A. G., Amin, A. H. M., Indiveri, G., Chicca, E., et al. (2014). Concept learning in neuromorphic vision systems: What can we learn from insects? J. Softw. Eng. Appl. 7, 387–395. doi: 10.4236/jsea.2014.75035
Seguin, D., and Gerlai, R. (2017). Zebrafish prefer larger to smaller shoals: analysis of quantity estimation in a genetically tractable model organism. Anim. Cogn. 20, 813–821. doi: 10.1007/s10071-017-1102-x
Shaki, S., and Fischer, M. H. (2020). Nothing to dance about: unclear evidence for symbolic representations and numerical competence in honeybees. a comment on: symbolic representation of numerosity by honeybees (Apis mellifera): matching characters to small quantities. Proc. R. Soc. B 287:20192840. doi: 10.1098/rspb.2019.2840
Simons, D., and Langheinrich, D. (1982). What is magic about the magical number four? Psychol. Res. 44, 283–294. doi: 10.2466/pms.2000.91.3.883
Spaethe, J., Tautz, J., and Chittka, L. (2001). Visual constraints in foraging bumblebees: flower size and color affect search time and flight behavior. Proc. Natl. Acad. Sci. U.S.A. 98, 3898–3903. doi: 10.1073/pnas.071053098
Srinivasan, M. V. (2006). Small brains, smart computations: vision and navigation in honeybees, and applications to robotics. Int. Congress Ser. 1291, 30–37. doi: 10.1016/j.ics.2006.01.055
Srinivasan, M. V. (2010). Honey bees as a model for vision, perception, and cognition. Annu. Rev. Entomol. 55, 267–284. doi: 10.1146/annurev.ento.010908.164537
Srinivasan, M. V. (2011). Visual control of navigation in insects and its relevance for robotics. Curr. Opin. Neurobiol. 21, 535–543. doi: 10.1016/j.conb.2011.05.020
Srinivasan, M. V., Chahl, J. S., Weber, K., Venkatesh, S., Nagle, M. G., and Zhang, S.-W. (1999). Robot navigation inspired by principles of insect vision. Robotics Autonomous Syst. 26, 203–216. doi: 10.1016/s0921-8890(98)00069-4
Srinivasan, M. V., Zhang, S. W., and Rolfe, B. (1993). Is pattern vision in insects mediated by ‘cortical’ processing? Nature 362, 539–540. doi: 10.1038/362539a0
Tang, Y., Zhang, W., Chen, K., Feng, S., Ji, Y., Shen, J., et al. (2006). Arithmetic processing in the brain shaped by cultures. Proc. Natl. Acad. Sci. U.S.A. 103, 10775–10780. doi: 10.1073/pnas.0604416103
Tomonaga, M., and Matsuzawa, T. (2002). Enumeration of briefly presented items by the chimpanzee (Pan troglodytes) and humans (Homo sapiens). Anim. Learn. Behav. 30, 143–157. doi: 10.3758/bf03192916
Trick, L. M., and Pylyshyn, Z. W. (1994). Why are small and large numbers enumerated differently? A limited-capacity preattentive stage in vision. Psychol. Rev. 101:80. doi: 10.1037/0033-295x.101.1.80
Troje, N. F., Huber, L., Loidolt, M., Aust, U., and Fieder, M. (1999). Categorical learning in pigeons: the role of texture and shape in complex static stimuli. Vis. Res. 39, 353–366. doi: 10.1016/s0042-6989(98)00153-9
Vasas, V., and Chittka, L. (2019). Insect-inspired sequential inspection strategy enables an artificial network of four neurons to estimate numerosity. IScience 11, 85–92. doi: 10.1016/j.isci.2018.12.009
Venables, W. N., and Ripley, B. D. (2002). Modern Applied Statistics with S. New York, NY: Springer.
Wilcox, R. R. (2011). Introduction To Robust Estimation And Hypothesis Testing. Cambridge, MA: Academic Press.
Yang, E. C., and Maddess, T. (1997). Orientation-sensitive neurons in the brain of the honey bee (Apis mellifera). J. Insect Physiol. 43, 329–336. doi: 10.1016/s0022-1910(96)00111-4
Zentall, T. R., Galizio, M., and Critchfield, T. S. (2002). Categorization, concept learning, and behavior analysis: an introduction. J. Exp. Anal. Behav. 78, 237–248. doi: 10.1901/jeab.2002.78-237
Zhang, S. (2006). Learning of abstract concepts and rules by the honeybee. Int. J. Comp. Psychol. 19, 318–341.
Zhang, S. W., and Srinivasan, M. V. (2004). “Exploration of cognitive capacity in honeybees: higher functions emerge from a small brain,” in Complex Worlds From Simpler Nervous Systems, ed. F. R. Prete (Cambridge, MA: MIT Press), 41–74.
Zhang, S., Bartsch, K., and Srinivasan, M. (1996). Maze learning by honeybees. Neurobiol. Learn. Mem. 66, 267–282. doi: 10.1006/nlme.1996.0069
Zhang, S., Mizutani, A., and Srinivasan, M. V. (2000). Maze navigation by honeybees: learning path regularity. Learn. Mem. 7, 363–374. doi: 10.1101/lm.32900
Zhang, S., Srinivasan, M. V., Zhu, H., and Wong, J. (2004). Grouping of visual objects by honeybees. J. Exp. Biol. 207, 3289–3298. doi: 10.1242/jeb.01155
Keywords: even, honeybee (Apis mellifera), neuromorphic, numerical cognition, simple artificial neural network, odd
Citation: Howard SR, Greentree J, Avarguès-Weber A, Garcia JE, Greentree AD and Dyer AG (2022) Numerosity Categorization by Parity in an Insect and Simple Neural Network. Front. Ecol. Evol. 10:805385. doi: 10.3389/fevo.2022.805385
Received: 30 October 2021; Accepted: 02 March 2022;
Published: 29 April 2022.
Edited by:
Guy Gilles Beauchamp, Concordia University, CanadaReviewed by:
Giorgio Vallortigara, University of Trento, ItalyVera Vasas, Queen Mary University of London, United Kingdom
Eirik Søvik, Volda University College, Norway
Copyright © 2022 Howard, Greentree, Avarguès-Weber, Garcia, Greentree and Dyer. This is an open-access article distributed under the terms of the Creative Commons Attribution License (CC BY). The use, distribution or reproduction in other forums is permitted, provided the original author(s) and the copyright owner(s) are credited and that the original publication in this journal is cited, in accordance with accepted academic practice. No use, distribution or reproduction is permitted which does not comply with these terms.
*Correspondence: Scarlett R. Howard, scarlett.howard@monash.edu