Satellitome of the Red Palm Weevil, Rhynchophorus ferrugineus (Coleoptera: Curculionidae), the Most Diverse Among Insects
 Eugenia E. Montiel
 Pablo Mora
 José M. Rico-Porras
 Teresa Palomeque
 Pedro Lorite
- Animal and Human Molecular Genetics Group (RNM-924), Department of Experimental Biology (Genetics Area), University of Jaén, Jaén, Spain
The red palm weevil, Rhynchophorus ferrugineus, is the most harmful species among those pests affecting palm trees. Its impact causes important economic losses around the World. Nevertheless, the genetic information of Rh. ferrugineus is very scarce. Last year, the first genome assembly was published including a rough description of its repeatome. However, no information has been added about one of the main components of repeated DNA, the satellite DNA. Herein, we presented the characterization of the satellitome of this important species that includes 112 satellite DNA families, the largest number in an insect genome. These satellite DNA families made up around 25% of the genome while the most abundant family, RferSat01-169, alone represented 20.4%. Chromosomal location of most abundant satellite DNA families performed by fluorescence in situ hybridization showed that all of them are dispersed in the euchromatin on all chromosomes but some of them are also specifically accumulated either on the pericentromeric heterochromatic regions of all chromosomes or on specific chromosomes. Finally, the transcription of satellitome families was analyzed through Rh. ferrugineus development. It was found that 55 out of 112 satellite DNA families showed transcription, some families seemed to be transcribed across all stages while a few appeared to be stage-specific, indicating a possible role of those satellite DNA sequences in the development of this species.
Introduction
During human history, insects have been responsible for spreading diseases, damaging crops and forests, destroying infrastructures or altering ecosystem functions. Globally, insects are considered as the most prevalent of invasive species, and likely, the costliest animal class to human society, with an estimated mean annual cost of around US$7.8 billion (Diagne et al., 2021).
The genus Rhynchophorus contains the main pests affecting palm trees. Among them, the red palm weevil (RPW), Rhynchophorus ferrugineus Olivier, 1790, stands out for its invasive potential and almost worldwide distribution. The RPW is a native insect to the Indian sub-continent and Southeast Asia, where it is considered the most destructive pest on coconut tree since XIX century (El-Mergawy and Al-Ajlan, 2011). In the 80s, it was detected for the first time in the Middle East and from there, it expanded toward the Arabian Peninsula, Lebanon, the Mediterranean basin, some Caribbean islands and United States (El-Mergawy and Al-Ajlan, 2011). Currently, Rh. ferrugineus is present in 49 countries around the world (EPPO, 20211). During the last four decades, the host number of the RPW has grown significantly, and currently it has been found in 29 plant species (EPPO, 20212). This increment on the host range is the result of its fast geographical expansion, which could be even wider in the future due to the climate change (Fiaboe et al., 2012).
The knowledge of the genetics of Rh. ferrugineus is necessary to understand its success in infestation and expansion. In fact, understanding its genetic diversity and population structure is a key step in developing effective control strategies (Bock et al., 2015). Besides its importance as pest species, published genetic data on Rh. ferrugineus are scarce. Most efforts have been focused on the use of genetic markers to study its expansion (El-Mergawy et al., 2011; Rugman-Jones et al., 2017; Wang et al., 2017) or population structure by the use of RAPD (random amplified polymorphic DNA) markers (Gadelhak and Enan, 2005; Al-Ayied et al., 2006). Surprisingly, in the OMICs era, only transcriptomic (Wang et al., 2013; Antony et al., 2016) and metagenomics projects could be found until 2019 (Tagliavia et al., 2014; Montagna et al., 2015). Recently, Hazzouri et al. (2020) published the first genome assembly of the species. According to this work, the RPW genome size was estimated by flow cytometry in 726 and 696 Mb (female and male respectively) and their assembly size was ∼780 Mb. Hazzouri et al. (2020) were able to annotate 25,567 genes and estimated that transposable elements make up more than 45% of the genome, with the mariner-like elements being the most abundant transposons. Later, Dias et al. (2021) published a haplotype-resolved genome assembly from a single heterozygous individual using a combination of short reads (Illumina) and linked reads (10x Genomics). The two generated assemblies, or ‘pseudo-haplotypes’, were identical in the homozygotic part (“unphased blocks”) and differing in regions where paternal and maternal haplotypes can be discriminated or phased (“phased block”). This haplotype-resolved genome assembly reduced duplicated artifacts present in the first published assembly to a smaller size, i.e., to 590 Mb. The authors attributed this sensible difference to the absence of one important player in the genome, the satellite DNA sequences present in the heterochromatic regions (Dias et al., 2021).
Satellite DNA (satDNA) is an important fraction of the eukaryotic genome. These non-coding sequences are repeated in tandem creating either large arrays as those located in centromeres, telomeres or pericentromeric heterochromatin or small arrays dispersed in the euchromatin (Palomeque and Lorite, 2008; Garrido-Ramos, 2017; Pita et al., 2017; Feliciello et al., 2021). Usually, satDNA is ignored in genome assembly projects due to its repeated nature, which hampers the assembly process, leading to its collapse and the underestimation of the satDNA amount in the genomes (Garrido-Ramos, 2017; Lower et al., 2018). Despite its scarce representation on genome assemblies, the satDNA has importance beyond maintaining the chromosome integrity. The satDNA sequences are involved in the organization, maintenance and function of the centromere (Perea-Resa and Blower, 2017), in the kinetochore establishment and the correct segregation of chromosomes (Louzada et al., 2020). Likewise, these sequences have been related to gene regulation under stress (Pezer and Ugarković, 2012), and to the regulation of specific developmental stage of the organisms (Shatskikh et al., 2020; Sermek et al., 2021). Furthermore, due to its fast evolutionary rate and its rapid change in copy number, the satDNA can contribute in speciation processes producing reproductive isolation between species (Hughes and Hawley, 2009; Ferree and Prasad, 2012). Therefore, it is possible to find specie-specific satDNA sequences, or even chromosome-specific ones, among the satDNA families that form the satellitome of a genome.
In Coleoptera, the use of classic methods such as restriction endonucleases digestions [revised in Palomeque and Lorite (2008)] or C0t-1 libraries generation (Mora et al., 2019) has allowed the identification of most of the satDNAs. Among beetles, the use of next-generation sequencing (NGS) data to study the satDNA has been so far limited to two species, the model species Tribolium castaneum (Tenebrionidae) and the ladybird Hippodamia variegata (Coccinellidae) (Pavlek et al., 2015; Mora et al., 2020). In T. castaneum two main satDNA families have been described, the major TCAST1 and the minor TCAST2, both located in the pericentromeric heterochromatin (Feliciello et al., 2011). Genome assembly of this species has allowed to characterize other nine satDNA families which are dispersed in the euchromatin (Pavlek et al., 2015). Additionally, the transcription of TCAST1 and TCAST2 has been studied upon heat stress and during embryonic development. Sermek et al. (2021) found that TCAST1 transcription was increased upon heat stress and specifically during blastoderm differentiation and gastrulation, while TCAST2 transcription levels were maintained stable during both processes. The genome analysis of H. variegata revealed that its satellitome contains at least 30 satDNA families, which together constitute approximately 15% of the genome of this species (Mora et al., 2020). However, no information of satDNA sequences has been published in Rh. ferrugineus nor other species of the family Curculionidae.
Herein, we aim to shed some light on this genomic aspect of Rh. ferrugineus. SatDNA is one of the most important components of the repeated fraction of the genomes and in many cases serves as an excellent marker that provides information about the evolutionary history of organisms. From low-coverage sequencing data, we have been able to describe the Rh. ferrugineus satellitome, the most diverse to date in insects due to the high number of satDNA families. We have also compared satDNA families among individuals from distant populations to analyze variations in the satellitome. Furthermore, we studied the satellitome transcription throughout development using available data of RNA-Seq.
Materials and Methods
Samples and DNA Extraction
Individuals of Rh. ferrugineus were collected in Jaén (Andalusia, Spain) during 2016. This sample was named as Rfer_SPA. Since the male is the heterogametic sex in this species (Bartlett and Rananavare, 1983) adult males were selected for this study in order to obtain information from all chromosomes, including X and Y ones. Males were dissected and their testicles stored in fixative (ethanol-glacial acetic acid) at −20°C. Male head, thorax and legs were used for genomic DNA extraction using a commercial kit (NucleoSpin Tissue, Mini kit for DNA from cells and tissue, Macherey-Nagel Co., Düren, Germany) according to the instructions provided by the manufacturer.
DNA Sequencing and Graph-Based Clustering of Sequencing Reads
Genomic DNA from a male was sequenced using the Illumina HiSeq™ 2000 sequencing platform at Macrogen Inc., Low-coverage sequencing yielded 20,548,506 of 101 bp paired-end reads (2.075 Gb). Raw reads were quality trimmed and adapters were removed with Trimmomatic v.0.36 (Bolger et al., 2014). Fastq files were modified, i.e., fastq to fasta and sampled, with reformat of BBTool suite3. Raw reads from a Rh. ferrugineus assembly project (SRX5416729: SRR8617825) were downloaded using prefetch and fastq-dump tools. This sample was named as Rfer_UAE, in order to indicate its origin, United Arab Emirates. To determinate the relation between our sequenced sample and the downloaded one, their mitogenomes were partially assembled with NOVOplasty v.3.7 (Dierckxsens et al., 2017) using the published mitochondrial genome of Rh. ferrugineus (NC_028535) as a reference. Sequences of the mitochondrial cytochrome oxidase I gene (COI) were extracted from the mitogenomes and aligned with a representation of COI sequences from Rh. ferrugineus haplotypes (El-Mergawy et al., 2011) using the Muscle method implemented in Geneious Pro v.4.8.5. Phylogenetic tree with the COI sequences was built using the GTR + I substitution model with PhyML (Guindon et al., 2010).
SatDNA sequences identification started with a graph-based clustering performed using the RepeatExplorer2 pipeline, which includes the TAREAN analysis (Novák et al., 2017, 2020), on the Galaxy portal environment4. A set of 6 million paired-end reads were randomly selected from each sample for clustering analysis. Those clusters displaying graph topology with sphere or ring-like shape were identified as containing satDNA. Clusters with estimated abundance above 0.001% were analyzed. For each candidate cluster, the highest-coverage contigs were used to produce a dot plot in Geneious Pro v.4.8.5. Contigs with presence of satDNA repeats were separated in monomers. These monomers were aligned using the Muscle method and a consensus sequence for the satDNA family was generated. Once consensus sequences of all satDNA families were obtained, a BLAST all-to-all analysis with blastn and --e 0.001 options were performed in order to identify similarities between satDNA families. In addition, abundance and divergence were calculated for each satDNA with RepeatMasker5 with “-a” option and the RMBlast search engine. For this analysis, five million reads were selected and aligned to the total collection of satDNA dimers or monomer concatenations of approximately 200 bp in length. A satellite landscape was generated considering distances from the sequences applying the Kimura 2-parameter model with the perl script calcDivergenceFromAlign.pl and createRepeatLandscape.pl from the RepeatMasker suite. The tandem structure index (TSI) was calculated from RepeatMasker output. As Martín Peciña (2021) proposed, we calculated the number of reads with at least the 89% of read length aligned to the dimer (internal/pure satDNA reads) divided by the total number of aligned reads (internal/pure + external/mixed satDNA reads). The satellite landscape created was used to calculate the divergence peak (DivPeak) and the relative abundance size of the peak (RSP) following the method of Camacho et al. (2022). In brief, for each satDNA family was calculated the divergence value where the landscape had a maximum (DivPeak) and the relative peak size as the sum of satDNA abundances at ± 2% divergence from the divergence peak (peak size) divided by the total abundance of that satDNA family.
SatDNA consensus sequences were also masked on three genome assemblies published of Rh. ferrugineus to study their presence on them. Using RepeatMasker and the same collection of satDNA dimers or monomer concatenation as above, we masked satDNA sequences on the following assemblies: the first published genome assembly, GCA_012979105.1 (Hazzouri et al., 2020); and the two pseudo-haplotype assemblies, GCA_014462685.1 and GCA_014490705.1 (Dias et al., 2021). Abundance and divergence were calculated as above indicated.
For comparison, the coefficient of variation (CV) and the relative abundance were calculated among samples. The relative abundance was expressed as the log2 of the ratio of compared sample divided by the Rfer_SPA sample in order to facilitate the understanding of the fold-change between samples. Calculations and statistical analysis were performed in R base v.4.0.1 (R Core Team, 2019). Figures were also plotted in R with ggplot2 and viridis packages (Warnes et al., 2020; Garnier et al., 2021).
Chromosome Preparation and Cytogenetic Mapping
The chromosome preparations were obtained from fixed testicles of Rh. ferrugineus according to the protocol described by Montiel et al. (2014). The consensus sequences of the satDNA families with abundance above 0.1% of the genome were used to design a set of oligonucleotides (Supplementary Table 1). The oligonucleotides were labeled with biotin-16-dUTP (Roche, Manheim, Germany) using terminal transferase (Roche) and they were used as probes (final concentration of 5 ng/mL in 50% formamide) to perform fluorescence in situ hybridizations (FISH), according to the procedure described by Palomeque et al. (2005) and Montiel et al. (2021). The fluorescent immunological detection was carried out using the avidin-FITC/anti-avidin-biotin system with three amplification rounds. Slides were mounted with Vectashield-DAPI (Vector Laboratories, Burlingame, CA, United States) containing DAPI to counterstain the chromosomes. Images were taken with a BX51 Olympus® fluorescence microscope (Olympus, Hamburg, Germany) equipped with a CCD camera (Olympus® DP70) and processed using Adobe® Photoshop® software.
Transcription of Satellite DNA
To study the presence of satDNA transcripts in Rh. ferrugineus, RNA-Seq data were download from the bioproject PRJNA598560 at the NCBI database (Yang et al., 2020). From this project, raw reads of three development stages were selected: larvae, pupae and adults (females and males) (SRX7585175-SRX7585186). Three samples were sequenced for each stage and sex summed up to 12 raw read files. Raw reads were quality trimmed using Trimmomatic v.0.36 (Bolger et al., 2014). Reads from the triplicates were mapped against each satDNA consensus sequences, same as used for abundance and divergence estimations, and a set of nucleotide sequences corresponding to CDS features annotated on the pseudo-haplotype assembly (GCA_014462685.1) using bbmap (see text footnote 3) to obtain the output as a sam file. The aligned reads were counted with samtools (Li et al., 2009). Read counts and differential expression were performed with the edgeR package (Robinson et al., 2010) in R base v.4.0.1 (R Core Team, 2019). Briefly, read counts from all sex and stages were normalized to counts per millions (CPM). SatDNA families and CDS without counts in at least two samples were filtered out. Differences in library sizes were normalized by the TMM method (Robinson and Oshlack, 2010). To analyze the relative similarities between the expression profiles of samples, a multi-dimensional scaling plot (MDS plot) was performed with the plotMDS function of edgeR. Samples that did not group together with others of the same stage were discarded. Differential expressed (DE) satDNA families were identified using biological duplicates to fit a negative binomial generalized log-linear model with the glmQLFIT function and performing a likelihood ratio test to select DE satDNAs with the glmQLFTest function of edgeR. Those satDNA families whose FDR remained below 0.05 and with a log2-fold-change higher than 0.6 were confidently considered differential expressed between the target samples. Correlation between satDNA transcription and abundance was analyzed by means of the Spearman correlation and graphs were obtained with the ggplot2 package (Warnes et al., 2020) in R.
Results
Satellitome Description of Rhynchophorus ferrugineus
The red palm weevil expansion has been explosive in the last 40 years. In the Mediterranean basin, this expansion was possibly promoted by the exportation of infested palm trees from Egypt to other countries (Ferry and Gómez, 2002), appearing the first reports of its presence in Spain in the 90s (Barranco et al., 1995). The individuals sampled for this study were recollected in Jaén (Andalusian, Spain) in 2016 and a single male DNA sample was sequenced by low-coverage, yielding 20,548,506 paired reads (≈2 Gb). After quality trimming for removing poor quality bases at the read ends and sequencing adapters, a set of 17,127,512 paired-end reads (≈1.7 Gb) was obtained (Rfer_SPA). Additionally, we used a collection of raw reads (SRX5416729) from one of the Rh. ferrugineus samples used for its genome assembly (Hazzouri et al., 2020). This sample of male individuals from the United Arab Emirates (Rfer_UAE) was selected to obtain a more complete description of its satellitome. Firstly, we assembled partially the mitogenome of our two samples obtaining the sequence of COI gene, a sequence commonly used for population genetics studies. These sequences were aligned with a representation of the COI sequences of Rh. ferrugineus haplotypes published by El-Mergawy et al. (2011) and a phylogenetic tree was built (Supplementary Figure 1). In their work, the authors describe the existence of eight haplotypes (H1-H8) in 14 populations across the distribution range of RPW. The haplotype H8 was fixed in all populations of the Mediterranean basin. Our Spanish individual sequence (Rfer_SPA) collapsed in the same branch with all H8 haplotype sequences from Spain and other Mediterranean countries, while the sequence from UAE sample (Rfer_UAE) were clustered in the same branch of H1 haplotype with sequences from UAE, Syria and Pakistan.
From a subset of six million paired-end reads randomly selected from each sample for the RepeatExplorer2 analysis, a million reads per sample were selected as input by the pipeline for performing the clusterization. More than 50% of reads were grouped into clusters, indicating a high content of repeat sequences in this genome. After the analysis of 400 clusters above 0.001% of abundance in the genome, 111 satDNA families were identified. SatDNA consensus sequences were deposited in NCBI database (accession no. OL456523–OL456633). Besides, we used RepeatMasker software to mask the insect canonical telomeric repeat (TTAGG)n in the RPW genome, which was present at a low level. With the 111 satDNAs detected in the RepeatExplorer analysis plus the telomere repeats, the satellitome of Rh. ferrugineus is composed by at least 112 satDNA families representing the 24.9–11.4% of the genome (samples from Spain and UAE, respectively) (Table 1). Each satDNA family was named with the species name abbreviation (Rfer), followed by “Sat,” a number of its position in decreasing abundance (relative to the Spanish sample) and the length of the repeat sequence consensus (Ruiz-Ruano et al., 2016; Table 1). The telomeric repeat was named in the same manner and the abbreviation “Tel” was added to the end in order to facilitate its identification (Table 1).
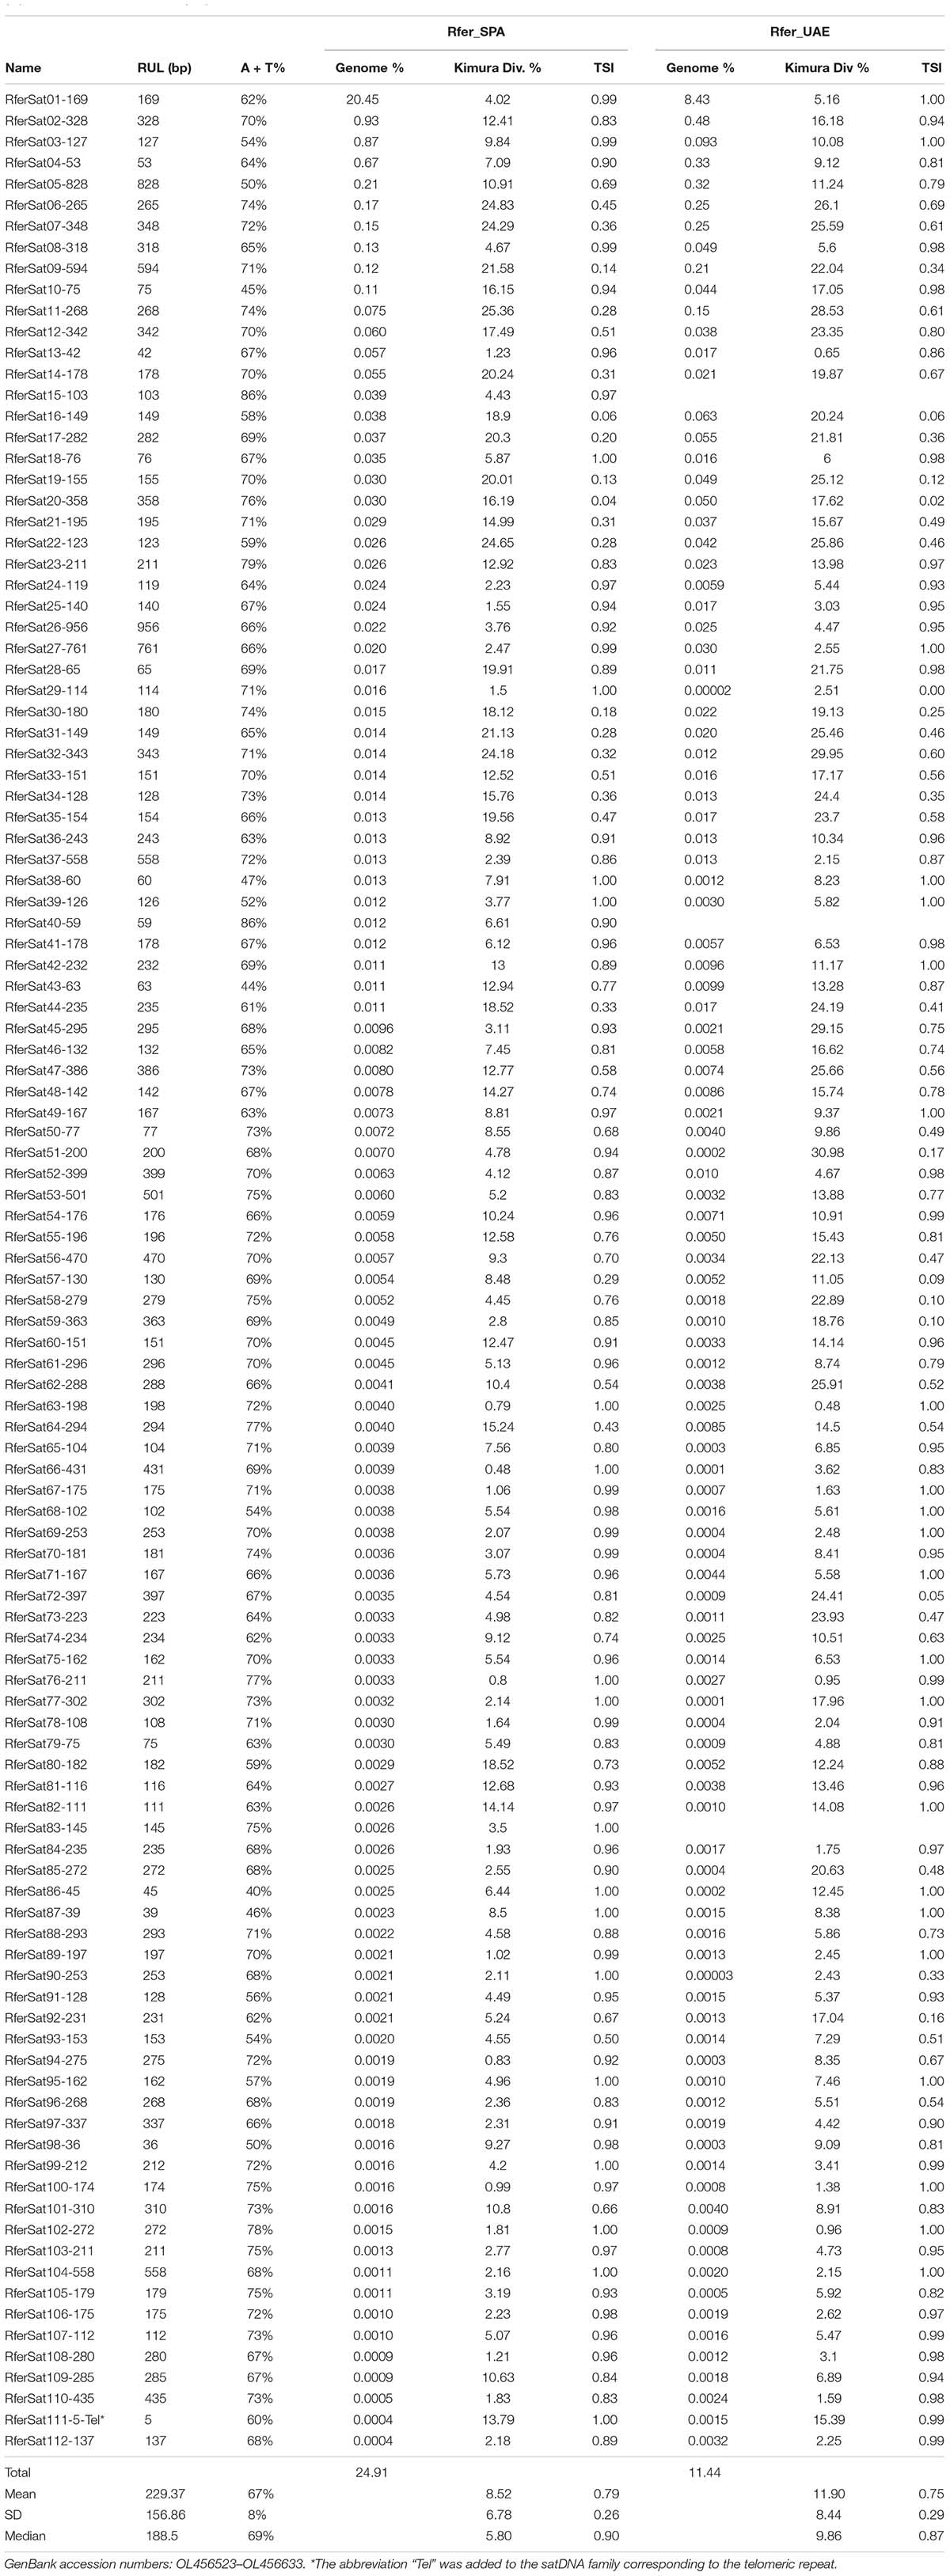
Table 1. Data of the satDNA families found in Rhynchophorus ferrugineus populations: repeat unit length (RUL), A + T content, genome abundance (%), divergence (%) and tandem structure index (TSI).
The average size of the satDNA families repeat units was 229 bp and apart from telomeric repeat, it ranged from 36 bp (RferSat98-36) to 956 bp (RferSat 26-956), with most of the repeat units being smaller than 200 bp (median = 188 bp) (Table 1). The A + T% in the consensus satDNA families ranged between 40% (RferSat86-45) and 86% (RferSat15-103) with a mean A + T% of 67%. Moreover, we analyzed the divergence of each satDNA family. The family with the lowest divergence was RferSat66-431 (0.48%) while the highest value of divergence corresponded to the family RferSat11-268 (25.36%). Altogether, the satellitome of Rh. ferrugineus has a mean divergence of 8.52% (Table 1). Additionally, we calculated the tandem structure index (TSI) of each satDNA family (Martín Peciña, 2021). This index represents the proportion of internal reads of satDNA arrays (reads containing only satDNA sequence) respect to the total of reads with satDNA sequence. The TSI index varies between 0 and 1 and informs about the clusterization level of the satDNA family. Therefore, dispersed families with arrays formed by low number of repeat units would present lower value of TSI while families with their repeat units concentrated in big arrays would present TSI values closer to 1. Most of the satDNA families of Rh. ferrugineus showed high TSI values with a median of 0.91, however, there are families with very low TSI values pointing out to satDNA families with their monomers highly dispersed such as the family RferSat09-594. The possible evolutionary relationships among satDNA families were also analyzed. We found that 15 satDNA families shared similarities in their consensus sequence. These satDNAs may be grouped into seven satDNA superfamilies (Supplementary Figure 2). A superfamily would be composed of satDNA families that show significant sequence similarity (Ruiz-Ruano et al., 2016). All superfamilies have two members except the superfamily SF-1 formed by three satDNA families: RferSat01-169, RferSat14-178 y RferSat54-176. Among SF-1 members, RferSat01-169 and RferSat14-178 were the most similar (73.2% identity) whereas the identity was only 60.2% between RferSat01-169 and Rfersat54-176, or 62.9% between RferSat14-178 and RferSat54-176. The superfamily SF-5 (RferSat46-132 and RferSat48-142) had the highest similarity between their members, 84.1% identity. On the contrary, the superfamilies SF-2 (RferSat12-342 and RferSat32-343) and SF-4 (RferSat25-140 and RferSat83-145) showed the lowest similarities with 61.9% and 62.1% respectively. The superfamily SF-6 (RferSat49-167 and RferSat71-167) was in the middle range with their members sharing 76.2% of their sequence. The members of superfamily SF-7 (RferSat52-399 and RferSat61-296) had also a similarity of 76.2% of aligned nucleotides although RferSat52-399 contained a 122 bp insertion. Finally, the families RferSat15-103 and RferSat40-59 composed the superfamily SF-3. Interestingly, in the SF-3, the family RferSat15-103 seemed to be an imperfect dimer of RferSat40-59, where the first part of its consensus sequence contained a 19-bp deletion being the second one almost complete and more similar to RferSat40-59 sequence (84.7% identity) (Supplementary Figure 2).
The diploid chromosome number of RPW is 2n = 22, with a XY sex chromosome system (Bartlett and Rananavare, 1983). All chromosomes that formed the RPW karyotype are either metacentric or submetacentric except for the Y chromosome which is a small dot-shaped chromosome and displays with the X chromosome the typical parachute association (Xyp) in meiosis I (Al-Qahtani et al., 2014; Lannino et al., 2016). However, the small size of the Y chromosome and the different conformations of the sex chromosome pair in meiosis makes it difficult to identify the sex bivalent on many occasions. We confirmed the chromosome number in our sample as we found in the meiotic cells 11 bivalents including the Xyp. Moreover, the C-banding supported the presence of large heterochromatic blocks in pericentromeric position of all autosomes and the sex chromosomes (Figure 1A). The C-banding pattern was also similar to the pattern obtained with DAPI staining, indicating the A + T-rich nature of these heterochromatic blocks (Figure 1B). The ten most abundant satDNA families (above 0.1% of the genome) were chromosomally located. Likewise, two randomly selected satDNA families with a proportion in the genome below 0.1% were also chromosomally located (Figure 1 and Supplementary Figure 3). Oligonucleotide probes for fluorescence in situ hybridization were designed based on each satDNA family consensus sequence. The twelve families analyzed gave positive hybridization results. Five different hybridization patterns were observed. First, hybridization signals accumulated in the heterochromatin of all chromosomes that was displayed by the family RferSat01-169 (Figures 1C–E), the main satDNA family. Second, hybridization signals accumulated on the heterochromatic Y chromosome that was found for the family RferSat02-328 (Figures 1F–H). Third, hybridization signals scattered in the euchromatin of all chromosomes, as was found for the family RferSat03-127 (Figures 1I–K). Fourth, hybridization signals accumulated in the heterochromatin of one autosome pair, which was displayed by the family RferSat04-53 (Figures 1L–N). Finally, scattered hybridization signals were also observed in the euchromatin of all chromosomes, although with accumulation in euchromatin of an autosomal pair, as we found in the RferSat05-828 family (Figures 1O–Q). In all cases, despite the possible existence or no of satDNA accumulation on some chromosomal regions, more or less intense signals were always observed on the euchromatic regions. This latter pattern was observed for the rest of the analyzed satDNA families (Supplementary Figure 3).
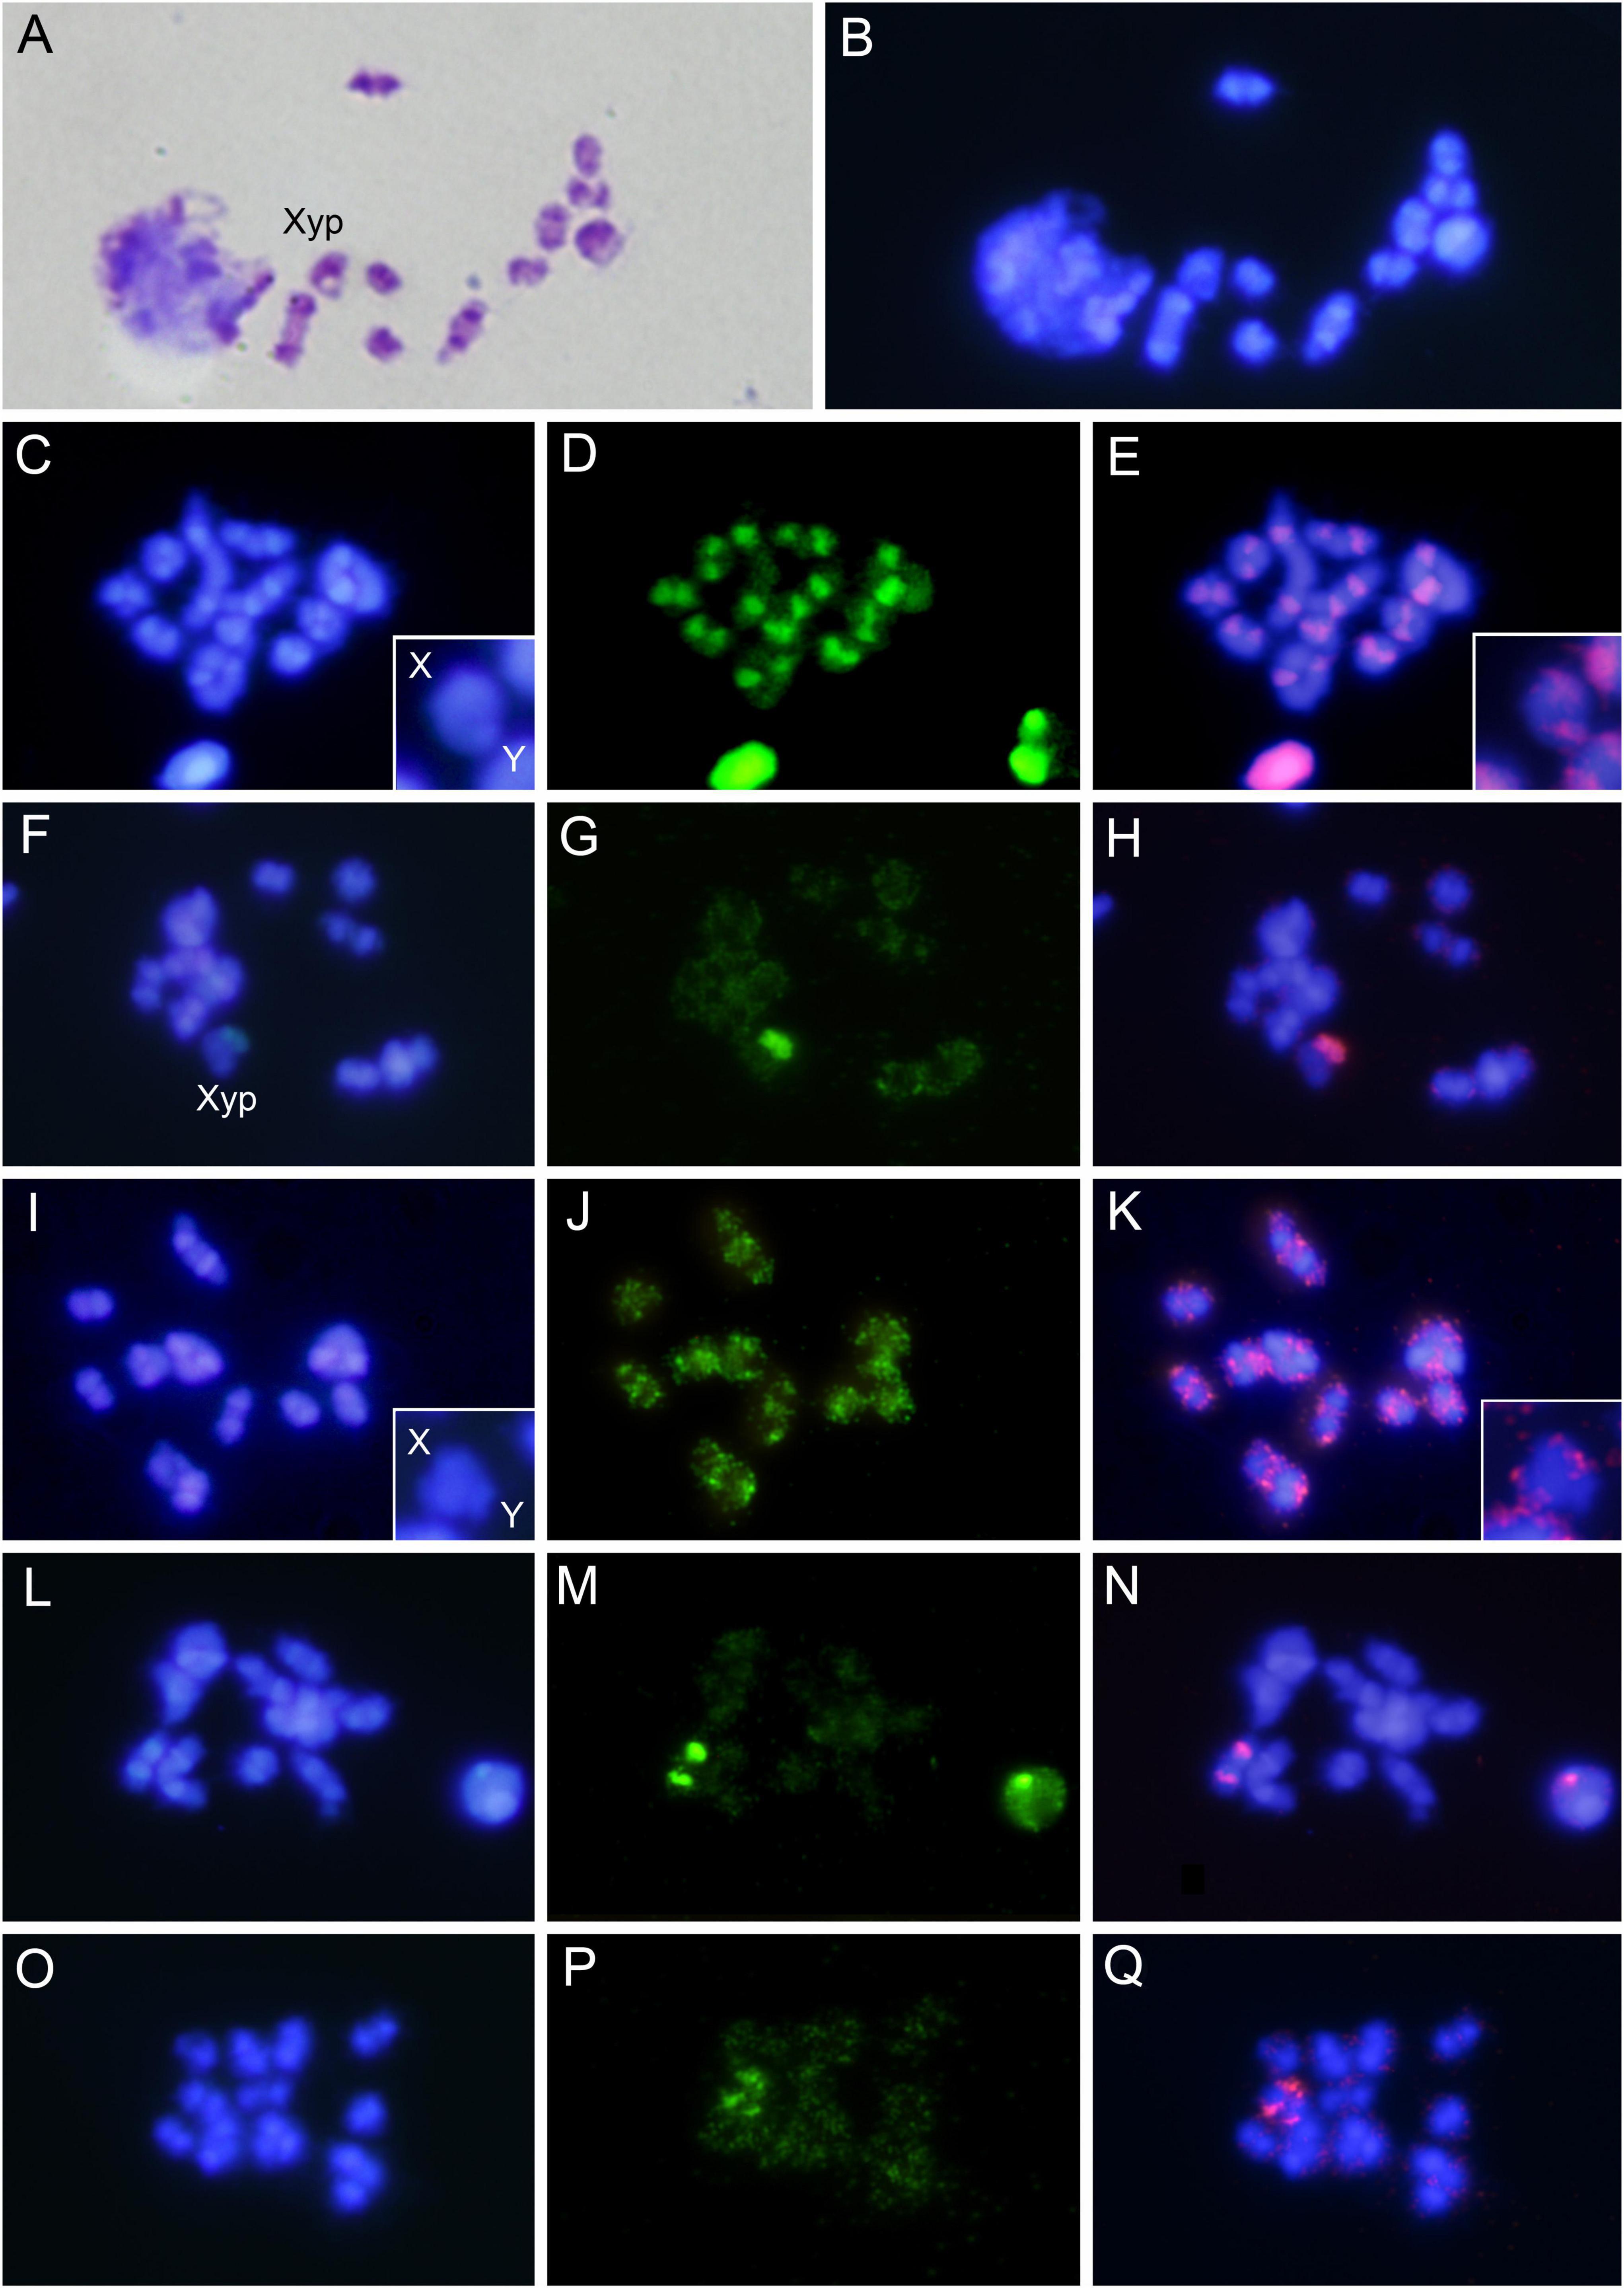
Figure 1. (A) Meiotic cell of Rhynchophorus ferrugineus after C-banding and stained with Giemsa. (B) The same cell after DAPI staining. (C) Meiotic cell after DAPI staining, (D) the same after FISH using RferSat01-169 as a probe, and (E) merged image. (F) Meiotic cell after DAPI staining, (G) the same after FISH using RferSat02-328 as a probe, and (H) merged image. (I) Meiotic cell after DAPI staining, (J) the same after FISH using RferSat03-127 as a probe, and (K) merged image. (L) Meiotic cell after DAPI staining, (M) the same after FISH using RferSat04-53 as a probe, and (N) merged image. (O) Meiotic cell after DAPI staining, (P) the same after FISH using RferSat05-828 as a probe, and (Q) merged image. For RferSat01-169 and RferSat03-127 satDNAs families selected sexual bivalents from other cells are also shown.
Satellitome Analysis in Individuals From Different Populations
The satellitome could vary across populations and lineages of the same species (Feliciello et al., 2015; Pita et al., 2017). Two individuals from two distant populations (Rfer_SPA and Rfer_UAE) with different haplotypes (H8 and H1) were used to characterize their satellitomes (Supplementary Figure 1), and to test the impact of the distance on the satDNA sequences.
Firstly, the abundance of satDNA families in each individual was analyzed. As it was commented above, in the Spanish specimen satellitome represented 24.9% of the genome, while in the UAE specimen the satellitome was 11.4%. The major contribution to this variation was due to the family RferSat01-169, which represented 20.5% in Rfer_SPA and just 8.4% in Rfer_UAE (Table 1). However, the remaining satDNA families did not display clearly differences of abundances between samples (p = 0.019 two-sided Wilcoxon signed-rank test). Three satDNA families were found only in the Rfer_SPA individual (RferSat15-103, RferSat40-59 and RferSat83-145). The variation of abundance among individuals was calculated with the coefficient of variation and the ratio between samples (Rfer_UAE/Rfer_SPA) which was represented as log2 (Rfer_UAE/Rfer_SPA). Only 39 out 112 families showed coefficient of variation below 30% with less of 1.5 fold-change between samples (−0.6 < log2 ratio < 0.6), 19 were more abundant on Rfer_UAE (log2 ratio > 0.6) and 51 more abundant on Rfer_SPA (log2 ratio < −0.6) (Figure 2A). This pointed out either to the possible expansion of Rfer_SPA specimen satellitome or contraction of the Rfer_UAE one. Besides, relation between satDNA family abundance and its variation between samples (as log2 ratio) was analyzed. This analysis helped us to determinate if the abundance variations of satDNA families between samples were biased to the most abundant or the least abundant families. While these variables showed no correlation in Rfer_SPA (Spearman’s correlation rs = 0.02, p = 0.8239) (Figure 2A), they did in Rfer_UAE (Spearman’s correlation rs = 0.55, p < 0.001) (Figure 2A) where low-abundant satDNA families presented largest changes in respect of Rfer_SPA.
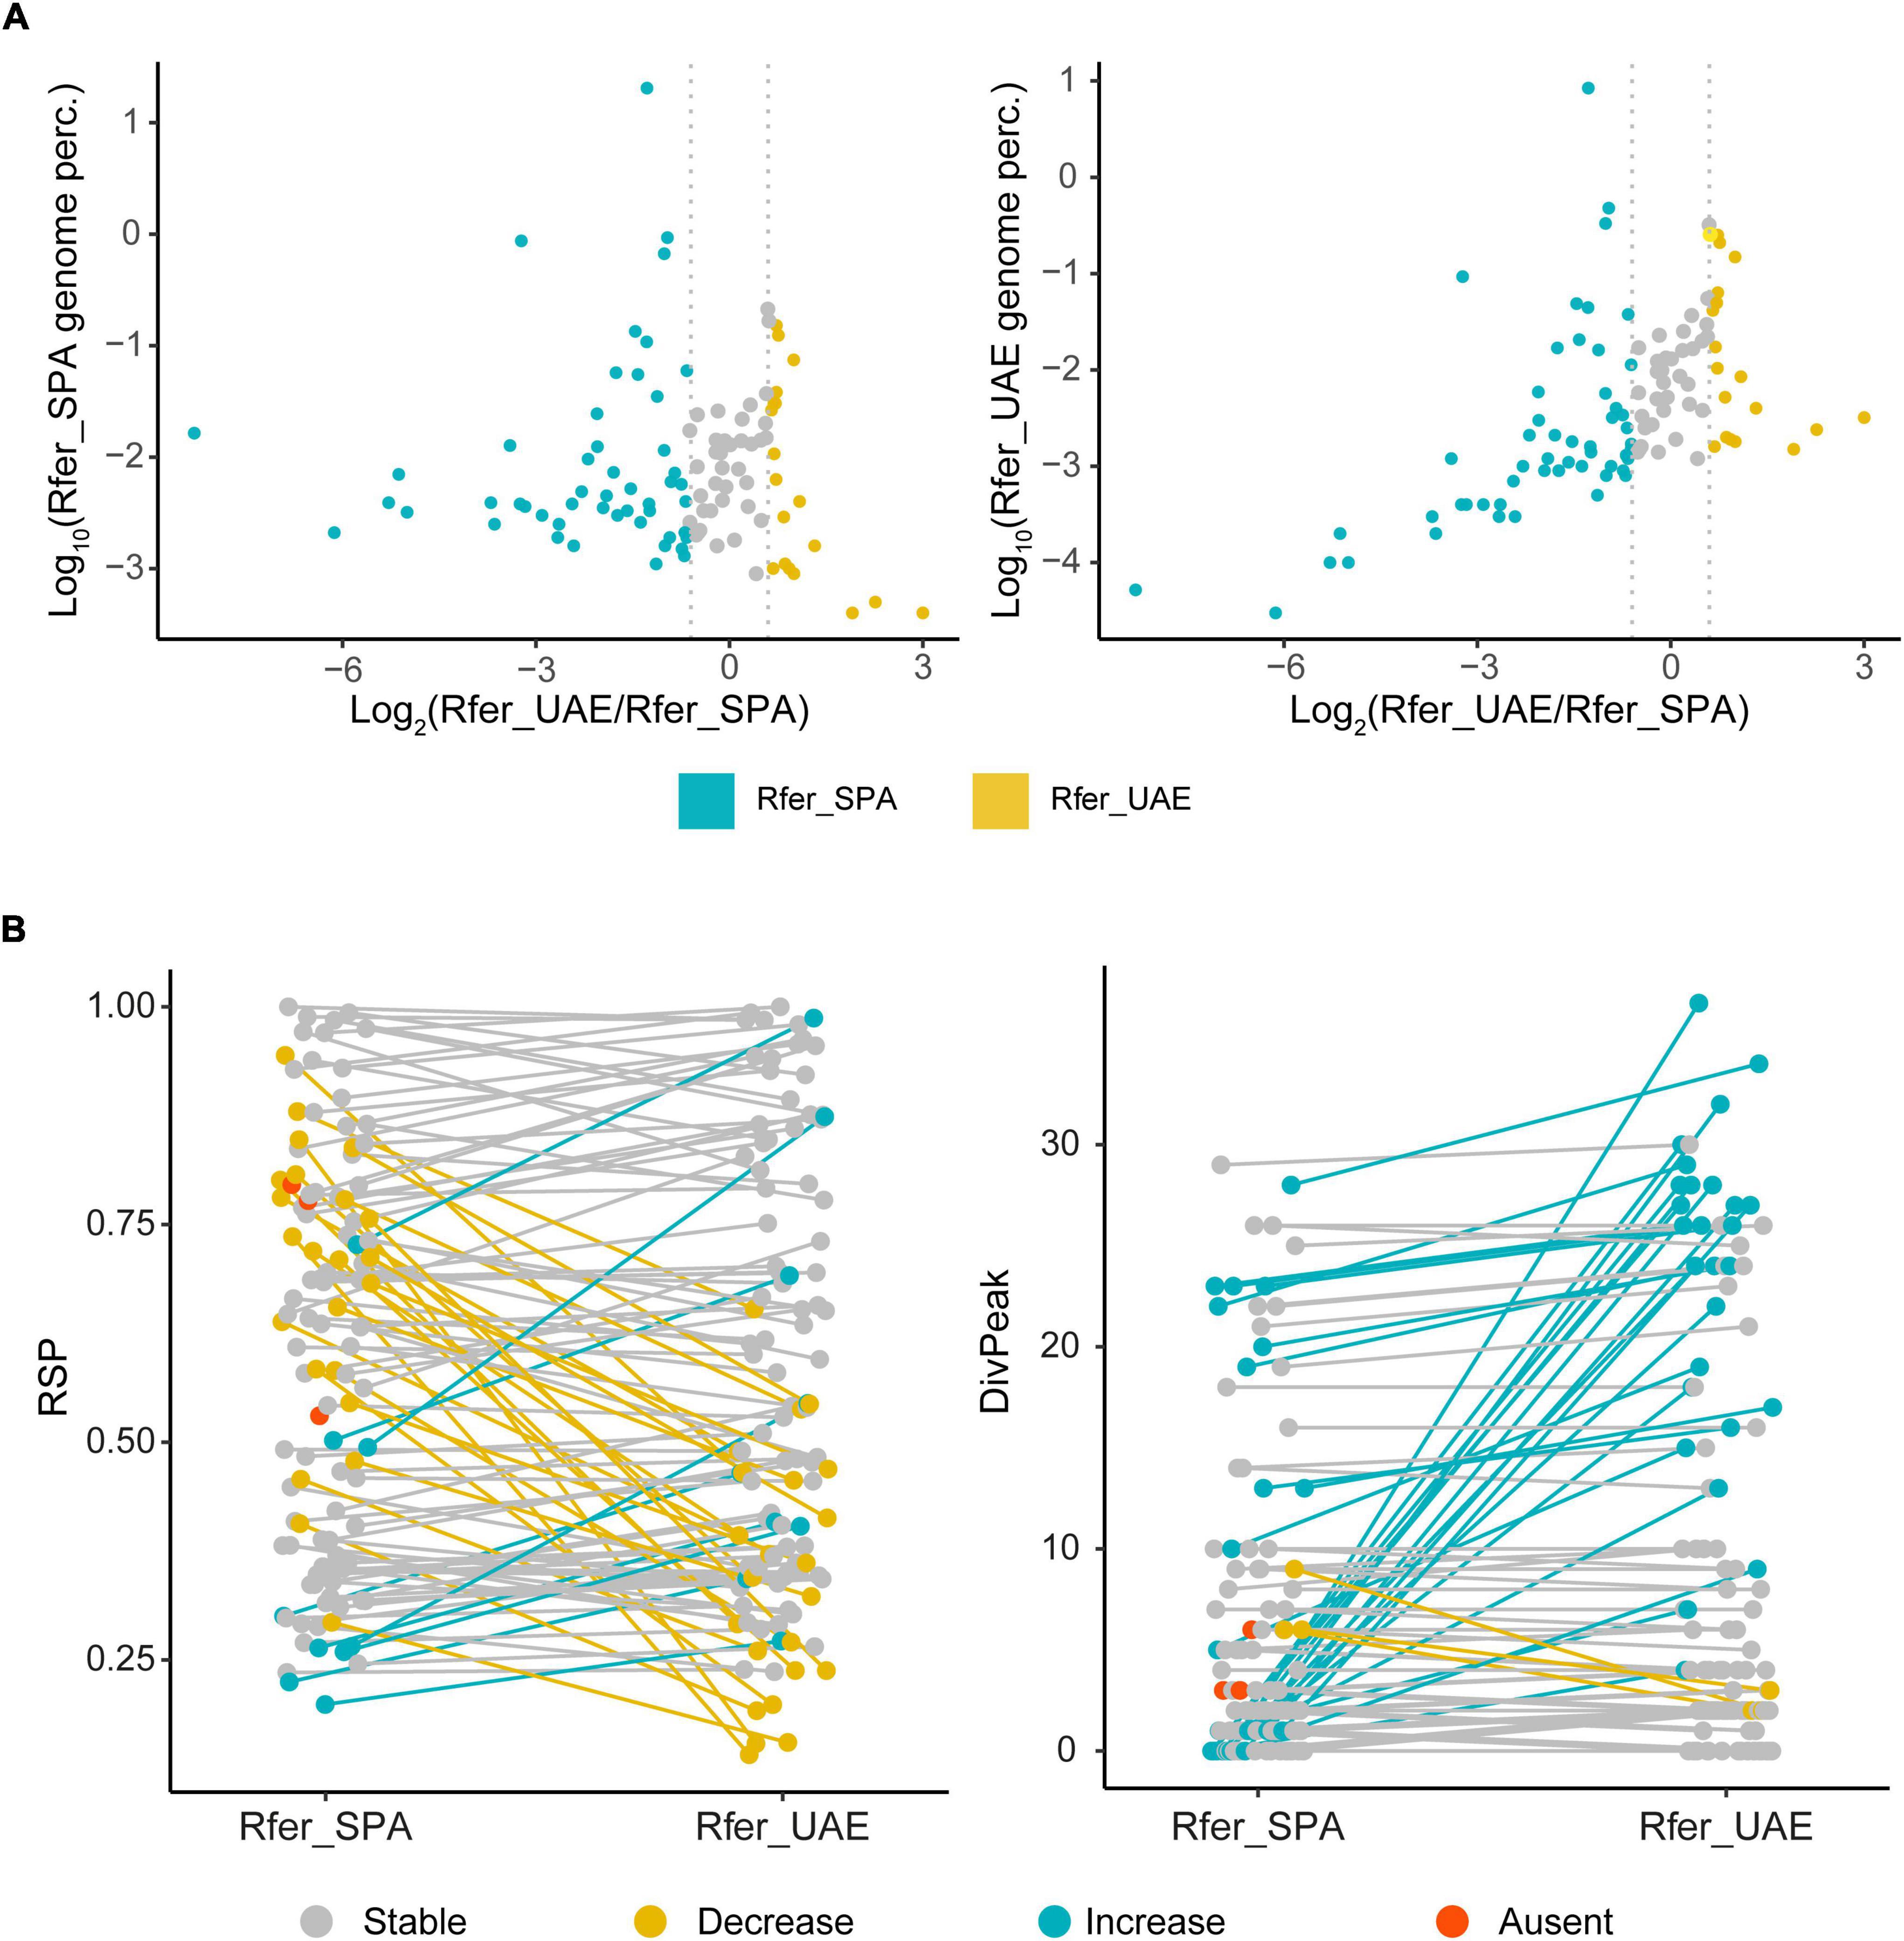
Figure 2. Comparison of satDNA families between Rhynchophorus ferrugineus samples. (A) Genome percentage of satDNA families in each sample against the abundance ratio was depicted. SatDNA families with coefficient of variation below 30% and less of 1.5 fold-change between samples (–0.6 < log2 ratio < 0.6) are in gray, most abundant satDNA families on Rfer_UAE in yellow and most abundant on Rfer_SPA in blue. (B) SatDNA homogenization indexes, RSP and DivPeak, in Spanish and UAE samples. Changes between samples are represented in colors: families with no variation in gray, decreased in UAE individual in yellow and increased in UAE individual in blue. Families not found in Rfer_UAE are in orange.
Other interesting datum to compare was the satellitome landscape of each satDNA family in both specimens. This landscape was obtained by plotting abundance vs. divergence of satDNA sequences against the consensus sequence of each family. Furthermore, we calculated the divergence value where the landscape had a maximum (DivPeak) and the relative abundance size of the peak (RSP) as a measure of the family homogenization (Camacho et al., 2022). The satDNA families with a recent expansion would display lower values of DivPeak and RSP values close to 1. Their monomers would be nearly identical and almost the total abundance of the family would be contained in the landscape peak. The satellite landscape distributions of these families would be leptokurtic, with their peaks on low divergence values. On the contrary, satDNA families with high divergence would have high values of DivPeak and lower RSP. Their monomers would accumulate mutations in their sequence since their last expansion and the satDNA family abundance would not be contained in the peak. The satellite landscape distribution of these divergent families would be platykurtic with the peak on high divergence values. Most of the satDNA families did not present significant differences for RSP between individuals (p = 0.1775 two-sided Wilcoxon signed-rank test) but those families which did show differences presented mostly lower values in Rfer_UAE (Figure 2B). The absence of significant differences for RSP between the two analyzed individuals would indicate similar homogenization process on the populations they are part of. On the contrary, DivPeak values between individuals were found significantly different (p = 1.078e-06 two-sided Wilcoxon signed-rank test) with lower values in Rfer_SPA (Figure 2B), which would suggest expansion of satDNA families in Rfer_SPA. Focusing on the most abundant families (above 0.1% of the genome), we found that the landscape for each individual tended to have similar distribution but with differences in abundance (Figure 3). In the case of the family RferSat01-169, satellite landscapes in both samples indicated a recent expansion of this satDNA that seems more intense in the Rfer_SPA specimen. Nevertheless, if we change the focus to satDNA families with the extreme log2 ratio values, their satellitome landscapes were mainly leptokurtic with DivPeak close to 0 and higher RSP values in the sample with more abundance which also pointed out to the family amplification on that sample (Supplementary Figure 4).
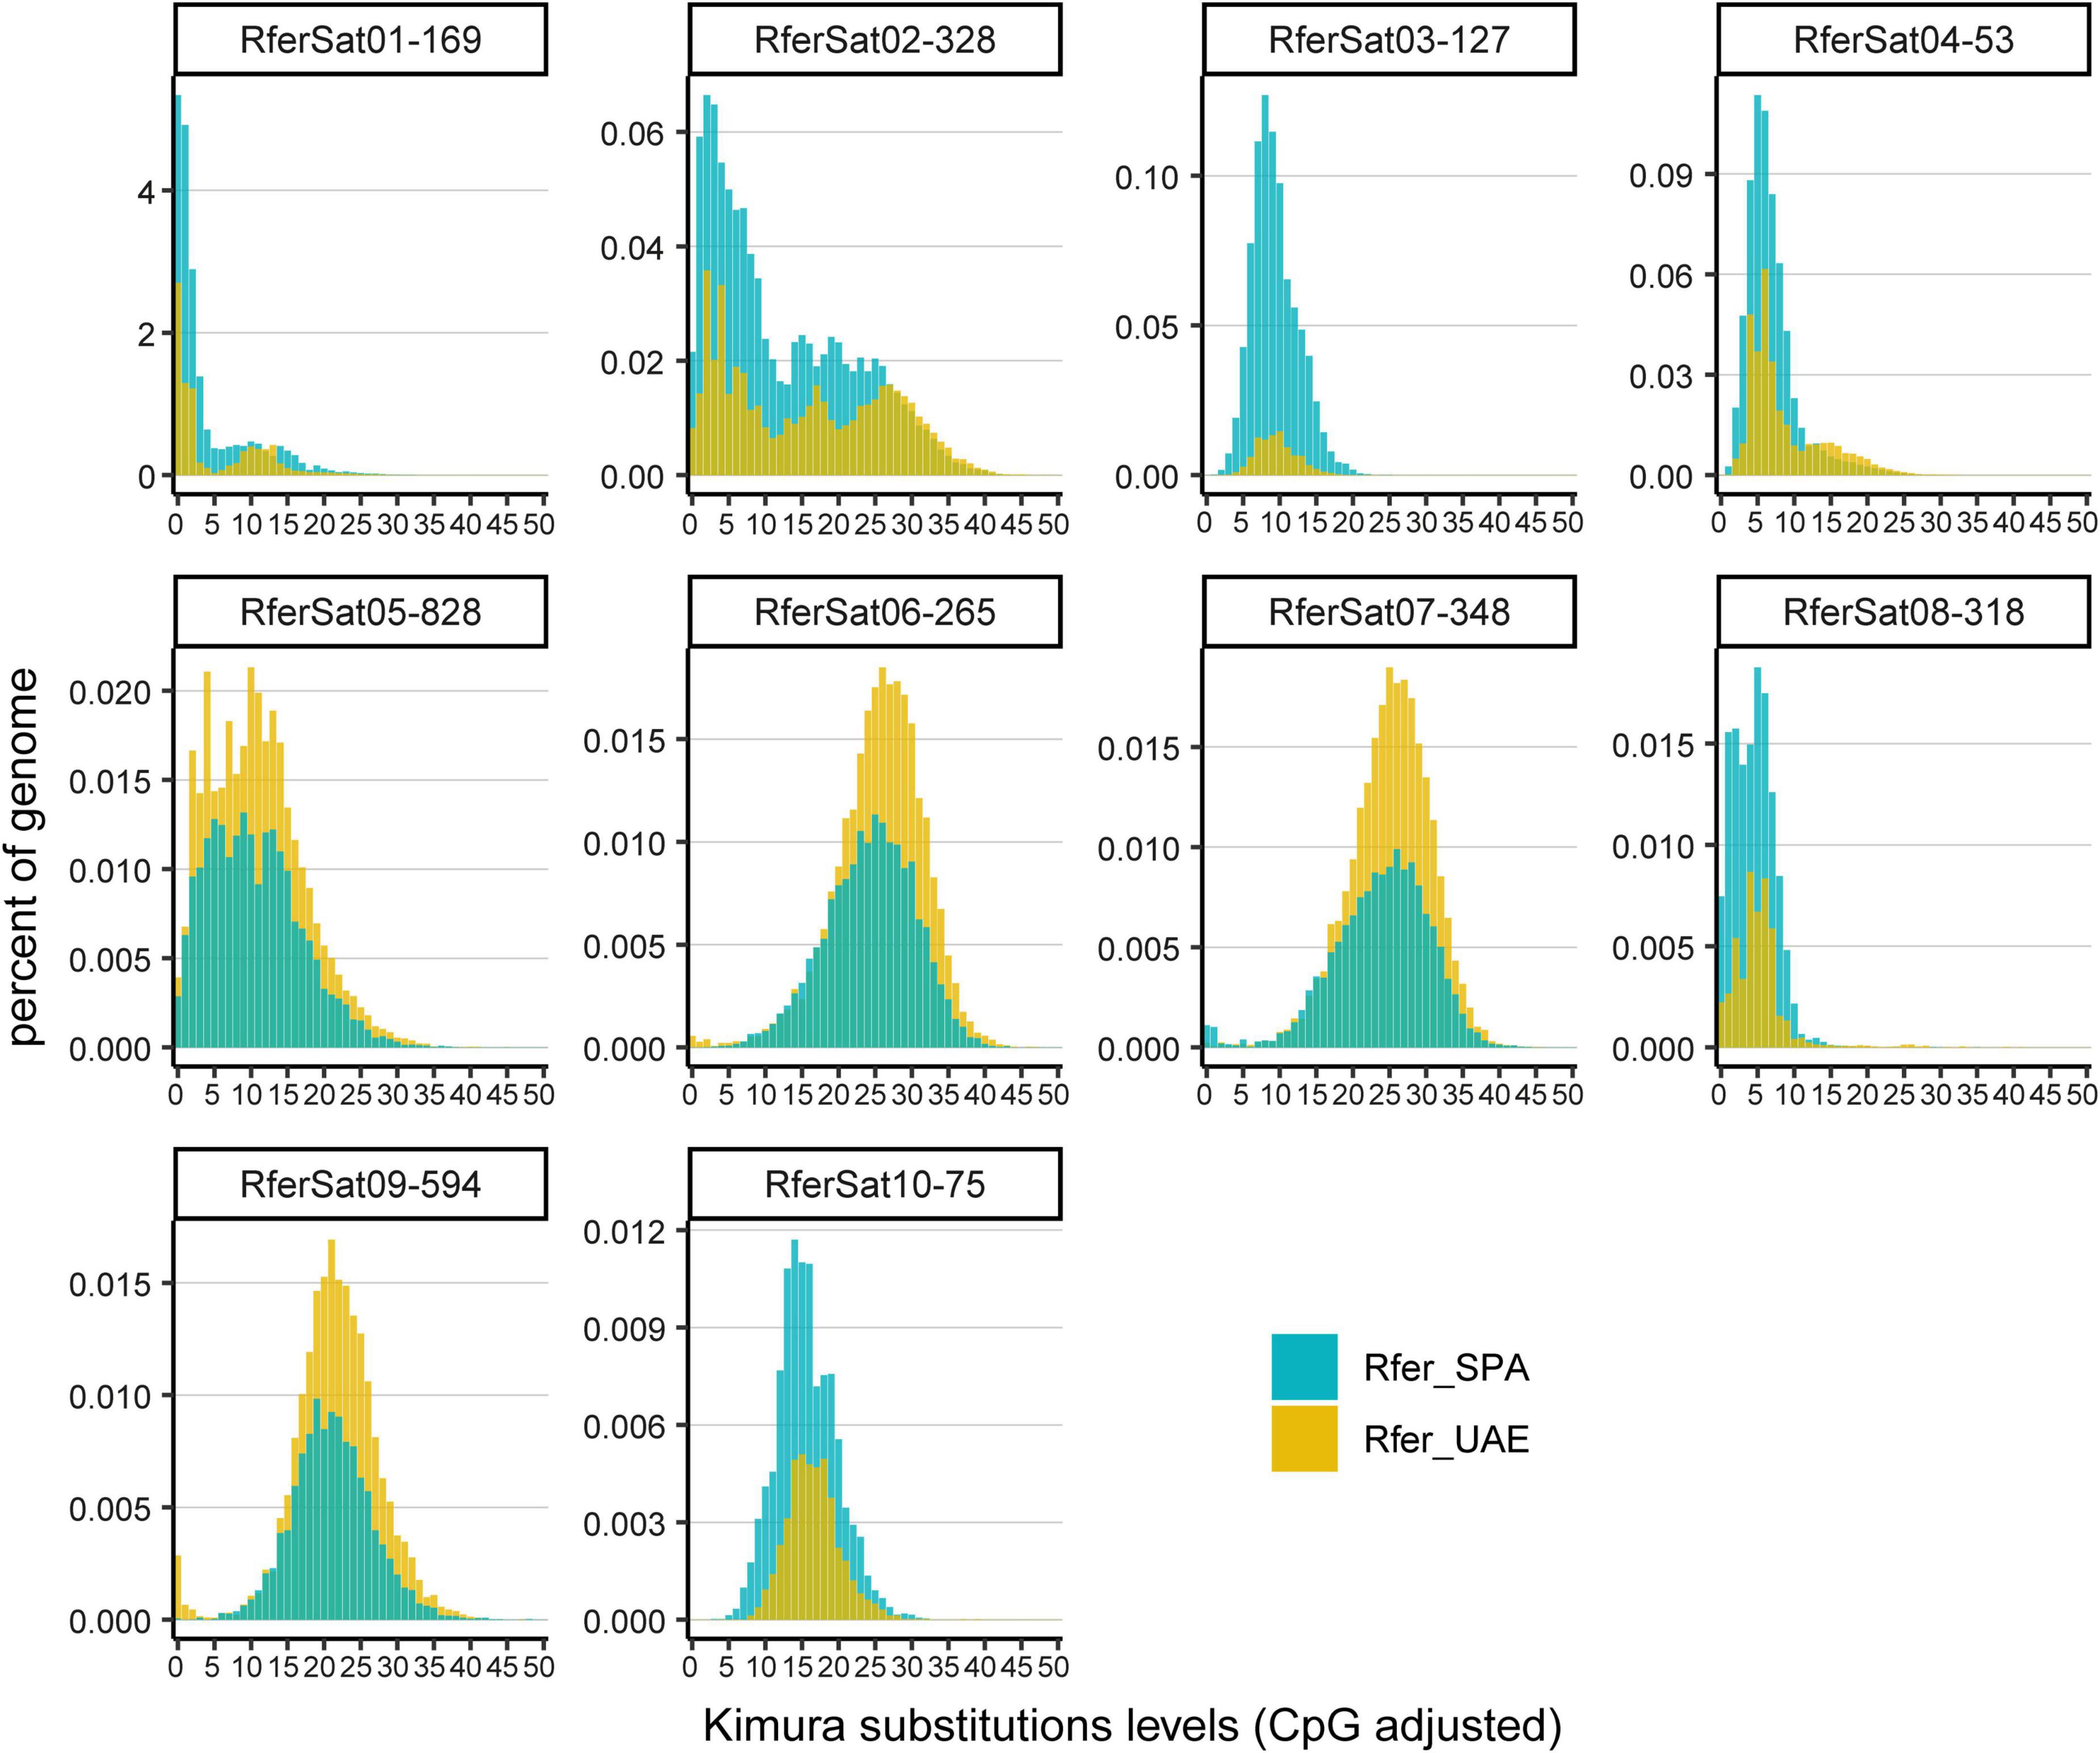
Figure 3. Satellite landscape of most abundant satDNA families.
Satellitome Representation in the Rh. ferrugineus Genome Assemblies
Recently, three Rh. ferrugineus genome assemblies have been published. Using RepeatMasker, we masked satDNA sequences on the three assemblies: the first published assembly (GCA_012979105.1; Hazzouri et al., 2020), and two “pseudo-haplotype” assemblies (GCA_014462685.1 and GCA_014490705.1; Dias et al., 2021) (Supplementary Table 2). The representation of Rh. ferrugineus satellitome on these assemblies was around 2% of the assembly, being slightly lower on the first genome assembly (2.23%) but identical on the “pseudo-haplotype” assemblies (2.67%). In consequence, the satDNA appeared underrepresented in them, for instance the family RferSat01-169, the most abundant one, represented just the 0.06–0.01% of the assemblies. Furthermore, not all satDNA families could be masked, 109 out of 112 satDNA families composing Rh. ferrugineus satellitome were found in both “pseudo-haplotype” assemblies and just 88 families were found in the first one. In order to analyze this variation further, we calculate the relative variation of each family as the log2 ratio between assembly and our sample abundance (abundance in the assembly/abundance in our sample) and the coefficient of variation between abundances as we did when we compared the satellitome between Spanish and Emirati individuals. In all cases, both values were correlated with the TSI value of satDNA families (Spearman’s rank correlation rho p < 0.000) (Supplementary Table 3) although with opposite tendency. SatDNA families with a low clusterization and more interspersed (low TSI value) tended to be better assembled and well represented in the assemblies so their coefficient of variation is low between the assembly and our sample, and their log2 ratio is closer to 1. SatDNA families with higher TSI value, formed by clusters with large number of monomers, seem to be less represented on the Rh. ferrugineus genome assemblies. Accordingly, these satDNA families have larger coefficient of variation and smaller log2 ratios between the abundance found in our sample and the assemblies. During the assembly process, repeated DNA sequences tend to be discarded due to the challenge that their assembly suppose. In this way, a large cluster of satDNA is likely to be collapsed just in few monomers, since satDNA families composed by small clusters scattered in the genome appear to be better assembled. This was well illustrated in the Figure 4, where for the most abundant satDNA families the number of monomers masked in the assembly GCA_014462685.1 was plotted against the number of scaffolds. Again, the families with TSI below 0.7 (RferSat05-828, RferSat06-265, RferSat07-348 and RferSat09-594) presented thousands of scaffold with low number of monomers, while families with TSI above 0.9 (RferSat01-169, RferSat03-127, RferSat08-318 and RferSat10-75) were masked in low number of scaffolds and with low number of monomers (Figure 4). The families with TSI between 0.7 and 0.9 showed intermediated values for both number of scaffolds and monomers.
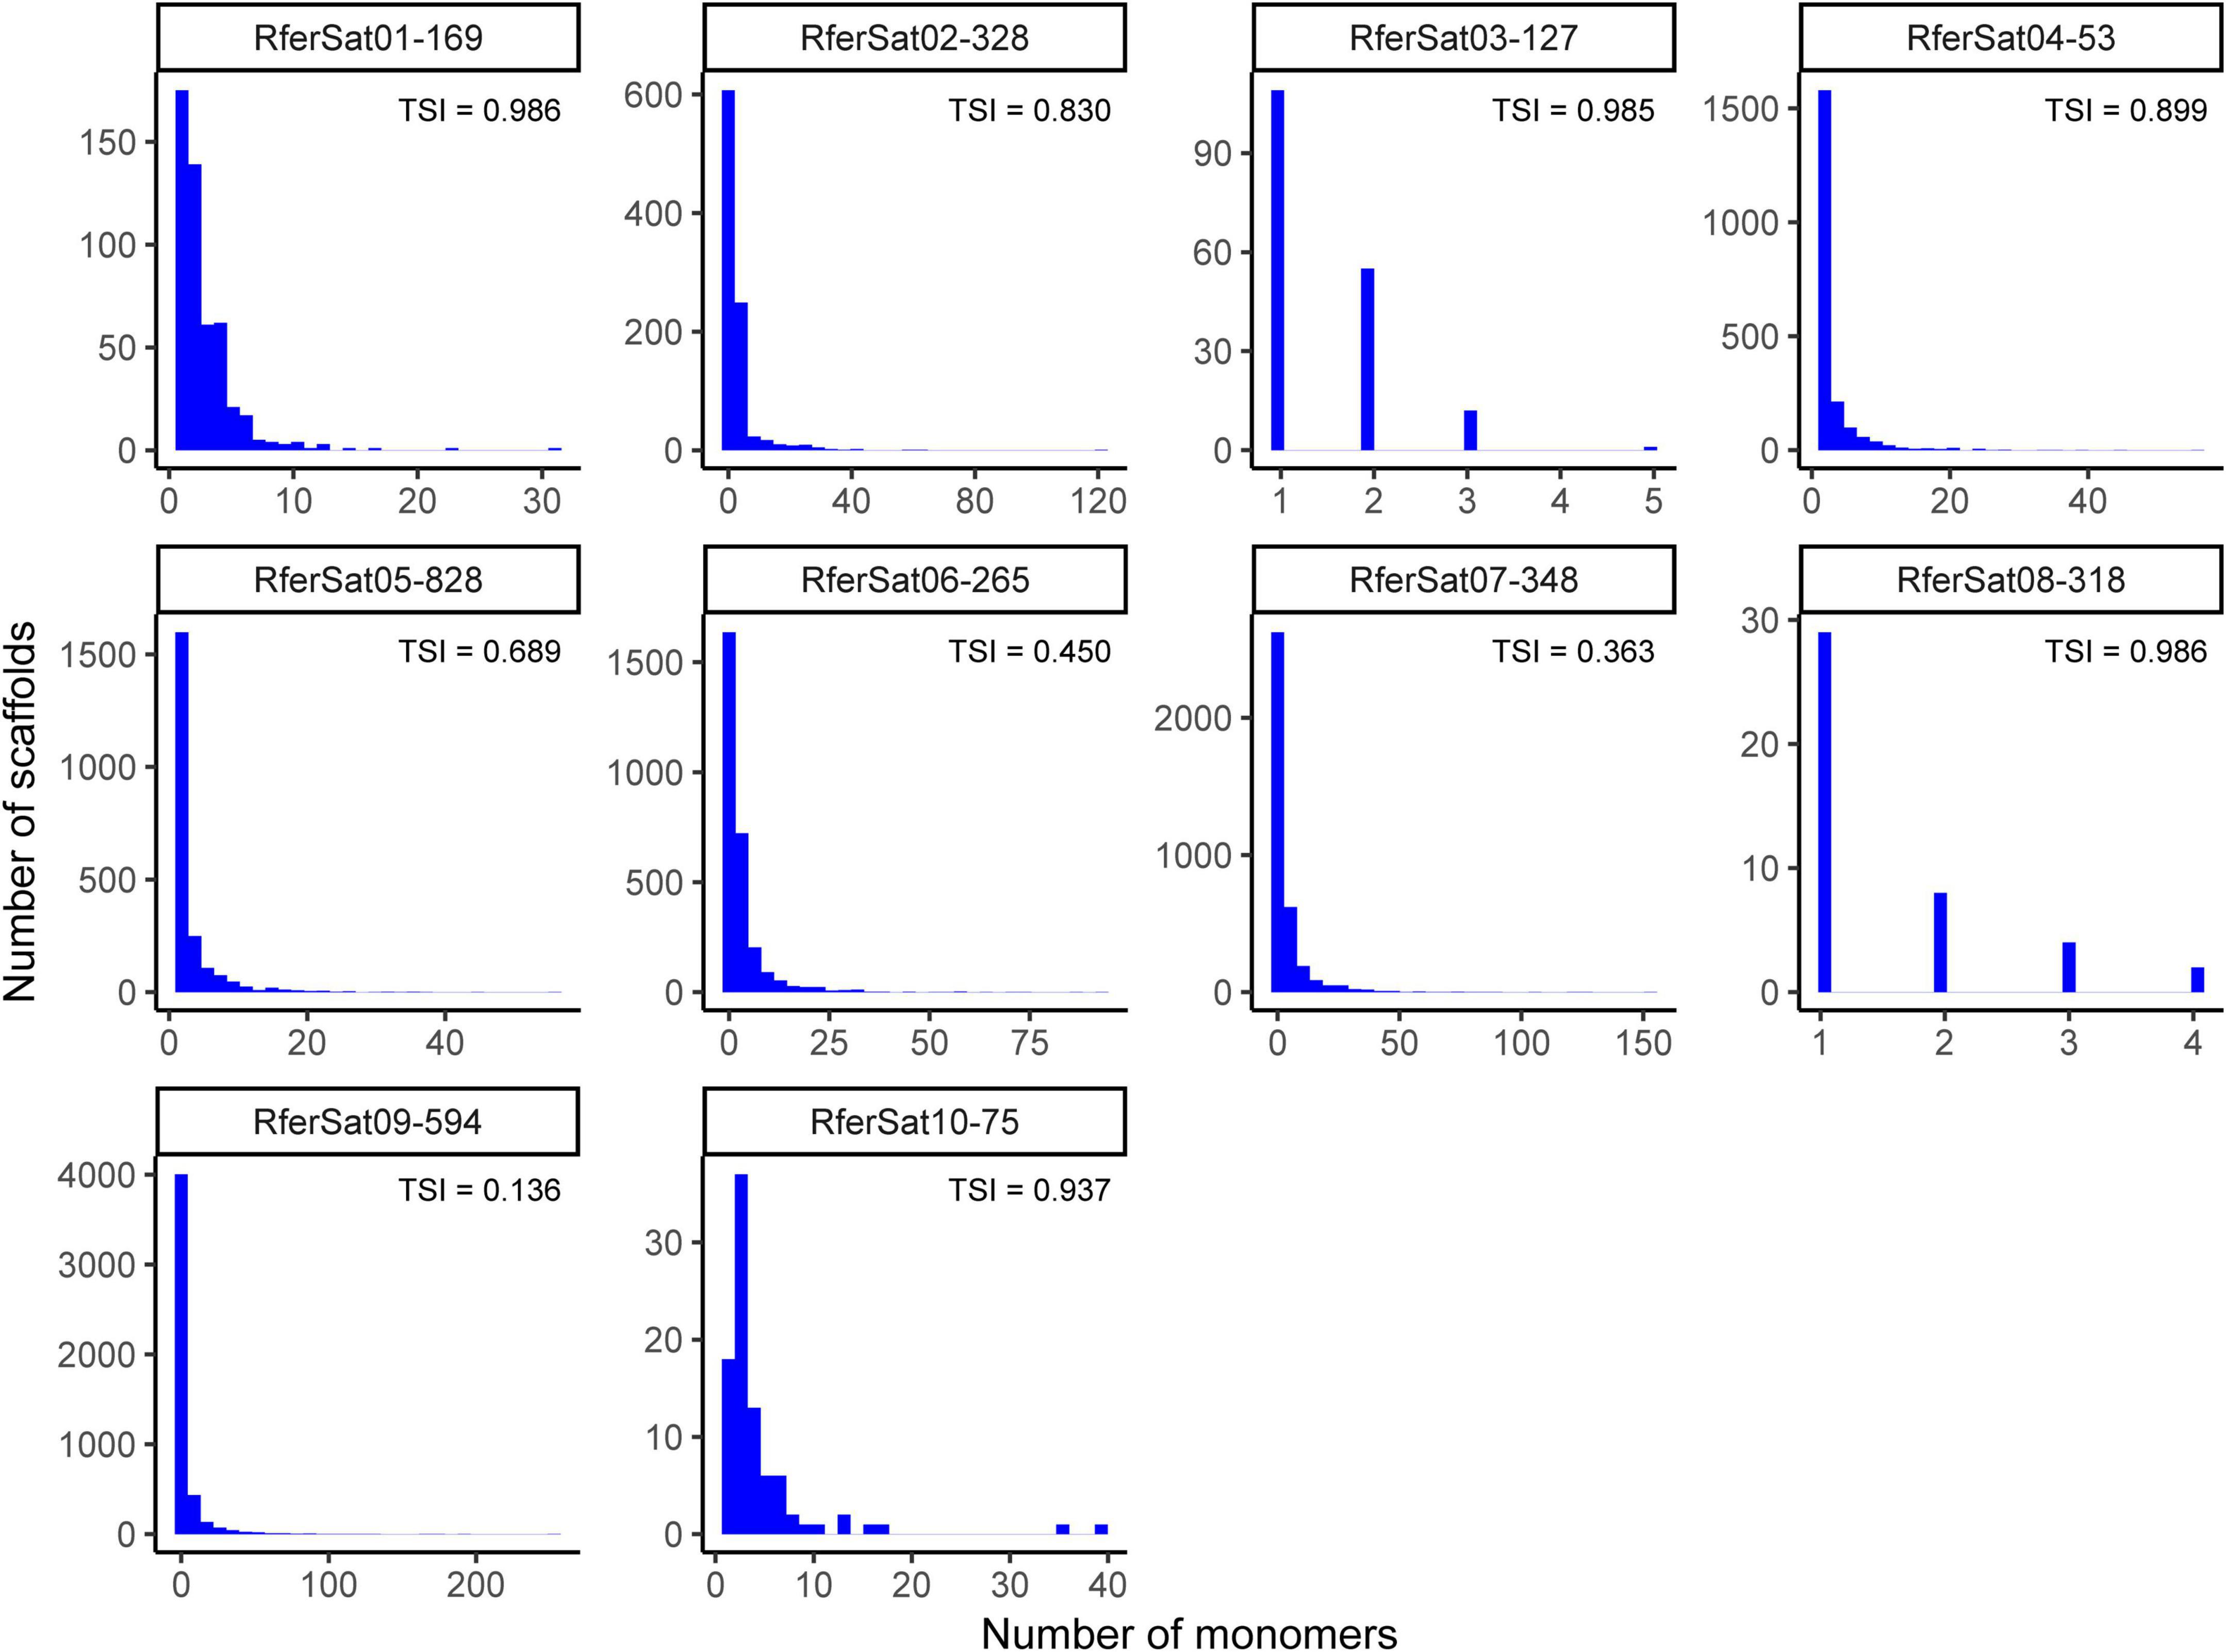
Figure 4. Monomers distribution of most abundant satDNA families in Rhynchophorus ferrugineus assembled genome. Histograms relate number of scaffolds and monomers.
SatDNA Transcription Across Rh. ferrugineus Development
Finally, we investigated the presence of satDNA transcripts in the Rh. ferrugineus transcriptome. We used data from a published RNA-Seq project (PRJNA598560) for the assembly and annotation of full-length transcriptome of this species (Yang et al., 2020). From this, we selected data of three development stages: larvae, pupae and adults (females and males) (SRX7585175-SRX7585186). Three samples were sequenced for each stage and sex. Reads from the triplicates were mapped against the consensus sequences of Rh. ferrugineus satDNA families and a set of 25,382 nucleotide sequences corresponding to CDS features annotated on the pseudo-haplotype assembly (GCA_014462685.1). During the data exploration, we found that samples grouped together by stages according to their expression profile, except two of them (Fem1: SRX7585175 and Male3: SRX7585182) (Supplementary Figure 5). These samples were removed from the following analysis. To keep the same number of sample per stage, one sample of larvae and pupae stages were also removed (Larv3: SRX7585178 and Pupa3: SRX7585185) (Supplementary Figure 5). We found that 55 satDNA families were transcribed in at least two samples. Further, neither the total transcription nor transcription per stage was correlated with the abundance of satDNA families in Rh. ferrugineus genome (Supplementary Table 4). Actually, the satDNA family RferSat13-42, which was 0.057% of the genome, showed the largest number of counts per million (mean = 798 CPM) and the satDNA family RferSat87-39 representing 0.0023%, was the fourth-largest value (mean = 143 CPM). On the contrary, the most abundant satDNA families of the genome, Rfersat01-169 and RferSat02-328, showed mean transcription values of 10 CPM and 2 CPM, respectively. Additionally, the satDNA families showed differences in their transcriptions across stages. According to their expression profiles, samples were clustered by stage (Figure 5A). To investigate further these relationships, we proceeded to identified differential expressed satDNA families between stages. Our aim here was to obtain a rough idea of satDNA families expression as we were using only duplicates. Firstly, we compared adults (females and males) vs. juveniles (larvae and pupae) in order to identify differentially expressed satDNA families. Only three families displayed a significant change on their transcriptions: RferSat01-169, RferSat03-127 and RferSat25-140, which were upregulated on adults (Figure 5D). On a close inspection, we discovered that RferSat03-127 was upregulated mostly in female adults (Figure 5B and Supplementary Figure 6). Secondly, we grouped the samples per stage and sex into four groups: larvae, pupae, male adults and female adults and compared each group vs. the rest to distinguish differential satDNA transcription by group. The larger number of differentially transcribed satDNA families were found in female adults (seven satDNA families) and pupae (seven satDNA families), while three satDNA families were found in male adults and two in larvae (Figure 5D). In fact, the families RferSat01-169 and RferSat03-127, differentially transcribed between adults and juveniles as we commented above, were among upregulated satDNA families found in female adults. Equally interesting were those satDNA families transcribed at the same level among groups as the case of family RferSat05-828 at the top of the heatmap (Figure 5B) or RferSat04-53 and RferSat23-211 at the bottom (Figure 5C). This stable expression could indicate a constitutive expression during the lifespan of the organism (Supplementary Figure 6 and Supplementary Table 4).
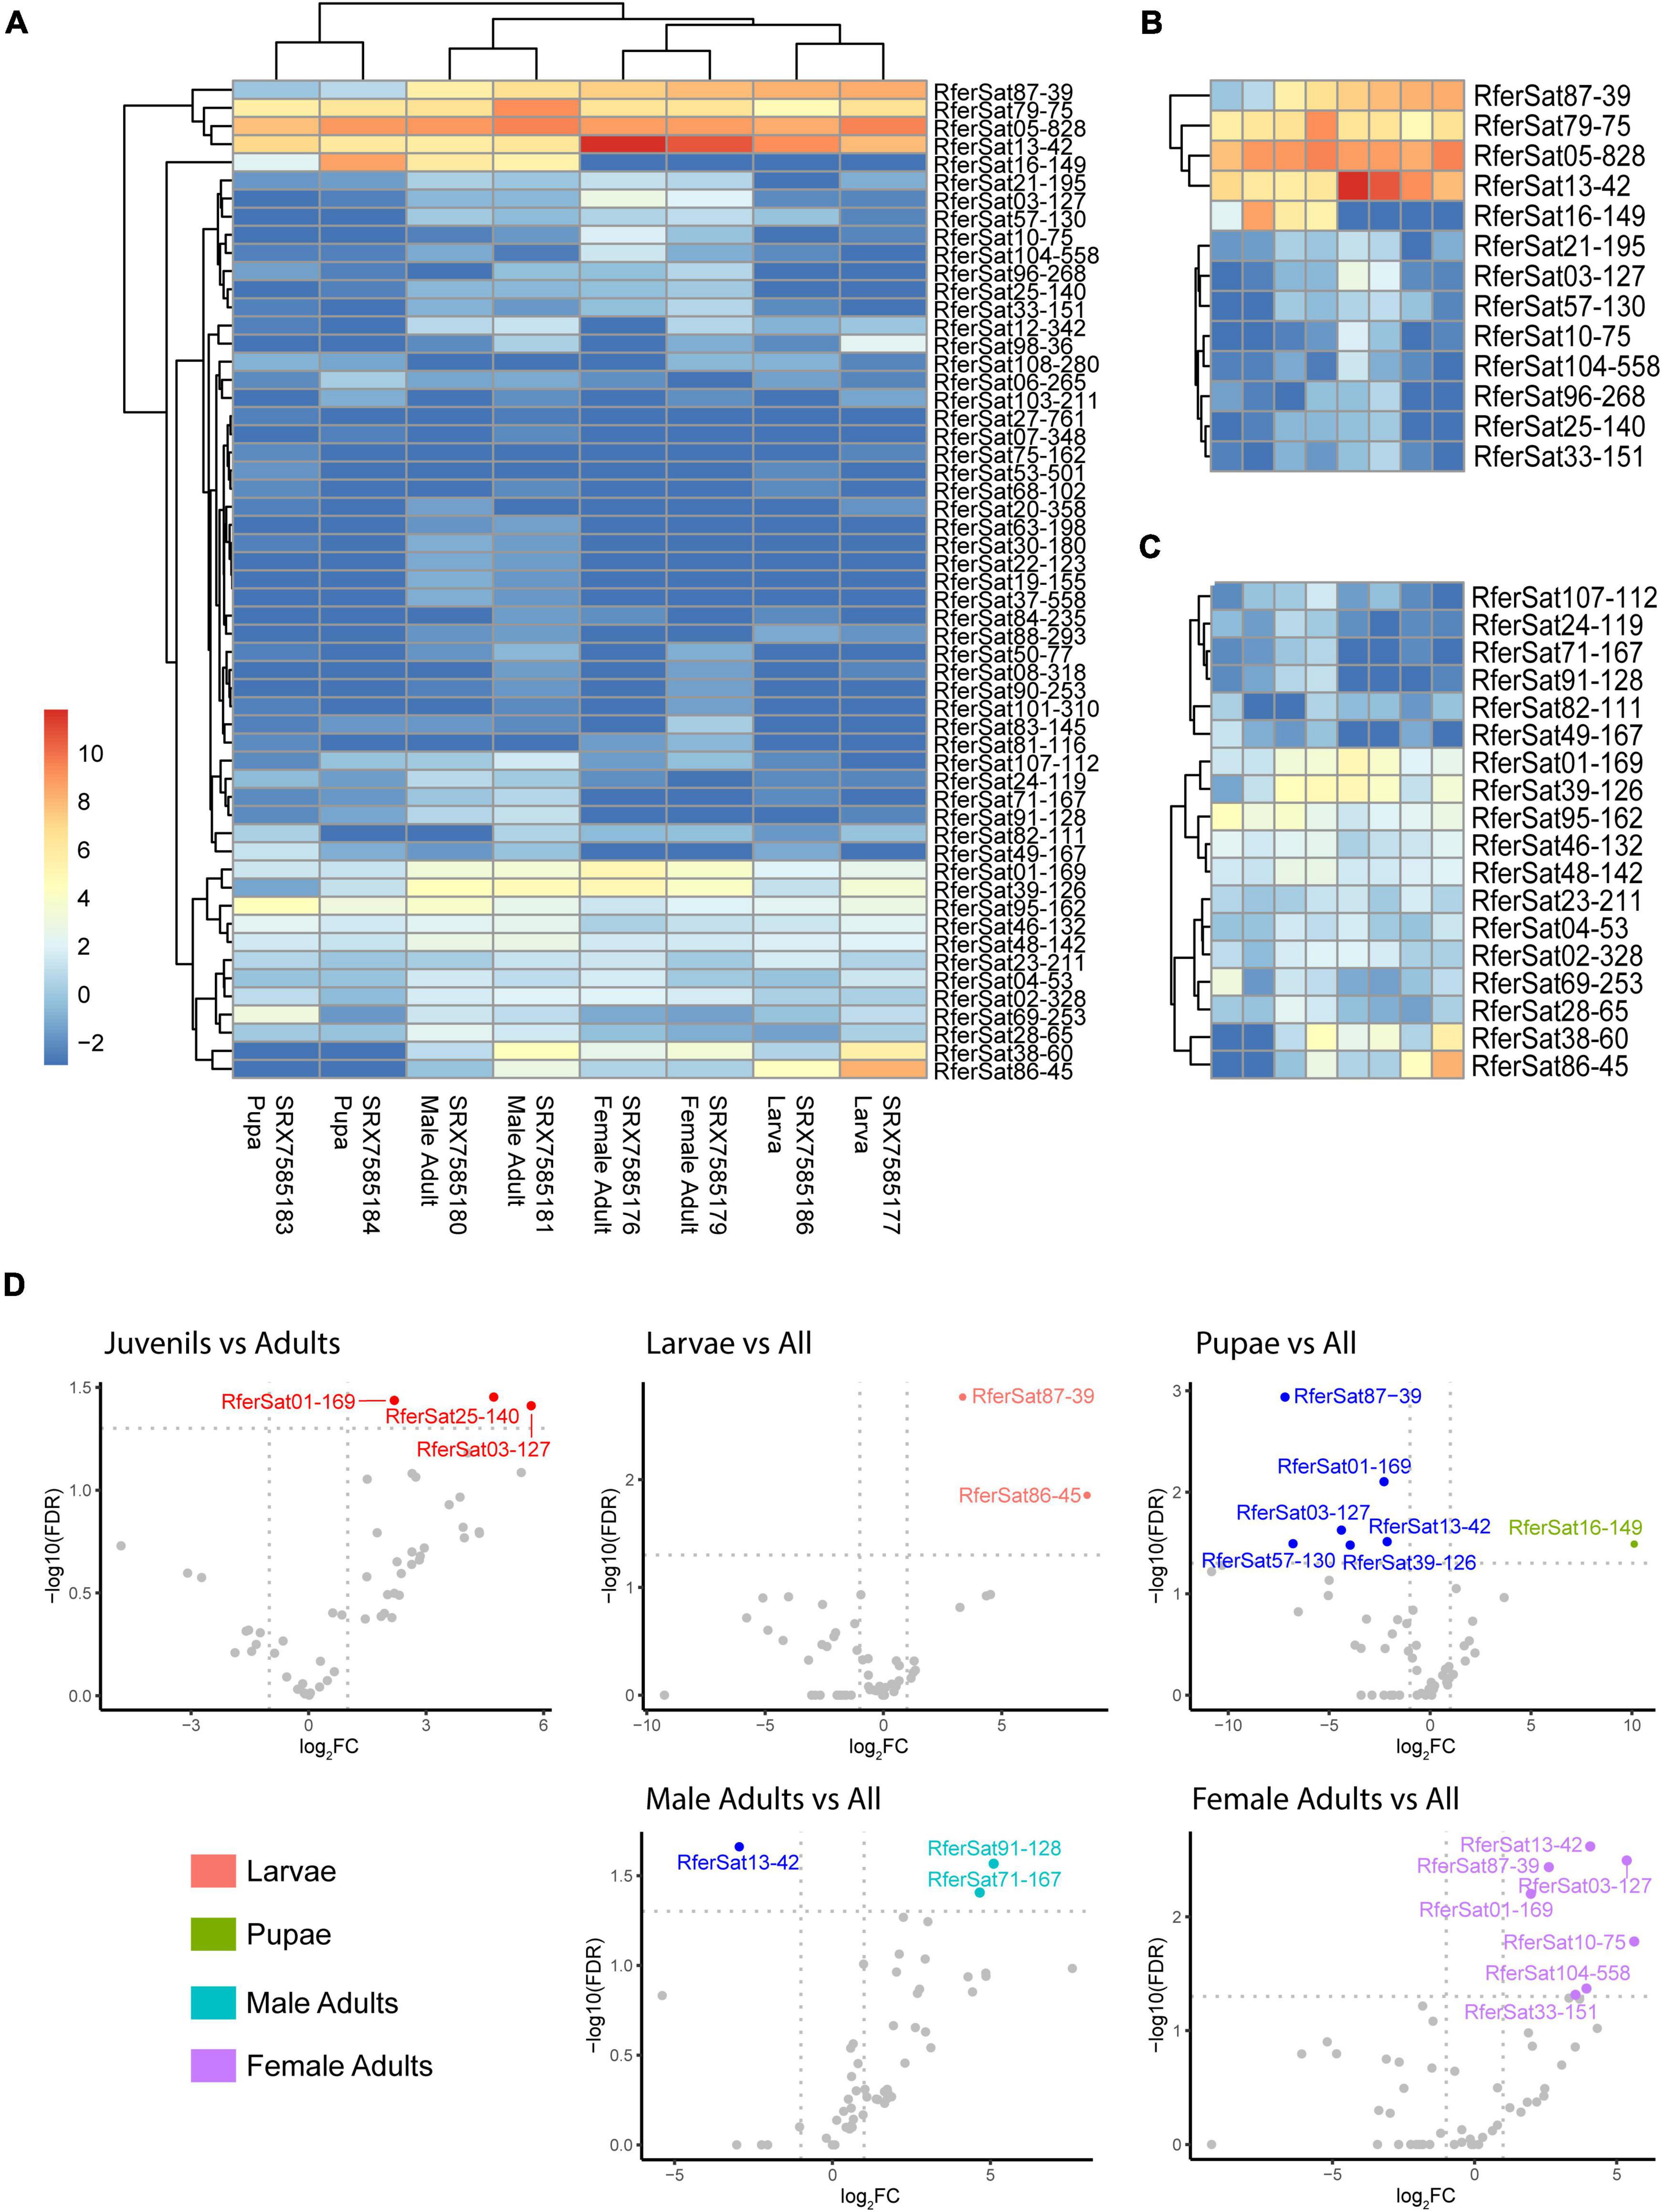
Figure 5. Transcription of satDNA families of Rhynchophorus ferrugineus across the development. (A) Heatmap with satDNA family expression. Samples were clustered by stage according to their expression profiles. (B) Top of the heatmap with the highly expressed satDNA families. (C) Bottom of the heatmap with moderated expressed satDNA families. (D) Differential expression in different stages compared to the rest. Downregulated satDNA families are indicated in blue and upregulated satDNA families in the color of each stage.
Discussion
The satDNA Sequences Are Important Component of Red Palm Weevil Genome
The relevance of Rhynchophorus ferrugineus as pest species is reflected in the numerous efforts used to study its biology, distribution and to design control strategies. However, until not long ago, the information about its genome has been scarce. Fortunately, three genome assemblies have been published recently (Hazzouri et al., 2020; Dias et al., 2021). With a size of 696.3--726.2 Mb, the RPW genome is in the average of Coleoptera group (737.3 Mb) (Animal Genome Size Database6). In the first assembly, from approximately 780 Mb assembled, authors found that 45% accounted for transposable elements, mainly mariner-like elements (Hazzouri et al., 2020). This amount of repetitive DNA is in concordance with 50% of repeated sequences estimated in our analysis with RepeatExplorer2. In fact, that amount of repetitive DNA is not uncommon in the order Coleoptera. The red flour beetle Tribolium castaneum, with a much smaller genome (151 Mb assembled) presents around 30% of repetitive sequences (Wang et al., 2008) and the genome of the coccinellid Hippodamia variegata (284 Mb) contains 47% of repetitive DNA (Mora et al., 2020). We have found that satDNA alone accounts 11–24% of RPW genome, which makes it into one of the main components of the repeatome. Furthermore, the 112 satDNA families identified turn the RPW satellitome in the satellitome with the highest number of different satDNA families found in insect. Actually, it is one of the most family-rich satellitomes published until now, only surpassed by the satellitome of the fish Megaleporinus microcephalus with 164 satDNA families (Utsunomia et al., 2019) and by the crustacean Pontastacus leptodactylus satellitome with 258 families (Boštjančić et al., 2021). In insects, the satellitomes with high numbers of satDNA families were found in grasshoppers such as Pygomorpha conica with 76 families (Ruiz-Ruano et al., 2018) or Locusta migratoria with 64 (Ruiz-Ruano et al., 2016), and hemipterans such as Triatoma infestans with 42 satDNA families (Pita et al., 2017).
In Coleoptera, there are numerous studies describing satDNA sequences by means of traditional techniques and only a few using genomic data. In the model species T. castaneum nine families of satDNA have been identified from the genome assembly (Pavlek et al., 2015) but a complete characterization of its satellitome has not been performed so far. This characterization only has been achieved in the beetle Hippodamia variegata that counts with a humbler number of satDNA families than Rh. ferrugineus (Mora et al., 2020). Nevertheless, the satellitomes of these two beetles show similar values for the satellitome main features. The mean A + T richness and monomer sizes were similar, although the RPW satellitome has no satDNA families with monomers over 1 Kb. The rates of divergence were also similar in these two species being slightly larger in RPW. However, for the first time in beetles, we have calculated an index to estimate the tandem structure of satDNA families (TSI) which may inform about their distribution in the genome. The TSI, as Camacho et al. (2022) explain on their proposal of satDNA evolution, should be high at the beginning of the family amplification process when unequal crossing-over events increase the size of satDNA family arrays, while as monomers lose their identity by accumulation of point mutations satDNA arrays start fractioning and consequently, the TSI decreases. The mean TSI of satDNA families in RPW is smaller (0.79) than those TSI found in the satellitomes of the grasshoppers Oedaleus decorus and Locusta migratoria (0.87 and 0.90 respectively). The smaller TSI could account for a more dispersed satellitome in RPW where 25% of satDNA families show TSI under 0.7, respect to 10–12% of grasshopper satDNA families (Camacho et al., 2022).
The dispersion of the RPW satDNA is observed in the physical mapping of the most abundant satDNA families. SatDNA families located by FISH display signals scattered in the euchromatin of all chromosomes, while three satDNA exhibit a band-like hybridization pattern either in the heterochromatin of all chromosomes or in the heterochromatin of certain chromosomes. The family RferSat01-169, the main satDNA of the RPW satellitome, was located in the pericentromeric heterochromatin of all chromosomes as the main satDNAs of T. castaneum and H. variegata (Ugarković et al., 1996; Mora et al., 2020). Traditionally, the satDNA location has been assumed as restricted to the heterochromatic regions, although as the study of these sequences progresses, their presence in all chromosomal regions becomes apparent. The triatomine Triatoma infestans is a good example as the main part of satDNA families, which chromosomal location has been studied, were located in the euchromatin (Pita et al., 2017).
Red Palm Weevil satDNA as a Dynamic Component of the Genome With Differences Between Individuals From Distant Populations
The satDNA sequences are fast evolving component of the genome, changing even among closely related species. Their expansion and divergence capacity configure species-specific genetic background, which could contribute to reproductive isolation and speciation (Hughes and Hawley, 2009; Ferree and Prasad, 2012). Here we compare satellitomes of two RPW individuals from Spain and UAE, bearing different COI haplotypes. We found that the satellitomes of the specimens from distant populations are mostly conserved in sequences, although the amount of satDNA in the UAE sample is almost half-abundant than Spanish one, with the family RferSat01-169 contributing the most to that variation. Insect satDNA differences between populations have been studied before in other studies. Even though most of them did not find significant differences neither in sequences nor in copy number (Lorite et al., 2002a; Kuhn et al., 2003), there are some examples of the great impact that satDNA may mean to populations. In the case of T. infestans, the Andean and Non-Andean lineages differ over 30% (450 Mb) in their genome sizes due to differences in the satDNA amount, mainly due to the most abundant satDNA family (Pita et al., 2017). In T. castaneum the TCAST2 satDNA expands in different ways between strains, and this does not suppose a reproductive barrier, although similar change in a major family as TCAST1 could produce hybrid incompatibility (Feliciello et al., 2015). In the RPW, despite evident differences in the major satDNA family, the abundance changes between individuals from different populations were not significant. Nevertheless, low-abundant satDNA families in UAE specimen display high differences in amount in relation to the Spanish specimen. For instance, the families RferSat29-115 and RferSat90-253 vary 315 and 70 fold-change between UAE and Spanish specimens, respectively. These observed changes would be coherent with the library hypothesis proposed by Fry and Salser (1977) applied to populations. Starting from the same set of satDNA sequences, certain families could suddenly expand and fix in some individuals in one population whereas other different families would expand in individuals of other population. As time goes by the satellitome could diverge more contributing to the differentiation process and ultimately, to the speciation (Mestrović et al., 1998; Ugarković and Plohl, 2002).
Changes in the amount of satDNA could be due to expansion in one population or to loss in the other population. Satellite DNA family expansion, i.e., through unequal crossing-over, raises the number of identical copies increasing the family homogeny. This could be observed in the satellite landscape, where abundance against sequence diversity of a satDNA family is depicted. The satDNA expansion would produce a leptokurtic distribution with a lower divergence peak the more recent the expansion is. On the contrary, the family contraction by the loss of copy number reduces the homogeneity of that satDNA family. It would also happen in families expanded a long time ago which monomers accumulate point mutations. The satDNA landscape in these cases would depict a platykurtic distribution, with an excess of negative kurtosis and a divergence peak at higher figures. The satDNA family RferSat01-169 produces similar satellite landscapes regard to their kurtoses and divergence peaks on both samples, although a greater expansion was appreciated in the Spanish individual. The satDNA families with higher fold-change between samples present different satellite landscapes with higher values of homogeneity and lower divergence peaks in the specimen where the expansion has taken place. What causes that certain satDNA family expands in one population is still unknown and it would require further investigations. Some authors point out to the association of satDNA to transposable elements that would increase the copy number with transposable elements dispersion (Brajković et al., 2012; Palacios-Gimenez et al., 2020; Vojvoda Zeljko et al., 2020), but in general, these changes seem to be totally contingent.
Red Palm Weevil satDNA Is Underrepresented in the Genome Assemblies
The representation of the satDNA on the genome assemblies of RPW has been another point addressed in this study. The masking of RPW satDNA sequences on these assemblies pointed out that were underrepresented 10 times in them. As it was commented in the introduction, the underrepresentation of satDNA sequences on the assemblies is inherent to their repeat nature. During assembling process, satDNA sequences tend to be collapsed underestimating the satDNA arrays size or directly being excluded of the assembly (Wang et al., 2008). This issue with satDNA sequences has been observed before. For example, the satDNA of Rhodnius prolixus makes up 5.6% of the assembled genome whereas its estimation from unassembled reads represents 8% of the genome (Montiel et al., 2021). Equally, in Tribolium castaneum, where experiments of reassociation kinetics indicated that 48% of its genome belong to repeated sequences (Brown et al., 1990), just 30% of the genome assembly was identified as repeat DNA (Wang et al., 2008). In fact, only 4.9% was assigned as satDNA, and specifically 0.3% of the assembled genome allocated to the centromeric satDNA families TCAST1 and TCAST2, which have previously been estimated at 35% of T. castaneum genome (Ugarković et al., 1996; Feliciello et al., 2011; Pavlek et al., 2015). Similarly, the family RferSat01-169, estimated at 20% of the genome, only represents 0.01–0.06% of the genome assemblies. Species with large heterochromatic blocks, as Rh. ferrugineus or T. castaneum, have a severe satDNA underestimation. The genome assembly of these species usually will expand until the heterochromatic block edges and internal repeats would remain unassembled. The amount of discarded satDNA sequences will be higher and the amount of satDNA will be underestimated. Additionally, we found a correlation between the underestimation of a satDNA family and the index of tandem structure. Therefore, high-TSI families concentrated in big arrays (i.e., RferSat01-169) showed a higher underestimation than low-TSI families scattered in small arrays with almost no difference in abundance between genome assemblies and unassembled reads. Due to the novelty of TSI definition (Martín Peciña, 2021; Camacho et al., 2022), herein it is the first time, to the best of our knowledge, that the correlation between the TSI and satDNA estimation in genome assemblies has been found. Consequently, it is also the first time that it is possible to relate the satDNA underestimation of species with large heterochromatic blocks and the TSI of their satDNA families. Currently, long-read sequencing technology will help to overcome the underrepresentation of repeat DNA and to improve the assembly of these sequences.
SatDNA Sequences Transcribed During the Development
The repetitive DNA, and by extension the satDNA, have been considered “genetic junk” with no function in the genome for long time. Currently, that vision has changed, and beside their mere structural functions, numerous evidences have been found to support that the satDNA transcription involves several other functions (Shatskikh et al., 2020). Almost half of satDNA families were transcribed in some stages of RPW development and some families were transcribed stably throughout RPW life. In insects, satDNA transcription has previously been described in flies (Lima et al., 2017; Mills et al., 2019), mosquitoes (Halbach et al., 2020), moths (Věchtová et al., 2016), ants (Lorite et al., 2002b), wasps (Renault et al., 1999), sawflies (Rouleux-Bonnin et al., 1996), crickets (Palacios-Gimenez et al., 2018) and beetles (Pezer and Ugarković, 2008, 2009; Feliciello et al., 2015; Mora et al., 2017). The studies of Pezer and Ugarković (2008, 2009) analyzing the transcription of centromeric satDNAs in two species of the genera Palorus are especially interesting. The authors found that these satellites, the main satellites on both species and located in the pericentromeric heterochromatin, were stably transcribed in larvae, pupae and adults indicating a possible role in the maintenance of heterochromatin and centromeric function. The family RferSat01-169 of RPW also showed transcription in all stages, though slightly upregulated in adults. Other satDNA families, however, were highly upregulated only on some stages, as the family RferSat16-149, which was transcribed intensely in pupae, pointing out to a function on this stage of development. In the mosquito Aedes aegypti, transcription of a satDNA locus produces two piRNAs that regulate in trans the expression of genes during early embryonic development (Halbach et al., 2020). The satDNA families, pBuM (Drosophila buzzatti) and CDSTR198 (Drosophila mojavensis) were transcribed across development and most notably in pupae and male adults (Lima et al., 2017). Otherwise, the satellite (AAGAG)n of Drosophila melanogaster, was transcribed from the pericentromeric heterochromatin in embryos and during the whole development of the fly, being important for their viability. Equally, its expression in early spermatogenesis has been proved essential, causing its depletion male sterility (Mills et al., 2019). Another D. melanogaster satDNA, the 1.688 satDNA family, contains a subfamily member densely distributed on the X chromosome (1.688X), which has an important role in marking the X chromosome during dosage compensation (Joshi and Meller, 2017). The small interfering RNAs generated from 1.688X sequences in males facilitate the X localization of the male-specific lethal complex, which raises X-linked gene expression by modification of the chromatin (Joshi and Meller, 2017; Shatskikh et al., 2020). In the hymenopteran Diprion pini, the transcription of satDNA was higher in females although the amount of satDNA is lower than in males and with the presence of female-specific transcripts (Rouleux-Bonnin et al., 1996) which could be related to sexual differentiation (Rouleux-Bonnin et al., 2004).
These evidences explained above underpin the importance of satDNA in the genomes, not only as a passive component but also as an active element with diverse roles. Besides, its expression and expansion in the genome suppose a huge evolutionary impact in the species, increasing the diversity of gene expression and varying their epigenetic landscapes. Faced with a future with changing environmental conditions, this variation caused by the satDNA may be an enormous adaptive advantage for the species.
Data Availability Statement
The datasets presented in this study can be found in online repositories. The names of the repository/repositories and accession number(s) can be found below: NCBI (accession: OL456523 to OL456633).
Author Contributions
EM, TP, and PL conceived and designed the experiment, analyzed the data, and wrote the draft. EM, PM, JR-P, TP, and PL performed the experiment. TP and PL acquired the funds. All authors have read and agreed to the published version of the manuscript.
Funding
This work was supported by the Universidad de Jaén (through the program “Plan de Apoyo a la Investigación 2019–2020”).
Conflict of Interest
The authors declare that the research was conducted in the absence of any commercial or financial relationships that could be construed as a potential conflict of interest.
Publisher’s Note
All claims expressed in this article are solely those of the authors and do not necessarily represent those of their affiliated organizations, or those of the publisher, the editors and the reviewers. Any product that may be evaluated in this article, or claim that may be made by its manufacturer, is not guaranteed or endorsed by the publisher.
Supplementary Material
The Supplementary Material for this article can be found online at: https://www.frontiersin.org/articles/10.3389/fevo.2022.826808/full#supplementary-material
Footnotes
- ^ https://gd.eppo.int/taxon/RHYCFE/distribution
- ^ https://gd.eppo.int/taxon/RHYCFE/hosts
- ^ sourceforge.net/projects/bbmap
- ^ https://repeatexplorer-elixir.cerit-sc.cz
- ^ http://www.repeatmasker.org
- ^ http://www.genomesize.com
References
Al-Ayied, H. Y., Alswailem, A. M., Shair, O., and Al Jabr, A. M. (2006). Evaluation of phylogenetic relationship between three phenotypically different forms of red date palm weevil Rhynchophorus ferrugineus Oliv. using PCR-based RAPD technique. Arch. Phytopathol. 39, 303–309. doi: 10.1080/03235400500222461
Al-Qahtani, A. H., Al-Khalifa, M. S., and Al-Saleh, A. A. (2014). Karyotype, meiosis and sperm formation in the red palm weevil Rhynchophorus ferrugineus. Cytologia 79, 235–242. doi: 10.1508/cytologia.79.235
Antony, B., Soffan, A., Jakše, J., Abdelazim, M. M., Aldosari, S. A., Aldawood, A. S., et al. (2016). Identification of the genes involved in odorant reception and detection in the palm weevil Rhynchophorus ferrugineus, an important quarantine pest, by antennal transcriptome analysis. BMC Genomics 17:69. doi: 10.1186/s12864-016-2362-6
Barranco, P., De la Peña, J., and Cabello, T. (1995). Un nuevo curculionido tropical para la fauna europea, Rhynchophorus ferrugineus (Olivier 1790) (Coleoptera, Curculionidae). Bol. Asoc. Esp. Entomol. 20, 257–258.
Bartlett, A. C., and Rananavare, H. D. (1983). Karyotype and sperm of the red palm weevil (Coleoptera: Curculionidae). Ann. Entomol. Soc. Am. 76, 1011–1013. doi: 10.1093/aesa/76.6.1011
Bock, D. G., Caseys, C., Cousens, R. D., Hahn, M. A., Heredia, S. M., Hübner, S., et al. (2015). What we still don’t know about invasion genetics. Mol. Ecol. 24, 2277–2297. doi: 10.1111/mec.13032
Bolger, A. M., Lohse, M., and Usadel, B. (2014). Trimmomatic: a flexible trimmer for Illumina sequence data. Bioinformatics 30, 2114–2120. doi: 10.1093/bioinformatics/btu170
Boštjančić, L. L., Bonassin, L., Anušić, L., Lovrenčić, L., Besendorfer, V., Maguire, I., et al. (2021). The Pontastacus leptodactylus (Astacidae) repeatome provides insight into genome evolution and reveals remarkable diversity of satellite DNA. Front. Genet. 11:1820. doi: 10.3389/fgene.2020.611745
Brajković, J., Feliciello, I., Bruvo-Mađarić, B., and Ugarković, Đ. (2012). Satellite DNA-like elements associated with genes within euchromatin of the beetle Tribolium castaneum. G3 2, 931–941. doi: 10.1534/g3.112.003467
Brown, S. J., Henry, J. K., Black, W. C. IV, and Denell, R. E. (1990). Molecular genetic manipulation of the red flour beetle: genome organization and cloning of a ribosomal protein gene. Insect Biochem. 20, 185–193. doi: 10.1016/0020-1790(90)90011-I
Camacho, J. P. M., Cabrero, J., López-León, M. D., Martín-Peciña, M., Perfectti, F., Garrido-Ramos, M. A., et al. (2022). Satellitome comparison of two oedipodine grasshoppers highlights the contingent nature of satellite DNA evolution. BMC Biol. 20:36. doi: 10.1186/s12915-021-01216-9
Diagne, C., Leroy, B., Vaissičre, A. C., Gozlan, R. E., Roiz, D., and Jarić, et al. (2021). High and rising economic costs of biological invasions worldwide. Nature 592, 571–576. doi: 10.1038/s41586-021-03405-6
Dias, G. B., Altammami, M. A., El-Shafie, H. A., Alhoshani, F. M., Al-Fageeh, M. B., Bergman, C. M., et al. (2021). Haplotype-resolved genome assembly enables gene discovery in the red palm weevil Rhynchophorus ferrugineus. Sci. Rep. 11:9987. doi: 10.1038/s41598-021-89091-w
Dierckxsens, N., Mardulyn, P., and Smits, G. (2017). NOVOPlasty: de novo assembly of organelle genomes from whole genome data. Nucleic Acids Res. 45:e18. doi: 10.1093/nar/gkw955
El-Mergawy, R. A. A. M., and Al-Ajlan, A. M. (2011). Red palm weevil, Rhynchophorus ferrugineus (Olivier): economic importance, biology, biogeography and integrated pest management. J. Agric. Sci. Technol. 1, 1–23.
El-Mergawy, R. A. A. M., Faure, N., Nasr, M. I., Avand-Faghih, A., Rochat, D., and Silvain, J. F. (2011). Mitochondrial genetic variation and invasion history of red palm weevil, Rhynchophorus ferrugineus (Coleoptera: Curculionidae), in middle-east and Mediterranean basin. Int. J. Agric. Biol. 13, 631–637.
Feliciello, I., Akrap, I., Brajković, J., Zlatar, I., and Ugarković, Đ. (2015). Satellite DNA as a driver of population divergence in the red flour beetle Tribolium castaneum. Genome Biol. Evol. 7, 228–239. doi: 10.1093/gbe/evu280
Feliciello, I., Chinali, G., and Ugarković, Đ. (2011). Structure and population dynamics of the major satellite DNA in the red flour beetle Tribolium castaneum. Genetica 139, 999–1008. doi: 10.1007/s10709-011-9601-1
Feliciello, I., Pezer, Ž., Sermek, A., Bruvo Mađarić, B., Ljubić, S., and Ugarković, Đ. (2021). “Satellite DNA-mediated gene expression regulation: physiological and evolutionary implication. Prog. Mol. Subcell. Biol. 60, 145–167. doi: 10.1007/978-3-030-74889-0_6
Ferree, P. M., and Prasad, S. (2012). How can satellite DNA divergence cause reproductive isolation? Let us count the chromosomal ways. Genet. Res. Int. 2012:430136. doi: 10.1155/2012/430136
Fiaboe, K. K. M., Peterson, A. T., Kairo, M. T. K., and Roda, A. L. (2012). Predicting the potential worldwide distribution of the red palm weevil Rhynchophorus ferrugineus (Olivier) (Coleoptera: Curculionidae) using ecological niche modeling. Fla. Entomol. 95, 659–673. doi: 10.1653/024.095.0317
Fry, K., and Salser, W. (1977). Nucleotide sequences of HS-alpha satellite DNA from kangaroo rat Dipodomys ordii and characterization of similar sequences in other rodents. Cell 12, 1069–1084. doi: 10.1016/0092-8674(77)90170-2
Gadelhak, G. G., and Enan, M. R. (2005). Genetic diversity among populations of red palm weevil, Rhynchophorus ferrugineus Olivier (Coleoptera: Curculionidae), determined by random amplified polymorphic DNA polymerase chain reaction (RAPD-PCR). Int. J. Agric. Biol. 7, 395–399.
Garnier, S., Ross, N., Rudis, R., Camargo, A. P., Sciaini, M., and Scherer, C. (2021). Rvision - Colorblind-Friendly Color Maps for R. R package version 0.6.1. 2021. Available online at: https://cran.r-project.org/package=viridisLite (accessed November 28, 2021).
Garrido-Ramos, M. A. (2017). Satellite DNA: an evolving topic. Genes 8:230. doi: 10.3390/genes8090230
Guindon, S., Dufayard, J. F., Lefort, V., Anisimova, M., Hordijk, W., and Gascuel, O. (2010). New algorithms and methods to estimate maximum-likelihood phylogenies: assessing the performance of PhyML 3.0. Syst. Biol. 59, 307–321. doi: 10.1093/sysbio/syq010
Halbach, R., Miesen, P., Joosten, J., Taşköprü, E., Rondeel, I., Pennings, B., et al. (2020). A satellite repeat-derived piRNA controls embryonic development of Aedes. Nature 580, 274–277. doi: 10.1038/s41586-020-2159-2
Hazzouri, K. M., Sudalaimuthuasari, N., Kundu, B., Nelson, D., Al-Deeb, M. A., Le Mansour, A., et al. (2020). The genome of pest Rhynchophorus ferrugineus reveals gene families important at the plant-beetle interface. Commun. Biol. 3:323. doi: 10.1038/s42003-020-1060-8
Hughes, S. E., and Hawley, R. S. (2009). Heterochromatin: a rapidly evolving species barrier. PLoS Biol. 7:e1000233. doi: 10.1371/journal.pbio.1000233
Joshi, S. S., and Meller, V. H. (2017). Satellite repeats identify X chromatin for dosage compensation in Drosophila melanogaster males. Curr. Biol. 27, 1393–1402. doi: 10.1016/j.cub.2017.03.078
Kuhn, G. C., Franco, F. F., Silva, W. A. Jr., Martinez-Rossi, N. M., and Sene, F. M. (2003). On the pBuM189 satellite DNA variability among South American populations of Drosophila buzzatii. Hereditas 139, 161–166. doi: 10.1111/j.1601-5223.2003.01797.x
Lannino, A., Sineo, L., Lo Bianco, S., Arizza, V., and Manachini, B. (2016). Chromosome studies in North-Western Sicily males of Rhynchophorus ferrugineus. Bull. Insectol. 69, 239–247.
Li, H., Handsaker, B., Wysoker, A., Fennell, T., Ruan, J., Homer, N., et al. (2009). The sequence alignment/map (SAM) format and SAMtools. Bioinformatics 25, 2078–2079. doi: 10.1093/bioinformatics/btp352
Lima, L. G., Svartman, M., and Kuhn, G. C. (2017). Dissecting the satellite DNA landscape in three cactophilic Drosophila sequenced genomes. G3 7, 2831–2843. doi: 10.1534/g3.117.042093
Lorite, P., Carrillo, J. A., Garneria, I., Petitpierre, E., and Palomeque, T. (2002a). Satellite DNA in the elm leaf beetle, Xanthogaleruca luteola (Coleoptera, Chrysomelidae): characterization, interpopulation analysis, and chromosome location. Cytogenet. Genome Res. 98, 302–307. doi: 10.1159/000071053
Lorite, P., Renault, S., Rouleux-Bonnin, F., Bigot, S., Periquet, G., and Palomeque, T. (2002b). Genomic organization and transcription of satellite DNA in the ant Aphaenogaster subterranea (Hymenoptera, Formicidae). Genome 45, 609–616. doi: 10.1139/g02-022
Louzada, S., Lopes, M., Ferreira, D., Adega, F., Escudeiro, A., Gama-Carvalho, M., et al. (2020). Decoding the role of satellite DNA in genome architecture and plasticity – an evolutionary and clinical affair. Genes 11:72. doi: 10.3390/genes11010072
Lower, S. S., McGurk, M. P., Clark, A. G., and Barbash, D. A. (2018). Satellite DNA evolution: old ideas, new approaches. Curr. Opin. Genet. Dev. 48, 70–78. doi: 10.1016/j.gde.2018.03.003
Martín Peciña, M. (2021). Genómica y Transcriptómica de los Cromosomas B del Saltamontes Eyprepocnemis plorans. Ph.D. thesis. Granada: Universidad de Granada.
Mestrović, N., Plohl, M., Mravinac, B., and Ugarković, D. (1998). Evolution of satellite DNAs from the genus Palorus – experimental evidence for the” library” hypothesis. Mol. Biol. Evol. 15, 1062–1068. doi: 10.1093/oxfordjournals.molbev.a026005
Mills, W. K., Lee, Y. C. G., Kochendoerfer, A. M., Dunleavy, E. M., and Karpen, G. H. (2019). RNA from a simple-tandem repeat is required for sperm maturation and male fertility in Drosophila melanogaster. eLife 8:e48940. doi: 10.7554/eLife.48940
Montagna, M., Chouaia, B., Mazza, G., Prosdocimi, E. M., Crotti, E., Mereghetti, V., et al. (2015). Effects of the diet on the microbiota of the red palm weevil (Coleoptera: Dryophthoridae). PLoS One 10:e0117439. doi: 10.1371/journal.pone.0117439
Montiel, E. E., Cabrero, J., Ruiz-Estévez, M., Burkem, W. D., Eickbush, T. H., Camacho, J. P. M., et al. (2014). Preferential occupancy of R2 retroelements on the B chromosomes of the grasshopper Eyprepocnemis plorans. PLoS One 9:e91820. doi: 10.1371/journal.pone.0091820
Montiel, E. E., Panzera, F., Palomeque, T., Lorite, P., and Pita, S. (2021). Satellitome analysis of Rhodnius prolixus, one of the main Chagas disease vector species. Int. J. Mol. Sci. 22:6052. doi: 10.3390/ijms22116052
Mora, P., Vela, J., Ruiz-Mena, A., Palomeque, T., and Lorite, P. (2017). Characterization and transcriptional analysis of a subtelomeric satellite DNA family in the ladybird beetle Henosepilachna argus (Coleoptera: Coccinellidae). Eur. J. Entomol. 114, 481–487. doi: 10.14411/eje.2017.061
Mora, P., Vela, J., Ruiz-Mena, A., Palomeque, T., and Lorite, P. (2019). Isolation of a pericentromeric satellite DNA family in Chnootriba argus (Henosepilachna argus) with an unusual short repeat unit (TTAAAA) for beetles. Insects 10:306. doi: 10.3390/insects10090306
Mora, P., Vela, J., Ruiz-Ruano, F. J., Ruiz-Mena, A., Montiel, E. E., Palomeque, T., et al. (2020). Satellitome analysis in the ladybird beetle Hippodamia variegata (Coleoptera, Coccinellidae). Genes 11:783. doi: 10.3390/genes11070783
Novák, P., Ávila Robledillo, L., Koblížková, A., Vrbová, I., Neumann, P., and Macas, J. (2017). TAREAN: a computational tool for identification and characterization of satellite DNA from unassembled short reads. Nucleic Acids Res. 45:e111. doi: 10.1093/nar/gkx257
Novák, P., Neumann, P., and Macas, J. (2020). Global analysis of repetitive DNA from unassembled sequence reads using RepeatExplorer2. Nat. Protoc. 15, 3745–3776. doi: 10.1038/s41596-020-0400-y
Palacios-Gimenez, O. M., Bardella, V. B., Lemos, B., and Cabral-de-Mello, D. C. (2018). Satellite DNAs are conserved and differentially transcribed among Gryllus cricket species. DNA Res. 25, 137–147. doi: 10.1093/dnares/dsx044
Palacios-Gimenez, O. M., Koelman, J., Palmada-Flores, M., Bradford, T. M., Jones, K. K., Cooper, S. J., et al. (2020). Comparative analysis of morabine grasshopper genomes reveals highly abundant transposable elements and rapidly proliferating satellite DNA repeats. BMC Biol. 18:199. doi: 10.1186/s12915-020-00925-x
Palomeque, T., and Lorite, P. (2008). Satellite DNA in insects: a review. Heredity 100, 564–573. doi: 10.1038/hdy.2008.24
Palomeque, T., Muñoz-López, M., Carrillo, J. A., and Lorite, P. (2005). Characterization and evolutionary dynamics of a complex family of satellite DNA in the leaf beetle Chrysolina carnifex (Coleoptera, Chrysomelidae). Chromosome Res. 13, 795–807. doi: 10.1007/s10577-005-1013-6
Pavlek, M., Gelfand, Y., Plohl, M., and Meštrović, N. (2015). Genome-wide analysis of tandem repeats in Tribolium castaneum genome reveals abundant and highly dynamic tandem repeat families with satellite DNA features in euchromatic chromosomal arms. DNA Res. 22, 387–401. doi: 10.1093/dnares/dsv021
Perea-Resa, C., and Blower, M. D. (2017). Satellite transcripts locally promote centromere formation. Dev. Cell 42, 201–202. doi: 10.1016/j.devcel.2017.07.017
Pezer, Ž., and Ugarković, Đ. (2008). RNA Pol II promotes transcription of centromeric satellite DNA in beetles. PLoS One 3:e1594. doi: 10.1371/journal.pone.0001594
Pezer, Ž., and Ugarković, Đ. (2009). Transcription of pericentromeric heterochromatin in beetles–satellite DNAs as active regulatory elements. Cytogenet. Genome Res. 124, 268–276. doi: 10.1159/000218131
Pezer, Ž., and Ugarković, Đ. (2012). Satellite DNA-associated siRNAs as mediators of heat shock response in insects. RNA Biol. 9, 587–595. doi: 10.4161/rna.20019
Pita, S., Panzera, F., Mora, P., Vela, J., Cuadrado, Á., Sánchez, A., et al. (2017). Comparative repeatome analysis on Triatoma infestans Andean and Non-Andean lineages, main vector of Chagas disease. PLoS One 12:e0181635. doi: 10.1371/journal.pone.0181635
R Core Team (2019). A Language and Environment for Statistical Computing. Vienna: R Foundation for Statistical Computing.
Renault, S., Rouleux-Bonnin, F., Periquet, G., and Bigot, Y. (1999). Satellite DNA transcription in Diadromus pulchellus (Hymenoptera). Insect Biochem. Mol. 29, 103–111. doi: 10.1016/S0965-1748(98)00113-1
Robinson, M. D., McCarthy, D. J., and Smyth, G. K. (2010). edgeR: a Bioconductor package for differential expression analysis of digital gene expression data. Bioinformatics 26, 139–140. doi: 10.1093/bioinformatics/btp616
Robinson, M. D., and Oshlack, A. (2010). A scaling normalization method for differential expression analysis of RNA-seq data. Genome Biol. 11:R25. doi: 10.1186/gb-2010-11-3-r25
Rouleux-Bonnin, F., Bigot, S., and Bigot, Y. (2004). Structural and transcriptional features of Bombus terrestris satellite DNA and their potential involvement in the differentiation process. Genome 47, 877–888. doi: 10.1139/g04-053
Rouleux-Bonnin, F., Renault, S., Bigot, Y., and Periquet, G. (1996). Transcription of four satellite DNA subfamilies in Diprion pini (Hymenoptera, Symphyta, Diprionidae). Eur. J. Biochem. 238, 752–759. doi: 10.1111/j.1432-1033.1996.0752w.x
Rugman-Jones, P. F., Kharrat, S., Hoddle, M. S., and Stouthamer, R. (2017). The invasion of Tunisia by Rhynchophorus ferrugineus (Coleoptera: Curculionidae): crossing an ocean or crossing a sea? Fla. Entomol. 100, 262–265. doi: 10.1653/024.100.0220
Ruiz-Ruano, F. J., Castillo-Martínez, J., Cabrero, J., Gómez, R., Camacho, J. P. M., and López-León, M. D. (2018). High-throughput analysis of satellite DNA in the grasshopper Pyrgomorpha conica reveals abundance of homologous and heterologous higher-order repeats. Chromosoma 127, 323–340. doi: 10.1007/s00412-018-0666-9
Ruiz-Ruano, F. J., López-León, M. D., Cabrero, J., and Camacho, J. P. M. (2016). High-throughput analysis of the satellitome illuminates satellite DNA evolution. Sci. Rep. 6:28333. doi: 10.1038/srep28333
Sermek, A., Feliciello, I., and Ugarković, Đ. (2021). Distinct regulation of the expression of satellite DNAs in the beetle Tribolium castaneum. Int. J. Mol. Sci. 22:296. doi: 10.3390/ijms22010296
Shatskikh, A. S., Kotov, A. A., Adashev, V. E., Bazylev, S. S., and Olenina, L. V. (2020). Functional significance of satellite DNAs: insights from Drosophila. Front. Cell Dev. Biol. 8:312. doi: 10.3389/fcell.2020.00312
Tagliavia, M., Messina, E., Manachini, B., Cappello, S., and Quatrini, P. (2014). The gut microbiota of larvae of Rhynchophorus ferrugineus Oliver (Coleoptera: Curculionidae). BMC Microbiol. 14:136. doi: 10.1186/1471-2180-14-136
Ugarković, Đ, and Plohl, M. (2002). Variation in satellite DNA profiles – causes and effects. EMBO J. 21, 5955–5959. doi: 10.1093/emboj/cdf612
Ugarković, Đ, Podnar, M., and Plohl, M. (1996). Satellite DNA of the red flour beetle Tribolium castaneum – comparative study of satellites from the genus Tribolium. Mol. Biol. Evol. 13, 1059–1066. doi: 10.1093/oxfordjournals.molbev.a025668
Utsunomia, R., de Andrade Silva, D. M. Z., Ruiz-Ruano, F. J., Goes, C. A. G., Melo, S., Ramos, L. P., et al. (2019). Satellitome landscape analysis of Megaleporinus macrocephalus (Teleostei, Anostomidae) reveals intense accumulation of satellite sequences on the heteromorphic sex chromosome. Sci. Rep. 9:5856. doi: 10.1038/s41598-019-42383-8
Věchtová, P., Dalíková, M., Sıkorová, M., Žurovcová, M., Füssy, Z., and Zrzavá, M. (2016). AT-1, a transcribed satellite sequence from the codling moth, Cydia pomonella. Genetica 144, 385–395. doi: 10.1007/s10709-016-9907-0
Vojvoda Zeljko, T., Pavlek, M., Meštrović, N., and Plohl, M. (2020). Satellite DNA-like repeats are dispersed throughout the genome of the Pacific oyster Crassostrea gigas carried by Helentron non-autonomous mobile elements. Sci. Rep. 10:15107. doi: 10.1038/s41598-020-71886-y
Wang, G., Hou, Y., Zhang, X., Zhang, J., Li, J., and Chen, Z. (2017). Strong population genetic structure of an invasive species, Rhynchophorus ferrugineus (Olivier), in southern China. Ecol. Evol. 7, 10770–10781. doi: 10.1002/ece3.3599
Wang, L., Zhang, X. W., Pan, L. L., Liu, W. F., Wang, D. P., Zhang, G. Y., et al. (2013). A large-scale gene discovery for the red palm weevil Rhynchophorus ferrugineus (Coleoptera: Curculionidae). Insect Sci. 20, 689–702. doi: 10.1111/j.1744-7917.2012.01561.x
Wang, S., Lorenzen, M. D., Beeman, R. W., and Brown, S. J. (2008). Analysis of repetitive DNA distribution patterns in the Tribolium castaneum genome. Genome Biol. 9:R61. doi: 10.1186/gb-2008-9-3-r61
Warnes, G. R., Bolker, B., Bonebakker, L., Gentleman, R., Huber, W., Liaw, A., et al. (2020). gplots: Various R Programming Tools for Plotting Data. R Package Version 3.1.1. Available online at: https://CRAN.R-project.org/package=gplots (accessed November 28, 2021)
Keywords: Rhynchophorus ferrugineus, beetle, repetitive DNA, satellite DNA, satellitome, evolution, fluorescence in situ hybridization
Citation: Montiel EE, Mora P, Rico-Porras JM, Palomeque T and Lorite P (2022) Satellitome of the Red Palm Weevil, Rhynchophorus ferrugineus (Coleoptera: Curculionidae), the Most Diverse Among Insects. Front. Ecol. Evol. 10:826808. doi: 10.3389/fevo.2022.826808
Received: 01 December 2021; Accepted: 15 February 2022;
Published: 04 May 2022.
Edited by:
Valentina G. Kuznetsova, Zoological Institute of Russian Academy of Science, RussiaReviewed by:
Zeljka Pezer, Rudjer Boskovic Institute, CroatiaRita Rebollo, Institut National de la Recherche Agronomique (INRA), France
Nazar Shapoval, Zoological Institute (RAS), Russia
Copyright © 2022 Montiel, Mora, Rico-Porras, Palomeque and Lorite. This is an open-access article distributed under the terms of the Creative Commons Attribution License (CC BY). The use, distribution or reproduction in other forums is permitted, provided the original author(s) and the copyright owner(s) are credited and that the original publication in this journal is cited, in accordance with accepted academic practice. No use, distribution or reproduction is permitted which does not comply with these terms.
*Correspondence: Pedro Lorite, plorite@ujaen.es