Ecological Constraints on the Evolution of Consumer Functional Responses
 Priyanga Amarasekare
- Department of Ecology and Evolutionary Biology, University of California, Los Angeles, Los Angeles, CA, United States
Intrinsically generated oscillations are a defining feature of consumer-resource interactions. They can have important consequences for the evolution of consumer functional responses. Functional response traits that maximize resource fitness (low attack rate and long handling time) and consumer fitness (high attack rate and short handling time) generate high-amplitude oscillations that can predispose species to extinction during periods of low abundances. This suggests that the ecological consequences of consumer-resource oscillations may impede evolutionary outcomes that maximize fitness. Data suggest this to be a strong possibility. Time series analyses reveal consumer-resource cycles to be infrequent in real communities, and functional response studies show a preponderance of low attack rates and/or short handling times that preclude oscillations but maximize neither species' fitness. Here I present a mathematical model to address this tension between ecological dynamics and the evolution of functional response traits. I show that the empirically observed attack rate-handling time distributions emerge naturally from the interplay between individual-level selection and the population-level constraint of oscillation-induced extinction. Extinction at low abundances curtails stabilizing selection toward trait values that maximize fitness but induce large-amplitude oscillations. As a result, persistent interactions are those in which the mean attack rate is low and/or the mean handling time is short. These findings emphasize the importance of incorporating oscillation-induced extinction into models that link food web topology to community persistence.
Introduction
An intrinsic tendency to oscillate in abundance is the hallmark of consumer resource interactions (Gurney and Nisbet, 1998; Kot, 2001; Murdoch et al., 2003). These oscillations arise from the time delay between resource uptake by a consumer (functional response) and the subsequent increase in consumer abundances via the conversion of energy consumed into reproduction (numerical response; Gurney and Nisbet, 1998). Many organisms tend to exhibit saturating (Type II) functional responses (Murdoch et al., 2003; Jeschke et al., 2004). Saturation results from the time spent handling prey, a necessary constraint on the consumption rate of most heterotrophs. The handling time causes the per capita consumption rate to increase with resource density at a decelerating rate, and saturate to a species-specific maximum uptake rate (Holling, 1959). This in turn causes resource and consumer per capita growth rates to increase with increasing abundance. Such positive feedback effects can lead to divergent oscillations and eventual collapse of consumer-resource interactions (Johnson and Amarasekare, 2015). Persistent consumer-resource interactions are, therefore, those in which negative density-dependent processes (e.g., self-limitation in resource or consumer) counteract the positive density-dependence induced by saturating functional responses (Gurney and Nisbet, 1998; Murdoch et al., 2003).
Oscillatory interactions are considered unstable because high-amplitude fluctuations can increase the risk of extinction during periods of low abundances. This is, in fact, the basis for the idea that strong interactions destabilize communities (McCann et al., 1998; McCann, 2000, 2011). Oscillations also have important consequences for functional response evolution. There is a conflict of interest between species such that the resource species' fitness is maximized by low attack rates and long handling times, while the the consumer species' fitness is maximized by high attack rates and short handling times. Since it is the product of the attack rate and handling time that induces destabilizing positive feedback, either combination can generate large-amplitude oscillations that predispose populations to extinction at low abundances (Murdoch et al., 2002; Johnson and Amarasekare, 2015). This makes for an interesting interplay between individual-level selection on attack rates and handling times, and the ecological constraint on maximizing fitness imposed by oscillatory consumer-resource dynamics.
Data from arthropod communities, the largest consumer-resource group on the planet, show an intriguing pattern. An analysis of 57 consumer-resource pairs found that the majority of species exhibited relatively low attack rates and/or short handling times, with only 23% exhibiting the potential for oscillations (Johnson and Amarasekare, 2015). An independent study (Murdoch et al., 2002), based on 108 time series data for natural populations comprising 40 species, showed that only about 30% of the interactions studied exhibited consumer-resource cycles. The interplay between selection and constraints provides a hypothesis to explain this pattern. The preponderance of low attack rates and short handling times in real species is the result of oscillation-induced extinctions preventing the evolution of high attack rates and/or long handling times that maximize resource and/or consumer fitness. Here I present a mathematical model for testing this hypothesis that combines quantitative genetics of trait evolution with oscillatory consumer-resource dynamics.
Past theoretical work has shown us that consumer-resource oscillations can increase extinction risk during periods of low abundances (e.g., McCann et al., 1998; McCann, 2000, 2011), and that such extinctions can prevent the coexistence of evolving competitors and predators (e.g., Matsuda and Abrams, 1994a,b). Past work has also demonstrated numerous instances of eco-evolutionary feedbacks with ecological dynamics stabilizing or destabilizing evolutionary dynamics (e.g., Abrams and Matsuda, 1997; Gavrilets, 1997; Abrams, 2000; Nuismer et al., 2005; Tien and Ellner, 2012; Cortez, 2018; Patel et al., 2018). However, few, if any, studies have investigated the role of oscillation-induced extinction in the evolution of consumer functional responses.
Hypotheses and Predictions
My goal is to test the hypothesis that oscillation-induced extinction constrains functional response evolution. This involves a three-step process. The first is to elucidate the mechanistic basis of consumer-resource oscillations, identifying the precise roles of functional response traits (attack rate and handling time) in generating oscillations. The second is to determine whether attack rate-handling time combinations that can maximize resource and consumer fitness generate oscillations large enough to cause extinction. Assuming these conditions are satisfied, the third step is to generate testable predictions about functional response evolution via individual-level selection on attack rates and handling times, subject to the constraint of oscillation-induced extinction. The sections below describe each of these three steps.
Mechanistic Basis of Consumer-Resource Oscillations
It is well-known that negative density-dependent processes such as self-limitation can dampen consumer-resource oscillations (Rosenzweig and MacArthur, 1963; Murdoch et al., 2003). What is less well-known is that oscillations arise from the positive density-dependence induced by the consumer's handling time. To see this, consider the following interaction between a resource species experiencing self limitation and a specialist consumer exhibiting a saturating functional response:
where the state variables R and C depict, respectively the abundance of the resource and the consumer. The parameter r depicts the the resource species' intrinsic growth rate, and q is the per capita competition coefficient (inverse of carrying capacity). We use the competition coefficient rather than the carrying capacity, because it can be more easily quantified via experiments and hence is more amenable to model parameterization. The parameters a and d depict the consumer's per capita attack and mortality rates, and f and h, its conversion efficiency and handling time.
The resource species' per capita growth rate is given by:
When resource self-limitation is weak to non-existent (i.e., q ≈ 0), the resource per capita growth rate is an increasing function of its own density (Figures 1A,I). Importantly, it is the handling time that generates this positive density-dependence (i.e., when h → 0, the resource per capita growth becomes independent of its density). In the absence of resource or consumer self-limitation, the positive feedback induced by the handling time leads to divergent oscillations followed by collapse of the entire interaction (Figures 1A,E,I,M). Negative density-dependence is induced by self-limitation in the resource species. It is only when positive density dependence is weak relative to negative density-dependence (Rosenzweig, 1971) that we observe stable point equilibria or persistent (limit cycle) oscillations (Figure 1 and Appendix A).
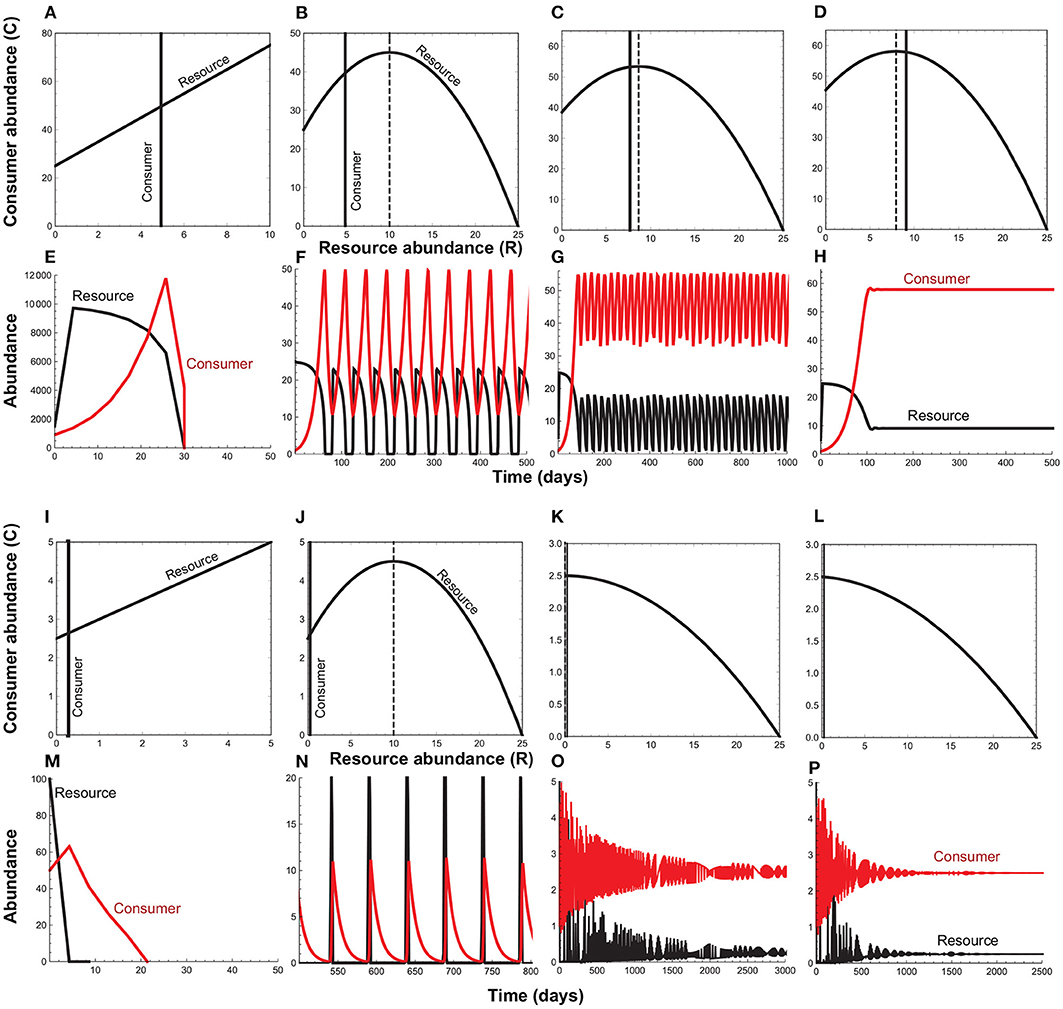
Figure 1. Phase diagrams and time series plots for the consumer-resource model (Equation 1) when the strength of positive feedback (ah) changes relative to the strength of negative feedback (q). In the phase plots, the parabola depicts the resource isocline (), the solid vertical line, the consumer isocline (), and the dashed vertical line, the critical resource density at which the consumer-resource interaction transitions from a stable point equilibrium to limit cycle oscillations (). (A–H) depict the case (low attack rates and long handling times) that maximizes the resource species' fitness, with the attack rate decreasing from left to right while the handling time remains constant. (I–P) depict the case (high attack rates and short handling times) that maximizes the consumer species' fitness, with the handling time decreasing from left to right while the attack rate remains constant. In both cases, when resource self-limitation is weak to non-existent (q ≈ 0), divergent oscillations lead to the collapse of the consumer-resource interaction (A,E,I,M). Stronger self-limitation can prevent collapse, but as long as attack rates remain large and handling times long, oscillations cause resource species' abundances to fall to levels that predispose them to extinction (B,F,J,N). It is only when attack rates and handling times are low enough to cause the equilibrium resource abundance () to approach the critical resource density (Rc) that the minimum resource density sufficiently exceeds zero to prevent extinction at low abundances (A,G,K,O). When attack rates and handling times fall to level that cause R⋆ to exceed Rc, oscillations dampen to a stable point equilibrium (D,H,L,P). Parameter values are as follows. (A,E): q = 0.0001, a = 0.2, h = 1.0; (B,F): q = 0.04, a = 0.2, h = 1.0; (C,G): q = 0.04, a = 0.13, h = 1.0; (D,H): q = 0.04, a = 0.11, h = 1.0; (I,M): q = 0.0001, a = 2.0, h = 0.1; (J,N): q = 0.04, a = 2.0, h = 0.1; (K,O): q = 0.04, a = 2.0, h = 0.02; (L,P): q = 0.04, a = 2.0, h = 0.018. Common parameters are: r = 5.0, d = 0.1, e = 0.2.
The stability boundary for the coexistence equilibrium (Appendix A) is given by:
The resource species' persistence in the presence of the consumer requires that f > hd, i.e., the consumer's conversion efficiency should exceed the fraction of its lifetime spent handling resources (Appendix A). This means that the right hand side of Equation (3) is positive, and unlikely to exceed 1 by a large amount unless the consumer spends a large fraction (>25%) of its lifetime handling prey. The important consequence is that the stability of the coexistence equilibrium is driven mainly by the ratio , which scales the negative and positive feedback effects on species' per capita growth rates). In fact, the critical resource density at which the consumer-resource interaction undergoes a transition from a stable equilibrium to limit cycle oscillations is determined entirely by the relative magnitudes of ah and q (Appendix A). Of note, although it is the product ah that determines strength of positive feedback, it is the handling time that generates such feedback. The attack rate only mediates the strength of positive feedback.
Consumer-Resource Oscillations as a Constraint on Maximizing Fitness
The next step is to determine whether the attack rate-handling time combinations that can maximize resource and consumer fitness generate oscillations large enough to cause extinction at low abundances. I follow previous studies (e.g., Lande, 1982; Abrams et al., 1993) in using the per capita growth rate as the measure of absolute fitness. The resource species' per capita growth rate is given by Equation (2) while the consumer species' per capita growth rate is given by:
As can be seen from Equations (2) and (4), the resource species' fitness is maximized when the attack rate is minimized and the handling time is maximized, while the consumer species' fitness is maximized when the attack rate is maximized and the handling time is minimized. Recall that the relative magnitudes of ah and q determine both the stability of the coexistence equilibrium and the transition from a stable equilibrium to limit cycle oscillations (Appendix A). The product ah is the per capita number of attacks by a consumer during the time it takes to handle a resource item, and q is the strength of resource self-limitation. Unless the attack rate or handling time becomes infinitesimally small (possible in models but not in real species), both scenarios can cause ah to be sufficiently large relative to q to induce consumer-resource oscillations.
Numerical analyses of Equation (1) show that high attack rates and long handling times generate oscillations sufficiently divergent as to cause collapse of the entire interaction (Figures 1, 2A). Even when oscillations are not large enough to cause such collapse, extinction during periods of low abundances restricts persistence to interactions characterized by low attack rates and/or short handling times (Figures 1, 2B). The resulting distribution closely mirrors the empirically observed pattern, with most species exhibiting relatively low attack rates and/or short handling times (Figure 2C). These findings bring up the intriguing possibility that the attack rate-handling time combinations observed in real species may be the result of functional response evolution subject to the ecological constraint of oscillation-driven extinction.
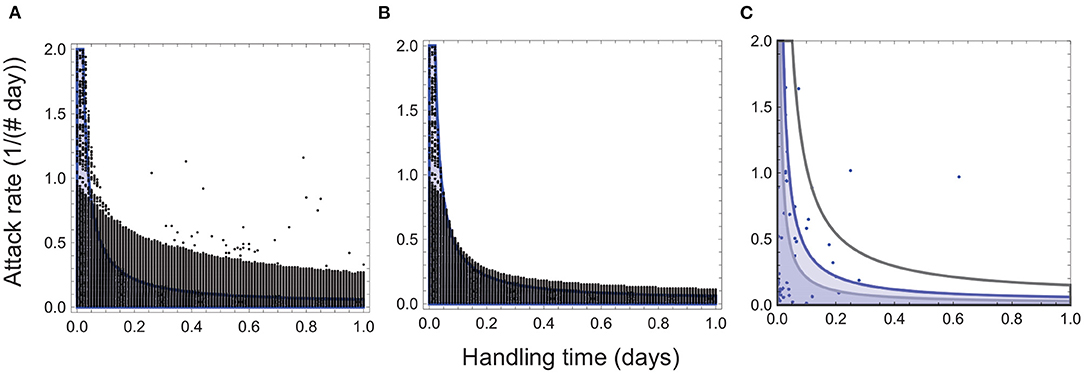
Figure 2. Attack rate-handling time combinations for persistent consumer-resource interactions. The black circles depict the combinations remaining after collapse of interactions with high attack rates and long handling times (A), and those remaining after collapse and extinction at low abundances (B). In both panels, the blue curve depicts the stability boundary for the ecological model (Appendix A), and the blue shaded region, the attack rate-handling time combinations that yield a stable point equilibrium. The black circles above the blue region represent attack rate-handling time combinations that yield persistent oscillations. No interactions persist in the regions of the parameter space (e.g., high attack rates and long handling times) that leads to high-amplitude oscillations that predispose consumer and resource populations to extinction at low abundances. Parameter values for (A,B) are: r = 5.0, e = 0.5, d = 0.1, q = 0.04. In (C), the blue circles denote empirically-observed attack rate-handling time combinations, and the black, blue and gray curves depict the stability boundaries for q = 0.1, 0.04 and and q = 0.02 with the blue region corresponding to the stability regions depicted in (A,B).
Functional Response Evolution via Selection and Constraints
The last step is to generate testable predictions about functional response evolution. As Equation (4) shows, the consumer's fitness is maximized when the attack rate is maximized and the handling time is minimized. However, the handling time imposes a limit on maximizing fitness because predators have to capture, handle and ingest their prey, and parasitoids have to spend time ovipositing in or on their hosts. Thus, there is a minimum beyond which the handling time cannot be reduced, particularly when resource species exhibit defense mechanisms such as shells, spines, trichomes, and toxins, and the consumers themselves are limited by jaw size, gut capacity, ovipositor length and egg limitation (Saloniemi, 1993; Abrams and Matsuda, 1997; Sasaki and Godfray, 1999). Similarly, the attack rate, which involves searching and finding resources, depends on search velocity and detection distance (i.e., each individual has to search a space of some radius within which it can detect its prey), which themselves are subject to energetic and other constraints that set an upper limit on the attack rate (Pawar et al., 2013). One would therefore expect stabilizing selection to drive attack rates and handling times toward optima determined by energetic, physiological, and anatomical considerations. However, oscillation-induced extinction could counteract evolution toward such optima by imposing a population-level constraint on the attack rate-handling time combinations that can evolve under stabilizing selection. For instance, given that the consumer's handling time cannot be decreased beyond that determined by resource attributes, high attack rates could cause positive feedback to exceed negative feedback (i.e., ah > q), leading to consumer-resource oscillations. If such oscillations are large enough to cause extinction during periods of low abundances, we expect evolved attack rates to be lower than the optima determined by stabilizing selection in the absence of such extinctions.
I test these predictions using a model that combines quantitative genetics of phenotypic trait evolution with consumer-resource dynamics. I investigate whether stabilizing selection combined with extinction at low abundances can generate the observed attack rate-handling time distribution in the absence of (i) trade-offs between phenotypic or quantitative traits (Schreiber et al., 2011; Vasseur et al., 2011) or (ii) phenotype matching, i.e., the consumer maximizes its attack rate by matching the resource's phenotype while the resource maximizes its escape rate by deviating from the predator's phenotype (Abrams and Matsuda, 1987; Saloniemi, 1993; Marrow et al., 1996; Nuismer et al., 2005).
Mathematical Framework
Evolution of the Attack Rate
Let a(x) be the consumer species' attack rate, the evolution of which is driven by an underlying quantitative trait x. Under the infinitesimal model of quantitative genetics (Fisher, 1918; Turelli and Barton, 1994), the trait x is driven by the action of a large number of unlinked loci, each having a small, additive effect. In the limit of infinitely many loci, each with an infinitesimally small effect such that their product is finite, the central limit theorem states that the trait distribution is Gaussian and that selection only changes the trait mean and not its variance (Fisher, 1918; Lande, 1976). The trait distribution is given by the probability density:
with and denoting, respectively, the mean and variance of x. When genetic variation is purely additive and mating is random, where is the additive genetic variance, and , the environmental variance. The quantity is the narrow-sense heritability (), the fraction of phenotypic variation due to additive genetic effects (Turelli and Barton, 1994). I follow previous studies utilizing the infinitesimal model in assuming that parents and offspring experience the same range of environments, and that, under weak selection, additive genetic variance remains constant over time (Lande, 1976, 1980; Bulmer, 1980; Gomulkiewicz and Kirkpatrick, 1992; Turelli and Barton, 1994). Several studies have shown that the infinitesimal model can correctly predict the mean phenotype even when the genetics are non-Gaussian, and the variances change over time (Barton and Turelli, 1987; Turelli, 1988, 2017; Turelli and Barton, 1990, 1994; Barton et al., 2017).
Stabilizing selection on the attack rate is given by a Gaussian function:
where α is the attack rate corresponding to the optimal value of the quantitative trait [i.e., when x → θ, a(x) → α], and τa depicts the strength of stabilizing selection (Gomulkiewicz and Kirkpatrick, 1992; Gavrilets, 1997; Kopp and Gavrilets, 2006). When τa is small stabilizing selection is strong and vice versa.
When the attack rate evolution is driven by the quantitative trait x, the fitness of an individual consumer is given by its per capita growth rate WC(x, R):
The mean fitness is obtained by integrating the fitnesses of all consumer individuals over all values of x:
The integral in Equation (8) cannot be solved analytically. As it involves the expectation of a ratio, a Taylor series expansion (Appendix B) shows that this ratio can be approximated by:
where gives the mean attack rate over all consumer phenotypes x:
Numerical analyses show that this approximation is valid in the limit of low phenotypic variation and weak to moderate selection (Appendix B).
The eco-evolutionary dynamics are given by:
where is the selection gradient (the rate at which mean fitness changes with the mean trait value) given by:
There are several points to note about Equation (11). First, additive genetic variation () only affects the rate of evolution; it has no effect on the selection gradient (). Second, the selection gradient contains several parameters (f, α, τa, σa) that do not depend on . These parameters contribute to the change in mean fitness through their effects on ecological dynamics. Third, the mean phenotype () is determined both by the selection strength (τa) and phenotypic variation (). When the mean quantitative trait () evolves to its optimum (θa), the mean attack rate is given by . When phenotypic variation is low (most individuals have trait values close to the optimum) and selection is weak to moderate (i.e., fitness cost of deviating from the optimum is lower) evolves to approach its optimum (i.e., ). Note that because it appears in the numerator and the denominator of , selection strength (τa) has a stronger effect on trait evolution than phenotypic variation.
In the absence of resource or consumer extinction, the mean quantitative trait and the mean attack rate will evolve toward the values expected under stabilizing selection [i.e., and ]. This allows us to determine the degree to which oscillation-induced extinction can impede trait evolution toward values that maximize consumer fitness.
Evolution of the Handling Time
When the handling time is a consumer trait, consumer fitness is maximized when the handling time is minimized. In this case, we expect stabilizing selection to drive the handling time toward a minimum determined by the resource species' defense mechanisms and the consumer's morphology. In contrast, when the handling time is a resource trait, resource fitness is maximized when the handling time is maximized. I investigate each case in turn.
When the handling time is a consumer trait driven by a quantitative trait y, the fitness of an individual consumer is given by:
where with η and θh depicting, respectively, the minimum handling time and the corresponding quantitative trait value, and τh denotes the strength of stabilizing selection.
Mean consumer fitness is given by:
In the limit of low phenotypic variation and weak to moderate selection, the integral in Equation (14) can be approximated by:
where gives the mean handling time over all consumer phenotypes y, i.e.,
Note that the mean phenotype is subject to the constraint that selection strength be weaker than phenotypic variation.
Eco-evolutionary dynamics are given by:
where is the phenotypic variance in the handling time, is the narrow-sense heritability, and the selection gradient is given by:
When the mean quantitative trait (ȳ) evolves to its optimum (θh), the mean handling time is given by . When phenotypic variation is low and selection is weak, evolves to approach η.
When the handling time is a resource trait driven by the quantitative trait z, the fitness of a resource individual is given by
Mean resource fitness is given by:
As previously, we can approximate the integral in the low phenotypic variation and weak-to-moderate selection limit as:
where gives the mean handling time over all resource phenotypes z:
Now the eco-evolutionary dynamics are given by:
where is the phenotypic variance in the handling time, is the narrow-sense heritability, and the selection gradient is given by:
Recall that we want to understand how oscillatory ecological dynamics influence trait evolution. The important traits that affect oscillations are resource self-limitation strength (q), and the consumers' mortality and conversion efficiency (d and f). Of note, resource self-limitation has a much stronger effect on stability than the consumer's mortality rate or conversion efficiency. This is because oscillatory tendency is determined by the relative magnitudes of ah and q (Appendix A).
Joint Evolution of the Attack Rate and Handling Time
Consider the attack rate as a consumer attribute and the handling time as a resource attribute, driven respectively by the quantitative traits x and y. These traits are under direct stabilizing selection with no phenotype matching (Saloniemi, 1993; Marrow et al., 1996; Abrams and Matsuda, 1997; Nuismer et al., 2005). I do not incorporate phenotype matching because it only applies to traits shared by both species (e.g., body size, running speed) that can be measured, or be transformed, into the same units (Gavrilets, 1997; Sasaki and Godfray, 1999; Abrams, 2000; Kopp and Gavrilets, 2006). (Since the attack rate has units of time−1ind−1 and the handling time, units of time, they cannot be transformed into the same units). Because resource and consumer individuals experience direct stabilizing selection on handling time and attack rate with no genetic exchange between the species, there is no indirect or correlated selection within a species that could lead to a genetic covariance between the two traits. Such covariances can arise when the attack rate and handling time are both consumer traits, but empirical data on the covariance structure is non-existent at present. I therefore investigate whether joint trait evolution can occur solely in response to consumer-resource dynamics in the absence of genetic covariances (Gavrilets, 1997).
The consumer maximizes fitness by maximizing the attack rate, the resource maximizes fitness by maximizing the handling time. Fitnesses of individual resources and consumers are given by Equations (19) and (7). Mean fitnesses of the resource and consumer populations are given by:
and
As previously, when phenotypic variation is low and selection is weak to moderate, the integrals in Equations (25) and (26) can be approximated by:
and
where and are given by Equations (10) and (22) above.
The eco-evolutionary dynamics are given by:
Model Analysis
Consumer-Resource Oscillations and Extinction at Low Abundances
The hypothesis that oscillation-induced extinction constrains functional response evolution rests on the premise that consumer-resource oscillations can be large enough to cause extinction. I used the ecological model (Equation 1) to test whether consumer-resource oscillations predispose species to extinction during periods of low abundances. In this model, strong positive feedback relative to negative feedback can cause divergent oscillations followed by rapid collapse to extinction, a phenomenon noted in previous studies as well (Murdoch et al., 2003; Noonburg and Abrams, 2005; Hein and Martin, 2020). I considered an interaction as having undergone such collapse if populations did not recover from abundances falling below the absolute error tolerance (10−50) at the end of 100 years (36,500 time steps). I investigated extinction at low abundances of deterministically persistent interactions by considering species to have become extinct if abundances fell below 1,000th of the resource carrying capacity (inverse of self-limitation strength q) over the course of 100 years. I used the carrying capacity as a normalizing factor because it, along with the attack rate and handling time, drives oscillatory tendency; a large carrying capacity means weak self-limitation and stronger oscillations. Also, what constitutes a low abundance for a population with a carrying capacity of 10,000 is not the same as that for one with a carrying capacity of 25. To ensure that extinction at low abundances occurred due to persistent oscillations themselves and not transient fluctuations, I let dynamics proceed for 15 years (5,475 time steps) before imposing the extinction threshold. The results reported below are insensitive to the magnitude of the extinction threshold or the transient period length.
Eco-Evolutionary Dynamics of Trait Evolution
I used the eco-evolutionary models (Equations 11, 17, 23, and 29) to test the hypothesis that oscillation-induced extinctions constrain functional response evolution. If this hypothesis is correct, attack rates (handling times) should evolve to values expected under stabilizing selection only if they are associated with handling times (attack rates) that preclude extinction. I tested this prediction by comparing eco-evolutionary dynamics with and without extinction at low abundances. As noted in the Mathematical Framework section above, evolution of functional response traits is affected by the strength of stabilizing selection (τ) even in the absence of extinction. I therefore designed numerical experiments in which I compared the outcomes of attack rate and/or handling time evolution with and without extinction under varying selection strengths (weak vs. moderate) in the limit of low phenotypic variance. I used the same thresholds as I did in the ecological model above to determine collapse and extinction at low abundances. I allowed species interaction dynamics to proceed for 15 years (5,475 time steps) before imposing an extinction threshold. I calculated mean trait values and species' abundances after 50 years (18,250 time steps) of eco-evolutionary dynamics, after ensuring that this time frame was sufficient for eco-evolutionary dynamics to reach their long-term outcomes. I used a day as a time step in all simulations because this is the time unit on which attack rates and handling times are measured in the data.
I used empirical data on attack rates and handling times obtained from the literature (Vucic-Pestic et al., 2010; Englund et al., 2011; Binzer et al., 2012; Johnson and Amarasekare, 2015) to inform the simulations. These data come from studies in which the the attack rate and handling time were either directly observed or estimated by fitting Type II functional responses to consumption rates measured at different resource densities. Attack rates were converted to units of per individual per day and handling times, to units of days. This yielded 57 functional responses with 49 predator-prey interactions and eight host-parasitoid interactions. Most of the interactions involved insect predators and insect prey (N = 51), followed by fish and insect (N = 2), fish and crustacean (N = 1), crustacean and mussel (N = 1), insect and crustacean (N = 1), and insect and mite (N = 1).
Analysis of these data show that attack rate and handling time distributions are strongly right-skewed, with most species exhibiting low attack rates (mean ± SE = 0.77±0.14 day−1ind−1;
mode = 0.07 day−1ind−1, skewness = 2.29) and handling times (mean ± SE = 0.08±0.02 days; mode = 0.1 days; skewness = 2.76). Indeed, the attack rate and handling time rarely exceeded 2.0 day−1ind−1 and 0.2 days (Vucic-Pestic et al., 2010; Englund et al., 2011; Johnson and Amarasekare, 2015). I therefore report simulation results for attack rates in the range 0.01–2.0 and handling times in the range 0.01–1.
Given the low heritability of phenotypic traits (Falconer and McKay, 1996), I set throughout for both species. I found that higher heritability leads to faster evolutionary dynamics (Schreiber et al., 2011; Vasseur et al., 2011), but do not alter the qualitative nature of the long-term evolutionary outcomes (Appendix C, Figures C2, C3). Initial values of the quantitative traits x, y and z were set to 0.01−0.05, well below those (θa = θh = 1) corresponding to the optimal attack rate (α) and handling time (η), after verifying that initial conditions did not affect the long-term outcomes. Guided by empirical data, I set α = 1.0 and η = 0.1 when the handling time is a consumer trait. I set η = 1.0 for when the handling time is a resource trait because the resource maximizes its fitness when the handling time is maximized. For the case when they evolve jointly, I set the optimal attack rate and handling time based on empirical observed ranges with α ranging from 0.1 to 2.0 and η, from 0.01 to 0.7. I chose τ and σ2 in accordance with the quantitative genetic model assumptions of low phenotypic variation (σ ≤ 0.5) and weak to moderate selection strengths (Lande, 1976, 1982; Abrams et al., 1993) [τ ∈ (0.5–2.0)].
Results
Analysis of the eco-evolutionary model shows that regardless of whether handling time is a resource or a consumer trait, and whether it evolves independently of or jointly with the attack rate, high attack rates and long handling times cause divergent oscillations and the eventual collapse of consumer-resource interactions, restricting the persistent interactions to those with low attack rates and/or short handling times. Even when oscillations do not cause such collapse, they can predispose resource and consumer populations to extinction during periods of low abundances. The combination of collapse and extinction at low abundances restricts the evolved attack rate-handling time combinations to a range that closely mirrors the empirically observed distribution. Below I explain how these results come about.
Evolution of the Attack Rate
Consider first the evolution of the attack rate, a consumer trait, with the handling time, which can be a resource or consumer trait, acting as a constraint. This means that stabilizing selection on the attack rate can maximize fitness only to the extent possible given the magnitude of the handling time. For instance, a consumer exploiting a resource requiring a long handling time may not evolve as high an attack rate as one that exploits a resource with a short handling time because of the extinction risk posed by consumer-resource oscillations. This is indeed what we find (Figures 3, 4). When the handling time is long, collapse prevents trait evolution regardless of selection strength (Figures 3A,B,F). When the handling time is shorter, the mean attack rate () can evolve to its expected value () (Figures 3C,G), albeit with resource abundances falling to extremely low levels. As a result, extinction at low abundances constrains trait evolution such that the mean attack rates of persistent consumer-resource interactions always fall within the parameter space that admits a stable equilibrium in the absence of evolution (Figure 4).
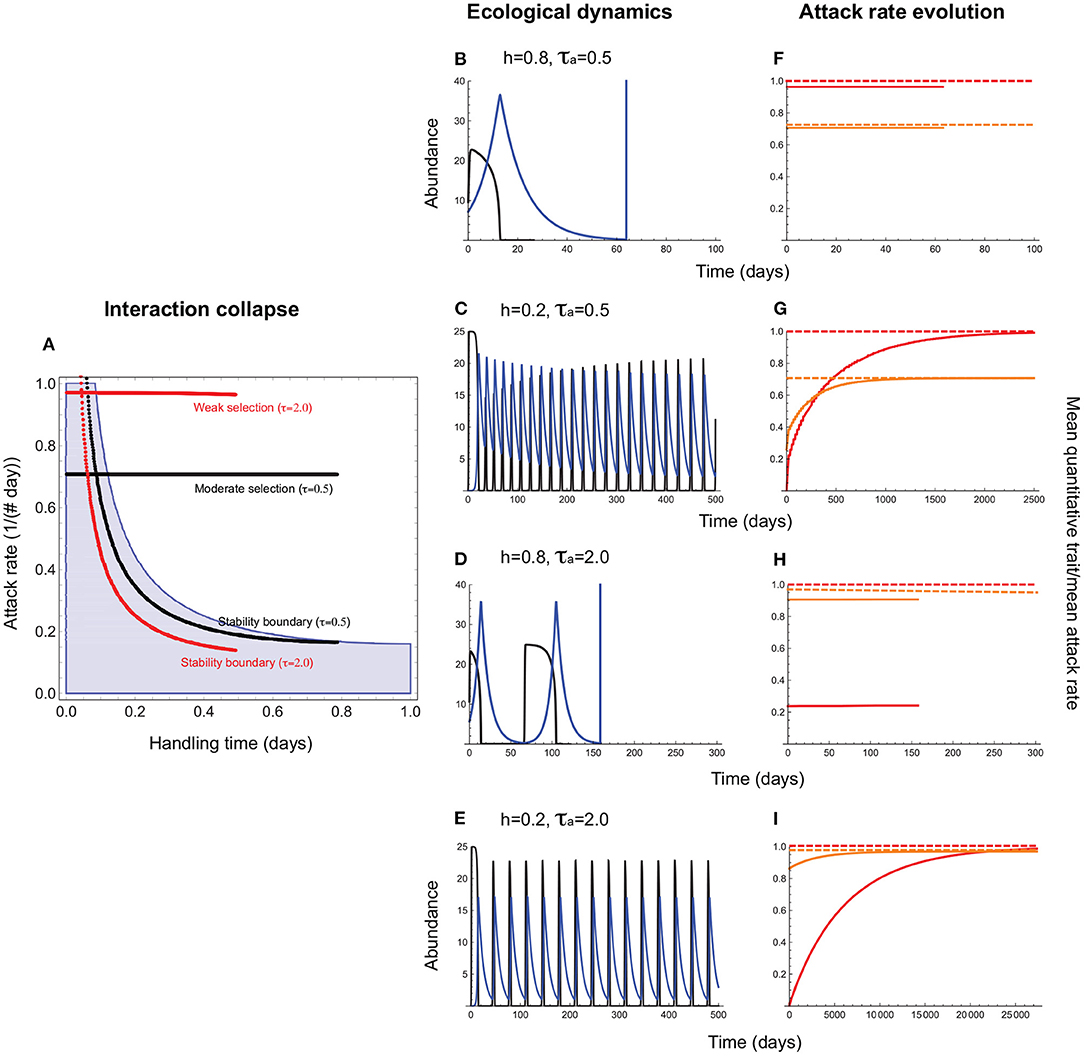
Figure 3. Attack rate evolution (Equation 11) when the handling time acts as a constraint. (A) depicts the attack rate-handling combinations that evolve in the model for varying strengths of stabilizing selection (τa). (B–I) depict four representative cases of eco-evolutionary dynamics. In (A), the red and black horizontal lines depict the attack rate-handling combinations that evolve in the model for weak (τa = 2.0) and moderate (τa = 0.5) selection. Note that these lines terminate before the handling time reaches its maximum (h = 1.0) because when h is long, oscillations become sufficiently large to cause interaction collapse if negative feedback is too weak to prevent divergent oscillations. The red and black curves represent the corresponding stability boundaries calculated using these evolved combinations. The blue shaded region depicts the attack rate-handling time combinations that yield a stable point equilibrium in the absence of evolution (Appendix A). (B–E) depict resource (black) and consumer (blue) abundances and (F–I), the mean attack rate [, orange line] the corresponding quantitative trait mean (, red line), the expected optima for (; orange dashed line) and (θa; red dashed line). (B,F) illustrate the case when a long handling time (h = 0.8) leads to collapse under moderate levels of selection (τa = 0.5). (C,G) show that the interaction persists when the handling time is shorter (h = 0.2), albeit with resource abundances reaching extremely low levels, with and evolving to their respective optima (θa and ). (D–I) illustrate collapse (long handling time, h = 0.8) and persistence (short handling time, h = 0.2) under weak selection (τa = 2.0). Note that weaker selection leads to slower rates of evolution, with θa and taking much longer to reach their respective optima [2,500 time units in (E) vs. 25,000 time units in (I)]. Other parameter values are: r = 5.0, q = 0.04, e = 0.2, d = 0.1, σa = 0.5.
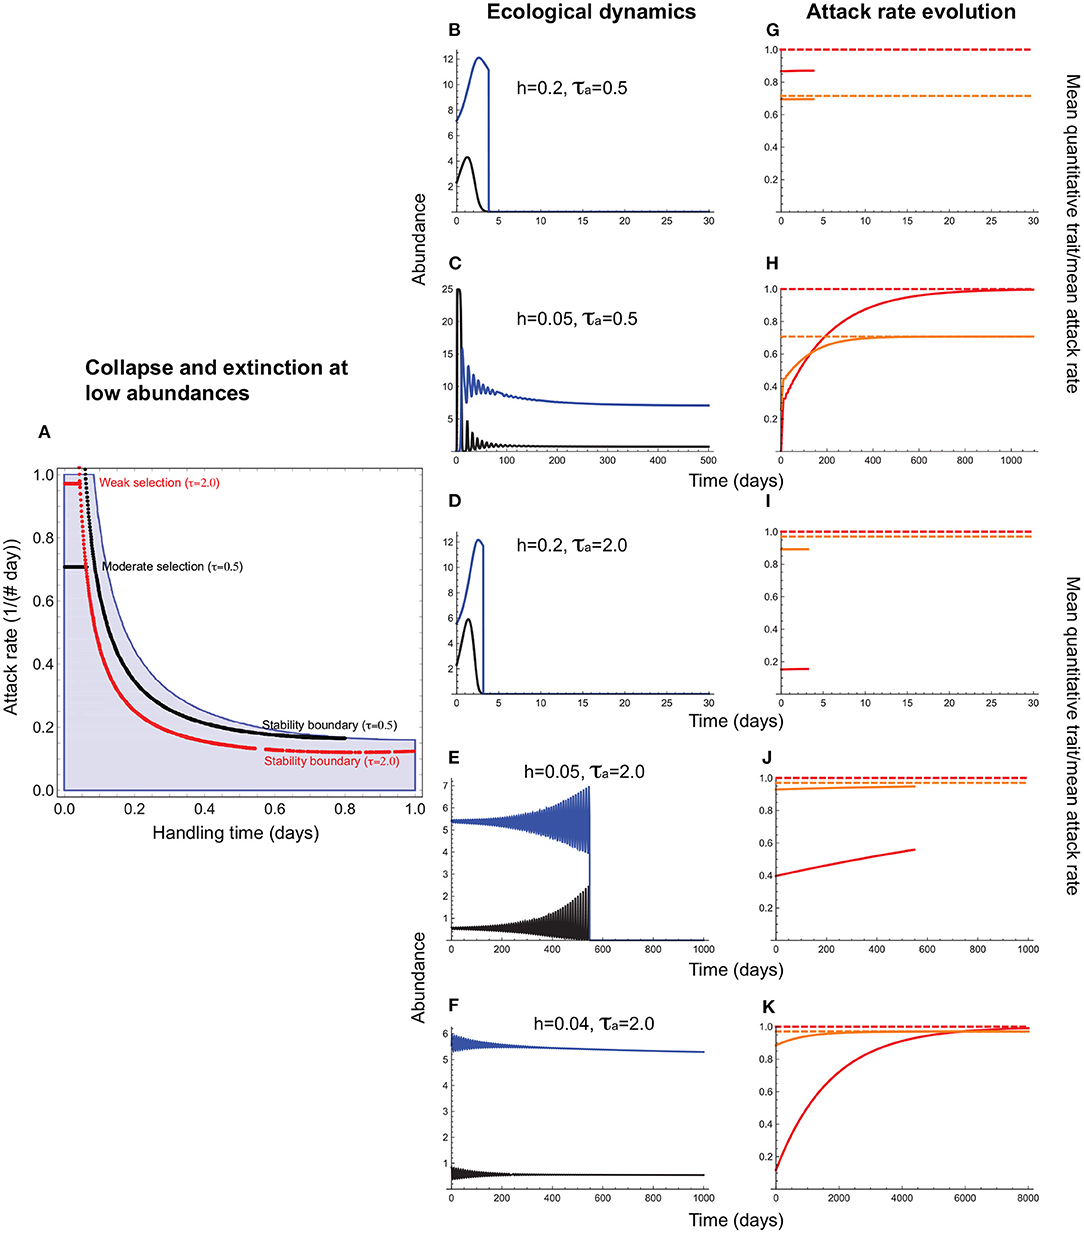
Figure 4. Attack rate evolution (Equation 11) under interaction collapse and extinction at low abundances. In (A), the red and black horizontal lines depict the attack rate-handling combinations that evolve in the model for varying strengths of stabilizing selection. Note that these lines terminate well before before the handling time reaches its maximum (h = 1.0) because when h is long, oscillations become sufficiently large to cause either extinction at low abundances (if there is sufficient negative feedback to maintain bounded fluctuations) or collapse (if negative feedback is too weak to prevent divergent oscillations). (B–F) depict resource (black) and consumer (blue) abundances and (G–K), the mean attack rate [, orange line] the corresponding quantitative trait mean (, red line), and the expected optima for (; orange dashed line) and (θa; red dashed line). (B,G,D,I) illustrate how the outcomes depicted in Figures 3C,G,E,I change when extinction at low abundances is taken into account. A shorter handling time (h = 0.2) prevents collapse (Figure 3) but resource abundances fall so low that extinction prevents trait evolution. When selection is moderately strong (τa = 0.5) and the handling time is sufficiently short [h = 0.05; (C,H)], minimum resource abundance exceeds the levels that predispose it to extinction, and the mean attack rate evolves to its optimum (). (E,J) illustrate the same situation under weak selection (τa = 2.0). Now, a handling time short enough to allow attack rate evolution under moderate selection is insufficiently short to prevent extinction at low abundances. As can be seen from (A), when selection is weak, the constraint imposed by the handling time becomes stronger, restricting attack rate evolution only to cases in which the handling times is exceedingly short [below 0.05 per day for the parameter values used here; (F,K)]. Other parameter values are as in Figure 3.
Evolution of the Handling Time
When the handling time is a resource trait, the resource species' fitness is maximized when the handling time is long relative to the consumer species' longevity (i.e., the consumer species' spends more time handling a captured resource item than in capturing new items, thus reducing its impact on the resource). In this case stabilizing selection should drive the handling time toward a maximum determined by energetic and other constraints on the resource species' defenses against predation/parasitism (i.e., the costlier the defense, the lower is the maximum handling time). When the handling time is a consumer trait, consumer species' fitness is maximized when the handling time is short relative to its longevity. In this case stabilizing selection should drive the handling time toward a minimum determined by the resource type the consumer specializes on (i.e., the better-defended the prey, the longer is the handling time). Since it is the handling time that induces positive feedback in species' per capita growth rates, its evolution should be subjected to the demographic constraint of oscillation-induced extinction regardless of whether it is a resource or consumer trait. Analysis of the eco-evolutionary model confirms these expectations.
When the handling time is a consumer trait, the mean handling time () evolves to the expected minimum under stabilizing selection () (Figure 5A). Such interactions can persist even under high attack rates albeit with resource abundances reaching extremely low levels (Figures 5B–E). Extinction at low abundances constrains trait evolution such that persistent interactions are those in which attack rates are sufficiently low to elevate minimum resource abundance above the extinction threshold (Figures 5F–N). As a result, mean handling times of persistent consumer-resource interactions fall within the parameter space that admits a stable equilibrium in the absence of evolution (Figure 5F).
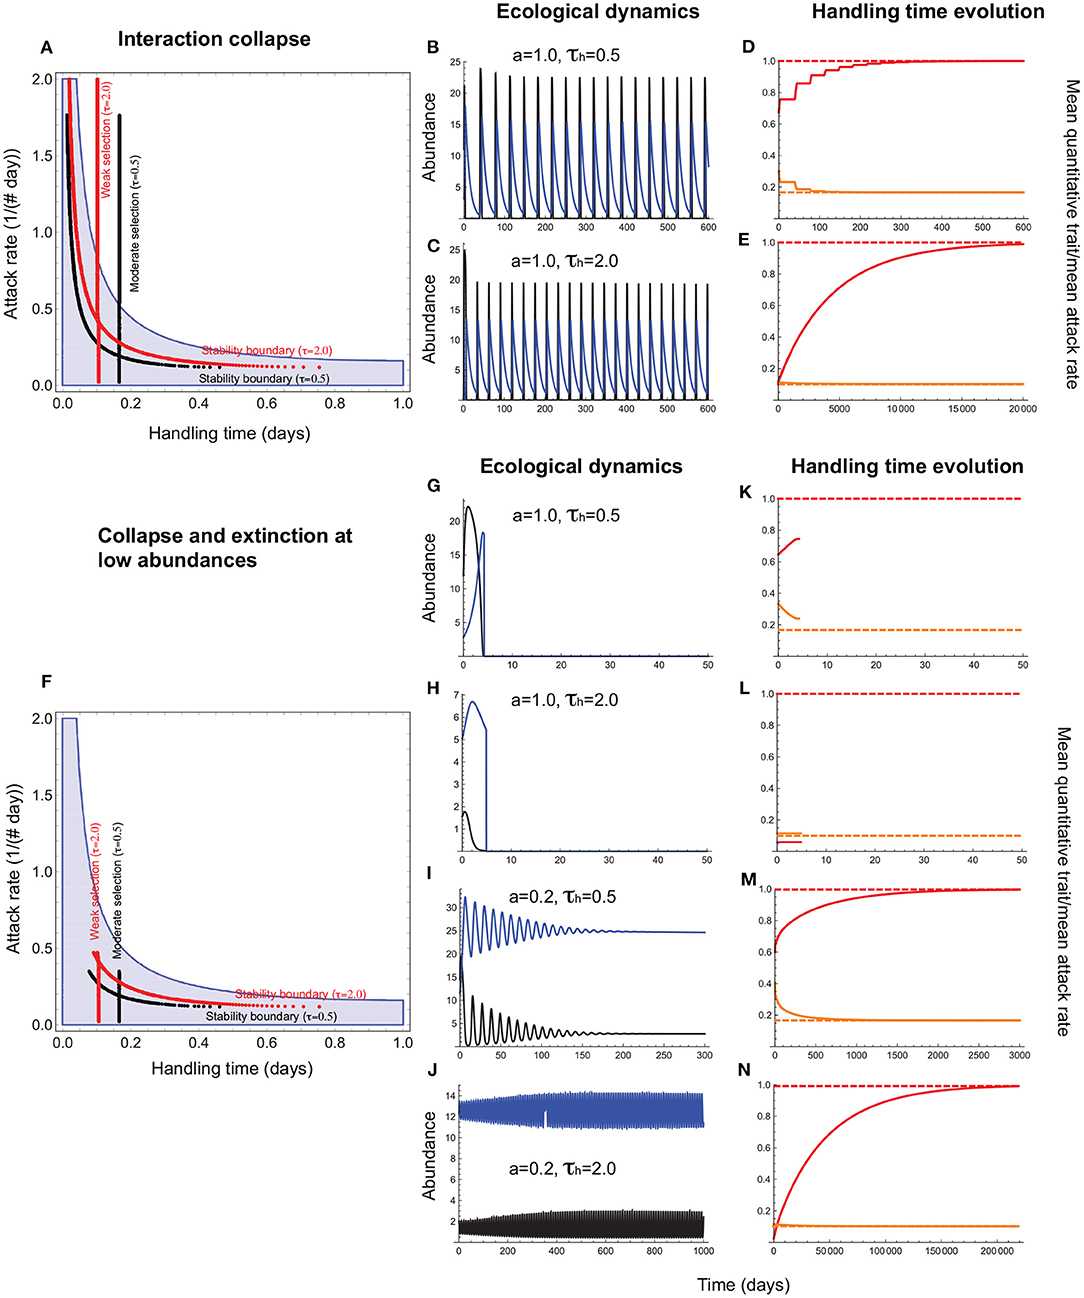
Figure 5. Handling time evolution when it is a consumer trait. (A–E) depict outcomes under collapse, and (F–N), collapse combined with extinction at low abundances. In (A,F), the red and black vertical lines depict the attack rate-handling combinations that evolve in the model for weak (τh = 2.0) and moderate (τh = 0.5) selection. The red and black curves represent the corresponding stability boundaries calculated using these evolved combinations. The blue shaded region depicts the attack rate-handling time combinations that yield a stable point equilibrium in the absence of evolution. In (A,F), the mean handling time () evolves to a minimum under stabilizing selection (). Note that the evolved minimum () exceeds the expected minimum (η) because of the phenotypic load imposed by even when σh is low. (B,C,G–J) depict resource (black) and consumer (blue) abundances and (D–E,K–N), the mean handling time [, orange line], the expect minimum of (; dashed orange line), the quantitative trait mean (, red line), and its expected optimum (θh = 1.0; dashed red line). (B–E) show that the handling time can evolve toward its expected minimum () regardless of selection strength even when the attack rate is high, albeit with resource abundances reaching extremely low levels at frequent intervals. (G–N) show that such interactions are susceptible to extinction at low abundances that curtails trait evolution. It is only when the attack rate is sufficiently low that the minimum resource abundance exceeds the levels that predispose it to extinction (I,J), that the mean handling time evolves to its optimum (] (M,N). Other parameter values are: r = 5.0, q = 0.04, e = 0.2, d = 0.1, σh = 0.4.
When the handling time is a resource trait, the mean handling time evolves to the expected maximum under stabilizing selection (), with evolved handling times being associated with a range of attack rates (Figure 6A). However, the ecological dynamics are such that resource abundances fall to low levels that predispose the entire interaction to extinction (Figures 6A–E). In this case, trait evolution is constrained to interactions in which attack rates are sufficiently low that resource abundance exceeds the levels that induce oscillation-induced extinction (Figures 6F–N). Now, attack rate-handling time combinations fall entirely within the stable region in the absence of evolution.
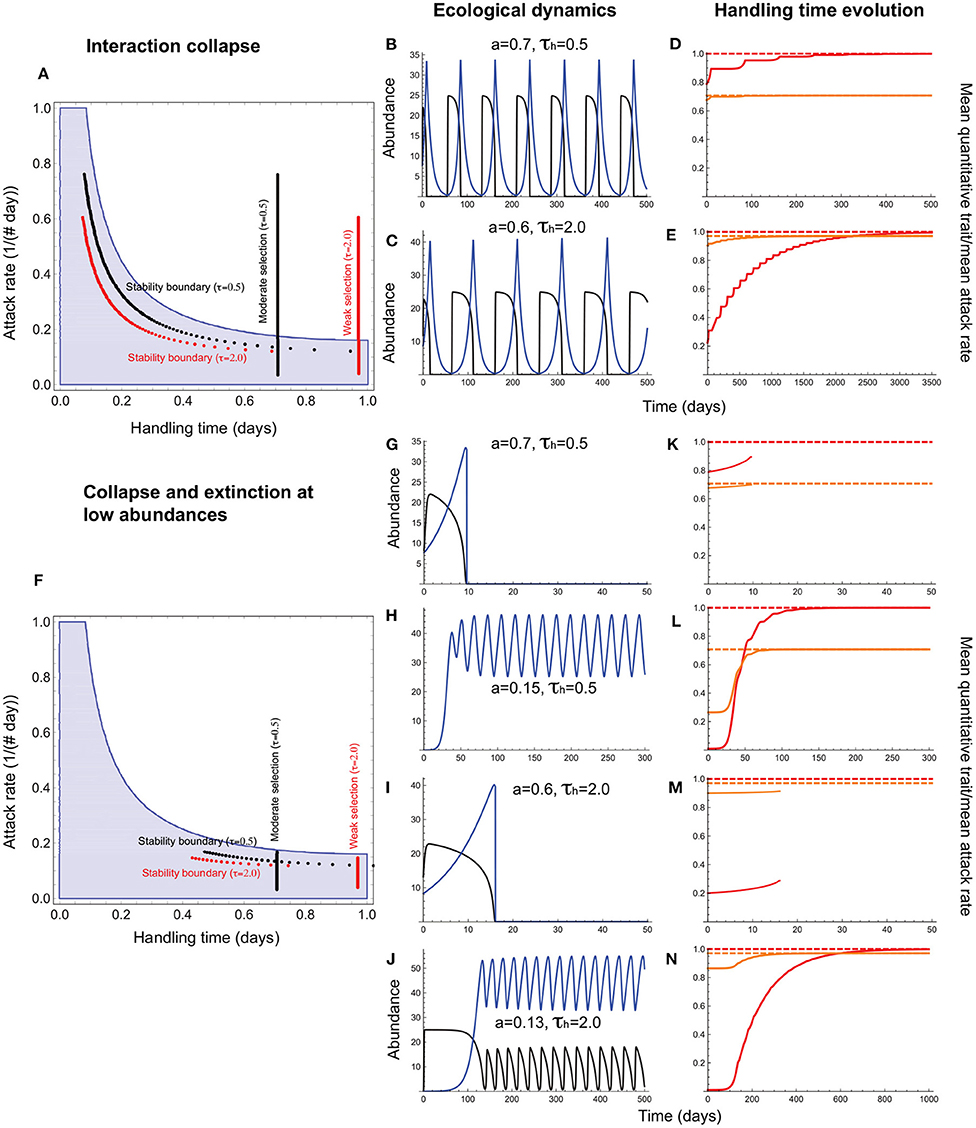
Figure 6. Handling time evolution when it is a resource trait. (A–E) depict outcomes under collapse, and (F–N), collapse combined with extinction at low abundances. In (A,F), the red and black vertical lines depict the attack rate-handling combinations that evolve in the model for weak (τh = 2.0) and moderate (τh = 0.5) selection. The red and black curves represent the corresponding stability boundary calculated using these evolved combinations. The blue shaded region depicts the attack rate-handling time combinations that yield a stable point equilibrium in the absence of evolution. (B,C,G–J) depict resource (black) and consumer (blue) abundances and (D–E,K–N), the mean handling time [, orange], its expected optimum (, dashed orange line), the quantitative trait mean (, red), and its expected optimum (θh = 1.0; dashed red line). (B–E) show that the handling time can evolve toward its optimum (), albeit with resource abundances reaching extremely low levels at frequent intervals. (G–J) show that such interactions are susceptible to extinction at low abundances that curtails trait evolution. It is only when the attack rate is sufficiently low that the minimum resource abundance exceeds the levels that predispose it to extinction, and the mean handling time evolves to its optimum () (K–N). Other parameter values are: r = 5.0, q = 0.04, e = 0.2, d = 0.1, σh = 0.5.
When the attack rate is a consumer trait and the handling time is a resource trait, the consumer maximizes fitness by maximizing the attack rate while the resource maximizes fitness by maximizing the handling time. Each trait is under direct stabilizing selection with no phenotype matching, but their joint evolution is influenced by consumer-resource oscillations. In this case, collapse prevents the evolution of high attack rate-long handling time combinations (Figures 7A–M). The joint effects of collapse and extinction at low abundances leads to an attack rate-handling time distribution that closely resembles the empirically observed pattern (Figure 7(n), 7(o)–(dd)).
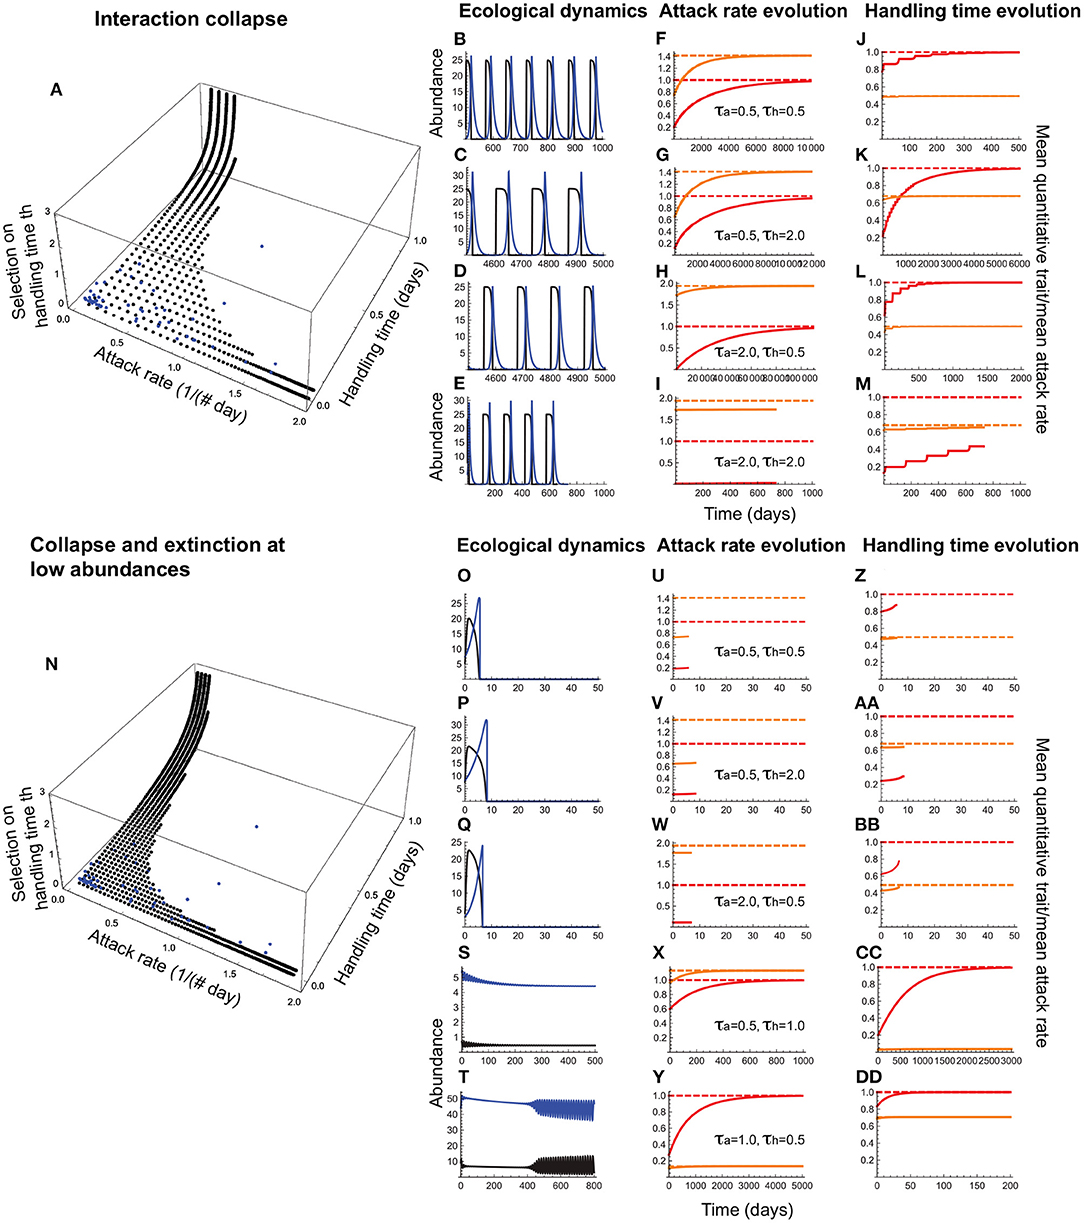
Figure 7. Joint evolution of the attack rate and handling time when the former is a consumer trait and the latter is a resource trait. (A–M) depict outcomes under collapse, and (N–DD), collapse combined with extinction at low abundances. In (A,N), the black circles depict the attack rate-handling combinations that evolve in the model as a function of stabilizing selection strength on the handling time (τh; note that the lower the τh, the stronger is the selection); the curves consisting of evenly spaced circles parallel to the handling time axis depict the evolved outcomes under a given selection strength on the attack rate (τa). The blue circles depict the empirically observed attack rate-handling time combinations. (B–E,O–T) depict resource (black) and consumer (blue) abundances, (F–I,U–Y) depict the mean attack rate [, orange curve] and its expected optimum [, dashed orange line], the corresponding quantitative trait mean [, red curve] and its expected optimum θa, dashed red line. (J–M,Z–DD) depict the mean handling time [, orange curve], its expected optimum [, dashed orange line], the corresponding quantitative trait mean (, red curve) and its expected optimum θh, dashed red line. (B–D,F–H,J–L) show that the attack rate and handling time can evolve toward their respective optima as long as selection strength is weak in one [τa(τh) = 2.0 and τh(τa) = 0.5] or both species (τa = τh = 2.0), albeit with resource abundances reaching extremely low levels. When both species experience moderate selection (τa = τh = 2.0), collapse prevents trait evolution (E,I,M). (O,P,Q,U,V,W,Z,AA,BB) show that interactions avoiding collapse under weak selection are nevertheless susceptible to extinction at low abundances, curtailing the evolution of both traits. Persistent interactions are those in which joint evolution leads to a high attack rate combined with a short handling time (S,X,CC) or vice versa (T,Y,DD). Other parameter values are: r = 5.0, q = 0.04, e = 0.2, d = 0.1, σa = 0.5, σh = 0.5.
Sensitivity Analysis
These qualitative outcomes are unchanged by the ecological parameters that affect stability, or the quantitative genetic parameters that drive trait evolution. In the case of ecological parameters, higher consumer death rate (d) and conversion efficiency (f) can increase oscillations and reduce persistence (Appendix C, Figure C1). However, these effects are relatively weak compared to those of resource self-limitation (q). Stronger self-limitation allows for the persistence and evolution of interactions with higher attack rates and longer handling times. In the case of evolutionary parameters, while selection strength (weak vs. moderate) has no qualitative effect on trait evolution, it slows the rate of evolution (Figures 3–6). This is because weaker selection means that individuals with quantitative values farther away from the optimum suffer a relatively low fitness cost, thus slowing down the rate of approach toward the optimum. Regardless of selection strength, evolutionary outcomes occur at a slower rate when heritability is lower (Appendix C, Figures C2, C3).
Discussion
There is a rich body of work on the role of oscillations in the persistence, stability and evolution of consumer-resource interactions (Gurney and Nisbet, 1998; McCann, 2000; Kot, 2001; Murdoch et al., 2002, 2003). Ecological studies have sought to elucidate mechanisms that dampen oscillations and enhance the persistence of consumer-resource interactions, while evolutionary studies have sought to investigate the feedbacks between ecological and evolutionary dynamics in driving trait evolution (e.g., Abrams and Matsuda, 1997; Gavrilets, 1997; Abrams, 2000; Nuismer et al., 2005; Tien and Ellner, 2012; Cortez, 2018; Patel et al., 2018). However, few, if any, studies have investigated whether and how oscillation-induced extinction can constrain the evolution of consumer functional responses. The present study is an attempt to fill this gap in our knowledge. It is motivated by empirical data from arthropod communities, the largest consumer-resource group on the planet, showing that, across a wide range of taxa, feeding modes, and habitats (Vucic-Pestic et al., 2010; Englund et al., 2011; Binzer et al., 2012; Johnson and Amarasekare, 2015 and references therein), most consumer-resource pairs exhibit attack rates-handling time combinations that do not generate oscillations. The main finding, which is robust to variation in both ecological and evolutionary parameters, is that extinction risk posed by consumer-resource oscillations constrains the evolution of the functional response such that persistent interactions are those with low attack rates and/or short handling times. This is exactly the pattern observed in the empirical data.
Two key insights emerge from this analysis. First, the intrinsic tendency for oscillations arising from the conflict of interest between resource and consumer species ultimately mediates the outcome of antagonistic selection pressures that operate on individual resources and consumers. The trait combinations that maximize resource species' fitness (low attack rates and long handling times) serve to minimize the consumer species' fitness, but neither species can maximize its fitness at the expense of the other because populations comprised of such genotypes will exhibit large-amplitude oscillations that predispose them to extinction at low abundances. This ecological constraint on the evolution of functional response parameters results in evolutionary outcomes that maximize neither species' fitness but ensures the long-term persistence of their interaction.
The second insight is that the empirically observed pattern of low attack rates and/or short handling times emerges naturally from the interplay between individual-level selection and the population-level constraint of oscillation-induced extinction. Indeed, there is no genetic or phenotypic covariance built into the eco-evolutionary model, and attack rates and handling times evolve as result of direct stabilizing selection without any pre-imposed trade-offs or phenotype matching. The emergent distribution is entirely the result of differential persistence of populations in which consumer and resource phenotypes exhibit, on average, low attack rates and/or short handling times. Thus, oscillation-driven extinction at low abundances provides a potential explanation for the preponderance of functional responses with low attack rates and/or short handling times that are observed in nature.
Importantly, the interplay between selection and constraints provides a potential explanation for the prevalence of low attack rates and short handling times across different types of consumer species (e.g., predators, herbivores, parasitoids Vucic-Pestic et al., 2010; Englund et al., 2011; Johnson and Amarasekare, 2015). As confirmed by independent studies of time series analyses (Murdoch et al., 2002), such interactions do not exhibit consumer-resource cycles. Of note, when we do observe strong oscillatory interactions in nature, they nearly always involve exotic species invading novel habitats to which they are maladapted (Elton, 1958; Williamson, 1996), insect pests causing periodic outbreaks (“boom and bust” cycles; Barbosa and Schultz, 1987) that result in local extinctions (Levins and Wilson, 1980), or pathogens causing transient epidemics (Anderson and May, 1980). The persistence of such systems in ecological time results from extinction-colonization dynamics (Simberloff and Gibbons, 2004), and over evolutionary time, through the coevolution of enemy and victim traits (Day, 1996; Levin, 1996; Gavrilets, 1997).
These findings have broader implications for food web dynamics and persistence. A number of studies have found that food web modules that are over-represented in natural communities are those that theoretical studies find to be the most persistent (Milo et al., 2002; Camacho et al., 2007; Borelli et al., 2015). For instance, tri-trophic food chains and omnivory are observed in greater frequencies than expected by chance compared to exploitative and apparent competition. The fact that the commonest food web modules observed in natural communities are ones with more trophic links, and hence greater potential for oscillatory dynamics compared to the less common ones, suggests that functional response evolution under the constraint of oscillation-induced extinction may play an important role in driving food web topology. It emphasizes the importance of incorporating oscillation-induced extinction into network theory approaches to studying food web complexity.
Data Availability Statement
Publicly available datasets were analyzed in this study. This data can be found here: https://www.journals.uchicago.edu/doi/suppl/10.1086/679279.
Author Contributions
PA designed the project, conducted the analyses, and wrote the article.
Funding
This research was supported by a National Science Foundation grant DEB-1949796 and a Guggenheim Fellowship to PA.
Conflict of Interest
The author declares that the research was conducted in the absence of any commercial or financial relationships that could be construed as a potential conflict of interest.
Publisher's Note
All claims expressed in this article are solely those of the authors and do not necessarily represent those of their affiliated organizations, or those of the publisher, the editors and the reviewers. Any product that may be evaluated in this article, or claim that may be made by its manufacturer, is not guaranteed or endorsed by the publisher.
Supplementary Material
The Supplementary Material for this article can be found online at: https://www.frontiersin.org/articles/10.3389/fevo.2022.836644/full#supplementary-material
References
Abrams, P. (2000). The evolution of predator-prey interactions: theory and evidence. Annu. Rev. Ecol. Syst. 31, 79–105. doi: 10.1146/annurev.ecolsys.31.1.79
Abrams, P., and Matsuda, H. (1987). A coevolutionary predator-prey model with quantitative characters. Am. Naturalist 141, 880–896. doi: 10.1086/285514
Abrams, P., and Matsuda, H. (1997). Fitness minimization and dynamic instability as a consequence of predator-prey coevolution. Evol. Ecol. 10, 167–186. doi: 10.1007/BF01241783
Abrams, P., Matsuda, H., and Harada, Y. (1993). Evolutionarily unstable fitness maxima and stable fitness minima of continuous traits. Evol. Ecol. 7, 465–487. doi: 10.1007/BF01237642
Anderson, R., and May, R. (1980). Infectious diseases and population cycles of forest insects. Science 210, 658–661. doi: 10.1126/science.210.4470.658
Barton, N., Etheridge, A., and Veber, A. (2017). The infinitesimal model: definition, derivation and implications. Theor. Popul. Biol. 118, 50–73. doi: 10.1016/j.tpb.2017.06.001
Barton, N. H., and Turelli, M. (1987). Adaptive landscapes, genetic distance, and the evolution of quantiatative characters. Genet. Res. 49, 157–173. doi: 10.1017/S0016672300026951
Binzer, A., Guill, C., Brose, Y., and Rall, B. (2012). The dynamics of food chains under climate change and nutrient enrichment. Philos. Trans. R. Soc. Biol. Sci. 367, 2935–2944. doi: 10.1098/rstb.2012.0230
Borelli, J., Allesina, S., and Amarasekare, P. t. (2015). Selection on stability across ecological scales. Trends Ecol. Evol. 00, 417–425. doi: 10.1016/j.tree.2015.05.001
Bulmer, M. (1980). The Mathematical Theory of Quantitative Genetics. New York, NY: Oxford University Press
Camacho, J., Stouffer, D., and Amaral, L. (2007). Quantitative analysis of the local structure of food webs. J. Theor. Biol. 246, 260–268. doi: 10.1016/j.jtbi.2006.12.036
Cortez, M. (2018). Genetic variation determines which feedbacks drive and alter predator-prey eco-evolutionary cycles. Ecol. Monogr. 353–371, 353–371. doi: 10.1002/ecm.1304
Day, T. (1996). Parasite transmission modes and the evolution of virulence. Evolution 55, 2389–2400. doi: 10.1111/j.0014-3820.2001.tb00754.x
Englund, G., Ohlund, G., and Hein, C. S D. (2011). Temperature dependence of the functional response. Ecol. Lett. 14, 914–921. doi: 10.1111/j.1461-0248.2011.01661.x
Falconer, D. S., and McKay, T. (1996). Introduction to Quantitative Genetics. San Francisco, CA: Benjamin Cummings.
Fisher, R. (1918). The correlation between relatives on the supposition of mendelian inheritance. R. Soc. Edinburgh Trans. Soc. 52, 399–433. doi: 10.1017/S0080456800012163
Gavrilets, S. (1997). Coevolutionary chase in exploiter-victim systems with polygenic characters. J. Theor. Biol. 186, 527–534. doi: 10.1006/jtbi.1997.0426
Gomulkiewicz, R., and Kirkpatrick, M. (1992). Quantitative genetics and the evolution of reaction norms. Evolution 46, 390–411. doi: 10.1111/j.1558-5646.1992.tb02047.x
Hein, A. M., and Martin, B. (2020). Information limitation and the dynamics of coupled ecological systems. Nat. Ecol. Evolut. 4, 82–90. doi: 10.1038/s41559-019-1008-x
Holling, C. S. (1959). Some characteristics of simple types of predation and parasitism. Can. Entomol. 91, 385–398. doi: 10.4039/Ent91385-7
Jeschke, J. M., Koop, M., and Tollrian, R. (2004). Consumer-food systems: why type i functional responses are exclusive to filter feeders. Biol. Rev. Camb. Philos. Soc. 79, 337–349. doi: 10.1017/S1464793103006286
Johnson, C., and Amarasekare, P. (2015). A metric for quantifying the oscillatory tendency of consumer-resource interactions. Am. Naturalist 185, 87–99. doi: 10.1086/679279
Kopp, M., and Gavrilets, S. (2006). Multi-locus genetics and the coevolution of quantitative traits. Evolution 60, 1321–1336. doi: 10.1111/j.0014-3820.2006.tb01212.x
Lande, R. (1976). Natural selection and random genetic drift in phenotypic evolution. Evolution 30, 314–334. doi: 10.1111/j.1558-5646.1976.tb00911.x
Lande, R. (1980). Genetic variation and phenotypic evolution during allopatric speciation. Am. Naturalist 116, 463–479. doi: 10.1086/283642
Lande, R. (1982). A quantitative genetic theory of life history evolution. Ecology 63, 607–615. doi: 10.2307/1936778
Levin, B. (1996). The evolution and maintenance of virulence in microparasites. Emerg. Infect. Dis. 2, 93–102. doi: 10.3201/eid0202.960203
Levins, R., and Wilson, M. (1980). Ecological theory and pest management. Annu. Rev. Ecol. Syst. 25, 287–308. doi: 10.1146/annurev.en.25.010180.001443
Marrow, P., Dieckmann, U., and Law, R. (1996). Evolutionary dynamics of predator-prey systems: an ecological perspective. J. Math. Biol. 34, 556–578. doi: 10.1007/BF02409750
Matsuda, H., and Abrams, P. (1994a). Runaway evolution to self-extinction under asymmetrical competition. Evolution 48, 1764–1772. doi: 10.1111/j.1558-5646.1994.tb02212.x
Matsuda, H., and Abrams, P. (1994b). Timid consumers: self-extinction due to adaptive change in foraging and anti-predator effort. Theor. Popul. Biol. 45, 76–91. doi: 10.1006/tpbi.1994.1004
McCann, K., Hastings, A., and Huxel, G. R. (1998). Weak trophic interactions and the balance of nature. Nature 395, 794–798. doi: 10.1038/27427
Milo, R., Shen-Orr, S., Itzkovitz, S., Kashtan, N., Chklovskii, D., and Alon, U. (2002). Network motifs: Simple building blocks of complex networks. Science 298, 824–827. doi: 10.1126/science.298.5594.824
Murdoch, W., Briggs, C. J., and Nisbet, R. M. (2003). Consumer Resource Dynamics. Princeton, NJ: Princeton University Press.
Murdoch, W., Kendall, B. E., Nisbet, R. M., Briggs, C., McCauley, E. R., et al. (2002). Single-species models for many-species food webs. Nature 417, 541–543. doi: 10.1038/417541a
Noonburg, E., and Abrams, P. (2005). Transient dynamics limit the effectiveness of keystone predation in bringing about coexistence. Am. Naturalist 165, 322–335. doi: 10.1086/428068
Nuismer, S., Doebeli, M., and Browning, D. (2005). The covolutionary dynamics of antagonistic interactions mediated by quantitative traits with evolving variances. Evolution 59, 2073–2082. doi: 10.1111/j.0014-3820.2005.tb00918.x
Patel, S., Cortez, M., and Schreiber, S. (2018). Partitioning the effects of eco-evolutionary feedbacks on community stability. Am. Naturalist 191, 381–394. doi: 10.1086/695834
Pawar, S., Dell, A., and Savage, V. (2013). Dimensionality of consumer search space drives trophic interaction strengths. Nature 486, 485–489. doi: 10.1038/nature11131
Rosenzweig, M. L. (1971). Paradox of enrichment: destabilization of exploitation ecosystems in ecological time. Science 171, 385–387. doi: 10.1126/science.171.3969.385
Rosenzweig, M. L., and MacArthur, R. (1963). Graphical representation and stability conditions of predator-prey interactions. Ame. Naturalist 97, 209–223. doi: 10.1086/282272
Saloniemi, I. (1993). A coevolutionary predator-prey model with quantitative characters. Am. Naturalist 141, 880–896. doi: 10.1086/85514
Sasaki, A., and Godfray, H. (1999). A model for the coevolution of resistance and virulence in coupled host-parasitoid interactions. Proc. R. Soc. B 266, 455–463. doi: 10.1098/rspb.1999.0659
Schreiber, S., Bolnick, D., and Burger, R. (2011). The community effects of phenotypic and genetic variation within a predator population. Ecology 93, 1582–1593. doi: 10.1890/10-2071.1
Simberloff, D., and Gibbons, L. (2004). Now you see them, now you don't - population crashes of established introduced species. Biol. Invasions 6, 161–172. doi: 10.1023/B:BINV.0000022133.49752.46
Tien, R. J., and Ellner, S. (2012). Variable cost of prey defense and coevolution in predator-prey systems. Ecol. Monogr. 82, 491–504. doi: 10.1890/11-2168.1
Turelli, M. (1988). Phenotypic evolution, constant covariances, and the maintenance of additive variance. Evolution 42, 1342–1347. doi: 10.1111/j.1558-5646.1988.tb04193.x
Turelli, M. (2017). Fisher's infinitesimal model: a story for the ages. Theor. Popul. Biol. 118, 46–49. doi: 10.1016/j.tpb.2017.09.003
Turelli, M., and Barton, N. H. (1990). Dynamics of polygenic characters under selection. Theor. Popul. Biol. 38, 1–57. doi: 10.1016/0040-5809(90)90002-D
Turelli, M., and Barton, N. H. (1994). Genetic and statistical analyses of strong selection on polygenic traits: what, me normal? Genetics 138, 913–941. doi: 10.1093/genetics/138.3.913
Vasseur, D. A., Amarasekare, P., Rudolf, V., and Levine, J. (2011). Eco-evolutionary dynamics of coexistence via neighbor dependent selection. Am. Naturalist 178, 96–109. doi: 10.1086/662161
Vucic-Pestic, O., Rall, B., Kalinkat, G., and Brose, U. (2010). Allometric functional response model: body masses constrain interaction strengths. J. Anim. Ecol. 79, 249–256. doi: 10.1111/j.1365-2656.2009.01622.x
Keywords: constraints, consumer-resource oscillations, eco-evolutionary dynamics, functional response, selection
Citation: Amarasekare P (2022) Ecological Constraints on the Evolution of Consumer Functional Responses. Front. Ecol. Evol. 10:836644. doi: 10.3389/fevo.2022.836644
Received: 15 December 2021; Accepted: 31 March 2022;
Published: 10 May 2022.
Edited by:
György Barabás, Linköping University, SwedenReviewed by:
Meike Wittmann, Bielefeld University, GermanyFrederik De Laender, University of Namur, Belgium
Copyright © 2022 Amarasekare. This is an open-access article distributed under the terms of the Creative Commons Attribution License (CC BY). The use, distribution or reproduction in other forums is permitted, provided the original author(s) and the copyright owner(s) are credited and that the original publication in this journal is cited, in accordance with accepted academic practice. No use, distribution or reproduction is permitted which does not comply with these terms.
*Correspondence: Priyanga Amarasekare, amarasek@ucla.edu