Soil Moisture Affects the Rapid Response of Microbes to Labile Organic C Addition
 Hongfeng Bian1†
  Chao Li
 Jianxing Zhu
 Li Xu
Li Xu Mingxu Li
 Nianpeng He
- 1State Environmental Protection Key Laboratory of Wetland Ecology and Vegetation Restoration, School of Environment, Northeast Normal University, Changchun, China
- 2College of Life and Environmental Sciences, Minzu University of China, Beijing, China
- 3Institute of Geographic Sciences and Natural Resources Research, Chinese Academy of Sciences, Beijing, China
- 4College of Resources and Environment, University of Chinese Academy of Sciences, Beijing, China
- 5Center for Ecological Research, Northeast Forestry University, Harbin, China
Pulsed inputs of labile organic carbon (LOC) are common in soils and significantly affect carbon cycling. However, it remains unclear how soil moisture content affects microbial responses to LOC inputs and the relative contributions of native soil organic matter (SOM) and LOC derived from CO2 emissions during this process. In this study, we aimed to elucidate how moisture content affects microbial response to LOC inputs and native SOM. Here, 13C-labeled glucose was added to soils under nine soil moisture treatments [ranging from 10 to 90% of the water holding capacity (WHC)], and the immediate utilization of LOC and native SOM by microbes was measured. We found that the response of soil microbes to LOC was rapid, and promoted native SOM decomposition. Soil moisture content influenced the microbial usage of LOC and native SOM. A soil water content of 60% WHC was the optimal threshold for changes in the proportion of LOC and native SOM utilized by the microbes. Specifically, we found that when the soil moisture content was below 60% WHC, the ratio between LOC and native SOM increased with increasing moisture content levels. It gradually decreased when the soil moisture content was above 60% WHC. Overall, these findings emphasize the important role of moisture and LOC inputs in soil C cycles.
Introduction
Soil organic matter (SOM) is the largest carbon (C) pool in the terrestrial biosphere, and its decomposition is a vital flux between the soil and atmosphere (Davidson and Janssens, 2006). Hence, slight variations in SOM mineralization have a huge impact on atmospheric CO2 concentration and may result in dramatic climate and global change (Davidson and Janssens, 2006). The size of the soil C pool depends on the combined effects of C input and SOM decomposition. However, the input of C does not imply an increase in soil C storage because exogenous C input may significantly alter native SOM decomposition through a process called priming (Kuzyakov et al., 2000). With global change, temperature will increase and LOC input into the soil will increase due to higher plant productivity increases (Wu et al., 2011), leading to uncertainty in soil C pools (Kuzyakov, 2010). Numerous studies have investigated SOM priming; however, the short-term processes involved in the microbial response to LOC inputs remains unclear. This is due to the rapid response of soil microbes to exogenous substrate inputs, as well as the limitations of measuring technologies (Wang et al., 2016a; Xu et al., 2020; Jiang et al., 2021).
Soil moisture is an important medium for various biochemical reactions in soils, but it also affects soil gas exchange and the availability and mobility of soluble SOM (Brockett et al., 2012). Moreover, it plays a crucial role in influencing microbial activity and community composition, which indirectly affects microbial mineralization of SOM and thus soil C balance (Geisseler et al., 2011; Brockett et al., 2012). Precipitation events are closely linked to soil moisture content and play a critical role in regulating SOM turnover (Austin et al., 2004; Li et al., 2021), particularly in arid and semi-arid regions (Kim et al., 2012; Wang et al., 2016a). It is therefore expected that changes in soil moisture content, resulting from variations in precipitation patterns or soil management regimes in managed landscapes (Dore, 2005), influence the availability of substrates (Schimel et al., 2007; Butterly et al., 2009) and the mineralization of SOM (Navarro-García et al., 2012). However, it is still unclear how moisture content affects the microbial response to LOC inputs, and the relative contributions of native SOM and LOC to microbial respiration influenced by moisture have not been investigated.
In this study, we aimed to investigate the rapid microbial response to LOC and how soil moisture affects microbial respiration derived from LOC and native SOM. Nine soil moisture treatments [10–90% water holding capacity (WHC)] were established in soil from a semi-arid temperate forest, and δ13C-labeled glucose solutions were added to simulate natural LOC inputs. We used a fully automatic system to measure 12CO2 and 13CO2 fluxes over a 48-h period, taking measurements at 3-min intervals, to quantify the microbial respiration rate using LOC and native SOM. As the study site is an arid/semi-arid region with a low soil moisture content in its natural state, soil microbes are sensitive to changes in moisture. Lower soil moisture leads to lower microbial activity (Jiang et al., 2021) and higher soil moisture tends to form an anaerobic environment to inhibit microbial activity (Kool et al., 2011). Thus, we hypothesized that, either extremely high or low moisture content is not conducive to microbial decomposition of LOC and SOM; conversely, optimal moisture content conditions (50–70% WHC) would lead to greater CO2 emissions. Moreover, we predicted that soil moisture affects the contributions of LOC and SOM to microbial respiration. We inferred that under low moisture conditions, native SOM would contribute more to microbial respiration than LOC due to the blocked diffusion of LOC (Schjønning et al., 2003), but that the contribution of LOC to microbial respiration would gradually increases with increasing soil moisture content.
Materials and Methods
Study Site and Soil Sampling
Soil samples were collected from a warm-temperate forest in a semi-arid region of northern China (39°58′N, 115°25′E; 1,278 m elevation) in July 2017, where a native slow-growing oak (Quercus liaotungensis) was the dominant species. Mean annual precipitation and temperature in the forest were 638.8 mm and 6.5°C, respectively, and 74% of the precipitation occurred in summer (from June to August). The soil type was classified as Lixisols (Wang et al., 2016a). Three plots (30 m × 40 m) were randomly established at the study site. After removing the surface litter, we randomly collected more than 10 soil samples from 0 to 10 cm soil depth and combined these into a composite sample for each plot. The fresh soil samples were immediately sieved through a 2 mm diameter sieve to remove rocks, roots, and visible organic debris. These were then taken and transported to the laboratory and divided into three parts: one part was stored at 4°C before conducting the incubation experiments, one part was freeze-dried to measure soil microbial phospholipid fatty acid (PLFA), while the last part was air-dried and processed to measure the soil properties.
A soil-water suspension (1:2.5 v/v) was used to measure the soil pH with a pH meter (Myron L. Company, California, United States). Soil organic carbon (SOC) and total nitrogen (TN) content were measured using an elemental analyzer (Vario EL III, Elemental Analysis System GmbH, Germany). Soil texture was analyzed using a Mastersizer-2000 laser particle analyzer (Malvern Company, Worcestershire, England), and the soil was classified into sand (250–2,000 μm), silt (50–250 μm), and clay fractions (<50 μm). Soil microbial community composition was determined using PLFA biomarker analysis to obtain fungal, bacterial, and actinomycete content (Frostegård et al., 1993; Bååth and Anderson, 2003). The soil properties and microbial characteristics are shown in Table 1.

Table 1. Soil properties used in this study.
Incubation Experiment
Fresh soil (equivalent to 30 g dry soil) was weighed into a 150 mL plastic culture bottles (n = 3), and the headspace volume was approximately 130 mL after placing the soil sample. As the moisture content of fresh soil exceeded 20% WHC, we lightly air-dried the samples, treated with 10 and 20% WHC moisture, and then adjusted the moisture content. The soil samples were then pre-incubated in a 20°C constant temperature incubator for 7 days to activate the microbes and reduce the interference of the “pulse effect” of water on the decomposition of SOM (Li et al., 2022). Additionally, considering that the added LOC contained water would increase the soil moisture, the soil moisture content during pre-culture was less than the predetermined moisture content to ensure that the soil moisture reached 10, 20, 30, 40, 50, 60, 70, 80, and 90% moisture with the addition of LOC. Water loss in the sample bottles was measured daily and corrected by weight.
The automatic temperature control soil flux system (PRI-8800; PRE-ECO, Beijing, China) developed by He et al. (2013) was modified to measure the soil respiration rates. Specifically, this new device with a PICARRO isotope analyzer (G2131-i, PICARRO Inc., Sunnyvale, California, United States) enabled observations of δ13C and CO2 concentrations on a minute-scale. As shown in Supplementary Figure 1, the device consists of five parts: an analysis, sampling, control, temperature control, and calibration system. Specifically, the soil sample bottles were placed in a 16-hole electric water bath controlled by an automatic temperature regulator and held at 20°C. When the instrument began testing, a collection needle controlled by the control system was automatically inserted into the sample bottle and completely covered the mouth of the bottle, creating an enclosed space. During this time, the instrument was connected to the PICARRO G2131-i isotope analyzer through a control system to record the δ13C and CO2 concentrations every second. After measuring one sample, the collection needle was automatically pulled out, and the next sample was measured. During the measurements, each sample bottle was sealed with a preservative film to reduce water loss. Small holes were poked in the preservative film for ventilation, and the sampling needle was inserted through the holes to collect samples from the vials. The dynamics of the respiration rate (R) were measured at 3-min intervals for each sample, and each sample was measured 290 times over a 48-h period. In addition, after every 30 samples, the instrument was automatically calibrated using the calibration system.
We added glucose as a simple analog for LOC input. Specifically, three incubation bottles were removed from the instrument. Then, 1 mL 13C-uniformly labeled glucose (δ13C = 3,864‰) solution was added slowly and uniformly to the soil by pipetting the glucose onto the soil surface at a controlled and consistent rate. This was done to ensure uniform distribution of the solution in the soil (Li et al., 2022). The amount of LOC added to the soil was 0.4 mg C g soil, which was approximately 1% of the soil organic carbon content (3.9%). Considering the possible pulse effect of the deionized water contained in 1 mL of the glucose solution, a control treatment with 1 mL of deionized water was set up. The R-values were stable (Supplementary Figure 2), as demonstrated in our recent study (Li et al., 2022).
Labile Organic Carbon and Native Soil Organic Matter Derived CO2
As the soil used in this study is acidic and probably contains low carbonate amounts, the amount of carbonate decomposition in this soil environment should be minimal, because inorganic C is relatively stable. Therefore, we assumed that the released CO2 is derived directly from microbial respiration and did not consider the C emissions potentially caused by abiotic factors. Additionally, the fractionation during the biodegradation processes was negligible (Mary et al., 1992). The proportions of CO2 derived from LOC and SOM components were calculated using a mass balance model:
where fLOC is the fraction of total CO2 derived from glucose, δTotal is the measured isotopic value of the sample obtained at each measurement point, δSOM is the mean of the isotopic value of the control treatment, and δLOC is the isotopic value of the added glucose treatment.
Calculation of the Microbial Respiration Rate
The total soil microbial respiration rate (RTotal; μg C g–1 soil h–1) was calculated using Eq. 2:
where C is the slope of the CO2 concentration, V is the volume of the incubation bottle and gas tube, m is the soil dry weight (g), α is the conversion coefficient of the CO2 mass, and β is the conversion coefficient of time (He et al., 2013).
RLOC and RSOM are associated with LOC and native SOM decomposition, respectively. RLOC and RSOM were calculated using Eqs 3 and 4, respectively (Li et al., 2022):
Calculation of the CO2 Released
During the 48-h incubation, the accumulation of CO2 release (μg C g–1 soil) was calculated as follows:
where Rti and Rti+ 1 are the respiration rates at ti and ti + 1, respectively. The cumulative CO2 released from LOC, native SOM, and the total CO2 present was expressed as CO2–LOC, CO2–SOM, and CO2–Total, respectively.
Statistical Analysis
As shown in Figure 1, the corresponding parameters were defined to better determine the microbial response to the LOC input. Tukey’s HSD test was used to identify differences in Rmax, time for Rmax, absolute change in R, and accumulation of CO2 released among different soil moisture treatments. Curve fitting was used to explore the relationships between the soil moisture and the above parameters. Statistical analyses were performed using the SPSS software (SPSS for Windows, Version 13.0; Chicago, IL, United States). Graph plotting and curve fitting were performed using Origin software (version 8.5; Northampton, MA, United States). Differences were considered statistically significant at P < 0.05.
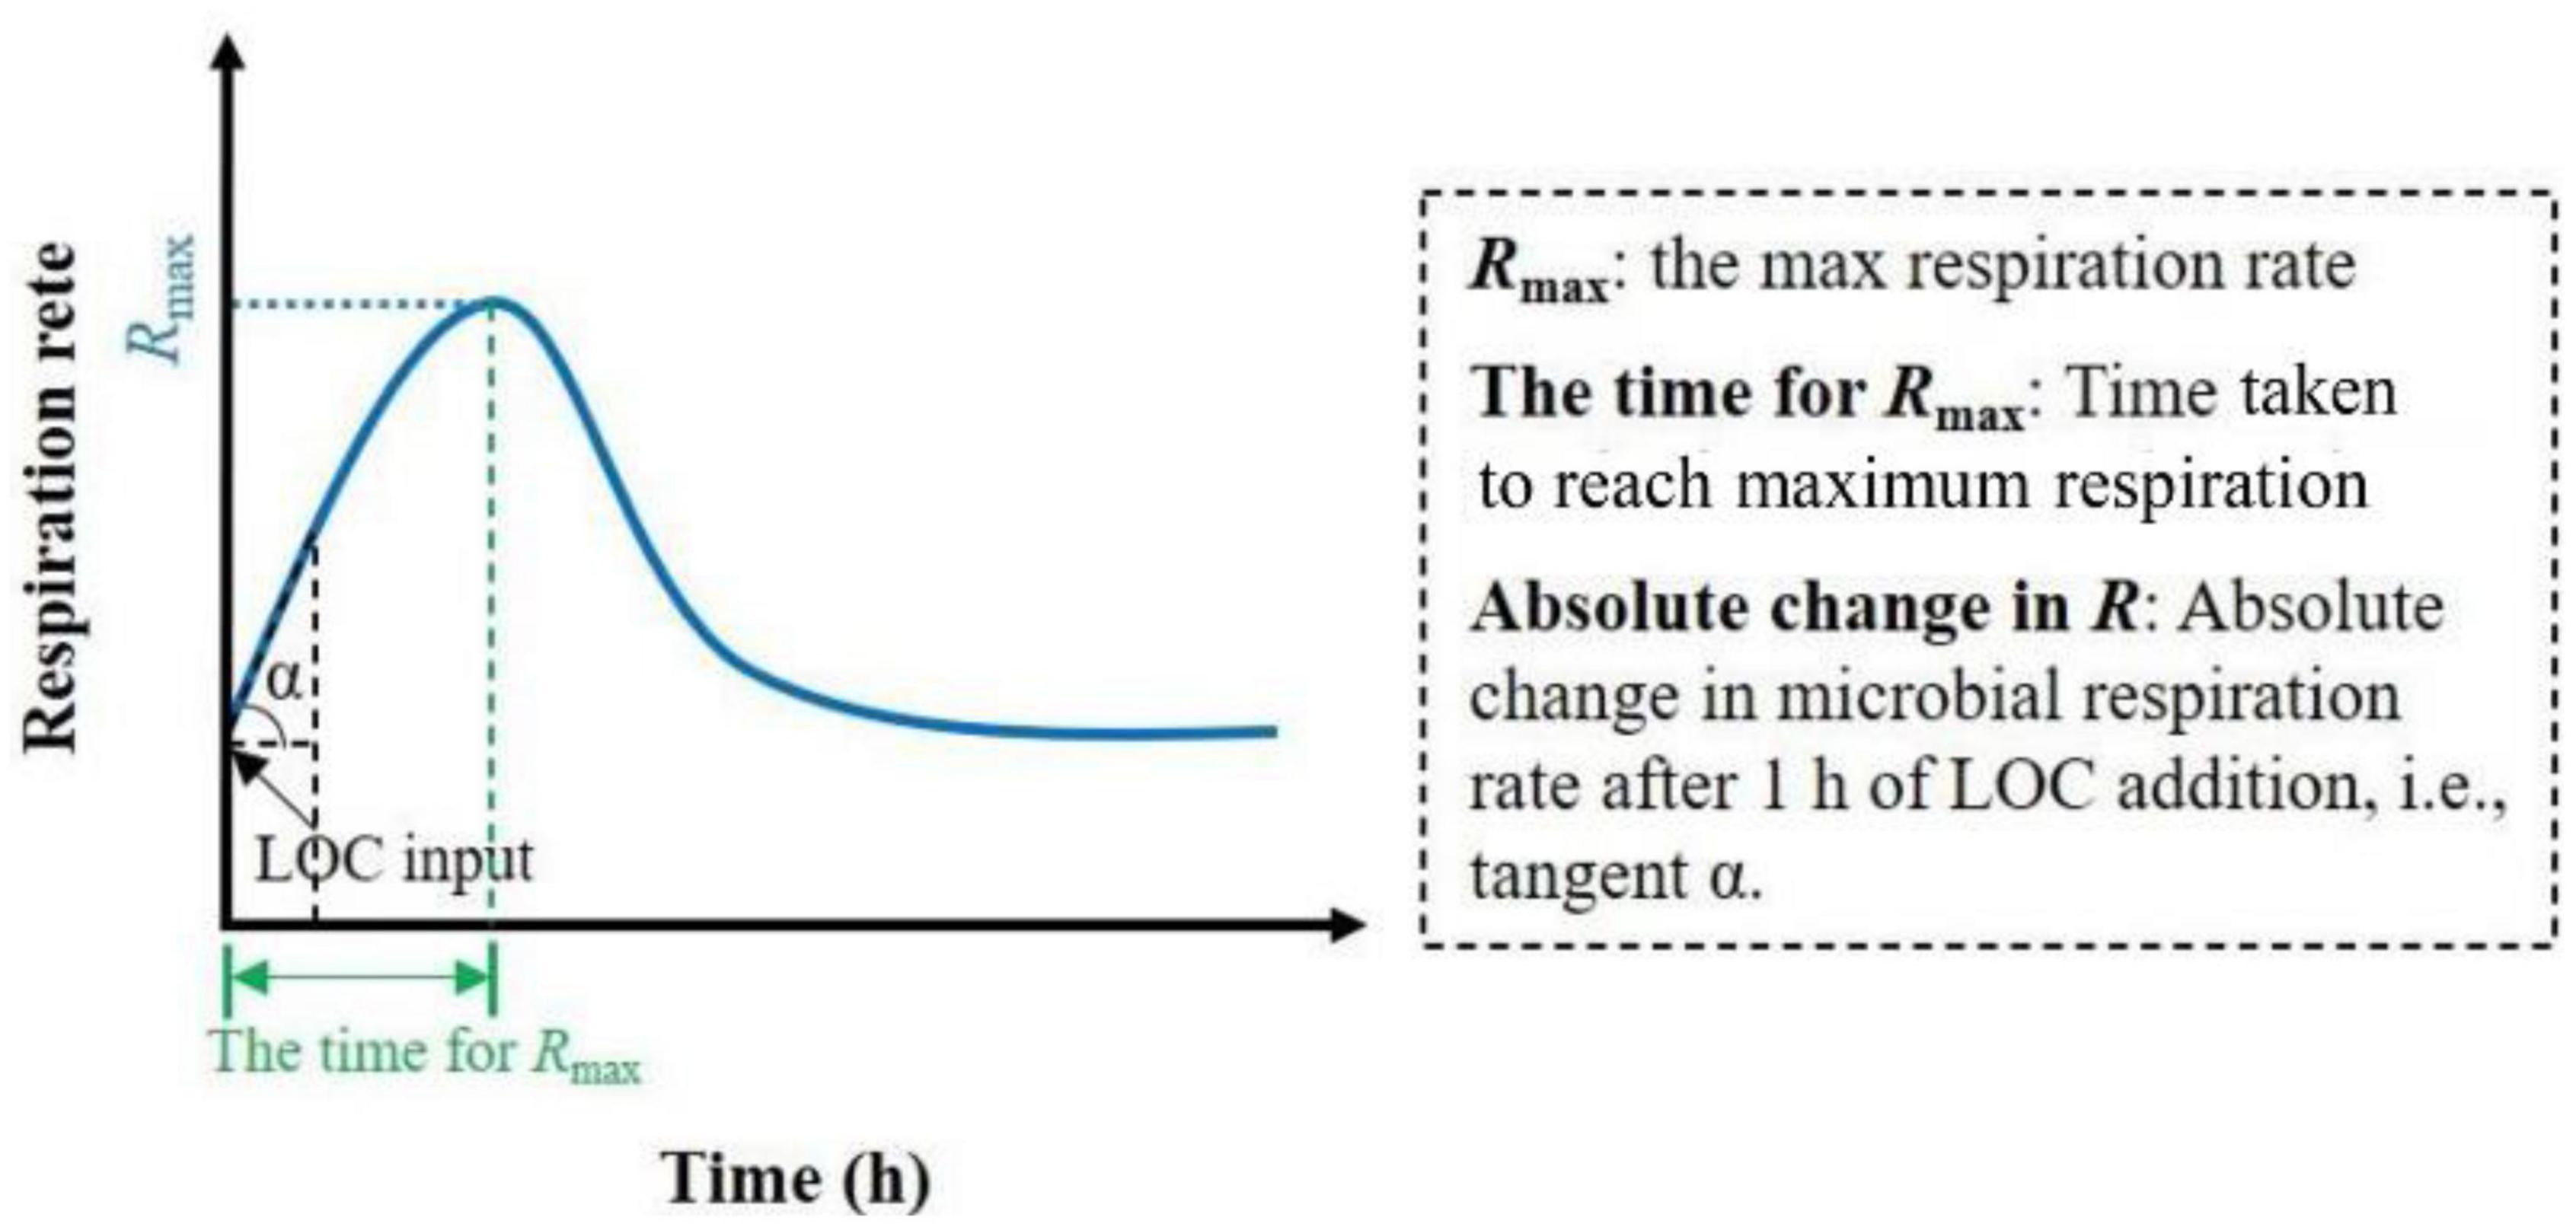
Figure 1. Schematic overview of soil microbial respiration rate after LOC input over time and the definition of relevant parameters.
Results
After the input of LOC, RLOC, and RTotal increased rapidly, peaked, declined rapidly, and eventually became relatively stable in all treatments (Figure 2). However, the RSOM of treatments with less than 50% WHC decreased, increased, and gradually stabilized, whereas that of treatments with more than 50% WHC first increased, decreased and then stabilized (Figure 2). Soil moisture content influenced the response of soil microorganisms to LOC addition. Specifically, Rmax from both LOC and native SOM first increased and then decreased with increasing soil moisture content; their values differed significantly among soil moisture treatments (Figures 3A–C; P < 0.01). There was no obvious pattern of variation between time taken to reach Rmax and soil moisture content (Figures 3D–F; P < 0.01). Moreover, the absolute changes in RLOC and RTotal under different moisture treatments first increased with increasing moisture content which reached a maximum level of approximately 60% WHC, and then decreased with increasing moisture content (Figures 3G,I; P < 0.01). The absolute changes in RSOM were less than 0 in moisture content levels less than 50% WHC and greater than 0 in moisture contents greater than 50% WHC (Figure 3H; P < 0.05).
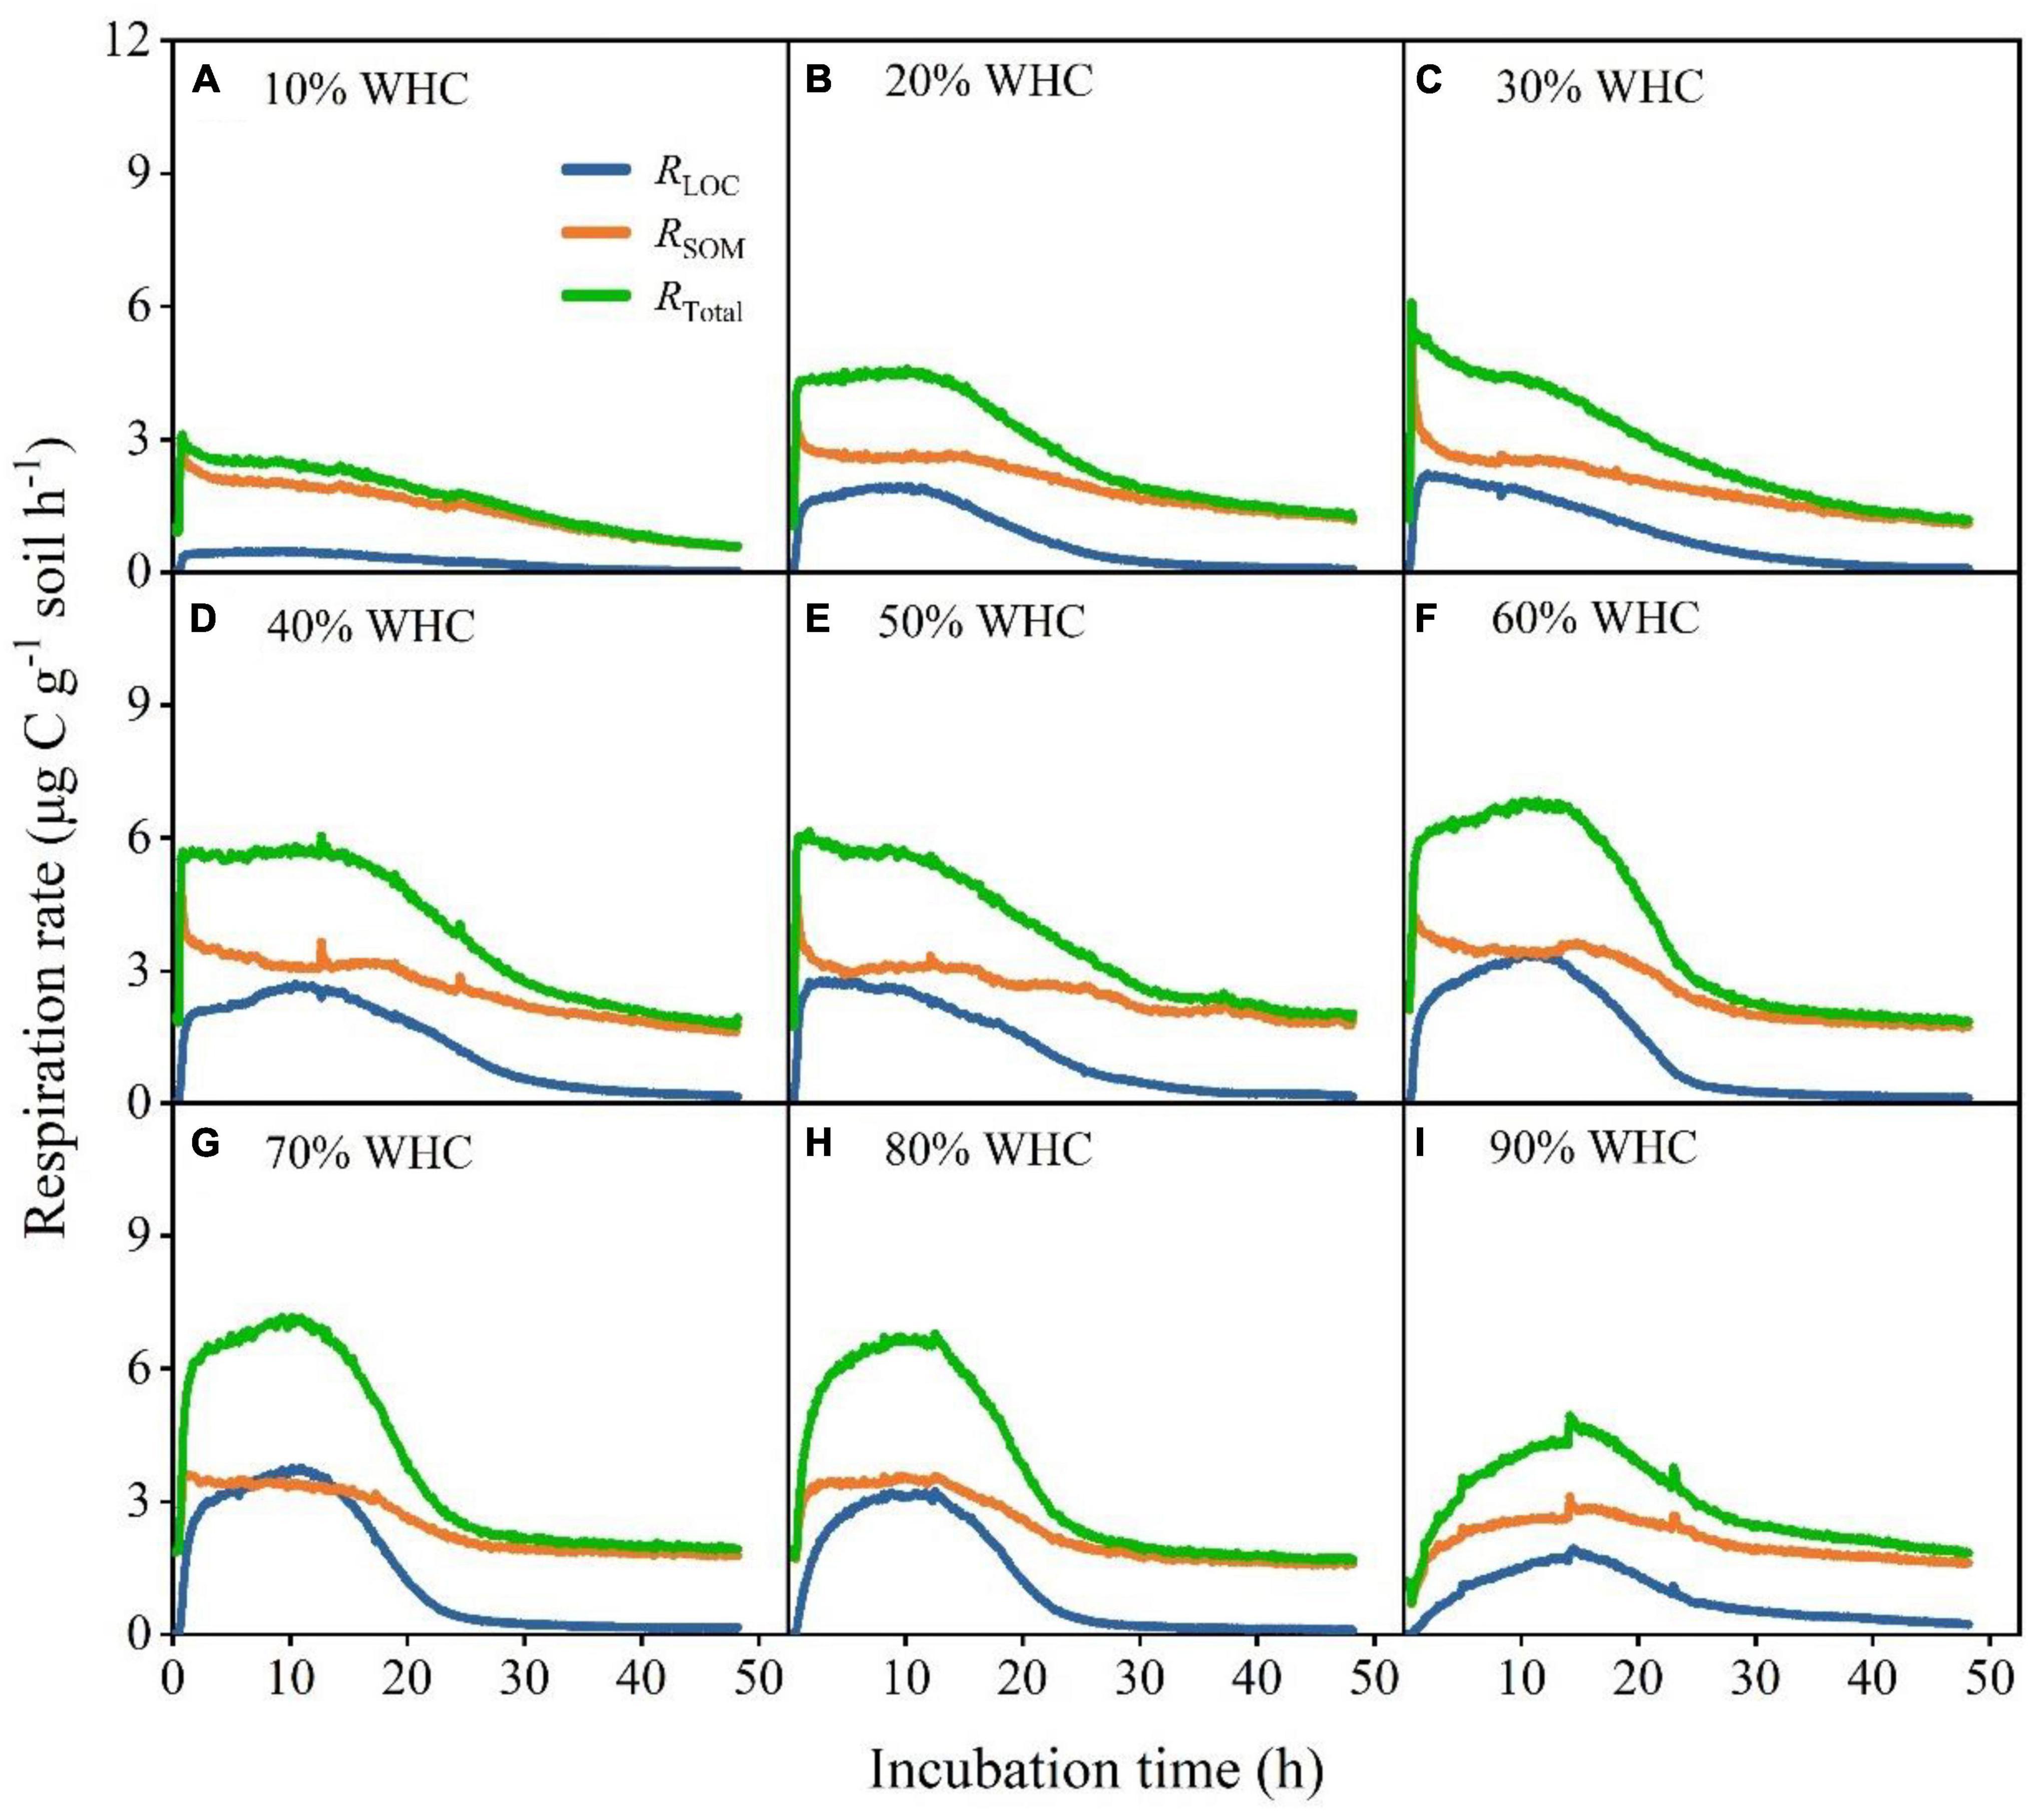
Figure 2. Changes in soil microbial respiration rates under different soil moisture treatments after LOC addition. (A–I) Soil microbial respiration rates from glucose (RLOC), soil organic matter (RSOM), and the total respiration rate (RTotal) under different temperature treatments and WHCs.
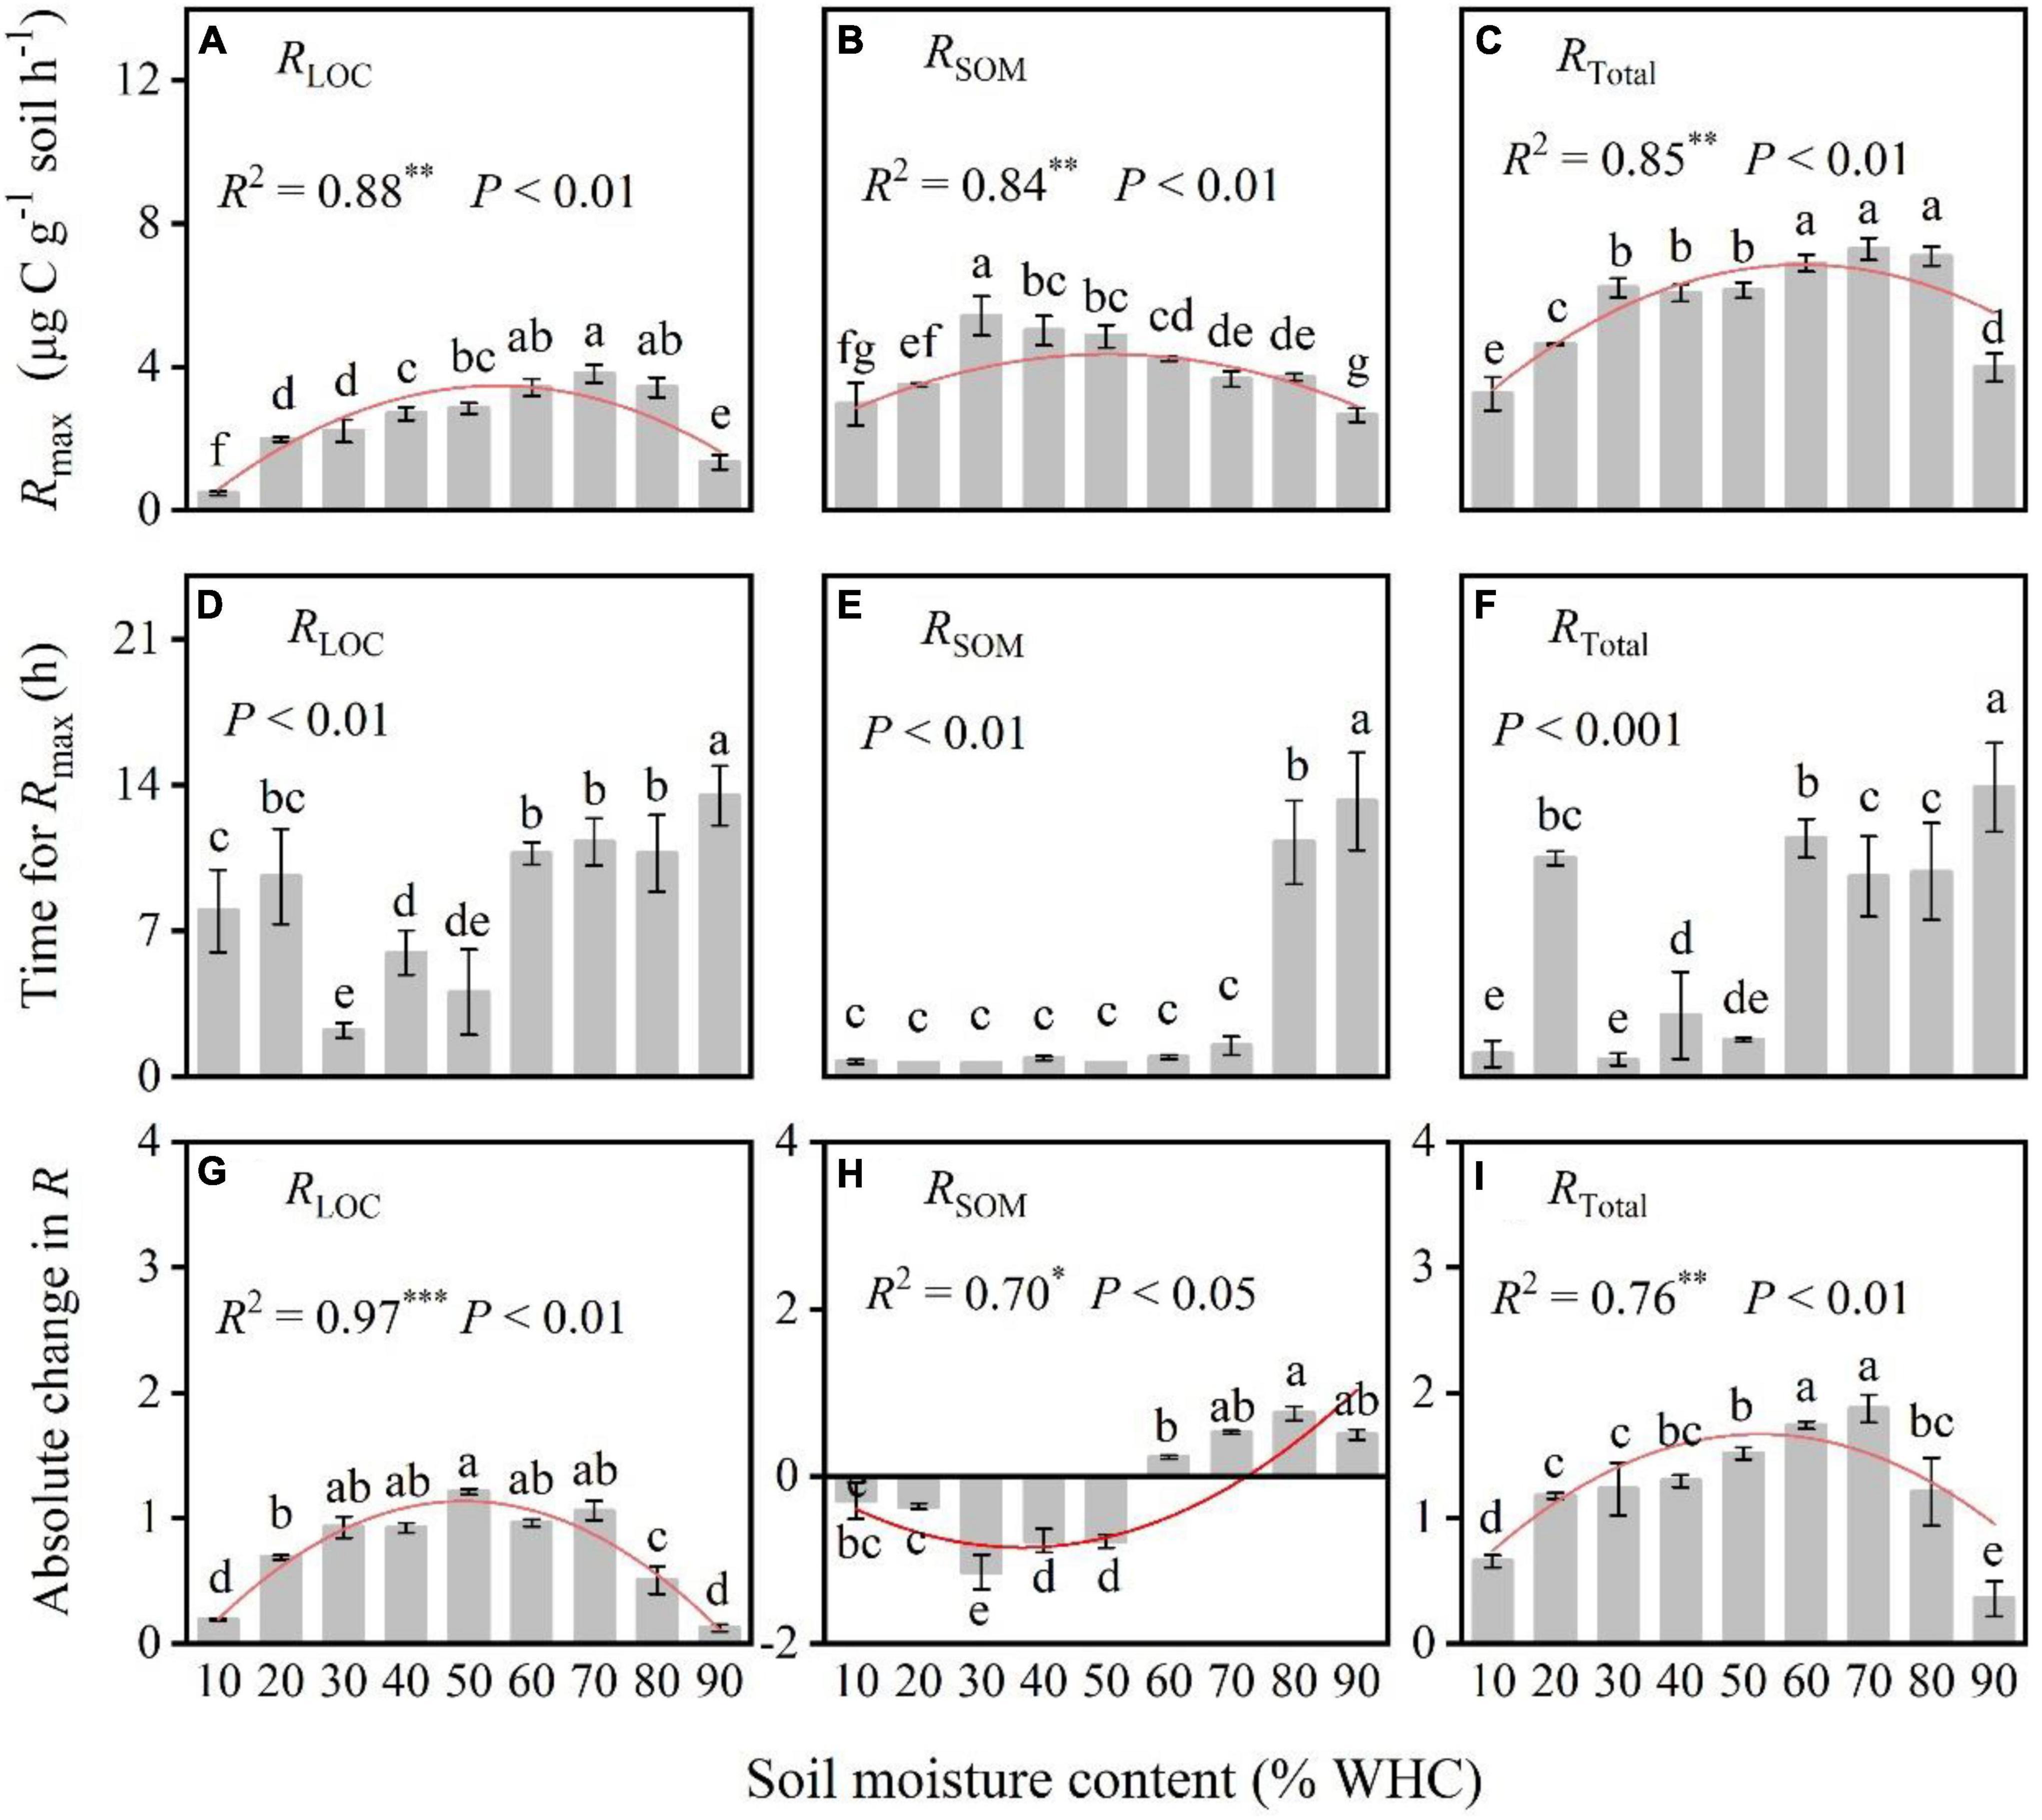
Figure 3. Comparison of the max microbial respiration rate (Rmax), time for Rmax, and absolute change in respiration rate under different soil moisture treatments. (A–C) The relationships between soil moisture content and max respiration rate. (D–F) The relationships between soil moisture content and the time taken to reach Rmax. (G–I) The relationships between soil moisture content and the absolute changes in respiration. P-values and different letters indicate significant differences among the different soil moisture content treatments (n = 3, mean ± SE). Red lines indicate the fitted curves of the corresponding parameters vs. soil moisture content. R2 and * denote the goodness of fit and significance level, and the *, **, and *** in the figures indicate statistical difference levels of P < 0.05, P < 0.01, and P < 0.001, respectively.
The RLOC/RSOM ratios at different moisture contents levels showed a sharp increase, decrease, and then finally reached 0. Samples with 70% WHC were accompanied by larger peaks (Figure 4). The accumulation of CO2 release, CO2–LOC, CO2–SOM, and CO2–Total, first increased and then decreased with increasing soil moisture content. The soil moisture content of approximately 60% WHC was optimal for CO2–LOC, CO2–SOM, and CO2–Total and differed significantly among the soil moisture treatments (Figures 5A–C; P < 0.01). The ratio of CO2–LOC/CO2–Total showed an increasing and then decreasing relationship with soil moisture; conversely, the ratio of CO2–SOM/CO2–Total exhibited a decreasing and then increasing relationship (Figures 5D,E). Additionally, the ratio of CO2–LOC/ CO2–SOM also revealed an increasing and then decreasing relationship with soil moisture (Figure 5F) and a soil moisture content of approximately 60% WHC. CO2–LOC/CO2–Total, CO2–SOM/CO2–Total, and CO2–LOC/ CO2–SOM reached their extreme values when the soil moisture content was approximately 60% WHC.
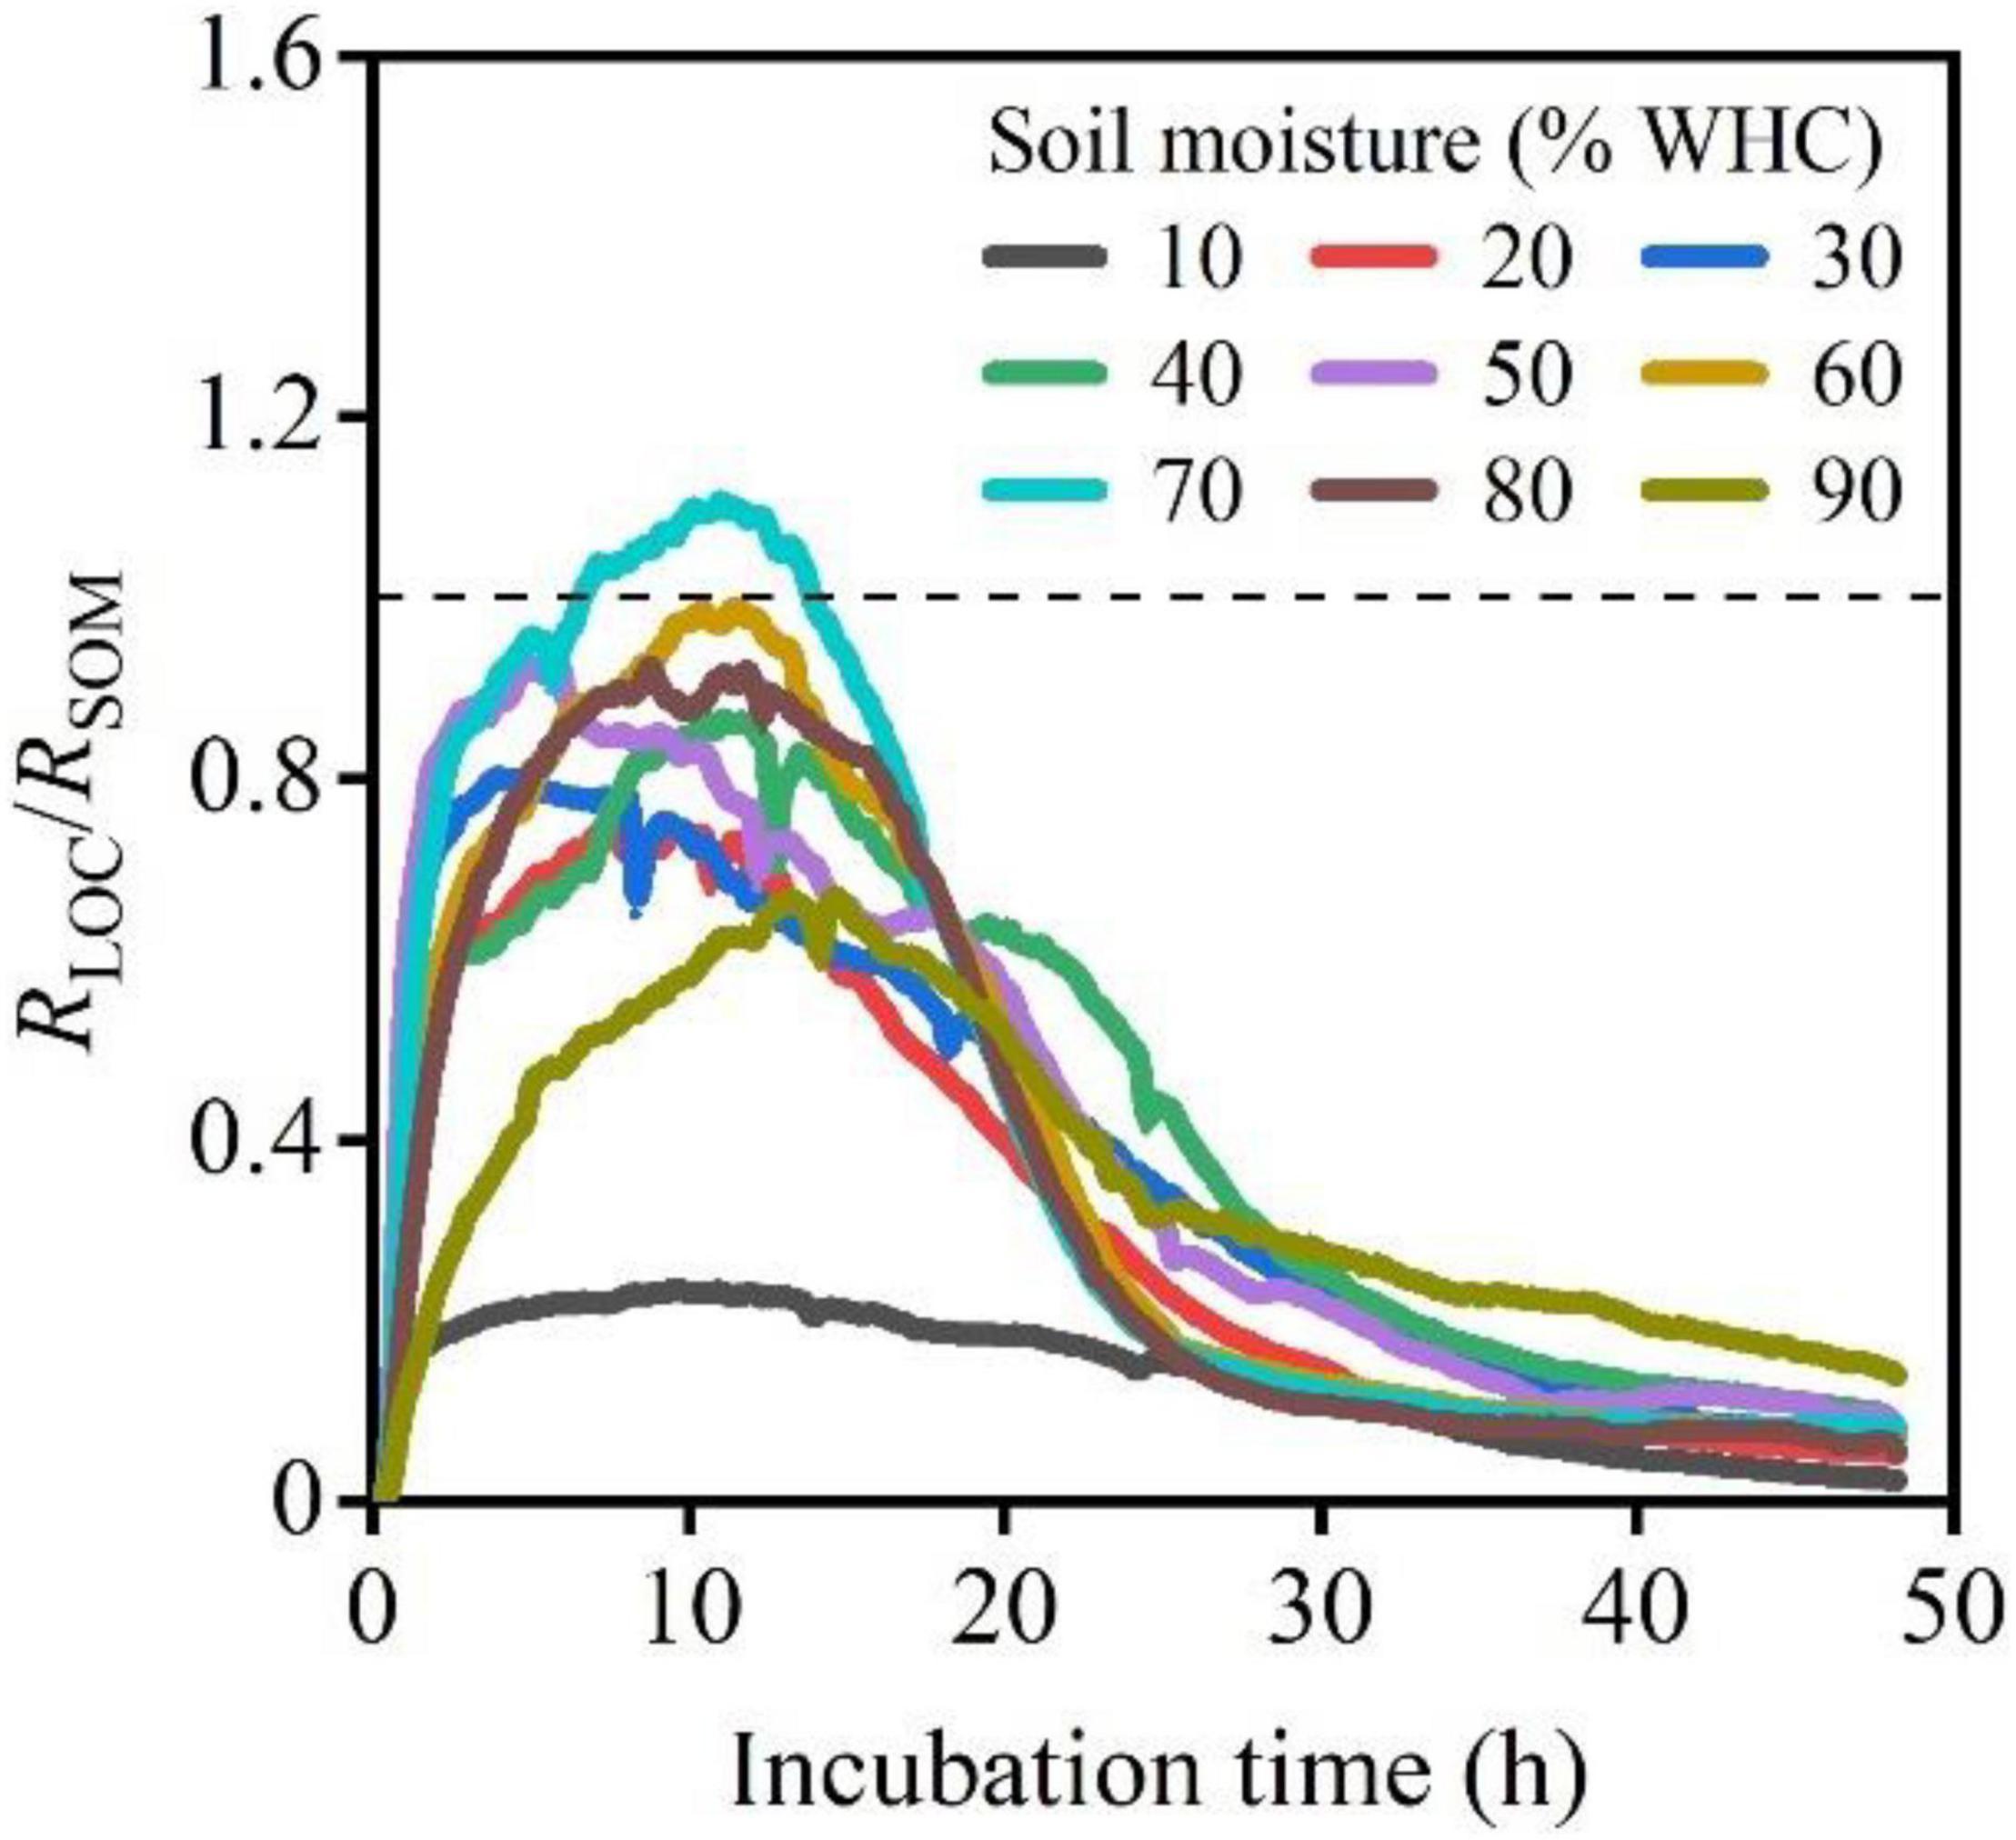
Figure 4. The ratio of RLOC/RSOM under different soil moisture treatments following LOC addition. The dotted line represents RLOC = RSOM, indicating equal respiration rates of microbes using LOC and native SOM.
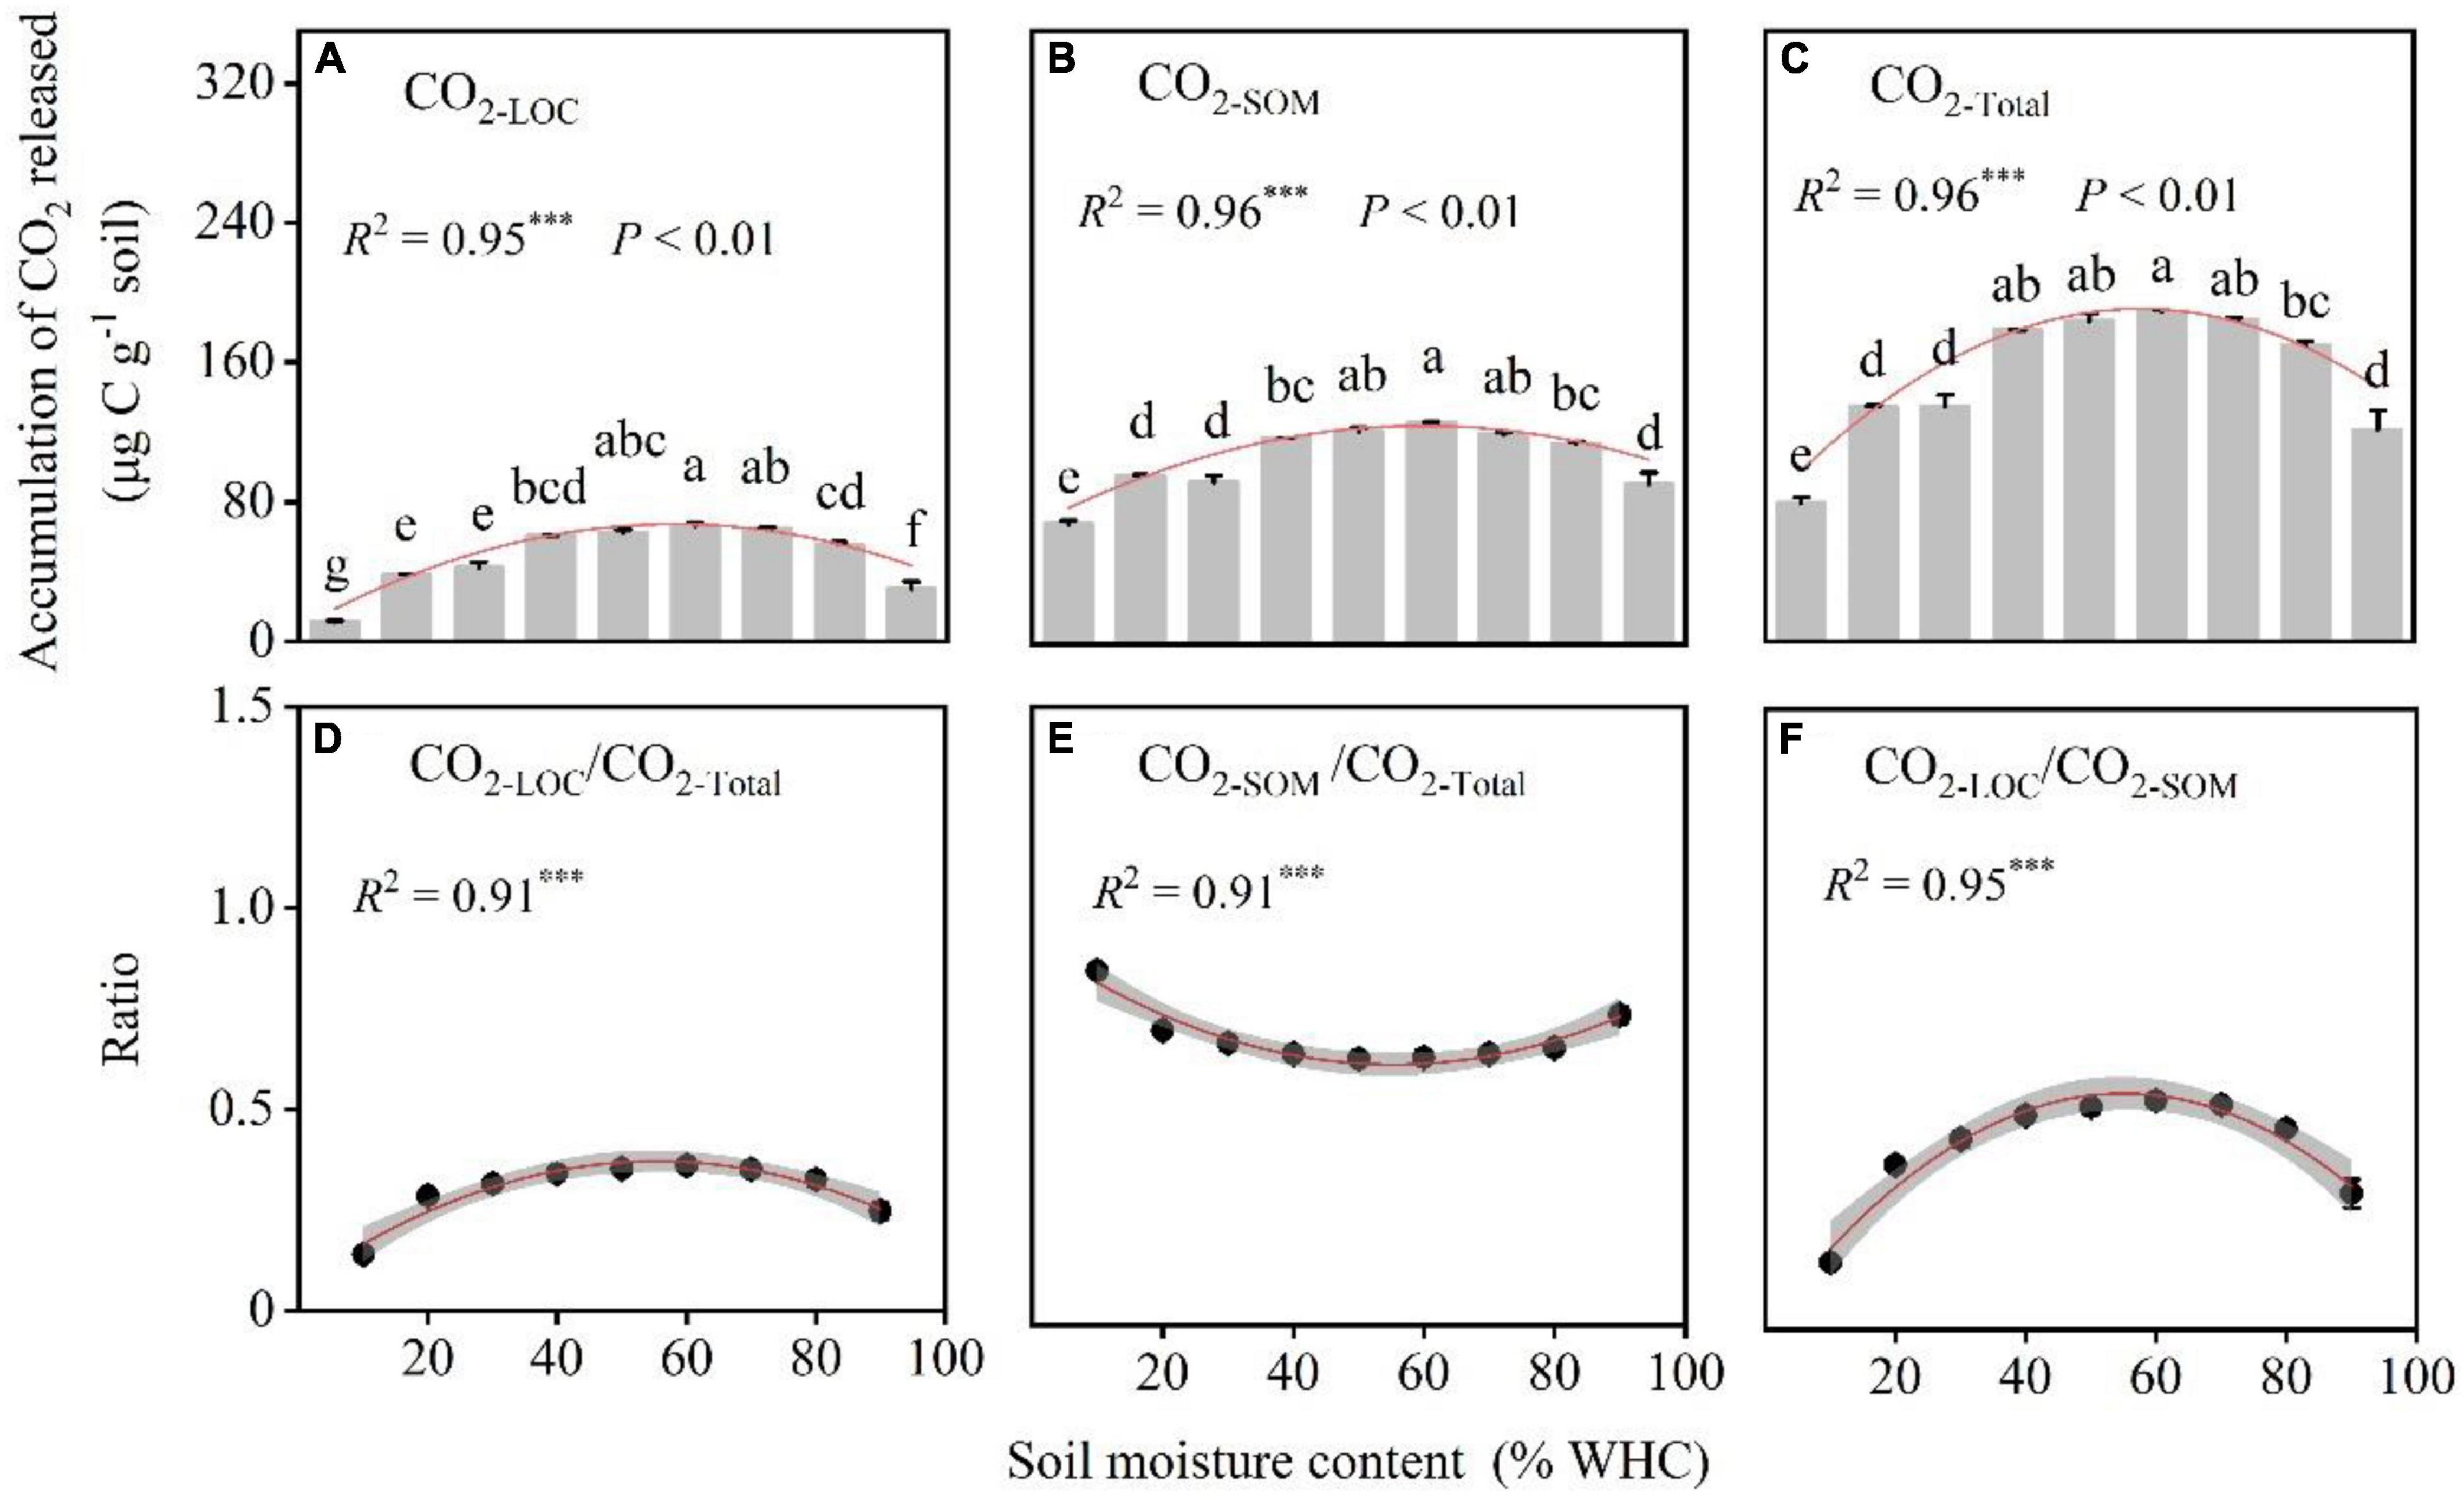
Figure 5. The accumulation of CO2 released and their ratios under different soil moisture treatments. (A–C) The cumulative CO2 emissions from LOC (CO2–LOC), soil organic matter (CO2–SOM), and the total respiration rate (CO2–Total). (D–F) Ratios of CO2 accumulation from different C sources. P-values and different letters indicate significant differences among the different soil moisture content treatments (n = 3, mean ± SE). Red lines indicate the fitted curves of the corresponding parameters vs. soil moisture content. R2 and *** denote the goodness of fit and significance level, and the *** indicate statistical difference level of P < 0.001.
Discussion
Soil Moisture Content Affects the Response of Soil Microbes to Labile Organic Carbon Addition and the Decomposition of Native Soil Organic Matter
Soil moisture content is an important environmental factor that affects microbial activity, the diffusion rate of gasses, and the availability and mobility of soluble SOM (Casals et al., 2000; Liu et al., 2009). Therefore, changes in soil moisture content have a profound impact on soil microbial respiration and SOM mineralization. In general, aerobic microbial respiration is optimal when the soil moisture content is approximately 60% WHC (Das et al., 2019). Here, we observed that extremely high or low moisture content was not conducive to microbial utilization of both LOC and native SOM. However, when soil moisture content was 50–70% of WHC, the responses of soil microbes to added LOC were stronger than those observed under other soil moisture treatments; that is, Rmax and CO2 released were greater. This finding supports our hypothesis, and consistent with findings in related studies (Geisseler et al., 2011; Wang et al., 2016b). We found that soil microbes with lower moisture content (<30%WHC) were less responsive to added LOC (lower Rmax and CO2–LOC). The movement of the glucose solution strongly depends on the soil moisture content (Casals et al., 2000; Liu et al., 2009). During low soil moisture treatment, the downward movement of the glucose solution was much slower than that during high soil moisture treatment. Microbes and their enzymes responsible for macromolecule degradation can be affected by moisture (Šnajdr et al., 2008; Geisseler et al., 2011); low soil moisture content affects the utilization of added LOC by microbes (Xue et al., 2017). That is because the diffusion of substrate may slow down due to lack of water which limits the substrate supply to soil microbes (Schjønning et al., 2003). Additionally, as the matrix potential of soil moisture decreases, soil microbes need to consume additional energy to maintain osmotic balance with their surroundings (Schimel et al., 2007). They also need to produce extracellular substances to buffer soil moisture changes and improve diffusivity (Or et al., 2007). Together, these factors lead to a reduced metabolic activity of soil microbes and a limited rate of reproduction and respiration. The utilization of LOC by microorganisms is also reduced when the moisture content is too high (>70% WHC). High moisture content creates an anaerobic environment (Hackl et al., 2005), which inhibits microbial activity and is unfavorable for the utilization of LOC by microorganisms.
Although we found that microbes preferred the utilization of LOC over native SOM, the simultaneous effect of LOC on microbial activity further promoted the decomposition of native SOM. This decomposition was also influenced by soil moisture. Generally, microbes are limited by the availability of C substrates (Cleveland et al., 2007), and LOC inputs increase substrate availability, relieve microbial C limitations, and increase microbial activity. This in turn promotes the decomposition of native SOM (Weedon et al., 2013). The microbial nitrogen (N)-mining hypothesis can be used to explain this phenomenon (Craine et al., 2007). Although the addition of LOC increases the availability of C substrate to microbes, microbial growth and metabolism will be limited by N, when microbes need to decompose more native SOM to obtain nutrients to meet growth requirements, and thus stimulate the decomposition of native SOM (Chen et al., 2014).
Our results show an interesting phenomenon: when the soil moisture was below 60% WHC, the absolute change in RSOM was less than 0 but that of RLOC was greater than 0, after 1 h of LOC input (Figures 3G,H). This implies the microbial preferential utilization of LOC and an inhibition of SOM decomposition (Li et al., 2022). Generally, microbial availability of organic matter depends on its chemical recalcitrance, mineral association, and accessibility to decomposers (Deng et al., 2020). Microbes are limited by the availability of C substrates, and thus soil microbes prefer to utilize labile substrate with a low molecular composition when compared to recalcitrant SOM, as less energy is required for mineralization (Deng et al., 2020). Additionally, it is difficult for microorganisms to access and decompose the dissolved soil C due to the microbial activity is limited by the low moisture content (Curiel Yuste et al., 2007). This allows them to preferentially use LOC, thereby inhibit microbial decomposition of native SOM (Blagodatskaya and Kuzyakov, 2008). In contrast to lower soil moisture content, optimal soil moisture content allows the cleavage and dispersion of soil aggregates, which leads to the dissolution and release of SOM encapsulated within the aggregates, thereby allowing more and better access to and decomposition of native SOM by soil microbes (Marín-Spiotta et al., 2014). In contrast, when soil moisture is saturated (>70% WHC), the oxidation-reduction decreases and anaerobic conditions limit the activity of soil microbial enzymes (Hackl et al., 2005). Furthermore, any soil moisture content above 70% WHC also reduces the diffusion of O2 and forms a flooded anaerobic environment. This environment inhibits the activity of aerobic microbes and various oxidative enzymes, thereby affecting the mineralization of C by microbes (Schjønning et al., 2003).
Soil Moisture Affects the Proportion of Labile Organic Carbon and Native Soil Organic Matter Used by Microbes
The proportions of LOC and native SOM utilized by microbes differed in response to different soil moisture content. This provides quantitative evidence that soil moisture content can affect how microbes utilize LOC and native SOM, through RLOC/RSOM, CO2–LOC/CO2–Total, CO2–SOM/CO2–Total, and CO2–LOC/CO2–SOM. Our study found that soils have greater CO2 fluxes under suitable moisture conditions (approximately 60% WHC). However, this is inconsistent with our alternative hypothesis that microbes would utilize more LOC under higher moisture conditions, as we found that microbes have different strategies for utilizing LOC and native SOM under different moisture conditions. We found that the relative proportions of the metabolism of soil microbes using the two C sources to total respiration were different under different moisture conditions (Figure 5). Under lower moisture conditions (<30%WHC), more native SOM was used for microbial respiration. This may occur because low moisture conditions are not conducive to the diffusion of LOC; thus, microbes predominantly use native SOM (Davidson et al., 2010). Furthermore, the decrease in soil water potentially may stimulate microbial responses to water stress. This stimulation results in an increase in soil microbial C-use efficiency (Herron et al., 2009), which can lead to lower LOC for respiration. However, as soil water content increased, more microbes had access to LOC, resulting in more LOC for respiration. Thus, values of CO2–LOC/CO2–Total increased and those of CO2–SOM/CO2–Total decreased. Moreover, when the soil moisture content was too high (>60% WHC), the proportion of native SOM utilization by microbes gradually increased again (Figure 5B). This increase occurs because moisture content affects the microbial C use efficiency. Many studies have found that the native SOM mineralization rate is highest under higher moisture content conditions after LOC input, which is consistent with our results (Guenet et al., 2013; Miao et al., 2016). When the water content is too high, it contributes to the disruption of the soil aggregate structure and SOM leaching and increases the contact area between native SOM and decomposers, thus promoting native SOM mineralization (Marín-Spiotta et al., 2014). Moreover, it is possible that LOC input resulted in local energy excesses and nutrient deficits caused by the highly heterogeneous SOM forming many relatively independent microhabitats, Meanwhile, soil flooding resulted in a homogeneous mixing of decomposing substrates and adequate utilization of LOC, which promoted the utilization of native SOM by microbes (Guenet et al., 2013).
Here, we provide quantitative evidence that soil moisture content can influence the way microbes utilize LOC and native SOM and propose potential mechanisms of influence (Figure 6). However, microbial taxa determine the composition and functional properties of microbial communities, which organize and structure their responses to resource availability and changes in environmental conditions and play a key role in the C cycle (Banerjee et al., 2018). Theoretically, soil microbes are divided into r- and K-strategists according to their biological characteristics and utilization of resources. Among them, r-strategists (mainly bacteria) grow faster and generally use LOC, whereas K-strategists grow slowly and can use more resistant organic matter (Fontaine et al., 2003). Therefore, future studies should examine the dynamics of soil microbes. This will help us to fundamentally understand the microbial strategies for the utilization of LOC and native SOM under different moisture conditions.
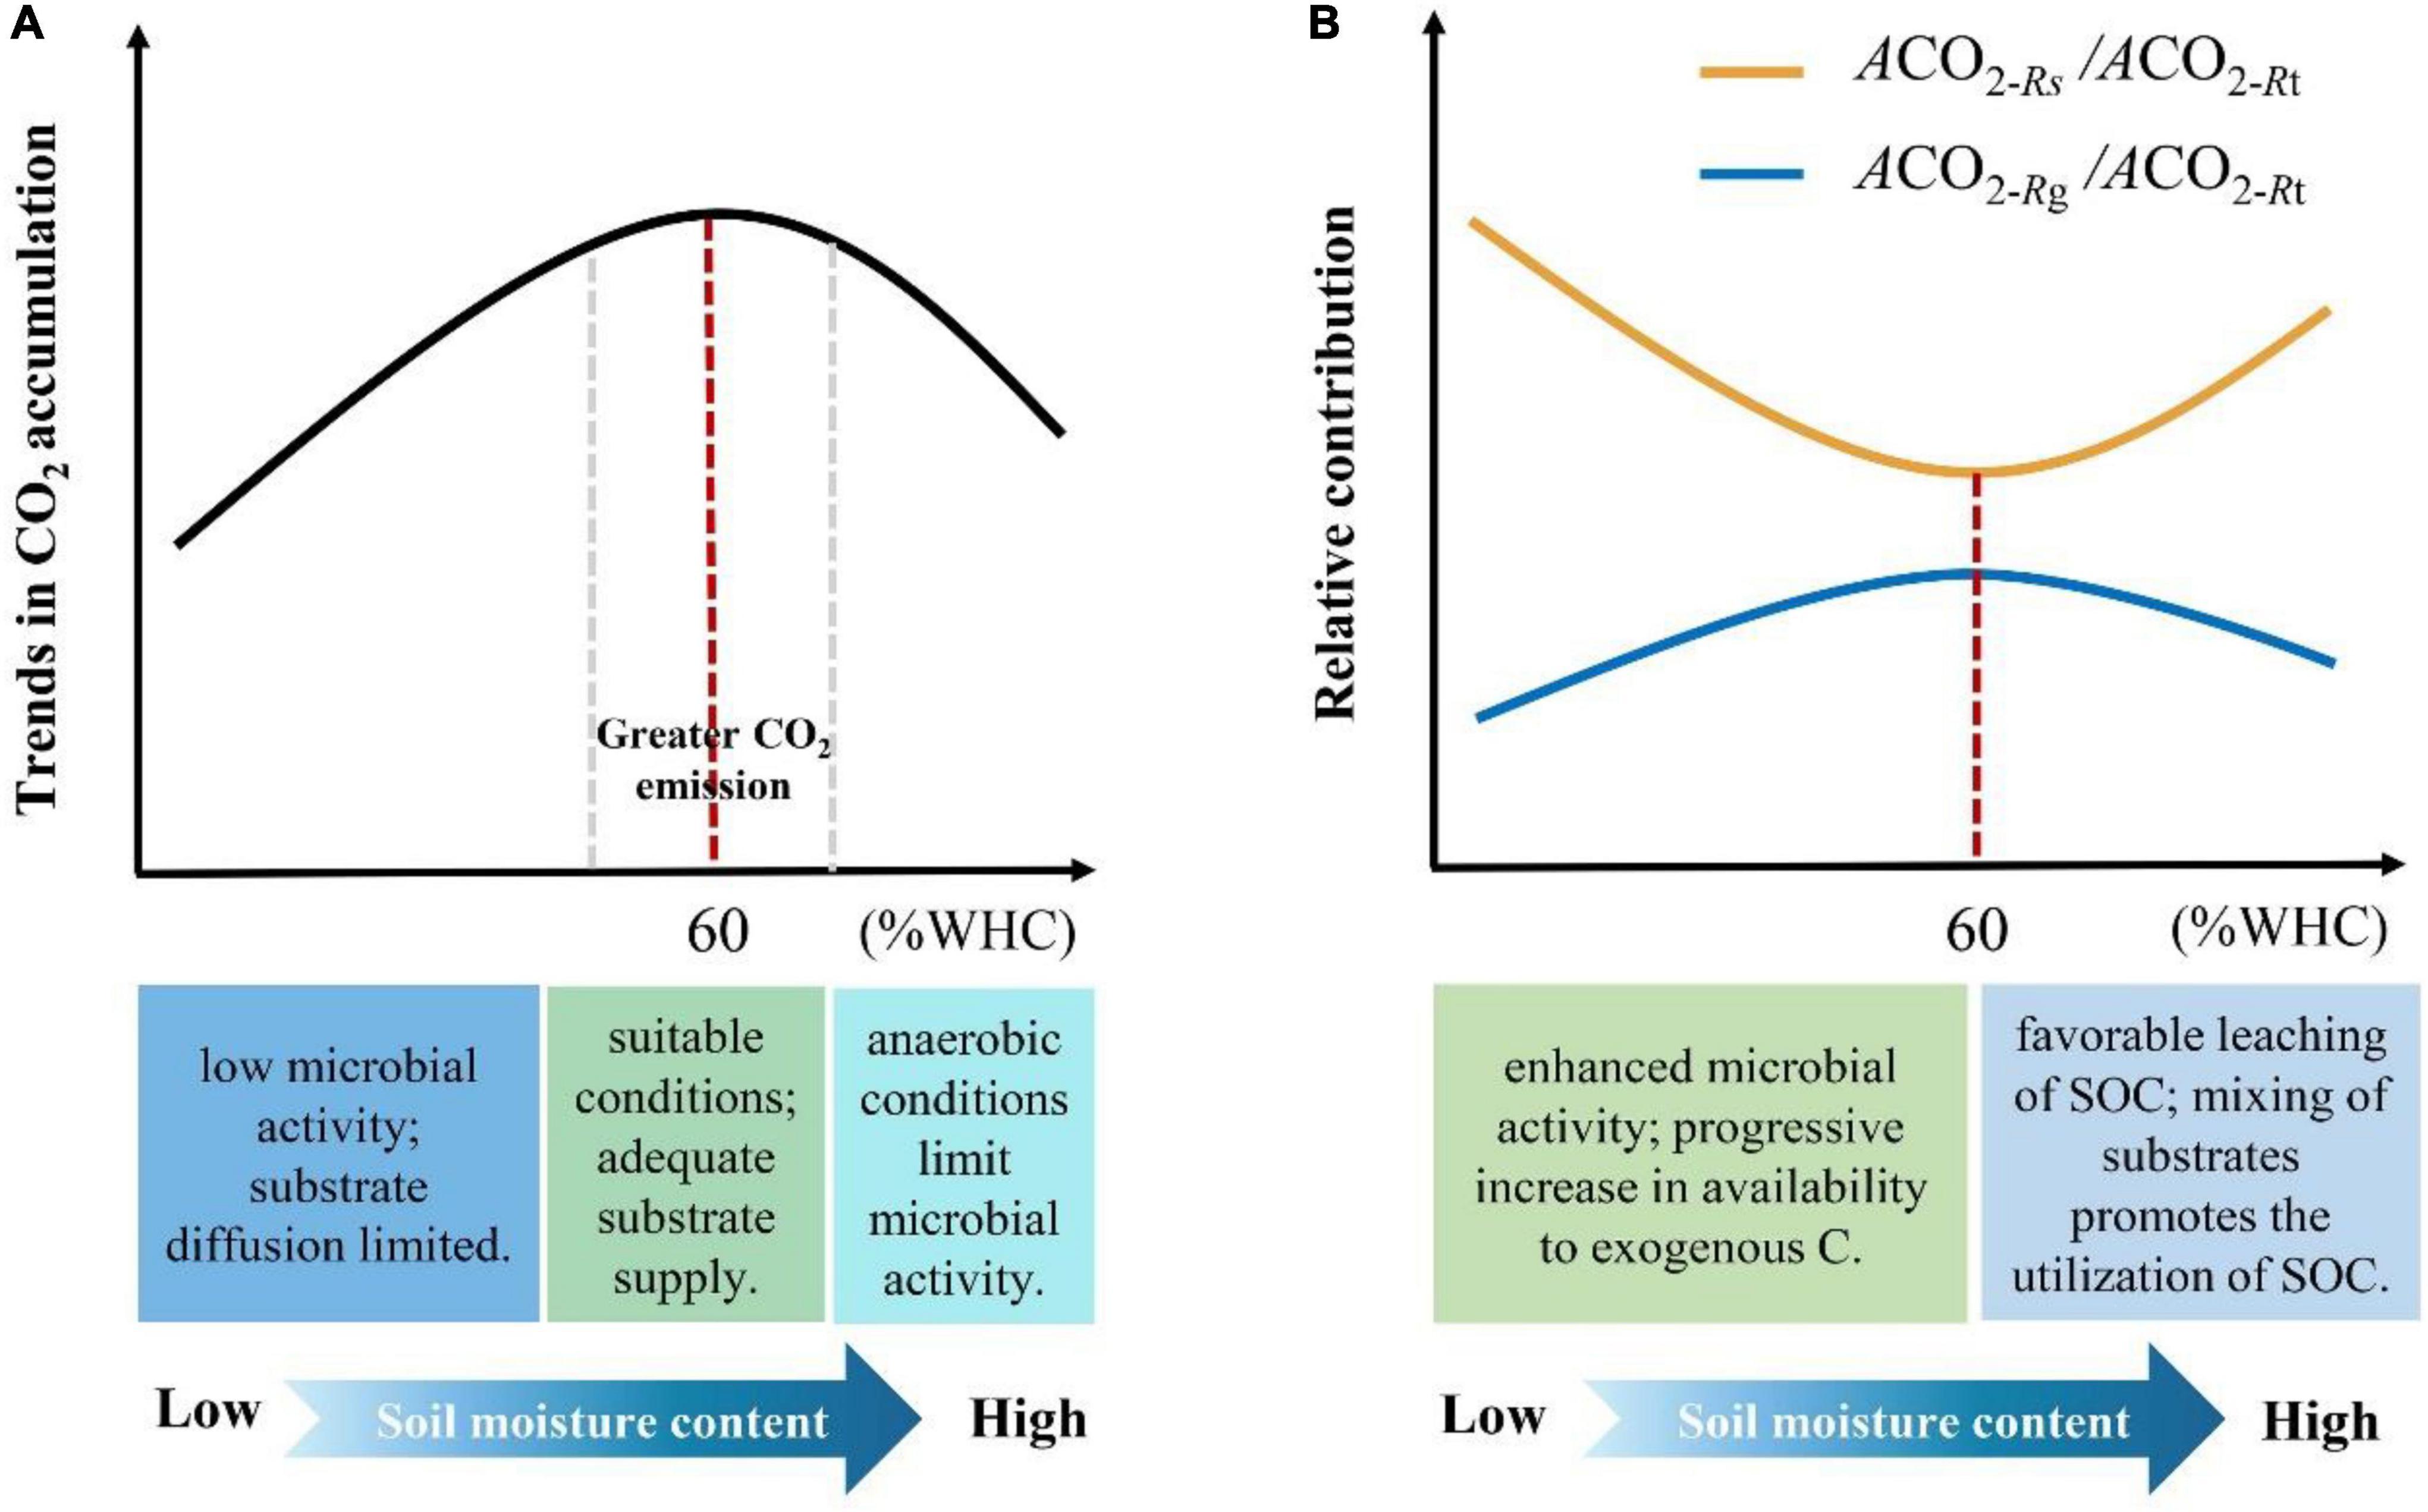
Figure 6. Mechanisms of soil moisture content affecting microbial utilization of LOC and native SOM. (A) The black line indicates the trend of cumulative CO2 emissions under different moisture content treatments, and the red-dash line indicates the maximum CO2 emissions when the soil moisture content is 60% WHC. The range of the two gray-dash lines indicates the moisture content interval with larger CO2 emissions. The three blocks below the X-axis indicate the causes of the difference in soil CO2 emissions under different moisture conditions. (B) The yellow and blue lines indicate the trends in the relative contribution of microbial utilization of native SOC and LOC to total soil respiration under different moisture treatments, respectively. The red dashed line indicates that 60% WHC is the threshold that causes the change in the proportion of relative contribution. The two blocks below the X-axis indicate the causes of this change.
Conclusion
In this study, we demonstrated that soil moisture content influences the microbial response to LOC and native SOM. We show that a soil moisture content of 60% WHC is the optimal and allows for changes in the proportion of LOC and native SOM utilized by microbes. Additionally, we found that when the soil moisture content was below 60% WHC, the proportion of microbial respiration derived from LOC increased with increasing soil moisture content. In contrast, this proportion gradually decreased when the soil moisture content was above 60% WHC. Moreover, under suitable moisture conditions (approximately 60% WHC), the soil exhibited greater CO2 emissions. Overall, our results emphasized that microbial utilization of LOC and native SOM was significantly affected by soil moisture content. These findings may be important considering climate induced changes in precipitation and increased C inputs.
Data Availability Statement
The raw data supporting the conclusions of this article will be made available by the authors, without undue reservation.
Author Contributions
NH and JZ designed the research. HB and SZ conducted the study and analyzed the data. CL drafted the manuscript with input from HB and JZ. ML and LX reviewed and revised the manuscript. All authors contributed to revisions.
Funding
This work was partially supported by the Chinese Academy of Sciences Strategic Priority Research Program (XDA19020302), the Natural Science Foundation of China (31770655, 31800368, and 31872690), and the Youth Innovation Research Project from Key Laboratory of Ecosystem Network Observation and Modeling, CAS. JZ acknowledged support from the Research Project of Institute of Geographic Sciences and Natural Resources Research, Chinese Academy of Sciences (E0V00101YZ).
Conflict of Interest
The authors declare that the research was conducted in the absence of any commercial or financial relationships that could be construed as a potential conflict of interest.
Publisher’s Note
All claims expressed in this article are solely those of the authors and do not necessarily represent those of their affiliated organizations, or those of the publisher, the editors and the reviewers. Any product that may be evaluated in this article, or claim that may be made by its manufacturer, is not guaranteed or endorsed by the publisher.
Supplementary Material
The Supplementary Material for this article can be found online at: https://www.frontiersin.org/articles/10.3389/fevo.2022.857185/full#supplementary-material
Abbreviations
RTotal, Total soil respiration rate; RLOC, Soil respiration rate from glucose; RSOM, Soil respiration rate from native soil SOM; Rmax, the maximum of respiration rate; CO2–Total, total accumulation of CO2 released; CO2–LOC, accumulation of CO2 released from LOC; CO2–SOM, accumulation of CO2 released from native SOM.
References
Austin, A. T., Yahdjian, L., Stark, J. M., Belnap, J., Porporato, A., Norton, U., et al. (2004). Water pulses and biogeochemical cycles in arid and semiarid ecosystems. Oecologia 141, 221–235. doi: 10.1007/s00442-004-1519-1
Bååth, E., and Anderson, T. H. (2003). Comparison of soil fungal/bacterial ratios in a pH gradient using physiological and PLFA-based techniques. Soil Biol. Biochem. 35, 955–963. doi: 10.1016/s0038-0717(03)00154-8
Banerjee, S., Schlaeppi, K., and van der Heijden, M. G. A. (2018). Keystone taxa as drivers of microbiome structure and functioning. Nat. Rev. Microbiol. 16, 567–576. doi: 10.1038/s41579-018-0024-1
Blagodatskaya, Å, and Kuzyakov, Y. (2008). Mechanisms of real and apparent priming effects and their dependence on soil microbial biomass and community structure: critical review. Biol. Fertil. Soils 45, 115–131. doi: 10.1007/s00374-008-0334-y
Brockett, B. F. T., Prescott, C. E., and Grayston, S. J. (2012). Soil moisture is the major factor influencing microbial community structure and enzyme activities across seven biogeoclimatic zones in western Canada. Soil Biol. Biochem. 44, 9–20. doi: 10.1016/j.soilbio.2011.09.003
Butterly, C. R., Bünemann, E. K., McNeill, A. M., Baldock, J. A., and Marschner, P. (2009). Carbon pulses but not phosphorus pulses are related to decreases in microbial biomass during repeated drying and rewetting of soils. Soil Biol. Biochem. 41, 1406–1416. doi: 10.1016/j.soilbio.2009.03.018
Casals, P., Romanyà, J., Cortina, J., Bottner, P., Couteaux, M.-M., and Vallejo, V. R. (2000). CO2 efflux from a mediterranean semi-arid forest soil. I. Seasonality and effects of stoniness. Biogeochemistry 48, 261–281. doi: 10.1023/A:1006289905991
Chen, R., Senbayram, M., Blagodatsky, S., Myachina, O., Dittert, K., Lin, X., et al. (2014). Soil C and N availability determine the priming effect: microbial N mining and stoichiometric decomposition theories. Glob. Chang. Biol. 20, 2356–2367. doi: 10.1111/gcb.12475
Cleveland, C. C., Nemergut, D. R., Schmidt, S. K., and Townsend, A. R. (2007). Increases in soil respiration following labile carbon additions linked to rapid shifts in soil microbial community composition. Biogeochemistry 82, 229–240. doi: 10.1007/s10533-006-9065-z
Craine, J. M., Morrow, C., and Fierer, N. (2007). Microbial nitrogen limitation increases decomposition. Ecology 88, 2105–2113. doi: 10.1890/06-1847.1
Curiel Yuste, J., Baldocchi, D. D., Gershenson, A., Goldstein, A., Misson, L., and Wong, S. (2007). Microbial soil respiration and its dependency on carbon inputs, soil temperature and moisture. Glob. Chang. Biol. 13, 2018–2035. doi: 10.1111/j.1365-2486.2007.01415.x
Das, S., Richards, B. K., Hanley, K. L., Krounbi, L., Walter, M. F., Walter, M. T., et al. (2019). Lower mineralizability of soil carbon with higher legacy soil moisture. Soil Biol. Biochem. 130, 94–104. doi: 10.1016/j.soilbio.2018.12.006
Davidson, E. A., and Janssens, I. A. (2006). Temperature sensitivity of soil carbon decomposition and feedbacks to climate change. Nature 440, 165–173. doi: 10.1038/nature04514
Davidson, E. A., Belk, E., and Boone, R. D. (2010). Soil water content and temperature as independent or confounded factors controlling soil respiration in a temperate mixed hardwood forest. Glob. Chang. Biol. 4, 217–227. doi: 10.1046/j.1365-2486.1998.00128.x
Deng, S., Zheng, X., Chen, X., Zheng, S., He, X., Ge, T., et al. (2020). Divergent mineralization of hydrophilic and hydrophobic organic substrates and their priming effect in soils depending on their preferential utilization by bacteria and fungi. Biol. Fertil. Soils 57, 65–76. doi: 10.1007/s00374-020-01503-7
Dore, M. H. (2005). Climate change and changes in global precipitation patterns: what do we know? Environ. Int. 31, 1167–1181. doi: 10.1016/j.envint.2005.03.004
Fontaine, S., Mariotti, A., and Abbadie, L. (2003). The priming effect of organic matter: a question of microbial competition? Soil Biol. Biochem. 35, 837–843. doi: 10.1016/s0038-0717(03)00123-8
Frostegård, Å, Bååth, E., and Tunlio, A. (1993). Shifts in the structure of soil microbial communities in limed forests as revealed by phospholipid fatty acid analysis. Soil Biol. Biochem. 25, 723–730. doi: 10.1016/0038-0717(93)90113-P
Geisseler, D., Horwath, W. R., and Scow, K. M. (2011). Soil moisture and plant residue addition interact in their effect on extracellular enzyme activity. Pedobiologia 54, 71–78. doi: 10.1016/j.pedobi.2010.10.001
Guenet, B., Danger, M., Harrault, L., Allard, B., Jauset-Alcala, M., Bardoux, G., et al. (2013). Fast mineralization of land-born C in inland waters: first experimental evidences of aquatic priming effect. Hydrobiologia 721, 35–44. doi: 10.1007/s10750-013-1635-1
Hackl, E., Pfeffer, M., Donat, C., Bachmann, G., and Zechmeisterboltenstern, S. (2005). Composition of the microbial communities in the mineral soil under different types of natural forest. Soil Biol. Biochem. 37, 661–671. doi: 10.1016/j.soilbio.2004.08.023
He, N., Wang, R., Gao, Y., Dai, J., Wen, X., and Yu, G. (2013). Changes in the temperature sensitivity of SOM decomposition with grassland succession: implications for soil C sequestration. Ecol. Evol. 3, 5045–5054. doi: 10.1002/ece3.881
Herron, P. M., Stark, J. M., Holt, C., Hooker, T., and Cardon, Z. G. (2009). Microbial growth efficiencies across a soil moisture gradient assessed using 13C-acetic acid vapor and 15N-ammonia gas. Soil Biol. Biochem. 41, 1262–1269. doi: 10.1016/j.soilbio.2009.03.010
Jiang, Z. X., Bian, H. F., Xu, L., Li, M. X., and He, N. P. (2021). Pulse Effect of Precipitation: Spatial Patterns and Mechanisms of Soil Carbon Emissions. Front. Ecol. Evol. 9:673310. doi: 10.3389/fevo.2021.673310
Kim, D. G., Vargas, R., Bond-Lamberty, B., and Turetsky, M. R. (2012). Effects of soil rewetting and thawing on soil gas fluxes: a review of current literature and suggestions for future research. Biogeosciences 9, 2459–2483. doi: 10.5194/bg-9-2459-2012
Kool, D. M., Dolfing, J., Wrage, N., and Van Groenigen, J. W. (2011). Nitrifier denitrification as a distinct and significant source of nitrous oxide from soil. Soil Biol. Biochem. 43, 174–178. doi: 10.1016/j.soilbio.2010.09.030
Kuzyakov, Y. (2010). Priming effects: interactions between living and dead organic matter. Soil Biol. Biochem. 42, 1363–1371. doi: 10.1016/j.soilbio.2010.04.003
Kuzyakov, Y., Friedel, J. K., and Stahr, K. (2000). Review of mechanisms and quantification of priming effects. Soil Biol. Biochem. 32, 1485–1498. doi: 10.1016/S0038-0717(00)00084-5
Li, C., Liu, L., Zheng, L., Yu, Y., Mushinski, R. M., Zhou, Y., et al. (2021). Greater soil water and nitrogen availability increase C : N ratios of root exudates in a temperate steppe. Soil Biol. Biochem. 161:108384. doi: 10.1016/j.soilbio.2021.108384
Li, C., Xiao, C. W., Guenet, B., Li, M. X., Xu, L., and He, N. P. (2022). Short-term effects of labile organic C addition on soil microbial response to temperature in a temperate steppe. Soil Biol. Biochem. 167:108589. doi: 10.1016/j.soilbio.2022.108589
Liu, W., Zhang, Z. H. E., and Wan, S. (2009). Predominant role of water in regulating soil and microbial respiration and their responses to climate change in a semiarid grassland. Glob. Chang. Biol. 15, 184–195. doi: 10.1111/j.1365-2486.2008.01728.x
Marín-Spiotta, E., Gruley, K. E., Crawford, J., Atkinson, E. E., Miesel, J. R., Greene, S., et al. (2014). Paradigm shifts in soil organic matter research affect interpretations of aquatic carbon cycling: transcending disciplinary and ecosystem boundaries. Biogeochemistry 117, 279–297. doi: 10.1007/s10533-013-9949-7
Mary, B., Mariotti, A., and Morel, J. L. (1992). Use of 13C variations at natural abundance for studying the biodegradation of root mucilage, roots and glucose in soil. Soil Biol. Biochem. 24, 1065–1072. doi: 10.1016/0038-0717(92)90037-X
Miao, S., Ye, R., Qiao, Y., Zhu-Barker, X., Doane, T. A., and Horwath, W. R. (2016). The solubility of carbon inputs affects the priming of soil organic matter. Plant Soil 410, 129–138. doi: 10.1007/s11104-016-2991-1
Navarro-García, F., Casermeiro, M. Á, and Schimel, J. P. (2012). When structure means conservation: effect of aggregate structure in controlling microbial responses to rewetting events. Soil Biol. Biochem. 44, 1–8. doi: 10.1016/j.soilbio.2011.09.019
Or, D., Smets, B. F., Wraith, J. M., Dechesne, A., and Friedman, S. P. (2007). Physical constraints affecting bacterial habitats and activity in unsaturated porous media – a review. Adv. Water Resour. 30, 1505–1527. doi: 10.1016/j.advwatres.2006.05.025
Schimel, J., Balser, T. C., and Wallenstein, M. (2007). Microbial stress-response physiology and its implications for ecosystem function. Ecology 88, 1386–1394. doi: 10.1890/06-0219
Schjønning, P., Thomsen, I. K., Moldrup, P., and Christensen, B. T. (2003). Linking soil microbial activity to water- and air-phase contents and diffusivities. Soil Sci. Soc. Am. J. 67, 156–165. doi: 10.2136/sssaj2003.0156
Šnajdr, J., Valášková, V., Merhautová, V. R., Herinková, J., Cajthaml, T., and Baldrian, P. (2008). Spatial variability of enzyme activities and microbial biomass in the upper layers of Quercus petraea forest soil. Soil Biol. Biochem. 40, 2068–2075. doi: 10.1016/j.soilbio.2008.01.015
Wang, Q., He, N. P., Liu, Y., Li, M. L., and Xu, L. (2016a). Strong pulse effects of precipitation events on soil microbial respiration in temperate forests. Geoderma 275, 67–73. doi: 10.1016/j.geoderma.2016.04.016
Wang, Q., Zeng, Z., and Zhong, M. (2016b). Soil moisture alters the response of soil organic carbon mineralization to litter addition. Ecosystems 19, 450–460. doi: 10.1007/s10021-015-9941-2
Weedon, J. T., Aerts, R., Kowalchuk, G. A., van Logtestijn, R., Andringa, D., and van Bodegom, P. M. (2013). Temperature sensitivity of peatland C and N cycling: does substrate supply play a role? Soil Biol. Biochem. 61, 109–120. doi: 10.1016/j.soilbio.2013.02.019
Wu, Z., Dijkstra, P., Koch, G. W., PeÑUelas, J., and Hungate, B. A. (2011). Responses of terrestrial ecosystems to temperature and precipitation change: a meta-analysis of experimental manipulation. Glob. Chang. Biol. 17, 927–942. doi: 10.1111/j.1365-2486.2010.02302.x
Xu, M., Wu, S., Zhaoxiao, J., Xu, L., Li, M., Bian, H., et al. (2020). Effect of pulse precipitation on soil CO2 release in different grassland types on the Tibetan Plateau. Eur. J. Soil Biol. 101:103250. doi: 10.1016/j.ejsobi.2020.103250
Keywords: soil moisture content, microbial respiration, LOC inputs, utilization strategies, isotopes
Citation: Bian H, Li C, Zhu J, Xu L, Li M, Zheng S and He N (2022) Soil Moisture Affects the Rapid Response of Microbes to Labile Organic C Addition. Front. Ecol. Evol. 10:857185. doi: 10.3389/fevo.2022.857185
Received: 18 January 2022; Accepted: 06 June 2022;
Published: 22 June 2022.
Edited by:
Albertus J. Smit, University of the Western Cape, South AfricaReviewed by:
Malak M. Tfaily, University of Arizona, United StatesKanchan Vishwakarma, Swedish University of Agricultural Sciences, Sweden
Copyright © 2022 Bian, Li, Zhu, Xu, Li, Zheng and He. This is an open-access article distributed under the terms of the Creative Commons Attribution License (CC BY). The use, distribution or reproduction in other forums is permitted, provided the original author(s) and the copyright owner(s) are credited and that the original publication in this journal is cited, in accordance with accepted academic practice. No use, distribution or reproduction is permitted which does not comply with these terms.
*Correspondence: Jianxing Zhu, zhujianxing2008@yeah.net
†These authors have contributed equally to this work