Remote Sensing of Floral Resources for Pollinators – New Horizons From Satellites to Drones
 Dunia Gonzales
 Natalie Hempel de Ibarra
 Karen Anderson
- 1Centre for Research in Animal Behaviour, Department of Psychology, University of Exeter, Exeter, United Kingdom
- 2Environment and Sustainability Institute, University of Exeter, Penryn, United Kingdom
Insect pollinators are affected by the spatio-temporal distribution of floral resources, which are dynamic across time and space, and also influenced heavily by anthropogenic activities. There is a need for spatial data describing the time-varying spatial distribution of flowers, which can be used within behavioral and ecological studies. However, this information is challenging to obtain. Traditional field techniques for mapping flowers are often laborious and limited to relatively small areas, making it difficult to assess how floral resources are perceived by pollinators to guide their behaviors. Conversely, remote sensing of plant traits is a relatively mature technique now, and such technologies have delivered valuable data for identifying and measuring non-floral dynamics in plant systems, particularly leaves, stems and woody biomass in a wide range of ecosystems from local to global scales. However, monitoring the spatial and temporal dynamics of plant floral resources has been notably scarce in remote sensing studies. Recently, lightweight drone technology has been adopted by the ecological community, offering a capability for flexible deployment in the field, and delivery of centimetric resolution data, providing a clear opportunity for capturing fine-grained information on floral resources at key times of the flowering season. In this review, we answer three key questions of relevance to pollination science – can remote sensing deliver information on (a) how isolated are floral resources? (b) What resources are available within a flower patch? And (c) how do floral patches change over time? We explain how such information has potential to deepen ecological understanding of the distribution of floral resources that feed pollinators and the parameters that determine their navigational and foraging choices based on the sensory information they extract at different spatial scales. We provide examples of how such data can be used to generate new insights into pollinator behaviors in distinct landscape types and their resilience to environmental change.
Introduction
Pollination of flowering plants by insects is essential to the functioning of natural and agricultural ecosystems and to the global food supply (most recently reviewed by Khalifa et al., 2021; Montoya et al., 2021). These pollination services depend in fundamental ways on the spatio-temporal distribution of floral resources, which are dynamic across time and space. They are also shaped by anthropogenic landscape fragmentation and climate change with a potential to reduce or eliminate relationships within intricate ecosystems that are balanced by both the species composition and abundance of flowering plants (e.g., Biesmeijer et al., 2006; Memmott et al., 2007; Montero-Castaño and Vila, 2012; Goulson et al., 2015; Wenzel et al., 2020). Alterations in the availability of floral resources and the macro- and micronutrients they provide may have important effects on the population strength, health, activity and navigation patterns of pollinators across a range of spatial scales – from the plant to the flower patch and wider landscape. Consequently, the landscape context is critical to understanding pollination behaviors and their effects on pollinator populations (e.g., Winfree et al., 2007; Betts et al., 2019; Pamminger et al., 2019; Timberlake et al., 2021; Nicholls et al., 2022). It is timely to assess how spatial data describing the time-varying spatial distribution of flowers can be obtained by integrating remote sensing technology more firmly into behavioral and ecological studies. We review here how new technology and approaches can be applied to overcome challenges in obtaining accurate description of landscape structures and the dynamic distribution of floral resources that impacts pollinator abundance, activity and movements.
Vision guides most pollinators’ behavioral repertoires, as shown by long-standing research of vision and visually guided behaviors in bees, flies and other insect pollinators (for reviews see Menzel et al., 1997; Egelhaaf and Kern, 2002; Srinivasan, 2011; Hempel de Ibarra et al., 2014; Behnia and Desplan, 2015; Kelber and Somanathan, 2019). For demonstrating causality, the environmental conditions, typically inside the laboratory, are often manipulated to reduce complexity and to control the presentation of visual stimuli or landmarks. This has helped to characterize rules of movements at different spatial scales, unraveling how insects navigate (e.g., Collett and Collett, 2002; Collett et al., 2006; Knaden and Graham, 2016; Webb, 2019). However, it is still difficult to carry out behavioral experiments over larger spatial scales, in field environments or heterogeneous landscapes, partly because most pollinators are flying insects and small in body size. There are limited options for tracking their flight trajectories and these do not resolve small-scale movements and behavioral choices during a natural foraging trip. The other challenge is to design behavioral studies and identifying suitable study areas based on easily quantifiable landscape parameters, such as the distribution of foraging locations and floral densities. Remote sensing offers opportunities to analyze floral resources in situ along a range of spatial and temporal scales (Table 1). This information could enhance our understanding of how and at what scales the distribution of floral resources in the environment affects pollinator movements. For ecological questions such information also allows scientists to evaluate how fitness and abundance of pollinators is affected in different landscapes.
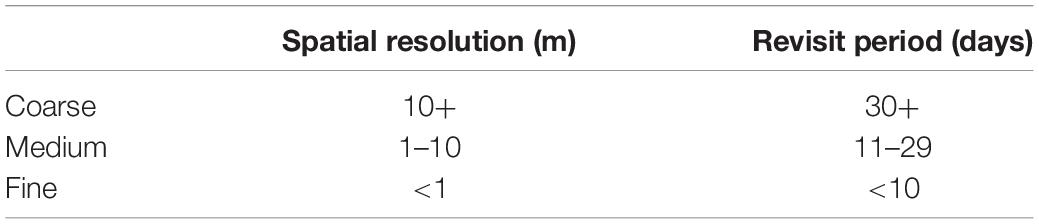
Table 1. Definitions for “coarse,” “medium,” and “fine” spatial resolutions and revisit periods used in this paper.
Terrestrial remote sensing approaches, where the Earth’s ecosystems are monitored by sensors on board satellites (e.g., Xie et al., 2008), airplanes (e.g., Lan et al., 2009), unpiloted aircrafts also known as drones (Anderson and Gaston, 2013) and ground-based platforms have transformed scientific understanding of the dynamics in global processes, particularly the world’s vegetated ecosystems. Remote sensing works by capturing changes in the spectral signatures or structural traits of vegetation (at different grains, depending on the sensor and platform used) so that their physiological, biochemical and spatial properties can be analyzed. When using remote sensing to characterize flowering vegetation, researchers have obtained can information in the form of multispectral images, reflectance spectra, or point cloud data (Willcox et al., 2018; Krishnasamy et al., 2019). Traditional field techniques involving manual floral counts using quadrats or transects are often laborious, time-consuming and only measure floral features detectable or predefined by the observers’ eyes Furthermore, in an analysis of methodologies employed by 159 studies, Szigeti et al. (2016) found that ecologists use a wide range of manual sampling methods but those are often not reported in sufficient detail, leading to a lack of standardization of sampling methods within the field. Additionally, due to the time and labor costs associated with manual sampling, the authors conclude that many floral samples capture only a fraction of the areas relevant to pollination and therefore may not be truly representative of the range of floral resources that can be accessed by pollinators. Remote sensing approaches can increase both the spatial and temporal efficiency of floral sampling as it allows for flowers or flower patches to be surveyed over areas covering several hundreds of meters (drones) to several thousands of kilometers (satellites) in only a few hours, facilitating coverage of large portions, if not all of, pollinators foraging and/or migration ranges. However, it is critical to differentiate between resources that are available to pollinators in the environment, which flowers pollinators actually exploit and how pollinators use distinct floral resources. Behavioral, physiological or foraging data on pollinators must be paired with remote sensing approaches that examine various aspects of floral resources that lie within an insect’s flight range. In conclusion, selecting the sensors and imaging platforms most appropriate for capturing the spatio-temporal dynamics of floral resources depends on the ecological and behavioral questions of interest.
This review focuses on the little explored nexus of remote sensing and pollination studies, concentrating on a discussion of the various ways that remote sensing data can be used to characterize floral resources in the field for integration into pollination studies. We explore how different remote sensing platforms can be used to address three critical questions relevant to pollination science which are:
• How isolated are floral resources?
• What resources are available within a flower patch?
• How do floral patches change over time?
Background: Remote Sensing Approaches for Landscape Ecological Assessment
The spatio-temporal distribution of flowering vegetation can be measured using a variety of sensors carried by satellites, airplanes and drones. To frame the technical methods presented in the rest of this paper, we provide some technical specifications of platform survey heights and resultant spatial data grains (Figure 1); temporal vs. spatial trade-offs (Figure 2) and details of combined platform-sensor capabilities with examples (Table 2). Sensors carried by these platforms may be passive, and measure sunlight reflected from the Earth or may be active, producing their own source of light that is subsequently reflected back and measured. Passive satellite systems such as those used on the NASA Landsat (30 m spatial resolution in the visible, near-infrared, and short-wave infrared portions of the light spectrum, i.e., VIS, NIR, SWIR—for a list of abbreviations and terminology used throughout this paper see Table 3) and Sentinel-2 (10–20 m spatial resolution in the VIS, NIR, SWIR) missions can capture landscape features at coarse and moderate spatial resolutions from a few spectral bands using multispectral sensors. However, commercial satellites such as Worldview-3 (1.24 m VIS and NIR, 3.7 m SWIR) are capable of generating fine spatial resolution datasets, allowing for more detailed explorations of vegetation features, albeit at relatively high financial cost. Additionally, hyperspectral datasets that sample the light spectrum across hundreds of narrow band-width channels can be generated from research satellites (e.g., Hyperion, Gaofen-5) and from hyperspectral sensors mounted on drones, but the mechanisms to understand how the complex hyperspectral metrics measured over moderate resolution pixels relate to ecological phenomena need further exploration (Roberts et al., 2011). Yet some efforts are ongoing to explore these complexities and find new information sources (e.g., ‘Spectranomics’ approach where spectral diversity might provide a proxy for ecosystem diversity – explored by Asner and Martin, 2016). In the context of vegetation studies, multispectral and hyperspectral data obtained from sensors mounted on satellites, airplanes and drones are often processed using vegetation indices (VIs), which are the reflectance ratios of two or more spectral bands (Table 4). Probably the most widely used VI is the normalized difference vegetation index (NDVI; Gao et al., 2020). NDVI ratios reflectance in the near infra-red (NIR) to the red portion of the visible spectrum because healthy plants tend to absorb red light and reflect it strongly from their spongy mesophyll layer in the NIR. This reflectance ratio can be used in a simple way to determine the probability that a given pixel represents vegetation on the ground, allowing researchers to build up a map of the spatial distribution of vegetation over a given area. It can also be used in a more complex sense to serve as a proxy for other vegetation parameters where the
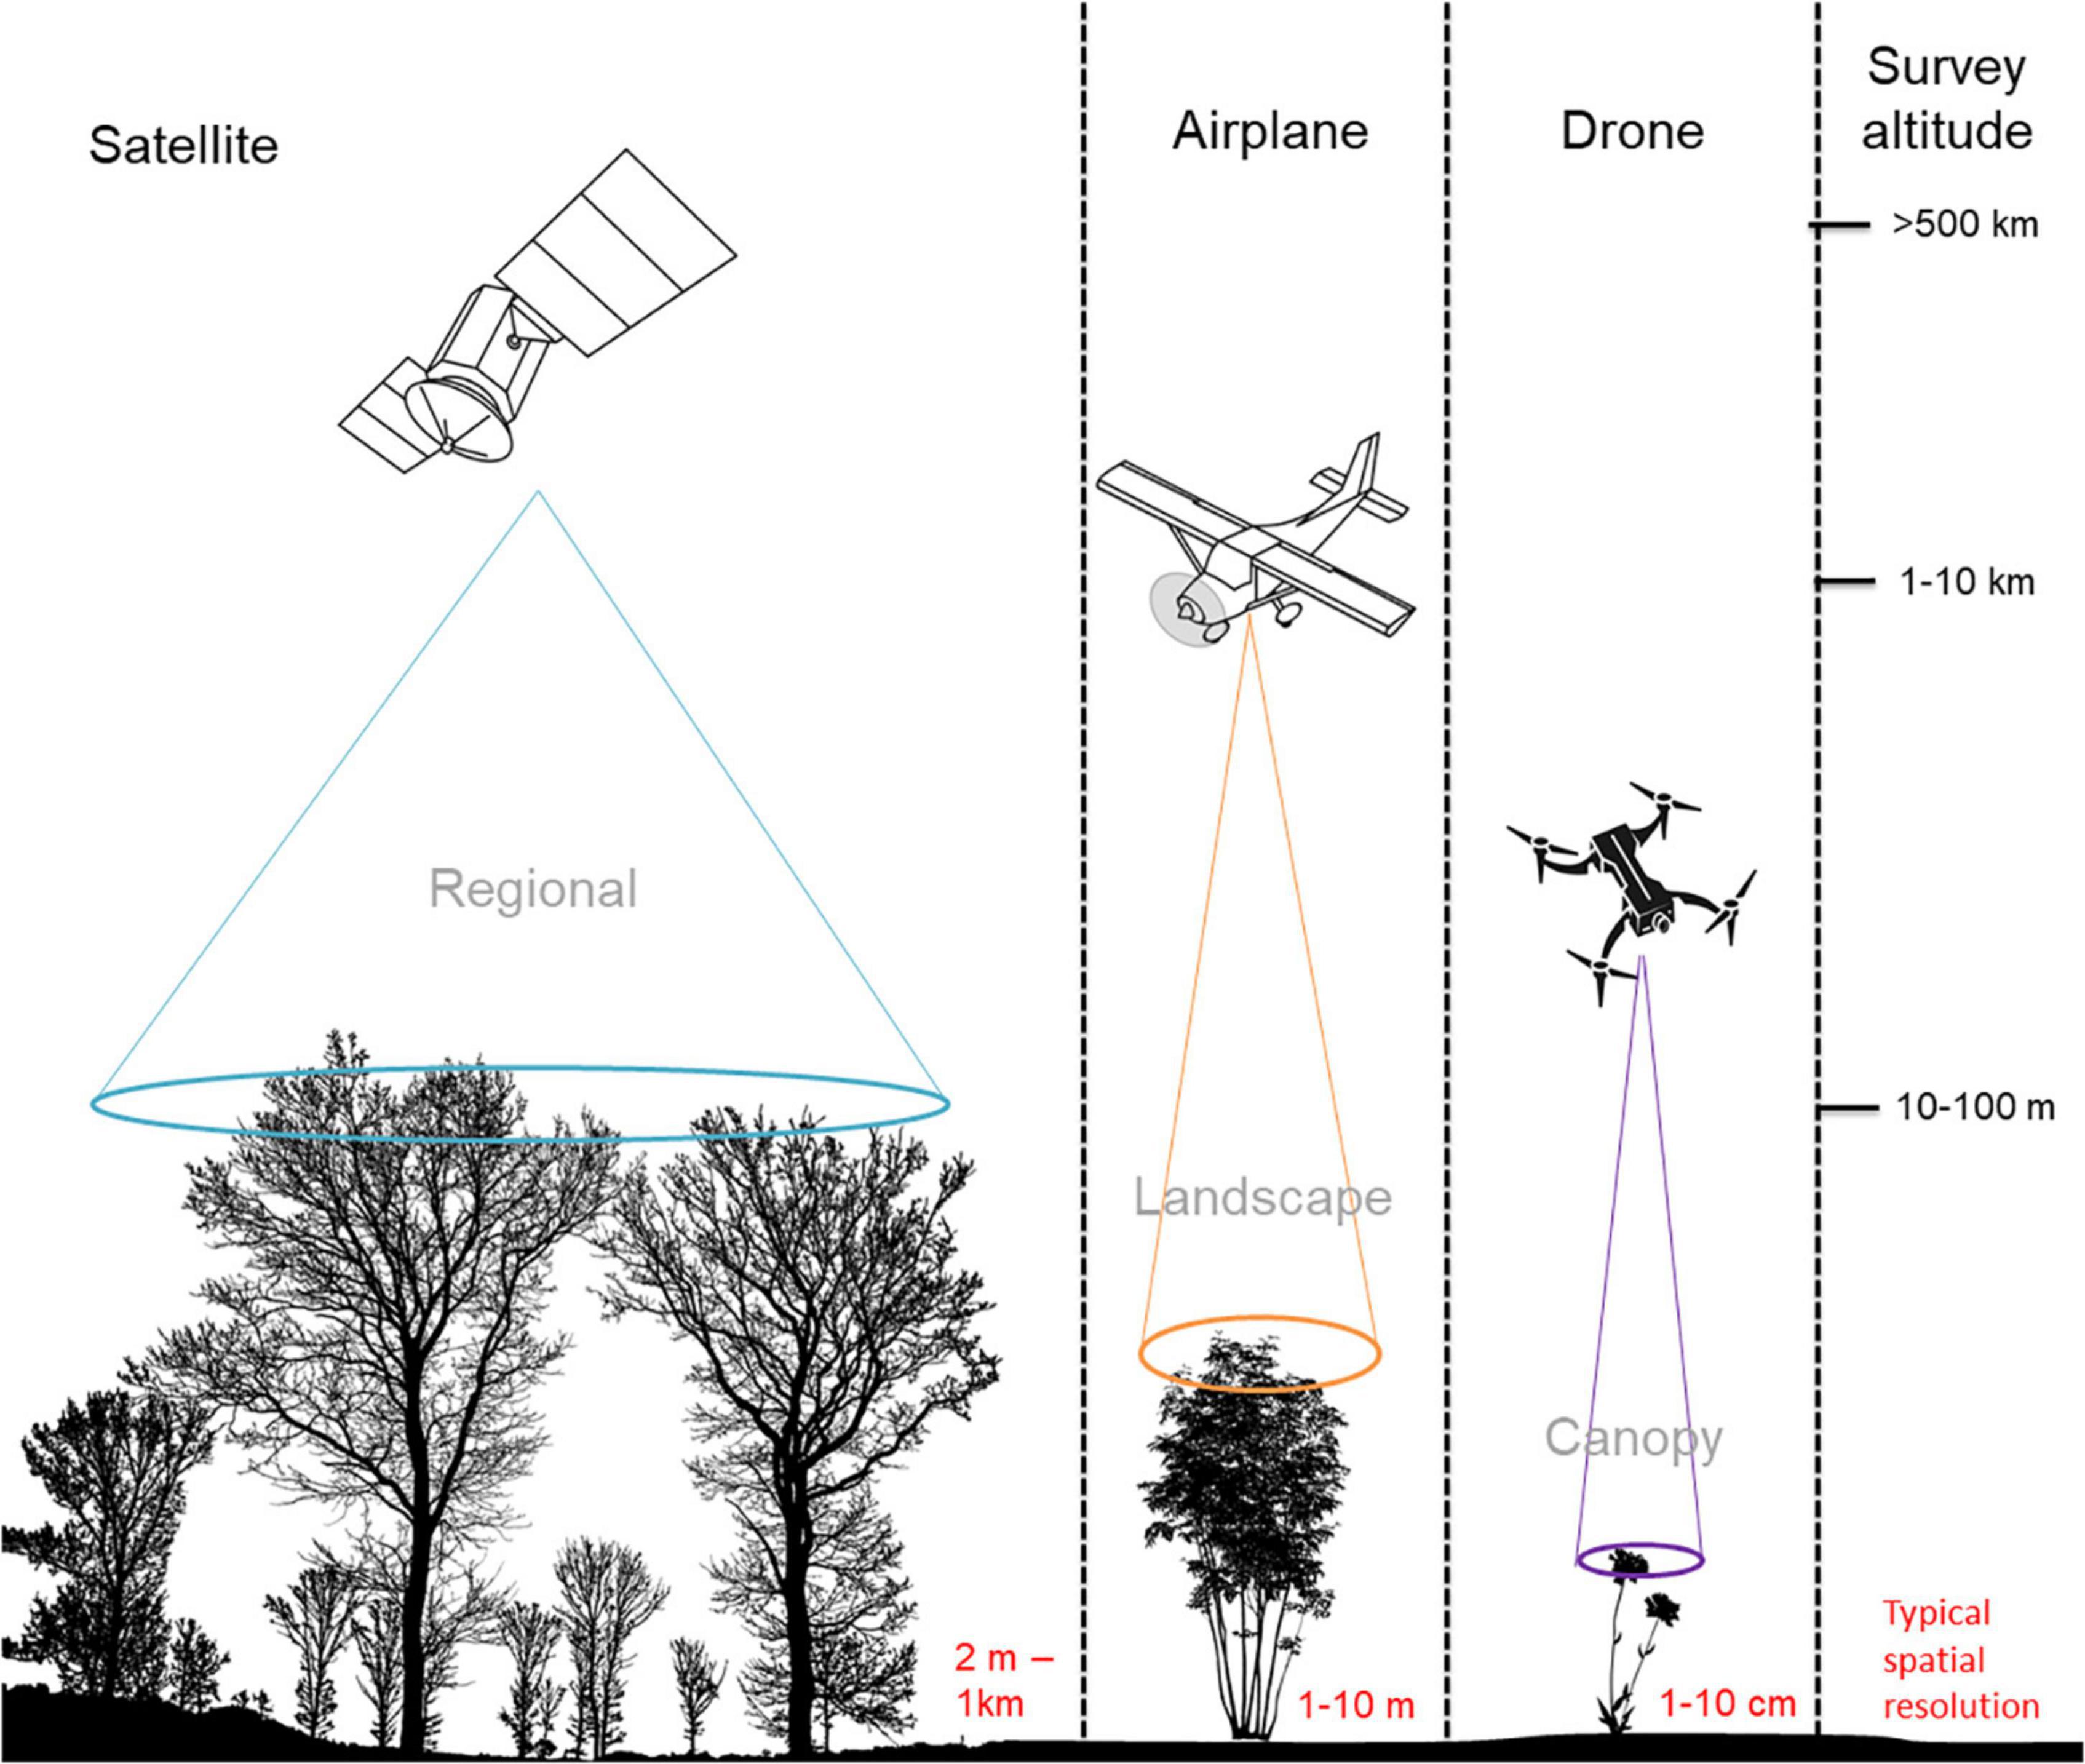
Figure 1. The approximate operating altitudes of satellite-, airplane-, and drone-based imaging platforms. The corresponding fields of view used to capture vegetation from these different altitudes illustrate the extent of the landscape that can be viewed from a single image by sensors onboard each imaging platform.
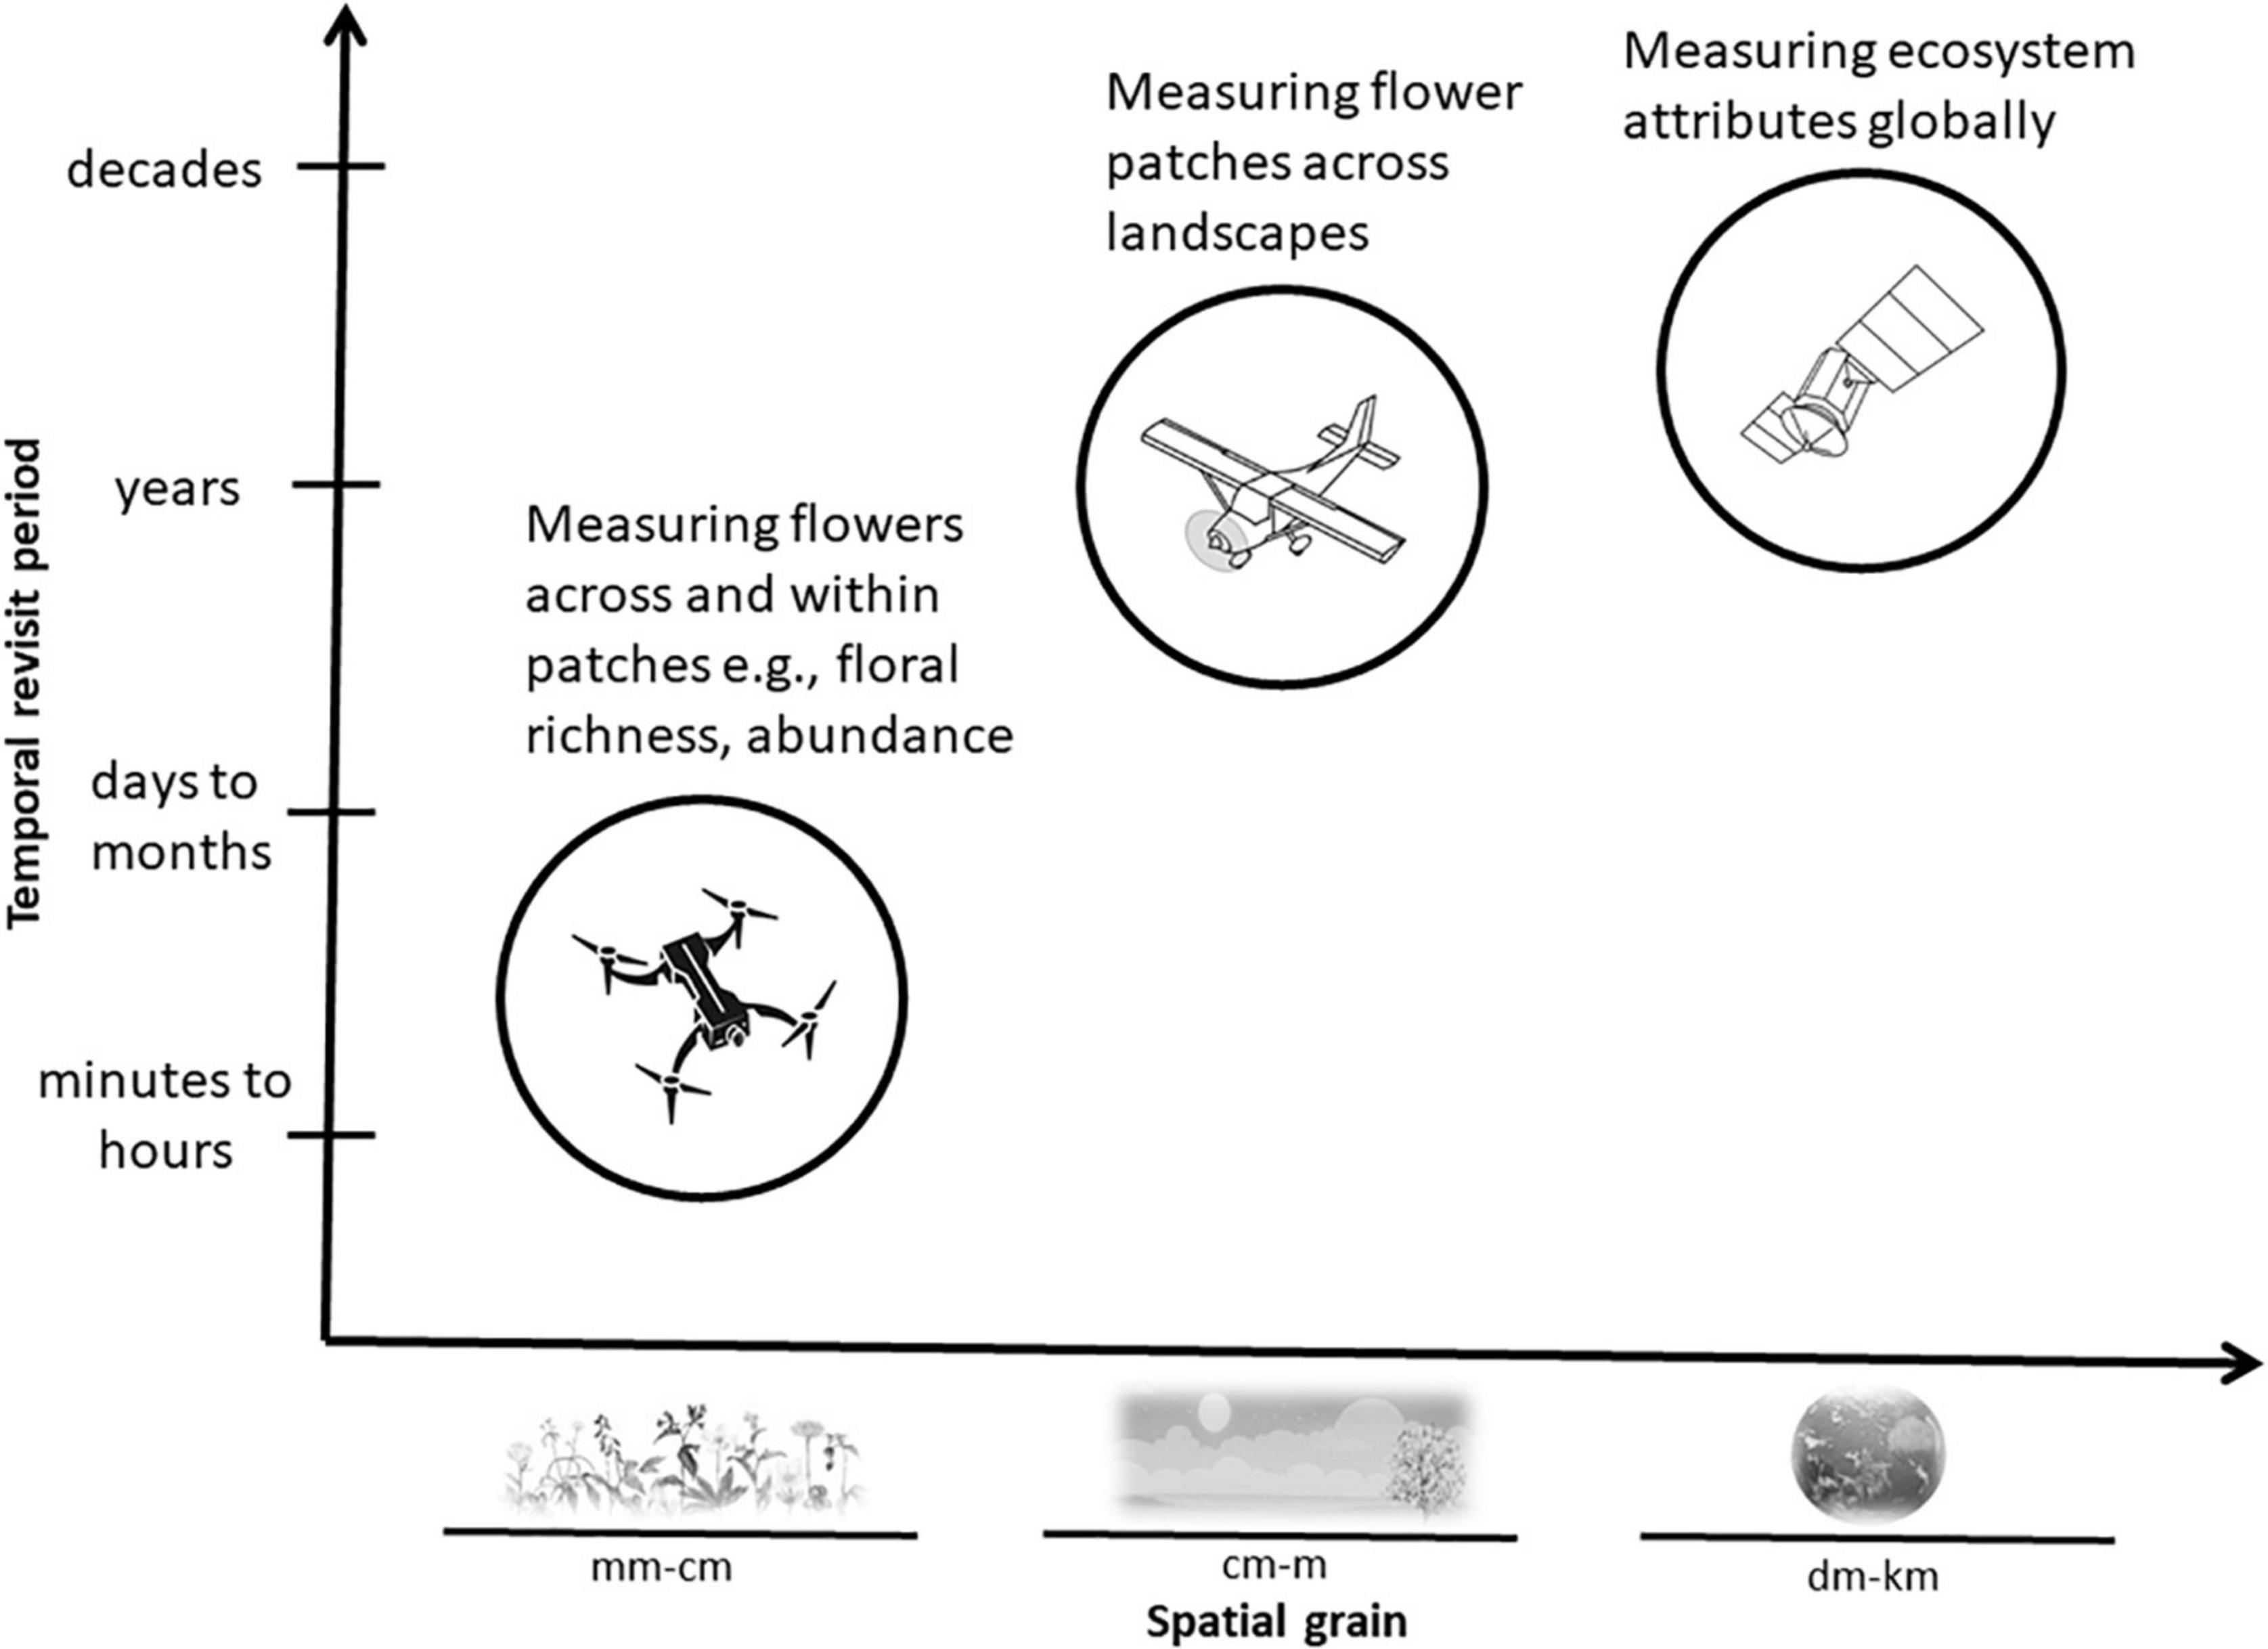
Figure 2. Satellites, airplanes, and drones usually carry sensors that measure flowering vegetation at distinct temporal revisit periods and spatial grains. Typical vegetation features that can be efficiently measured by each of these remote sensing platforms are shown in relation to the temporal and spatial capabilities of each system.
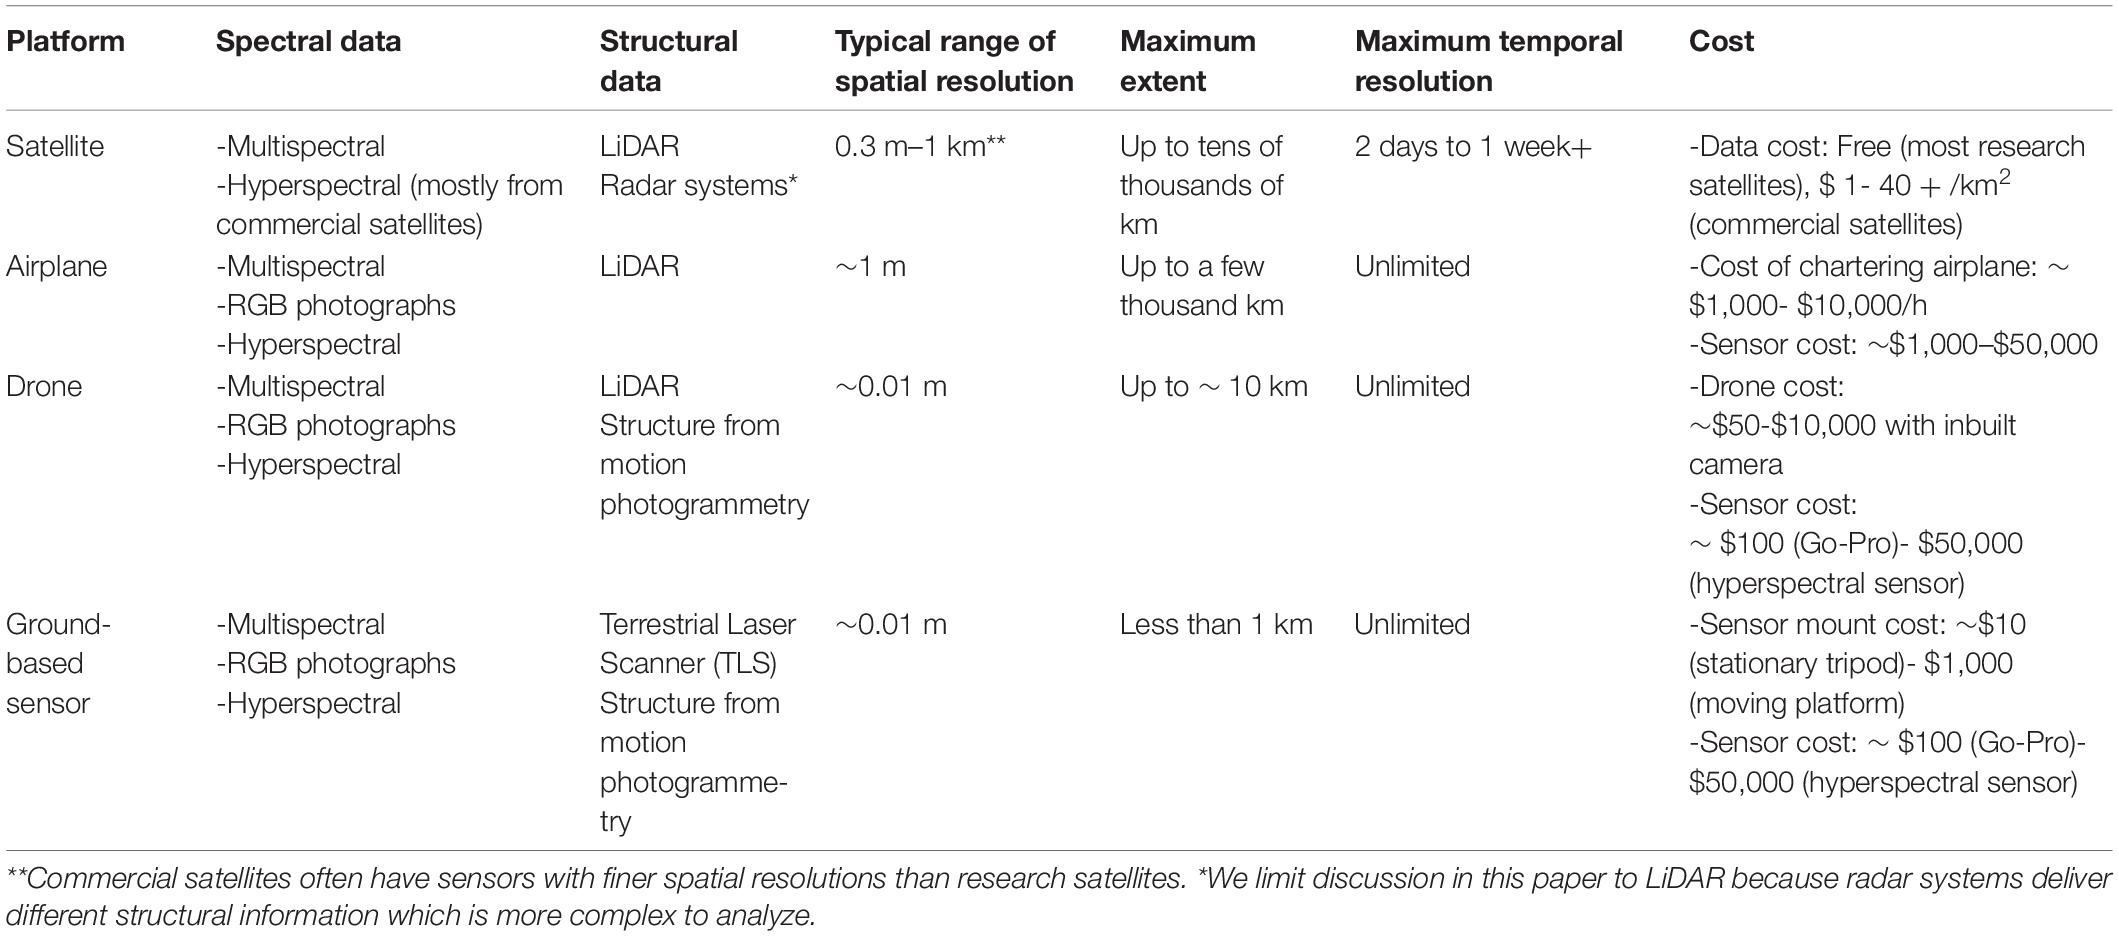
Table 2. Examples of the types of data acquired by satellite, airplane, and drone-based imaging platforms, their approximate range of spatial resolutions (at typical flight heights), extents, temporal resolutions and costs to the user.
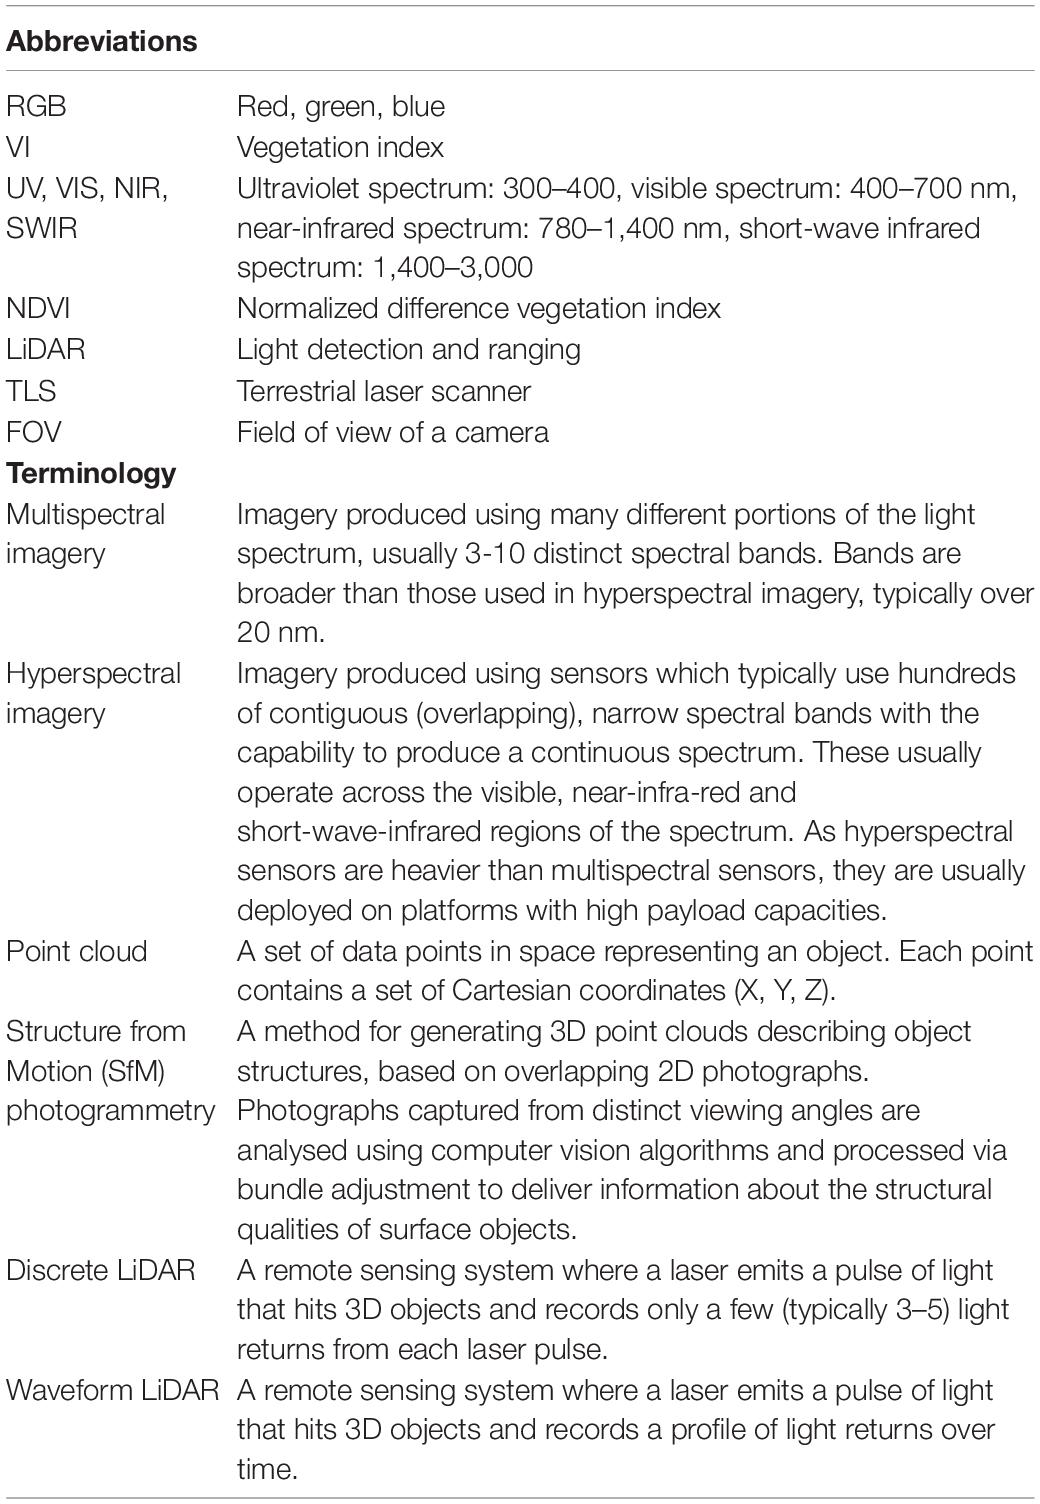
Table 3. Abbreviations and terminology.
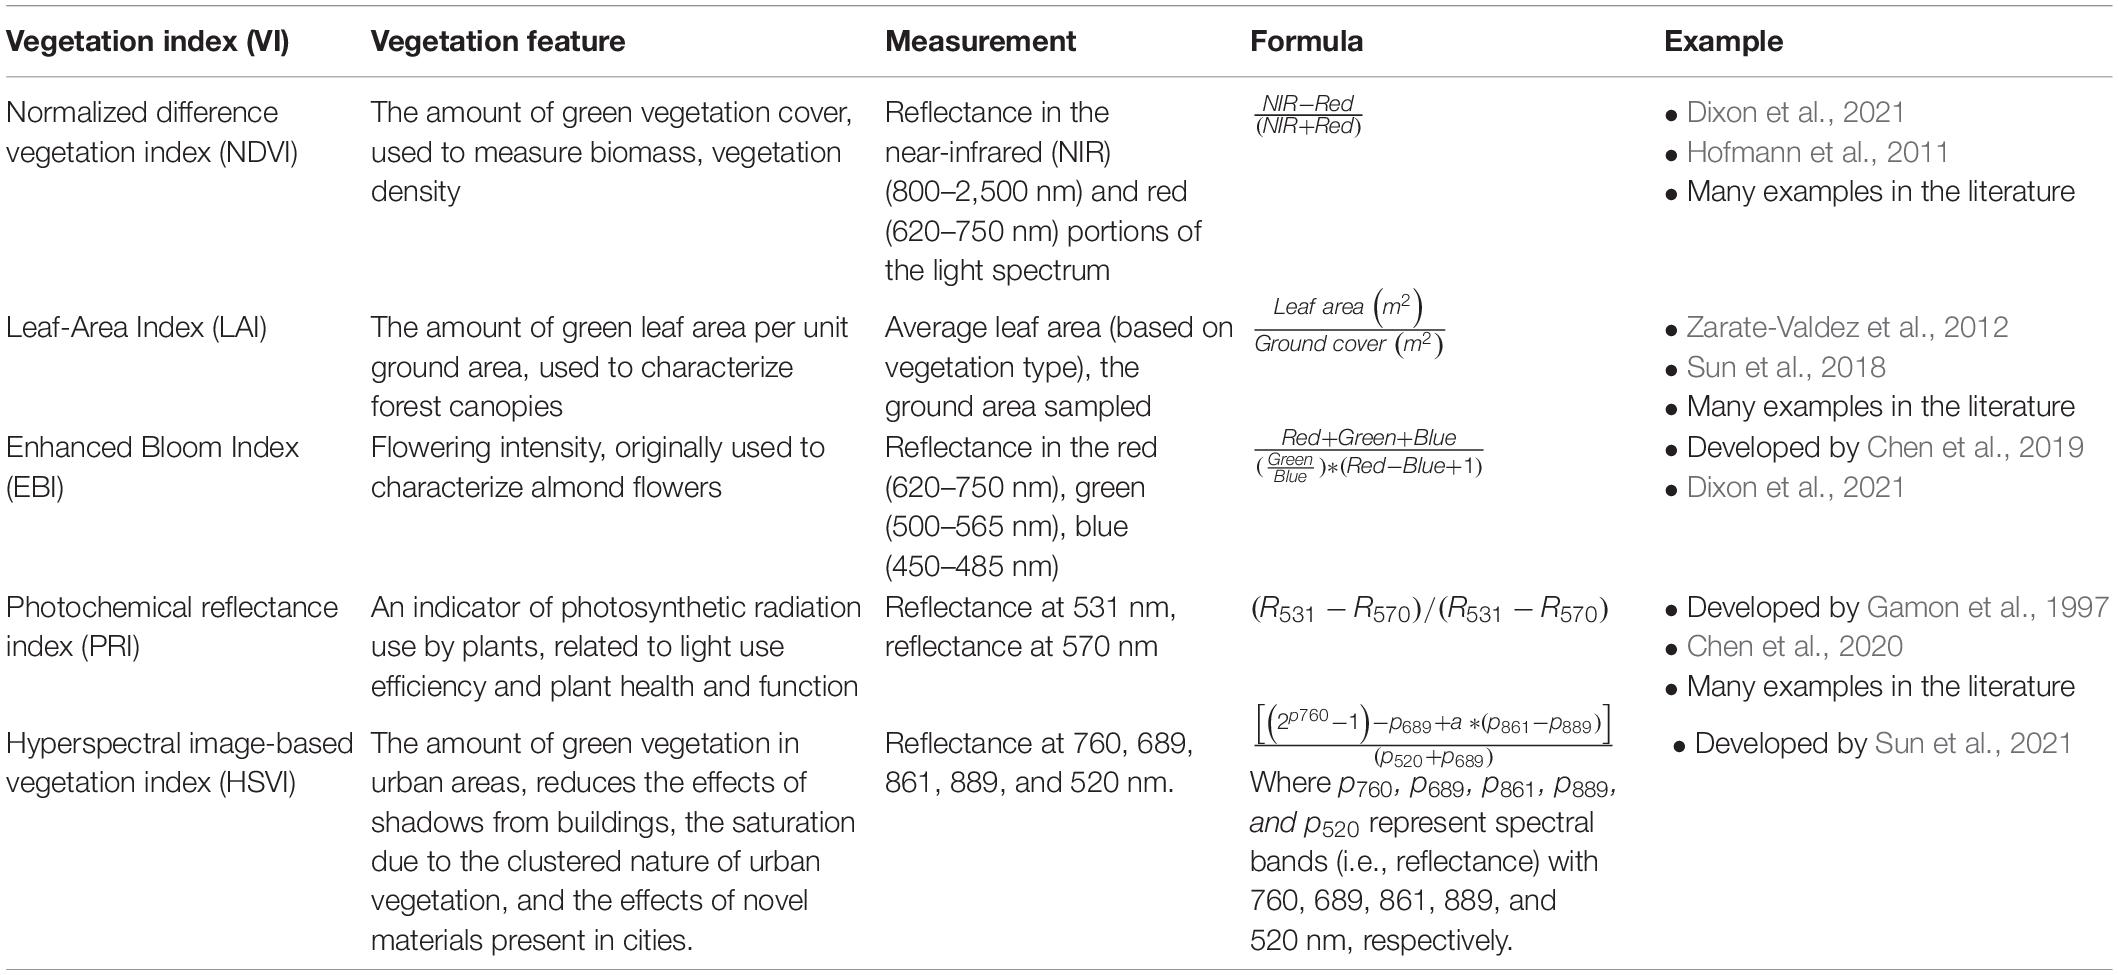
Table 4. Examples of vegetation indices that are expressed as ratios between different portions of the electromagnetic spectrum reflected by vegetation on earth’s surface.
magnitude of NDVI is linked to vegetation features such as canopy structural parameters e.g., leaf area index (Roberts et al., 2011; Gao et al., 2020). Note that there are a great number of vegetation indices, all slightly varying in their algorithms, but many widely used for similar purposes (Elvidge and Chen, 1995; Viña et al., 2011; Table 4). Most published research using VIs to examine flowering vegetation come from agriculture (e.g., Fang et al., 2016; Wan et al., 2018; Yang et al., 2022) or conservation (e.g., Hunt and Williams, 2006; Tvostik et al., 2019) and use VIs to quantify flower number or patch size of the same floral species and do not differentiate between distinct flower types within the same patch. Such studies have reported differing accuracies depending on the flower type and VI used, for example, Wan et al. (2018) compared the accuracies of ten different VIs to quantify oilseed rape crops, and reported classification accuracies ranging between 0.61 and 0.91. There are fewer studies examining floral diversity using vegetation indices, and these studies are tasked with maximizing the reflectance of different floral types from each other and against the background. While distinguishing floral species based on reflectance spectra is possible both manually and by using classification algorithms, this task is complicated when flowers are spectrally similar. Therefore, object-based analyses on RGB imagery are often employed for detection of individual floral species based on different floral features such as size and shape, although these methods can sometimes be computationally intensive, involving machine learning. Despite their relatively high computational demands, such studies have typically reported accuracies in distinguishing floral types ranging between around 0.70 to over 0.90 (Gogul and Kumar, 2017; Cibuk et al., 2019Islam et al., 2020; Togacar et al., 2020) depending on the features extracted and the algorithms employed.
The structures of vegetation can be resolved through light detection and ranging (LiDAR) sensors mounted on ground-based (“terrestrial laser scanning,” TLS), drone and airplane platforms. While LiDAR doesn’t provide information on floral distribution (since most LiDARs record only structural rather than spectral parameters), it can be used to resolve landscape elevation and plant structures, allowing researchers to understand the spatial and volumetric distribution of floral patches when integrated with optical and infra-red products from different systems (Sellars and Jolls, 2007; Hosoi and Omasa, 2009; Wu et al., 2019). LiDAR emits pulses of light and captures backscatter from vegetation stored in point clouds to measure the height of objects within landscapes, with capabilities for describing the 2.5-D or 3-D representations of their structures. Discrete LiDAR systems provide information about the top of canopies and the underlying terrain allowing basic metrics of canopy height to be determined, but missing the detail of what lies between the tree tops and the ground (hence, “2.5-D”). Conversely, TLS can deliver 3D information by scanning canopies from the ground up; whilst waveform LiDAR can resolve full volumetric canopy structure by measuring how the emitted light interacts with vegetation between the treetops and the ground. There are now waveform LiDARs in the air (Hancock et al., 2017; Coops et al., 2021) and on the International Space Station (NASA GEDI mission). Additionally, LiDAR data can be used within models of radiative transfer to simulate processes of light penetration which can provide information about the amount of light reaching forest understories (Salas, 2020). New innovations in multispectral LiDAR might provide novel opportunities for pollination scientists because this potentially allows for both spectral and structural data to be captured.
At the landscape scale, data obtained from satellites can be used to analyze patches of floral resources at coarse- and moderate- grain, such that each pixel represents light reflected over an area of several dozen to hundreds of meters on the ground (e.g., Hofmann et al., 2011; Leong and Roderick, 2015; Beduschi et al., 2018). Compared to other remote sensing platforms, the use of satellite data is a relatively mature technique for assessing vegetation and is often used in landscape studies to map vegetation and flower patches. Although aerial imagery captured from airplanes can provide spatial information at moderate-grain, the use of this platform for mapping vegetation is comparatively rare in the pollination literature, likely due to the high financial and logistical costs associated with chartering airplanes to obtain data (Table 2, Willcox et al., 2018). Consequently, governmental organizations with relatively large amounts of funding typically charter airplanes to capture new geo-spatial data which may in some situations be made available to researchers and members of the public at little or no cost on a post hoc basis (e.g., in the UK the Environment Agency makes all airplane-acquired remote sensing data available to citizens through data.gov.uk).
Important platforms for use in field studies are consumer-grade fixed-wing and rotor-based drones (take-off weight totals less than 30 kg; Anderson and Gaston, 2013; Krishnasamy et al., 2019; Rominger et al., 2021). They are typically also equipped with GPS so that the captured images can be geo-referenced. Drones may be useful for capturing floral data relevant to pollination research as they can be operated over spatial areas that roughly match the distances covered by many foraging pollinators (Osborne et al., 2008; Danner et al., 2016), with maximum operating distances of up to 10 km, depending on the aircraft model, and limited by legislative restrictions (Duffy et al., 2018). Their proximity to the Earth’s surface means that the grain of such observations has capacity to capture flower-scale information (e.g., Wan et al., 2018; Xavier et al., 2018; Chen et al., 2019; López-Granados et al., 2019). Furthermore, drones with high-quality inbuilt cameras are becoming more affordable (£500–£2000) for the everyday field ecologist, and there is the possibility to further modify these with customized sensors. Drones are particularly useful for monitoring pollinator resources as they can be deployed at shorter intervals compared to satellites, their measurements are less affected by cloud cover, their viewing angle can be adjusted in real-time and they can be used to capture high spatial resolution imagery in remote or inaccessible terrains (Landmann et al., 2015; López-Granados et al., 2019; Smigaj and Gaulton, 2021). Drones have also emerged as useful platforms for acquiring data describing volumetric vegetation structure – as an alternative to LiDAR. To do so requires a Structure from Motion (SfM) photogrammetry workflow to be applied to overlapping aerial photographs (examples can be found in Cunliffe et al., 2016; López-Granados et al., 2019; Smigaj and Gaulton, 2021). The workflow requires a drone with standard camera, plus optional ground control equipment. If validation is required this includes ground control targets and high accuracy geographic positioning system (GPS). A computer vision algorithm uses a bundle adjustment approach to determine 2.5D vegetation structures and stores this information in point clouds. Critical to the successful application of this method is the capture of images from distinct viewing angles and high convergence of images—i.e. high overlap in front and lateral extents, so that features with structure exhibit image parallax which can be modeled to generate a virtual rendering of their relative height and volume. This technique was facilitated by the use of drones and pioneered in geosciences for the measurement of stable structures (Jackson et al., 2020). It has also recently been applied successfully to vegetation for measuring crop height in agricultural fields (Holman et al., 2016), generating biomass estimates in drylands (Cunliffe et al., 2016), or for measuring forest structures with equivalent accuracies to LiDAR (Filippelli et al., 2019). Acquisition of such volumetric information can be achieved with very low hardware costs. This is relevant for pollination ecologists because such data can be combined with spectral information on floral resources to deliver information about the structural properties of foraging patches (e.g., ground elevation, tree/hedge height, building height) which could affect habitat use, microclimate (Duffy et al., 2021), and thus timing of flowering and navigational strategies employed by pollinators.
In addition to satellites, piloted aircrafts, and drones, ground-based sensors are frequently used to monitor the health and growth of individual plants. However, they capture information at very fine spatial scales (e.g., 3.5° field of view), which is relatively inefficient for assessing an entire floral patch or for capturing flowering patches across a landscape at all spatial scales relevant to pollinators’ foraging behaviors. Although a discussion of ground-based sensors is omitted from this review for the aforementioned reasons, these approaches are widely used for monitoring individual crops in agricultural research (Hong et al., 2007; Raper et al., 2013; Quemada et al., 2014), and we acknowledge that data from close-range spectroscopy could also provide useful insights for discriminating different flowers based on spectral signatures, that could benefit (via calibration/validation) some of the other techniques discussed herein.
Remote sensing techniques exploiting drone, airplane and satellite-borne sensors are therefore mature with respect to generalized landscape ecology applications, but there is limited research that diverts these approaches toward characterization of floristic resources. The next sections will discuss the capabilities of state-of-the-art remote sensing techniques that can be used to examine relationships between pollinators and changing foraging landscapes. Furthermore, discussion is warranted on the level to which remote sensing approaches can deliver new insights into how future climate change and intensification of landscape management may affect pollination services in particular landscape types.
How Isolated Are Floral Resources?
Landscape fragmentation can isolate flowers in time and space. For example, as natural grasslands containing diverse floral resources are modified to create fields for agriculture or for human recreation, flowers offering preferred and valuable nutritional resources to pollinators can become separated from each other and from nesting or egg-laying areas within the landscape. As a result of this fragmentation and landscape homogenization, pollinators may be required to travel further on foraging trips to obtain a sufficient quantity and diversity of floral resources to sustain their survival and reproduction. Small-sized pollinators with smaller flight ranges, such as solitary bees, (Greenleaf et al., 2007; Garibaldi et al., 2011; Frasnelli et al., 2021), or insects with specialized diets (Winfree et al., 2007; Bommarco et al., 2010; Woodard and Jha, 2017), differ in their foraging strategies and choices and may particularly struggle to obtain food resources in highly fragmented habitats compared to large-sized, generalist pollinators that can travel farther to obtain food, such as bumblebees and honeybees (Gibb and Hochuli, 2002; Memmott et al., 2007; Martinson and Fagan, 2014; Wilson et al., 2021). However, even pollinators capable of covering large distances on foraging trips may face fitness consequences in highly fragmented and resource-poor environments, including reduced population, forager and colony sizes and changes to their foraging behaviors in the field. The effects of landscape composition on pollinators are particularly relevant due to the rapid expansion of agricultural activities and urbanization over the past 200 years, which have driven and accelerated fragmentation in many landscapes, such as forests and grasslands (Ghazoul, 2005; Libran-Embid et al., 2021).
However, how and along which spatial scales landscape composition affects the fitness and foraging behaviors of insect pollinators remains a largely open question. Remote sensing can provide new tools to map floral resources using multispectral imaging platforms that deliver data at distinct spatial grain. Research satellites are the most common platforms from which data on floral resources can be acquired. However, as discussed previously - most free-to-use data from public research satellites (e.g., Landsat, MODIS) deliver only relatively coarse spatial resolution data ranging from tens to hundreds of meters per pixel. Despite this, such data can have sufficient spatial resolution to identify patches of dense flowering vegetation found in meadows, urban parks, and mass flowering agricultural crops (Beduschi et al., 2018; Lane et al., 2020; Kowe et al., 2021), although it is not possible to distinguish between individual floral species within a single patch using such coarse-grain data. In contrast, there are commercial satellite products available which can deliver moderate- and fine- grain data (e.g., Geo-Eye1 multispectral resolution of 1.65 m, Worldview-3 multispectral resolution of 0.30 m), but the spatial resolution of these data would still be insufficient to resolve individual flower heads or inflorescences. The relatively high financial costs of purchasing such data have led to relatively few pollination studies employing commercial satellite data to study foraging landscapes (for examples see Beduschi et al., 2018; Chen et al., 2019). Additionally, satellite imagery can be used to identify distinct vegetation patches, such as densely forested areas, or cropped fields, that may serve as nesting and egg-laying habitats to pollinators or barriers to their dispersal. One of many examples in which research satellite data was used to characterize fragmentation of vegetation in pollinators’ foraging habitats has examined how distinct types of landscape patches affected pollinators’ dispersal from the nest site (Tscheulin et al., 2011). In this study, the authors obtained freely available satellite data (Landsat Thematic Mapper 5) and used algorithms to classify landscape patches surrounding their sampling sites. This information was paired with data on the proportions of differently sized pollinators along a transect. Therefore, it was possible to relate landscape composition surrounding the study sites to habitat use and the dispersal abilities of differently sized bee species, leading to observed differences in their spatial distributions across the landscape. Combining objective measures of spatial information at the landscape scale from remote sensing with data on pollinator abundance, size, diets, and navigation can lead to new insights into how landscape composition affects pollinators and pollination services.
One way to acquire scale-appropriate data describing detailed spatial variations in floral imagery is to obtain it from close range using low-flying drones (Figure 3), or in some cases, airplane-mounted sensors. The type of spatial information captured from airplane platforms may be particularly useful to surveying floral species that are highly dispersed, enabling the capture of small patches of floral resources scattered across hundreds of km (Carson et al., 1995). Carson et al. (1995) for instance, investigated the abundance of hawkweed flowers in experimental plots using multispectral imagery (1 m spatial resolution blue-green, green, 2 bands in NIR) captured from an airplane. As this floral species occurs at low densities in nature, small patches of hawkweed comprised of only a few individual flowers (of 2–3 cm diameter approximately) would likely be impossible to distinguish from the surrounding vegetation using coarse spatial resolution data provided by satellite platforms such as Landsat.
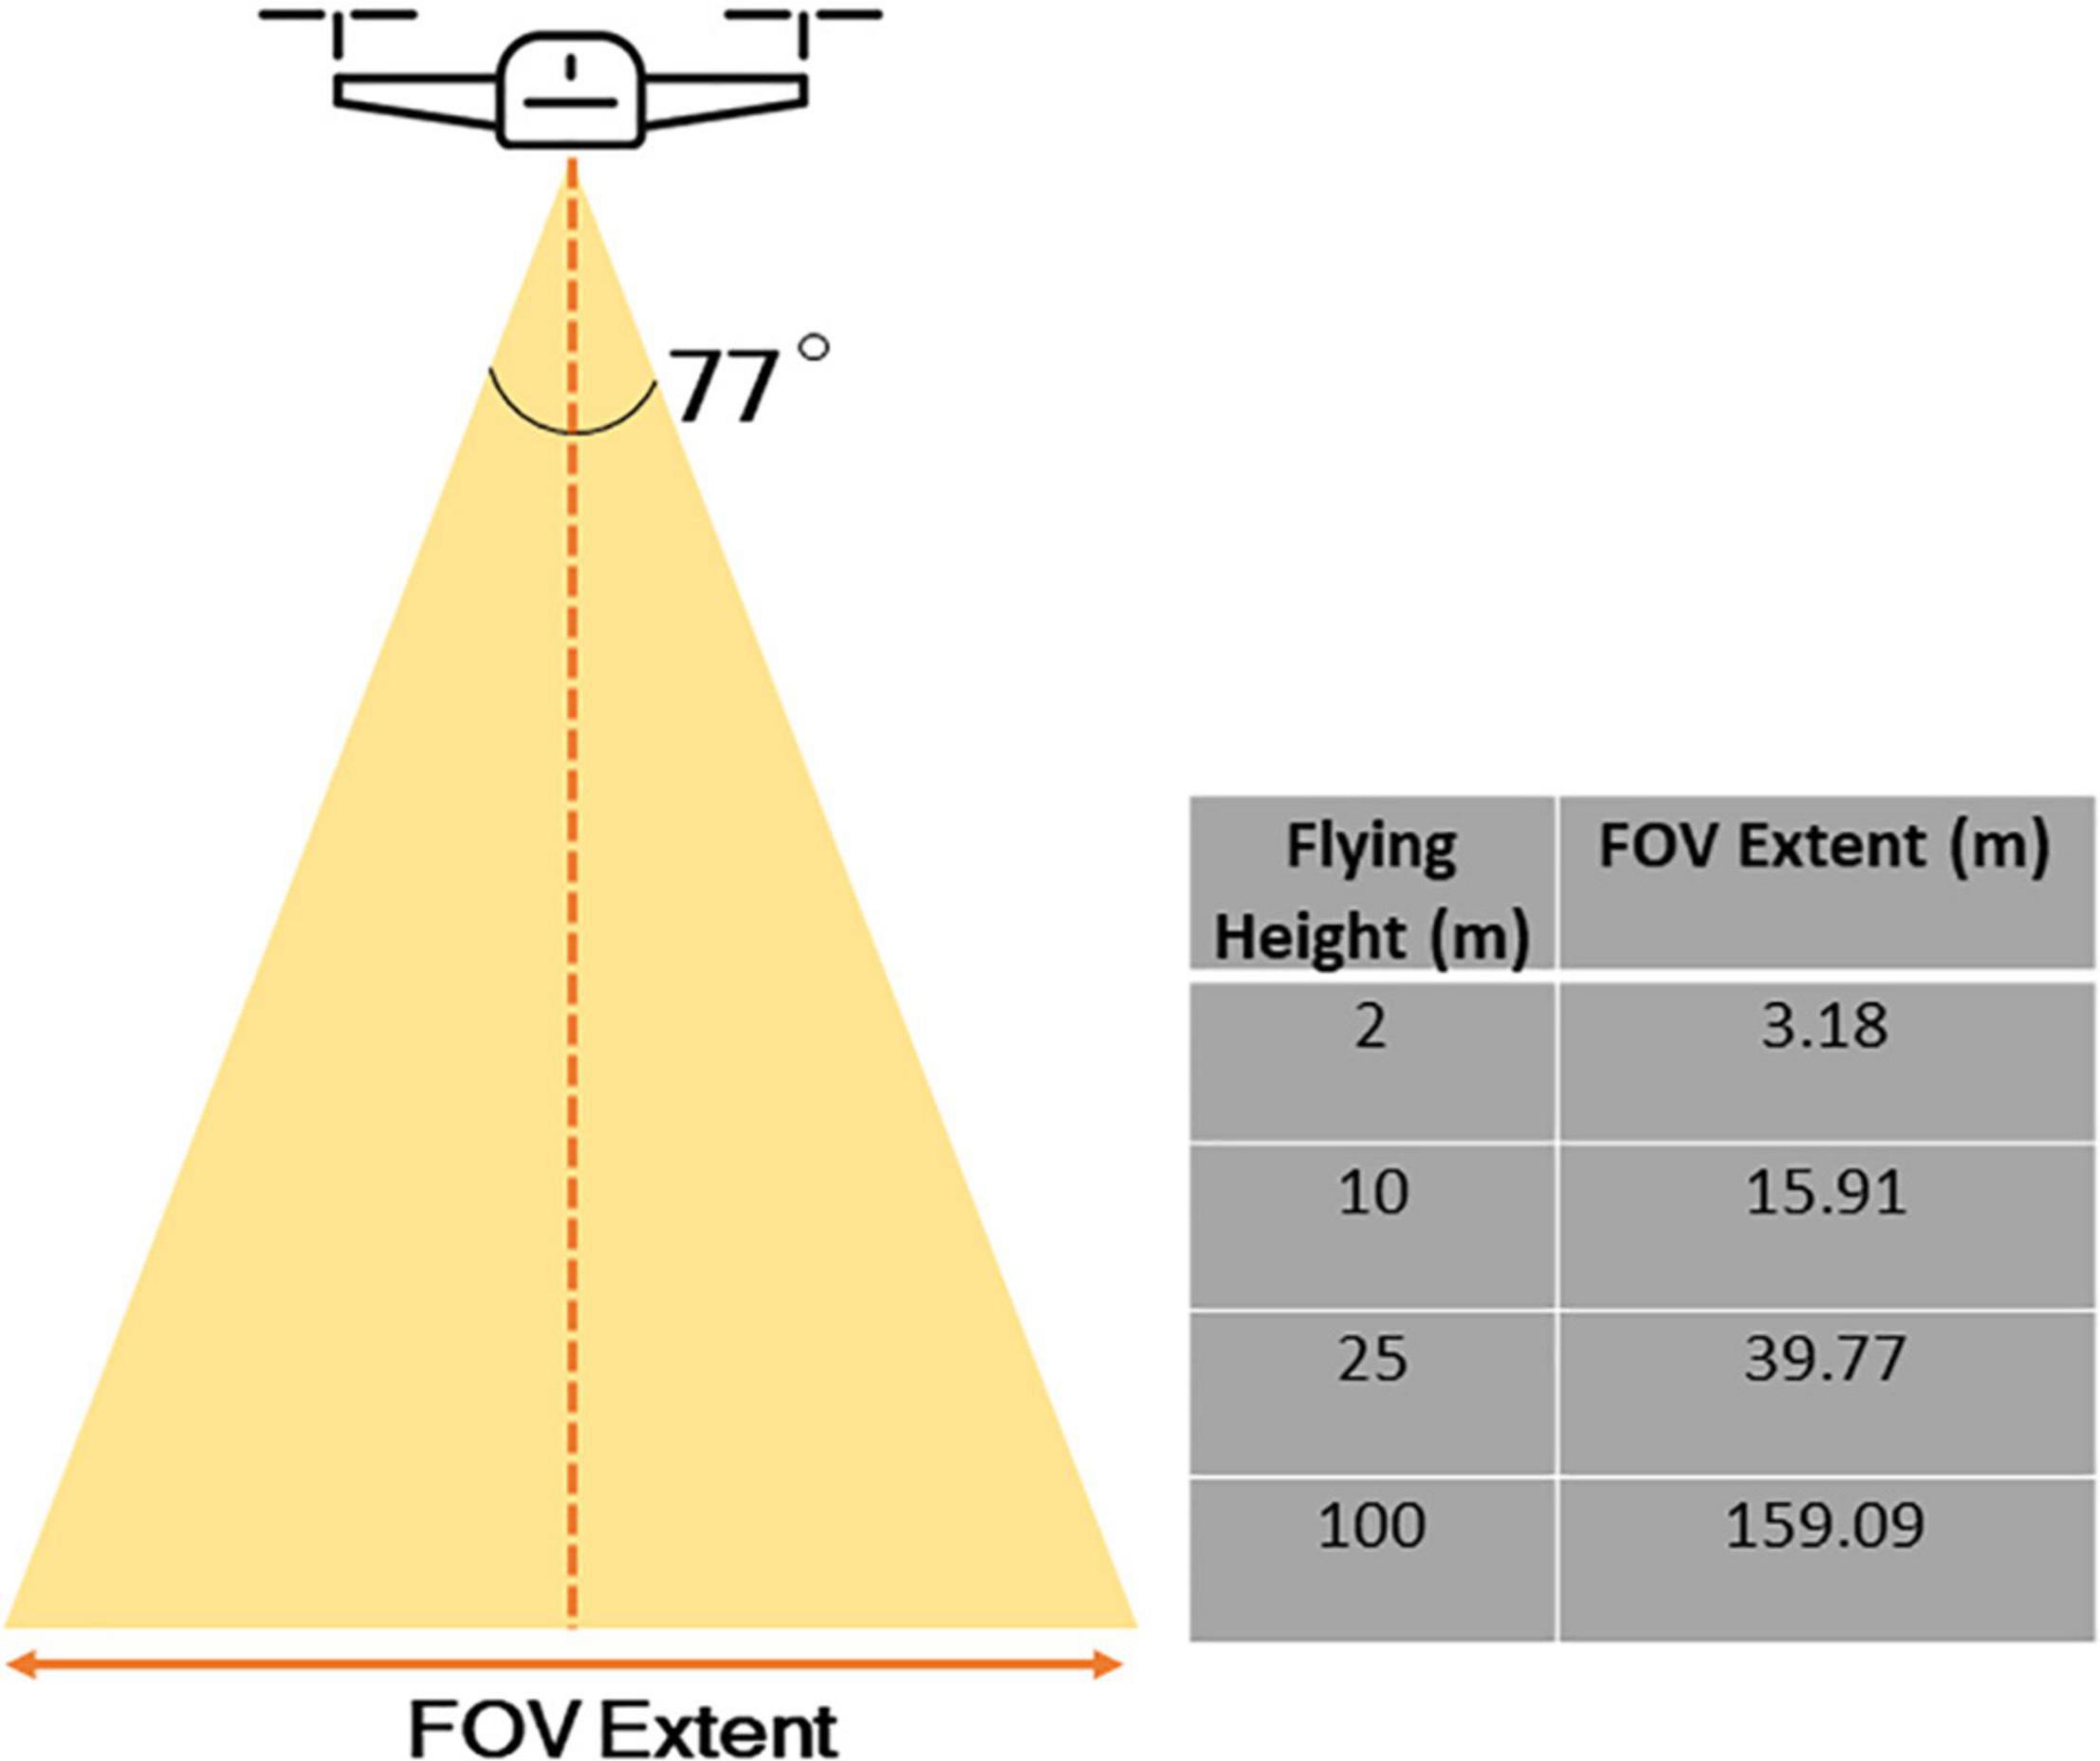
Figure 3. The relationship between flying height and extent of image. As an example, the DJI Mavic 2 Pro, a relatively commonly used drone for capturing spatial information in scientific research, and the camera has a field of view of 77° and an image size in pixels of 5472 × 3468.
From a drone perspective, the grain of data is even finer compared to those captured by airplanes – with a capability to measure individual flowers at sub-centimetric spatial resolution, depending on flying altitude, though there is a trade-off between spatial resolution and image extent (Figure 3). We therefore assert that it is particularly the fine-grained nature of drone data that lends itself strongly to the analysis of abundance and distribution of floral resources within a foraging patch, e.g., within forest, grassland, gardens, crop fields, and hedgerows (Figure 4). This information could be paired with data on the movements, foraging preferences, and individual and colony sizes of pollinators to provide insights on how changes to floral abundance along fine spatial scales affect pollinators (Woodard and Jha, 2017; Kremen et al., 2018; Lázaro and Tur, 2018). Fine-scale spatial data acquired by drones could be especially critical to facilitating investigations into habitat use by ecologically specialized pollinators and the effects of habitat fragmentation on their populations (Winfree et al., 2011). Although this approach remains novel within the field of pollination research, drones are increasingly used to study flowering plants within the agricultural sector, and this approach has been used in some conservation studies to map suitable habitats for animals threatened by habitat loss (Mangewa et al., 2019). Habel et al. (2018), for example, used a small commercial-grade multirotor platform (DJI Phantom 3, inbuilt RGB camera and CMOS Red + NIR sensor) to identify suitable habitats for three butterfly species that display varying degrees of diet specialization within a 45-ha managed grassland site. They found that high quality vegetation for the two specialized butterfly species were spatially restricted to a greater degree than for the generalist species, supporting the idea that habitat loss may have greater consequences for specialized species that rely on spatially restricted patches of vegetation for survival. Furthermore, the drone-obtained data showed that high quality vegetation for all three species were more frequently located in the verges of paths and roads than in open grassland, which may serve as important food resources for pollinators in urban and in agricultural landscapes.
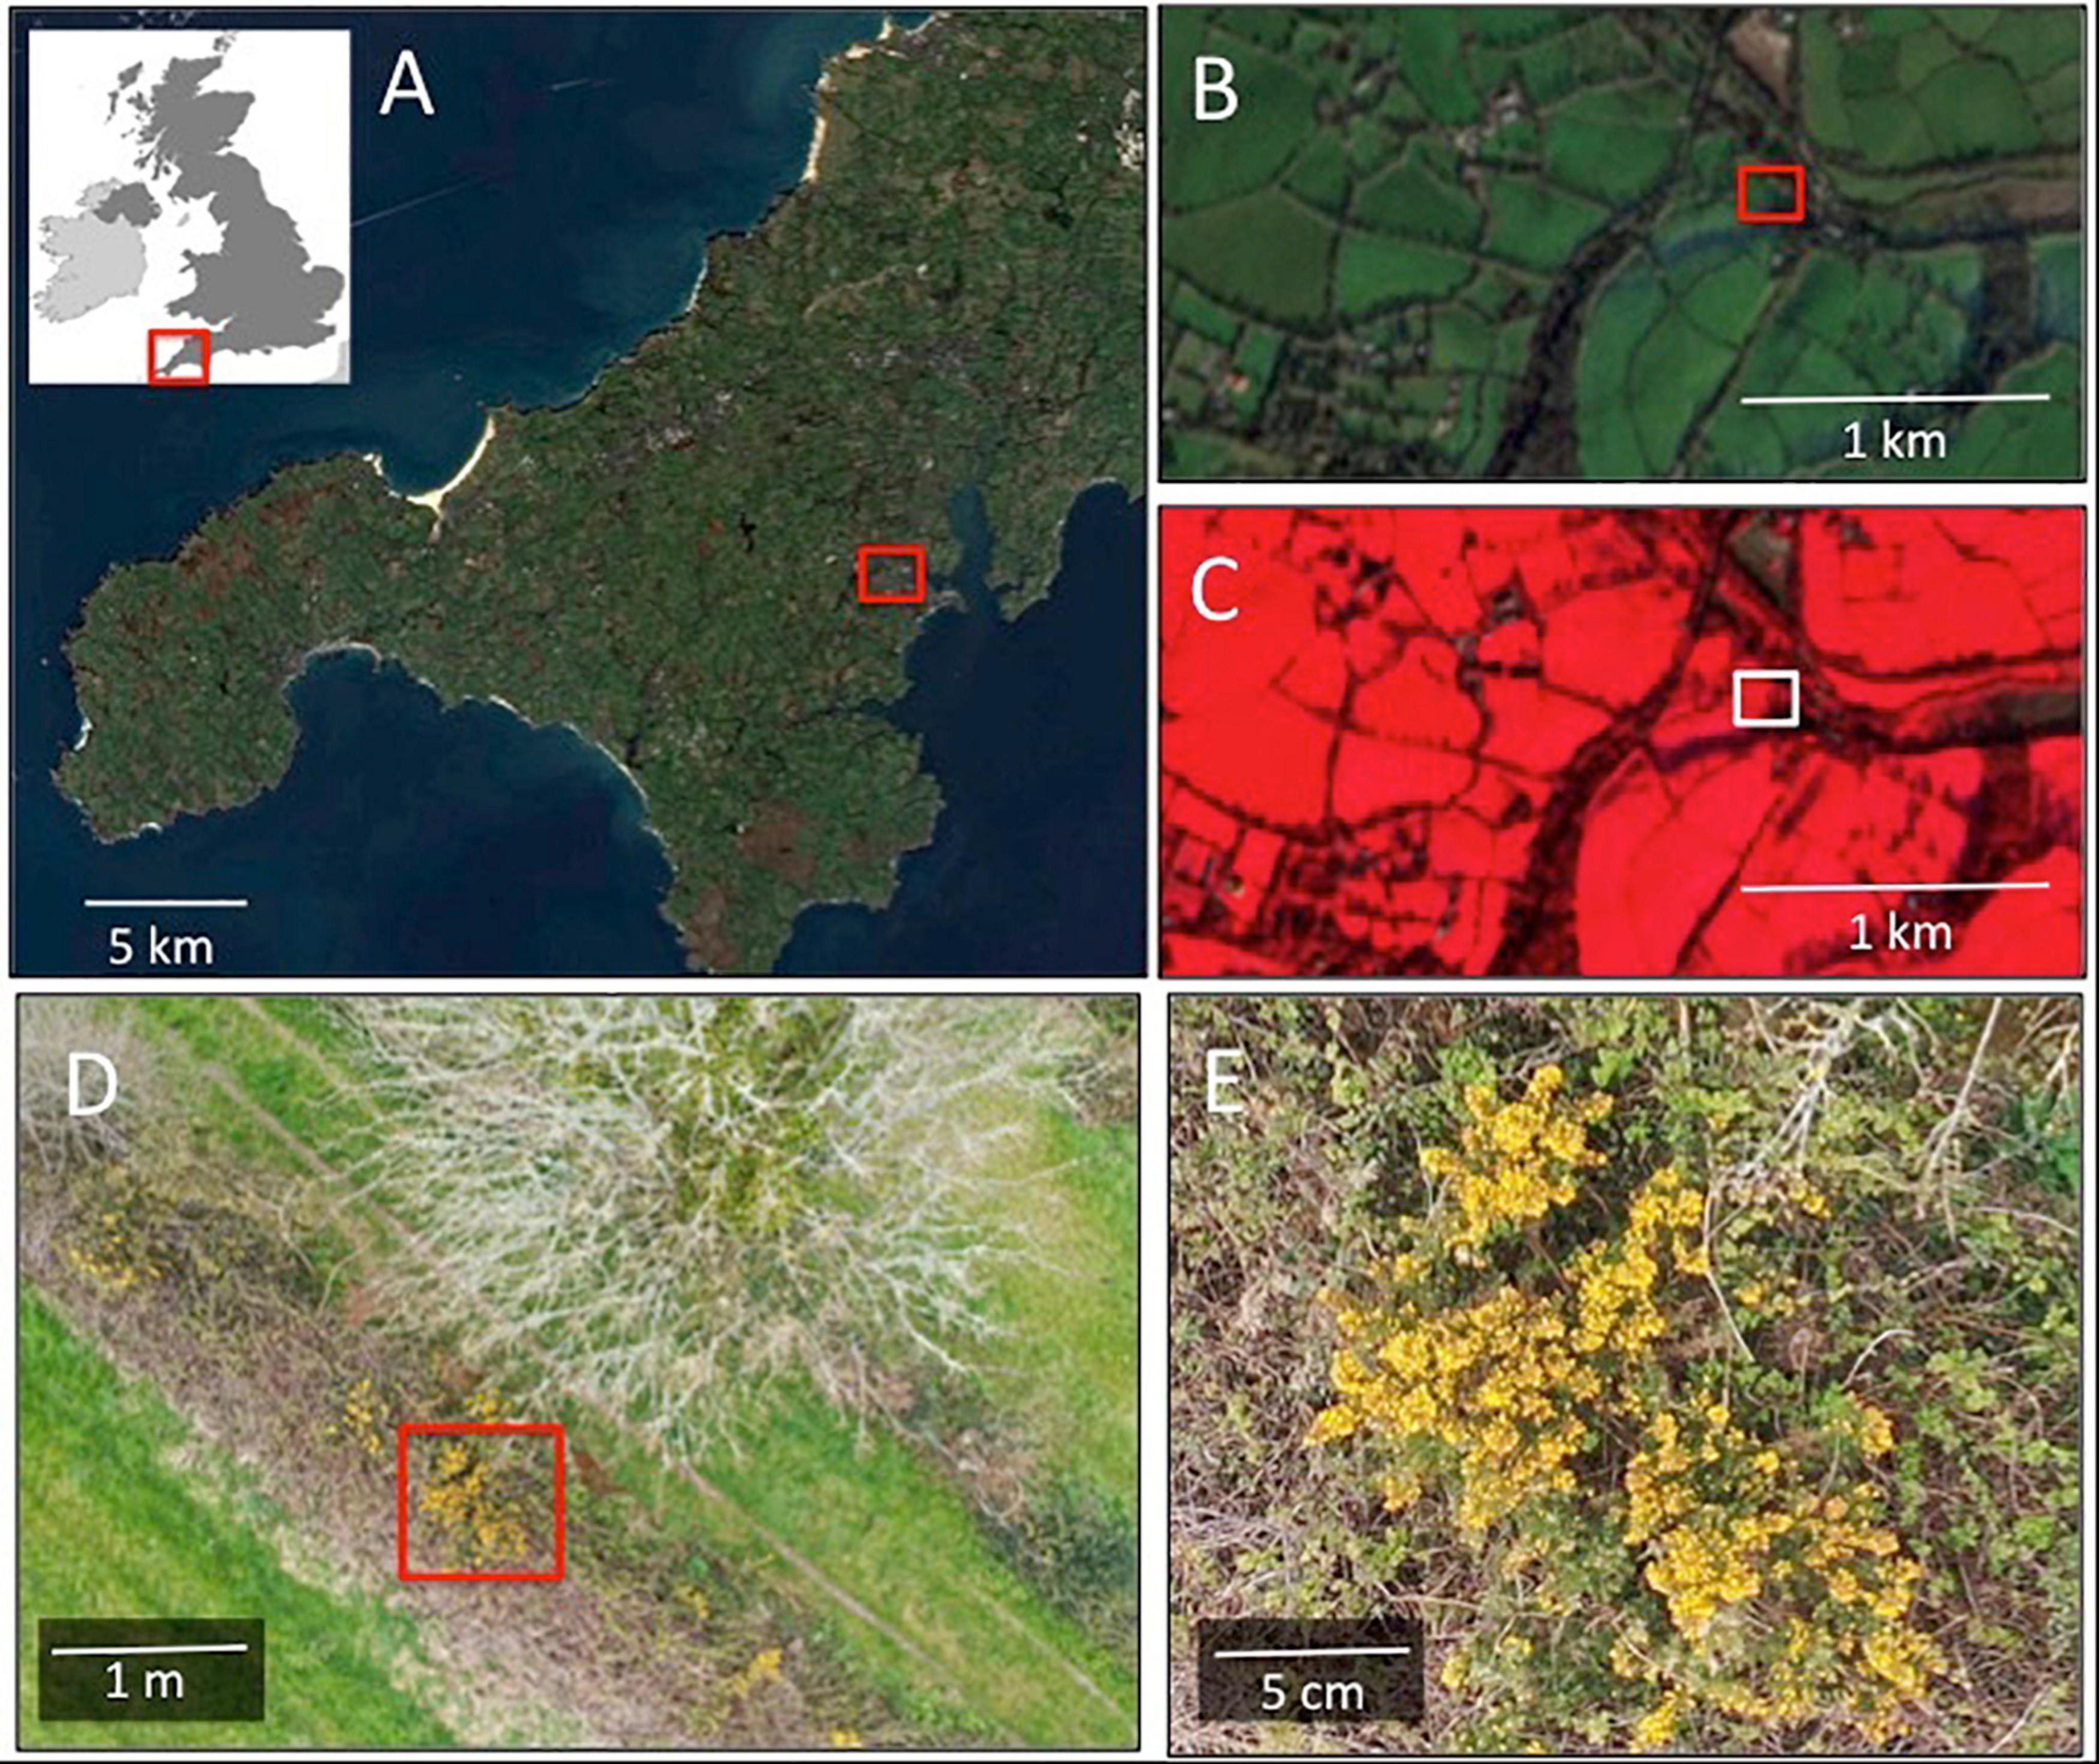
Figure 4. Scale-varying views of flower-scapes from satellites to drones. (A) Shows a regional perspective imaged in optical (RGB) wavelengths from the Sentinel-2 satellite at 10 m spatial resolution. (B) Is a local perspective of the highlighted region in (A), also at 10 m spatial resolution showing a neighborhood view comprising a mixed agricultural and residential area with various floristic resources including private gardens, woodlands and hedgerows. (C) Shows the same area as (B) but viewed using a false color composite (Bands 8, 4, 3). (D) Is a drone captured image from the region highlighted in (B,C) in optical wavelengths (RGB) acquired from a survey height of 25 m during spring budburst (April 2020). Gorse (Ulex europaeus; yellow) and blackthorn (Prunus spinosa; white) flowers can be seen in the hedgerow. The spatial resolution of this image is finer than 1 cm. (E) Is a highlight of the image shown in (D), over the area highlighted showing in detail a bunch of gorse flowers.
In agricultural biology, data obtained from drones has been critical to assessing the growth of individual crops and predicting their yields (Wan et al., 2018; Chen et al., 2019; López-Granados et al., 2019). Fine-grain data acquired by drones could also be important to studying the efficacy of alternative agricultural practices, such as those seeking to enhance crop yields by providing a mix of diverse floral resources to attract pollinators. These studies could be carried out using relatively simple-to-use and cheap consumer-grade technologies as evidenced by Xavier et al. (2018), who used a drone (Solo-3DR) and GoPro Hero 4 RGB camera (12-megapixel photos) to capture spatial data on floral resources. The study assessed the suitability of wildflower strips in attracting pollinators in two distinct types of environments: one in which the wildflower strips were adjacent to woodland, and another in which the wildflower strips were adjacent to agricultural crops. The researchers quantified individual wildflower species arranged in mixed 34 m × 10 m plots and sampled pollinator abundance within these plots. They found that the abundance and cover of floral resources was positively correlated with the number of pollinator visits at both sites, with an increase of just 0.12 m2 in floral cover resulting in 6–8 additional pollinator visits.
What Resources Are Available Within Floral Patches?
An important factor in the ability of landscapes to sustain pollinator populations is the quality of foraging patches within the landscape. Not all foraging patches are equal by virtue of their variable floristic composition that can provide different resources to pollinators. Floral abundance and floral richness are two established metrics by which the quality of foraging patches is typically assessed in landscape ecology. These metrics correlate broadly with higher pollinator visitation rates (Hegland and Boeke, 2006; Lázaro et al., 2020). However, this comes often at a cost of resolving the differences between different pollinators, their movements and behaviors and their role in intricate plant-pollinator networks (Lima et al., 2020; Ropars et al., 2020; Chakraborty et al., 2021). To facilitate more integrated empirical and modeling approaches, such as combining remote sensing data with network data and behavioral observations, it is useful to differentiate between floral species across patches. Remote-sensing techniques are best placed to capture spatial data at fine-grain over sufficiently large areas for quantifying different floral resources at ecologically relevant spatial scales. By segregating flowers in the images from the surrounding vegetation on the basis of their spectral reflectance profiles, novel information on the richness and abundance of floral resources within flower patches can be obtained.
So far, most studies that have used remote sensing to quantify flower number within foraging patches have come from precision agriculture, where flowering phenology and abundance have been used to predict crop yields (Wan et al., 2018; Chen et al., 2019; López-Granados et al., 2019). However, the quantification of floral species is also important for comparing the quantity and diversity of resources provided to pollinators by different types of floral patches, from fields of monocrops to patches of natural grassland and urban green spaces (Vrdoljak et al., 2016; Kremen et al., 2018; Ziaje et al., 2018Prado et al., 2021; Tew et al., 2021). To detect individual flowers at fine-grain using remote sensing, it is possible to utilize imagery from drones flown at low altitudes. Spectral data obtained through these remote sensing platforms are often processed using specialized VIs that have been developed to track small differences in the spectral reflectance of flowers across distinct color channels.
Using these VIs, the availability and development of distinct floral species can be precisely quantified and subsequently related to the quantity and quality of floral resources available within a foraging patch. Chen et al. (2019), for example, developed an enhanced bloom index (EBI) using multispectral data for quantifying the bloom intensity of individual almond flowers grown in orchards ranging in size between 21.5 and 222.5 hectares. EBI compared floral brightness in red, blue, and green channels against the low reflectivity of soil background reflectance in the red and blue channels and high reflectivity of leaves in the green channel (equation [1]):
Where R, B, and G represent reflectance in the red, blue and green channels and ε represents an adjusting constant.
Furthermore, optical images (R,G,B) acquired by standard cameras on drones can be processed using SfM photogrammetry workflows to generate 3D models of vegetation patches. These models can help researchers quantify flowers in structurally complex floral patches which would be beyond the visual reach of a ground-based observer, such as in flowering tree canopies and along hedgerows, which can serve as important foraging resources for pollinators (Carl et al., 2017; Smigaj and Gaulton, 2021; Figure 2). This technique allows reconstruction of the structure and distribution of floral patches for investigating relationships with pollinator fitness, abundance, and behaviors. Carl et al. (2017), for instance, used a MAPIR Survey2 RGB camera (6.17472 mm × 4.63104 mm FOV, focal distance of 3.97 mm) mounted on a hexacopter drone to obtain RGB imagery of black locust tree (Robinia pseudoacacia) flowers, which serve as an important food resource to honeybees. This allowed the crown structure to be resolved, while flowers were distinguished from the surrounding vegetation using reflectance intensity in the blue channel. The precise quantification of flowers across the trees’ 3D structures allowed the researchers to make predictions about the population of honeybees that the landscape could support. Similarly, Smigaj and Gaulton (2021) captured overlapping multi-spectral and RGB images using two different drones (DJI Matrice 600 with Micasense RedEdge-M multispectral camera, RGB, near red, NIR and DJI Phantom 4 Pro inbuilt RGB/NIR camera) to generate SfM-based models of hedgerow structures in an agricultural setting. The researchers were able to quantify and compare floral abundance within different hedgerow types using reflectance data in the red, green, blue and NIR channels, providing information on the quantity and quality of resources available to pollinators.
How Do Floral Patches Change Over Time?
The synchronization of flowering and pollinator emergence times are critical to sustaining plant-pollinator relationships. The availability of flowers within a foraging patch is dynamic across time and is affected by change in micro- and macroclimatic conditions and the spatial heterogeneity of the landscape, with differences in light exposure which leads to changes in the growth and flowering phenology of plants (Alsanius et al., 2017; Ogilvie and Forrest, 2017; Swierszcz et al., 2019). These effects are easily illustrated in urban environments, where plants grow in small, heterogenous patches that are often located near anthropogenic structures such as roads and buildings, which create a variety of microclimatic conditions, resulting in differences in the growth and abundance of floral species (Habel et al., 2018; Jung et al., 2020). As such, some pollinators in highly fragmented urban environments may face favorable conditions for foraging on diverse flowers (Rollings and Goulson, 2019; Ropars et al., 2019; Staab et al., 2020; Tew et al., 2021). However, across broad spatial scales, many natural landscapes which previously would have contained diverse floral resources have been homogenized into agricultural monocrops and urban lawns. Therefore, the limited floral diversity available to pollinators may also limit floral availability across the foraging season, potentially leading to dips in floral resource availability for pollinators at various times across the season.
Across broader spatial scales, changes in local environmental conditions driven by climate change have altered many species’ temporal distributions and the onset, peak and durations of flowering periods, changing the distribution of floral resources at given points in time (Chen et al., 2019). These environmental changes often have uneven effects on plants and pollinator populations, leading to “bottom-up” effects, limiting the food supply of pollinators, or “top–down” effects, limiting the reproductive potential of plants (Hegland et al., 2009). The flexibility of these relationships also remains unclear as pollinators may avoid the negative consequences of shifts in flowering emergence times depending on their ability to exploit a range of floral resources in the environment.
Answering questions about timing of phenological phenomena from remote sensing data requires, beyond all else, regular repeat survey coverage (Figure 2). The frequency with which flowers can be surveyed depends on the remote sensing platform utilized. The temporal resolution of satellite datasets are pre-determined by the satellite’s orbital period and are typically used to examine vegetation along coarse and moderate temporal scales. Additionally, there are trade-offs between enhanced spatial and temporal resolution, as satellites in low orbit that provide fine spatial resolution data have longer re-visit periods. By comparison, airplane and drone pilots have much greater control over the temporal resolution of the data collected. Airplanes and drones can be deployed according to the user’s demands (albeit at substantially higher costs with airplanes), allowing for very fine temporal resolution data to be collected. The ability to choose when an aircraft is deployed additionally allows researchers to select when floral surveys are carried out and select the optimal lighting conditions to maximize the visibility of flowers against the background. The latter is important to distinguishing flowers from green vegetation in photographs taken by RGB cameras mounted on drones flown at several meters in altitude (Figure 5). This is particularly relevant to drone-acquired imagery as many recreational drones carry inbuilt RGB cameras that could facilitate the capture of floral resources at low financial cost and with little need for further processing, increasing the accessibility of these technologies to scientists and conservationists with limited research funding.
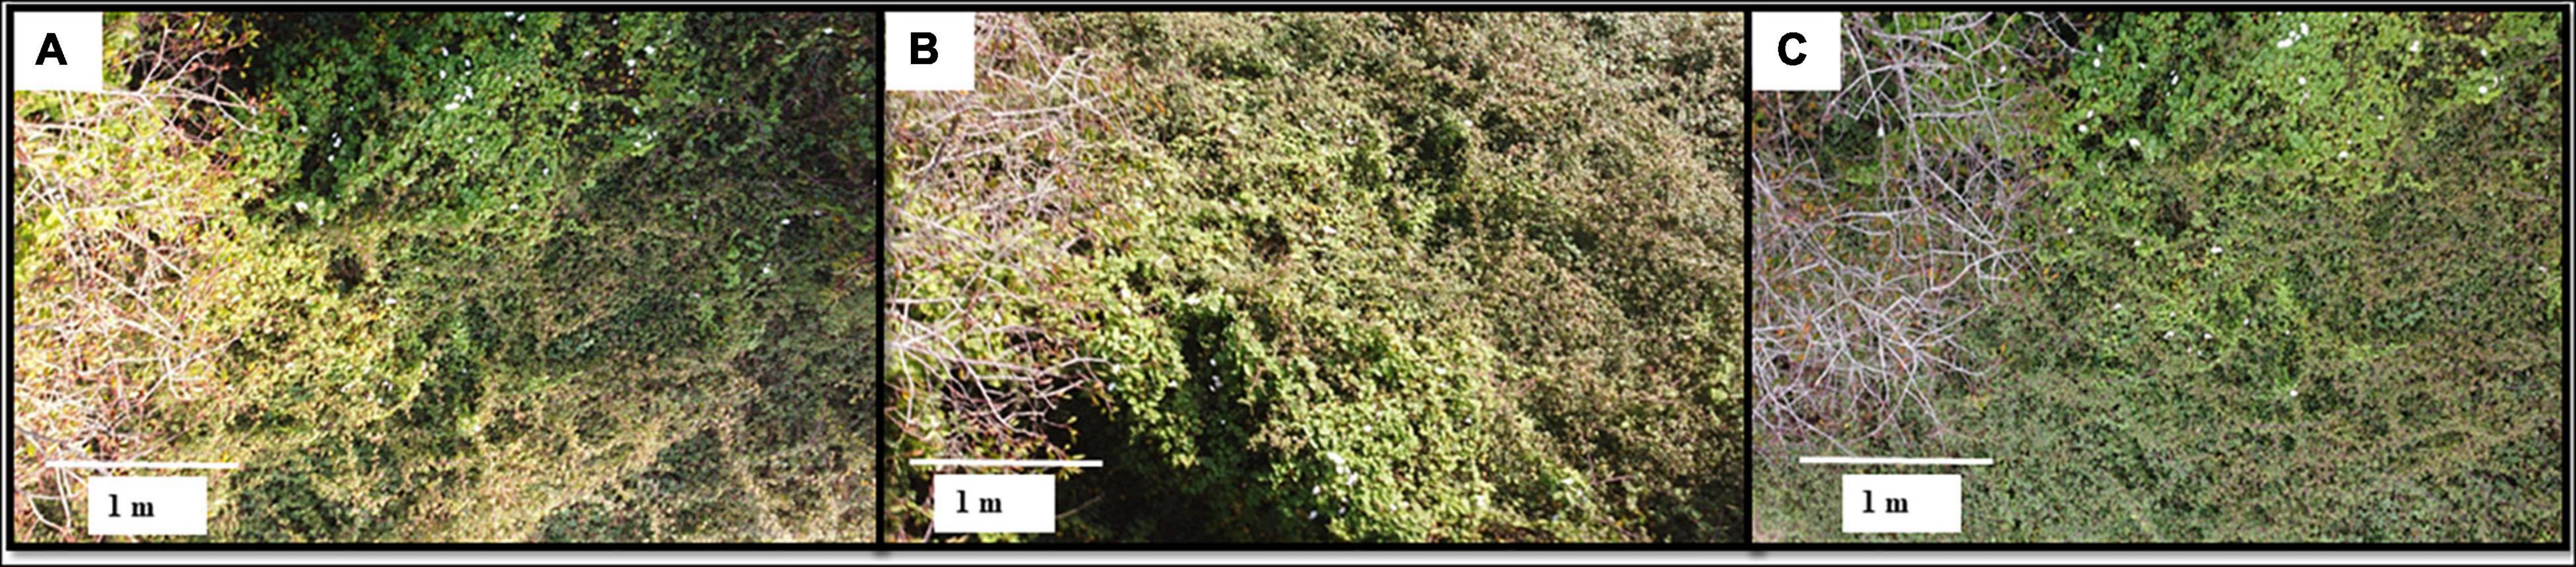
Figure 5. The visibility of flowering bindweed (Convolvulus) when imaged under varying natural light intensities at approximately the same location (A) 9:30 (light intensity: 1792 lum/ft2), (B) 12:00 (light intensity: 4096 lum/ft2), and (C) 17:30 (light intensity: 2688 lum/ft2) using an RBG camera (DJI Mavic Mini inbuilt camera) on October 9th, 2021. Light intensity was measured using a HOBO Pendant temperature/light data logger (Onset, Bourne, MA, United States). The ability to discriminate the flowers from the background can be impaired under some viewing and lighting conditions.
Data obtained from satellites have been used to characterize temporal changes to flower patches over broad areas of landscape (e.g., hundreds to thousands of kilometers), and particularly in agricultural research to study changes to patches of mass flowering crops across various time scales (e.g., weeks, years, decades) (Zhang et al., 2003; Leong and Roderick, 2015; Dixon et al., 2021). Changes to mass flowering crops may be important to studying pollinator populations in agricultural environments, as crop fields dense in flowering plants may become deserts to pollinators within short periods of time. If such agricultural fields occupy extensive areas, the landscape may be unsuitable for sustaining pollinators in the long-term (Kovács-Hostyánszki et al., 2017). A growing number of studies are using satellite data to track changes in flowering phenology across landscapes in relation to the abundance or emergence times of pollinators. Leong and Roderick (2015), for example, analyzed changes in vegetation within natural and human-altered grassland landscapes in California. The researchers used spectral data obtained from MODIS to examine changes in normalized vegetation index (NDVI) and enhanced vegetation index (EVI) across agricultural, urban and natural landscapes comprising a 50 × 50 km region. They observed different trends in phenology across the three landscape types and corresponding differences in bee abundance over the 14-year (2000–2014) study period. Therefore, when paired with data on the richness, abundance and behaviors of distinct pollinator types, temporal data obtained from satellites can help uncover relationships between the availability of flower patches over time and the types of pollinators or pollination services that the landscape can support.
Drone data could be useful for examining how floral patches change in terms of their reward availability to pollinators (for a review see Bloch et al., 2017). Drones could be particularly useful to studying changes to flower patches over fine temporal scales (Neumann et al., 2019) especially when the floral species or its pollinators are only available for short periods of time (Xu and Servedio, 2021), and to track the development of individual flowers in patches containing mixed floral species. Shifts in flowering time within mixed floral patches may not be apparent when the whole patch is studied as a single unit. Investigations into the flowering dynamics of distinct floral species may be critical to understanding the use of the foraging patch as a food resource to different pollinator species over time (Simba et al., 2018; Kehrbergerand Holzschuh, 2019).
Changes to patches of mixed floral species can be measured using a variety of sensors, from consumer-grade RGB cameras to hyperspectral scanners, depending on a variety of environmental and study-specific factors, such as the reflectance spectra of the flowers studied and the lighting conditions under which the data are acquired. Few studies have attempted to investigate flowering in such heterogeneous environments at such fine spatial grain as it is difficult to obtain accurate floral counts due to the spectral complexity of the reflectance from the ground. Landmann et al. (2015), for example, used a hyperspectral remote sensor, the AISA/Eagle pushbroom scanner that produces images in 64 spectral bands (max spectral resolution of 2.9 nm), mounted on a drone to track the spatial availability of floral resources at a 100 km2 study site in the African savannah. This hyperspectral dataset allowed the researchers to detect different flower types against the background. In addition to tracking shifts in the spatial distribution of floral resources over this time period, the researchers found an overall increase in floral resources from 2013 to 2014. This example shows how drones can help researchers detect small-scale shifts in floral resource availability over long periods for a better understanding of the consequences for the pollinator populations present within it. Furthermore, there is an increasing demand for information on how changes to floral resources affect pollinator populations, which are vital to the production of many human food crops. For example, actions by government agencies, such as the European Commission’s EU Pollinators Initiative calls for research investigating the effects of climate and landscape change on pollinators and their food resources. Remote sensing approaches could contribute to increasing the scale, efficiency, and quantity of information required for such research.
Discussion
Remote sensing offers unparalleled means of measuring flowering vegetation at various grains, extents and timescales. Alterations to floral resources can have long-lasting effects on pollinator fitness, abundance and behaviors over a range of spatial and temporal scales (Hegland et al., 2009; Ogilvie and Forrest, 2017) and can include changes to populations, forager sizes, and colony sizes, as well as shifts to their foraging strategies. The ability to use remote sensing data to rapidly and accurately acquire spatial information pertaining to pollinators’ foraging habitats and their floral richness and abundance could vastly improve understanding of how landscapes affect insect pollinators and their populations. Remote sensing approaches can facilitate the capture of large portions or the entirety of pollinators’ foraging or migration ranges, which may allow for more spatially representative sampling of floral resources and can reduce the time and labor costs associated with manual sampling. Pollinating insects vary widely in how far they travel to forage or during migrations, with small-sized pollinators typically traveling shorter distances up to 1.4 km (Nicholls et al., 2022). Larger-sized, generalist pollinators travel further (e.g., social bees typically travel 1–2 km while the bumblebee-tailed bumblebee and Western honeybee can travel 12–15 km), while some species of butterfly can travel hundreds to thousands of kilometers during migrations (e.g., Chowdhury et al., 2020). Additionally, the required sampling timescales vary depending on individual or colony lifespans. Therefore, both flight range and lifespan of an individual or colony will determine which remote sensing platform is most appropriate for capturing information pertaining to their food, nesting and mating resources. While a variety of manual methods exist for tracking insect movements in the field (see Kissling et al., 2014; Montgomery et al., 2021) using existing technologies for tracking individual insect movements is particularly challenging given their small body sizes paired with quick movements, leading to rapidly changing backgrounds against which they must be detected. Therefore, the objective is to pair remote sensing approaches with novel or traditional means of quantifying insect movements or behaviors in the field. Also, remote sensing approaches can provide an efficient and potentially accurate means for understanding the landscape context in which behaviors occur. Additionally, both natural and human-made structures have the potential to affect pollinator dispersal and habitat use, facilitating or reducing access to flowers across landscapes or changing microclimatic conditions (Morandin and Kremen, 2013; Habel et al., 2018). This is particularly relevant due to the rapid development of many rural habitats into agricultural fields or urban environments both in the UK and globally (Haddad et al., 2015; Wenzel et al., 2020). Not only can remote sensors capture changes to the spectral signatures of flowering vegetation over time, but changes to the volumetric characteristics of a landscape can be resolved using LiDAR sensors carried by drones or airplanes, or SfM photogrammetry, which generates models of 3D structures using overlapping images. However, the remote sensing platforms, sensors and data types utilized to measure floral resources must facilitate studying pollination at the spatial and temporal scales of interest.
Using remote sensing to measure floral resources in situ remains relatively novel within the field of pollination research. Most existing studies have used coarse-grain satellite imagery to examine one or a few species of mass flowering crops over large spatial areas and relate broad measures and categorization of floral availability (e.g., field, hedge, forest, urban green space coverage) to the abundance, physiology and behaviors of insect pollinators. The relative popularity of using coarse-grain satellite imagery in pollination research can be explained by the low (often free) cost of satellite imagery, the amount of publicly available information on how to process satellite data, prior knowledge of the coloration of the flowers under study and the narrow spectral variation within flower patches containing a single species, all of which makes it easy to broadly outline areas of floral growth. However, this information typically does not tell us about differences in abundance and flowering characteristics between individual plants, the availability of wild flowers and other sparsely distributed flowers across the landscape, or the floral diversity and volumetric character of foraging patches.
Although relatively novel within the field of pollination research, drones can capture imagery along very fine spatial scales, such that individual flowers can be detected and quantified. The use of drone imagery to quantify the spatial distributions and timing of distinct floral species could facilitate studies examining how pollinators interact with different floral types and vegetation structures along fine spatial scales in the field and their reliance on particular food resources for survival. Additionally, combining drone imagery with behavioral observations of insect pollinators could show how gradual shifts in flower number, species richness and flowering onset influence their populations from year-to-year or across decades and could be critical to modeling habitat requirements for different pollinators and identifying areas of suitable habitat across a landscape. Furthermore, drones can be deployed according to the researcher’s demands, allowing the researcher to select the optimal environmental conditions under which to capture floral imagery. The ability to control when and how often flowers are sampled also facilitates repeated sampling along very fine temporal scales, whereas existing data acquired by airplanes and satellites have fixed temporal resolutions. However, there are trade-offs between spatial resolution and the extent of landscape that can be covered. Drones, for instance, can provide spatial data at very fine grain and cover much larger areas than traditional methods, such as transect measurements. However, they are inefficient for capturing vast areas of landscape in comparison to satellites and airplanes.
Sensors carried on-board remote sensing platforms are critical to defining what flower types and floral features can be analyzed. In agricultural research, the interest is focused on specific crops, and flower colors are therefore known for selecting appropriate sensors to maximize the visibility of the flowers against the background. However, in natural habitats and in urban environments, where differently colored flowers frequently exist in mixed distributions, selecting the appropriate sensors to capture flowering dynamics within the patch would be more difficult. One solution is to use hyperspectral sensors capable of simultaneously sampling multiple wavelengths of light and develop vegetation indices that maximize the visibility of distinct floral species against the background (Landmann et al., 2015). Although using hyperspectral remote sensing to study vegetation is relatively novel compared to the use of multispectral remote sensing, advancements in this field may be critical to capturing the health and flowering dynamics of different species at fine spatial and temporal grain. This may facilitate detecting changes in flowering over short periods of time and corresponding shifts to floral rewards, which can influence pollinators’ foraging decisions (Ito et al., 2021). Furthermore, some studies have used hyperspectral datasets to establish relationships between species biodiversity and spectral diversity. The Spectral Variability Hypothesis, for example, argues that the reflectance spectra of vegetation are related to plant biodiversity (Palmer et al., 2000, 2002). Therefore, advances in hyperspectral remote sensing may help uncover relationships between the spectral diversity of a given area and its ability to sustain pollinator populations, and could be a ripe area for future exploration by pollination ecologists.
Another means of capturing floral richness at fine-grain is to use multispectral sensors or RGB cameras mounted on drones flown at low altitudes to capture floral imagery. While this option can be relatively cost-efficient and simple to deploy, the image quality can be greatly affected by environmental conditions in the field, which could potentially make it difficult to resolve flowers against the background.
One important barrier to using drones in ecological fieldwork is the increased adoption of legislation limiting the use of drones over public and private land and airspace. As the debates over who has the right to use airspace over privately- and government-owned lands intensify, the potential benefits to using drones for assessing landscape change are often overlooked. The conflicts over the use of airspace come at a time when recent developments in drones, sensors, and processing software have revolutionized researchers’ abilities to analyze the spectral and structural properties of vegetation along fine spatial scales. Simultaneously, the increase in cost-effective consumer-grade drones and cameras could allow for their widespread use in pollination research. The costs of drones can be further reduced by using DIY drone kits or by altering existing pieces of hardware to capture floral resources1, making them accessible to researchers on low budgets (Moudrý et al., 2019). Along with reductions in cost, the rise in the number of hobbyists operating drones has allowed online communities to flourish. Such communities may stimulate innovation and make operating drones increasingly accessible to beginner pilots.
Conclusion
Across the globe, anthropogenic activities are accelerating changes to landscapes in which pollinating insects forage. These changes can affect the size, shape and number of foraging patches in the landscape and the quantity and quality of floral resources they contain. Spatial and temporal changes to floral resources may have diverse consequences for pollinator behaviors, population sizes, reproductive strategies, and pollination services. However, the extent to which changes to floral resources affect different types of pollinating insects and along which spatial and temporal scales remains relatively unknown. Traditional methods for floral sampling, such as manually counting flowers using transects and quadrats can be difficult to use along diverse spatial and temporal scales, as they can be laborious, time-consuming, limited by floral features that are detectable by the human eye and may not accurately reflect floral distributions present across a pollinator’s entire foraging or migration range. However, drones and satellites are well-suited to capturing changes in the richness and abundance of floral resources through RGB images, spectral, and structural data. Additionally, many of the methods for capturing and processing drone and satellite data established in geographical and computer sciences have now become streamlined, simplified and reduced in cost. This has made them much more accessible to ecologists and conservationists who often operate on small research budgets and may not have specialist knowledge of remote sensing technologies. This trend is exemplified by the recent widespread availability of consumer-grade drones, free or cost-effective apps for piloting drones, recreational drone use and online communities aimed at improving drone hardware and software. Satellites, airplanes and drones can be used to generate datasets on floral resources and can revolutionize our understanding of the spatial and temporal scales along which pollinator species are affected by environmental change.
Author Contributions
DG drafted the manuscript. All authors conceived the project, contributed to writing, and approved the final version.
Funding
DG was funded by the Biotechnology and Biological Sciences Research Council-South West Biosciences Doctoral Training Partnership (BB/M009122/1), in partnership with the South Devon AONB (United Kingdom).
Conflict of Interest
The authors declare that the research was conducted in the absence of any commercial or financial relationships that could be construed as a potential conflict of interest.
Publisher’s Note
All claims expressed in this article are solely those of the authors and do not necessarily represent those of their affiliated organizations, or those of the publisher, the editors and the reviewers. Any product that may be evaluated in this article, or claim that may be made by its manufacturer, is not guaranteed or endorsed by the publisher.
Acknowledgments
We are grateful to Roger English, South Devon AONB, for continuous support and advice.
Footnotes
References
Alsanius, B.W., Bergstrand, K.J., Hartmann, R., Gharaie, S., Wohanka, W., Dorais, M., and Rosberg Karin, A. (2017). Ornamental flowers in new light: artificial lighting shapes the microbial phyllosphere community structure of greenhouse grown sunflowers (Helianthus annuus L.). Sci. Hortic. 216, 234–247. doi: 10.1016/j.scienta.2017.01.022
Anderson, K., and Gaston, K.J. (2013). Lightweight unmanned aerial vehicles will revolutionize spatial ecology. Front. Ecol. Environ. 11, 138–146. doi: 10.2307/23470549
Asner, P.G., and Martin, R.E. (2016). Spectranomics: Emerging science and conservation opportunities at the interface of biodiversity and remote sensing. Glob. Ecol. Conserv. 8, 212–219. doi: 10.1016/j.gecco.2016.09.010
Beduschi, T., Kormann, U.G., Tscharntke, T., and Scherber (2018). Spatial community turnover of pollinators is relaxed by semi-natural habitats, but not by mass-flowering crops in agricultural landscapes. Biol. Conserv. 221, 59–66. doi: 10.1016/j.biocon.2018.01.016
Behnia, R., and Desplan, C. (2015). Visual circuits in flies: beginning to see the whole picture. Curr. Opin. Neurobiol. 34, 125–132. doi: 10.1016/j.conb.2015.03.010
Betts, M.G., Hadley, A.S., and Kormann, U. (2019). The landscape ecology of pollination. Landscape Ecol. 34, 961–966. doi: 10.1007/s10980-019-00845-4
Biesmeijer, J. C., Roberts, S. P., Reemer, M., Ohlemuller, R., Edwards, M., Peeters, T, et al. (2006). Parallel declines in pollinators and insect-pollinated plants in Britain and the Netherlands. Science 313, 351–354. doi: 10.1126/science.1127863
Bloch, G., Bar-Shai, N., Cytter, Y., and Green, R. (2017). Time is honey: circadian clocks of bees and flowers and how their interactions may influence ecological communities. Philos. T.R. Soc. B. 372:1734. doi: 10.1098/rstb.2016.0256
Bommarco, R., Biesmeijer, C., Meyer, B., Potts, S.G., Pöyry, J., Roberts, S.P.M., Steffan-Dewenter, I., and Öckinger, E. (2010). Dispersal capacity and diet breadth modify the response of wild bees to habitat loss. Proc. Royal Soc. B. 277, 2075–2082. doi: 10.1098/rspb.2009.2221
Carl, C., Landgraf, D., van der Maaten-Theunissen, M., Biber, P., and Pretzsch, H. (2017). Robinia pseudoacacia l. Flowers analyzed by using an unmanned aerial vehicle (uav). Remote Sens. Basel. 9:1091. doi: 10.3390/rs911109110.3390/rs9111091
Carson, H.W., Lass, L.W., and Callihan, R.H. (1995). Detection of yellow hawkweed (Hieracium pretense) with high resolution multispectral digital imagery. Weed Technol. 9, 477–483. doi: 10.1017/s0890037x0002371x
Chakraborty, P., Chatterjee, S., Smith, B.M., and Basu, P. (2021). Seasonal dynamics of plant pollinator networks in agricultural landscapes: how important is connector species identity in the network? Oecologia 196, 825–837. doi: 10.1007/s00442-021-04975-y
Chen, B., Jin, Y.F., and Brown, P. (2019). An enhanced bloom index for quantifying floral phenology using multi-scale remote sensing observations. Isprs. J. Photogramm. 156, 108–120. doi: 10.1016/j.isprsjprs.2019.08.006
Chen, J., Zang, Q., Chen, B., Yongguang, Z., Ma, L., and Zhaohui, L. (2020). Evaluating Multi-Angle Photochemical Reflectance Index and Solar-Induced Fluorescence for the Estimation of Gross Primary Production in Maize. Remote Sens. 12:2812. doi: 10.3390/rs12172812
Chowdhury, S., Zalucki, M.P., Amano, T., Woodworth, B., Venegas-Li, R., and Fuller, R.A. (2020). Seasonal spatial dynamics of butterfly migration. Ecol. Lett. 24, 1814–1823. doi: 10.1111/ele.13787
Cibuk, M., Budak, U., Guo, Y.H., Ince, M.C., and Sengur, A. (2019). Efficient deep features selections and classification for flower species recognition. Measurement 137, 7–13. doi: 10.1016/j.measurement.2019.01.041
Collett, T. S., Graham, P., Harris, R. A., and Hempel de Ibarra, N. (2006). Navigational memories in ants and bees: memory retrieval when selecting and following routes. Adv. Study Behav. 36, 123–172. doi: 10.1016/s0065-3454(06)36003-2
Collett, T.S., and Collett, M. (2002). Memory use in insect visual navigation. Nat. Rev. Neurosci. 3, 542–552. doi: 10.1038/nrn872
Coops, N.C., Tompalski, P., Goodbody, T.R.H., Queinnec, M., Luther, J.E., Bolton, D.K., et al. (2021). Modelling lidar-derived estimates of forest attributes over space and time: A review of approaches and future trends. Remote Sens. Environ. 260:112477. doi: 10.1016/j.rse.2021.112477
Cunliffe, A.M., Brazier, R.E., and Anderson, K. (2016). Ultra-fine grain landscape-scale quantification of dryland vegetation structure with drone-acquired structure-from-motion photogrammetry. Remote Sens. Environ. 183, 129–143. doi: 10.1016/j.rse.2016.05.019
Danner, N., Molitor, A.M., Schiele, S., Härtel, S., and Steffan-Dewenter, I. (2016). Season and landscape composition affect pollen foraging distances and habitat use of honey bees. Ecol. Appl. 26, 1920–1929 doi: 10.1890/15-1840.1
Dixon, D.J., Callow, J.N., Duncan, J.M.A., Setterfield, S.A., and Pauli, N. (2021). Satellite prediction of forest flowering phenology. Remote Sens. Environ. 255: 112197. doi: 10.1016/j.rse.2020.112197
Duffy, J.P., Anderson, K., Fawcett, D., Curtis, R.J., and Maclean, I.M. (2021). Drones provide spatial and volumetric data to deliver new insights into microclimate modelling. Landsc. Ecol. 36, 685–702 doi: 10.1007/s10980-020-01180-9
Duffy, J.P., Cunliffe, A.M., DeBell, L., Sandbrook, C., Wich, S.A., Shutler, J.D, et al. (2018). Location, location, location: considerations when using lightweight drones in challenging environments. Remote. Sens. Ecol. Conserv. 4, 7–19 doi: 10.1002/rse2.58
Egelhaaf, M., and Kern, R. (2002). Vision in flying insects. Curr. Opin. Neurobiol. 12, 699–706 doi: 10.1016/s0959-4388(02)00390-2
Elvidge, C.D., and Chen, Z. (1995). Comparison of broad-band and narrow-band red and near-infrared vegetation indices. Remote Sens. Env. 54, 38–48. doi: 10.1016/0034-4257(95)00132-k
Fang, S.H., Tang, W.C., Peng, Y., Gong, Y., Dai, C., Chai, R.H., and Liu, K. (2016). Remote estimation of vegetation fraction and flower fraction in oilseed rape with unmanned aerial vehicle data. Remote Sens. 8:416. doi: 10.3390/rs8050416
Filippelli, S.K., Lefsky, M.A., and Rocca, M.E. (2019). Comparison and integration of LiDAR and photogrammetric point clouds for mapping pre-fire forest structure. Remote Sens. Environ. 224, 154–166. doi: 10.1016/j.rse.2019.01.029
Frasnelli, E., Robert, T., Chow, P.K.Y., Scales, B., Gibson, S., Manning, N, et al. (2021). Small and large bumblebees invest differently when learning about flowers. Curr. Biol. 31, 1058–1064 doi: 10.1016/j.cub.2020.11.062
Gamon, J.A., Serrano, L, and Surfus, J.S. (1997). The photochemical reflectance index: an optical indicator of photosynthetic radiation use efficiency across species, functional types, and nutrient levels. Oecologia 112, 492–501. doi: 10.1007/s004420050337
Gao, L., Wang, X.F., Johnson, B.A., Tian, Q.J., Wang, Y., Verrelst, J., et al. (2020). Remote sensing algorithms for estimation of fractional vegetation cover using pure vegetation index values: A review. Isprs J. Photogramm. Remote Sens. 159, 364–377 doi: 10.1016/j.isprsjprs.2019.11.018
Garibaldi, L. A., Steffan-Dewenter, I., Kremen, C., Morales, J. M., Bommarco, R., Cunningham, S., et al. (2011). Stability of pollination services decreases with isolation from natural areas despite honey bee visits. Ecol. Lett. 14, 1062–1072 doi: 10.1111/j.1461-0248.2011.01669.x
Ghazoul, J. (2005). Pollen and seed dispersal among dispersed plants. Biol. Rev. 80, 413–443 doi: 10.1017/s1464793105006731
Gibb, H., and Hochuli, D.F. (2002). Habitat fragmentation in an urban environment: large and small fragments support different arthropod assemblages. Biol. Conserv. 106, 91–100. doi: 10.1016/S0006-3207(01)00232-4
Gogul, I., and Kumar, V.S. (2017). “Flower species recognition system using convolution neural networks and transfer learning”. in 4th International Conference on Signal Processing, Communication and Networking (ICSCN), (New Jersey, NJ: IEEE) doi: 10.3389/fpls.2021.804140
Goulson, D., Nicholls, E., Botias, C., and Rotheray, E.L. (2015). Bee declines driven by combined stress from parasites, pesticides, and lack of flowers. Science 347:1255957. doi: 10.1126/science.1255957
Greenleaf, S. S., Williams, N. M., Winfree, R., and Kremen, C. (2007). Bee foraging ranges and their relationship to body size. Oecologia 153, 589–596 doi: 10.1007/s00442-007-0752-9
Habel, J.C., Teucher, M., and Rodder, D. (2018). Mark-release-recapture meets species distribution models: Identifying microhabitats of grassland butterflies in agricultural landscapes. PLoS One 13:e0207052. doi: 10.1371/journal.pone.0207052
Haddad, N.M, Brudvig, L.A., Clobert, J., Davies, K.F., Gonzalez, A., Holt, R.D., et al. (2015). Habitat fragmentation and its lasting impact on earth’s ecosystems. Sci. Adv 1:e1500052. doi: 10.1126/sciadv.15000529
Hancock, S., Anderson, K., Disney, M., and Gaston, K.J. (2017). Measurement of fine-spatial-resolution 3D vegetation structure with airborne waveform lidar: Calibration and validation with voxelised terrestrial lidar. Remote Sens. Environ. 188, 37–50 doi: 10.1016/j.rse.2016.10.041
Hegland, S., Anders, N., Lazaro, A., Bjerknes, A., and Totland, O. (2009). How does climate warming affect plant-pollinator interactions? Ecol. lett. 12, 184–195. doi: 10.1111/j.1461-0248.2008.01269.x
Hegland, S.J., and Boeke, L. (2006). Relationships between the density and diversity of floral resources and flower visitor activity in a temperate grassland community. Ecol. Entomol. 31, 532–538. doi: 10.1111/j.1365-2311.2006.00812.x
Hempel de Ibarra, N., Vorobyev, M., and Menzel, R. (2014). Mechanisms, functions and ecology of colour vision in the honeybee. J. Comp. Physiol. A. 200, 411–433. doi: 10.1007/s00359-014-0915-1
Hofmann, P., Strobl, J., and Nazarkulova, A. (2011). Mapping Green Spaces in Bishkek—How Reliable can Spatial Analysis Be? Remote Sens. 3, 1088–1103 doi: 10.3390/rs3061088
Holman, F.H., Riche, A.B., Michalski, A., Castle, M, Wooster, MJ, and Hawkesford, MJ. (2016). High throughput field phenotyping of wheat plant height and growth rate in field plot trials using uav based remote sensing. Remote Sens. Basel 8:1031. doi: 10.3390/rs8121031
Hong, S.D., Schepers, J.S., Francis, D.D., and Schlemmer, M.R. (2007). Comparison of ground-based remote sensors for evaluation of corn biomass affected by nitrogen stress. Commun. Soil Sci. Plant Anal. 38, 2209–2226 doi: 10.1080/00103620701549157
Hosoi, F., and Omasa, K. (2009). Estimating vertical plant area density profile and growth parameters of a wheat canopy at different growth stages using three-dimensional portable lidar imaging. Isprs. J. Photogramm. 64, 151–158 doi: 10.1016/j.isprsjprs.2008.09.003
Hunt, E.R., and Williams, A.E.P. (2006). Detection of flowering leafy spurge wit satellite multispectral imagery. Rangel Ecol and Manag. 59, 494–499. doi: 10.2111/05-216R.1
Islam, S., Foysal, M.F.A., and Jahan, N. (2020). “A computer vision approach to classify local flower using convolutional neural network”. in International Conference on Intelligent Computing and Control Systems (ICICCS), (New Jersey, NJ: IEEE).
Ito, K., Suzuki, M.F., and Mochizuki, K. (2021). Evolution of honest reward signal in flowers. Proc. Royal Soc. B. 288:20202848. doi: 10.1098/rspb.2020.2848
Jackson, T.D., Williams, G.J., Walker-Springett, G., and Davies, A.J. (2020). Three-dimensional digital mapping of ecosystems: A new era in spatial ecology. P. Roy. Soc. B Biol. Sci. 287:20192383. doi: 10.1098/rspb.20110.1098/rspb.2019.2383
Jung, S.H., Kim, A.R., An, J.H., Lim, C.H., Lee, H., and Lee, C.S. (2020). Abnormal shoot growth in Korean red pine as a response to microclimate changes due to urbanization in Korea. Int. J. Biometeorol. 64, 571–584. doi: 10.1007/s00484-019-01843-6
Kehrberger, S., and Holzschuh, A. (2019). How does timing of flowering affect competition for pollinators, flower visitation and seed set in an early spring grassland plant? Sci. Rep. 9:15593. doi: 10.1038/s41598-019-51916-0
Kelber, A., and Somanathan, H. (2019). Spatial vision and visually guided behavior in Apidae. Insects 10:418. doi: 10.3390/insects10120418
Khalifa, S. A. M., Elshafiey, E. H., Shetaia, A. A., Abd El-Wahed, A. A., Algethami, A. F., Musharraf, S. G., et al. (2021). Overview of Bee Pollination and Its Economic Value for Crop Production. Insects 12:688. doi: 10.3390/insects12080688
Kissling, W. D., Pattemore, D. E., and Hagen, M. (2014). Challenges and prospects in the telemetry of insects. Biol. Rev. 89, 511–530. doi: 10.1111/brv.12065
Knaden, M., and Graham, P. (2016). The sensory ecology of ant navigation: from natural environments to neural mechanisms.Annu. Rev. Entomol. 61, 63–76. doi: 10.1146/annurev-ento-010715-023703
Kovács-Hostyánszki, A., Espíndola, A., Vanbergen, A. J., Settele, J., Kremen, C., and Dicks, L. V. (2017). Ecological intensification to mitigate impacts of conventional intensive land use on pollinators and pollination. Ecol Lett. 20, 673–689. doi: 10.1111/ele.12762
Kowe, P., Mutanga, O., and Dube, T. (2021). Advancements in the remote sensing of landscape pattern of urban green spaces and vegetation fragmentation. Int. J. Remote Sens. 42, 3797–3832. doi: 10.1080/01431161.2021.1881185
Kremen, C., M’Gonigle, L. K., and Ponisio, L. C. (2018). Pollinator community assembly tracks changes in floral resources as restored hedgerows mature in agricultural landscapes. Front. Ecol. Evol. 6:170. doi: 10.3389/fevo.2018.00170
Krishnasamy, V., Sundaraguru, R., and Amala, U. (2019). Emerging vistas of remote sensing tools in pollination studies. Sociobiology 66, 394–399. doi: 10.13102/sociobiology.v66i3.4266
Lan, Y., Huang, Y., Martin, D. E., and Hoffmann, W. C. (2009). Development of an airborne remote sensing system for crop pest management: system integration and verification. Appl. Eng. Agric. 25, 607–615. doi: 10.13031/2013.27458
Landmann, T., Piiroinen, R., Makori, D. M., Abdel-Rahman, E., Makau, S., Pellikka, P. K. E., et al. (2015). Application of hyperspectral remote sensing for flower mapping in African savannas. Remote Sens. Environ. 166, 50–60. doi: 10.1016/j.rse.2015.06.006
Lane, I. G., Herron-Sweet, C. R., Portman, Z. M., and Cariveau, D. P. (2020). Floral resource diversity drives bee community diversity in prairie restorations along an agricultural landscape gradient. J. Appl. Ecol. 57, 2010–2018. doi: 10.1111/1365-2664.13694
Lázaro, A., and Tur, C. (2018). Land-use changes as drivers of pollinator declines. Ecosistemas 27, 23–33. doi: 10.7818/ECOS.1378
Lázaro, A., Fuster, F., Alomar, D., and Totland, Ø (2020). Disentangling direct and indirect effects of habitat fragmentation on wild plants’ pollinator visits and seed production. Ecol. Appl. 30:e02099. doi: 10.1002/eap.2099
Leong, M., and Roderick, G. K. (2015). Remote sensing captures varying temporal patterns of vegetation between human-altered and natural landscapes. Peerj. 3:e1141. doi: 10.7717/peerj.1141
Libran-Embid, F., Grass, I., Emer, C., Ganuza, C., and Tscharntke, T. (2021). A plant-pollinator metanetwork along a habitat fragmentation gradient. Ecol. Lett. 24, 2700–2712.
Lima, G. D., Leite, A. V., Souza, C. S., Castro, C. C., and Bezerra, E. L. D. (2020). A multilayer network in an herbaceous tropical community reveals multiple roles of floral visitors. Oikos 129, 1141–1151. doi: 10.1111/oik.06565
López-Granados, F., Torres-Sanchez, J., Jimenez-Brenes, F. M., Arquero, O., Lovera, M., and de Castro, A. I. (2019). An efficient rgb-uav-based platform for field almond tree phenotyping: 3-d architecture and flowering traits. Plant Methods 15:160. doi: 10.1186/s13007-019-0547-0
Mangewa, L. J., Ndakidemi, P. A., and Munishi, L. K. (2019). Integrating UAV Technology in an Ecological Monitoring System for Community Wildlife Management Areas in Tanzania. Sustainability 11:6116. doi: 10.3390/su11216116
Martinson, H. M., and Fagan, W. F. (2014). Trophic disruption: a meta-analysis of how habitat fragmentation affects resource consumption in terrestrial arthropod systems. Ecol. Lett. 17, 1178–1189.
Memmott, J., Craze, P. G., Waser, N. M., and Price, M. V. (2007). Global warming and the disruption of plant–pollinator interactions. Ecol. Lett. 10, 710–717. doi: 10.1111/j.1461-0248.2007.01061.x
Menzel, R., Gumbert, A., Kunze, J., and Shmida, A. (1997). Pollinators’ strategies in finding flowers. Isr. J. Plant Sci. 45, 141–156. doi: 10.1080/07929978.1997.10676680
Montero-Castaño, A., and Vila, M. (2012). Impact of landscape alteration and invasions on pollinators: a meta-analysis. J. Ecol. 100, 884–893. doi: 10.1111/j.1365-2745.2012.01968.x
Montgomery, G. A., Belitz, M. W., Guralnick, R. P., and Tingley, M. W. (2021). Standards and Best Practices for Monitoring and Benchmarking Insects. Front. Ecol. Evol. 8:579193. doi: 10.3389/fevo.2020.579193
Montoya, D., Haegeman, B., Gaba, S., De Mazancourt, C., and Loreau, M. (2021). Habitat fragmentation and food security in crop pollination systems. J. Ecol. 109, 2991–3006. doi: 10.1111/1365-2745.13713
Morandin, L. A., and Kremen, C. (2013). Hedgerow restoration promotes pollinator populations and exports native bees to adjacent fields. Ecol. Appl. 23, 829–839. doi: 10.2307/23440929
Moudrý, V., Urban, R., Stroner, M., Komárek, J., Brouček, J., and Prošek, J. (2019). Comparison of a commercial and home-assembled fixed-wing uav for terrain mapping of a post-mining site under leaf-off conditions. Int. J. Remote Sens. 40, 555–572. doi: 10.1080/01431161.2018.1516311
Neumann, C., Behling, R., Schindhelm, A., Itzerott, S., Weiss, G., Wichmann, M., et al. (2019). The colors of heath flowering – quantifying spatial patterns of phenology in Calluna life-cycle phases using high-resolution drone imagery. Remote Sens. Ecol. Conser. 6, 35–51. doi: 10.1002/rse2.121
Nicholls, E., Rands, S. A., Botías, C., and Hempel de Ibarra, N. (2022). Flower sharingand pollinator health: a behavioural perspective. Phil. Trans. R. Soc. B 377:20210157. doi: 10.1098/rstb.2021.0157
Ogilvie, J. E., and Forrest, J. R. K. (2017). Interactions between bee foraging and floral resource phenology shape bee populations and communities. Curr Opin Insect Sci. 21, 75–82. doi: 10.1016/j.cois.2017.05.015
Osborne, J. L., Martin, A. P., Carreck, N. L., Carreck, J. L. S., Swain, J. L., Knight, M. E., et al. (2008). Bumblebee flight distances in relation to the forage landscape. J. Anim. Ecol. 77, 406–415. doi: 10.1111/j.1365-2656.2007.01333.x
Palmer, M. W., Earls, P. G., Hoagland, B. W., White, P. S., and Wohlgemuth, T. (2002). Quantitative tools for perfecting species lists. Environmetrics 13, 121–137. doi: 10.1002/env.516
Palmer, M. W., Wohlgemuth, T., Earls, P., Arévalo, J. R., and Thompson, S. (2000). “Opportunities for long-term ecological research at the Tallgrass Prairie Preserve, Oklahoma,” in Cooperation in Long Term Ecological Research in Central and Eastern Europe: Proceedings, eds K. Lajtha and K. Vanderbilt (Budapest, Hungary: Oregon State University).
Pamminger, T., Becker, R., Himmelreich, S., Schneider, C. W., and Bergtold, M. (2019). The nectar report: Quantitative review of nectar sugar concentrations offered by bee visited flowers in agricultural and non-agricultural landscapes. PeerJ 7:e6329. doi: 10.7717/peerj.6329
Prado, S. G., Collazo, J. A., Marand, M. H., and Irwin, R. E. (2021). The influence of floral resources and microclimate on pollinator visitation in an agro-ecosystem. Agric. Ecosyst. Environ. 307:107196. doi: 10.1016/j.agee.2020.107196
Quemada, M., Gabriel, J. L., and Zarco-Tejada, P. (2014). Airborne hyperspectral images and ground-level optical sensors as assessment tools for maize nitrogen fertilization. Remote Sens. 6, 2940–2962. doi: 10.3390/rs6042940
Raper, T. B., Varco, J. J., and Hubbard, K. J. (2013). Canopy-based normalized difference vegetation index sensors for monitoring cotton nitrogen status. Agron. J. 105, 1345–1354. doi: 10.2134/agronj2013.0080
Roberts, D. A., Roth, K., and Perroy, R. (2011). “Hyperspectral vegetation indices,” in Hyperspectral Remote Sensing of Vegetation, 1st Edn, eds P. S. Thenkabail and J. G. Lyon (Florida, US: CRC Press).
Rollings, R., and Goulson, D. (2019). Quantifying the attractiveness of garden flowers for pollinators. J. Insect Conserv. 23, 803–817. doi: 10.1007/s10841-019-00177-3
Rominger, K. R., DeNittis, A., and Meyer, S. E. (2021). Using drone imagery analysis in rare plant demographic studies. J. Nat. Conserv. 62:126020. doi: 10.1016/j.jnc.2021.126020
Ropars, L., Affre, L., Aubert, M., Fernandez, C., Floriane, F., Genoud, D., et al. (2020). Pollinator specific richness and their interactions with local plant species: 10 years of sampling in Mediterranean habitats. Environ. Entomol. 49, 947–955. doi: 10.1093/ee/nvaa061
Ropars, L., Dajoz, I., Fontaine, C., Muratet, A., and Geslin, B. (2019). Wild pollinator activity negatively related to honey bee colony densities in urban context. PLoS One 14:e0222316. doi: 10.1371/journal.pone.0222316
Salas, E. A. L. (2020). Waveform lidar concepts and applications for potential vegetation phenology monitoring and modeling: A comprehensive review. Geo-Spat. Inf. Sci. 24, 179–200. doi: 10.1080/10095020.2020.1761763
Sellars, J. D., and Jolls, C. L. (2007). Habitat modeling for Amaranthus pumilus: An application of light detection and ranging (LIDAR) data. J. Coast. Res. 23, 1193–1202. doi: 10.2112/04-0334.1
Simba, L. D., Foord, S. H., Thebault, E., van Veen, F. J. F., Joseph, G. S., and Seymour, C. L. (2018). Indirect interactions between crops and natural vegetation through flower visitors: the importance of temporal as well as spatial spillover. Agric. Ecosyst. Environ. 253, 148–156. doi: 10.1016/j.agee.2017.11.002
Smigaj, M., and Gaulton, R. (2021). Capturing hedgerow structure and flowering abundance with uav remote sensing. Remote Sens. Ecol. Con. 7, 521–533. doi: 10.1002/rse2.208
Srinivasan, M. V. (2011). Honeybees as a model for the study of visually guided flight, navigation, and biologically inspired robotics. Psychol. Rev. 91, 413–460. doi: 10.1152/physrev.00005.2010
Staab, M., Pereira-Peixoto, M. H., and Klein, A. M. (2020). Exotic garden plants partly substitute for native plants as resources for pollinators when native plants become seasonally scarce. Oecologia 194, 465–480. doi: 10.1007/s00442-020-04785-8
Sun, G., Jiao, Z., Zhang, A., Li, F., and Fu, H. (2021). Hyperspectral image-based vegetation index (HSVI): A new vegetation index for urban ecological research. Appl. Earth Obs. Geoinf. 103:102529. doi: 10.1016/j.jag.2021.102529
Sun, Y., Ren, H., Zhang, T., Zhang, C., and Qin, Q. (2018). Crop Leaf Area Index Retrieval Based on Inverted Difference Vegetation Index and NDVI. IEEE 15, 1662–1666. doi: 10.1109/lgrs.2018.2856765
Swierszcz, S., Nowak, A., Kojs, P., Nowak, S., and Nobis, M. (2019). Functional diversity of different vegetation types does not respond homogenously to change over time after conservation translocation from a rural landscape to an urbanized one. Urban For. Urban Green. 41, 323–332. doi: 10.1016/j.ufug.2019.05.001
Szigeti, V., Kőrösi, Á, Harnos, A., Nagy, J., and Kis, J. (2016). Measuring floral resource availability for insect pollinators in temperate grasslands – a review. Ecol. Entomol. 41, 231–240. doi: 10.1111/een.12298
Tew, N. E., Memmott, J., Vaughan, I. P., Bird, S., Stone, G. N., Potts, S. G., et al. (2021). Quantifying nectar production by flowering plants in urban and rural landscapes. J. Ecol. 109, 1747–1757. doi: 10.1111/1365-2745.13598
Timberlake, T. P., Vaughan, I. P., Baude, M., and Memmott, J. (2021). Bumblebee colony density on farmland is influenced by late-summer nectar supply and garden cover. J. Appl. Ecol. 58, 1006–1016. doi: 10.1111/1365-2664.13826
Togacar, M., Ergen, B., and Comert, Z. (2020). Classification of flower species by using features extracted from the intersection of feature selection methods in convolutional neural network models. Measurement 158:107703. doi: 10.1016/j.measurement.2020.107703
Tscheulin, T., Neokosmidis, L., Petanidou, T., and Settele, J. (2011). Influence of landscape context on the abundance and diversity of bees in mediterranean olive groves. B. Entomol. Res. 101, 557–564. doi: 10.1017/S0007485311000149
Tvostik, E. V., Adamovich, T. A., and Ashikhmina, T. Y. (2019). Identification of sites of mass growth of Heracleum sosnowskyi Manden using spectral indices according to Sentinel-2 images. Theor. Appl. Ecol. 3, 34–40. doi: 10.25750/1995-4301-2019-3-034-040
Viña, A., Gitelson, A. A., Nguy-Robertson, A. L., and Peng, Y. (2011). Comparison of different vegetation indices for the remote assessment of green leaf area index of crops. Remote Sens. Env. 115, 3468–3478. doi: 10.1016/j.rse.2011.08.010
Vrdoljak, S. M., Samways, M. J., and Simaika, J. P. (2016). Pollinator conservation at the local scale: flower density, diversity and community structure increase flower visiting insect activity to mixed floral stands. J. Insect Conserv. 20, 711–721. doi: 10.1007/s10841-016-9904-8
Wan, L., Li, Y. J., Cen, H. Y., Zhu, J., Yin, W., Wu, W., et al. (2018). Combining uav-based vegetation indices and image classification to estimate flower number in oilseed rape. Remote Sens. Basel 10:1484. doi: 10.3390/rs10091484
Wenzel, A., Grass, I., Belavadi, V. V., and Tscharntke, T. (2020). How urbanization is driving pollinator diversity and pollination–A systematic review. Biol. Conserv. 241:108321. doi: 10.1016/j.biocon.2019.108321
Willcox, B. K., Robson, A. J., Howlett, B. G., and Rader, R. (2018). Toward an integrated approach to crop production and pollination ecology through the application of remote sensing. Peerj 6:e5806. doi: 10.7717/peerj.5806
Wilson, R. S., Keller, A., Shapcott, A., Leonhardt, S. D., Wiebke Sickel, J., and Hardwick, L. (2021). Many small rather than few large sources identified in long-term bee pollen diets in agroecosystems. Agric. Ecosyst. Environ. 310:107296. doi: 10.1016/j.agee.2020.107296
Winfree, R., Bartomeus, I., and Cariveau, D. P. (2011). Native pollinators in anthropogenic habitats. Annu. Rev. Ecol. Ev. 42, 1–22. doi: 10.1146/annurev-ecolsys-102710-145042
Winfree, R., Griswold, T., and Kremen, C. (2007). Effect of human disturbance on bee communities in a forested ecosystem. Conserv. Biol. 21, 213–223. doi: 10.1111/j.1523-1739.2006.00574.x
Woodard, S. H., and Jha, S. (2017). Wild bee nutritional ecology: predicting pollinator population dynamics, movement, and services from floral resources. Curr. Opin. Insect Sci. 21, 83–90. doi: 10.1016/j.cois.2017.05.011
Wu, L., Zhu, X., Lawes, R., Dunkerley, D., and Zhang, H. (2019). Comparison of machine learning algorithms for classification of lidar points for characterization of canola canopy structure. Int. J. Remote Sens. 40, 5973–5991. doi: 10.1080/01431161.2019.1584929
Xavier, S. S., Coffin, A. W., Olson, D. M., and Schmidt, J. M. (2018). Remotely estimating beneficial arthropod populations: Implications of a low-cost small unmanned aerial system. Remote Sens. Basel. 10:1485. doi: 10.3390/rs10091485
Xie, Y. C., Sha, Z. Y., and Yu, M. (2008). Remote sensing imagery in vegetation mapping: a review. J. Plant Ecol. 1, 9–23. doi: 10.1093/jpe/rtm005
Xu, K. Y., and Servedio, M. R. (2021). The evolution of flower longevity in unpredictable pollination environments. J. Evol. Biol. 34, 1781–1792. doi: 10.1111/jeb.13936
Yang, Q., Shi, L., Han, J., Chen, Z., and Yu, J. (2022). A VI-based phenology adaptation approach for rice crop monitoring using UAV multispectral images. Field Crops Res. 277:108419. doi: 10.1016/j.fcr.2021.108419
Zarate-Valdez, J. L., Whiting, M. L., Lampinen, B. D., Metcalf, S., Ustin, S. L., and Brown, P. H. (2012). Prediction of leaf area index in almonds by vegetation indexes. Comput. Electron. Agric. 85, 24–32. doi: 10.1016/j.scitotenv.2021.148177
Zhang, X. Y., Friedl, M. A., Strahler, A. H., Hodges, J. C. F., Gao, F., et al. (2003). Monitoring vegetation phenology using modis. Remote. Sens. Envi. 84, 471–475. doi: 10.1016/s0034-4257(02)00135-9
Keywords: remote sensing, flower, insects, pollination, behaviour, foraging, drone, satellite
Citation: Gonzales D, Hempel de Ibarra N and Anderson K (2022) Remote Sensing of Floral Resources for Pollinators – New Horizons From Satellites to Drones. Front. Ecol. Evol. 10:869751. doi: 10.3389/fevo.2022.869751
Received: 04 February 2022; Accepted: 12 April 2022;
Published: 20 May 2022.
Edited by:
Michael Hrncir, University of São Paulo, BrazilReviewed by:
Adam Kőrösi, Hungarian Academy of Sciences (MTA), HungaryJoaquín Goyret, University of Tennessee at Martin, United States
Copyright © 2022 Gonzales, Hempel de Ibarra and Anderson. This is an open-access article distributed under the terms of the Creative Commons Attribution License (CC BY). The use, distribution or reproduction in other forums is permitted, provided the original author(s) and the copyright owner(s) are credited and that the original publication in this journal is cited, in accordance with accepted academic practice. No use, distribution or reproduction is permitted which does not comply with these terms.
*Correspondence: Dunia Gonzales, dg408@exeter.ac.uk