Theropod Tridactyl Tracks Across the Triassic–Jurassic Boundary in Southern Africa: Implications for Pedal Morphology Evolution
 Miengah Abrahams
 Emese M. Bordy
 Fabien Knoll
 James O. Farlow3
- 1Department of Geological Sciences, University of Cape Town, Cape Town, South Africa
- 2ARAID-Fundación Conjunto Paleontológico de Teruel-Dinópolis, Teruel, Spain
- 3Department of Biological Sciences, Purdue University Fort Wayne, Fort Wayne, IN, United States
The end-Triassic mass extinction events mark a pivotal period in archosaur history, and have been proposed to contribute to the rise and dominance of dinosaurs throughout the Mesozoic. In southern Africa, the Triassic–Jurassic boundary is contained within the richly fossiliferous fluvio-lacustrine-aeolian deposits of the upper Stormberg Group in the main Karoo Basin. Due to an absence of high-resolution radioisotopic age constraints, the exact placement of the boundary remains difficult. The Stormberg Group theropod osteological record is limited to scarce, fragmentary material; therefore, the abundant Norian–Pliensbachian tridactyl tracks attributed to theropods are vital for unraveling theropod dinosaur evolutionary trends in southwestern Gondwana. This study considers over 200 upper Stormberg Group tridactyl tracks assigned to the Kayentapus-Grallator-Anchisauripus-Eubrontes (K-GAE) plexus, to quantify their morphological variation across a time span of ∼35 million years. Our findings show that within the upper Stormberg Group, and across the Triassic–Jurassic boundary, the younger tracks become larger, have a decreased mesaxony and a reduced digit III projection. This reduced emphasis of the medial digit is also observed across the K-GAE plexus, and for the individual ichnotaxa across time in the main Karoo Basin, e.g., Eubrontes tracks become less mesaxonic and have a reduced digit III projection higher up in the stratigraphy. This suggests that these morphological trends are not simply linked to size but may reflect a change in autopod morphology through time, which has implications for pedal functionality. Furthermore, being morphologically distinct from contemporaneous North American K-GAE tracks (e.g., reduced elongation and mesaxony, no correlation between digit divarication angles and size), these southern African footprints warrant further investigation.
Introduction
Vertebrate footprint morphology is the product of three interlinked variables: trackmaker anatomy (especially the foot), trackmaker locomotory style (behavior) and substrate conditions. Furthermore, extrinsic factors, such as erosion, also affect the preserved morphology. Accounting for the extent to which these factors influence a resultant track morphology is complex, though numerous studies have illustrated the influence of the individual variables and their combinations (e.g., Gatesy et al., 1999; Mílan and Bromley, 2006; Wilson et al., 2009; Avanzini et al., 2012; Razzolini et al., 2017). Assessing the morphology of fossil tracks is important for ichnology, as it is the root of ichnotaxonomy and in turn, critical for inferences on paleodiversity, paleoecology and paleoethology (e.g., Farlow et al., 2018; Lallensack et al., 2019). Recent technological advances in 3D photogrammetric modeling and geometric morphometric landmark-based principal component analysis have shifted track-based studies from primarily descriptive to quantitative (e.g., Weems, 1992; Olsen et al., 1998; Dalman and Weems, 2013; Razzolini et al., 2014; Castanera et al., 2015, 2016; Lallensack et al., 2016, 2019; Wings et al., 2016; Belvedere et al., 2018; Falkingham et al., 2018; Farlow et al., 2018; Abrahams et al., 2020a). Statistical studies, incorporating extensive dinosaur track databases, have successfully been used to refine ichnotaxonomic assignment by accounting for morphological variability, distinguish between tridactyl theropod and ornithopod tracks, and better understand pedal function. Consequently, the global ichnological record has proven to be an invaluable complement to the osteological record for unraveling dinosaur evolutionary history. To date, the early history of dinosaurs is still poorly understood, with controversy surrounding the timing of their origins during the Triassic (e.g., Marsicano et al., 2007; Brusatte et al., 2008, 2010, 2011; Baron et al., 2017; Langer et al., 2017) and the cause of their ascent and dominance later in the Mesozoic (e.g., Olsen et al., 2002, 2010; Padian, 2012). The Triassic–Jurassic boundary has often been considered to mark a crucial period in dinosaur history, evidenced by significant diversification, population and body size increases in the Early Jurassic, possibly linked to a recovery period following the end-Triassic mass extinction events (see “diminished competitor capacity” concept, e.g., Olsen et al., 2002).
The main Karoo Basin of southern Africa (Figure 1), which encapsulates ∼120 million years of geological history from the Late Carboniferous to Early Jurassic, preserves one of the world’s most extensive continental successions, i.e., the Karoo Supergroup (e.g., Rubidge et al., 2016; Bordy et al., 2020). The Triassic–Jurassic upper Stormberg Group (i.e., Elliot and Clarens formations) preserves a rich, diverse body and trace fossil assemblage, making it an ideal stratigraphic succession for unraveling early dinosaur evolution in southwestern Gondwana. Although the exact placement of the Triassic–Jurassic boundary within the upper Stormberg Group is unknown, recent radiometric dating suggests a Norian–Rhaetian age for the lower Elliot Formation (lEF), a Hettangian to Sinemurian age for the upper Elliot Formation (uEF) and a Sinemurian to Pliensbachian age for the Clarens Formation (Figure 1; Bordy et al., 2020). Upper Stormberg Group vertebrate tracks, attributed to dinosaurs, have been known since in the 1800s (Dieterlen, 1885) and formally documented since the early 1900s (Dornan, 1908) with a boom in systematic documentation in the second half of the 20th century and post-2015 (e.g., Ellenberger, 1955, 1970, 1972, 1974; Ellenberger and Ellenberger, 1956, 1958, 1960; Ellenberger et al., 1963; Ambrose, 2003; Raath and Yates, 2005; Smith et al., 2009; Sciscio et al., 2016, 2017; Abrahams et al., 2017, 2020a,b; Bordy et al., 2017; Rampersadh et al., 2018; Bordy, 2021). Like many other early Mesozoic vertebrate ichnoassemblages attributed to dinosaurs (e.g., Petti et al., 2008; Belvedere et al., 2010; Moreno et al., 2012; Lockley et al., 2013; Läng et al., 2013; Pérez-Lorente, 2015; D’Orazi Porchetti et al., 2016; Xing et al., 2020), the upper Stormberg Group dinosaur track record comprises tracks primarily assigned to Kayentapus, Grallator, Anchisauripus, and Eubrontes. These ichnogenera have been proposed to form a morphological continuum (i.e., the K-GAE plexus), where elongation and mesaxony decrease and digit thickness increases with increasing footprint size (e.g., Olsen et al., 1998). Due to the conservative nature of tridactyl track morphology, distinguishing between different dinosaurian trackmakers can be riddled with complexities, e.g., theropod versus ornithopod (see Moratalla et al., 1988; Romilio and Salisbury, 2011), theropod versus “prosauropod” (see Weems, 2019). Nevertheless, Kayentapus is widely accepted to have a theropod trackmaker (e.g., Lockley et al., 2011; Sciscio et al., 2017), while, based on the eastern North American track record, Grallator-Anchisauripus-Eubrontes have been attributed to at least two distinct trackmakers (Farlow et al., 2018), which are generally accepted to be theropods (e.g., Lockley, 1991; Olsen et al., 1998; Castanera et al., 2016; Li et al., 2019; cf. Weems, 2019).
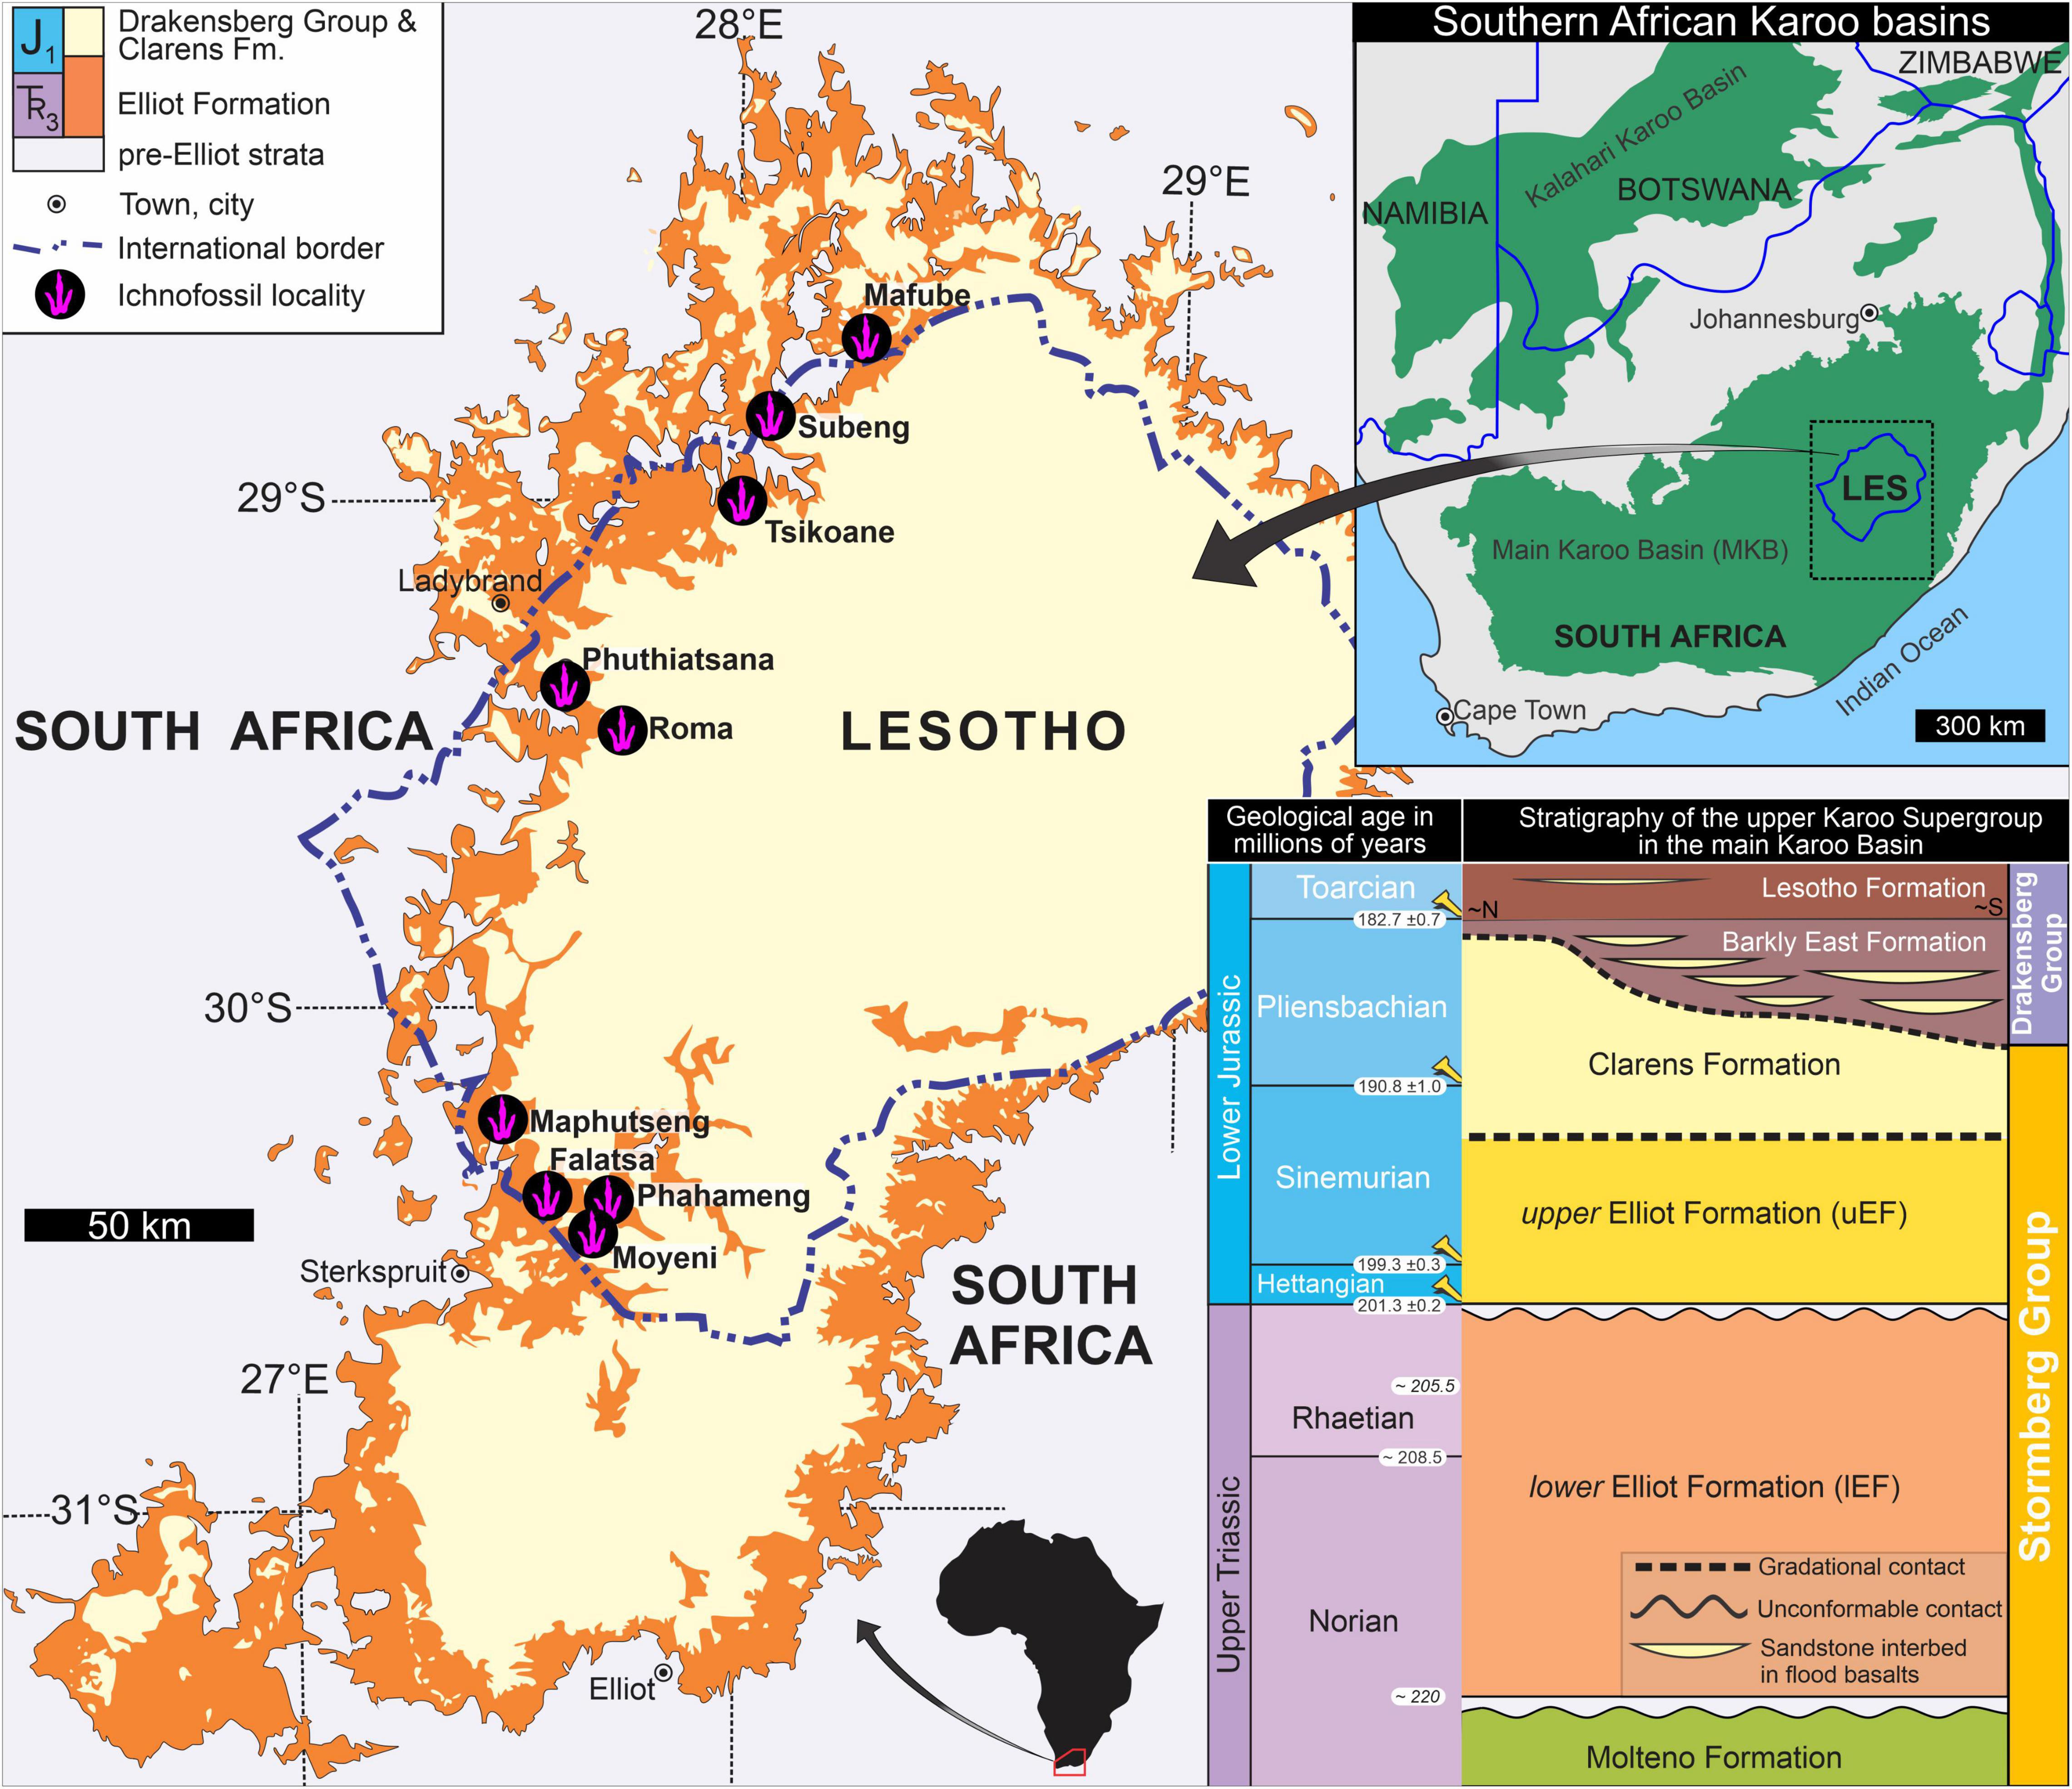
Figure 1. Overview geological map of the upper Stormberg Group showing the geographic distribution of the ichnofossil sites reviewed in this study. Insets on the right are the map of the Karoo basins in southern Africa and the chronostratigraphic table of the Upper Triassic–Lower Jurassic Stormberg Group, upper Karoo Supergroup. Geological time scale is based on the International Chronostratigraphic Chart (v2021) and Cohen et al. (2013). At Moyeni and Roma, multiple tracksites are recorded (see Supplementary Table 1 for GPS co-ordinate data).
Contrary to its rich track record, the upper Stormberg Group theropod osteological record is limited to a handful of fragmentary material attributed to two dinosaurs, Dracovenator regenti (Yates, 2005) and Megapnosaurus rhodesienses (Kitching and Raath, 1984; Smith and Kitching, 1997; Munyikwa and Raath, 1999; Bristowe and Raath, 2004). Therefore, the ichnological record of southern Africa, which preserves important messages about the dynamics of the paleoecological system during the early Mesozoic, is crucial for understanding theropod evolution in southwestern Gondwana.
Herein, we evaluate standard track dimensions of tridactyl tracks assigned to the K-GAE plexus preserved within the upper Stormberg Group to assess their morphological variation within the K-GAE plexus and across the Triassic–Jurassic boundary in southwestern Gondwana. Furthermore, we quantify the morphological differences between the upper Stormberg Group ichnotaxa and their contemporaneous global equivalents.
Materials and Methods
Thirteen tracksites, preserving more than 200 tridactyl tracks, within the upper Stormberg Group of southern Africa were examined primarily in the field to assess their morphology (Figure 1; Supplementary Figure 1 and Supplementary Table 1). Most of these tracks are preserved as isolated impressions, and for those that constitute trackways, each individual track comprising the trackway is considered to be a distinct track in this study, i.e., mean track data is not considered for trackways. The upper Stormberg Group tracks were first described by Dornan (1908), Ellenberger (1955; 1970; 1972), Ellenberger and Ellenberger (1960); Ellenberger et al. (1963), and Ambrose (2003) and have subsequently been redocumented by various authors (e.g., Olsen and Galton, 1984; Smith et al., 2009). Track quantification, using modern ichnological standards (Falkingham et al., 2018) has been executed since 2015 (e.g., Sciscio et al., 2016, 2017; Abrahams et al., 2017, 2020a,b; Bordy et al., 2017; Abrahams, 2020; Bordy, 2021). This study assumes that the tridactyl tracks reviewed herein have correctly been assigned to Kayentapus, Grallator, and Eubrontes by these authors. Except for Tsikoane (Figure 1), the ichnosites considered herein have been dated using U–Pb detrital zircon geochronology and their maximum depositional ages are reported in Bordy et al. (2020). Two Qemetrisauripus track casts, collected by Paul Ellenberger and housed at the Morija Museum Archives (G024), have been revised to Eubrontes by Klein and Lucas (2021) and are also considered in this study.
Track Outline
Defined track outlines form the basis of morphological studies. The assignment of a track boundary, especially for tracks with graded walls, is highly interpretative, and to date, remains non-standardized (see Thulborn, 1990). Recently, with the advancement of digital technologies, automated track outlining (Lallensack, 2019) and reference mediotype track morphologies (Belvedere et al., 2018) have been proposed to mitigate the effects of operator bias, which has been shown to radically influence measured track parameters (e.g., Castanera et al., 2012). Inconsistent track outlines and measurements have significant ramifications for ichnotaxonomic assignment, comparative track studies and inferences on trackmaker speed, body size, mass, behavior, etc. To reduce the influence of operator bias in this study, a single operator (MA) outlined and measured the track parameters shown in Figure 2 with the aid of false-color depth maps generated from photogrammetric 3D models. Photographs were taken using a Canon PowerShot EOS D1200 (focal length 28 mm, 5,184 × 3,456 resolution) camera. Photogrammetric 3D models were built using Agisoft Photoscan v1.1.4 following established methods (Mallison and Wings, 2014; Matthews et al., 2016). False color depth maps were generated from 3D models using Cloud Compare v2.6.1. Track length (TL), track width (TW) and track span (TS) were measured in the field, while digit III projection beyond digits II and IV (DP), digit lengths (LII-LIV) and interdigit divarication angles (II^III, III^IV) were measured from orthophotographs using ImageJ (a public domain software; Schneider et al., 2012; Figure 2). Given the large dataset, it is assumed that the sample size damps the uncertainties and statistical noise potentially generated by the subjectivity of track outlining. Consequently, it is assumed that the dataset is a reliable reflection of morphological variations in the vertebrate track record of southern Africa.
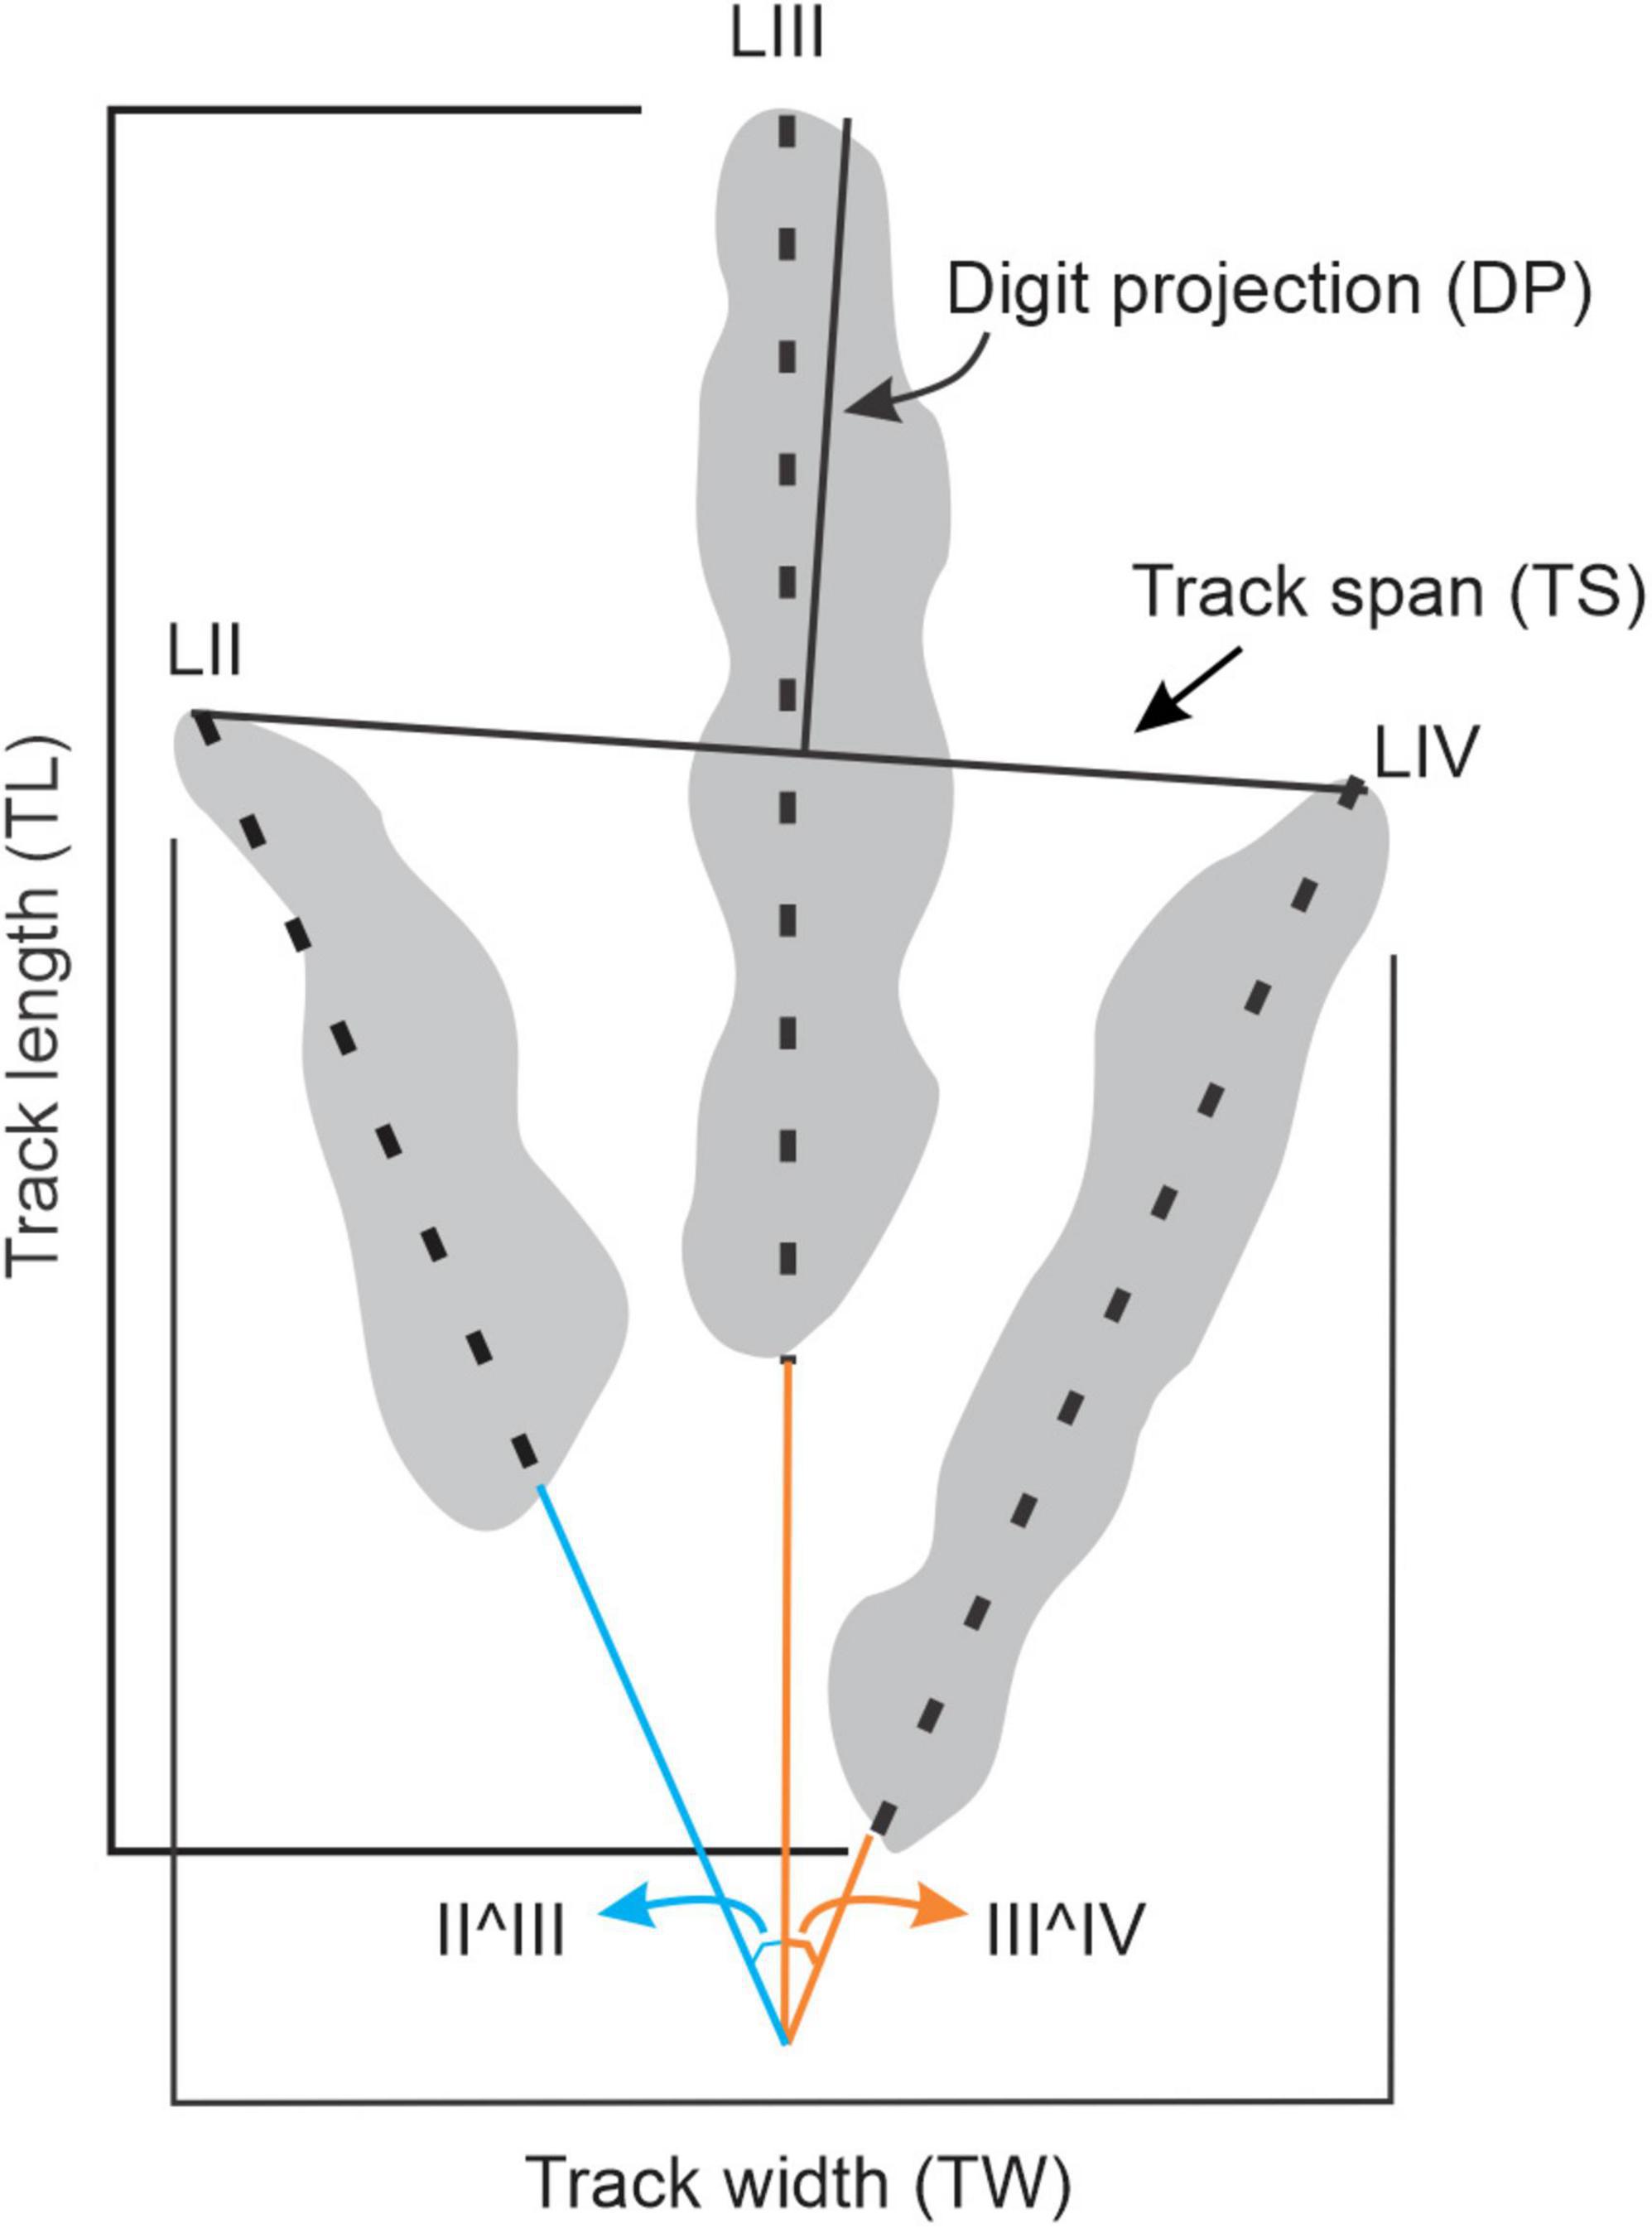
Figure 2. Parameters measured from tridactyl tracks in the field or using ImageJ software (Schneider et al., 2012). LII–LIV – respective digit lengths; II^III, III^IV – respective interdigit angles.
Exploratory Statistics
A morphological study utilizing complex objects such as footprints is likely to be riddled with problems that may create statistical noise. In addition to single operator track data collection, to reduce the effect of interpretative outlines and measurements, this study primarily considers tracks with moderate and high anatomic fidelity (sensu Gatesy and Falkingham, 2017) or good morphological preservation quality (Mp, sensu Marchetti et al., 2019). High anatomical fidelity tracks with a Mp ≥ 2 are complete, preserve digital pad and claw impressions, and have higher reliability and precision for the measured track parameters. However, such tracks only comprise 60% of upper Stormberg Group dataset (Supplementary Figure 1 and Supplementary Table 1). To obtain a more robust dataset for the individual measured track parameters outlined in Figure 2, tracks with Mp < 2 are included in this study. For the most part, these tracks are complete tridactyl impressions from which TL, TW, TS and DP data could be obtained (Supplementary Figure 1 and Supplementary Table 1).
To understand the morphological variations of upper Stormberg K-GAE footprints, two subsets of data were examined: (a) across the K-GAE plexus, i.e., size based on TL, and (b) across stratigraphy (time), i.e., lower Elliot Formation (lEF), upper Elliot Formation (uEF) and Clarens Formation (CLAR). The size classes are defined as “small” with TL ≤ 15 cm, “medium” with 15 < TL ≤ 25 cm, “large” with 25 < TL ≤ 40 cm and “mega” with TL > 40 cm, and are based on the TLs which characterize the morphotype material of the ichnogenera (TL ≤ 15 cm Grallator-like, 15 < TL ≤ 25 cm Anchisauripus-like, TL > 25 cm Eubrontes-like; Olsen et al., 1998).
Statistical analysis assessing the two subsets was performed either by Stats consulting, University of Cape Town (STA-CON) or using Paleontological statistics (PAST) v3.18 software package for education and analysis created by Hammer et al. (2001). Correlation matrices were used to assess and quantify the relationship between all the measured parameters of the track dataset (Figure 3). Frequency distributions considering linear data were log-transformed and normalized (the mean of each variable was subtracted) while distributions of bivariate ratios consider the absolute value. A Shapiro-Wilk probability for normality, where the null hypothesis p < 0.05 rejects a normal distribution, was included for all frequency distribution plots (Figures 4B, 5B and Supplementary Figures 3, 4). ANOVA and Kruskal-Wallis tests were performed on the data subsets to assess the statistical relevance of observed trends (Table 1 and Supplementary Tables 4, 5). Where trends are statistically relevant, post hoc assessments (e.g., Bonferroni corrected multiple comparisons) were performed to understand which subsets of data primarily account for the observed trends (Table 2 and Supplementary Tables 6, 7). Reduced major axis analyses was performed on log-transformed paired variables to determine if their relationship is allometric (Table 3). Values within a confidence interval of a 0.95–1.05 are isometric, while tracks outside of the interval range are allometric. If confidence intervals span isometric and allometric values, the paired variables’ relationship may be interpreted to be “barely” allometric. Discriminant analysis, exclusively utilizing linear measured parameters, was performed on defined subsets of the data to assess the degree to which the analysis can correctly assign tracks to their relevant group based on their measurements (Table 4).
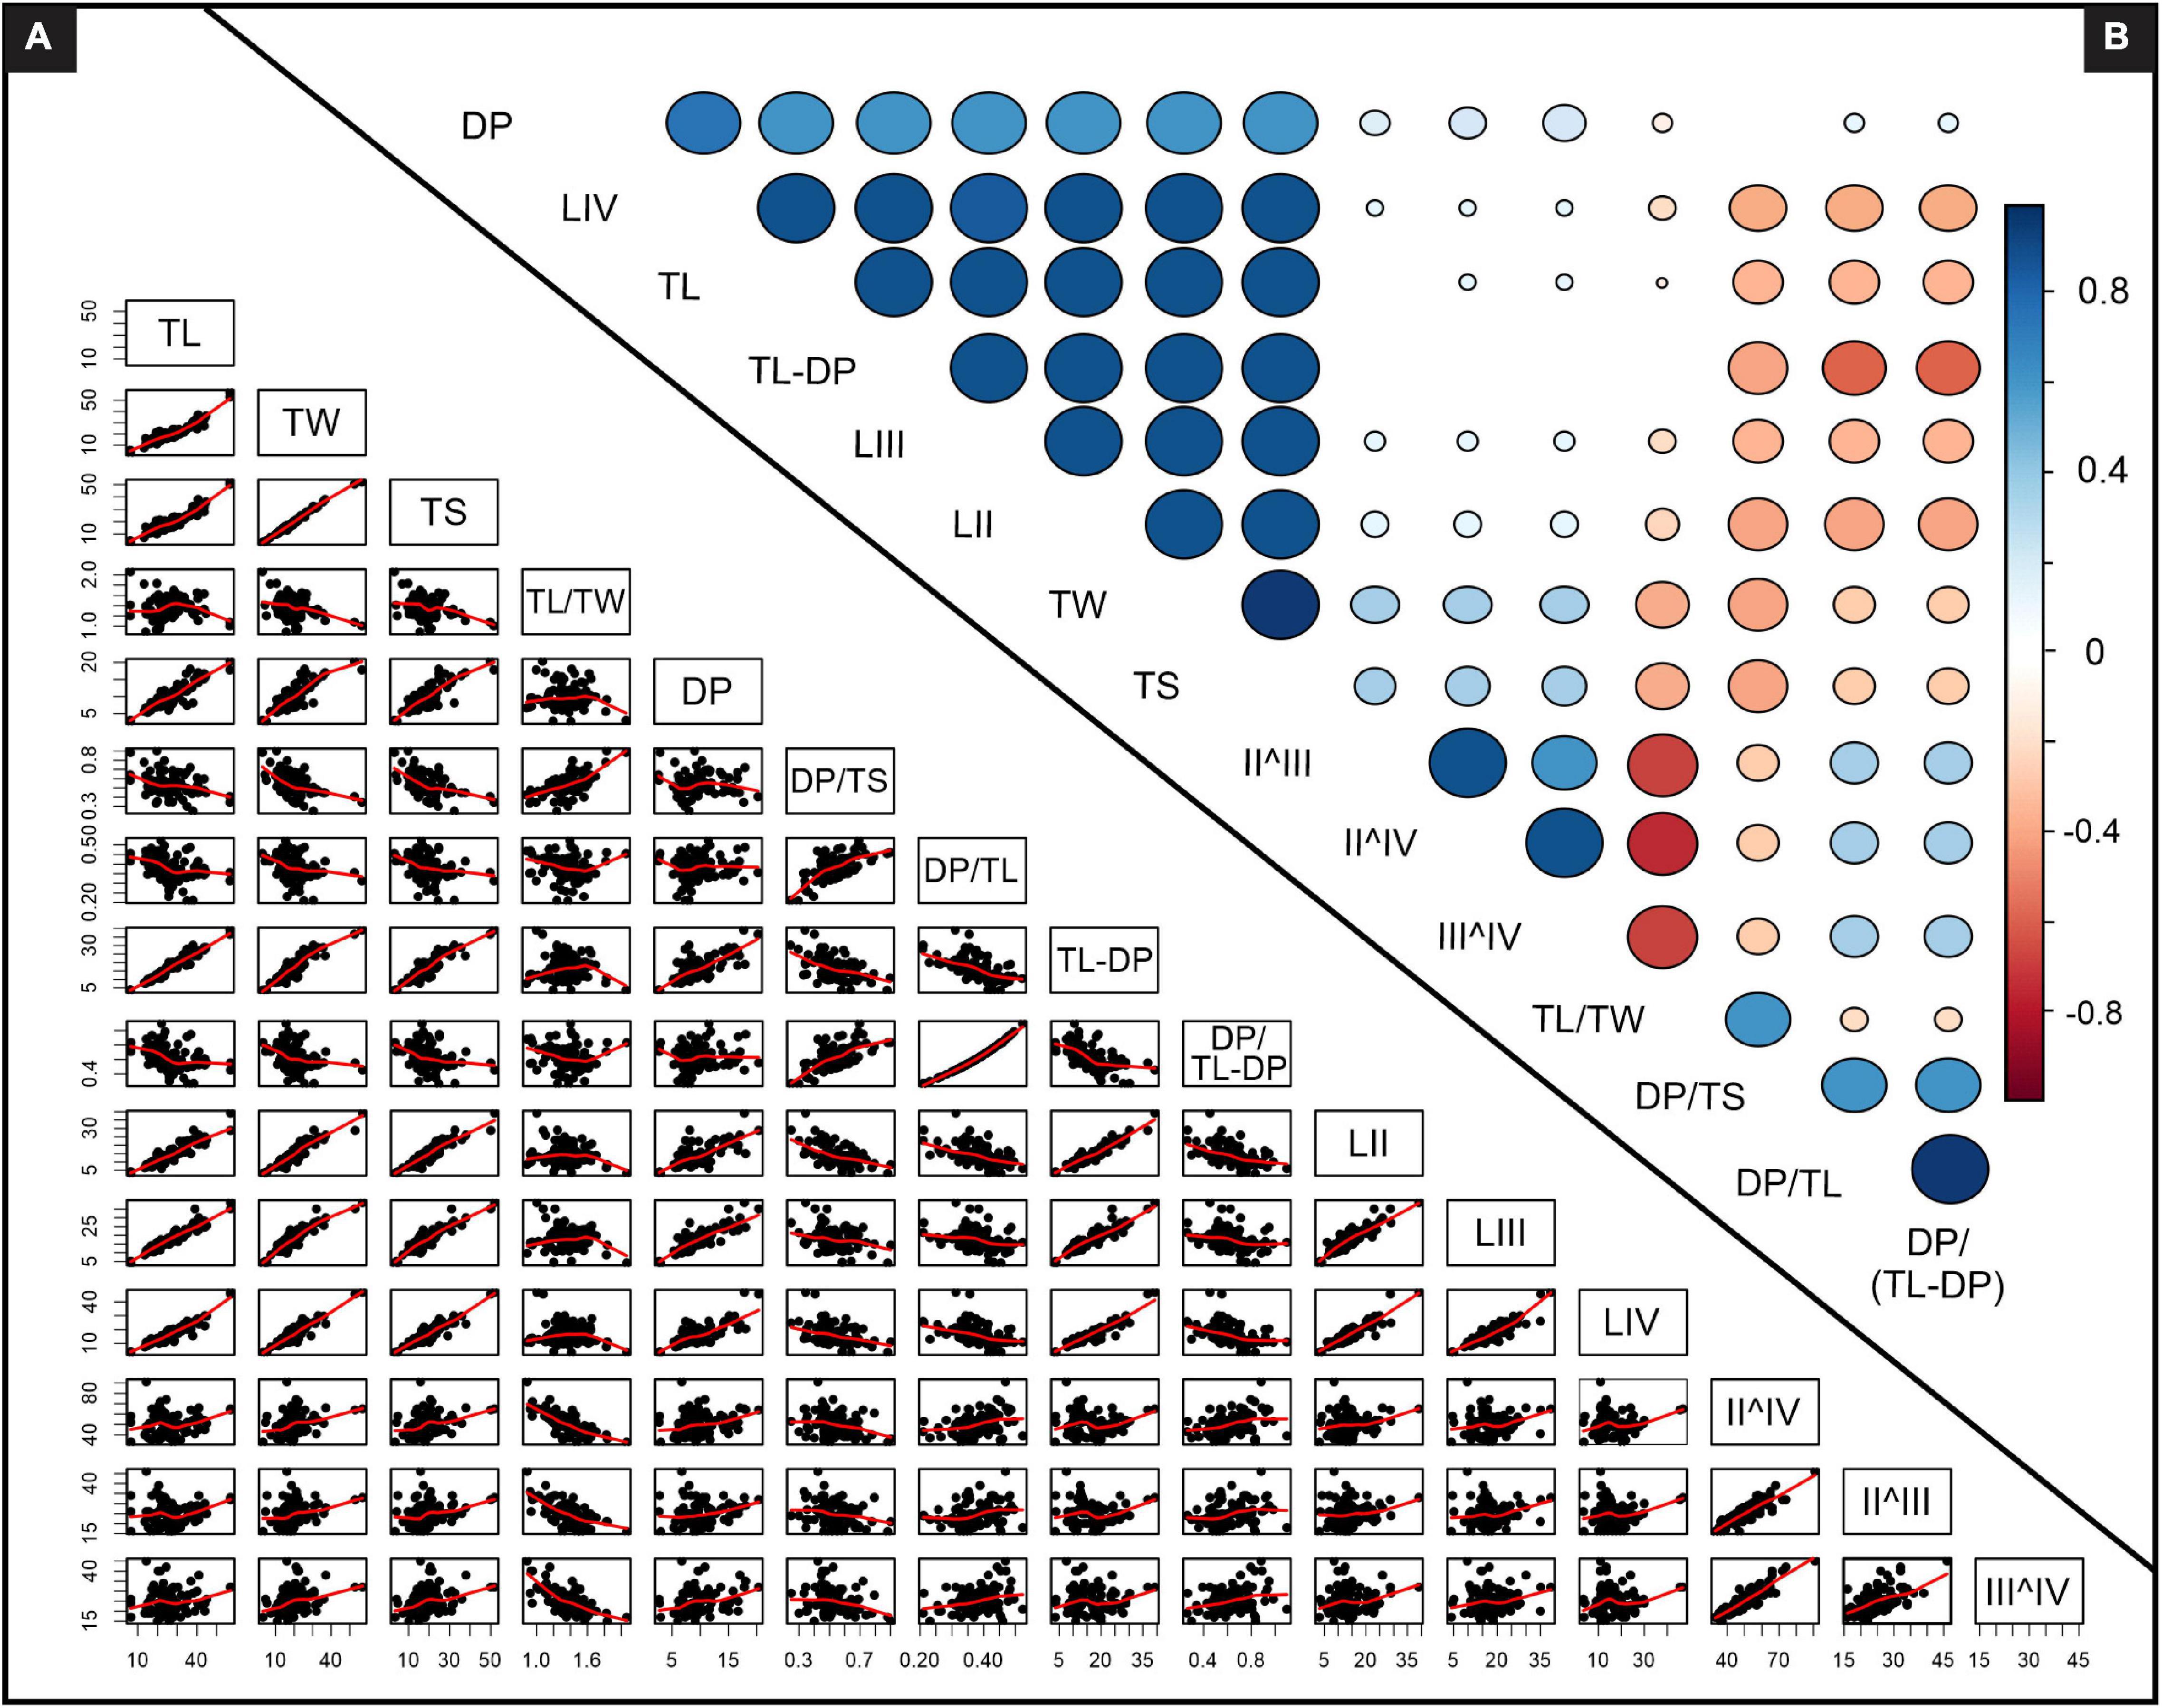
Figure 3. Relationships between bivariate analyses (STA-CON). (A) Pairwise scatter plots with locally weighted scatterplot smoothing (LOWESS) fit lines, (B) Correlation matrices between measured parameters where larger circle diameters correspond to stronger correlations and blank spaces indicate negligible correlations. See Supplementary Figure 2 for enlarged TL versus DP and TL versus bivariate ratio scatterplots and Supplementary Table 2 for detailed matrices data. TL – track length, TW – track width, TS – track span, DP – digit III projection, LII, LIII, LIV – respective digit II, III and IV lengths, II^IV, II^III, III^IV – respective interdigital angles.
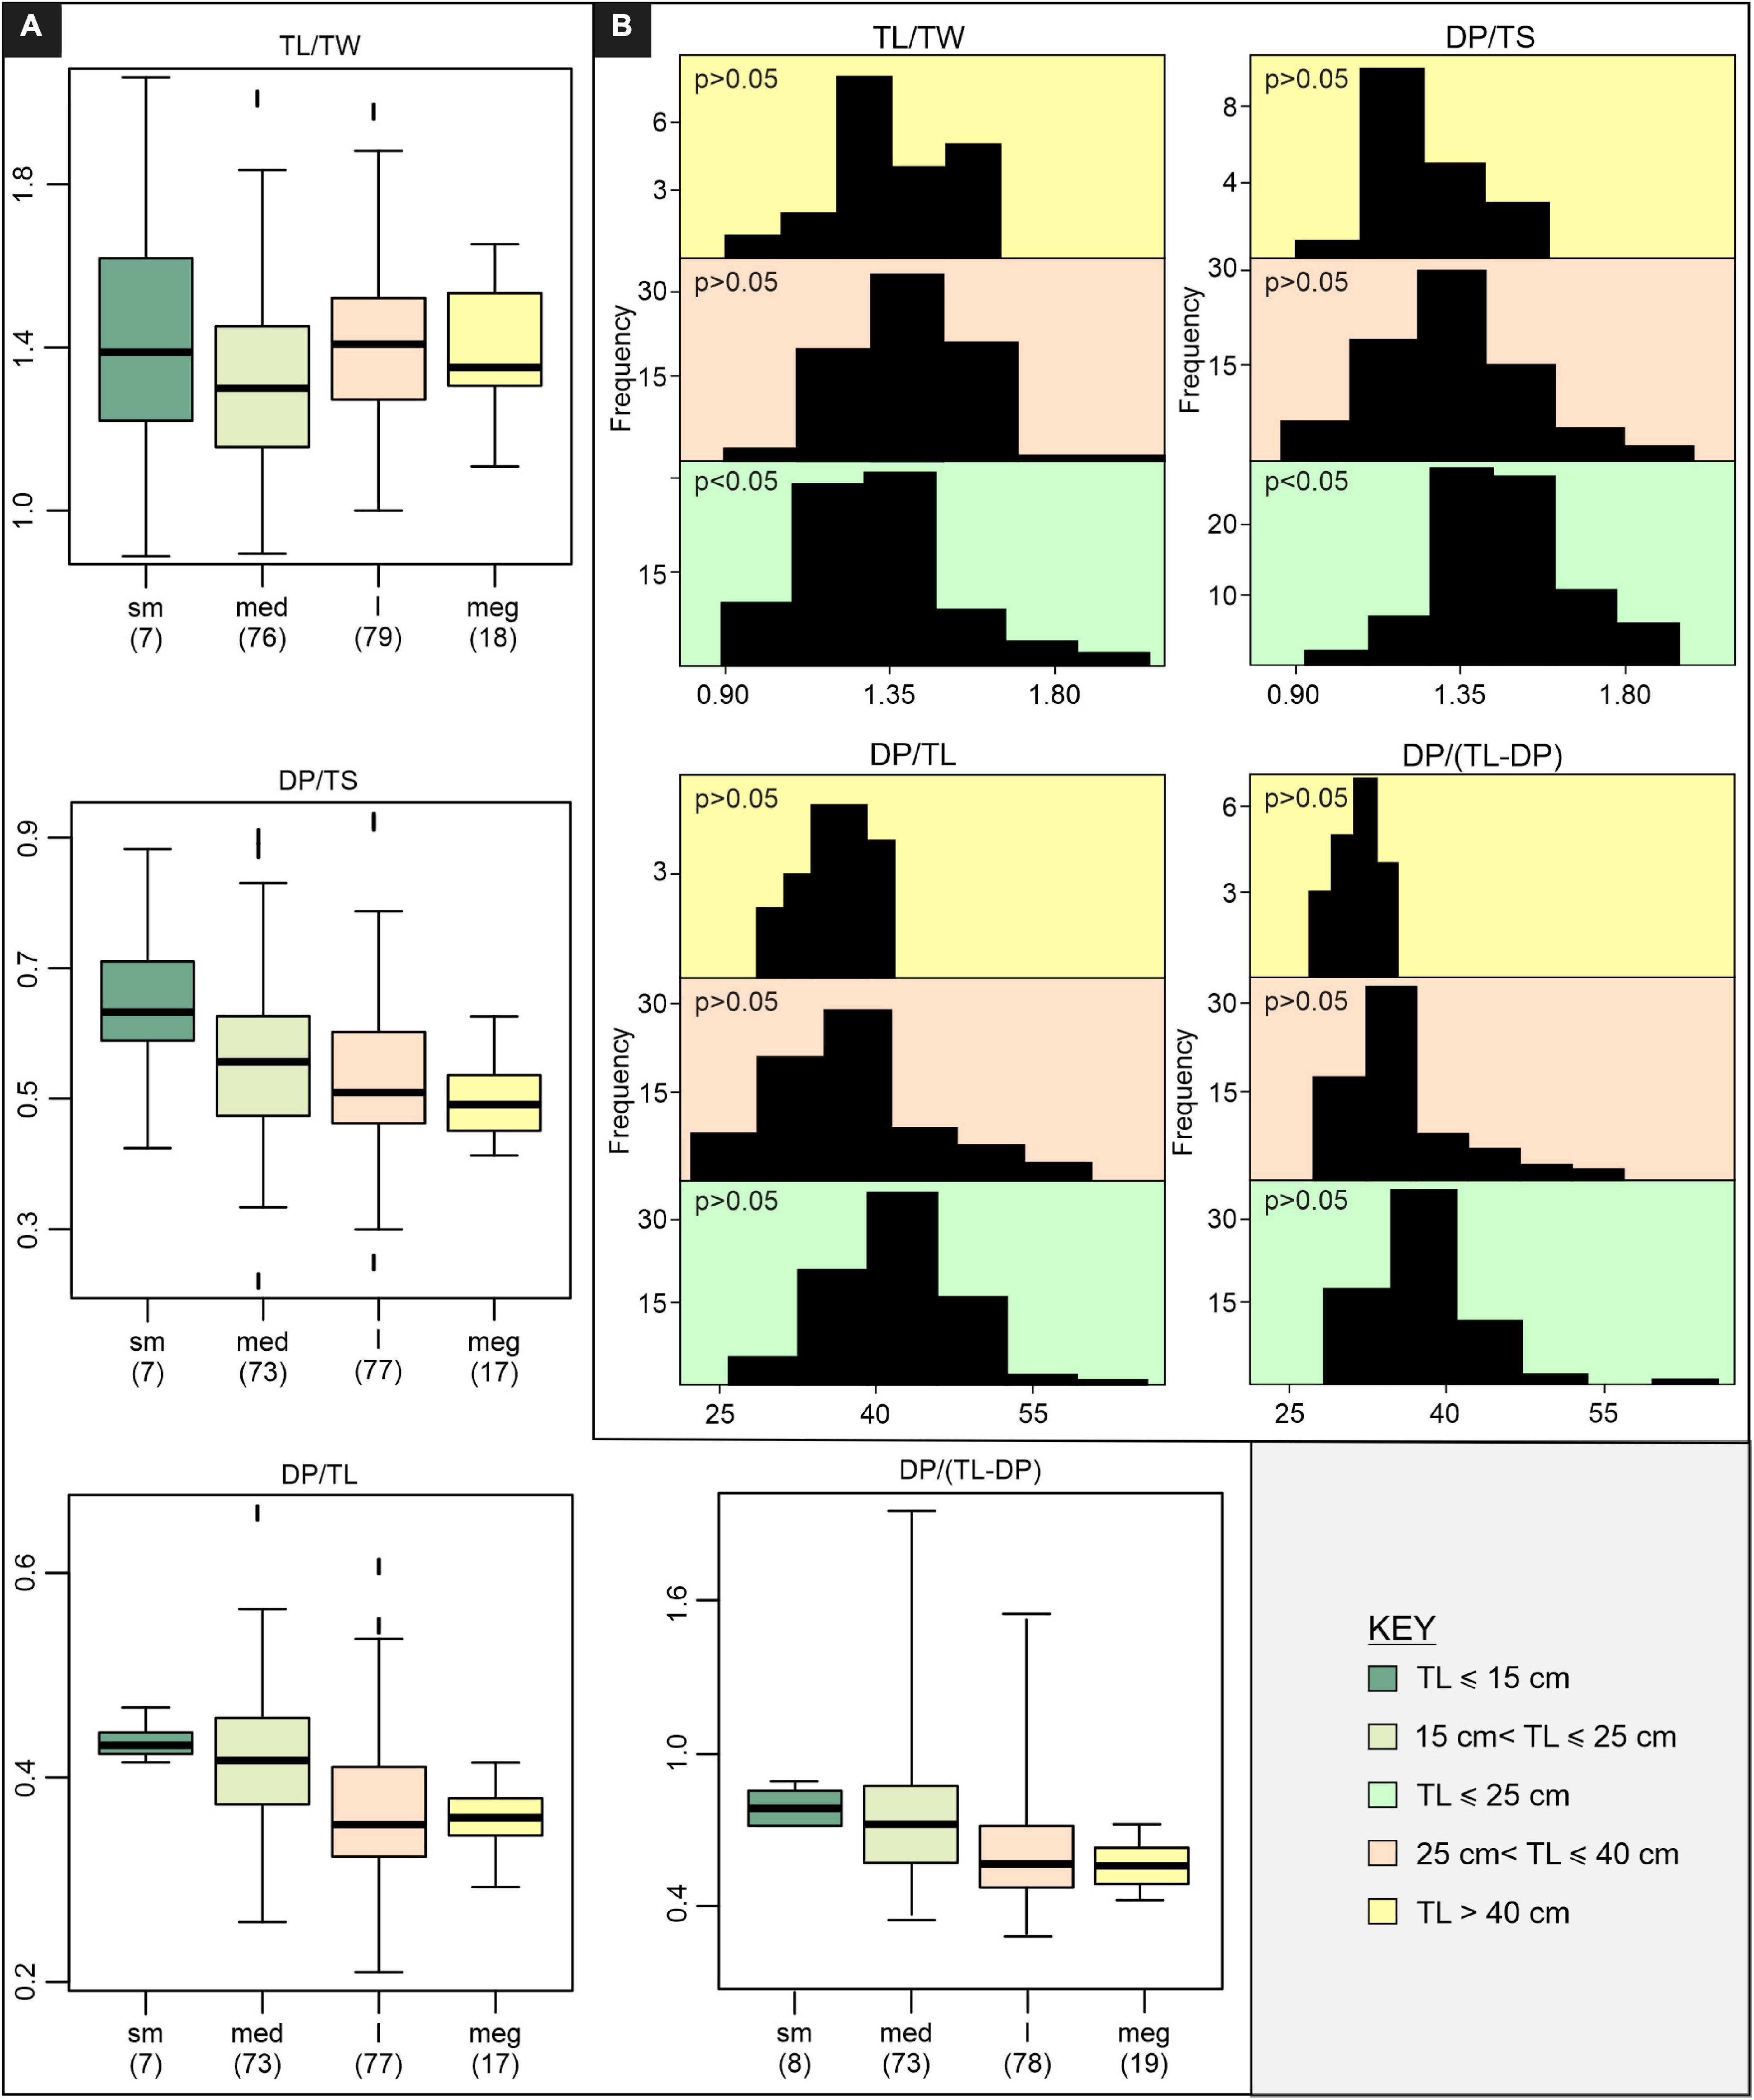
Figure 4. Morphology, expressed by track bivariate ratio data, across the K-GAE plexus. (A) Boxplots showing the spread in data for considered ratios (50% of data within the box, median denoted with a black bar), (B) Frequency distributions with Shapiro-Wilk normality probabilities (p > 0.05 follows a normal distribution) included. Due to the limited sample size of “small” tracks, TL ≤ 15 cm data are merged with 15 < TL ≤ 25 cm data. sm – small, med – medium, l – large, meg – mega, TL – track length, TW – track width, DP – digit III projection, TS – track span.
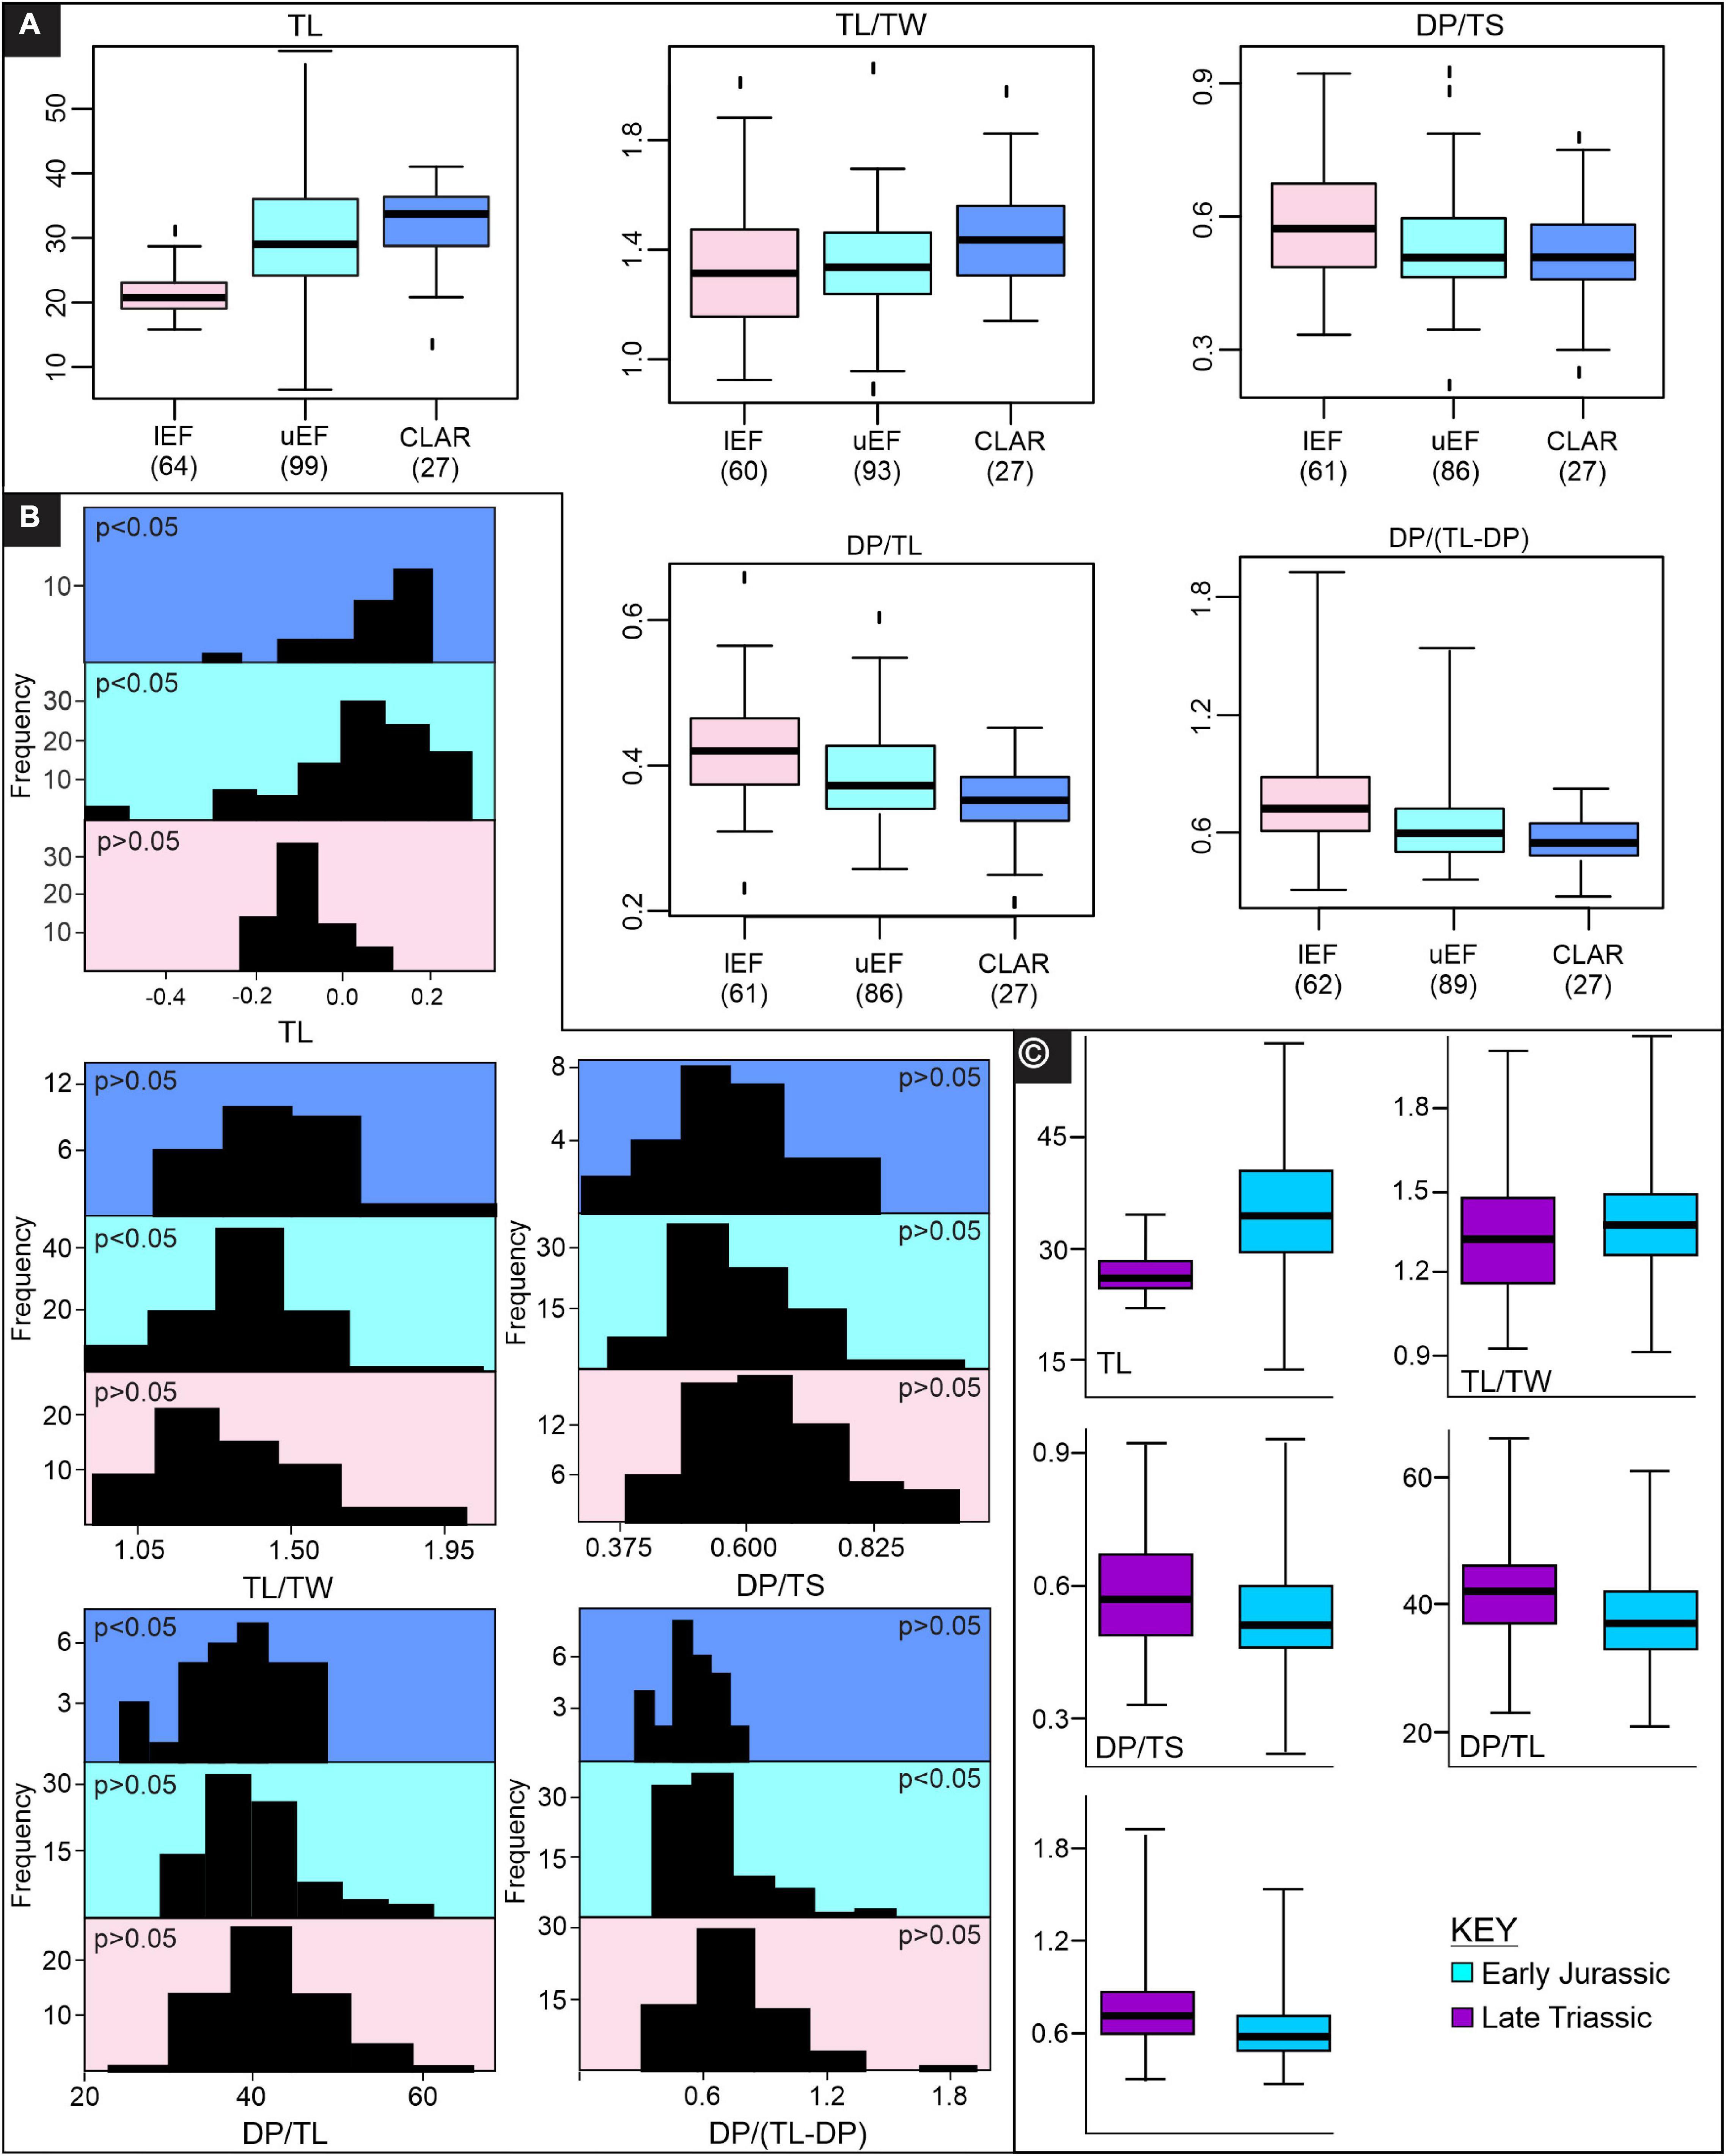
Figure 5. Track length and bivariate ratio trends across the upper Stormberg Group. (A) Boxplots showing the spread in data for considered variables (50% of data within the box, median denoted with a black bar), (B) Frequency distributions with Shapiro-Wilk normality probabilities (p > 0.05 follows a normal distribution) are included, (C) Box and whisker plots of Late Triassic (lEF) and Early Jurassic (uEF and CLAR) tracks, where 50% of the data are within the box and the median is denoted by a black bar. lEF – lower Elliot Formation, uEF – upper Elliot Formation, CLAR – Clarens Formation, TL – track length, TW – track width, DP – digit III projection, TS – track span.
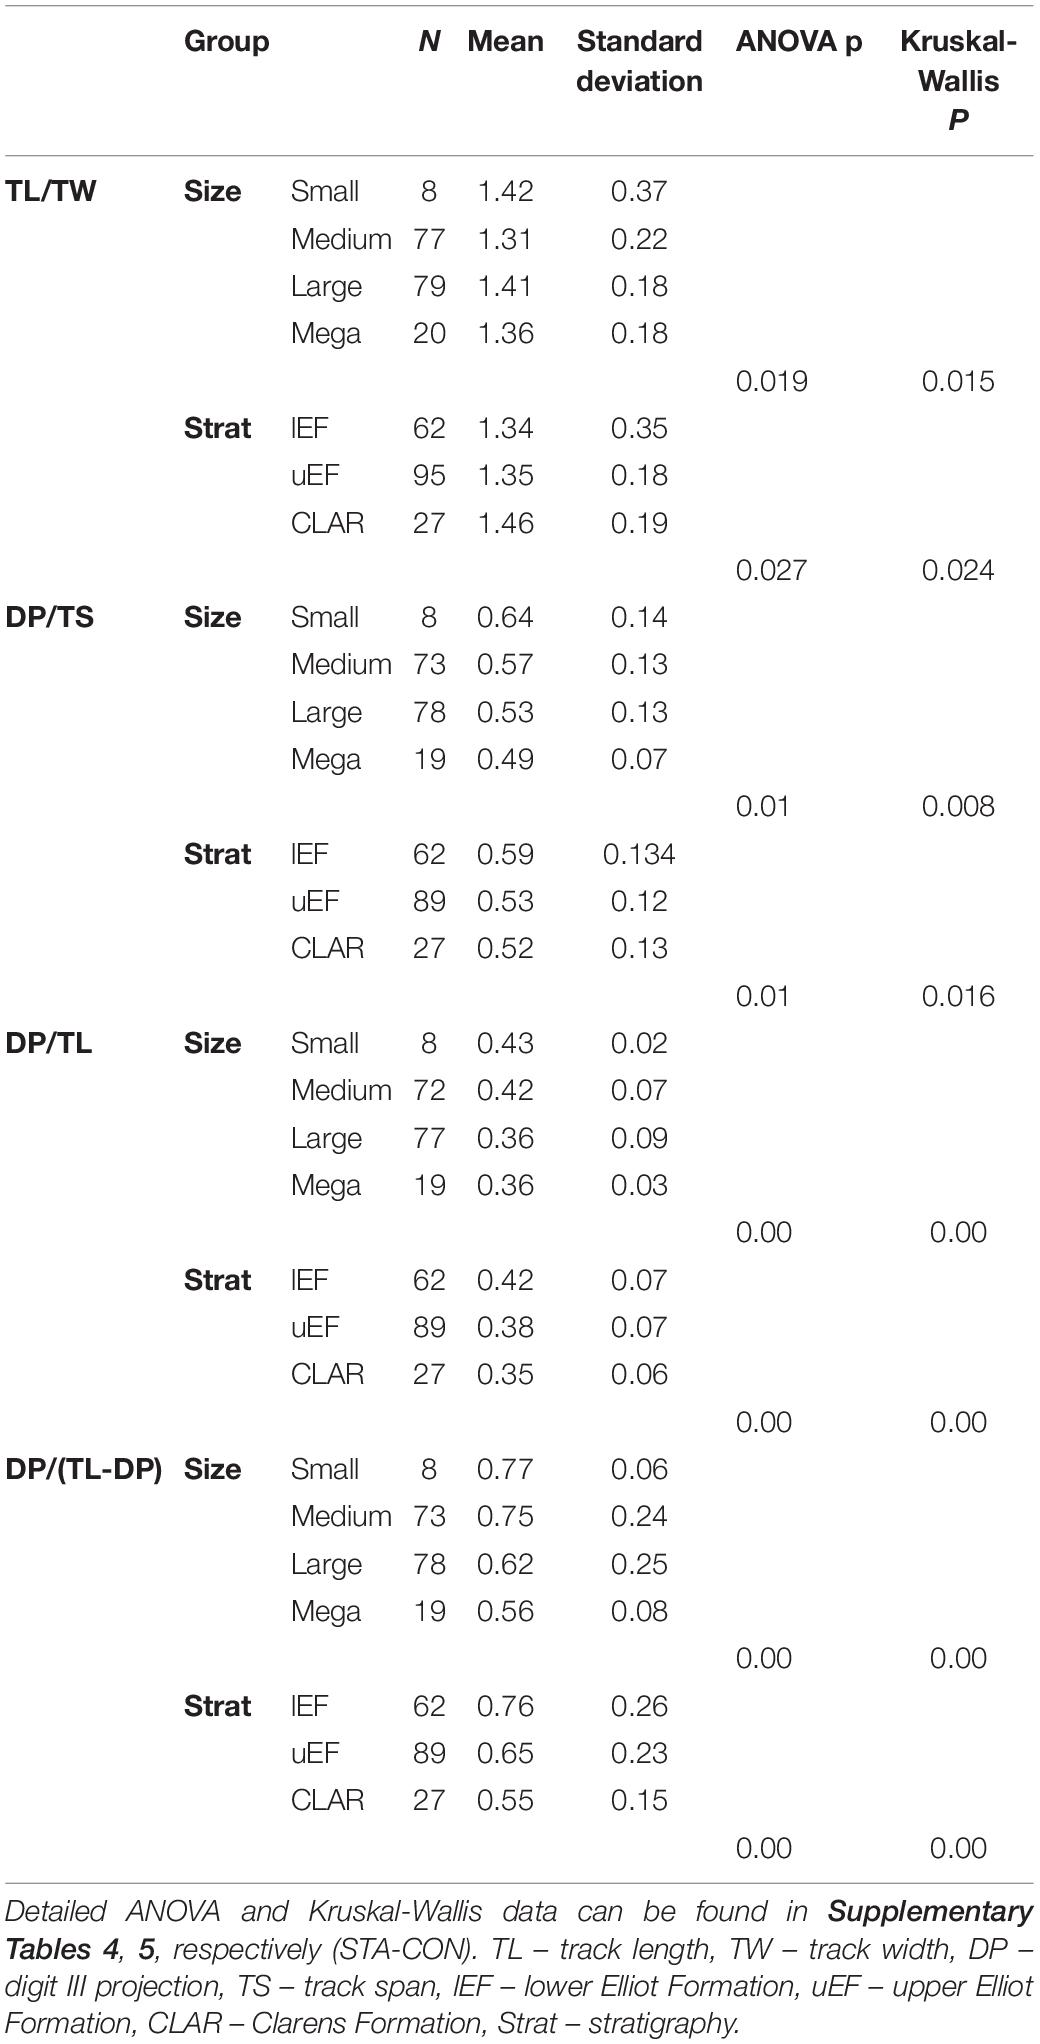
Table 1. Summary statistics for equal distributions of bivariate ratio data for size and stratigraphic groupings, where p < 0.05 is statistically significant.
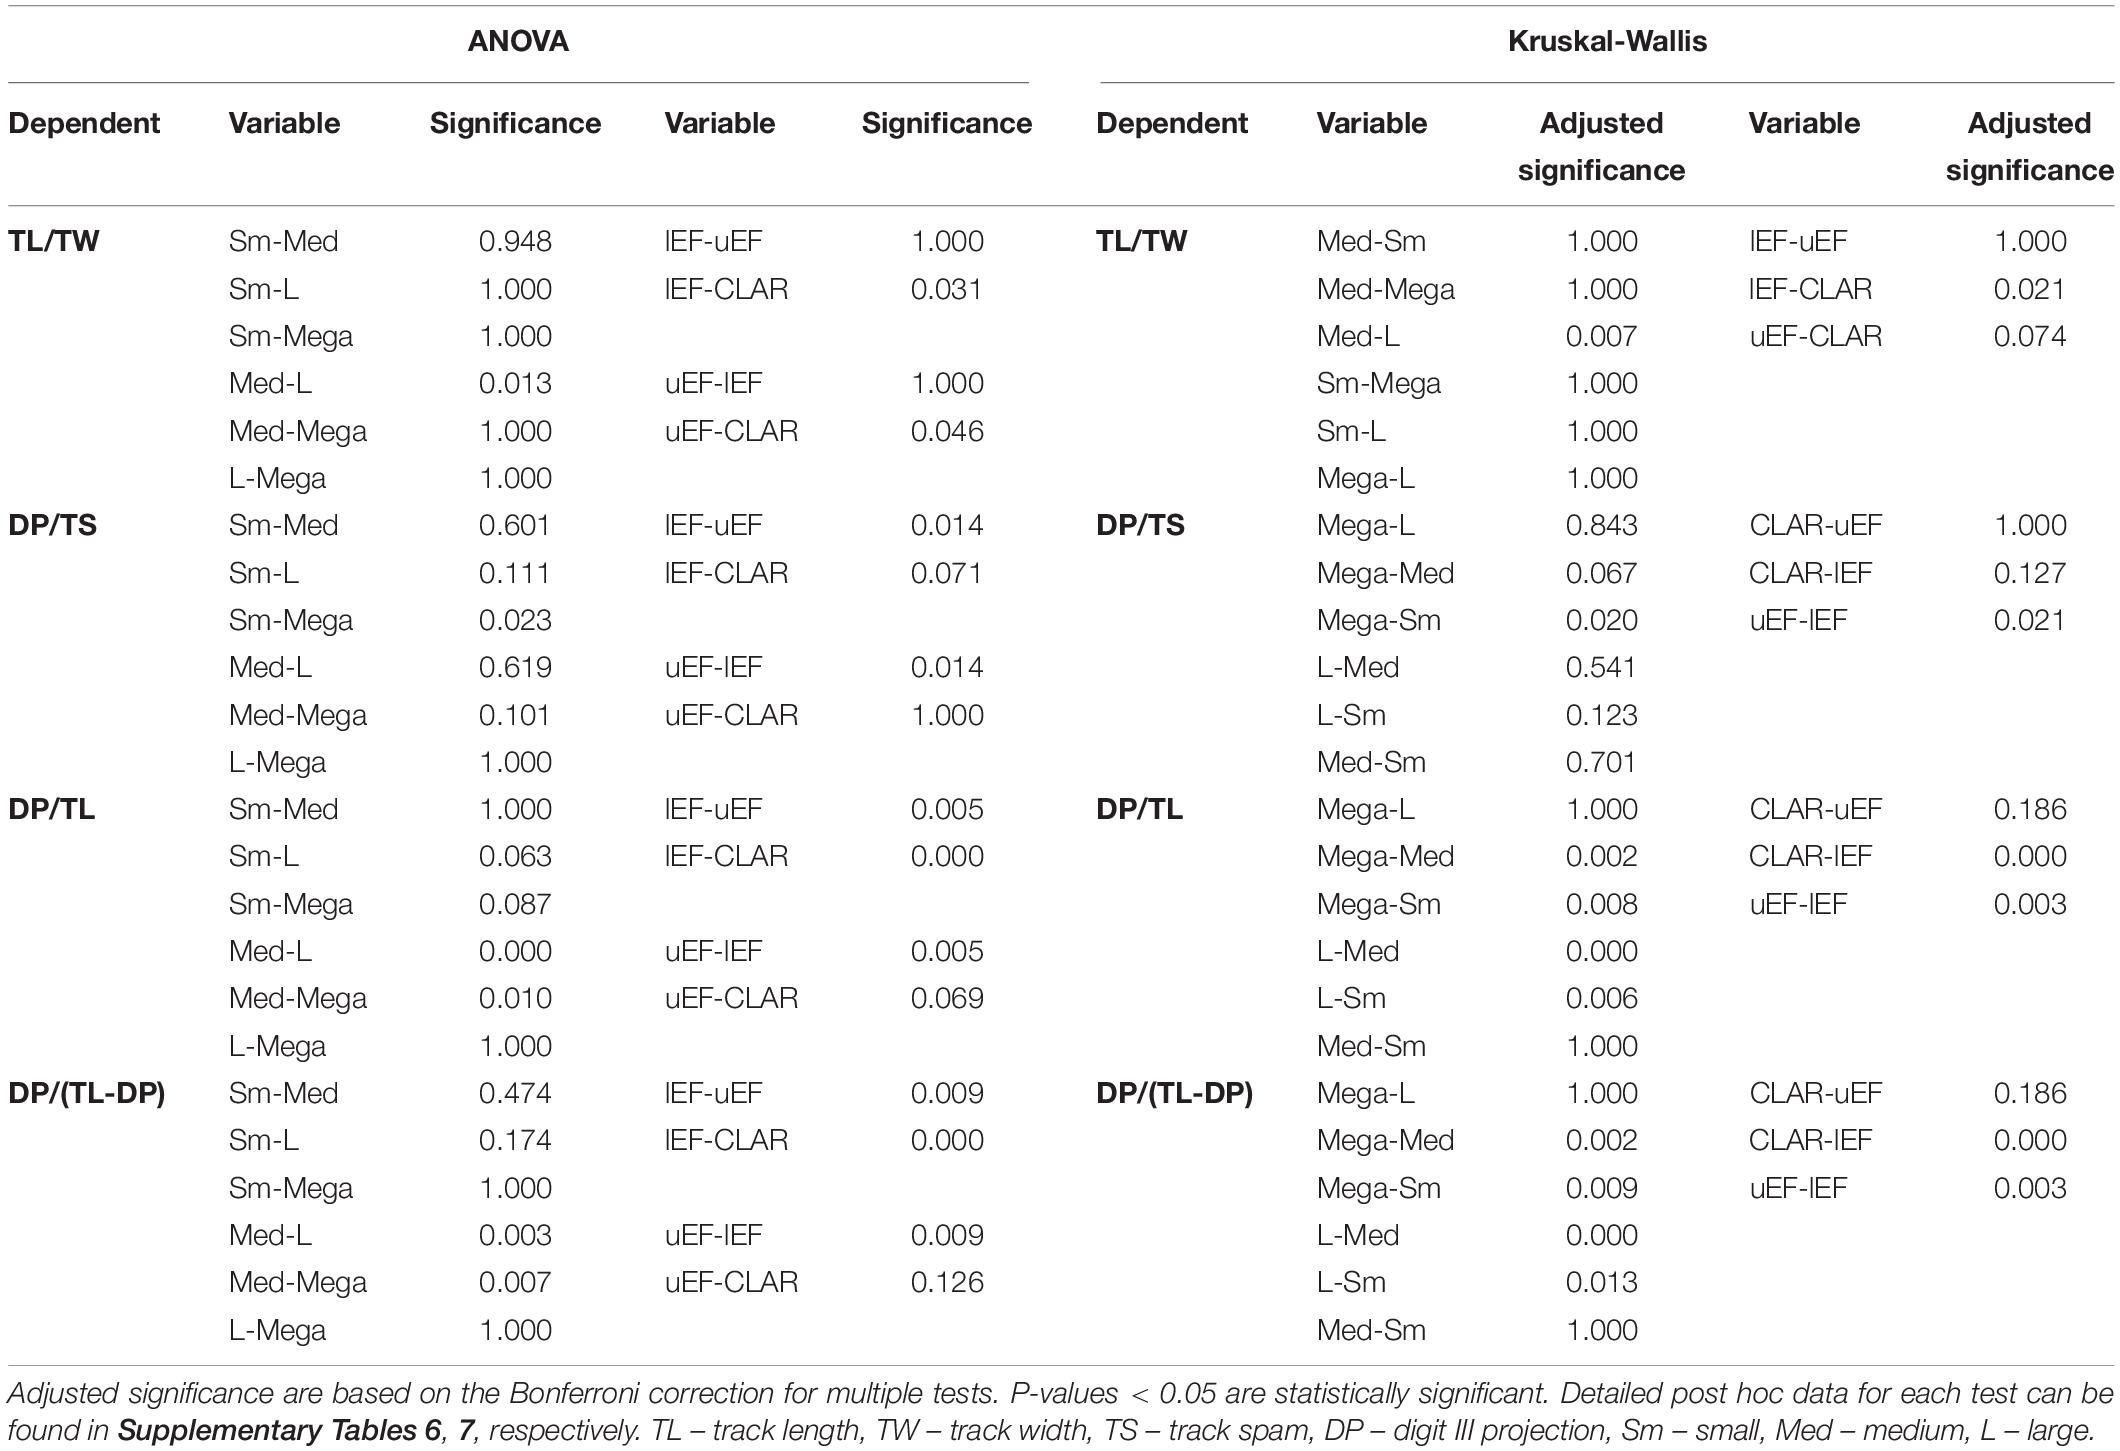
Table 2. Post hoc assessment data for ANOVA and Kruskal-Wallis tests.
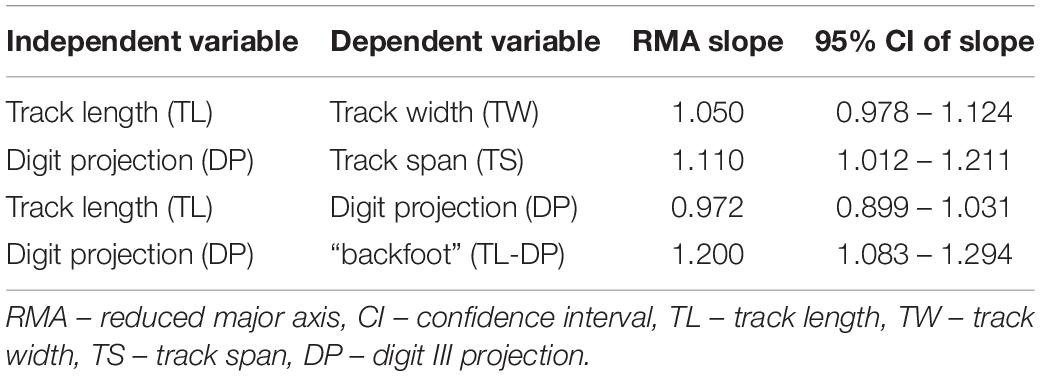
Table 3. Summary of reduced major axis analysis where CI between 0.95 and 1.05 are isometric.
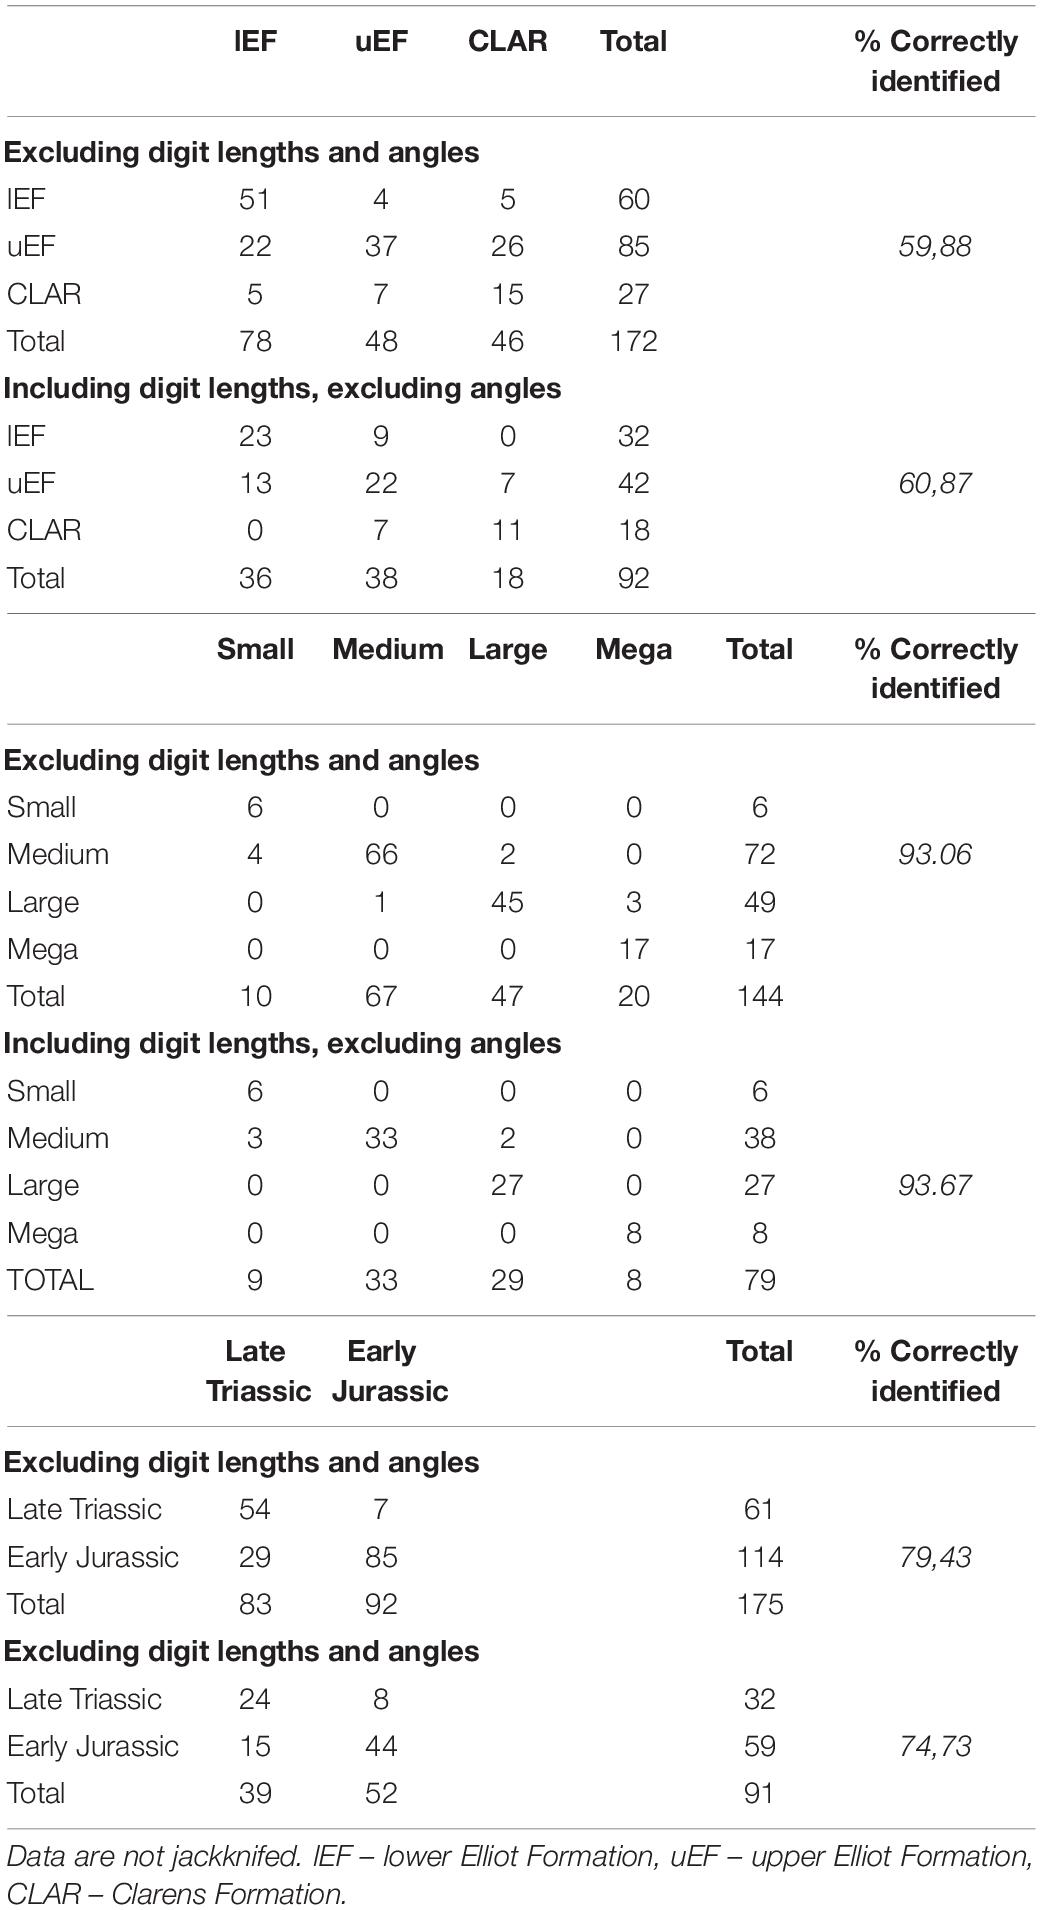
Table 4. Summary of the discriminant analysis confusion matrix.
Results
The stratigraphic distribution of upper Stormberg Group tridactyl tracks considered in this study is skewed toward the uEF (50% of the database) with 35% of the tracks from the lEF and 15% from the Clarens Formation. The tracks are primarily preserved as isolated tracks with morphological preservation qualities ranging from 0 to 3 (Supplementary Figure 1 and Supplementary Table 1). Of the 216 tracks that comprise the dataset, 81% of the tracks have complete TL, TW, TS, DP measurements, which are the main linear parameters used for ichnotaxonomic assignment and morphological descriptions.
Relationship Between Measured Variables
As expected, with increasing TL, all the linear track parameters are positively correlated, i.e., they increase as TL increases (Figure 3). A gradient inflection point is noted for the TL and DP bivariate plot, indicating that larger tracks have a reduced DP relative to smaller tracks (Figure 3A and Supplementary Figure 2). The digit lengths have positive, linear relationships (LII and LIII, LII and LIV, LIII, and LIV), which is most pronounced for LII and LIV. The interdigital angle data show significant spread and do not correlate with any of the considered linear parameters (Figure 3). Because divarication angles are the most interpretive parameter to measure without a standardized method (Thulborn, 1990) and are secondary contributors to track morphology (Moratalla et al., 1988; Lockley, 2009), digit divarication data are excluded from further morphological assessment herein. Linear ratio data show significant spread, with track elongation (TL/TW) having no apparent trend to TL, and mesaxony (DP/TS), the proportion of DP accounting for TL (DP/TL) and DP relative to the “backfoot” [DP/(TL-DP)] having weak negative correlations with TL (Figure 3 and Supplementary Figure 2). Furthermore, elongate tracks tend to have higher mesaxony as well.
Trends Within the Kayentapus-Grallator-Anchisauripus-Eubrontes Plexus
Morphological trends across the K-GAE spectrum are well-established for North American tracks (e.g., Olsen, 1980; Weems, 1992; Olsen et al., 1998) but have not been quantified for their southern African counterparts. Established trends for K-GAE and tridactyl tracks in general include a decrease in elongation, mesaxony and digit III emphasis with increasing TL. Given that the linear measurements are all positively correlated (Figure 3) and their normalized frequency distributions show no trends with increasing size (Supplementary Figure 3), here we focus on track ratios to express the morphology of upper Stormberg Group K-GAE tracks.
The TL/TW for each size grouping is highly variable and overlaps significantly between the different subsets (Figure 4 and Supplementary Table 3). ANOVA and Kruskal-Wallis tests suggest a potential significant difference in the TL/TW distribution of the size groups (Table 1 and Supplementary Tables 4, 5), but the only statistically significant difference is between “medium” and “large” tracks (Table 2 and Supplementary Tables 6, 7). TL and TW are interpreted to have an isometric relationship and increase in size at similar rates (Table 3). There is an apparent decrease in mesaxony with increasing size (Figures 4A,B and Supplementary Table 3). ANOVA and Kruskal-Wallis tests suggest a potential significant difference in the DP/TS distribution of the size groups (Table 1 and Supplementary Tables 4, 5), which is only statistically significant between “small” and “mega” tracks (Table 2 and Supplementary Tables 6, 7). It should be noted that “small” and “mega” tracks only account for 14% of the DP/TS data and that increasing the robustness of these size subsets may change the statistical relevance of their difference. DP and TS have an isometric to positive, “barely” allometric relationship, suggesting that TS may increase at a greater rate than DP (Table 3).
DP/TL and DP/(TL-DP) ratios show an apparent decrease with increasing size (Figures 4A,B and Supplementary Table 3). ANOVA and Kruskal-Wallis testing indicate that the size groups have distinct distributions (Table 1 and Supplementary Tables 4, 5), with statistically different distributions for most of the size subsets (“mega” – “medium”, “mega” – “small”, “large” – “medium”, “large – small”; Table 2 and Supplementary Tables 6, 7). TL and DP have an isometric to negative “barely” allometric relationship suggesting that DP increases at a slower rate than TL. DP and the “backfoot” (TL-DP) have a positive allometric relationship, indicating that the “backfoot” increases in length at a faster rate than DP (Table 3).
The ratio data for the K-GAE plexus suggest gradational, but significant, differences in track morphology with increasing size which is most pronounced for parameters considering digit III projection. DP/TL and DP/(TL-DP) are distinct for TL ≤ 25 cm versus TL > 25 cm (i.e., “small” – “medium” tracks and “large” – “mega” tracks are indistinguishable from each other), and DP/TS of “small” and “mega” tracks are distinct from each other, but “medium” and “large” tracks are indistinguishable.
Trends Within the Upper Stormberg Tracks
Stratigraphically well-provenanced tracks in the upper Stormberg Group are evaluated with regards to potential morphological changes through time (Figure 5). The TL data for the upper Stormberg Group have a lot of spread, particularly the uEF, but an increase in TL from the lEF to CLAR is reflected in each subset’s mean, median TL, interquartile range TL and frequency distributions (Figures 5A,B and Supplementary Table 8). Given that the linear measurements are all positively correlated (Figure 3) and increase with TL up stratigraphy (Supplementary Figure 4), here we focus on ratios to express morphology. Track elongation data (TL/TW) for the tridactyl tracks are variable throughout the stratigraphy, particularly the lEF, and overlap significantly between the different stratigraphic units though a potential decrease in TL/TW is observable up stratigraphy (Figures 5A,B and Supplementary Table 8). ANOVA and Kruskal-Wallis tests suggest that there are differences in the groups’ distributions (Table 1 and Supplementary Tables 4, 5), which are only statistically relevant between the lEF and CLAR tracks (Table 2 and Supplementary Tables 6, 7). Mesaxony (DP/TS) data for each stratigraphic group are comparably variable in range, but the lEF has the most spread in data (Figures 5A,B). Median DP/TS ratios and accompanying interquartile ranges, hint at a decrease in mesaxony up stratigraphy. ANOVA and Kruskal-Wallis testing suggest that there are differences in the groups’ distributions (Table 1 and Supplementary Tables 4, 5), but these differences are mainly attributed to the lEF and uEF tracks which have statistically distinct distributions (Table 2 and Supplementary Tables 6, 7). A more distinct, statistically relevant, decrease in mesaxony may be noted if additional track data are collected from the under-represented CLAR, which currently only comprises 15% of the studied dataset. Ratios relating to DP [DP/TL and DP/(TL-DP)] show an apparent decrease in their medians and interquartile range data up stratigraphy (Figure 5 and Supplementary Table 8), though it should be noted that the lEF and uEF ratios have a lot spread in data. ANOVA and Kruskal-Wallis tests indicate the distributions of the groups are statistically distinct (Table 1 and Supplementary Tables 4, 5), with the primary differences in distributions attributable to the uEF and CLAR relative to the lEF.
The stratigraphic ratio data indicate that the uEF and CLAR distributions are indistinguishable from each other but tend to be distinct from the lEF (Table 2). This suggests that there is a change in track morphology from the Late Triassic (lEF) to Sinemurian (uEF), which persists throughout the Pliensbachian (CLAR).
Comparing the Late Triassic and Early Jurassic tracks does not improve the resolution of these apparent ratio trends (Figure 5C). However, the Early Jurassic tracks are clearly, on average, larger and have greater maximum TLs. Given the strong correlation between TL and stratigraphic unit, it is unclear whether the decrease in DP/TL and DP (TL-DP) and the potential decrease in DP/TS reflect morphological changes linked to size (i.e., K-GAE plexus) or reflect evolutionary pedal morphological variation. The trends observed within the K-GAE plexus, i.e., no strong distinction between elongation, an apparent decrease in mesaxony and a decrease in DP/TL and DP/(TL-DP), are comparable to the trends observed up stratigraphy (Figures 4, 5). Given the strong correlation between stratigraphic unit and TL, the morphological variation of individual size classes needs to be evaluated up stratigraphy to establish whether the observed stratigraphic trends are simply due to the presence of greater and more abundant larger TLs or potentially reflect pedal morphology evolutions through time.
Tracks with TL ≤ 25 cm and 25 < TL < 40 cm have similar apparent trends up stratigraphy: erratic TL/TWs, and a decrease in DP/TS, DP/TL and DP/(TL-DP) (Figures 6A,B). The DP/TL ratios (TL ≤ 25 cm and 25 < TL ≤ 40 cm) and DP/(TL-DP) ratios (TL ≤ 25 cm) for uEF and CLAR subsets largely overlap and have similar medians, suggesting that for these size groupings there is a distinct change in morphology between the Norian–Rhaetian lEF and Hettangian–Sinemurian uEF, but that the morphology is consistent for these size classes into the Sinemurian–Pliensbachian Clarens Formation. These observations echo the post hoc assessments of the stratigraphic groups, which showed that the DP/TL and DP/(TL-DP) distributions for the uEF and CLAR were distinct from the lEF but no different from each other (Table 2 and Supplementary Tables 6, 7). The uEF and CLAR DP/TS ratios do not overlap with each other for TL ≤ 25 cm but do coincide, and have similar medians, for 25 < TL ≤ 40 cm. Post hoc assessments considering all size classes indicated that the lEF DP/TS ratios are distinct from the uEF and CLAR, which had similar distributions but that is only partially detected when examining stratigraphic trends of the different size groupings (Figures 6A,B). “Mega” track trends deviate from the trends observed for TL ≤ 40 cm, potentially showing an increase in TL/TW and DP/TS from the uEF to CLAR, but these observations are not considered to be convincing as they are only based on 22 tracks. Furthermore, these “mega” trends are not observed across the Triassic–Jurassic boundary as no TL > 40 cm from the Upper Triassic of southern Africa are documented herein.
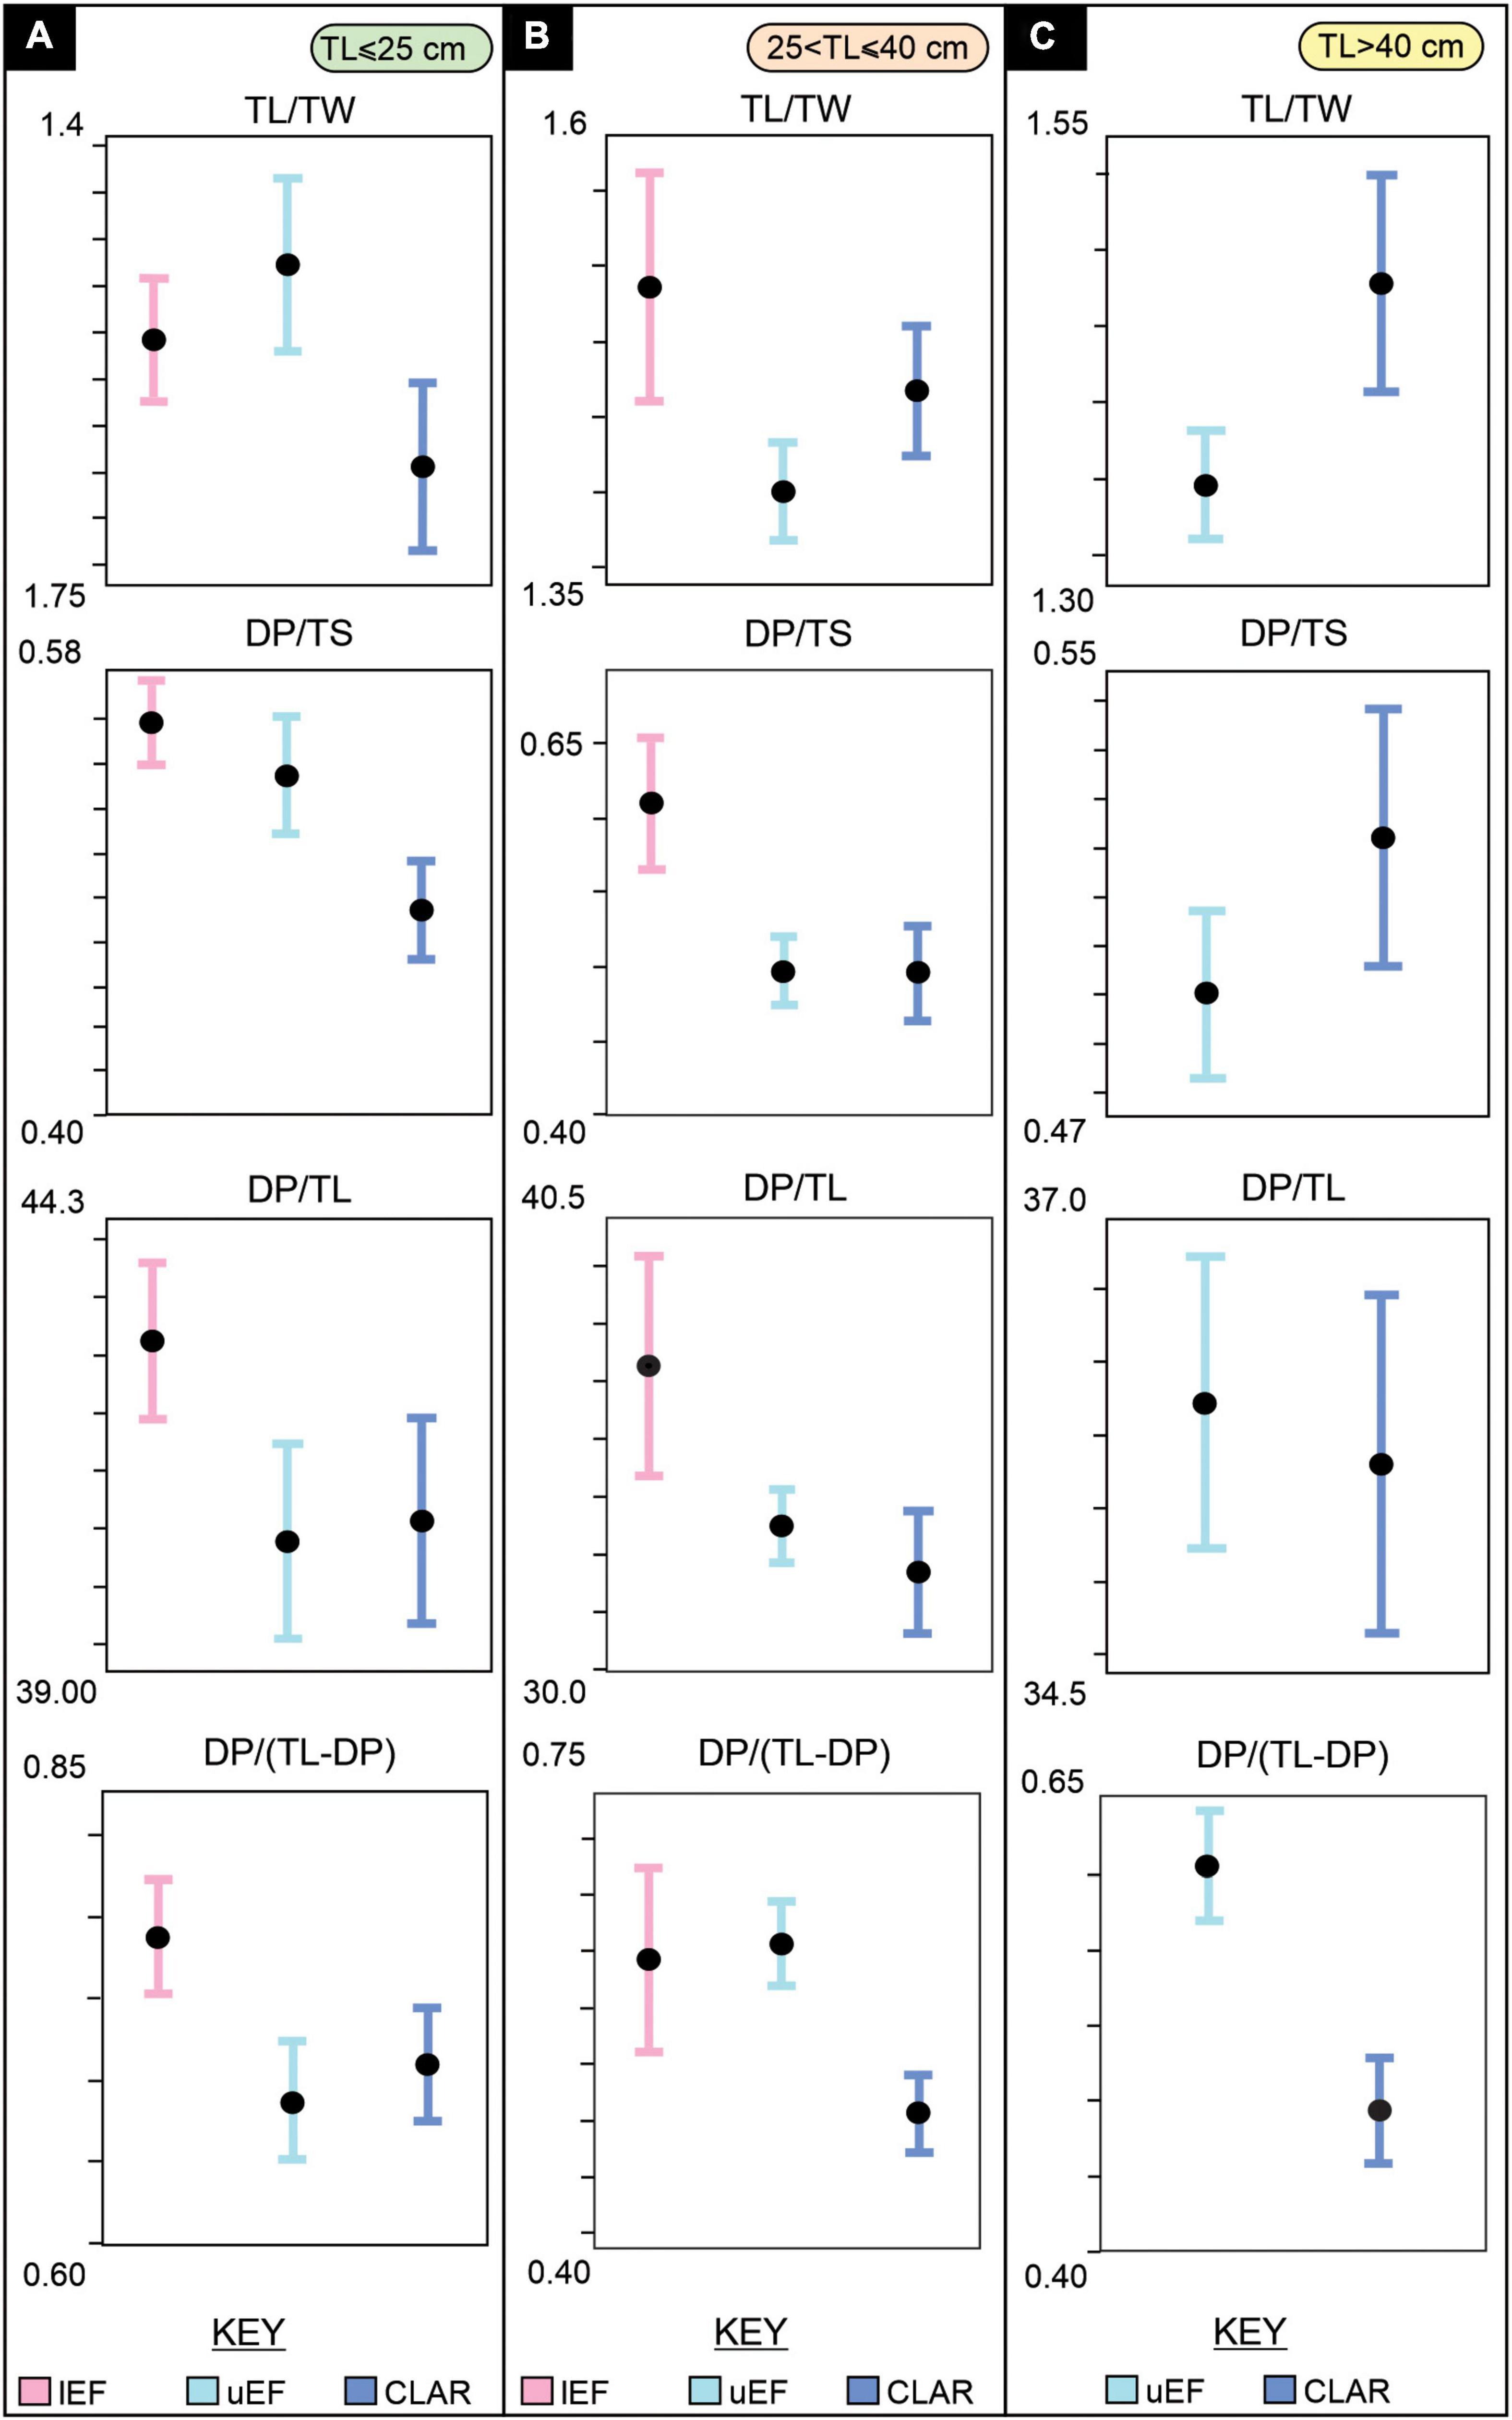
Figure 6. Size grouping trends across the stratigraphic units of the upper Stromberg Group. (A) TL ≤ 25 cm, due to limited sample size “small” track data are merged with “medium” track data, (B) 25 < TL ≤ 40 “large” tracks, (C) TL > 40 cm “mega” tracks. lEF – lower Elliot Formation, uEF – upper Elliot Formation, CLAR – Clarens Formation, TL – track length, TW – track width, DP – digit III projection, TS – track span.
Given that tracks within the TL ≤ 25 cm and 25 < TL ≤ 40 cm size classes show a decrease in DP/TS, DP/TL and DP/(TL-DP) up stratigraphy, the decrease in mesaxony and digit III projection emphasis observed for ungrouped data across stratigraphy (Figure 5) may not simply be a function of the coinciding increase in track size (Figure 4). Instead, they may also reflect a pedal morphology evolutionary trend in southern Africa, where irrespective of size, Early Jurassic tridactyl tracks have a reduced DP/TL and DP/(TL-DP) and a potentially decreased DP/TS relative to Late Triassic tracks. The distinction in the morphology observed between Late Triassic lEF and Early Jurassic uEF and CLAR tracks is further supported by discriminant analysis which has up to 19% improvement in correctly identifying tracks of a given period rather than of a given stratigraphic unit (Table 4).
Discussion
Dataset Limitations
Track Anatomical Fidelity
Footprint morphology is controlled by the trackmaker’s pedal morphology, its behavior and the substrate it interacts with. The majority of fossil tracks considered in this study are preserved as isolated tracks; therefore, the influence of these three variables cannot be accounted for and it is assumed that for most tracks, the track morphology reflects the trackmaker. A small number of tracks, specifically those at Upper Moyeni, preserve expulsion rims and sediment slumping features indicative of a strong substrate control on the resultant track morphology, but because they comprise trackways, and morphological consistencies can be checked, some measurements were obtained from these tracks (Supplementary Figure 1 and Supplementary Table 1). The degree of anatomical fidelity can be quantified using established morphological preservation grades, where high Mps of 2–3 preserve anatomical characters (Belvedere and Farlow, 2016; Marchetti et al., 2019). The upper Stormberg Group tracks in this study encompass Mps ranging from 0–3, with those of Mp ≥ 2 accounting for ∼60% of the dataset (Supplementary Table 1). Tracks considered herein with Mp < 2 are predominantly complete tridactyl tracks that do not preserve anatomical details like digital pad impressions or claw marks (Supplementary Figure 1).
Another factor to consider for anatomical fidelity is whether tracks are preserved as true tracks, undertracks or natural casts, where true tracks and casts are most likely to preserve anatomical details. Undertracks, registered in underlying sediments in response to a trackmaker’s weight, are subject to overall track enlargement, broadening of digit morphologies and widening of interdigit angles (Avanzini et al., 2012), and therefore need to be treated with caution. The ichnosites considered in this dataset are interpreted to primarily preserve true tracks, on ripple-marked and/or desiccated palaeosurfaces, with some tracks preserving anatomical details or sedimentary structures within the impression (e.g., Maphutseng track 31, Phuthiatsana tracks 1–6; Supplementary Figure 1). Six of the tridactyl true tracks are penetrative, such as those at Upper Moyeni and Matobo, but because they comprise steps or trackways their overall dimension measurements may be somewhat corroborated (Supplementary Figure 1). Exaggerated elongation of the tracks is not observed.
Track Record Biases
A flaw in the dataset is that the distribution of the collected track data is not even throughout the upper Stormberg Group. Most of the 216 tracks considered herein are from the Lower Jurassic (uEF 50% and CLAR 15%) with only 35% of the tracks from the Upper Triassic lEF. Furthermore, the uEF has the highest proportion of tracks with Mp ≥ 2 (60% versus 50% for the lEF and CLAR), making it the most robust track subset in the dataset. Additional distribution inconsistencies are also noted across the upper Stormberg stratigraphic units: the bulk of the uEF ichnosites are from the middle to upper of this stratigraphic unit, while the CLAR ichnosites are exclusively from the lowermost Clarens Formation, which is likely Sinemurian (see Bordy et al., 2020). Therefore, more detailed observation resolution across the Triassic–Jurassic boundary is lacking, and trends projected into the Pliensbachian need more substantiating. To circumvent biases related to the stratigraphic distribution of tracks (in terms of number of tracks and stratigraphic position), additional sites in the lEF and CLAR (e.g., Ellenberger, 1970; Rampersadh and Bordy, 2019) need to be located or cast materials, from extensive track documentation by Ellenberger (1970, 1972) housed at the Morija Museum and Archives in Lesotho and Université de Montpellier in France need to be included into the dataset.
Additional biases inherent in the dataset can be attributed to the geological aspects of the Upper Triassic – Lower Jurassic rocks of southern Africa. The upper Stormberg Group was deposited under acidifying climatic conditions, which has a strong control on the prevalence and distribution of ichnosites. The lEF was deposited mainly in meandering fluvial systems during humid to semi-arid climatic conditions, while the uEF was deposited in ephemeral water courses (streams, rivers) and lakes prone to flash floods (Bordy et al., 2004a,2020). Unlike the lEF, the uEF deposits experienced extended periods of exposure evidenced by the common pedogenic alteration features (e.g., paleosols, in situ pedogenic carbonates, root traces, desiccation cracks; Bordy et al., 2004a,2020). The seasonal flooding and exposure events of the uEF may have created more favorable conditions to register and preserve tracks than in the lEF. Additionally, the dramatic thinning of the Elliot Formation from south to north is more pronounced and variable for the lEF, which may suggest that parts of the lEF in the north are missing, affecting sampling (Bordy et al., 2004b,2020; Bordy and Eriksson, 2015). The basal and upper zones of the Clarens Formation have been interpreted as deposits of wetter aeolian systems with lakes (Beukes, 1970; Bordy and Head, 2018), which are suitable for track preservation; however, due to poor accessibility, the cliff-forming Clarens Formation is under-sampled to date. Given these geological considerations, our skewed uEF dataset and exclusive basal CLAR dataset may not only reflect a sampling bias but also a preservation bias controlled by large-scale paleoenvironmental conditions.
The Southern African Kayentapus-Grallator-Anchisauripus-Eubrontes Continuum
Most theropods (sensu Baron et al., 2017; Langer et al., 2017) and ornithopods have a functionally tridactyl pes with the medial digit being the most prominent, and subordinate peripheral digits II and IV often having subequal lengths. Tracks attributed to theropod trackmakers are globally abundant in the Upper Triassic – Lower Jurassic and often dominate the ichnological record (e.g., Petti et al., 2008; Belvedere et al., 2010; Moreno et al., 2012; Läng et al., 2013; Lockley et al., 2013; Pérez-Lorente, 2015; D’Orazi Porchetti et al., 2016; Xing et al., 2020). For K-GAE plexus tracks outside southern Africa, it has been showed that with increasing TL tracks become wider (decrease in elongation and increase in total digit divarication), the medial digit projection decreases (reduced mesaxony) and the digits widen from gracile to more robust (e.g., Olsen, 1980, 2010; Weems, 1992; Olsen et al., 1998; Demathieu et al., 2014). This size-linked morphological continuum is also observed for ornithischians (e.g., Lockley, 2009; Lallensack, 2019), suggesting that, in part, the strong convergence and conservatism in footprint morphology for tridactyl dinosaurs and birds may be due to functionality (Farlow et al., 2018). There are exceptions to the rule, such as Minisauripus (Lockley et al., 2008), a Cretaceous ichnogenus with TL < 3 cm and morphologies akin to Eubrontes, e.g., reduced elongation and weak mesaxony with robust digits. Relative to their Triassic – Jurassic North American counterparts (holotype data from Lockley, 2009), the southern African K-GAE tracks have significantly reduced elongation (TL/TW) and mesaxony (DP/TS), which is most pronounced for Grallator-like tracks: Grallator holotype 2.64, 1.22 versus upper Stormberg 1.4, 0.65; Anchisauripus holotype 1.9, 0.68 versus 1.31, 0.57; Eubrontes 1.7, 0.58 versus 1.53, 0.53. The largest discrepancy applies to the Grallatoroid tracks, which have elongations and mesaxonies more comparable to Eubrontes, but unlike Minisauripus, have gracile digits and relatively stronger mesaxony (e.g., track Tsikoane track #6; Supplementary Figure 1 and Supplementary Table 1). Across the K-GAE continuum, southern African tracks preserve comparable elongation (deviating from global equivalents; Olsen et al., 1998; Lallensack, 2019), a shortening of DP relative to TL and the “backfoot”, and possible reductions in mesaxony, which require further data to substantiate. Digit III projection can be decreased by the shortening of digit III, lengthening of the outer digits, or a reduction in interdigital angles. Given that the interdigital angles are highly variable (Figure 3) and relative outer digit lengths are consistent across the plexus (Supplementary Figure 2), the observed reduction in DP/TL is likely due to a shortening of digit III, which would in turn influence mesaxony, supporting the weak trend noted herein (Figure 4). The lack of a trend in total digit divarication with track size further contradicts observations in North America (Olsen, 1995; Olsen et al., 1998) but is consistent with other global theropod track data (Lallensack, 2019).
In addition to morphological variations being observed within the southern African K-GAE plexus, morphological variations are observed for each ichnotaxon through time. Tracks with a TL ≤ 25 cm (Grallator-Anchisauripus) and 25 < TL ≤ 40 (Eubrontes) have an apparent decrease in mesaxony and digit III projection from the Upper Triassic to Lower Jurassic (Figure 6). These observations within the plexus and across stratigraphy are important for evolutionary interpretations, as digit III projection has been shown to be vital for tridactyl pedal function, specifically cursorial adaptations (see Lallensack et al., 2019). However, functional interpretations of track morphologies are lacking, and are hindered by limited studies on the pedal functional anatomy of tridactyl dinosaurs and their living relatives, birds (e.g., Farlow et al., 2000; Avanzini et al., 2012). The restricted theropod osteological record of the Stormberg Group is limited to fragmentary material (e.g., Kitching and Raath, 1984; Ray and Chinsamy, 2002; Yates, 2005; Viglietti et al., 2020a,b) and is thus inadequate for elucidating on the pedal function of local dinosaurs.
Theropod Body Size Trends
It is well established that maximum dinosaur body size had a general increasing trend throughout the Mesozoic (e.g., Benson et al., 2014; McPhee et al., 2018; Lallensack et al., 2019). The end-Triassic mass extinction events and Triassic–Jurassic boundary marked pivotal periods in dinosaur evolution and radiation, but unfortunately, an incomplete fossil record obscures the early evolution of large bodied theropod dinosaurs (Brusatte et al., 2010). Whether significant body size increases occurred at the Triassic–Jurassic boundary is contested; some authors propose local, abrupt increases in body size due to “ecological release” following the end-Triassic mass extinction events (Olsen et al., 2002), while others propose a gradual increase in body size, with few larger dinosaurs (body length of ∼5 m) having been present in the Late Triassic (e.g., Irmis, 2011; Lucas and Tanner, 2018; Griffin, 2019; Griffin and Nesbitt, 2019).
There is a direct link between TL and the body size of the trackmaker, with hip heights (h) and body lengths (BL) estimated from TL (Thulborn, 1990). Therefore, the increase in TL, in both maximum TL and abundance of larger TLs, observed within the upper Stormberg Group (Figures 5, 7A,B and Supplementary Table 1) reflects an increase in theropod body size from the Late Triassic to Early Jurassic. Moreover, the almost doubling of the maximum TL from 31 cm in the Late Triassic to 57 cm in Early Jurassic reflects a BL increase of > 450 cm in southern Africa (Figures 7A,B). From the lEF to the uEF–CLAR, the mean TL increases 43% from ∼21 to ∼31 cm, with larger tracks TL > 25 cm becoming more abundant in the Early Jurassic (75% versus 15%; Figures 7A,C). Tracks with TL > 25 cm are known, though very rare, from the lower Stormberg Group, with Ellenberger (1972) documenting Qemetrisauropus princeps, a lEF Eubrontes-like track from Lower Qeme in Lesotho (Figure 7D; Klein and Lucas, 2021). Therefore, the increase in body size reflected in the Stormberg Group track record appears to be gradual, with Eubrontes-sized tracks preserved from the Triassic, but becoming more common and larger in the Jurassic. These observations are consistent with global vertebrate track (e.g., Hunt and Lucas, 2007; Lagnaoui et al., 2012; Bernardi et al., 2018) and body fossil records (e.g., Welles, 1984; Rowe and Gauthier, 1990; Carpenter, 1997; Brusatte et al., 2010; Griffin and Nesbitt, 2019), which collectively suggest that larger theropods (TL of 25 – 27 cm; BL of ∼5 m) were present, though rare, in the Late Triassic, gaining prevalence in the Jurassic.
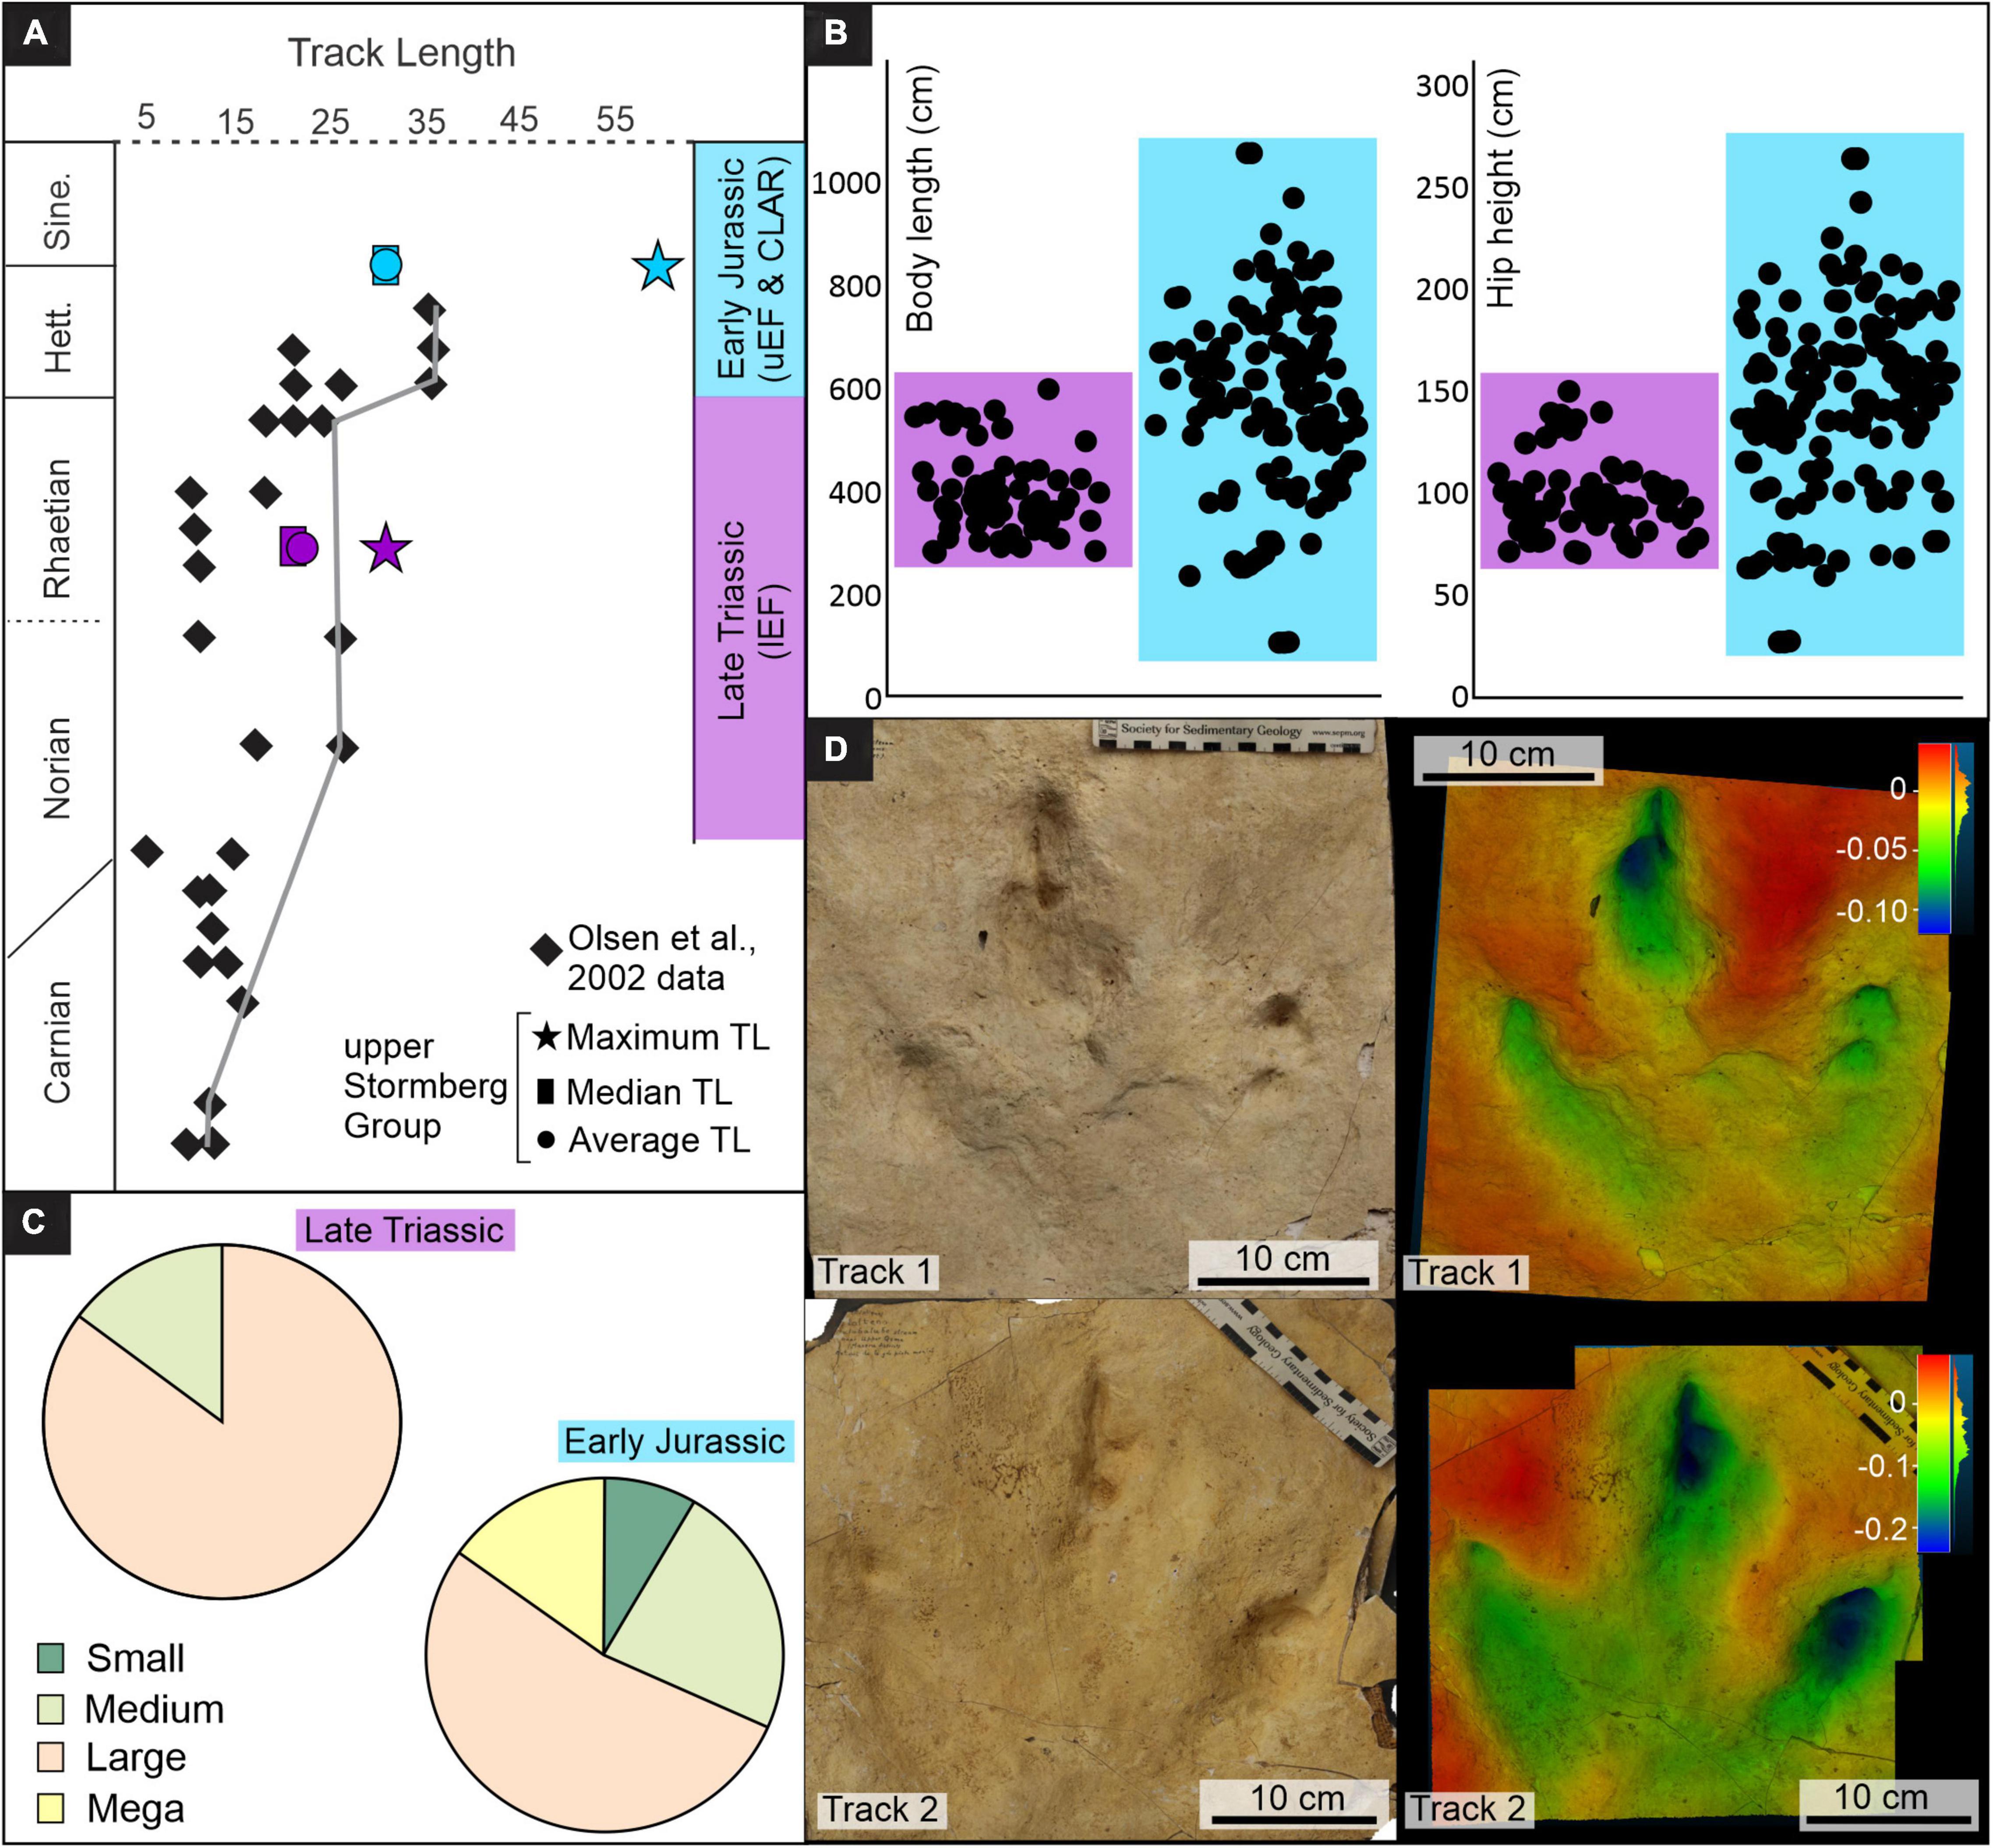
Figure 7. Summary assessment of TLs preserved in the Upper Triassic and Lower Jurassic of southern Africa. (A) Upper Stormberg tridactyl tracks mean and maximum TLs versus those of eastern North America (modified after Olsen et al., 2002), (B) Body length and hip heights (average of morphometric and allometric calculations, Supplementary Table 1), (C) Proportion of preserved track size groupings, (D) Photograph and false color depth map of Late Triassic Eubrontes-like lEF tracks from Lower Qeme, Lesotho (the “Qemetrisauripus princeps” cast materials were made by P. Ellenberger). The tracks have a TL of 27.34 and 30.78 cm, a TL/TW of 1.09 and 1.06, a DP/TS of 0.55 and 0.53, and a DP/TL of 046 and 0.47, respectively. lEF – lower Elliot Formation, uEF – upper Elliot Formation, CLAR – Clarens Formation, TL – track length.
Conclusion
Fossil tracks record a snapshot in time and the resultant morphology can reflect the trackmakers pedal morphology, its behavior and the substrate conditions at the time of track registration. Consequently, fossil tracks are suitable as a proxy to infer trends in paleodiversity, paleoethology and paleopedal morphology, and are especially important in deposits with lacking or rare body fossil remains. We evaluated 216 tridactyl tracks customarily assigned to Kayentapus, Grallator, Anchisauripus, and Eubrontes in southern Africa to assess morphological variations within the K-GAE plexus and in the Upper Triassic–Lower Jurassic host rocks (upper Stormberg Group). Southern African K-GAE tracks show a decrease of digit III projection, evidenced by reduced mesaxony and digit III projection relative to the “backfoot,” which is comparable with observations made elsewhere. However, tracks deviate from global counterparts in that there is no correlation between track elongation with size. This has implications for southern African ichnotaxonomic assignment, particularly Grallator-like tracks, which are typically more elongate than Eubrontes-like tracks. Across the Triassic–Jurassic boundary, the studied tracks increase in mean, median and maximum track lengths, with larger tracks becoming more prevalent in the Lower Jurassic but still present in Upper Triassic. This suggests that theropod body size gradually increased in the southern Africa, with larger theropods becoming more abundant after the Triassic–Jurassic boundary. Interestingly, independent of size, the southern African tridactyl tracks show a reduced emphasis of digit III projection (lower mesaxonies and digit III projection relative to the “backfoot”) from the Upper Triassic to the Lower Jurassic, which may have implications into evolutionary pedal functionality, requiring further investigation. Although the dataset has some limitations (e.g., considers tracks with Mp < 2, uneven stratigraphic distribution of tracks), it is believed that the trends observed herein reflect true trends for the upper Stormberg Group of southwestern Gondwana. Descriptions of additional tracks and cast materials that could not be located during this study will further refine the reliability of the observed trends.
Data Availability Statement
The original contributions presented in the study are included in the article/Supplementary Material, and also on Figshare (https://figshare.com/s/9be7e0be628bc4e71296). Further inquiries can be directed to the corresponding author/s.
Author Contributions
This manuscript was developed from MA Ph.D. dissertation. MA contributed to the conceptualization idea for the research, was responsible for data collection, analysis, interpretation, figures and writing, and submitting, and revising the manuscript. EB conceptualized the idea for research, designed the project, was responsible for the research budget, and as project leader advised MA. EB was also responsible for data collection, figures, and writing and revising the manuscript. FK was a co-supervisor and advised MA, and contributed to the writing and revising of this manuscript. JF contributed toward the analysis and interpretation, and writing and revising the manuscript. All authors contributed to the article and approved the submitted version.
Funding
This research component of this project was supported from the following research grants obtained by EB as principal investigator: DST-NRF Centre of Excellence in Palaeosciences (GENUS) (operational grants since 2015); National Research Foundation (NRF) of South Africa Competitive Programme for Rated Researchers (CPRR) and African Origins Programme (AOP) (93544, 113394, and 98825); FK was supported by the research project CGL2017-89123-P funded by ERDF/Spanish Ministry of Science and Innovation-State Research Agency. He is a member of the reference research group E04_20R FOCONTUR, co-funded by the Government of Aragon and ERDF. During the study MA was a recipient of postgraduate funding from the DST-NRF Centre of Excellence in Paleosciences (GENUS).
Author Disclaimer
Opinions expressed and conclusions reached are those of the authors and are not necessarily to be attributed to the CoE in Paleosciences (GENUS) or NRF or anybody else.
Conflict of Interest
The authors declare that the research was conducted in the absence of any commercial or financial relationships that could be construed as a potential conflict of interest.
Publisher’s Note
All claims expressed in this article are solely those of the authors and do not necessarily represent those of their affiliated organizations, or those of the publisher, the editors and the reviewers. Any product that may be evaluated in this article, or claim that may be made by its manufacturer, is not guaranteed or endorsed by the publisher.
Acknowledgments
We acknowledge curators Suzanne Jiquel at the Université de Montpellier in France as well as Stephen Gill and Keletso Selialia Lesego at the Morija Museum and Archives in Lesotho for access to the Ellenberger Collections under their care. We thank the UCT dino trackers, specifically Lara Sciscio, Mhairi Reid, T’Nielle Haupt, Howard Head, Akhil Rampsersadh, Robert Muir, and Riyaad Mukkadam for their assistance during data collection. We thank Emmanuel Fara, Matteo Belvedere, and József Pálfy for their constructive comments on an earlier version of this manuscript. We also thank our reviewers for their comments on the manuscript.
Supplementary Material
The Supplementary Material for this article can be found online at: https://www.frontiersin.org/articles/10.3389/fevo.2022.925313/full#supplementary-material
References
Abrahams, M. (2020). Evaluation of Tridactyl Theropod Tracks in Southern Africa: Quantitative Morphometric Analysis across the Triassic–Jurassic Boundary. Ph.D. dissertation. Cape Town: University of Cape Town.
Abrahams, M., Bordy, E. M., and Knoll, F. (2020a). Hidden for one hundred years: a diverse theropod ichnoassemblage and cross-sectional tracks from the historic Early Jurassic Tsikoane ichnosite (Clarens Formation, northern Lesotho, southern Africa). Hist. Biol. 33, 2504–2519. doi: 10.1080/08912963.2020.1810681
Abrahams, M., Sciscio, L., Reid, M., and Bordy, E. M. (2020b). Large tridactyl dinosaur tracks from the Early Jurassic of southern Gondwana–uppermost Elliot Formation, Upper Moyeni, Lesotho. Ann. Soc. Geol. Pol. 90, 1–26.
Abrahams, M., Bordy, E. M., Sciscio, L., and Knoll, F. (2017). Scampering, trotting, walking tridactyl bipedal dinosaurs in southern Africa: ichnological account of a Lower Jurassic palaeosurface (upper Elliot Formation, Roma Valley) in Lesotho. Hist. Biol. 29, 958–975. doi: 10.1080/08912963.2016.1267164
Avanzini, M., Piñeula, L., and Garcia-Ramos, J. C. (2012). Late Jurassic footprints reveal walking kinematics of theropod dinosaurs. Lethaia 45, 238–252. doi: 10.1111/j.1502-3931.2011.00276.x
Baron, M. G., Norman, C. B., and Barret, P. M. (2017). A new hypothesis of dinosaur relationships and early dinosaur evolution. Nature 543, 501–513. doi: 10.1038/nature21700
Belvedere, M., Bennet, M. R., Marty, D., Budka, M., Reynolds, S. C., and Bakirov, S. C. (2018). Stat-tracks and mediotypes: powerful tools for modern ichnology based on 3D models. PeerJ 6:e4247. doi: 10.7717/peerj.4247
Belvedere, M., and Farlow, J. O. (2016). “A Numerical scale for quantifying the quality of preservation of vertebrate tracks,” in Dinosaur Tracks: The Next Steps, eds P. L. Falkingham, D. Marty, and A. Richter (Indianapolis, IN: Indiana University Press), 93–98.
Belvedere, M., Mietto, P., and Ishigaki, S. (2010). A Late Jurassic diverse ichnocoenosis from the siliciclastic Iouaridene Formation (Central High Atlas, Morocco). Geol. Q. 54, 367–380.
Benson, R. B. J., Campione, N. E., Carrano, M. T., Mannion, P. G., Sullivan, C., Upchurch, P., et al. (2014). Rates of dinosaur body mass evolution indicate 170 million years of sustained ecological innovation on the avian stem lineage. PLoS Biol. 12:e1001853. doi: 10.1371/journal.pbio.1001896
Bernardi, M., Gianolla, P., Petti, F. M., Mietto, P., and Benton, M. J. (2018). Dinosaur diversification linked with the Carnian Pluvial Episode. Nat. Commun. 9:1499. doi: 10.1038/s41467-018-03996-1
Beukes, N. J. (1970). “Stratigraphy and sedimentology of the Cave Sandstone stage, Karoo System,” in Proceedings of the 2nd IUGS Symposium on Gondwana Stratigraphy and Palaeontology, Pretoria, 321–341.
Bordy, E. M. (2021). Darting towards Storm Shelter: a minute dinosaur trackway from southern Africa. S. Afr. J. Sci. 117:9145. doi: 10.17159/sajs.2021/9145
Bordy, E. M., Abrahams, M., and Sciscio, L. (2017). The Subeng vertebrate tracks: stratigraphy, sedimentology and a digital archive of a historic Upper Triassic palaeosurface (lower Elliot Formation), Leribe, Lesotho (Southern Africa). Boll. Soc. Paleontol. Ital. 56, 181–198.
Bordy, E. M., Abrahams, M., Sharman, G. R., Viglietti, P. A., Benson, R. B. J., McPhee, B. W., et al. (2020). A chronostratigraphic framework for the upper Stormberg Group: implications for the Triassic Jurassic boundary in Southern Africa. Earth Sci. Rev. 203:e103120. doi: 10.1016/j.earscirev.2020.103120
Bordy, E. M., and Eriksson, P. (2015). Lithostratigraphy of the Elliot Formation (Karoo Supergroup), South Africa. S. Afr. J. Geol. 118, 311–316. doi: 10.2113/gssajg.118.3.311
Bordy, E. M., Hancox, P. J., and Rubidge, B. S. (2004a). Fluvial style variations in the Late Triassic–Early Jurassic Elliot formation, main Karoo Basin, South Africa. J. Afr. Earth Sci. 38, 383–400. doi: 10.1016/j.jafrearsci.2004.02.004
Bordy, E. M., Hancox, P. J., and Rubidge, B. S. (2004b). Basin development during the deposition of the Elliot Formation (Late Triassic – Early Jurassic), Karoo Supergroup, South Africa. S. Afr. J. Geol. 107, 397–412. doi: 10.2113/107.3.397
Bordy, E. M., and Head, H. V. (2018). Lithostratigraphy of the Clarens Formation (Stormberg Group, Karoo Supergroup), South Africa. Geol. Soc. S. Afr. 121, 119–130. doi: 10.25131/sajg.121.0009
Bristowe, A., and Raath, M. A. (2004). A juvenile coelophysoid skull from the Early Jurassic of Zimbabwe, and the synonymy of Coelophysis and Syntarsus. Palaeontol. Afr. 40, 31–41.
Brusatte, S. L., Benton, M. J., Ruta, M., and Lloyd, G. T. (2008). The first 50 Myr of dinosaur evolution: macroevolutionary pattern and morphological disparity. Biol. Lett. 4, 711–736. doi: 10.1098/rsbl.2008.0441
Brusatte, S. L., Nesbitt, C. J., Irmis, R. B., Butler, R. J., Benton, M. J., and Norrel, M. A. (2010). The origin and early radiation of dinosaurs. Earth Sci. Rev. 101, 68–100. doi: 10.1016/j.earscirev.2010.04.001
Brusatte, S. L., Niedzwiedzki, G., and Butler, R. J. (2011). Footprints pull origin and diversification of dinosaur stem lineage deep int Early Triassic. Proc. Biol. Sci. 278, 1107–1113. doi: 10.1098/rspb.2010.1746
Carpenter, K. (1997). A giant coelophysoid (Ceratosauria) theropod from the Upper Triassic of New Mexico, USA. Neues Jahrb. Geol. Palaontol. Abh. 205, 189–208. doi: 10.1127/njgpa/205/1997/189
Castanera, D., Colmenar, J., Saque, V., and Canudo, J. I. (2015). Geometric morphometric analysis applied to theropod tracks from the Lower Cretaceous (Berriasian) of Spain. Palaeontology 58, 183–200. doi: 10.1111/pala.12132
Castanera, D., Pascual, C., Canudo, J. I., Hernandez, N., and Barco, J. L. (2012). Ethological variations in gauge in sauropod trackways from the Berriasian of Spain. Lethaia 45, 476–489. doi: 10.1111/j.1502-3931.2012.00304.x
Castanera, D., Piñuela, L., and Garcia-Ramos, J. C. (2016). Grallator theropod tracks from the Late Jurassic of Asturias (Spain): ichnotaxonomic implications. Span. J. Palaeontol. 31, 283–296. doi: 10.7203/sjp.31.2.17156
Cohen, K. M., Finney, S. C., Gibbard, P. L., and Fan, -X. (2013). International chronostratigraphic chart of the international commission on stratigraphy (v2021/10). Episodes 36, 199–204. doi: 10.18814/epiiugs/2013/v36i3/002
Dalman, S. G., and Weems, R. E. (2013). A new look at morphological variation in the ichnogenus Anomoepus, with special reference to material from the Lower Jurassic Newark Supergroup: implications for ichnotaxonomy and ichnodiversity. Bull. Peabody Mus. Nat. Hist. 54, 67–124. doi: 10.3374/014.054.0104
Demathieu, G. R., Gand, G., Sciau, J., and Freytet, P. (2014). Les Traces de pas de Dinosaures et autres Archosaures du lias inferieur des Grands Causses, Sud de la France. Palaeovertebrata 31, 1–143. doi: 10.18563/pv.31.1-4.1-143
D’Orazi Porchetti, S., Bernardi, M., Cinquegranelli, A., dos Santos, V. F., Marty, D., Petti, F. M., et al. (2016). “A review of the dinosaur track record from Jurassic and Cretaceous shallow marine carbonate depositional environments,” in Dinosaur Tracks: The Next Steps, eds P. L. Falkingham, D. Marty, and A. Richet (Indianapolis, IN: Indiana University Press), 380–392.
Dornan, S. S. (1908). Notes on the geology of Basutoland. Geol. Mag. 5, 57–63. doi: 10.1017/S0016756800112877
Ellenberger, F., and Ellenberger, P. (1956). Quelques precisions sur la Serie du Stormberg au Basutoland (Afrique du Sud). C. R. Seances Acad. Sci. 242, 799–801.
Ellenberger, F., and Ellenberger, P. (1958). Principaux types de pistes de Vertébrés dans les couches du Stormberg au Basutoland (Afrique du Sud) (Note préliminaire). C. R. Soc. Geol. France 4, 65–67.
Ellenberger, F., and Ellenberger, P. (1960). Sur une nouvelle dalle à pistes de Vertébrés, découverte au Basutoland (Afrique du Sud). C. R. Soc. Geol. France 9, 236–238.
Ellenberger, F., Ellenberger, P., Fabre, J., and Mendrez, C. (1963). Deux nouvelles dalles à pistes de Vertébrés fossiles découvertes au Basutoland (Afrique du Sud). C. R. Soc. Geol. France 9, 315–317.
Ellenberger, P. (1955). Note preliminaire sur les pistes et les restes osseuex de vertebres du Basutoland (Afrique du Sud). C. R. Seances Acad. Sci. 240, 889–891.
Ellenberger, P. (1970). “Les niveaux paléontologiques de première apparition des mammifères primordiaux en Afrique du Sud et leur ichnologie. Establissement de zones stratigraphique détaillées dans le Stormberg du Lesotho (Afrique du Sud) (Trias superior a Jurassique),” in Proceedings of the 1970 IUGS and Papers of the Second Gondwana Symposium, Oslo, 343–370.
Ellenberger, P. (1972). Contribution à la classification des pistes de vértebrés du trias: les stormberg d’Afrique du Sud (I). Paleovertebrata 5, 1–104.
Ellenberger, P. (1974). Contribution a la Classification des Pistes de Vértebrés du Trias; Les Types du Stormberg d’Afrique du Sud. Montpellier: Laboratoire de paléontologie des vertébrés.
Falkingham, P. L., Bates, K. T., Avanzini, M., Bennett, M., Bordy, E. M., Breithaupt, B. H., et al. (2018). A standard protocol for documenting modern and fossil ichnological data. Palaeontology 61, 469–480. doi: 10.1111/pala.12373
Farlow, J. O., Coroian, D., and Currie, P. J. (2018). Noah’s Ravens: Interpreting the Makers of Tridactyl Dinosaur Footprints. Bloomington, IN: Indiana University Press. doi: 10.2307/j.ctv6mtfgn
Farlow, J. O., Gatesy, S. M., Holtz, T. R. Jr., Hutchinson, J. R., and Robinson, J. M. (2000). Theropod locomotion. Am. Zool. 40, 640–663. doi: 10.1093/icb/40.4.640
Gatesy, S. M., and Falkingham, P. L. (2017). Neither bones nor feet: track morphological variation and ‘preservation quality. J. Vertebr. Paleontol. 37, e1314298. doi: 10.1080/02724634.2017.1314298
Gatesy, S. M., Middleton, K. M., Jenkins, F. A., and Shubin, N. H. (1999). Three-dimensional preservation of foot movements in Triassic theropod dinosaurs. Nature 399, 141–144. doi: 10.1038/20167
Griffin, C. T. (2019). Large neotheropods from the Upper Triassic of North America and the early evolution of large theropod body sizes. J. Paleontol. 93, 1010–1030. doi: 10.1017/jpa.2019.13
Griffin, C. T., and Nesbitt, S. J. (2019). Does the maximum body size of theropods increase across the Triassic–Jurassic boundary? Integrating ontogeny, phylogeny and body size. Anat. Rec. 303, 1158–1169. doi: 10.1002/ar.24130
Hammer, Ø., Harper, D. A. T., and Ryan, P. D. (2001). PAST: paleontological statistics software package for education and data analysis. Palaeontol. Electron. 4, 1–9.
Hunt, A. P., and Lucas, S. G. (2007). Tetrapod ichnofacies: a new paradigm. Ichnos 14, 59–68. doi: 10.1080/10420940601006826
Irmis, R. B. (2011). Evaluating hypotheses for the early diversification of dinosaurs. Earth Environ. Sci. Trans. R. Soc. Edinb. 101, 397–426. doi: 10.1017/S1755691011020068
Kitching, J. W., and Raath, M. A. (1984). Fossils from the Elliot and Clarens formations (Karoo Sequence) of the north–eastern Cape, Orange Free State and Lesotho, and a suggested biozonation based on tetrapods. Palaeontol. Afr. 25, 111–125.
Klein, H., and Lucas, S. G. (2021). The Triassic tetrapod footprint record. N. M. Mus. Nat. Hist. Sci. Bull. 83, 1–194.
Lagnaoui, A., Klein, H., Voigt, S., Hminna, A., Saber, H., Schneider, J. W., et al. (2012). Late Triassic tetrapod-dominated ichnoassemblages from the Argana Basin (Western High Atlas, Morocco). Ichnos. 19, 238–253. doi: 10.1080/10420940.2012.718014
Lallensack, J. N. (2019). Automatic generation of objective footprint outlines. PeerJ 7:e7203. doi: 10.7717/peerj.7203
Lallensack, J. N., Engler, T., and Barthel, H. J. (2019). Shape variability in tridactyl dinosaur footprints: the significant of size and function. Palaeontology 63, 1–26. doi: 10.1111/pala.12449
Lallensack, J. N., van Heteren, A. H., and Wings, O. (2016). Geometric morphometric analysis of intra-trackway variability: a case study on theropod and ornithopod dinosaur trackways from Munchehagen (Lower Cretaceous, Germany). PeerJ 4:e2059. doi: 10.7717/peerj.2059
Läng, E., Boudad, L., Maio, L., Samankoussa, E., Tabouelle, J., Tong, H., et al. (2013). Unbalanced food web in a Late Cretaceous dinosaur assemblage. Palaeogreogr. Palaeoclimatol. Palaeoecol. 381–382, 26–32. doi: 10.1016/j.palaeo.2013.04.011
Langer, M. C., Ezcurra, M. D., Rauhut, O. W. M., Benton, M. J., Knoll, F., McPhee, B. W., et al. (2017). Untangling the dinosaur family tree. Nature 551, E1–E3. doi: 10.1038/nature24011
Li, D. Q., Xing, L. D., Lockley, M. G., Romilio, A., Yang, J. T., and Li, L. F. (2019). The first theropod tracks from the Middle Jurassic of Gansu, Northwest China: new and rare evidence of quadrupedal progression in theropod dinosaurs. J. Palaeogeogr. 8:10. doi: 10.1186/s42501-019-0028-4
Lockley, M. (1991). Tracking dinosaurs: a new look at an ancient world. Cambridge: Cambridge University Press.
Lockley, M. G. (2009). New perspectives on morphological variation in tridactyl footprints: clues to widespread convergence in developmental dynamics. Geol. Q. 53, 415–432.
Lockley, M. G., Gierlinksi, G. D., and Lucas, S. G. (2011). Kayentapus revisited: notes on the type material and the importance of this theropod footprint ichnogenus. Fossil Rec. 53, 330–336.
Lockley, M. G., Kim, J. Y., Kim, K. S., Kim, S. H., Matsukawa, M., Rihui, L., et al. (2008). Minisauripus – the track of a diminutive dinosaur from the Cretaceous of China and South Korea: implications for stratigraphic correlation and theropod foot morphodynamics. Cretac. Res. 29, 115–130. doi: 10.1016/j.cretres.2007.04.003
Lockley, M. G., Li, J., Li, R., Matsukwa, M., Harris, J. D., and Xing, L. (2013). A review of the tetrapod track record in China, with special reference to type ichnospecies: Implications for ichnotaxonomy and Paleobiology. Acta Geol. Sin. 87, 1–20. doi: 10.1111/1755-6724.12026
Lucas, S. G., and Tanner, L. H. (2018). “The missing mass extinction at the Triassic–Jurassic boundary,” in The Late Triassic World, ed. L. H. Tanner (Cham: Springer), 721–785. doi: 10.1007/978-3-319-68009-5_15
Mallison, H., and Wings, O. (2014). Photogrammetry in paleontology – a practical guide. J. Paleontol. Tech. 12, 1–31.
Marchetti, L., Belvedere, M., Voigt, S., Klein, H., Castanera, D., Díaz-Martínez, I., et al. (2019). Defining the morphological quality of fossil footprints. Problems and principles of preservation in tetrapod ichnology with examples from the Paleozoic to the present. Earth Sci. Rev. 193, 109–145. doi: 10.1016/j.earscirev.2019.04.008
Marsicano, C. A., Domnanovich, N. S., and Mancuso, A. C. (2007). Dinosaur origins: evidence from the footprint record. Hist. Biol. 19, 83–91. doi: 10.1080/08912960600866920
Matthews, N., Noble, T., and Breithaupt, B. H. (2016). “Close-range photogrammetry for 3-D ichnology: the basics of photogrammetric ichnology,” in Dinosaur Tracks: The Next Steps, eds P. L. Falkingham, D. Marty, and A. Richter (Indianapolis, IN: Indiana University Press), 29–55.
McPhee, B. W., Benson, R. N., Both-Brink, J., Bordy, E. M., and Choiniere, J. N. (2018). A giant dinosaur from the earliest Jurassic of South Africa and the transition to quadrupedality in early sauropodomorphs. Curr. Biol. 28, 3143–3151. doi: 10.1016/j.cub.2018.07.063
Mílan, J., and Bromley, R. G. (2006). True tracks, undertracks and eroded tracks, experimental work with tetrapod tracks in laboratory and field. Palaeogeogr. Palaeoclimatol. Palaeoecol. 231, 231–264. doi: 10.1016/j.palaeo.2004.12.022
Moratalla, J. J., Sanz, J. L., and Jimenez, S. (1988). Multivariate analysis on Lower Cretaceous dinosaur footprints: discrimination between ornithopods and theropods. Geobios 21, 395–408. doi: 10.1016/S0016-6995(88)80042-1
Moreno, K., de Valais, S., Blanco, N., Tomlinson, A. J., Jacay, J., and Calvo, J. O. (2012). Large theropod dinosaur footprint associations in western Gondwana: behavioural and palaeogeographic implications. Acta Palaeontol. Pol. 57, 73–83. doi: 10.4202/app.2010.0119
Munyikwa, D., and Raath, M. A. (1999). Further material of the ceratosaurian dinosaur Syntarsus from the Elliot Formation (Early Jurassic) of South Africa. Palaeontol. Afr. 35, 55–59.
Olsen, P. E. (1980). “Fossil great lakes of the Newark Supergroup in New Jersey,” in Field studies in New Jersey Geology and Guide to Field Trips, ed. W. Manspeizer (Newark: Newark College of Arts and Sciences), 352–398.
Olsen, P. E. (1995). “Paleontology and paleoenvironments of Early Jurassic age strata in the Walter Kidde Dinosaur Park (New Jersey, USA),” in Field Guide and Proceedings of the Twelfth Annual Meeting of the Geological Association of New Jersey, ed. J. E. B. Baker (Lawrenceville), 156–190.
Olsen, P. E. (2010). “Fossil Great Lakes of the Newark Supergroup – 30 years later,” in Field Trip Guidebook, ed. W. Manspeizer (New York, NY: New York State Geological Association), 101–162.
Olsen, P. E., and Galton, P. M. (1984). A review of the reptile and amphibian assemblages from the Stormberg of southern Africa, with special emphasis on the footprints and age of the Stormberg. Palaeontol. Afr. 25, 87–110.
Olsen, P. E., Kent, D. V., Sues, H. D., Koeberl, C., Huber, H., Montanari, A., et al. (2002). Ascent of dinosaurs linked to an Iridium anomaly at the Triassic – Jurassic Boundary. Science 296, 1305–1307. doi: 10.1126/science.1065522
Olsen, P. E., Kent, D. V., and Whiteside, J. H. (2010). Implications of the Newark Supergroup-based astrochronology and geomagnetic polarity time scale (Newark-APTS) for the tempo and mode of the early diversification of Dinosauria. Earth Environ. Sci. Trans. R. Soc. Edinb. 101, 201–229. doi: 10.1017/S1755691011020032
Olsen, P. E., Smith, J. B., and McDonald, N. G. (1998). Type material of the type species of the classic theropod footprint genera Eubrontes, Anchisauripus, and Grallator (Early Jurassic, Hartford and Deerfield basins, Connecticut and Massachusetts, USA). J. Vertebr. Paleontol. 18, 586–601. doi: 10.1080/02724634.1998.10011086
Padian, K. (2012). The problem of dinosaur origins: integrating three approaches to the rise of Dinosauria. Earth Environ. Sci. Trans. R. Soc. Edinb. 103, 423–442. doi: 10.1017/S1755691013000431
Pérez-Lorente, F. G. (2015). Dinosaur Footprints and Trackways of La Rioja. Bloomington, IN: Indiana University Press.
Petti, F. M., Avanzini, M., Belvedere, M., De Gasperi, M., Ferretti, P., Girardi, S., et al. (2008). Digital 3D modelling of dinosaur footprints by photogrammetry and laser scanning techniques: integrated approach at the Coste dell’Anglone tracksite (Lower Jurassic, Southern Alps, Northern Italy). Studi Trent. Sci. Nat. Acta Geol. 83, 303–315.
Raath, M. A., and Yates, A. M. (2005). Preliminary report of a large theropod large theropod dinosaur trackway in Clarens Formation sandstone (Early Jurassic) in the Paul Roux, district, northeastern Free State, South Africa. Palaeontol. Afr. 41, 101–104.
Rampersadh, A., and Bordy, E. M. (2019). Early Jurassic dinosaur ecosystems in southwestern Gondwana: steps towards refining its palaecology. Hallesches Jahrbuch Geo 46:49.
Rampersadh, A., Bordy, E. M., Sciscio, L., and Abrahams, M. (2018). Dinosaur behaviour in an early ecosystem – uppermost Elliot formation, Ha Nohana, Lesotho. Soc. Geol. Pol. 88, 163–179. doi: 10.14241/asgp.2018.010
Ray, S., and Chinsamy, A. (2002). A theropod tooth from the Late Triassic of southern Africa. J. Biosci. 27, 295–298. doi: 10.1007/BF02704918
Razzolini, N. L., Belvedere, M., Marty, D., Paratte, G., Lovis, C., Cattin, M., et al. (2017). Megalosauripus transjurancisus ichnosp. Nov. A new Late Jurassic theropod from NW Switzerland and implications for tridactyl dinosaur ichnology and ichnotaxonomy. PLoS One 12:e0180289. doi: 10.1371/journal.pone.0180289
Razzolini, N. L., Vila, B., Castenera, D., Flakingham, P. L., Barco, J. L., Canud, J. I., et al. (2014). Intra-trackway morphological variations due to substrate consistency: the El Frontal Dinosaur Tracksite (Lower Cretaceous, Spain). PLoS One 9:e93708. doi: 10.1371/journal.pone.0093708
Romilio, A., and Salisbury, S. W. (2011). A reassessment of large theropod dinosaur tracks from the mid-Cretaceous (late Albian – Cenomanian) Winton Formation of Lark Quarry, central-western Queensland, Australia: a case for mistaken identity. Cretac. Res. 32, 135–142. doi: 10.1016/j.cretres.2010.11.003
Rowe, T., and Gauthier, J. (1990). “Ceratosauria,” in The Dinosauria, eds D. B. Weishampel, P. Dodson, and H. Osmolska (Berkley, CA: University of California Press), 151–168.
Rubidge, B. S., Day, M. O., Barbolini, N., Hancox, P. J., Choiniere, J. N., Bamford, M. K., et al. (2016). “Advances in nonmarine Karoo biostratigraphy: significance for understanding basin development,” in Origin and Evolution of the Cape Mountains and Karoo Basin, eds B. Linol and M. J. de Wit (Cham: Springer), 141–149. doi: 10.1007/978-3-319-40859-0_14
Schneider, C. A., Rasband, W. S., and Eliceiri, K. W. (2012). NIH Image to ImageJ: 25 years of image analysis. Nat. Methods 9, 671–675. doi: 10.1038/nmeth.2089
Sciscio, L., Bordy, E. M., Abrahams, M., Knoll, F., and McPhee, B. W. (2017). The first megatheropod tracks from the Lower Jurassic upper Elliot Formation, Karoo Basin, Lesotho. PLoS One 12:e0185941. doi: 10.1371/journal.pone.0185941
Sciscio, L., Bordy, E. M., Reid, M., and Abrahams, M. (2016). Sedimentology and ichnology of the Mafube dinosaur track site (Lower Jurassic, eastern Free State, South Africa): a report on footprint preservation and palaeoenvironment. PeerJ 4:e2285. doi: 10.7717/peerj.2285
Smith, R. M., and Kitching, J. (1997). Sedimentology and vertebrate taphonomy of the Tritylodon acmezone: a reworked palaeosol in the Lower Jurassic Elliot Formation, Karoo Supergroup, South Africa. Palaeogeogr. Palaeoclimatol. Palaeoecol. 131, 29–50. doi: 10.1016/S0031-0182(96)00143-5
Smith, R. M. H., Marsicano, C. A., and Wilson, J. A. (2009). Sedimentology and paleoecology of a diverse Early Jurassic tetrapod tracksite in Lesotho, Southern Africa. Palaios 24, 672–684. doi: 10.2110/palo.2008.p08-115r
Viglietti, P. A., McPhee, B. W., Bordy, E. M., Sciscio, L., Barrett, P. M., Benson, R. B. J., et al. (2020a). Biostratigraphy of the Massospondylus Assemblage Zone (Stormberg Group, Karoo Supergroup), South Africa. S. Afr. J. Geol. 123, 249–262. doi: 10.25131/sajg.123.0018
Viglietti, P. A., McPhee, B. W., Bordy, E. M., Sciscio, L., Barrett, P. M., Benson, R. B. J., et al. (2020b). Biostratigraphy of the Scalenodontoides Assemblage Zone (Stormberg Group, Karoo Supergroup), South Africa. S. Afr. J. Geol. 123, 239–248. doi: 10.25131/sajg.123.0017
Weems, R. E. (1992). “A re-evaluation of the taxonomy of Newark Supergroup saurischian dinosaur tracks, using extensive statistical data from a recently exposed tracksite near Culpeper, Virginia,” in Proceedings of the 26th Forum on the Geology of Industrial Minerals, ed. P. C. Sweet (Charlottesville, VA: Division of mineral resources publication), 113–127.
Weems, R. E. (2019). Evidence for bipedal prosauropods as the likely Eubrontes trackmakers. Ichnos 26, 187–215. doi: 10.1080/10420940.2018.1532902
Welles, S. P. (1984). Dilophosaurus wetherilli (Dinosauria, Theropoda) osteology and comparisons. Palaeontogr. Abt. A 185, 85–180.
Wilson, J. A., Marsicano, C. A., and Smith, R. M. H. (2009). Dynamic locomotor capabilities revealed by early dinosaur trackmakers from southern Africa. PLoS One 4:e7331. doi: 10.1371/journal.pone.0007331
Wings, O., Lallensack, J. N., and Mallison, H. (2016). “The Early Cretaceous dinosaur trackways in Münchehagen (Lower Saxony, Germany): 3-D Photogrammetry as basis for geometric morphometric analysis of shape variation and evaluation of material loss during excavation,” in Dinosaur tracks: the next steps, eds P. L. Falkingham, D. Marty, and A. Richter (Indianapolis, IN: Indiana university press), 56–71.
Xing, L., Dai, H., Wei, G., Lockley, M. G., Klein, H., Persons, W. S., et al. (2020). The Early Jurassic Kayentapus dominated tracks from Chongqing, China. Hist. Biol. 33, 2067–2073. doi: 10.1080/08912963.2020.1769093
Keywords: southwestern Gondwana, Karoo Basin, Kayentapus-Grallator-Anchisauripus-Eubrontes plexus, evolution of theropod tracks, Triassic–Jurassic boundary
Citation: Abrahams M, Bordy EM, Knoll F and Farlow JO (2022) Theropod Tridactyl Tracks Across the Triassic–Jurassic Boundary in Southern Africa: Implications for Pedal Morphology Evolution. Front. Ecol. Evol. 10:925313. doi: 10.3389/fevo.2022.925313
Received: 21 April 2022; Accepted: 18 May 2022;
Published: 30 June 2022.
Edited by:
Leonardo Santos Avilla, Rio de Janeiro State Federal University, BrazilReviewed by:
Rodrigo Temp Müller, Federal University of Santa Maria, BrazilRafael Costa Da Silva, Serviço Geológico do Brazil, Brazil
Copyright © 2022 Abrahams, Bordy, Knoll and Farlow. This is an open-access article distributed under the terms of the Creative Commons Attribution License (CC BY). The use, distribution or reproduction in other forums is permitted, provided the original author(s) and the copyright owner(s) are credited and that the original publication in this journal is cited, in accordance with accepted academic practice. No use, distribution or reproduction is permitted which does not comply with these terms.
*Correspondence: Miengah Abrahams, miengah.abrahams@uct.ac.za