Museomics and the holotype of a critically endangered cricetid rodent provide key evidence of an undescribed genus
 Susette Castañeda-Rico
 Cody W. Edwards
 Melissa T. R. Hawkins
 Jesús E. Maldonado
- 1Smithsonian-Mason School of Conservation, Front Royal, VA, United States
- 2Center for Conservation Genomics, Smithsonian National Zoo and Conservation Biology Institute, Washington, DC, United States
- 3Department of Biology, George Mason University, Fairfax, VA, United States
- 4Division of Mammals, Department of Vertebrate Zoology, National Museum of Natural History, Washington, DC, United States
Historical DNA obtained from voucher specimens housed in natural history museums worldwide have allowed the study of elusive, rare or even extinct species that in many cases are solely represented by museum holdings. This has resulted in the increase of taxonomic representation of many taxa, has led to the discovery of new species, and has yielded stunning novel insights into the evolutionary history of cryptic or even undescribed species. Peromyscus mekisturus, is a critically endangered cricetid rodent endemic to Mexico and is only known from two museum specimens collected in 1898 and 1947. Intensive field work efforts to attempt to determine if viable populations still exist have failed, suggesting that this species is extinct or is nearing extinction. In addition, a recent study using mitogenomes demonstrated that P. mekisturus forms a well-supported clade outside the genus Peromyscus and hypothesized that this taxon is the sister group of the genus Reithrodontomys. Here, we used target enrichment and high-throughput sequencing of several thousand nuclear ultraconserved elements and mitogenomes to reconstruct dated phylogenies to test the previous phylogenetic hypothesis. We analyzed the holotype and the only other known specimen of P. mekisturus and museum samples from other peromyscine rodents to test the phylogenetic position of the species. Our results confirm that the only two specimens known to science of P. mekisturus belong to the same species and support the hypothesis that this species belongs to an undescribed genus of cricetid rodents that is sister to the genus Reithrodontomys. We dated the origin of P. mekisturus together with other speciation events in peromyscines during the late Pliocene – early Pleistocene and related these events with the Pleistocene climatic cycles. In light of our results, we recommend a taxonomic re-evaluation of this enigmatic species to properly recognize its taxonomic status as a new genus. We also acknowledge the relevance of generating genomic data from type specimens and highlight the need and importance of continuing to build the scientific heritage of the collections to study and better understand past, present, and future biodiversity.
Introduction
Museomics is a booming field that leverages the potential of natural history museums as a source of DNA (ancient DNA – aDNA – naturally preserved, heavily degraded trace amounts with both low quality and quantity yields, and usually between thousands to a million years old; historical DNA – hDNA – fortuitously preserved in voucher specimens almost always collected during the last 200 years, highly degraded with both low quality and quantity yields; and modern DNA – mDNA – tissues stored frozen or in preservatives, usually of high DNA quality and quantity, but in some cases, they can be affected by the mode of preservation regardless of time) coupled with genomic methods and techniques (Schmitt et al., 2018; Raxworthy and Smith, 2021). It has transformed the field of collection-based research, extending research possibilities for paleontological and natural history specimens (Buerki and Baker, 2016; Rubi et al., 2020). Museomics-based research has yielded new insights into the evolutionary history of organisms and has greatly impacted our knowledge regarding the tree of life, filling gaps in the majority of its branches and revealing unknown or controversial phylogenetic positions (Buerki and Baker, 2016; Kehlmaier et al., 2019; Cong et al., 2021).
This innovative tool has been applied to discover and delimit species (Abreu-Jr et al., 2020; Lyra et al., 2020; McDonough et al., 2022), to sample extinct species (Roycroft et al., 2021) and extirped populations (Shepherd and Lambert, 2008), to clarified taxonomic classifications with type specimens (Prosser et al., 2016; Kehlmaier et al., 2019). It has also been used in population genetic studies (Yuan et al., 2022), to document changes in genetic diversity through time (Schmitt et al., 2018; Bi et al., 2019) and the species’ response to environmental change and genetic erosion (Bi et al., 2013; Dussex et al., 2019). Museomics has even been used to track the origins and spread of infectious diseases (Schmitt et al., 2018; Karwacki et al., 2021), and to investigate epigenetic effects (Rubi et al., 2020).
In the current biodiversity crisis, the discovery and documentation of biodiversity on earth should be a priority (Campana et al., 2021). It is of great concern that many species could be lost before they or their ecological roles have been described, without even being aware of what is being lost (Kehlmaier et al., 2019). Although accurate species identification should be the backbone of biodiversity research it is not sufficient to just identify and count these species, but we also need to better understand their evolutionary and environmental history. In this sense, the use of type specimens, within a taxonomic and phylogenetic framework, is essential to ensure the accurate identification of specimens (Buerki and Baker, 2016; Kehlmaier et al., 2019). Type specimens (or simply referred to as types) are the exemplar specimens that are representative of the species description, and as such, determine the correct application of nomenclature and represent the link between a name and a taxonomic unit (Buerki and Baker, 2016; Cong et al., 2021). Within types, a holotype is a single specimen designated, in the original publication, as the name-bearing exemplar of a species (International Commission on Zoological Nomenclature1). Despite their great contribution to science, the representation of holotypes in genetic studies is scarce. This is due to the impact that “destructive sampling” can have on these invaluable and irreplaceable specimens because it will likely involve damaging or destroying a portion of the specimen to obtain the genomic data. These specimens are, in general, very old – between 10 and 200 years old, and therefore they are understandably highly protected and valued by the curators and collection managers of their museum collections. Since specimens represent finite resources, most museums have strict policies governing destructive sampling, limiting the availability of samples (Holmes et al., 2016). However, recent phylogenetic studies have successfully demonstrated the importance of including type specimens, and as such museum curators are carefully evaluating the proper use and sampling of these unique specimens (e.g., Prosser et al., 2016; McGuire et al., 2018; Kehlmaier et al., 2019; Cong et al., 2021; Reyes-Velasco et al., 2021; Roos et al., 2021; Roycroft et al., 2021).
The Puebla deer mouse, Peromyscus mekisturus, is a critically endangered cricetid rodent endemic to Mexico and is only known from two museum specimens. The holotype (Smithsonian Institution’s National Museum of Natural History – USNM64108) collected by Merriam (1898) in Chalchicomula (= Ciudad Serdán) and a second individual captured by Hooper (1947) in Tehuacán, both in the state of Puebla (University of Michigan Museum of Zoology – UMMZ88967). Unfortunately, multiple expeditions after 1947 targeting this species have failed to find more specimens. This suggests that the Puebla deer mouse may have already become extinct or is close to extinction.
Peromyscus mekisturus, based on morphology (Osgood, 1909; Carleton, 1989; Musser and Carleton, 1993, 2005) and on a few mitochondrial genes (Castañeda-Rico et al., 2014), had been traditionally placed within the Peromyscus melanophrys group, together with P. melanophrys and P. perfulvus. However, Castañeda-Rico et al. (2020) using mitogenomes and ultraconserved elements (UCE) obtained from the P. mekisturus specimen collected in 1947 [University of Michigan Museum of Zoology – UMMZ88967– the same specimen analyzed by Castañeda-Rico et al. (2014)], found that this species was not part of the Peromyscus melanophrys group, as previously suggested. In addition, with a denser sampling of mitogenomes including more cricetid species, they also uncovered that P. mekisturus was more closely related to the genera Reithrodontomys and Isthmomys than to any other member of the genus Peromyscus. However, they suggested that the latest results needed to be confirmed with a denser taxon sampling of the nuclear genome. Castañeda-Rico et al. (2020) also found that the mitochondrial sequence obtained by Castañeda-Rico et al. (2014) was incorrect due to (i) cross contamination with other Peromyscus samples processed in the same lab during extraction and/or PCR steps, (ii) a chimera sequence product of jumping PCR, and/or (iii) contamination from the environment caused by not performing the extractions in a dedicated facility for ancient DNA analysis.
In this study, we show how museomics has revolutionized phylogenetic studies, improving our understanding of the biodiversity of our planet. Importantly, we demonstrate that holotype specimen data is crucial for confirming the accurate identification of poorly studied species, especially, when it concerns rare, extinct or under-collected species such as P. mekisturus. Here, we improved on the previous study by Castañeda-Rico et al. (2020) by obtaining genome-wide data, specifically mitogenomes and thousands of UCE loci from a larger number of representative species of the genus Peromyscus and some of their outgroups obtained from specimens in museum collections. We tested the phylogenetic hypothesis that P. mekisturus is more closely related to the genera Reithrodontomys and Isthmomys than it is to members of the genus Peromyscus. We analyzed the holotype of P. mekisturus and compared it to the previously sequenced museum specimen from Tehuacán, Puebla, in order to confirm its correct identification and the phylogenetic position of the species. Finally, we conducted molecular dating to estimate the timing of the divergence events of P. mekisturus. Our results conclusively support the genetic uniqueness of P. mekisturus and have important implications for taxonomy and the impact of biodiversity loss.
Materials and methods
Sample collection and laboratory methods
We obtained 12 samples (ca. 2 mm2 of frozen tissue –internal organ– or dry skin) from specimens deposited at the Smithsonian Institution’s National Museum of Natural History and the Museum of Texas Tech University (Supplementary Table S1). Sampling comprised of one sample per each species (Peromyscus attwateri, P. aztecus, P. megalops, P. polionotus, P. crinitus, Neotomodon alstoni, Podomys floridanus, Onychomys leucogaster, Reithrodontomys mexicanus, Isthmomys pirrensis, and Neotoma mexicana), including the holotype specimen of P. mekisturus (collected in 1898) see Supplementary Figure S1. We selected these species so that we could incorporate all of the species used in mitochondrial phylogeny obtained by Castañeda-Rico et al. (2020) and test their hypothesis using nuclear genome-wide data. We followed strict protocols to avoid cross-contamination during sampling, as described in McDonough et al. (2018) and Castañeda-Rico et al. (2020).
We performed all laboratory work at the Center for Conservation Genomics (CCG), Smithsonian National Zoo and Conservation Biology Institute, Washington, DC. DNA was extracted from frozen-preserved internal organs (i.e., liver or muscle, hereafter modern samples), in the modern lab at the CCG, using a DNeasy Blood and Tissue Kit (Qiagen Inc., Valencia, CA, USA) following the manufacturer’s protocol. We conducted all pre-PCR steps for the historical samples in a laboratory specifically dedicated to processing of historical and ancient DNA at the CCG. We extracted DNA from historical samples (i.e., dry skin), using the silica column extraction protocol (McDonough et al., 2018). We quantified DNA samples with a Qubit 4 fluorometer (Thermo Fisher, Waltham, MA, USA) using a 1x dsDNA HS assay and visualized DNA with a TapeStation 4200 System (Agilent Technologies, Santa Clara, CA, USA) using High Sensitivity D1000 reagents. We sheared modern DNA to an average length of 250 base pairs (bp) using a Bioruptor® Pico sonicator (Diagenode Inc., Denville, NJ, USA) with a pulse of 30 s on/30 s off for 90 cycles. We did not shear DNA from historical samples due to its inherent degradation and fragmentation.
We prepared dual-indexed libraries using the Kapa HyperPrep kit (Roche Sequencing) with 1/2 reactions, following the manufacturer’s protocol. To library prep the holotype specimen, we used the SRSLY PicoPlus NGS library prep kit (Claret Bioscience, LLC), according to the manufacturer’s protocol. We performed dual indexing PCR with TruSeq-style indices (Meyer and Kircher, 2010) using Kapa HiFi HotStart Uracil + (Roche Sequencing) for historical samples and Kapa HiFi HotStart Ready Mix (Roche Sequencing) for modern samples, following the manufacturer’s protocol. Libraries were amplified with 8–13 cycles of PCR. We cleaned the indexed libraries using 1.6x solid-phased reversible immobilization (SPRI) magnetic beads (Rohland and Reich, 2012), quantified concentration using a Qubit 4 fluorometer, and inspected size-ranges and quality with a TapeStation 4200 System (conditions as mentioned above). Each capture reaction contained pooled libraries, which consisted of equimolar pools of two individuals for historical samples and three individuals for modern samples. The holotype specimen was not pooled with any other sample and captured alone. We performed target enrichment using the myBaits® UCE Tetrapods 5Kv1 kit (Faircloth et al., 2012) produced by Daicel Arbor Biosciences following the myBaits protocol v3, and the myBaits® Mito kit (Daicel Arbor Biosciences) for the house mouse Mus musculus panel, following the myBaits protocol v4 to capture ultraconserved elements (UCE) and mitogenomes, respectively. We amplified post-enrichment UCE and mitogenomes libraries with 14–18 cycles of PCR using Kapa HiFi HotStart Ready Mix (Roche Sequencing), following the manufacturer’s protocol. A 1.6x SPRI magnetic bead clean-up was performed subsequently. We quantified and visualized the enriched libraries pool using a Qubit 4 fluorometer and a TapeStation 4200 System, respectively (conditions as mentioned above). Finally, we pooled captured libraries equimolarly and sequenced on a NovaSeq 6000 SP PE 2 × 150 bp (Illumina, Inc., San Diego, CA, USA) at the Oklahoma Medical Research Foundation, Oklahoma City (combined with samples from unrelated projects). We used two lanes of NovaSeq, one for historical samples and another for modern samples, to avoid biased sequencing.
We also reanalyzed UCE and mitogenomes published by Castañeda-Rico et al. (2020), and mitogenomes from Bi (2017) and Sullivan et al. (2017). We should note that we detected a misidentification labeling error in a museum specimen that was previously designated as P. eremicus in Castañeda-Rico et al. (2020) (GenBank accession number MT078819). It has now been correctly identified as P. pectoralis based on a BLAST analysis of the cytochrome b gene in GenBank2, and corroborated with the voucher specimen deposited at the Museo de Zoología, Facultad de Ciencias, Universidad Nacional Autónoma de México. A list of all samples used in this study is found in Supplementary Table S1.
Data processing and phylogenetic analyses of ultraconserved elements
We processed raw data, provided by the sequencing core, following the PHYLUCE v1.6.7 pipeline (Faircloth, 20163). We used Illumiprocessor 2.10 (Faircloth, 2013) and Trim Galore 0.6.54 to trim adapters, barcode regions and low-quality bases. The PHYLUCE script phyluce_assembly_get_fastq_lengths.py was used to check average fragment size after trimming. Reads were assembled into contigs using Trinity 2.8.5 (Grabherr et al., 2011), and identified contigs matching UCE loci in the 5K UCE locus set5. We generated two “taxon sets”: (1) containing all of our samples to query the database obtained during UCE contig identification and created a list of UCE loci by sample, and (2) without the holotype specimen to test if including a sample which recovered fewer loci and higher amounts of missing data could affect phylogenetic relationships. We produced a monolithic FASTA file to extract sequences from each sample. We aligned FASTA sequences using MAFFT 7.4 (Katoh and Standley, 2013; Nakamura et al., 2018) and performed edge trimming. We also tested the internal trimming using Gblocks 0.91b (Castresana, 2000; Talavera and Castresana, 2007), but we found that this approach increased branch lengths on samples with a high percentage of missing data. However, the phylogenetic relationships remained the same with both trimming methods (data not shown for the internal trimming). We filtered the resulting alignments to test them for various degrees of missing data (matrix completeness): 65% matrix for which 65% of the taxa were present for each UCE locus, 75% matrix (25% of taxa missing), 85% matrix (15% of taxa missing), and 95% matrix (5% of taxa missing), where the number of missing taxa is directly proportional to the number of UCE loci and missing data on the final matrices. We quantified informative sites with the PHYLUCE script phyluce_align_get_informative_sites.py. All of these analyses were performed on the Smithsonian Institution High Performance Computing Cluster (Smithsonian Institution6). The final UCE dataset included data generated in this study and in Castañeda-Rico et al. (2020).
We performed two independent phylogenetic analyses using: (1) a concatenated dataset including all of our samples (N = 18), and (2) a concatenated dataset without the holotype specimen of P. mekisturus (N = 17) due to high amounts of missing data. We tested the aforementioned levels of matrix completeness (65, 75, 85, and 95%) for both datasets.
First, we conducted a Maximum Likelihood (ML) analysis, for both datasets and all levels of matrix completeness, using RAxML 8.12 (Stamatakis, 2014) with a GTRGAMMA site rate substitution model and 20 ML searches for the phylogenetic tree that best fit each set of data. We generated non-parametric bootstrap replicates using the -N autoMRE option which runs until convergence is reached. We reconciled the best fitting ML tree with the bootstrap replicate to obtain the final phylogenetic tree with support values using the -f b command.
We performed a Bayesian Inference (BI) analysis, with all levels of matrix completeness and both datasets, using MrBayes 3.2.6 (Huelsenbeck and Ronquist, 2001; Ronquist and Huelsenbeck, 2003). First, we estimated the best evolutionary model of nucleotide substitution in jModelTest 2.1.1 (Guindon and Gascuel, 2003; Darriba et al., 2012) using the Akaike Information Criterion (AIC). The GTR + G model was selected as the best fitting model for both datasets (N = 18 and N = 17) with the following parameters: base frequencies A = 0.3041, C = 0.1960, G = 0.2039, T = 0.2960; nst = 6; and gamma shape = 0.1220; and base frequencies A = 0.2995, C = 0.2006, G = 0.2012, T = 0.2988; nst = 6; and gamma shape = 0.1270, respectively. The BI analyses were run using two independent runs with 50 million generations for the 95% matrix and 20 million generations for the 65, 75, and 85% matrices due to the high number of loci, sampling trees and parameters every 1,000 generations with four Markov-chains Monte Carlo (MCMC), three heated and one cold. Heating temperature was set at 0.2 to facilitate greater movement between the four MCMC chains. We visualized output parameters using Tracer v1.7.1 (Rambaut et al., 2018) to check for convergence between runs and we discarded the first 25% of the trees as burn-in.
Maximum Likelihood and Bayesian Inference analyses were performed without partitions (as mentioned above) and with partitions only on the 95% matrix of both datasets to test if there was any difference due to partitioning and to account for heterogeneity in rates and patterns of molecular evolution within each UCE loci. First, the Sliding-Window Site Characteristics (SWSC) partitioning method based on sites entropies (Tagliacollo and Lanfear, 2018) was used to generate partitions that account for within-UCE heterogeneity. We followed the code implemented by Tagliacollo and Lanfear (2018) in the SWSC-EN method7. Then, we used PartitionFinder 2.1.1 (Lanfear et al., 2016) to optimize the partition scheme, by joining together similar subsets, obtained with the SWSC-EN method. After the final partition scheme was obtained, we performed the ML and BI analyses as mentioned above.
Finally, we used the dataset without the holotype of P. mekisturus –high number of missing data– (N = 17) with all levels of matrix completeness, to conduct a species tree analysis under the multispecies coalescent (MSC) model with ASTRAL-III v.5.7.8 (Zhang et al., 2018). We used the uce2speciestree pipeline script (Campana, 20198) to generate input files for ASTRAL. This script uses RAxML to infer individual gene trees under the GTRGAMMA substitution model, and 100 bootstrap replicates. The local posterior probability – LPP – (Sayyari and Mirarab, 2016) was used as branching support, where an LPP ≥ 0.95 is considered as strong support (Erixon et al., 2003).
Data processing and phylogenetic analyses of mitogenomes
We analyzed read quality of the FASTQ format files using FastQC v0.11.5 (Andrews, 20109). We removed adapter sequences and low-quality reads using the default parameters (Phred:20, mean min-len:20) in Trim Galore 0.6.5 (see text footnote 4). We removed exact duplicates (-derep1,4) using Prinseq-lite v0.20.4 (Schmieder and Edwards, 2011). We mapped the resulting high quality reads to a reference genome according to a species-specific reference (see GenBank accession numbers for each reference genome in Supplementary Table S1), using the Geneious algorithm in Geneious Prime® 2021.2.210 with default parameters (Medium-Low sensitivity, Maximum mismatches = 20%, Maximum gaps = 10%). We generated consensus sequences with Geneious Prime® 2021.2.2 (see footnote 11), using 5X as the lowest coverage to call a base, a Highest Quality control, and the remaining default parameters, and aligned them using MAFFT 7.45 plug-in (Katoh and Standley, 2013). We transferred annotations from each species-specific reference (Supplementary Table S1) to rule out the presence of nuclear copies of mitochondrial genes (NUMTs), and translated all protein-coding genes to check for frame shifts or stop codons.
We aligned sequences with MAFFT 7.45 plug-in (Katoh and Standley, 2013) in Geneious Prime® 2021.2.2 (see footnote 11). We used samples generated in this study and data previously published by Bi (2017), Sullivan et al. (2017), and Castañeda-Rico et al. (2020) (Supplementary Table S1). For most of the species with a mitogenome previously published we generated a new mitogenome sequence from a different sample but same species (except for Peromyscus melanophrys, P. perfulvus, P. mexicanus, and Habromys ixtlani). We used the mitogenome alignment to infer the phylogenetic relationships of P. mekisturus in relation to other neotomine rodents. We performed a ML analysis using the concatenated dataset (without partitions) in RAxML 8.12 (Stamatakis, 2014) with a GTRGAMMA site rate substitution model. Clade support was assessed by bootstrapping with the -N autoMRE option for a bootstrap convergence criterion. We used the -f b option to reconcile the best fitting ML tree with the bootstrap replicate to obtain the final phylogenetic tree (as mentioned above).
We conducted a BI analysis, on a partitioned dataset, using MrBayes 3.2.6 (Huelsenbeck and Ronquist, 2001; Ronquist and Huelsenbeck, 2003). The best model and partition scheme were estimated using PartitionFinder 2.1.1 (Lanfear et al., 2016). Our search was limited to the models available in MrBayes, with linked, corrected Akaike Information Criterion (AICc) and greedy parameters. The data block was defined by codon position, tRNA, rRNA and D-loop selection, and the result was incorporated in the phylogenetic reconstruction. We used two independent runs with 50 million generations, sampling trees and parameters every 1,000 generations with four MCMC, and a heating temperature set at 0.2, as mentioned above, to perform the BI analysis. We checked convergence between runs using Tracer v1.7.1 (Rambaut et al., 2018), and we discarded the first 25% of the trees as burn-in.
DNA damage patterns were evaluated for the historical samples with mapDamage2.0 (Joìnsson et al., 2013). We analyzed the reads obtained from the mitogenome enrichment and mapped to the reference genome. We used the –rescale, -y 0.1, –plot-only commands.
Divergence time estimates
We estimated molecular dates of divergence using Bayesian MCMC searches implemented in BEAST2 v2.6.6 (Bouckaert et al., 2019) using the concatenated 95% matrix of the UCE data (N = 17) without partitions. The holotype specimen of P. mekisturus was not included in the matrix due to a high number of missing data. The analysis was performed under an uncorrelated lognormal relaxed molecular clock model. The calibrated Yule speciation processes model (Heled and Drummond, 2012) with a randomly generated starting tree were set up as priors. We used three calibration points with a lognormal distribution. Calibrations were based on fossil records (million years ago [mya]) of (1) Reithrodontomys (mean = 1.8, stdev = 1.076, offset = 1.63), as used by Steppan and Schenk (2017); (2) Onychomys (mean = 4.9, stdev = 1.169, offset = 4.753), as used by Steppan and Schenk (2017); and (3) the most recent common ancestor of P. attwateri (mean = 2.7, stdev = 0.9, offset = 2.4 [ Dalquest, 1962; Karow et al., 1996; Wright et al., 2020]) (Supplementary Tables S2, S3). Two separated runs of 50 million iterations each were sampled every 1,000 iterations. We checked convergence statistics for Effective Sample Sizes (ESS) using Tracer v1.7.1 (Rambaut et al., 2018) and a 25% of burn-in was performed on each run. We used LogCombiner v2.6.6 to combine trees and TreeAnnotator v2.6.2 to get a consensus tree with node height distribution (both packages available in BEAST).
We also estimated the divergence times on the complete mitogenomes dataset. First, we obtained the best model and partition scheme in PartitionFinder 2.1.1 (Lanfear et al., 2016). Our search was limited to the models available in BEAST, with linked, AICc, and greedy parameters. The data block was defined by codon position, tRNA, rRNA and D-loop selection, and the result was incorporated in the dating analysis. The analysis was performed under the same conditions and priors set up for the UCE data (mentioned above). We used the same three calibrations points set up for the UCE analysis. Two separated runs of 50 million iterations each were sampled every 1,000 iterations, with a burn-in of 25% on each run. We evaluated convergence with Tracer v1.7.1 (Rambaut et al., 2018), and LogCombiner v2.6.6 was used to combine trees. Finally, we obtained a consensus tree with node height distribution in TreeAnnotator v2.6.2.
We visualized all phylogenetic and dated trees from the UCE and mitogenomes datasets in FigTree 1.4.411. Phylogenetic, dating and DNA damage analyses were performed on the Smithsonian Institution High Performance Computing Cluster (Smithsonian Institution, see footnote 6).
Results
We successfully sequenced UCE’s (raw data is available in GenBank under BioProject PRJNA838631), and mitogenomes (GenBank accession numbers ON528108 – ON528119), from all samples processed, three historical and nine modern samples. The average number of paired-end reads were 11,632,614 (ranging from 8,998,310 to 13,693,826) and 12,272,671 (ranging from 9,480,276 to 21,093,430) for historical and modern samples, respectively. The average fragment size after trimming ranged from 59 to 123 bp and from 134 to 144 bp for historical and modern samples, respectively.
Multilocus nuclear phylogenies
Trinity assemblies yielded an average of 24,543 contigs per sample (min = 2,056; max = 87,428) for historical samples and 197,503 contigs (min = 43,081; max = 450,450) for modern samples. We recovered 4,406 UCE loci in the incomplete matrix (N = 18; average = 2,537 min = 306 max = 3,575 for historical samples, and average = 3,305 min = 1,375 max = 3,859 for modern samples). We obtained 303 UCE loci for the holotype specimen of P. mekisturus.
We tested topologies with different levels of missing data for: (a) complete dataset (N = 18), and (b) dataset without the holotype specimen (N = 17). For the complete dataset the 65% matrix contained 3,659 UCE loci (NL) with an average of 13.9 informative sites per locus (AIS), the 75% matrix (NL = 2,899, AIS = 14.4), the 85% matrix (NL = 1,334, AIS = 14.4), and the 95% matrix (NL = 85, AIS = 14.1). For the dataset without the holotype specimen the 65% matrix contained 3,649 UCE loci with an average of 13.9 informative sites per locus, the 75% matrix (NL = 3,361, AIS = 14.1), the 85% matrix (NL = 2,155, AIS = 14.3), and the 95% matrix (NL = 417, AIS = 14.9).
Maximum Likelihood and Bayesian Inference analyses for both datasets (N = 18 and N = 17) with all levels of matrix completeness yielded the same topology with high support values for all branches (Figure 1, phylogenetic trees obtained from the 65, 75, and 85% matrices are shown in Supplementary Figures S2, S3). The different levels of missing data reflected with the percentage matrices showed, at least for these datasets, that the inclusion of more or less samples per locus did not affect the phylogenetic inferences nor the support values. Both phylogenetic trees (Figure 1) placed Peromyscus mekisturus as the sister species of Reithrodontomys mexicanus with high bootstrap support values (bootstrap > 92, pp = 1), and it is more closely related to Isthmomys pirrensis than to any other member of the genus Peromyscus (bootstrap > 98, pp = 1). We also confirmed that the holotype specimen, despite its amount of missing data, was confidently placed within the clade that include the only other known specimen of this species. The ML and BI trees, using the 95% matrix, with and without partitions (Figure 1), supported the same topology with high bootstrap and posterior probability values (bootstrap > 92, pp = 1) for all branches.
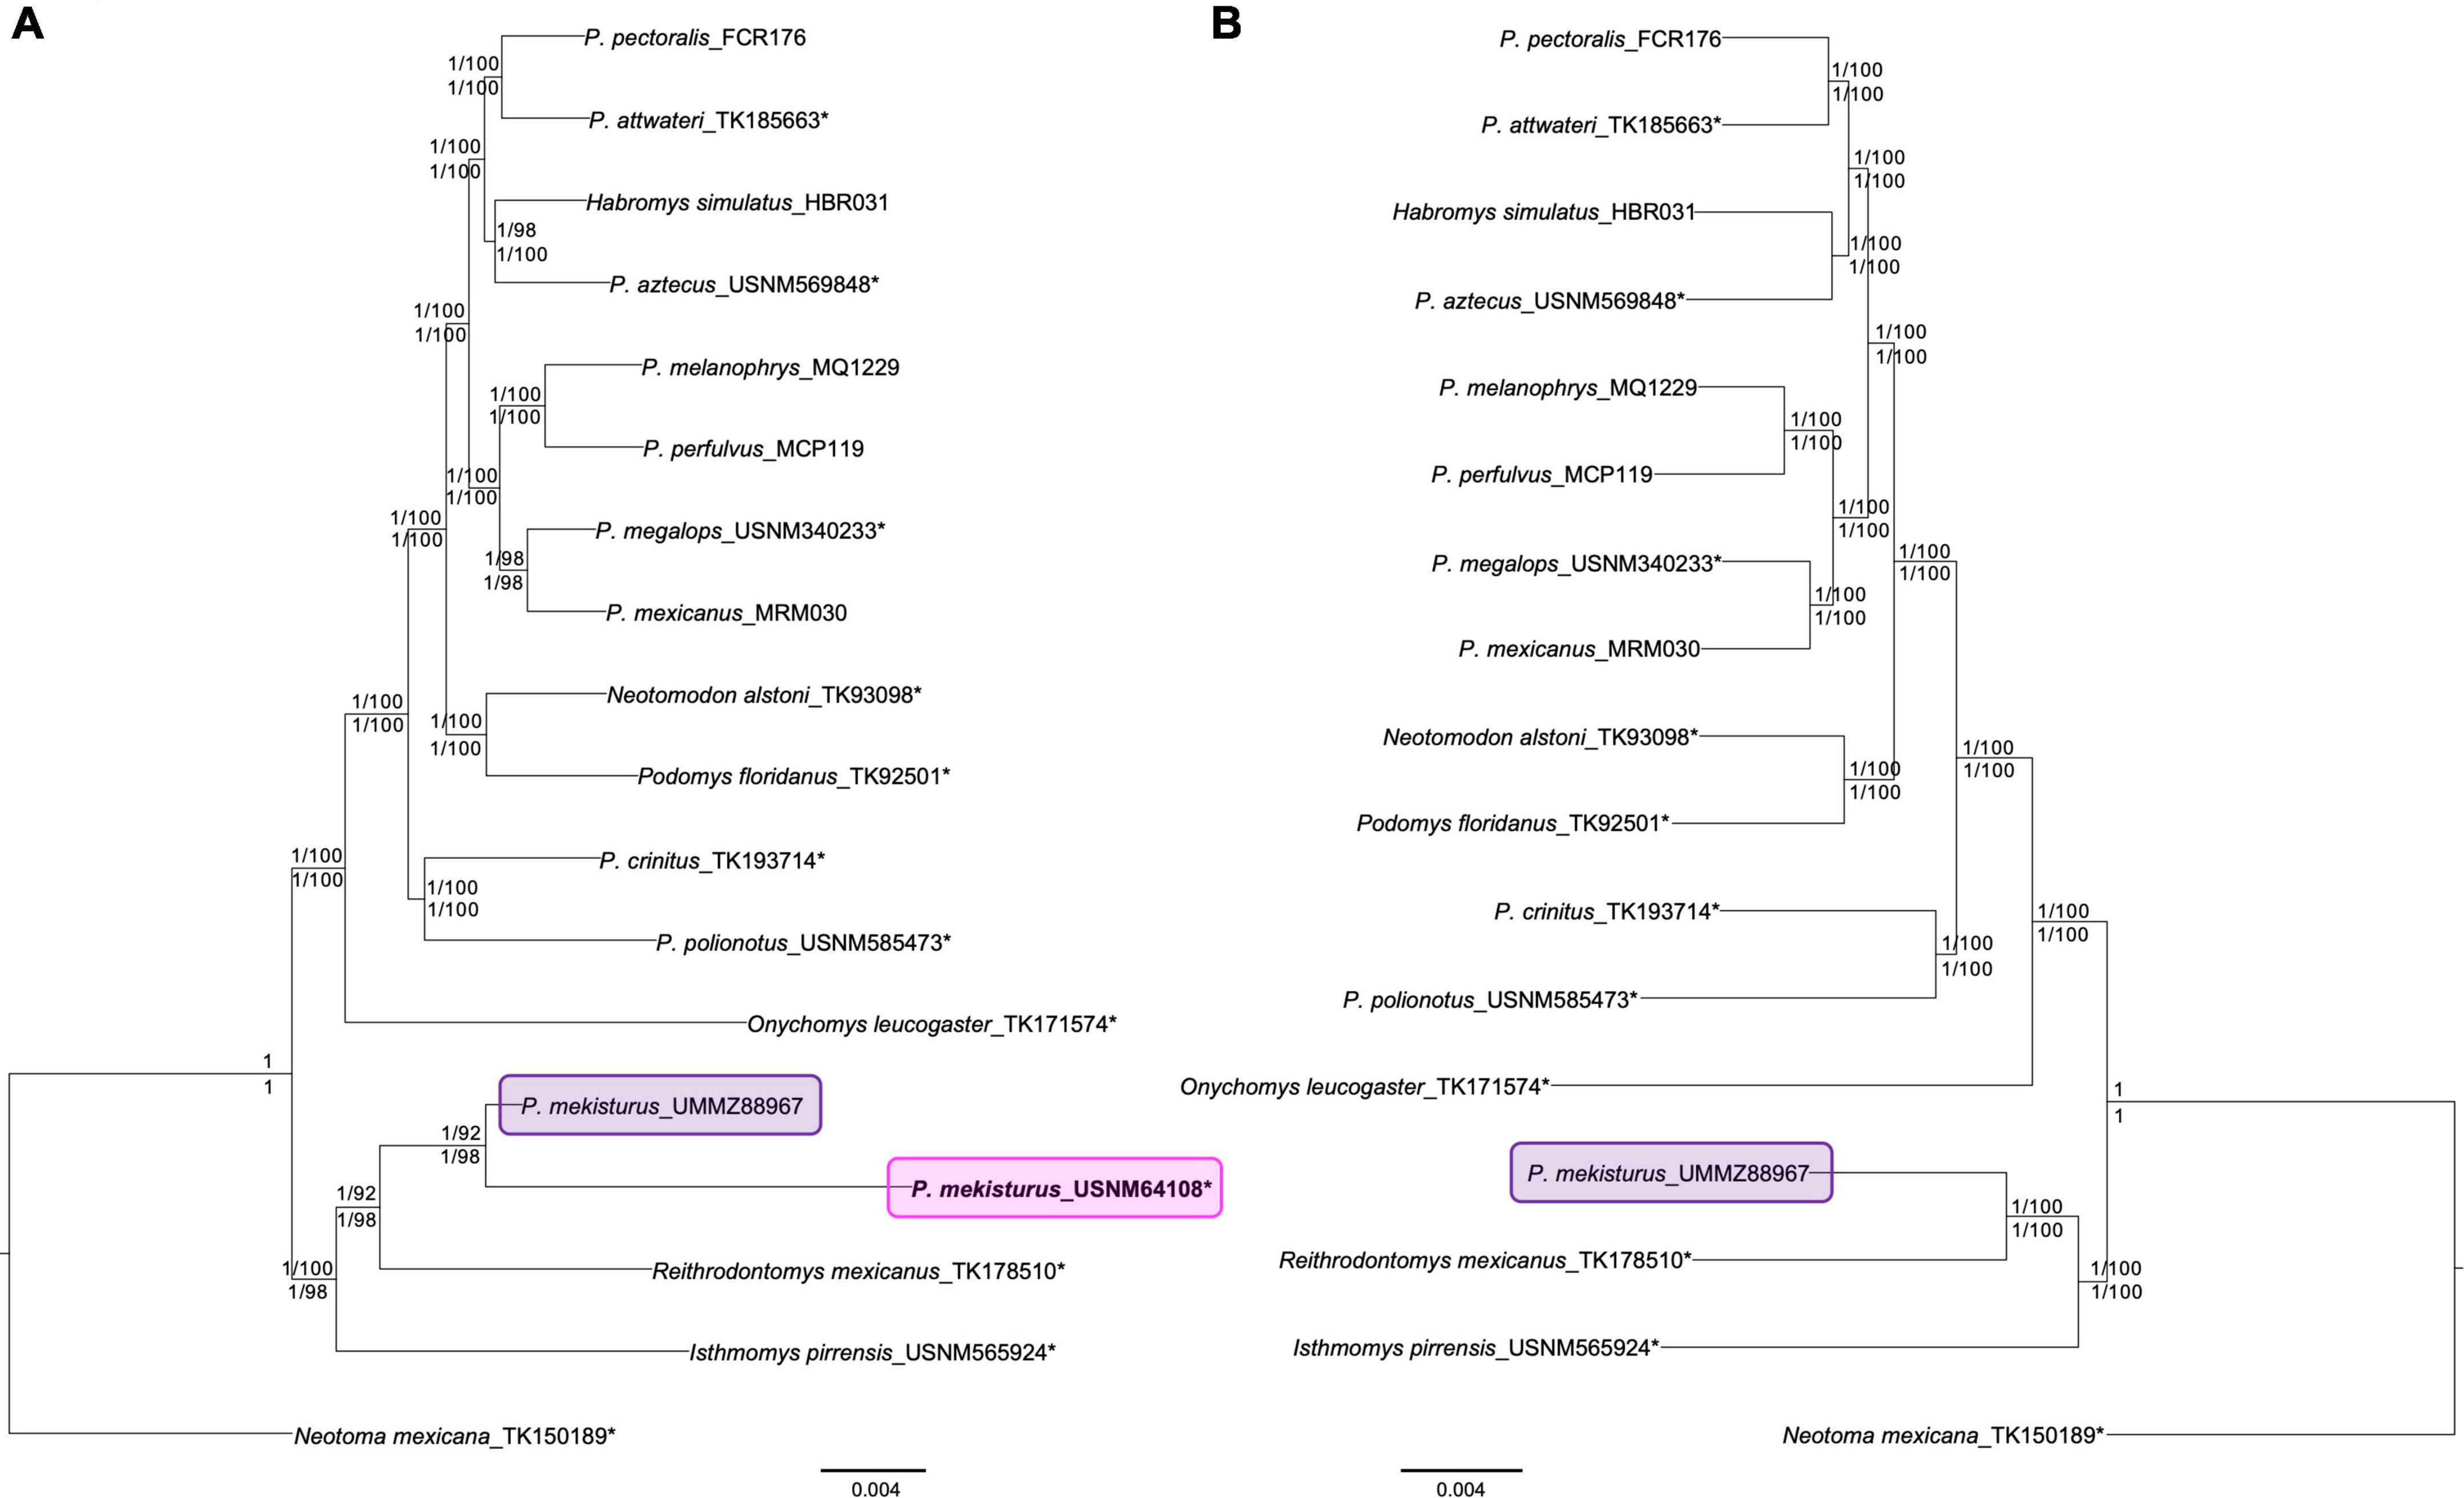
Figure 1. Ultraconserved elements (UCE) phylogenetic trees constructed using Bayesian Inference and Maximum Likelihood with and without partitions. Trees from all analyses yielded identical topologies. Nodal support is denoted with posterior probability/bootstrap values (numbers above the branches indicate results without partitions, those below with partitions). (A) Phylogenetic tree using a complete dataset (N = 18) based on 85 UCE loci (95% matrix) showing the phylogenetic position of the two Peromyscus mekisturus specimens. The pink block highlights the phylogenetic position of the P. mekisturus holotype collected in 1898, and the purple block shows the position of the P. mekisturus specimen collected in 1947; (B) phylogenetic tree based on 417 UCE loci (95% matrix, N = 17). Note that the removal of the holotype due to missing data (306 loci) does not change the tree topology but increases the nodal support between P. mekisturus and R. mexicanus. Asterisks* denote specimens that were sequenced from museum specimens for this study.
The species tree analysis, with all levels of matrix completeness and the dataset without the holotype specimen, estimated the same topology from all matrices (Figure 2) with high support values (local posterior probability – LPP > 0.95). The species tree was concordant with the ML and BI analyses, supporting the placement of P. mekisturus outside the genus Peromyscus, and as the sister species of R. mexicanus (LPP = 1). It also supported the relationship of P. mekisturus + R. mexicanus as the sister group of I. pirrensis (LPP > 0.95). The only difference between the concatenated analyses (ML and BI), and the species tree analysis was the phylogenetic relationship between P. mexicanus and P. megalops. The first analysis placed P. mexicanus and P. megalops as sister species, while the second analysis placed P. mexicanus as sister of P. melanophrys + P. perfulvus, and P. megalops as sister of P. mexicanus + (P. melanophrys + P. perfulvus).
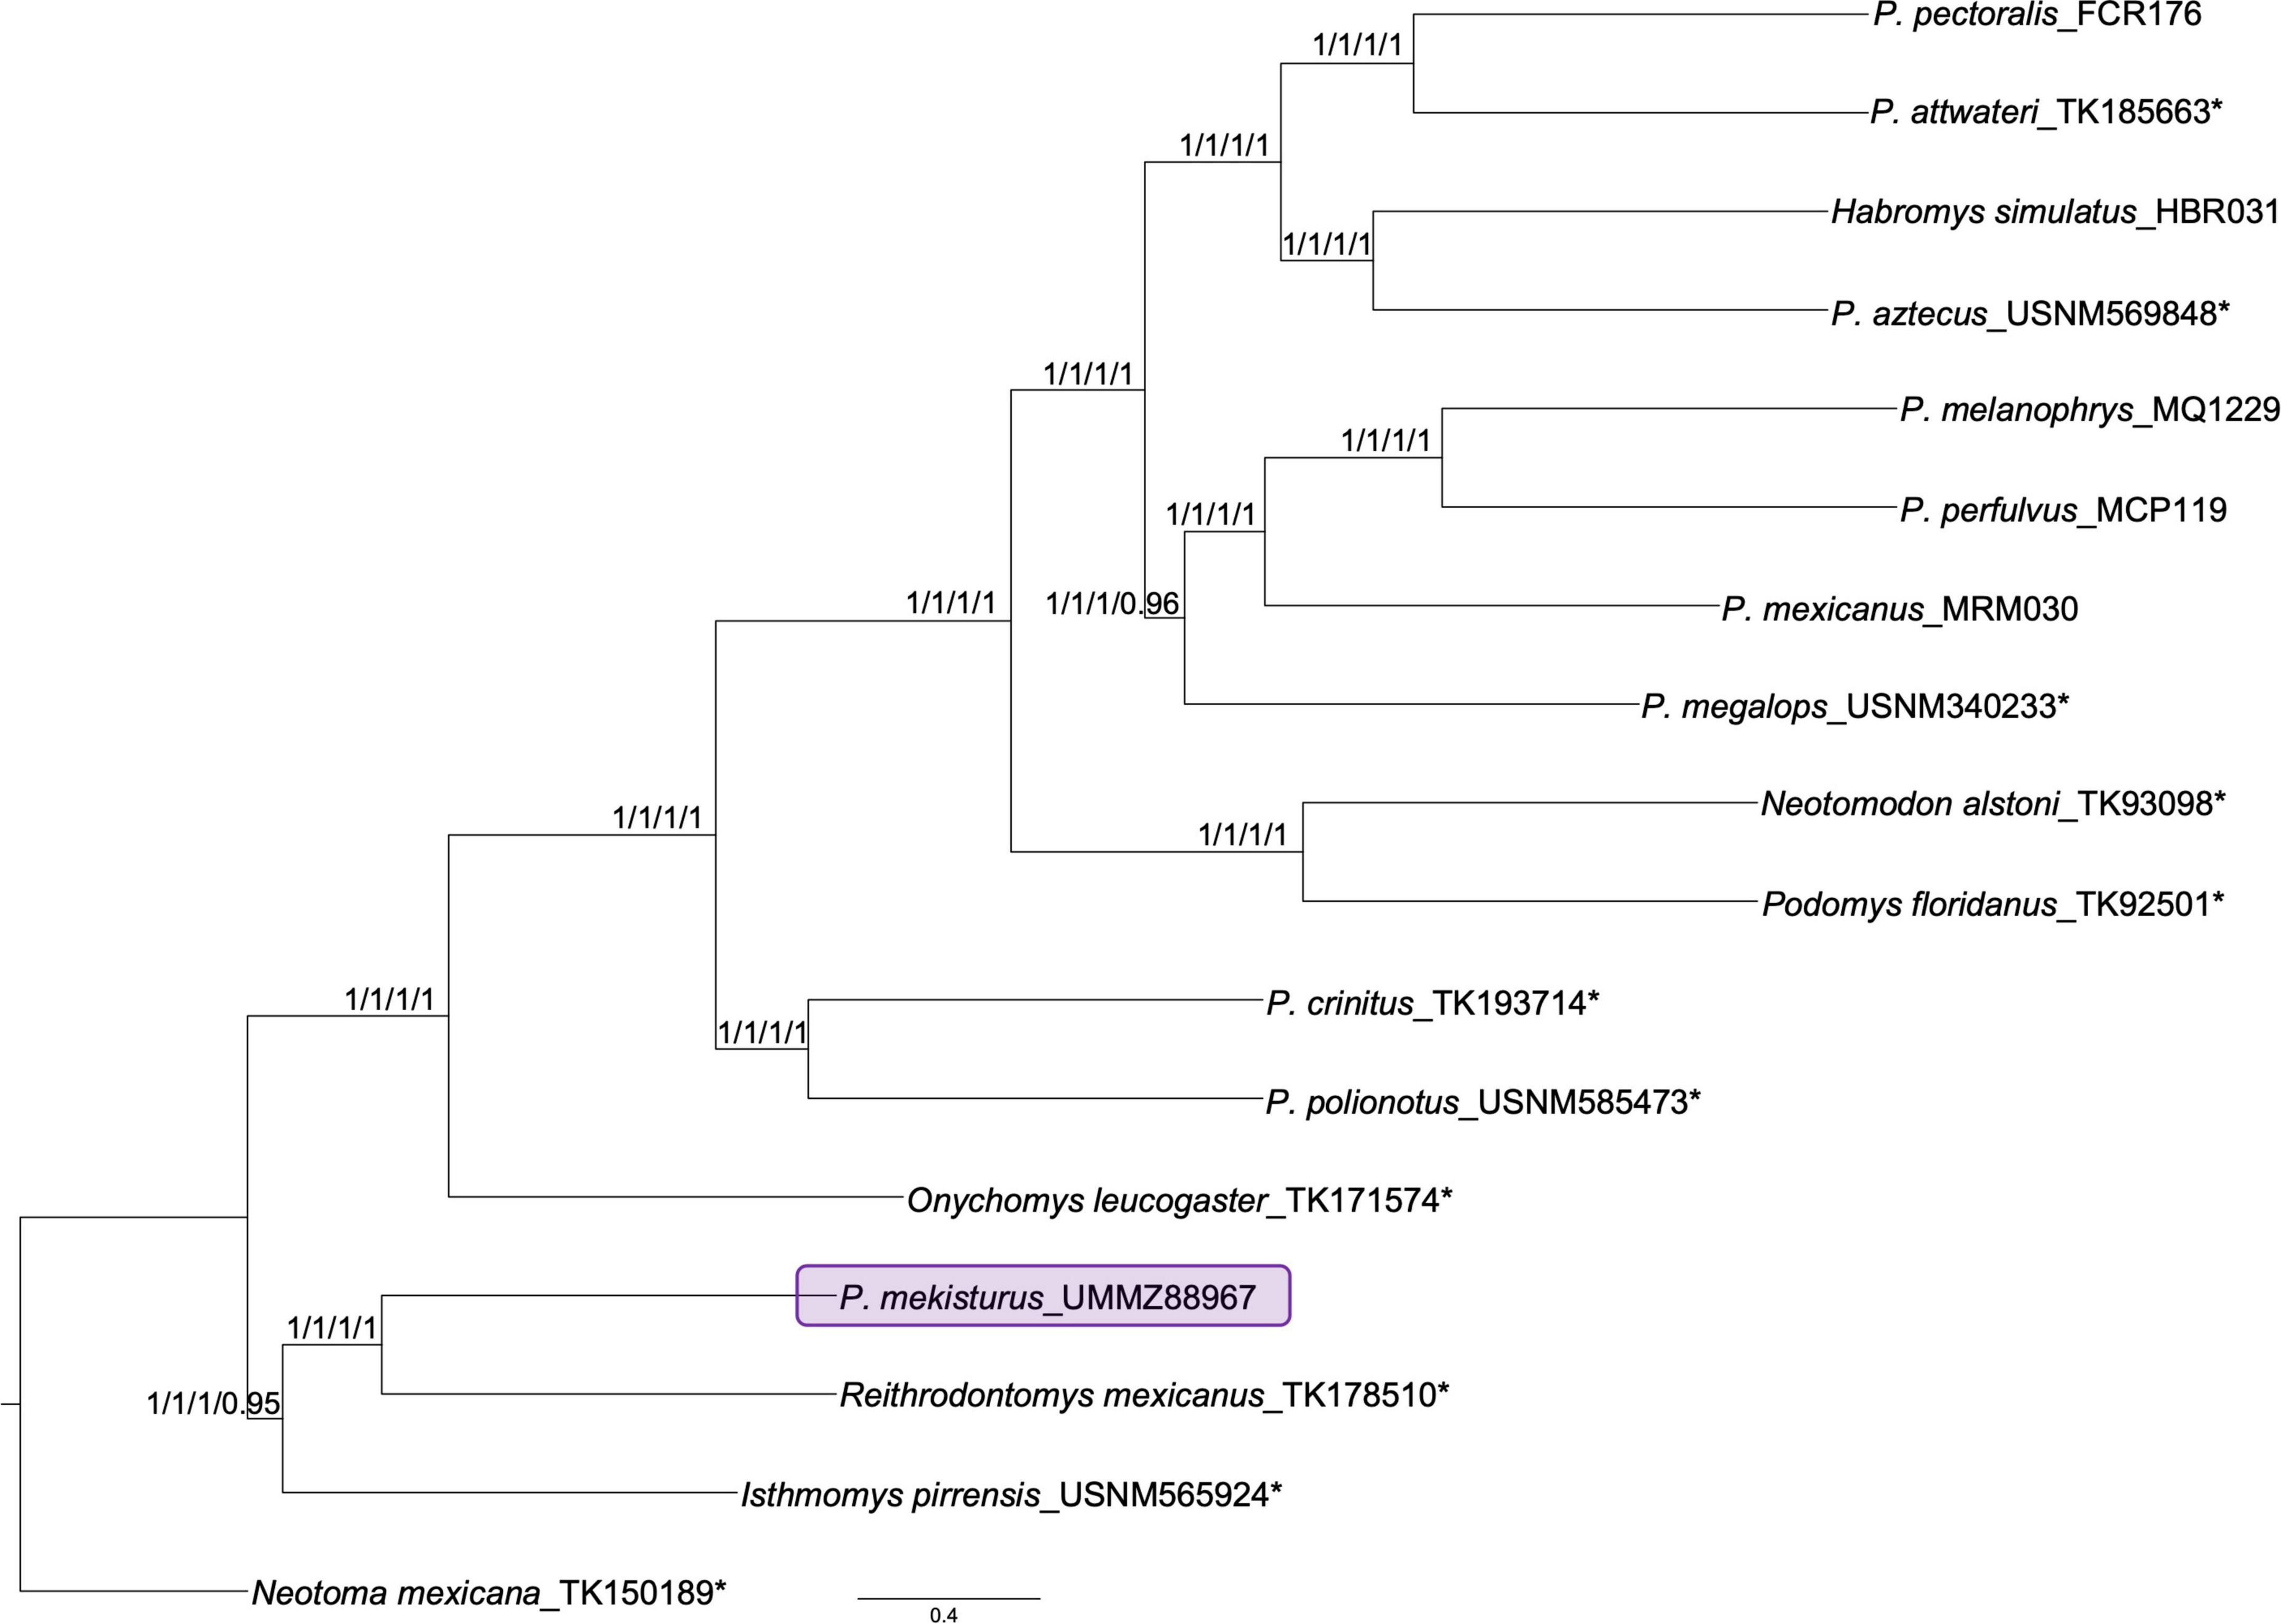
Figure 2. ASTRAL species tree estimation based on different levels of matrix completeness (65% −3,649 UCE loci−, 75% −3,361 UCE loci−, 85% −2,155 UCE loci−, and 95% −417 UCE loci−) and the N = 17 dataset. Nodal support is provided with local posterior probability in the same order as the matrices were mentioned. Note that the phylogenetic position of the P. mekisturus specimen collected in 1947 (purple block) also shows strong support for its close relationship to R. mexicanus. Asterisks* denote specimens that were sequenced from museum specimens for this study.
Mitochondrial phylogenies
We recovered near-complete mitogenome sequences for all samples, including the holotype specimen of P. mekisturus (>95% of the reference mitogenome covered). The mitochondrial sequences contain the standard features present in a mammalian genome as similar size, structure and gene arrangement. The final alignment was 16,228 bp length and included 30 individuals. The BI (with six partitions) and ML analyses (Figure 3) supported the placement of P. mekisturus outside the genus Peromyscus, and more closely related to the genus Reithrodontomys and Isthmomys. The closer phylogenetic relationship of P. mekisturus to R. mexicanus, as sister species, is strongly supported (pp = 1, bootstrap = 98). We also confirmed, with high support values (pp = 1, bootstrap = 100) that the two samples of P. mekisturus were closely related and placed in the same clade. The only difference between the BI and ML trees is the phylogenetic relationship of Neotomodon alstoni + Podomys floridanus with other peromyscine rodents. The BI analysis placed this clade as sister of P. attwateri, P. pectoralis, P. aztecus, P. megalops, P. mexicanus, P. melanophrys, P. perfulvus, and H. ixtlani, while the ML analysis place it as sister to P. attwateri, P. pectoralis, P. aztecus, and H. ixtlani.
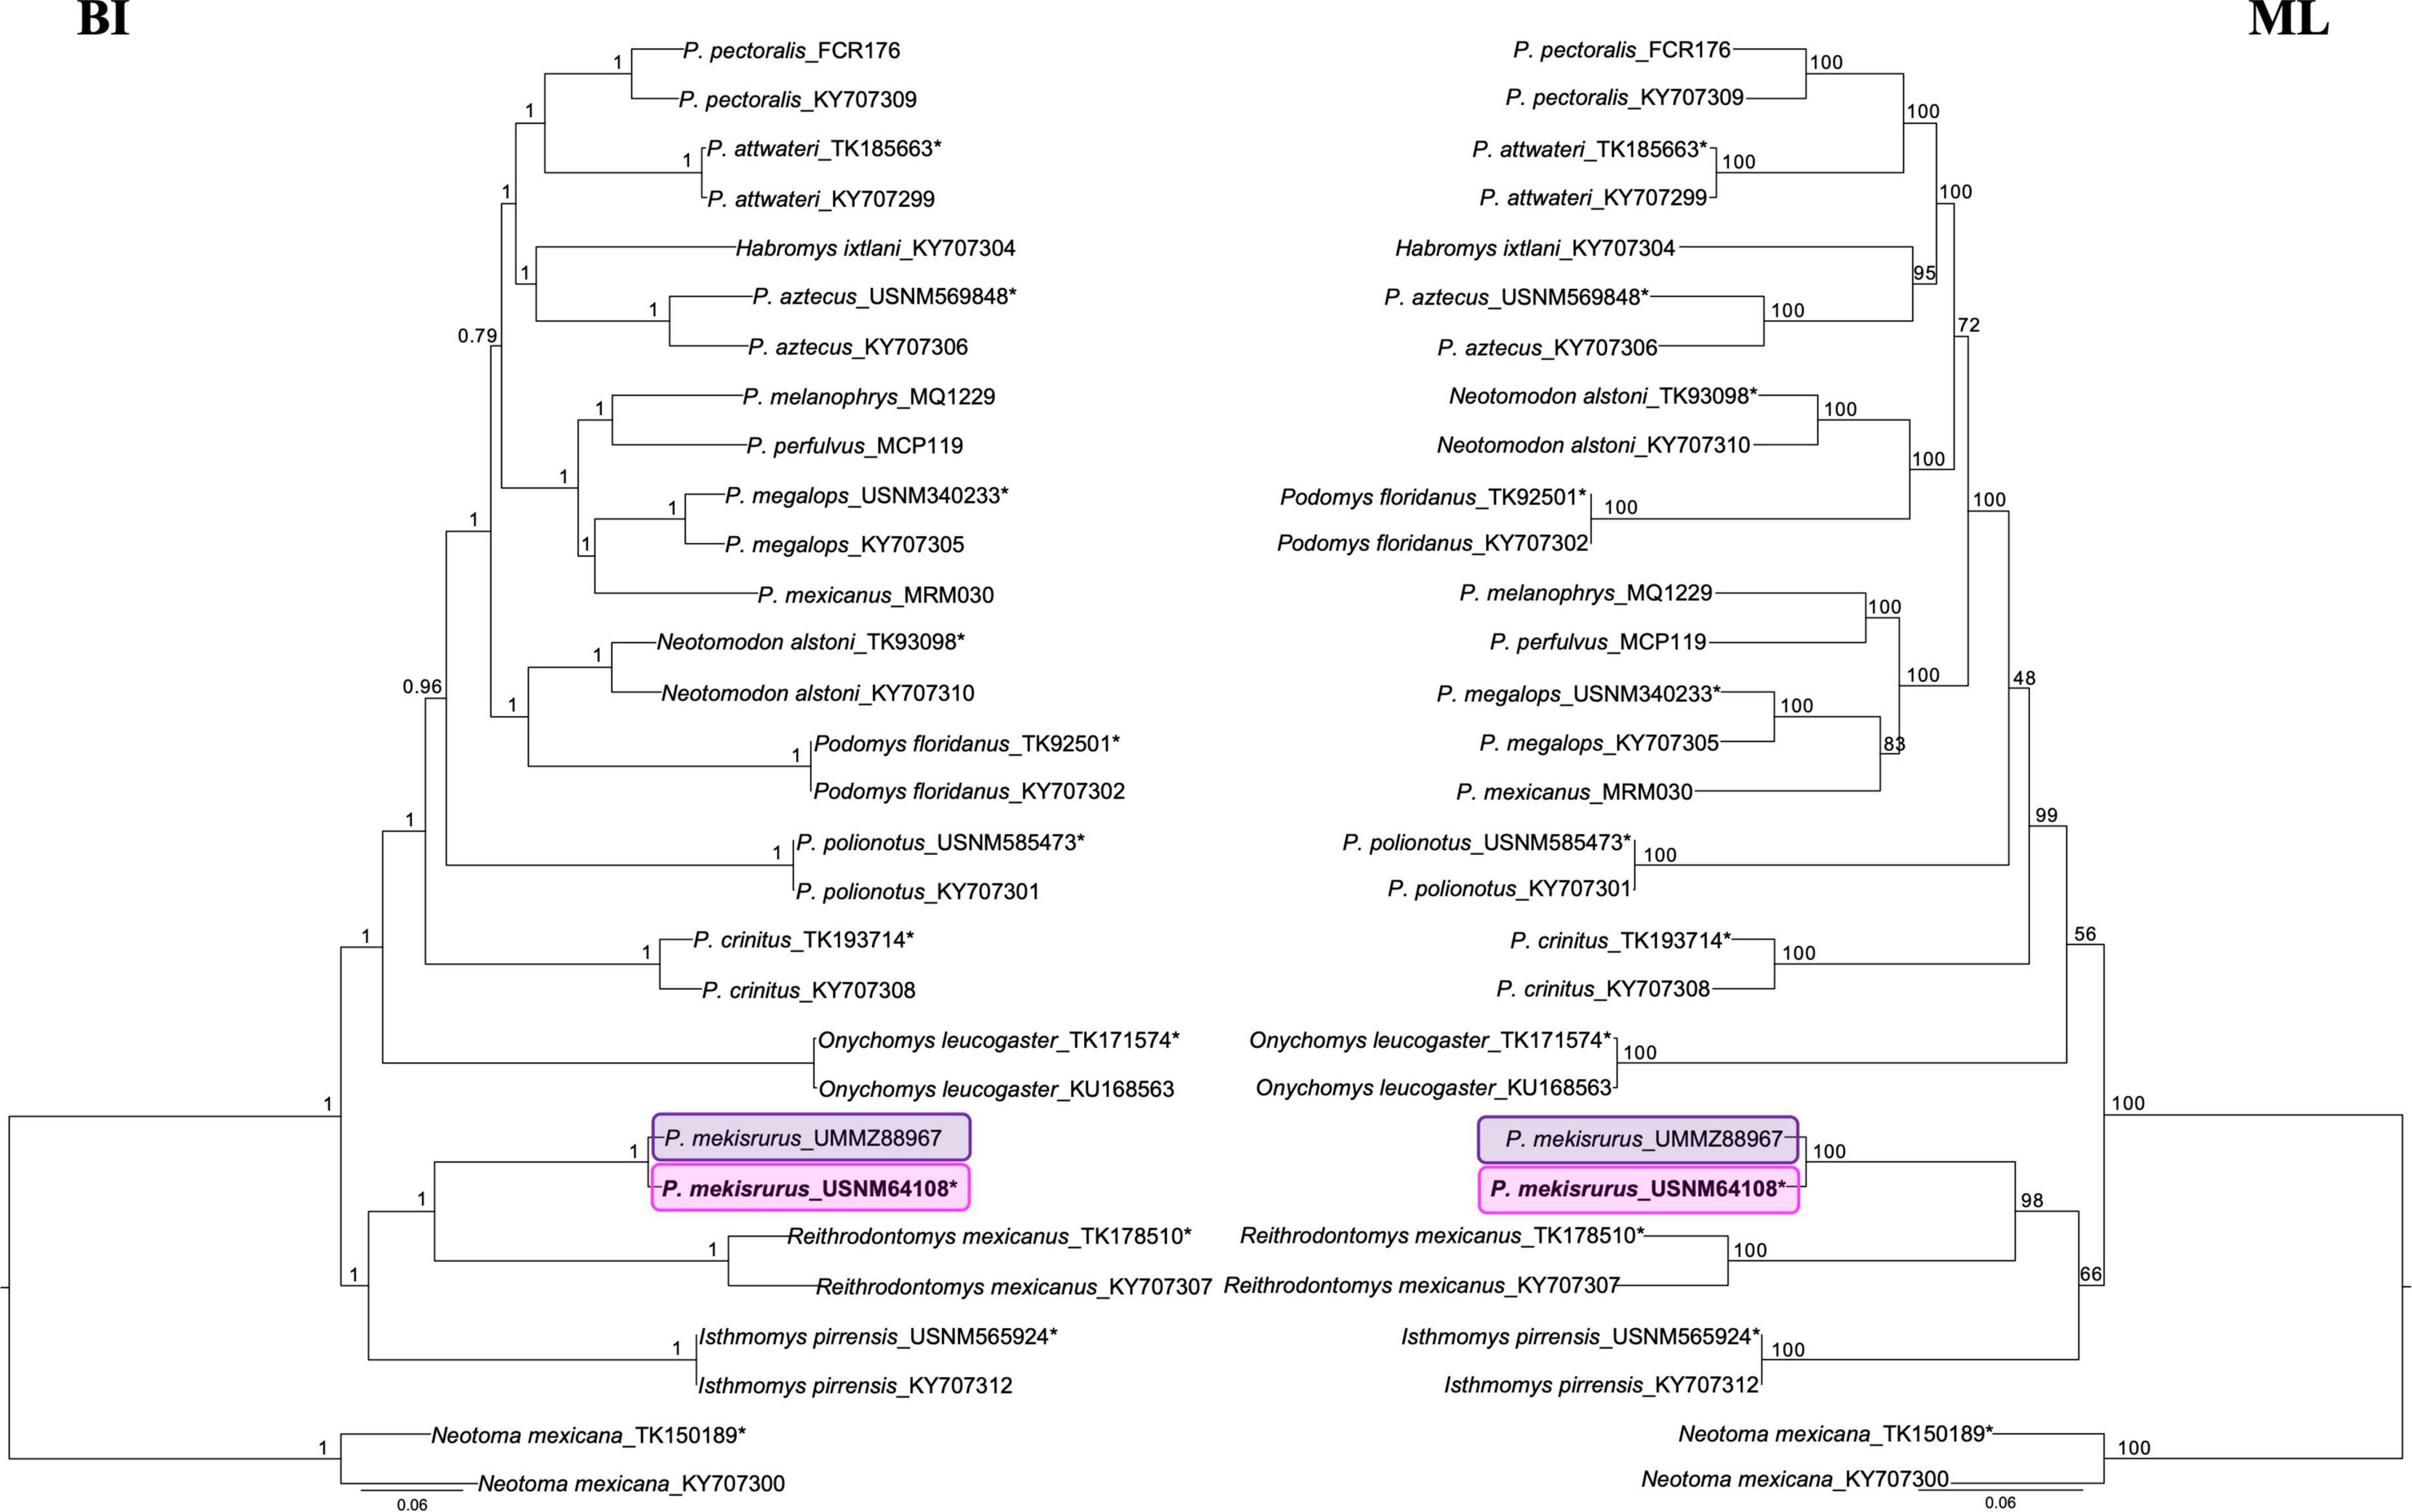
Figure 3. Mitogenome phylogenies based on Bayesian Inference (BI) and Maximum Likelihood (ML). Nodal support is provided with posterior probability and bootstrap values, respectively. The pink block highlights the phylogenetic position of the Peromyscus mekisturus holotype collected in 1898, and the purple block shows the position of the second specimen collected in 1947. Asterisks* denote specimens that were sequenced from museum specimens for this study and compared with previous GenBank accessioned mitogenome sequences.
In addition, all of the species which included both a mitogenome generated in this study and one obtained from GenBank were very similar and clustered together in our phylogenetic analysis. This allowed us to corroborate the taxonomic identity of the samples by using voucher specimens deposited in scientific collections. Finally, the results of mapDamage2.0 analysis showed a weak signal of DNA damage typical of historical DNA (Supplementary Figure S4). The weak damage signal is expected since the oldest sample was collected in 1898 and was well-preserved.
Divergence time estimates of Peromyscus mekisturus and its close relatives
For the UCE dataset, the analysis estimating the time to the most recent ancestor (TMRA) recovered that the divergence between I. pirrensis + R. mexicanus + P. mekisturus from the genus Peromyscus + O. leucogaster occurred ca. 8.60 mya (95% Highest Posterior Density [HPD]: 6.00 – 11.51 mya). While the split of P. mekisturus + R. mexicanus versus I. pirrensis is dated ca. 6.74 mya (95% HPD: 5.51 – 8.19 mya). Finally, the divergence between P. mekisturus and R. mexicanus occurred ca. 3.80 mya (95% HPD: 1.67 – 6.27 mya) (Figure 4).
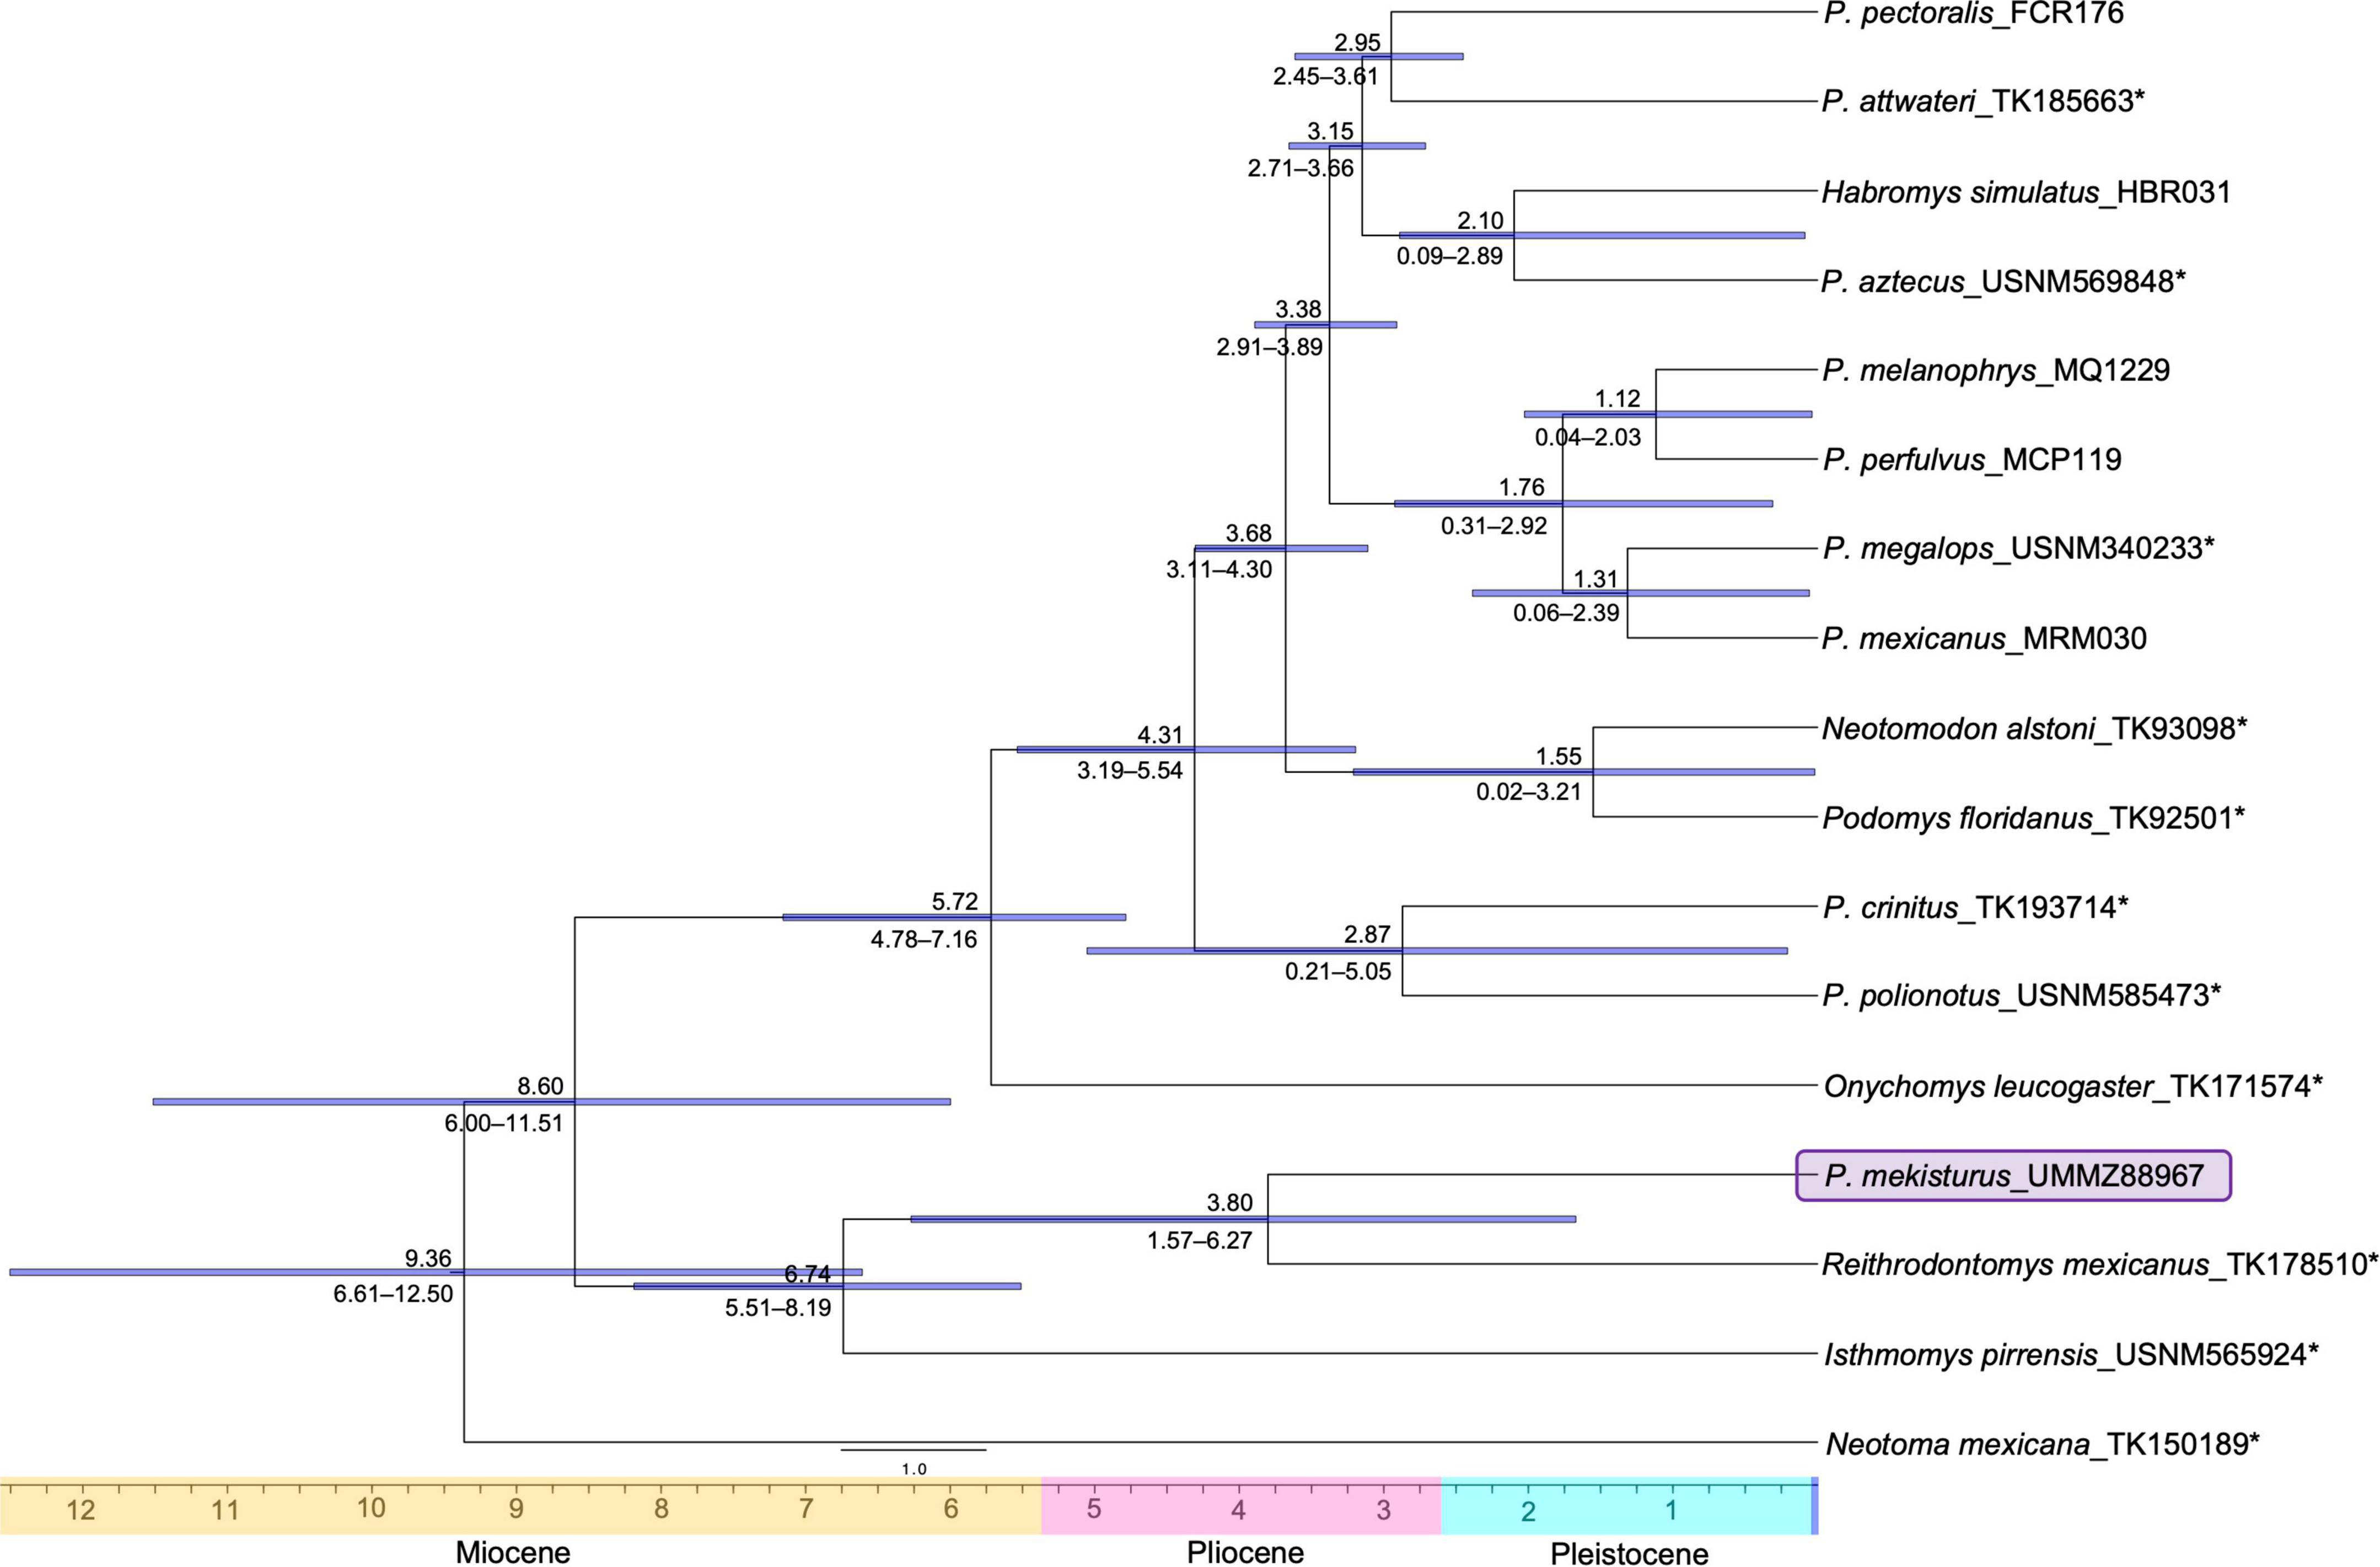
Figure 4. Divergence dated nuclear phylogeny based on 417 UCE loci (95% matrix, N = 17). Dates above the branches are provided in millions of years. Blue horizontal bars and numbers below the branches show the 95% confidence intervals. The purple block shows the phylogenetic position of the Peromyscus mekisturus specimen collected in 1947. Asterisks* denote specimens that were sequenced from museum specimens for this study.
For the mitogenome dataset with six partitions, we estimated the split between I. pirrensis + R. mexicanus + P. mekisturus versus the genus Peromyscus + O. leucogaster dated ca. 5.85 mya (95% HPD: 5.19 – 6.64 mya). While the divergence between P. mekisturus + R. mexicanus versus I. pirrensis occurred ca. 5.38 mya (95% HPD: 4.65 – 6.23 mya), followed by the split between P. mekisturus and R. mexicanus dated ca. 4.42 mya (95% HPD: 3.61 – 5.30 mya). Finally, we dated the diversification within P. mekisturus ca. 0.26 mya (95% HPD: 0.15 – 0.37 mya) (Figure 5).
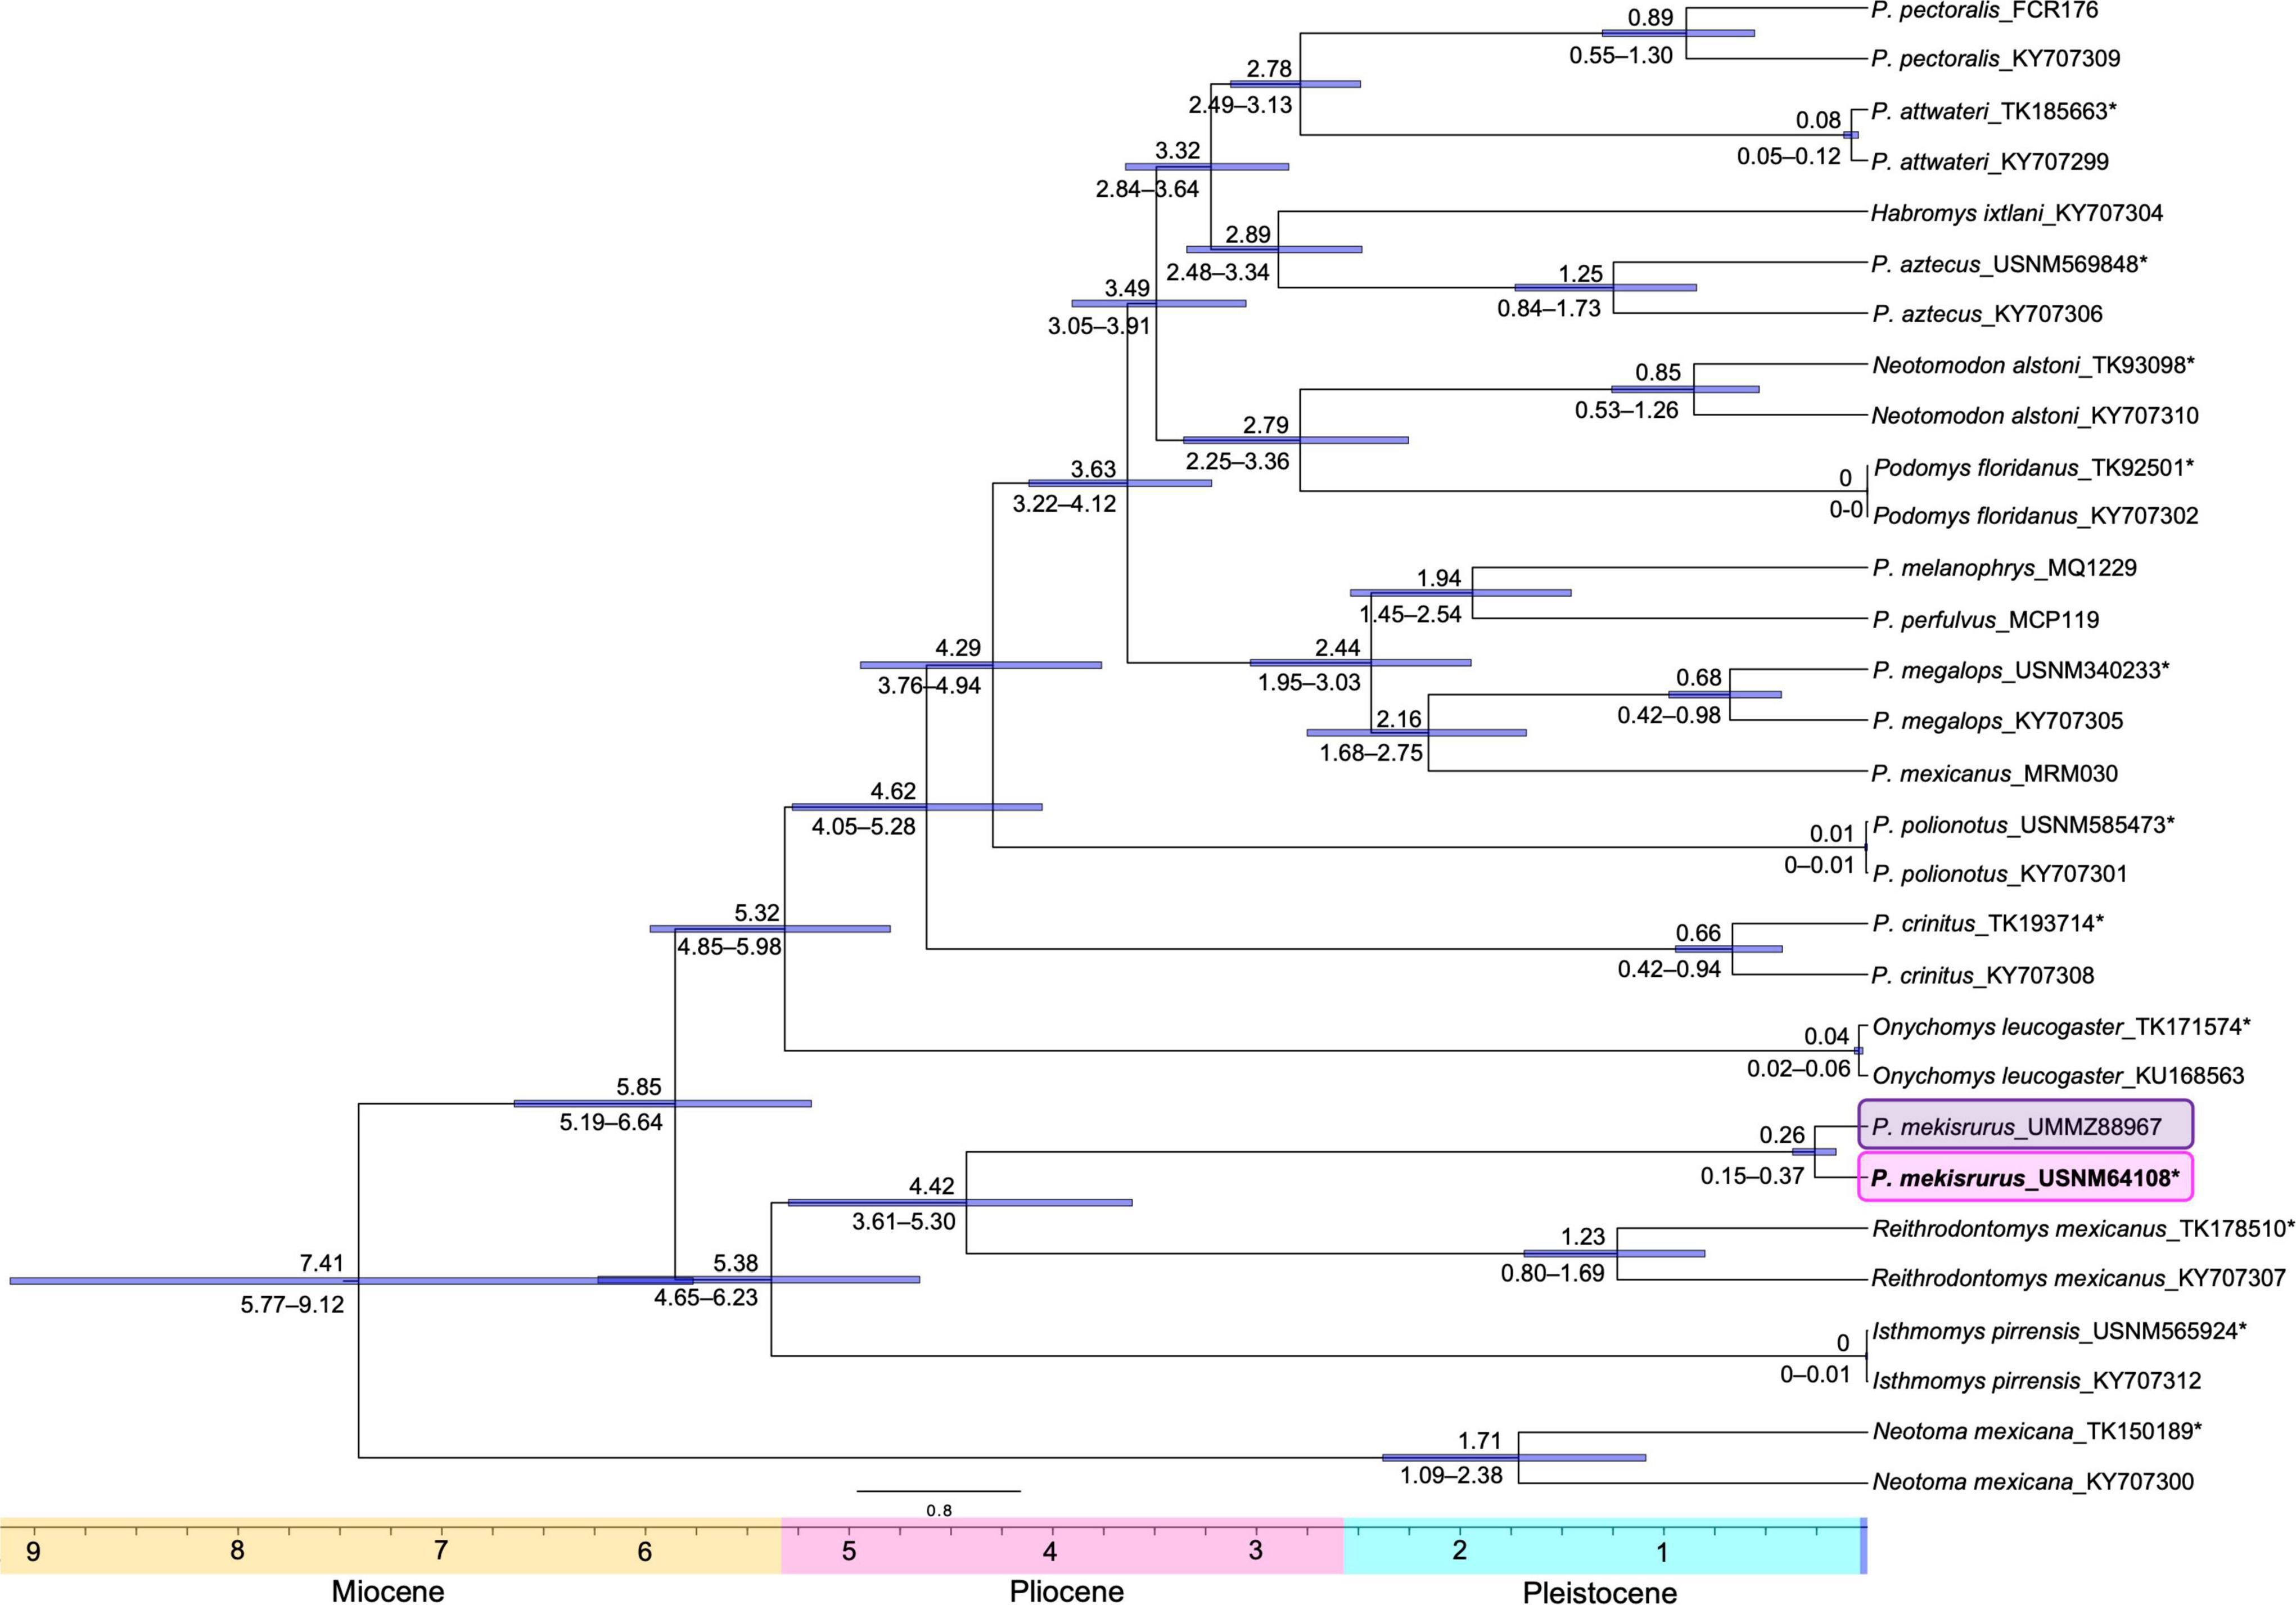
Figure 5. Divergence dated whole mitochondrial genome phylogeny. Dates above the branches are provided in millions of years. Blue horizontal bars and numbers below the branches show the 95% confidence intervals. The pink block highlights the phylogenetic position of the Peromyscus mekisturus holotype collected in 1898, and the purple block shows the position of the second specimen collected in 1947. Asterisks* denote specimens that were sequenced from museum specimens for this study and compared with previous GenBank accessioned mitogenome sequences.
Discussion
Phylogenetic relationships of Peromyscus mekisturus and its relatives
All of our ML, BI, and species tree analyses, with both mitochondrial and nuclear datasets, strongly supported that the Puebla deer mouse, P. mekisturus, is the sister species of the genus Reithrodontomys, and it is more closely related to the genus Isthmomys than to any other member of the genus Peromyscus. Therefore, our nuclear data results support previous mitochondrial hypothesis proposed by Castañeda-Rico et al. (2020). In addition, the successful sequencing of UCE loci and mitogenome from the holotype of P. mekisturus allowed us to confirm the identification of the only two known specimens of this species.
To better understand the phylogenetic position of P. mekisturus, it is important to outline some of the previous taxonomic problems that have emerged for the genus Peromyscus and its relationship with the genera Isthmomys and Reithrodontomys. Peromyscus is a very large and diverse group in which new species are still being described (Bradley et al., 2007, 2014) making taxonomic sampling challenging for this genus. It has also been demonstrated that this genus has a high and rapid diversification rate complicating the reconstruction of its phylogenetic relationships (Platt et al., 2015). Thus, Peromyscus has presented a great challenge to systematists and after over 100 years – since Osgood’s (1909) monograph – its evolutionary boundaries remain unresolved (Carleton, 1980, 1989; Bradley et al., 2007; Miller and Engstrom, 2008; Platt et al., 2015). An additional conflict is the taxonomic status of Habromys, Megadontomys, Neotomodon, Osgoodomys, Podomys, and Isthmomys, recognized at the generic (Peromyscus – sensu lato –) or subgeneric (Peromyscus – sensu stricto –) level. To date, no single classification fits perfectly into one category, and not a single study has been able to offer unambiguous taxonomic recommendations for Peromyscus and its close relatives (Platt et al., 2015).
Isthmomys was first suggested as a subgenus of Peromyscus (Hooper and Musser, 1964) but later it was elevated to a separate genus (Bradley et al., 2007; Miller and Engstrom, 2008; Platt et al., 2015; Sullivan et al., 2017). In addition, several studies have placed Isthmomys as the sister taxon of Reithrodontomys, and these two genera are the nearest taxa to Onychomys + Peromyscus (Bradley et al., 2007; Miller and Engstrom, 2008; Platt et al., 2015; Sullivan et al., 2017; Castañeda-Rico et al., 2020). In our study, we found that the divergence between Peromyscus versus Isthmomys + (Reithrodontomys + P. mekisturus) was strongly supported by the UCE’s BI tree and the mitogenomes analyses (Figures 1, 3), even though the ML and species tree analyses did not yield strong node support for this node (Figures 1, 2). Furthermore, we confirmed that Isthmomys is the sister genus of Reithrodontomys and P. mekisturus with high support values for all analyses and datasets (Figures 1–3).
To date, no phylogenetic hypothesis has ever suggested that the genus Reithrodontomys should be nested within Peromyscus (Sullivan et al., 2017). Additionally, no morphological similarities have been found between Reithrodontomys and its close relative Isthmomys (Miller and Engstrom, 2008). Harvest mice belonging to the genus Reithrodontomys, are small-bodied rodents with long tails and are distinguished from other peromyscine rodents by possessing grooved or sulcate upper incisors – a key synapomorphy defining this genus – (Le Conte, 1853; Musser and Carleton, 1993; Arellano et al., 2005). Peromyscus mekisturus is also a small-bodied rodent with a very long tail, equaling three-fourths of the total length that is associated with its arboreal habits. This same character was used to place it as sister of P. melanophrys within the Peromyscus melanophrys group (Osgood, 1909; Carleton, 1989). In addition, P. mekisturus does not have grooved or sulcate incisors, but only a greater development of an incisor capsule on the dentary compared with other peromyscine rodents (Carleton, 1989). To date, no morphological character has shown similarities or has suggested a close phylogenetic relationship between P. mekisturus and Reithrodontomys.
A recent study by Castañeda-Rico et al. (2020), suggested the placement of P. mekisturus and Isthmomys at the same taxonomic level, i.e., still considered part of Peromyscus (sensu lato or sensu stricto) but supporting the paraphyly of the genus as has been suggested (Bradley et al., 2007; Miller and Engstrom, 2008; Platt et al., 2015; Sullivan et al., 2017). However, based on the fact that Isthmomys is currently accepted as a separate genus (Sullivan et al., 2017) and coupled with our genomics results, we recommend that P. mekisturus be recognized at the generic level. In support of our recommendation is the phylogenetic position, and genetic uniqueness and distinctiveness of P. mekisturus alongside with its close relationship with Reithrodontomys but lacking the synapomorphy (i.e., grooved or sulcate upper incisors) that defines this genus. We also propose that a taxonomic revision of P. mekisturus should be undertaken to incorporate a morphological re-evaluation to formally recognize it as a new genus. If our results lead to a taxonomic re-evaluation and rearrangement of this group into a monotypic genus, this would have a great impact on their conservation management as it would likely represent the description of a nearly, or recently extinct unique lineage of rodents (Castañeda-Rico et al., 2020).
Even though the objectives of this study were not to further investigate the phylogenetic relationships within the genus Peromyscus, our sampling and novel results using mitogenomes and UCE loci of representative museum specimens within this genus allowed us to make some interesting inferences. First, all of our phylogenetic analyses (Figures 1–3) continue to support the paraphyly for the genus Peromyscus, including representatives of the genera Habromys, Podomys, and Neotomodon, as was previously suggested (Bradley et al., 2007; Miller and Engstrom, 2008; Platt et al., 2015; Sullivan et al., 2017; Castañeda-Rico et al., 2020). All of the analyses based on the UCE dataset showed a well-supported clade for P. crinitus and P. polionotus (Figures 1, 2). Sullivan et al. (2017) and Castañeda-Rico et al. (2020), both using mitogenomes, identified the same clade with high support values for the BI analysis but lacking support or low support values for the ML tree. In sharp contrast, our mitogenome trees did not support this clade, instead, P. crinitus was the most divergent species within Peromyscus, followed by the split of P. polionotus (Figure 3). This mito-nuclear discordance, commonly seen in mammals (Hawkins et al., 2016), requires further investigation. We suggest that future studies increase taxon sampling.
The relationship between P. mexicanus and P. megalops also recovered some discrepancies. The species tree analysis placed P. mexicanus as the sister of P. melanophrys + P. perfulvus, with P. megalops being the most closely related species to a clade containing all three, with high LPP support values (Figure 2). However, ML and BI nuclear UCE trees as well as all mitogenome trees showed a well-supported clade including P. mexicanus and P. megalops being the sister to a clade containing P. melanophrys + P. perfulvus (Figures 1, 3). The same phylogenetic relationships were also supported by Castañeda-Rico et al. (2020) but only the clade of P. mexicanus and P. megalops was identified by Sullivan et al. (2017) due to the inclusion of less taxa.
Neotomodon alstoni and Podomys floridanus constitute a well-supported clade across all the phylogenetic analyses, however, the placement of this clade is in conflict. All nuclear trees and the BI mitogenome tree with high support values (Figures 1–3) placed N. alstoni + P. floridanus as the sister clade of P. megalops, P. mexicanus, P. perfulvus, P. melanophrys, P. aztecus, P. attwateri, P. pectoralis, and H. simulatus/H. ixtlani. In contrast, the ML mitogenome tree and the time tree (Figures 3, 5) placed N. alstoni + P. floridanus as the sister clade of P. aztecus, P. attwateri, P. pectoralis, and H. ixtlani but with a lower support value (bootstrap = 72). Sullivan et al. (2017) and Castañeda-Rico et al. (2020) also supported the same phylogenetic relationship with high support values but only using mitogenomes. Finally, our genome-wide analyses confirm the sister genera relationship of Onychomys and Peromyscus which had been previously suggested using single genes (Platt et al., 2015), and that the Peromyscus melanophrys group (P. melanophrys + P. perfulvus) is sister to P. mexicanus + P. megalops previously suggested using only mitogenomes (Castañeda-Rico et al., 2020).
In general, our nuclear and mitochondrial phylogenetic trees largely mirror the mitogenome trees of Sullivan et al. (2017) and Castañeda-Rico et al. (2020) save a few exceptions. However, here we present the first nuclear and mitogenome-wide phylogeny with the most complete taxon dataset of peromyscine rodents to date. Given our results, we consider that the next step to unraveling the phylogenic relationships within the genus Peromyscus and its close relatives is to increase taxon sampling. However, this study has demonstrated that using museum specimens to increase taxa using UCE and mitogenomes is suitable to address complex phylogenetic studies, particularly when some taxa are only known from museum specimens.
Divergence time estimation indicates a late Pliocene – early Pleistocene origin of Peromyscus mekisturus
Our divergence time estimates (based on separate UCE and mitogenome datasets) resulted in similar dates (Figures 4, 5). Although mitochondrial divergence dates were slightly older than those obtained with nuclear data, with the exception of the three oldest splits [Neotoma, Isthmomys + (Reithrodontomys + P. mekisturus), and Isthmomys]. Nuclear and mitochondrial estimates indicated that the main speciation events started in the late Miocene and Pliocene up to the Pleistocene, when the diversification started within each species. A majority of the divergences appear to correspond with the timing of the Quaternary climatic fluctuations, mostly during the Pleistocene glacial/interglacial cycles.
We dated three late Miocene – Pliocene events: the divergence between Isthmomys + Reithrodontomys + P. mekisturus versus Onychomys + Peromyscus ca. 8.6–5.85 mya, the split of Isthmomys from Reithrodontomys + P. mekisturus ca. 6.74–5.38 mya, and the divergence between Onychomys and Peromyscus ca. 5.72–5.32 mya. The order of these divergence events coincides with those proposed by Platt et al. (2015) using a combined dataset of one mitochondrial and three nuclear genes, however, their dates are slightly older but still place these events during the Miocene and Pliocene (i.e., ca. 7.93, 7.30, and 7.20 mya, respectively). The divergence between P. mekisturus and Reithrodontomys dated ca. 3.80 – 4.42 mya coincides with the beginning of diversification within Peromyscus ca. 4.31 – 4.62 mya, both events during the late Pliocene and early Pleistocene. Platt et al. (2015) estimated an older origin for Peromyscus that began at approximately 8 mya, but its diversification appears to have been focused at ca. 5.71 mya (95% HPD: 3.37 – 9.08). Our estimates are placed within the range reported by them and with smaller 95% HPD values (Figures 4, 5). Finally, based on the mitogenome calibrated tree including the holotype specimen, we dated the diversification within P. mekisturus at ca. 0.26 mya at the end of the Pleistocene.
Similar divergence times have been found in other studies of Peromyscus (e.g., Castañeda-Rico et al., 2014; Cornejo-Latorre et al., 2017; Bradley et al., 2019) but they also analyzed single genes. Here, we present the first dated phylogeny obtained from genome-wide data for these groups of rodents. We expect that future genomic studies will continue to investigate and provide new insights into the divergence times in neotomines and other groups of rodents.
The complexity of elucidating the evolutionary history of P. mekisturus, with only two specimens known to science, can be decreased by making inferences about its closest relatives. For example, among peromyscines, the genus Peromyscus ranks first in species richness, followed by Reithrodontomys [ca. 70 and 24 species, respectively] (Miller and Engstrom, 2008; Platt et al., 2015; Martínez-Borrego et al., 2022). Both genera are found in most habitats distributed in North and Central America but only Reithrodontomys is found in South America. However, Mesoamerica, specifically Mexico, has been recognized as the center of biodiversity and diversification for both genera due to the unique physiographic characteristics that have promoted the isolation and differentiation of taxa in this region (Hooper, 1952; Hall, 1981; Eisenberg, 1989; Sullivan et al., 2000; Bradley et al., 2004; Arellano et al., 2005; Dawson, 2005; Miller and Engstrom, 2008). Speciation and diversification processes for these peromyscines have also been driven by the Pleistocene climatic cycles that expanded North American taxa southward during glacial advances, and retracted them northward during interglacial warming, giving rise to numerous vicariant and dispersal events (Dawson, 2005; Castañeda-Rico et al., 2014; Platt et al., 2015; Martínez-Borrego et al., 2022). Future phylogenetic studies should also include a denser taxon sampling of members of the genus Reithrodontomys and incorporate P. mekisturus as its closest outgroup to validate the timing and process of diversification of this group.
Information on environmental fluctuations and the existence of corridors at that time that favored movement across the landscape followed by post-glacial isolation strongly support the role of Pleistocene climate changes in the diversification process of many taxa (Martin and Klein, 1984; Ceballos et al., 2010; Ferrusquía-Villafranca et al., 2010). Therefore, we propose that both P. mekisturus and Reithrodontomys were also greatly impacted by the climatic fluctuation events that occurred during the Pleistocene, in agreement with our molecular dating. These taxa generated evolutionary novelties after repeated cycles of expansion and isolation that gave rise to unique lineages at the generic level. However, a surprisingly interesting revelation of our study regarding the phylogenetic placement and evolutionary history of P. mekisturus is that despite their close relatives (Peromyscus and Reithrodontomys) show high diversification rates, P. mekisturus did not and remained isolated in a restricted geographic area in central Mexico. We can only speculate that the distribution of this unique lineage was once more widespread with larger population sizes and that the subsequent biotic and/or abiotic conditions in the Anthropocene drastically decreased its population sizes putting it on a trajectory toward extinction.
The impact of museomics on present and future research
The case of P. mekisturus is particularly interesting as it demonstrates the positive impact of museomics, highlighting the importance of the inclusion of holotypes in phylogenetic studies, but it also provides evidence of the biodiversity loss that we are currently facing due to the ongoing mass extinction caused during the Anthropocene (Ceballos et al., 2020). We also demonstrate that it is possible to carefully design a protocol for destructive sampling that requires a very small amount of skin sample and that causes minimal damage to the voucher holotype specimen, ensuring all diagnostic characters remain intact. We also show that hDNA from museum specimens coupled with high throughput capture hybridization technologies are capable of yielding powerful genome-scale data. From a small piece of dry skin from the holotype specimen of P. mekisturus, we recovered a near-complete mitogenome sequence and 306 UCE loci that were enough to obtain well-resolved dated phylogenies. Therefore, we confirmed that the removal of tiny amounts of material from museum specimens by best practices of destructive sampling may add enormous value to the content of collections and will allow them, together with hDNA, to meet their full and incredible research potential (Bailey et al., 2016; Schmitt et al., 2018; Raxworthy and Smith, 2021). We expect that this example, confirming the ability of even very old specimens to yield genomic data, will motivate researchers to utilize type specimens and give confidence to curatorial staff who are tasked with ensuring the proper use of these valuable specimens.
Throughout this manuscript, we have continuously mentioned the value and importance of natural history museums and the specimens that are currently housed in their collections to conduct a wide range of cutting-edge research as well as continue with more traditional studies. However, we also need to highlight and advocate for the need to continue collecting specimens and to continue building the scientific heritage of the collections in the forthcoming years to keep a record of the historical biodiversity on the planet for the future generations of researchers and society in general. From a general perspective, Schmitt et al. (2018) argued that creative and novel uses of museum specimens have provided diverse applications of value to society, among them, is the research on biodiversity and global sustainability. Continued support of museums by funding agencies and dedication to collect specimens by museums are urgently needed to build and maintain this critical scientific resource moving forward and this topic should be a global priority. Yet collecting new specimens is still criticized and overlooked as an invaluable investment in the future (Minteer et al., 2014). However, this criticism is often due to misconceptions about the perceived negative impact of museum collecting on wildlife populations (Remsen, 1995; Hope et al., 2018). We expect that our case study of P. mekisturus can be used as justification for the need to continue to direct efforts and funding support for the collection and preservation of specimens across time, space, and taxonomic diversity with sufficient sample sizes, metadata, and breadth to ensure maximum impact across multiple disciplines (Brooks et al., 2011; Ward et al., 2015; Schmitt et al., 2018). There is still much work to be done in the field of museomics and the forthcoming years will surely offer astonishing results, new applications and uses, and even more improvements in methods and technologies.
Data availability statement
The raw data generated for this study can be found in the GenBank under BioProject: PRJNA838631 and under GenBank accession numbers given in Supplementary Table S1.
Ethics statement
Ethical review and approval were not required for the animal study because we exclusively used museum specimens deposited in scientific collections. All destructive sampling requests of the museum specimens used in this study were approved by the destructive sampling committee of those museums. We also used publicly available data on GenBank.
Author contributions
SC-R, CE, and JM secured funding and designed the study. SC-R and MH performed the specimen sampling. SC-R conducted the lab experiments, analyzed and archived the data, produced the figures, and wrote the manuscript with contributions from all co-authors. All authors read and approved the submitted version.
Funding
SC-R received a fellowship from Smithsonian-Mason School of Conservation and George Mason University. Research funding was provided by the Center for Conservation Genomics, Smithsonian Conservation Biology Institute, Smithsonian-Mason School of Conservation, and George Mason University. This article was funded in part by the George Mason University Libraries Open Access Publishing Fund.
Acknowledgments
We specially thank the specimen collectors, collection managers, curators and all museum staff of the Museum of Texas Tech University (TTU) and the Smithsonian Institution’s National Museum of Natural History (NMNH) that granted the destructive sampling of museum specimens and provided tissue sample loans.
Conflict of interest
The authors declare that the research was conducted in the absence of any commercial or financial relationships that could be construed as a potential conflict of interest.
Publisher’s note
All claims expressed in this article are solely those of the authors and do not necessarily represent those of their affiliated organizations, or those of the publisher, the editors and the reviewers. Any product that may be evaluated in this article, or claim that may be made by its manufacturer, is not guaranteed or endorsed by the publisher.
Supplementary material
The Supplementary Material for this article can be found online at: https://www.frontiersin.org/articles/10.3389/fevo.2022.930356/full#supplementary-material
Footnotes
- ^ https://www.iczn.org/the-code/the-code-online/
- ^ https://blast.ncbi.nlm.nih.gov/Blast.cgi
- ^ https://github.com/faircloth-lab/phyluce
- ^ https://github.com/FelixKrueger/TrimGalore
- ^ https://github.com/faircloth-lab/uce-probe-sets
- ^ https://doi.org/10.25572/SIHPC
- ^ https://github.com/Tagliacollo/PFinderUCE-SWSC-EN
- ^ https://github.com/campanam/uce2speciestree
- ^ www.bioinformatics.babraham.ac.uk/projects/fastqc
- ^ https://www.geneious.com
- ^ http://tree.bio.ed.ac.uk/software/figtree/
References
Abreu-Jr, E. F., Pavan, S. E., Tsuchiya, M. T. N., Wilson, D. E., Percequillo, A. R., and Maldonado, J. E. (2020). Museomics of Neotropical tree squirrels: A dense taxon sampling of mitogenomes shakes the squirrel tree and suggests deep changes on their taxonomy. BMC Evol. Biol. 20:77 doi: 10.1186/s12862-020-01639-y
Andrews, S. (2010). FastQC: A quality control tool for high throughput sequence data. Available online at: http://www.bioinformatics.babraham.ac.uk/projects/fastqc
Arellano, E., González-Cozátl, F. X., and Rogers, D. S. (2005). Molecular systematics of Middle American harvest mice Reithrodontomys (Muridae), estimated from mitochondrial cytochrome b gene sequences. Mol. Phylogenet. Evol. 37, 529–540. doi: 10.1016/j.ympev.2005.07.021
Bailey, S. E., Mao, X., Struebig, M., Tsagkogeorga, G., Csorba, G., Heaney, L. R., et al. (2016). The use of museum samples for large-scale sequence capture: A study of congeneric horseshoe bats (family Rhinolophidae). Biol. J. Linn. Soc. 117, 58–70. doi: 10.1111/bij.12620
Bi, G. (2017). The complete mitochondrial genome of northern grasshopper mouse (Onychomys leucogaster). Mitochondrial DNA B Resour. 2, 393–394. doi: 10.1080/23802359.2017.1347905
Bi, K., Linderoth, T., Singhal, S., Vanderpool, D., Patton, J. L., Nielsen, R., et al. (2019). Temporal genomic contrasts reveal rapid evolutionary responses in an alpine mammal during recent climate change. PLoS Genet. 15:e1008119. doi: 10.1371/journal.pgen.1008119
Bi, K., Linderoth, T., Vanderpool, D., Good, J. M., Nielsen, R., and Moritz, C. (2013). Unlocking the vault: Next-generation museum population genomics. Mol. Ecol. 22, 6018–6032. doi: 10.1111/mec.12516
Bouckaert, R., Vaughan, T. G., Barido-Sottani, J., Duchêne, S., Fourment, M., Gavryushkina, A., et al. (2019). BEAST 2.5: An advanced software platform for Bayesian evolutionary analysis. PLoS Comput. Biol. 15:e1006650. doi: 10.1371/journal.pcbi.1006650
Bradley, R. D., Bradley, L. C., Garner, H. J., and Baker, R. J. (2014). Assessing the value of natural history collections and addressing issues regarding long-term growth and care. BioScience 64, 1150–1158. doi: 10.1093/biosci/biu166
Bradley, R. D., Durish, N., Rogers, D., Millar, J., Engstrom, M., and Kilpatrick, W. (2007). Toward a molecular phylogeny for Peromyscus: Evidence from mitochondrial cytochrome-b sequences. J. Mammal. 88, 1146–1159. doi: 10.1644/06-mamm-a-342r.1
Bradley, R. D., Francis, J. Q., Platt, R. N. I. I., Soniat, T. J., Alvarez, D., and Lindsey, L. (2019). Mitochondrial DNA sequence data indicate evidence for multiple species within Peromyscus maniculatus. Special publications, Museum of Texas, Vol. 70. Lubbock, TX: Museum of Texas Tech University, 1–68.
Bradley, R. D., Mendez-Harclerode, F., Hamilton, M. J., and Ceballos, G. (2004). A new species of Reithrodontomys from Guerrero, Mexico. Occas. Pap. Mus. Texas Tech Univ. 231, 1–12.
Brooks, S. J., Fenberg, P. B., Glover, A. G., James, G. E., Johnson, K. G., Lister, K. G., et al. (2011). Natural history collections as sources of long-term datasets. Trends Ecol. Evol. 26, 153–154. doi: 10.1016/j.tree.2010.12.009
Buerki, S., and Baker, W. J. (2016). Collections-based research in the genomic era. Biol. J. Linn. Soc. 117, 5–10. doi: 10.1111/bij.12721
Campana, M. G. (2019). uce2speciestree. Available online at: https://github.com/campanam/uce2speciestree
Campana, M. G., Hawkins, M. T. R., and Caballero, S. (2021). Editorial: Assessing biodiversity in the phylogenomic era. Front. Ecol. Evol. 9:803188. doi: 10.3389/fevo.2021.803188
Carleton, M. D. (1980). Phylogenetic relationships in neotominae-peromyscine rodents (Muroidea) and a reappraisal of the dichotomy with New World Cricetinae. Misc. Publ. Mus. Zool. Univ. Mich. 146, 1–43.
Carleton, M. D. (1989). “Systematics and evolution,” in Advances in the study of Peromyscus (Rodentia), eds G. L. Kirkland and J. Layne (Lubbock, TX: Texas Tech University Press), 7–141.
Castañeda-Rico, S., León-Paniagua, L., Edwards, C. W., and Maldonado, J. E. (2020). Ancient DNA from museum specimens and next generation sequencing help resolve the controversial evolutionary history of the critically endangered puebla deer mouse. Front. Ecol. Evol. 8:94. doi: 10.3389/fevo.2020.00094
Castañeda-Rico, S., León-Paniagua, L., Vázquez-Domínguez, E., and Navarro-Sigüenza, A. G. (2014). Evolutionary diversification and speciation in rodents of the Mexican lowlands: The Peromyscus melanophrys species group. Mol. Phylogenet. Evol. 70, 454–463. doi: 10.1016/j.ympev.2013.10.004
Castresana, J. (2000). Selection of conserved blocks from multiple alignments for their use in phylogenetic analysis. Mol. Biol. Evol. 17, 540–552. doi: 10.1093/oxfordjournals.molbev.a026334
Ceballos, G., Arroyo-Cabrales, J., and Ponce, E. (2010). Effects of Pleistocene environmental changes on the distribution and community structure of the mammalian fauna of Mexico. Quat. Res. 73, 464–473. doi: 10.1016/j.yqres.2010.02.006
Ceballos, G., Ehrlich, P. R., and Raven, P. H. (2020). Vertebrates on the brink as indicators of biological annihilation and the sixth mass extinction. Proc. Natl. Acad. Sci. U.S.A. 117, 13596–13602. doi: 10.1073/pnas.1922686117
Cong, Q., Shen, J., Zhang, J., Li, W., Kinch, L. N., Calhoun, J. V., et al. (2021). Genomics reveals the origins of historical specimens. Mol. Biol. Evol. 38, 2166–2176. doi: 10.1093/molbev/msab013
Cornejo-Latorre, C., Cortés-Calva, P., and Álvarez-Castañeda, S. T. (2017). The evolutionary history of the subgenus Haplomylomys (Cricetidae: Peromyscus). J. Mammal. 98, 1627–1640. doi: 10.1093/jmammal/gyx107
Dalquest, W. W. (1962). The good creek formation, Pleistocene of Texas, and its fauna. J. Paleontol. 36, 568–582.
Darriba, D., Taboada, G. L., Doallo, R., and Posada, D. (2012). jModelTest 2: More models, new heuristics and parallel computing. Nat. Methods 9:772. doi: 10.1038/nmeth.2109
Dawson, W. (2005). “Peromyscine biogeography, Mexican topography and pleistocene climatology,” in Contribuciones Mastozoológicas en Homenaje a Bernardo Villa, eds V. Sánchez-Cordero and R. Medellín (México: UNAM- CONABIO), 145–156.
Dussex, N., von Seth, K., Knapp, M., Kardailsky, O., Robertson, B. C., and Dalén, L. (2019). Complete genomes of two extinct New Zealand passerines show responses to climate fluctuations but no evidence for genomic erosion prior to extinction. Biol. Lett. 15:20190491. doi: 10.1098/rsbl.2019.0491
Eisenberg, J. F. (1989). Mammals of the Neotropics: The Northern Neotropics, Vol. 1. Chicago, IL: University of Chicago Press.
Erixon, P., Svennblad, B., Britton, T., and Oxelman, B. (2003). Reliability of Bayesian posterior probabilities and bootstrap frequencies in phylogenetics. Syst. Biol. 52, 665–673.
Faircloth, B. C. (2013). Illumiprocessor: A Trimmomatic wrapper for parallel adapter and quality trimming. doi: 10.6079/J9ILL
Faircloth, B. C. (2016). PHYLUCE is a software package for the analysis of conserved genomic loci. Bioinformatics 32, 786–788. doi: 10.1093/bioinformatics/btv646
Faircloth, B. C., McCormack, J. E., Crawford, N. G., Harvey, M. G., Brumfield, R. T., and Glenn, T. C. (2012). Ultraconserved elements anchor thousands of genetic markers spanning multiple evolutionary timescales. Syst. Biol. 61, 717–726. doi: 10.1093/sysbio/sys004
Ferrusquía-Villafranca, I., Arroyo-Cabrales, J., Martínez-Hernández, E., Gama-Castro, J., Ruíz-González, J., Polaco, O., et al. (2010). Pleistocene mammals of Mexico: A critical review of regional chronofaunas, climate change response and biogeographic provinciality. Quat. Res. 217, 53–104. doi: 10.1016/j.quaint.2009.11.036
Grabherr, M. G., Haas, B. J., Yassour, M., Levin, J. Z., Thompson, D. A., Amit, I., et al. (2011). Full-length transcriptome assembly from RNA-seq data without a reference genome. Nat. Biotechnol. 29, 644–652. doi: 10.1038/nbt.1883
Guindon, S., and Gascuel, O. (2003). A simple, fast and accurate method to estimate large phylogenies by maximum-likelihood. Syst. Biol. 52, 696–704. doi: 10.1080/10635150390235520
Hawkins, M. T. R., Leonard, J., Helgen, K. M., McDonough, M. M., Rockwood, L. L., and Maldonado, J. E. (2016). Evolutionary history of endemic Sulawesi squirrels constructed from UCEs and mitogenomes sequenced from museum specimens. BMC Evol. Biol. 16:80. doi: 10.1186/s12862-016-0650-z
Heled, J., and Drummond, A. J. (2012). Calibrated tree priors for relaxed phylogenetics and divergence time estimation. Syst. Biol. 61, 138–149. doi: 10.1093/sysbio/syr087
Holmes, M. W., Hammond, T. T., Wogan, G. O. U., Walsh, R. E., Labarbera, K., Wommack, E. A., et al. (2016). Natural history collections as windows on evolutionary processes. Mol. Ecol. 25, 864–881. doi: 10.1111/mec.13529
Hooper, E. T. (1952). A systematic review of the harvest mice (genus Reithrodontomys) of Latin America. Misc. Publ. Mus. Zool. Univ. Mich. 77, 1–255.
Hooper, E. T., and Musser, G. G. (1964). Notes on classification of the rodent genus Peromyscus. Occas. Pap. Mus. Zool. Univ. Mich. 635, 1–13.
Hope, A. G., Sandercock, B. K., and Malaney, J. L. (2018). Collection of scientific specimens: Benefits for biodiversity sciences and limited impacts on communities of small mammals. BioScience 68, 35–42. doi: 10.1093/biosci/bix141
Huelsenbeck, J. P., and Ronquist, F. (2001). MRBAYES: Bayesian inference of phylogeny. Bioinformatics 17, 754–755. doi: 10.1093/bioinformatics/17.8.754
Joìnsson, H., Ginolhac, A., Schubert, M., Johnson, P., and Orlando, L. (2013). mapDamage2.0: Fast approximate Bayesian estimates of ancient DNA damage parameters. Bioinformatics 13, 1682–1684. doi: 10.1093/bioinformatics/btt193
Karow, P. F., Morgan, G. S., Portell, R. W., Simmons, E., and Auffenberg, K. (1996). “Middle Pleistocene (early Rancholabrean) vertebrates and associated marine and non-marine invertebrates from Oldsmar, Pinellas County, Florida,” in Palaeoecology and palaeoenvironments of Late Cenozoic mammals: Tributes to the career of C. S. (Rufus) Churcher, eds K. Stewart and K. Seymour (Toronto, ON: University of Toronto Press), 97–133.
Karwacki, E. E., Martin, K. R., and Savage, A. E. (2021). One hundred years of infection with three global pathogens in frog populations of Florida, USA. Biol. Conserv. 257:109088. doi: 10.1016/j.biocon.2021.109088
Katoh, K., and Standley, D. M. (2013). MAFFT multiple sequence alignment software version 7: Improvements in performance and usability. Mol. Biol. Evol. 30, 772–780. doi: 10.1093/molbev/mst010
Kehlmaier, C., Zhang, X., Georges, A., Campbell, P. D., Thomson, S., and Fritz, U. (2019). Mitogenomics of historical type specimens of Australasian turtles: Clarification of taxonomic confusion and old mitochondrial introgression. Sci. Rep. 9:5841. doi: 10.1038/s41598-019-42310-x
Lanfear, R., Frandsen, P. B., Wright, A. M., Senfeld, T., and Calcott, B. (2016). PartitionFinder 2: New methods for selecting partitioned models of evolution for molecular and morphological phylogenetic analyses. Mol. Biol. Evol. 34, 772–773. doi: 10.1093/molbev/msw260
Le Conte, J. (1853). Descriptions of three new species of American arvicolae, with remarks upon some other American rodents. Proc. Acad. Nat. Sci. Philos. 5, 404–420.
Lyra, M. L., Lourenço, A. C. C., Pinheiro, P. D. P., Pezzuti, T. L., Baêta, D., Barlow, A., et al. (2020). High-throughput DNA sequencing of museum specimens sheds light on the long-missing species of the Bokermannohyla claresignata group (Anura: Hylidae: Cophomantini). Zool. J. Linnean Soc. 190, 1235–1255. doi: 10.1093/zoolinnean/zlaa033
Martin, P. S., and Klein, R. G. (eds) (1984). Quaternary extinctions. Tucson, AZ: University of Arizona Press.
Martínez-Borrego, D., Arellano, E., González-Cózatl, F. X., Castro-Arellano, I., León-Paniagua, L., and Rogers, D. S. (2022). Molecular systematics of the Reithrodontomys tenuirostris group (Rodentia: Cricetidae) highlighting the Reithrodontomys microdon species complex. J. Mammal. 103, 29–44. doi: 10.1093/jmammal/gyab133
McDonough, M. M., Ferguson, A. W., Dowler, R. C., Gompper, M. E., and Maldonado, J. E. (2022). Phylogenomic systematics of the spotted skunks (Carnivora, Mephitidae, Spilogale): Additional species diversity and Pleistocene climate change as a major driver of diversification. Mol. Phylogenet. Evol. 167:107266. doi: 10.1016/j.ympev.2021.107266
McDonough, M. M., Parker, L. D., Rotzel, N., Campana, M. G., and Maldonado, J. E. (2018). Performance of commonly requested destructive museum samples for mammalian genomic studies. J. Mammal. 99, 789–802. doi: 10.1093/jmammal/gyy080
McGuire, J. A., Cotoras, D. D., O’Conell, B., Lawalata, S. Z. S., Wang-Claypool, C. Y., Stubbs, A., et al. (2018). Squeezing water from a stone: High-throughput sequencing from a 145-year old holotype resolves (barely) a cryptic species problem in flying lizards. PeerJ 6:e4470. doi: 10.7717/peerj.4470
Merriam, C. H. (1898). Descriptions of twenty new species and a subgenus of Peromyscus from Mexico and Guatemala. Proc. Biol. Soc. Washington 12, 115–125.
Meyer, M., and Kircher, M. (2010). Illumina sequencing library preparation for highly multiplexed target capture and sequencing. Cold Spring Harb. Protoc. 2010:pdb.rot5448. doi: 10.1101/pdb.prot5448
Miller, J. R., and Engstrom, M. D. (2008). The relationships of major lineages within peromyscine rodents: A molecular phylogenetic hypothesis and systematic reappraisal. J. Mammal. 89, 1279–1295. doi: 10.1644/07-mamm-a-195.1
Minteer, B. A., Collins, J. P., Love, K. E., and Puschendorf, R. (2014). Avoiding (Re)extinction. Science 344, 260–261. doi: 10.1126/science.1250953
Musser, G., and Carleton, M. D. (1993). “Family Muridae,” in Mammal species of the world: A taxonomic and geographic reference, eds D. E. Wilson and M. Reeder (Washington DC: Smithsonian Institution Press), 501–755.
Musser, G., and Carleton, M. D. (2005). “Superfamily Muridae,” in Mammal species of the world: A taxonomic and geographic reference, eds D. E. Wilson and M. Reeder (Baltimore, MD: Johns Hopkins University Press), 894–1531.
Nakamura, T., Yamada, K. D., Tomii, K., and Katoh, K. (2018). Parallelization of MAFFT for large-scale multiple sequence alignments. Bioinformatics 34, 2490–2492. doi: 10.1093/bioinformatics/bty121
Osgood, W. (1909). Revision of the mice of the American genus Peromyscus. North Am. Fauna 28, 1–285. doi: 10.3996/nafa.28.0001
Platt, R. N. II, Amman, A. M., Keith, M. S., Thompson, C. W., and Bradley, R. D. (2015). What is Peromyscus? Evidence from nuclear and mitochondrial DNA sequences suggests the need for a new classification. J. Mammal. 96, 708–719. doi: 10.1093/jmammal/gyv067
Prosser, S. W., Dewaard, J. R., Miller, S. E., and Hebert, P. D. N. (2016). DNA barcodes from century-old type specimens using next-generation sequencing. Mol. Ecol. Resour. 16, 487–497. doi: 10.1111/1755-0998.12474
Rambaut, A., Drummond, A. J., Xie, D., Baele, G., and Suchard, M. A. (2018). Posterior summarization in Bayesian phylogenetics using Tracer 1.7. Syst. Biol. 67, 901–904. doi: 10.1093/sysbio/syy032
Raxworthy, C. J., and Smith, B. T. (2021). Mining museums for historical DNA: Advances and challenges in museomics. Trends Ecol. Evol. 36, 1049–1060. doi: 10.1016/j.tree.2021.07.009
Remsen, J. V. (1995). The importance of continued collecting of bird specimens to ornithology and bird conservation. Bird Conserv. Int. 5, 145–180. doi: 10.1017/S095927090000099X
Reyes-Velasco, J., Goutte, S., Freilich, X., and Boissinot, S. (2021). Mitogenomics of historical type specimens clarifies the taxonomy of Ethiopian Ptychadena Boulenger, 1917 (Anura, Ptychadenidae). ZooKeys 1070, 135–149. doi: 10.3897/zookeys.1070.66598
Rohland, N., and Reich, D. (2012). Cost-effective, high-throughput DNA sequencing libraries for multiplexed target capture. Genome Res. 22, 939–946. doi: 10.1101/gr.128124.111
Ronquist, F., and Huelsenbeck, J. P. (2003). MRBAYES 3: Bayesian phylogenetic inference under mixed models. Bioinformatics 19, 1572–1574. doi: 10.1093/bioinformatics/btg180
Roos, C., Portela Miguez, R., Sabin, R., Louis, E. E. Jr., Hofreiter, M., and Zinner, D. (2021). Mitogenomes of historical type specimens unravel the taxonomy of sportive lemurs (Lepilemur spp.) in Northwest Madagascar. Zool. Res. 42, 428–432. doi: 10.24272/j.issn.2095-8137.2021.157
Roycroft, E., MacDonald, A. J., Moritz, C., and Rowe, K. C. (2021). Museum genomics reveals the rapid decline and extinction of Australian rodents since European settlement. Proc. Natl. Acad. Sci. U.S.A. 118:e2021390118. doi: 10.1073/pnas.2021390118
Rubi, T. L., Knowles, L. L., and Dantzer, B. (2020). Museum epigenomics: Characterizing cytosine methylation in historic museum specimens. Mol. Ecol. Resour. 20, 1161–1170. doi: 10.1111/1755-0998.13115
Sayyari, E., and Mirarab, S. (2016). Fast coalescent-based computation of local branch support from quartet frequencies. Mol. Biol. Evol. 33, 1654–1668. doi: 10.1093/molbev/msw079
Schmieder, R., and Edwards, R. (2011). Quality control and preprocessing of metagenomic datasets. Bioinformatics 27, 863–864. doi: 10.1093/bioinformatics/btr026
Schmitt, C. J., Cook, J. A., Zamudio, K. R., and Edwards, S. V. (2018). Museum specimens of terrestrial vertebrates are sensitive indicators of environmental change in the Anthropocene. Philoss. Trans. R. Soc. B 374:20170387. doi: 10.1098/rstb.2017.0387
Shepherd, L. D., and Lambert, D. M. (2008). Ancient DNA and conservation: Lessons from the endangered kiwi of New Zealand. Mol. Ecol. 17, 2174–2184. doi: 10.1111/j.1365-294X.2008.03749.x
Stamatakis, A. (2014). RAxML Version 8: A tool for phylogenetic analysis and post-analysis of large phylogenies. Bioinformatics 30, 1312–1313. doi: 10.1093/bioinformatics/btu033
Steppan, S., and Schenk, J. J. (2017). Muroid rodent phylogenetics: 900-species tree reveals increasing diversification rates. PLoS One 12:e0183070. doi: 10.1371/journal.pone.0183070
Sullivan, J., Arellano, E., and Rogers, D. S. (2000). Comparative phylogeography of Mesoamerican highland rodents: Concerted versus independent response to past climatic fluctuations. Am. Nat. 155, 755–786. doi: 10.1086/303362
Sullivan, K. A. M., Platt, R. N. I. I., Bradley, R. D., and Ray, D. A. (2017). Whole mitochondrial genomes provide increased resolution and indicate paraphyly in deer mice. BMC Zool. 2:11. doi: 10.1186/s40850-017-0020-3
Tagliacollo, V. A., and Lanfear, R. (2018). Estimating improved partitioning schemes for ultraconserved elements. Mol. Biol. Evol. 35, 1798–1811. doi: 10.1093/molbev/msy069
Talavera, G., and Castresana, J. (2007). Improvement of phylogenies after removing divergent and ambiguously aligned blocks from protein sequence alignments. Syst. Biol. 56, 564–577. doi: 10.1080/10635150701472164
Ward, D. F., Leschen, R. A. B., and Buckley, T. R. (2015). More from ecologists to support natural history museums. Trends Ecol. Evol. 30, 373–374. doi: 10.1016/j.tree.2015.04.015
Wright, E. A., Roberts, E. K., Evans, C. L., Schmidly, D. J., and Bradley, R. D. (2020). Evidence from mitochondrial DNA sequences suggest a recent origin for Peromyscus truei comanche. Occas. Pap. Tex. Tech Univ. Mus. 367, 1–19.
Yuan, S. C., Malekos, E., Cuellar-Gempeler, C., and Hawkins, M. T. R. (2022). Population genetic analysis of the Humboldt’s flying squirrel using high-throughput sequencing. J. Mammal. 103, 287–302. doi: 10.1093/jmammal/gyac002
Keywords: historical DNA, genomics, mitogenomes, Peromyscus mekisturus, type specimen, ultraconserved elements
Citation: Castañeda-Rico S, Edwards CW, Hawkins MTR and Maldonado JE (2022) Museomics and the holotype of a critically endangered cricetid rodent provide key evidence of an undescribed genus. Front. Ecol. Evol. 10:930356. doi: 10.3389/fevo.2022.930356
Received: 27 April 2022; Accepted: 09 September 2022;
Published: 03 October 2022.
Edited by:
Jonathan J. Fong, Lingnan University, ChinaReviewed by:
Andreanna J. Welch, Durham University, United KingdomMariana Lyra, São Paulo State University, Campus Rio Claro, Brazil
Copyright © 2022 Castañeda-Rico, Edwards, Hawkins and Maldonado. This is an open-access article distributed under the terms of the Creative Commons Attribution License (CC BY). The use, distribution or reproduction in other forums is permitted, provided the original author(s) and the copyright owner(s) are credited and that the original publication in this journal is cited, in accordance with accepted academic practice. No use, distribution or reproduction is permitted which does not comply with these terms.
*Correspondence: Susette Castañeda-Rico, susetteazul@gmail.com; castanedaricos@si.edu