Spatiotemporal Variations of Human Pressure on Key Biodiversity Areas in the Qinghai–Tibet Plateau: A Comparative Analysis
 Yuxi Zeng
  Ling-en Wang
- Institute of Geographic Sciences and Natural Resources Research, Chinese Academy of Sciences, Beijing, China
A key biodiversity area (KBA) is one of the important emerging area-based conservation measures that is being implemented recently in China; however, the human pressure faced by a KBA is still unclear. This study analyzed the spatiotemporal variation of human pressure on KBAs from 1990 to 2017 and compared it with the human pressure on national natural reserves (NNRs) through a case study of the Qinghai–Tibet Plateau. In addition, changes in the trend of human pressure before and after 2010 were analyzed to examine the influence of conservation policies on human pressure. Results showed that human pressure on KBAs and NNRs gradually increased from 1990 to 2017. Furthermore, the growth rates and mean values of human pressure in KBAs were higher than those in NNRs. After the implementation of conservation policies in 2010, the growth rates of human pressure on both KBAs and NNRs have significantly slowed, and the areas with negative growth in both KBAs and NNRs have gradually expanded. In addition to providing an understanding of the changing spatiotemporal trends of human pressure on KBAs, this study can serve as a reference to formulate policies for the improvement of the effectiveness of conservation.
Introduction
The negative effects of ecosystem degradation on social geographic sustainability have triggered ambitious targets for ecosystem conservation at the national, regional, and global levels (Strassburg et al., 2020). Protected areas (PAs), which are legally designated and managed for long-term nature conservation, have been widely adopted for ecosystem conservation by governments, policymakers, and many members of the conservation community (Maxwell et al., 2020). Although PAs have become the major means of area-based conservation, research shows that the existing global network of PAs is insufficient to prevent the continuing depletion of biodiversity (Pringle, 2017).
Key biodiversity areas (KBAs) were promoted as a type of “other effective area-based conservation measure” (Donald et al., 2019) by the International Union for Conservation of Nature (IUCN) since 2016, which acts as a means to identify “sites of importance for the global persistence of biodiversity” (International Union for Conservation of Nature [IUCN], 2016). Encompassing considerable populations of species and rich ecosystems of high conservation concern, KBAs not only provide habitats for wildlife, but also various ecosystem services (Shrestha et al., 2021). Using KBAs to guide the effective expansion of the global PA network has become an important issue (Kullberg et al., 2019).
To date, over 15,000 KBAs have been identified (83.1% of which are important bird areas—the avian subset of KBAs; BirdLife International, 2019). However, the introduction of KBAs has been slow in the developing world (Shrestha et al., 2021). For example, only 25% of KBAs identified in Myanmar are legally protected (Wildlife Conservation Society, 2013). As a developing country, China introduced this measure in 2019 and it is in its initial stage of KBA identification and management (Li, 2021). Furthermore, China intends to reform its natural conservation system, which was formed in 1956 (Ma et al., 2019). This reform aims to transfer the core of natural conservation systems from natural reserves to national parks. This is expected to improve conservation effectiveness by adjusting the spatial scope of conservation areas and institutional mechanisms (General Office of the CPC Central Committee, and General Office of the State Council of China, 2019), which provides opportunities for KBAs to be incorporated into the Chinese official conservation plan.
Due to the lack of official guidance and long-term protective action, some KBAs have been exposed to high levels of human pressure (Jonas et al., 2014; Alves-Pinto et al., 2021). Donald et al. (2019) studied ten countries (Australia, Bolivia, Canada, Ecuador, India, Indonesia, Kazakhstan, Kenya, Philippines, and South Africa) and revealed that unprotected KBAs occur in areas with significantly higher human population density and on flatter land, where pressure on natural resources may be higher. The likelihood of the skies of a KBA experiencing skyglow tends to increase in countries with a higher gross domestic product (GDP), and in areas with a higher human population density (Garrett et al., 2020). Consequently, ongoing and accelerating threats (e.g., introduction of invasive species, habitat loss and fragmentation, and water abstraction) lead to rapid extirpation of species inside the KBAs (Nogueira et al., 2021). China has experienced rapid economic growth and urbanization over the past few decades. From 1990 to 2019, the urban built-up area of China increased from 12,200 to 60,300 km2 (National Bureau of Statistics of China [NBSC], 2020), thereby exerting considerable stress on the ecosystem (Xie et al., 2021). Moreover, attempts to estimate human pressure on KBAs in China have been lacking, and urgent examination of the spatiotemporal pattern of human pressure on KBAs is necessary.
A case study of the Qinghai–Tibet Plateau was performed to analyze the spatiotemporal variations in human pressure on KBAs between 1990 and 2017. The Qinghai–Tibet Plateau is one of the national eco-safety barriers of China (National Development and Reform Commission of China [NDRC], and Ministry of Natural Resources of China [MNRC], 2020), and it has high ecological importance and vulnerability. Existing studies have found high-intensity human activities in national natural reserves (NNRs) in the Qinghai–Tibet Plateau (Hua et al., 2022), which emphasizes the urgency of adjusting area-based conservation management. The Chinese government put forward a series of policies around 2010 to protect the ecosystem of the Qinghai–Tibet Plateau. These include the Plan for Tibet Ecological Security Barrier Protection and Construction (2008–2030) and the Plan for Ecological Construction and Environmental Protection in the Qinghai–Tibet Plateau (2011–2030). Previous studies have shown that these conservation policies have had a positive effect on the ecological restoration of the Qinghai–Tibet Plateau (Li et al., 2021c). However, the effects of these policies on KBAs have not been reported. This study focuses on KBAs in the Qinghai–Tibet Plateau and compares them with NNRs, and aims to answer two questions: (i) Have KBAs suffered more human pressure than NNRs, and (ii) Have previous conservation policies led to changes in human pressure on KBAs and NNRs in the Qinghai–Tibet Plateau? What is the difference between these changes in KBAs and NNRs?
Human Pressure on the Qinghai–Tibet Plateau
In order to measure the pressure on ecosystems caused by human activities, it is necessary to understand the types of human activities that negatively affect ecosystems (Mu et al., 2022). According to existing studies, negative impacts of human activities on the Qinghai–Tibet Plateau ecosystems are mainly caused by population concentration, economic growth, agriculture and animal husbandry, urbanization, and construction of transportation facilities (Chen et al., 2015; Tian and Chen, 2022).
Population Density
In areas with large populations, the frequency and intensity of human disturbance to the ecosystem tends to be higher (Luo et al., 2021; Tian and Chen, 2022; Yu et al., 2022). From 1990 to 2015, the total population of the Qinghai–Tibet Plateau increased from 6.58 to 9.13 million (Bao and Liu, 2019). Increased human activity alters the natural succession direction of ecosystems by changing species richness, accelerating biodiversity loss, and discharging wastewater, gas, and solids into the environment, which has far-reaching impacts on ecosystems (Mottl et al., 2021; Pavlik et al., 2021). In this study, areas with a greater population density often suffered more pressure.
Economic Development
Following the environmental Kuznets curve, economic growth intensifies environmental pollution before the economic growth (indicated by per capita GDP) reaches a turning point (Zhao et al., 2021). Considering that environmental pollution is a major contributor to ecosystem degradation (Wang et al., 2021), it can be deduced that a high level of economic development will exert greater pressure on the ecosystem before the turning point. Yu et al. (2016) revealed that China will not approach the turning point until 2025, and the Qinghai–Tibet Plateau is still in the ascending stage of the Environmental Kuznets Curve. Therefore, areas with a high level of economic development in the Qinghai–Tibet Plateau are subjected to more human pressure.
Human-Managed Land Use
Land use is a typical form of human action on terrestrial surfaces, which affects ecosystems by disturbing the matter cycle and energy exchange between various layers of the Earth (de Queiroz et al., 2020). Land use affects the components of the atmosphere and underlying surfaces, changes soil texture, and disturbs water quality, quantity, and cycling (Trentman et al., 2022). Different land use types exert different pressures on ecosystems, with urbanized areas exerting the most. From 1990 to 2015, urban areas of the Qinghai–Tibet Plateau expanded largely, which led to an intensive heat island effect and increased virulent organic pollutants (Bao and Liu, 2019). Agricultural land also puts a large pressure on ecosystems, and agricultural activities cause soil erosion and desertification, which leads to reduction in biodiversity (Polazzo et al., 2022).
Animal Husbandry
Animal husbandry is one of the main sources of livelihood for residents living in the Qinghai–Tibet Plateau, and yaks and Tibetan sheep are the main livestock (Zhuang et al., 2019). The Qinghai–Tibet Plateau is dominated by dynamic and sensitive grassland ecosystems, and husbandry activities can easily cause ecological problems such as soil salinization, desertification, and deep soil drying (Li et al., 2021a,b). Therefore, intense animal husbandry leads to a greater pressure on the ecosystem.
Roads
During road construction, the excavation of roadbeds changes the geological landform, and pavements cause long-term damage to vegetation and aggravate desertification (Trombulak and Frissell, 2000). Road operations also affect animal migration, disturb animal habitat, and lead to changes in the number and structure of ecosystem components (Kroeger et al., 2022). Since 1989, the length and density of roads on the Qinghai–Tibet Plateau have increased considerably, which has resulted in intensified landscape fragmentation and increased ecological pressure (Zhao and Lu, 2017).
Methodology
Study Area
The Qinghai–Tibet Plateau is located in southwestern China (26–40° N, 73–105° E), and originates from the Yangtze, Yellow, and Mekong Rivers, and their water sustains cities and farms across Asia. The Qinghai–Tibet Plateau has a total area of 257 × 104 km2, and accounts for 27% of the Chinese land area, with an average altitude of over 4,000 m.
For decades, 52 NNRs have acted as the cornerstone of conservation practice on the Qinghai–Tibet Plateau, and these have received substantial financial aid from the government (Fu et al., 2021; Liu et al., 2021). However, this plateau has recently been experiencing habitat fragmentation, alien invasion, and local ecosystem degradation (Fu et al., 2021), which indicates that merely protecting NNRs is not sufficient to maintain its ecological health. According to the KBA Partnership program, parts of the Qinghai–Tibet Plateau are covered by KBAs (Figure 1). These KBAs are partially inside NNRs (the overlapping areas occupy 61.86% of KBAs and 63.09% of NNRs), but some are outside NNRs and have no official identification or management.
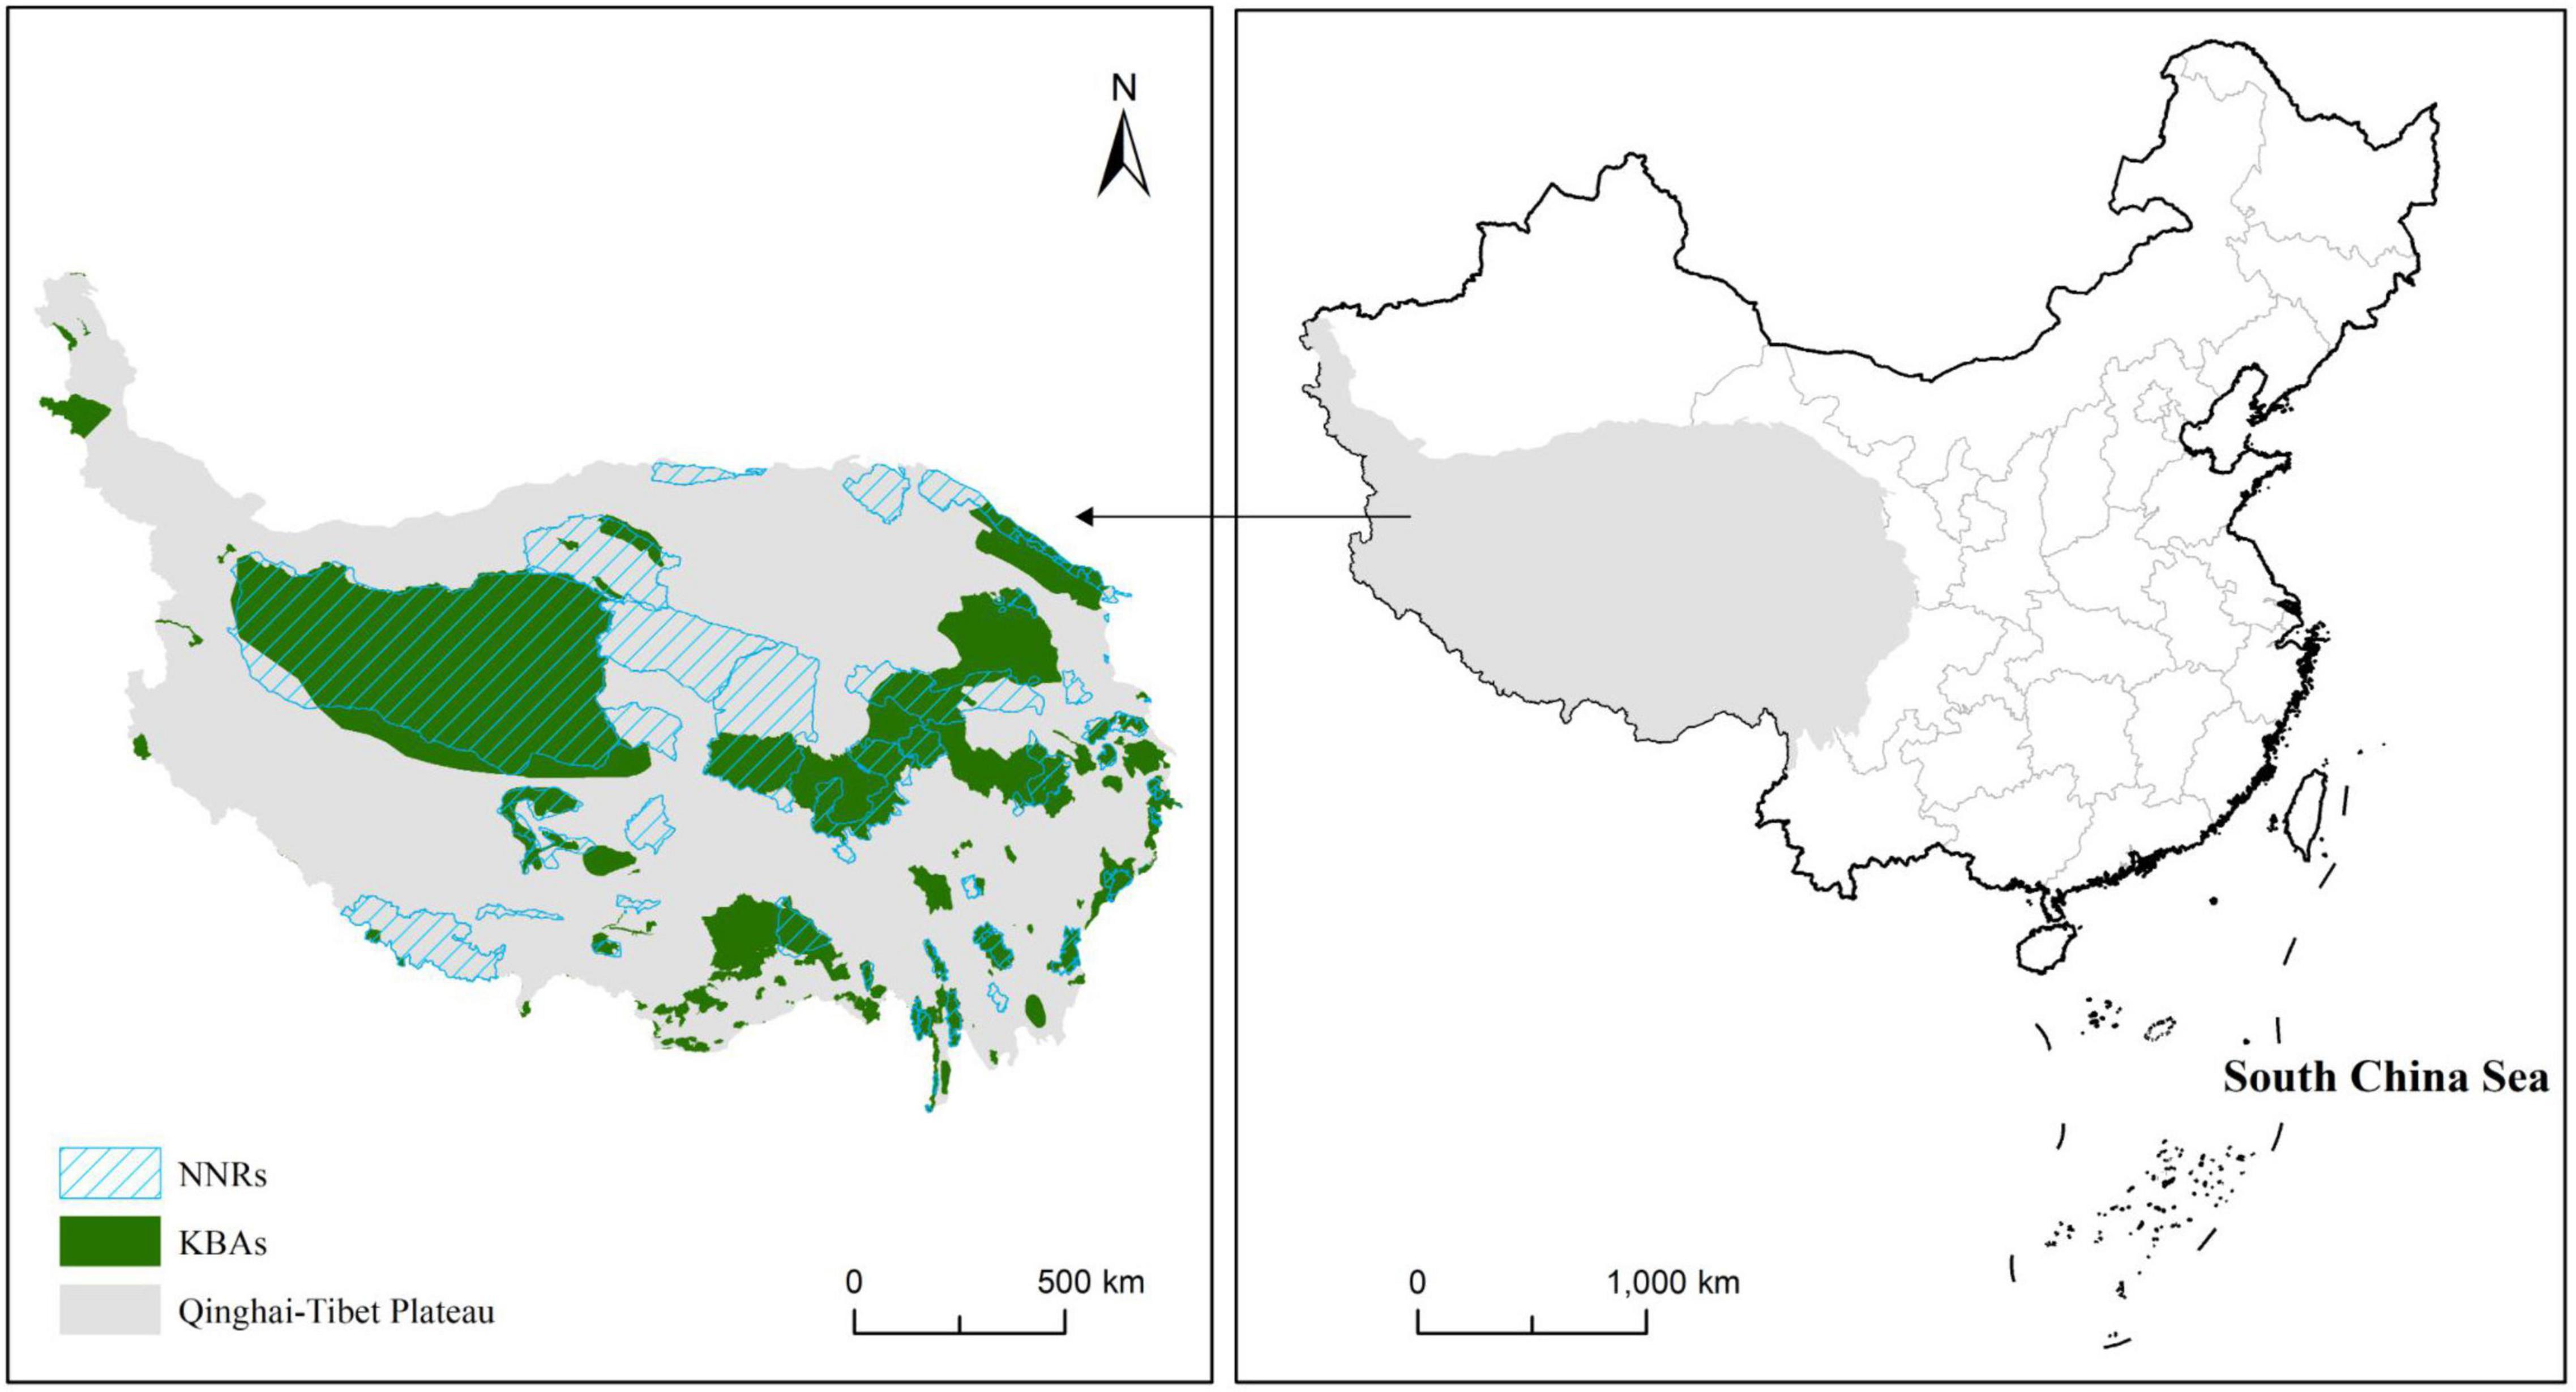
Figure 1. KBAs and NNRs in the Qinghai–Tibet Plateau.
Measuring Human Pressure
Previous studies have developed many composite indices to measure the anthropogenic pressure on ecosystems, such as human activity intensity (Chi et al., 2020; Gosselin and Callois, 2021) and human footprints (Sanderson et al., 2002; Venter et al., 2016; Duan and Luo, 2021). The human footprint index, a dimensionless metric that captures the extent of human influence on the terrestrial surface, is distinct from many land-use metrics in terms of its ability to singularly capture the total influence of human existence on a given location (Keys et al., 2021), and hence, it is widely applied in biodiversity conservation (Venter et al., 2016; Duan and Luo, 2021). This study draws on the method of Duan and Luo (2021) and uses the human footprint index to measure human pressure on each grid inside the KBAs and NNRs in the Qinghai–Tibet Plateau. Human pressure was calculated using the following formula:
where HPi represents the human pressure on grid i, HAij refers to the intensity of a specific pressure type j in grid i, and includes the pressure from population density, economic development, animal husbandry, land use, and roads. According to the value of each pressure type (Table 1), the HPi ranged from 0 (lowest) to 58 (highest).
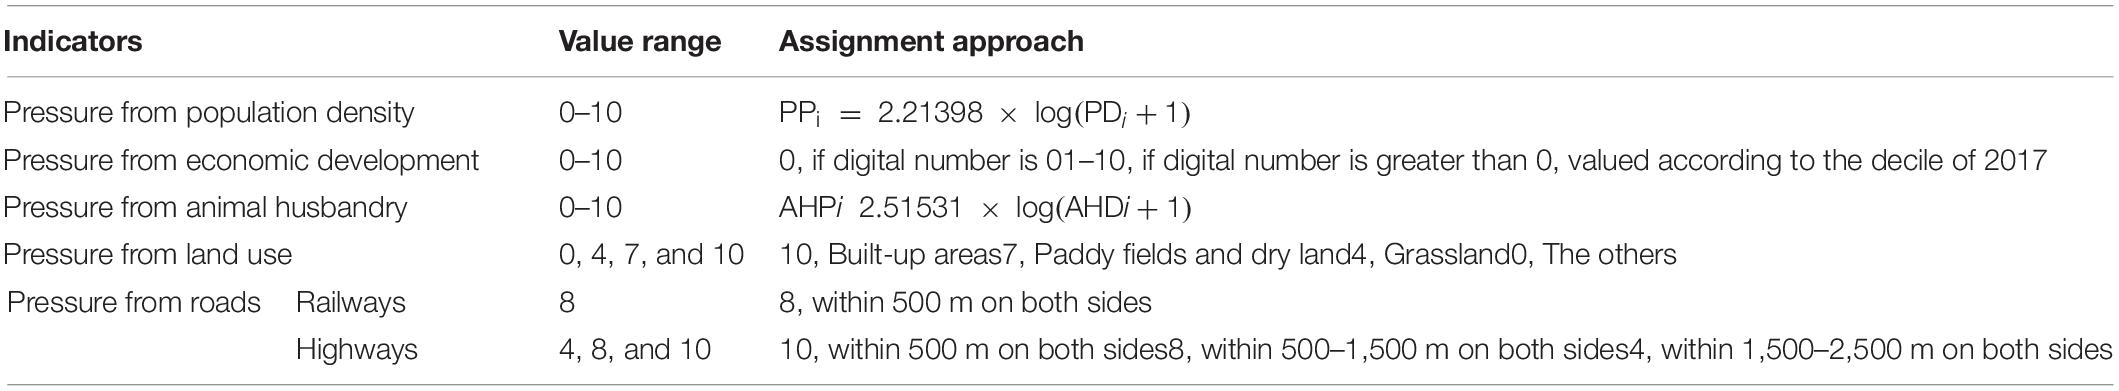
Table 1. Evaluation of each type of pressure.
Pressure From Population Density
According to Duan and Luo (2021), population density data were logarithmically calculated. The population density of 2017 was not available in the original datasets; therefore, this study used the average of 2015 and 2019 as the population density in 2017. According to the original data, the maximum population density is 32,866 people per km2 (the maximum value of PDi is 32,866). Therefore, the equation used for the calculation was constructed as follows:
where PPi represents the pressure intensity from the population density of grid i, which ranges from zero to 10. PDi is the population density of grid i.
Pressure From Economic Development
Nighttime light data, which is considered a robust indicator of regional economic development, was used to reflect the economic development level of the Qinghai–Tibet Plateau (Chen and Zhang, 2020). Since the original nighttime light data only contains data from 1992 to 2013, this study replaced data of 1990 and 2017 with those of 1992 and 2013, respectively. In addition, the original data have discontinuities and oversaturation problems, which must be corrected after projection and cropping are completed. This study used a correction approach based on invariant target areas, which have been widely used in related studies (Zhang et al., 2020). Following Zhang et al. (2020), this study took Hegang City as the invariant target area, since its economic and social data have changed little over the past decades and the digital number of light images is widely distributed in it (Zhang et al., 2020). After forming the nightlight data for each year, values were assigned to each grid. First, 0 points were assigned to the grid, with a digital number equal to 0. Second, the grid was divided into 10 equal parts with a digital number value greater than 0 using the quantile method and assigned a value of 1–10 points in order from small to large (according to the 2017 data). For data of the remaining years, according to the 2017 decile, a grid with a digital number value greater than 0 was assigned a score of 1–10, and a digital number value of 0 was assigned a score of 0.
Pressure From Animal Husbandry
This study used the sum of cattle and sheep densities to represent the intensity of husbandry activities. Since the original spatial data were only in 2006, a trend extrapolation analysis was adopted to obtain a layer of husbandry density for each year (Duan and Luo, 2021). First, beef and mutton production in Qinghai and Tibet were collected in 1990, 2010, and 2017, and the change rates of beef and mutton production in different years relative to 2005 were calculated. Then, the cattle and sheep density layers in 2006 were multiplied by the change rates of each year to obtain the cattle and sheep density layers in different years. The density layers of cattle and sheep in the same year were superimposed to obtain the husbandry density. Husbandry density data were calculated logarithmically according to Duan and Luo (2021). The original data showed that the maximum grazing density was 9,454 head/km2. Thus, the specific equation used for calculations was constructed as follows:
where AHPi represents the pressure intensity from the animal husbandry of grid i ranging from 0 to 10. AHDi is the husbandry density value of grid i.
Pressure From Land Use
This study used the type of land used to reflect ecological pressure from human-managed land. Specifically, built-up areas were assigned 10 points, paddy fields and dry land 7 points, and grasslands 4 points. The others were assigned 0 points (Duan and Luo, 2021).
Pressure From Roads
Railways and highways were used to reflect the pressure of roads on ecosystems. The construction of railways leads to ecosystem disturbance, while train operation has a relatively lower impact (Shen et al., 2004). Thus, only the area within 500 m on both sides of the railway was assigned 8 points. Highway construction and vehicle driving behaviors had a larger impact on both sides. Therefore, the areas within 500 m on both sides of highways were assigned 10 points, those within 500–1,500 m were assigned 8 points and those within 1,500–2,500 m were assigned 4 points. Limited by original data, this study replaced the highway data from 2017 with that from 2018.
Spatial Analysis of Human Pressure
We applied multiple spatial statistical approaches to compare the spatiotemporal changes in human pressure within KBAs and NNRs. First, we compared the mean value of the human footprint and its annual change rate of each unit in KBAs, NNRs, and their overlapping areas during 1990–2017. Second, we classified the area into seven levels according to human pressure: no human pressure (human pressure = 0) and areas with human pressure of ∈ (0, 10), ∈ (10, 20), ∈ (20, 30), (30, 400), ∈ (40, 50), and ∈ (50). We analyzed the proportions of the seven levels in KBAs and NNRs from 1990 to 2017. Third, we used kernel density estimation (Parzen, 1962) to analyze the spatial scale and location changes of aggregation areas with a human pressure of above 10 and those areas under no human pressure from 1990 to 2017.
Analysis of Human Pressure Changes After the Implementation of Conservation Policies
As mentioned in section “Study Area,” many ecological conservation policies have been implemented in the Qinghai–Tibet Plateau since 2010. Therefore, this study compared whether the human pressure within KBAs and NNRs before and after 2010 had a statistically significant variation through a Wilcoxon signed-rank test, which has been widely used in ecological conservation research (Lieb et al., 2021). The Wilcoxon signed-rank test is a nonparametric approach to test whether two groups of values are significantly different. It adds the rank of the absolute value of the difference between the observed value and center position of the null hypothesis according to different signs as its test statistic and does not require the difference between paired data to obey a normal distribution (Gibbons and Chakraborti, 2011).
The specific steps are as follows: first, we calculated the difference (di) of the average annual growth rate in human pressure between 1990–2010 and 2010–2017 for each grid in the KBAs and NNRs, respectively, and coded the absolute value of di in the order of magnitude to form a sequence. Then, we restored the positive and negative signs of the values in the sequence, summed the positive value (T+) and the negative value (T−), respectively, and selected the smaller one as the Wilcoxon test statistic T. Finally, we made judgments based on the significance level (Gibbons and Chakraborti, 2011).
Data Source
The datasets used in this study included the spatial extent of the Qinghai–Tibet Plateau, NNRs, KBAs, population density, land use, cattle and sheep densities, beef and mutton production, nighttime light, highway, and railway data (Table 2). Owing to inconsistencies in the projection, resolution, and spatial extent of data used, the original datasets must be preprocessed before data analysis. The projection coordinates were uniformly converted to an Albers equal-area projection suitable for China. The central meridian of the projection coordinate system parameter was set to 105° E, the two standard latitudes were 25° N and 47° N, and the spatial range was uniformly cut to the range of the Qinghai–Tibet Plateau. All raster data were resampled to a resolution of 1 km.
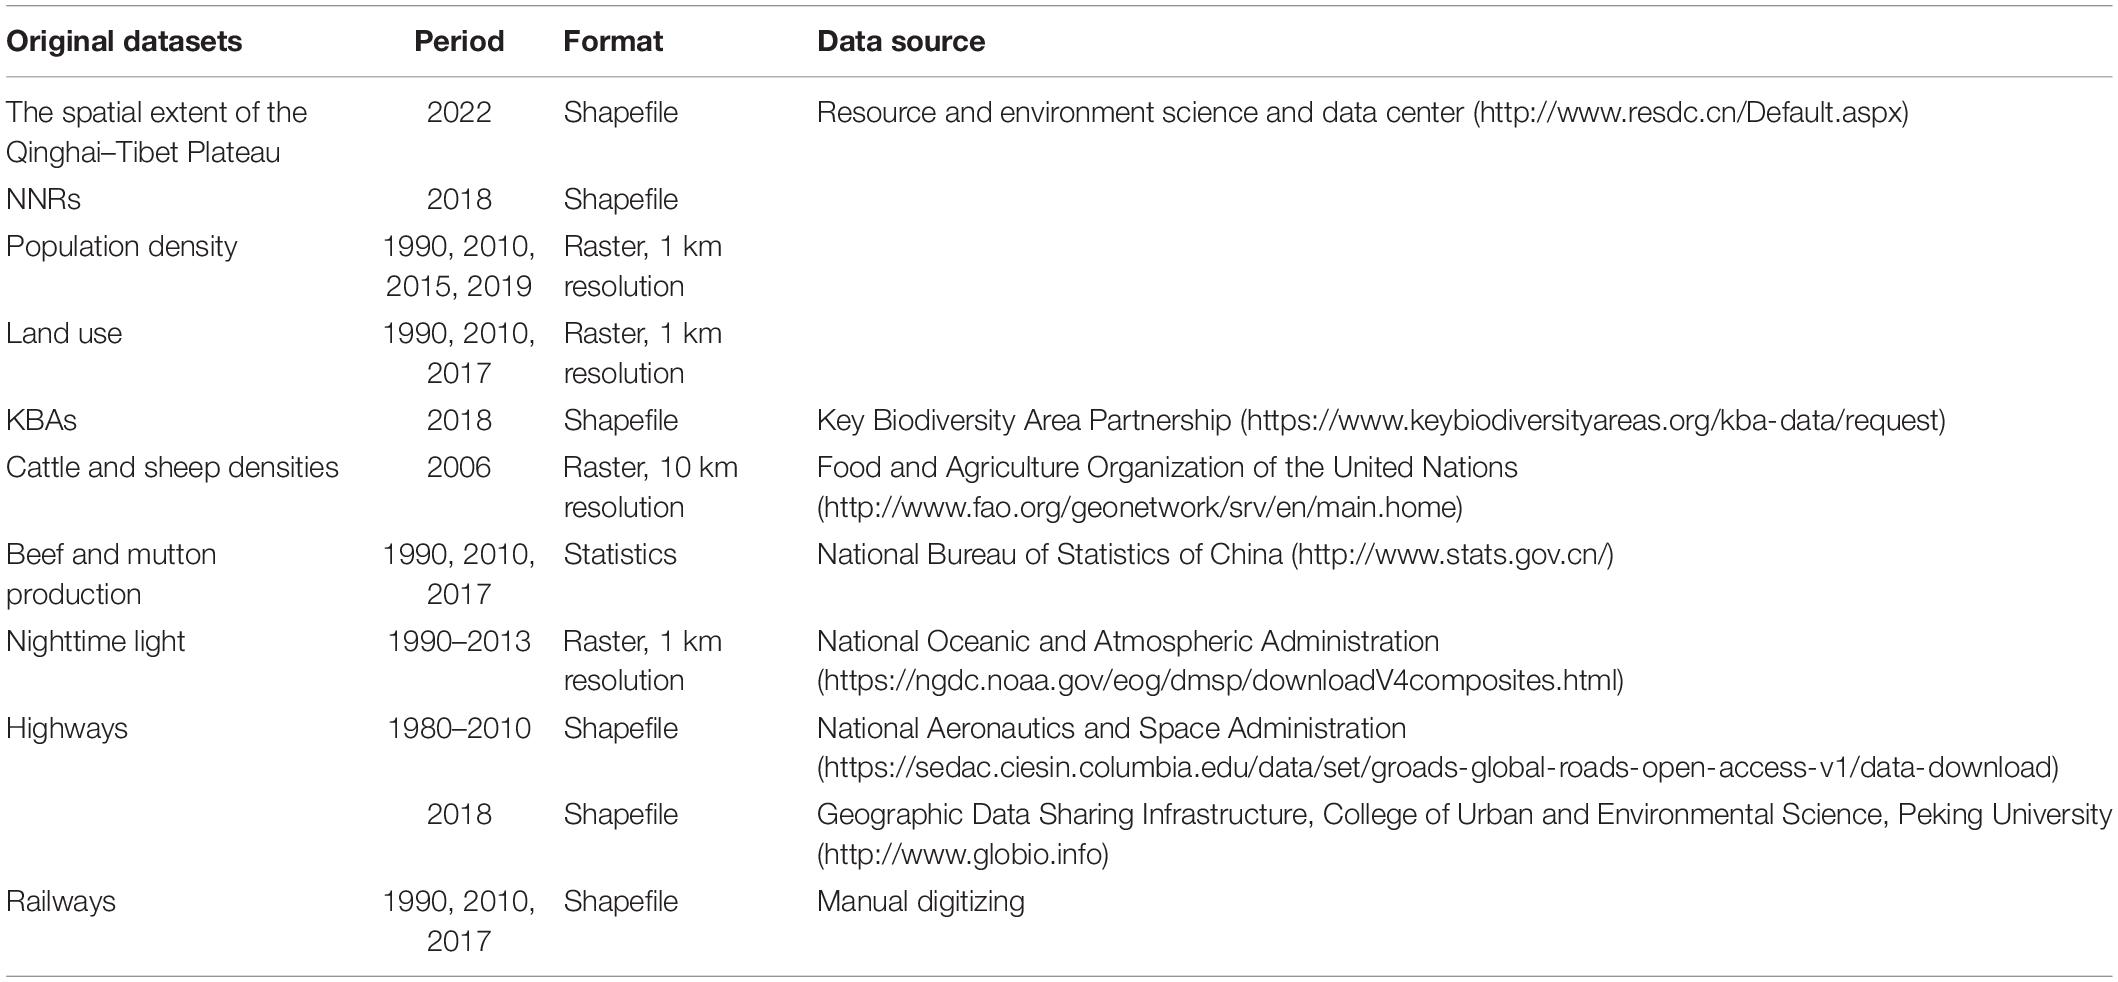
Table 2. Datasets used in this study.
Results
Spatiotemporal Variation of Human Pressure Within Key Biodiversity Areas and National Natural Reserves
The spatiotemporal patterns of human pressure within KBAs and NNRs from 1990 to 2017 are shown in Figures 2, 3, respectively. The human pressure inside KBAs was higher than that inside NNRs and their overlapping areas, and the rising trend of human pressure was more obvious than that of NRRs and the overlapping areas. The mean value (Figure 4) revealed that human pressure within KBAs was higher than that within NNRs and the overlapping areas. From 1990 to 2017, the average annual increase in human pressure experienced by KBAs (0.84%) was higher than that experienced by NRRs (0.81%) and the overlapping areas (0.72%). From the perspective of the two periods, the average annual growth rate of human pressure in KBAs was higher than that in NNRs (1990–2010, 1.10% of KBAs > 1.07% of NNRs > 0.99% of the overlapping areas; 2010–2017, 0.18% of KBAs > 0.13% of NNRs > −0.001% of the overlapping areas).
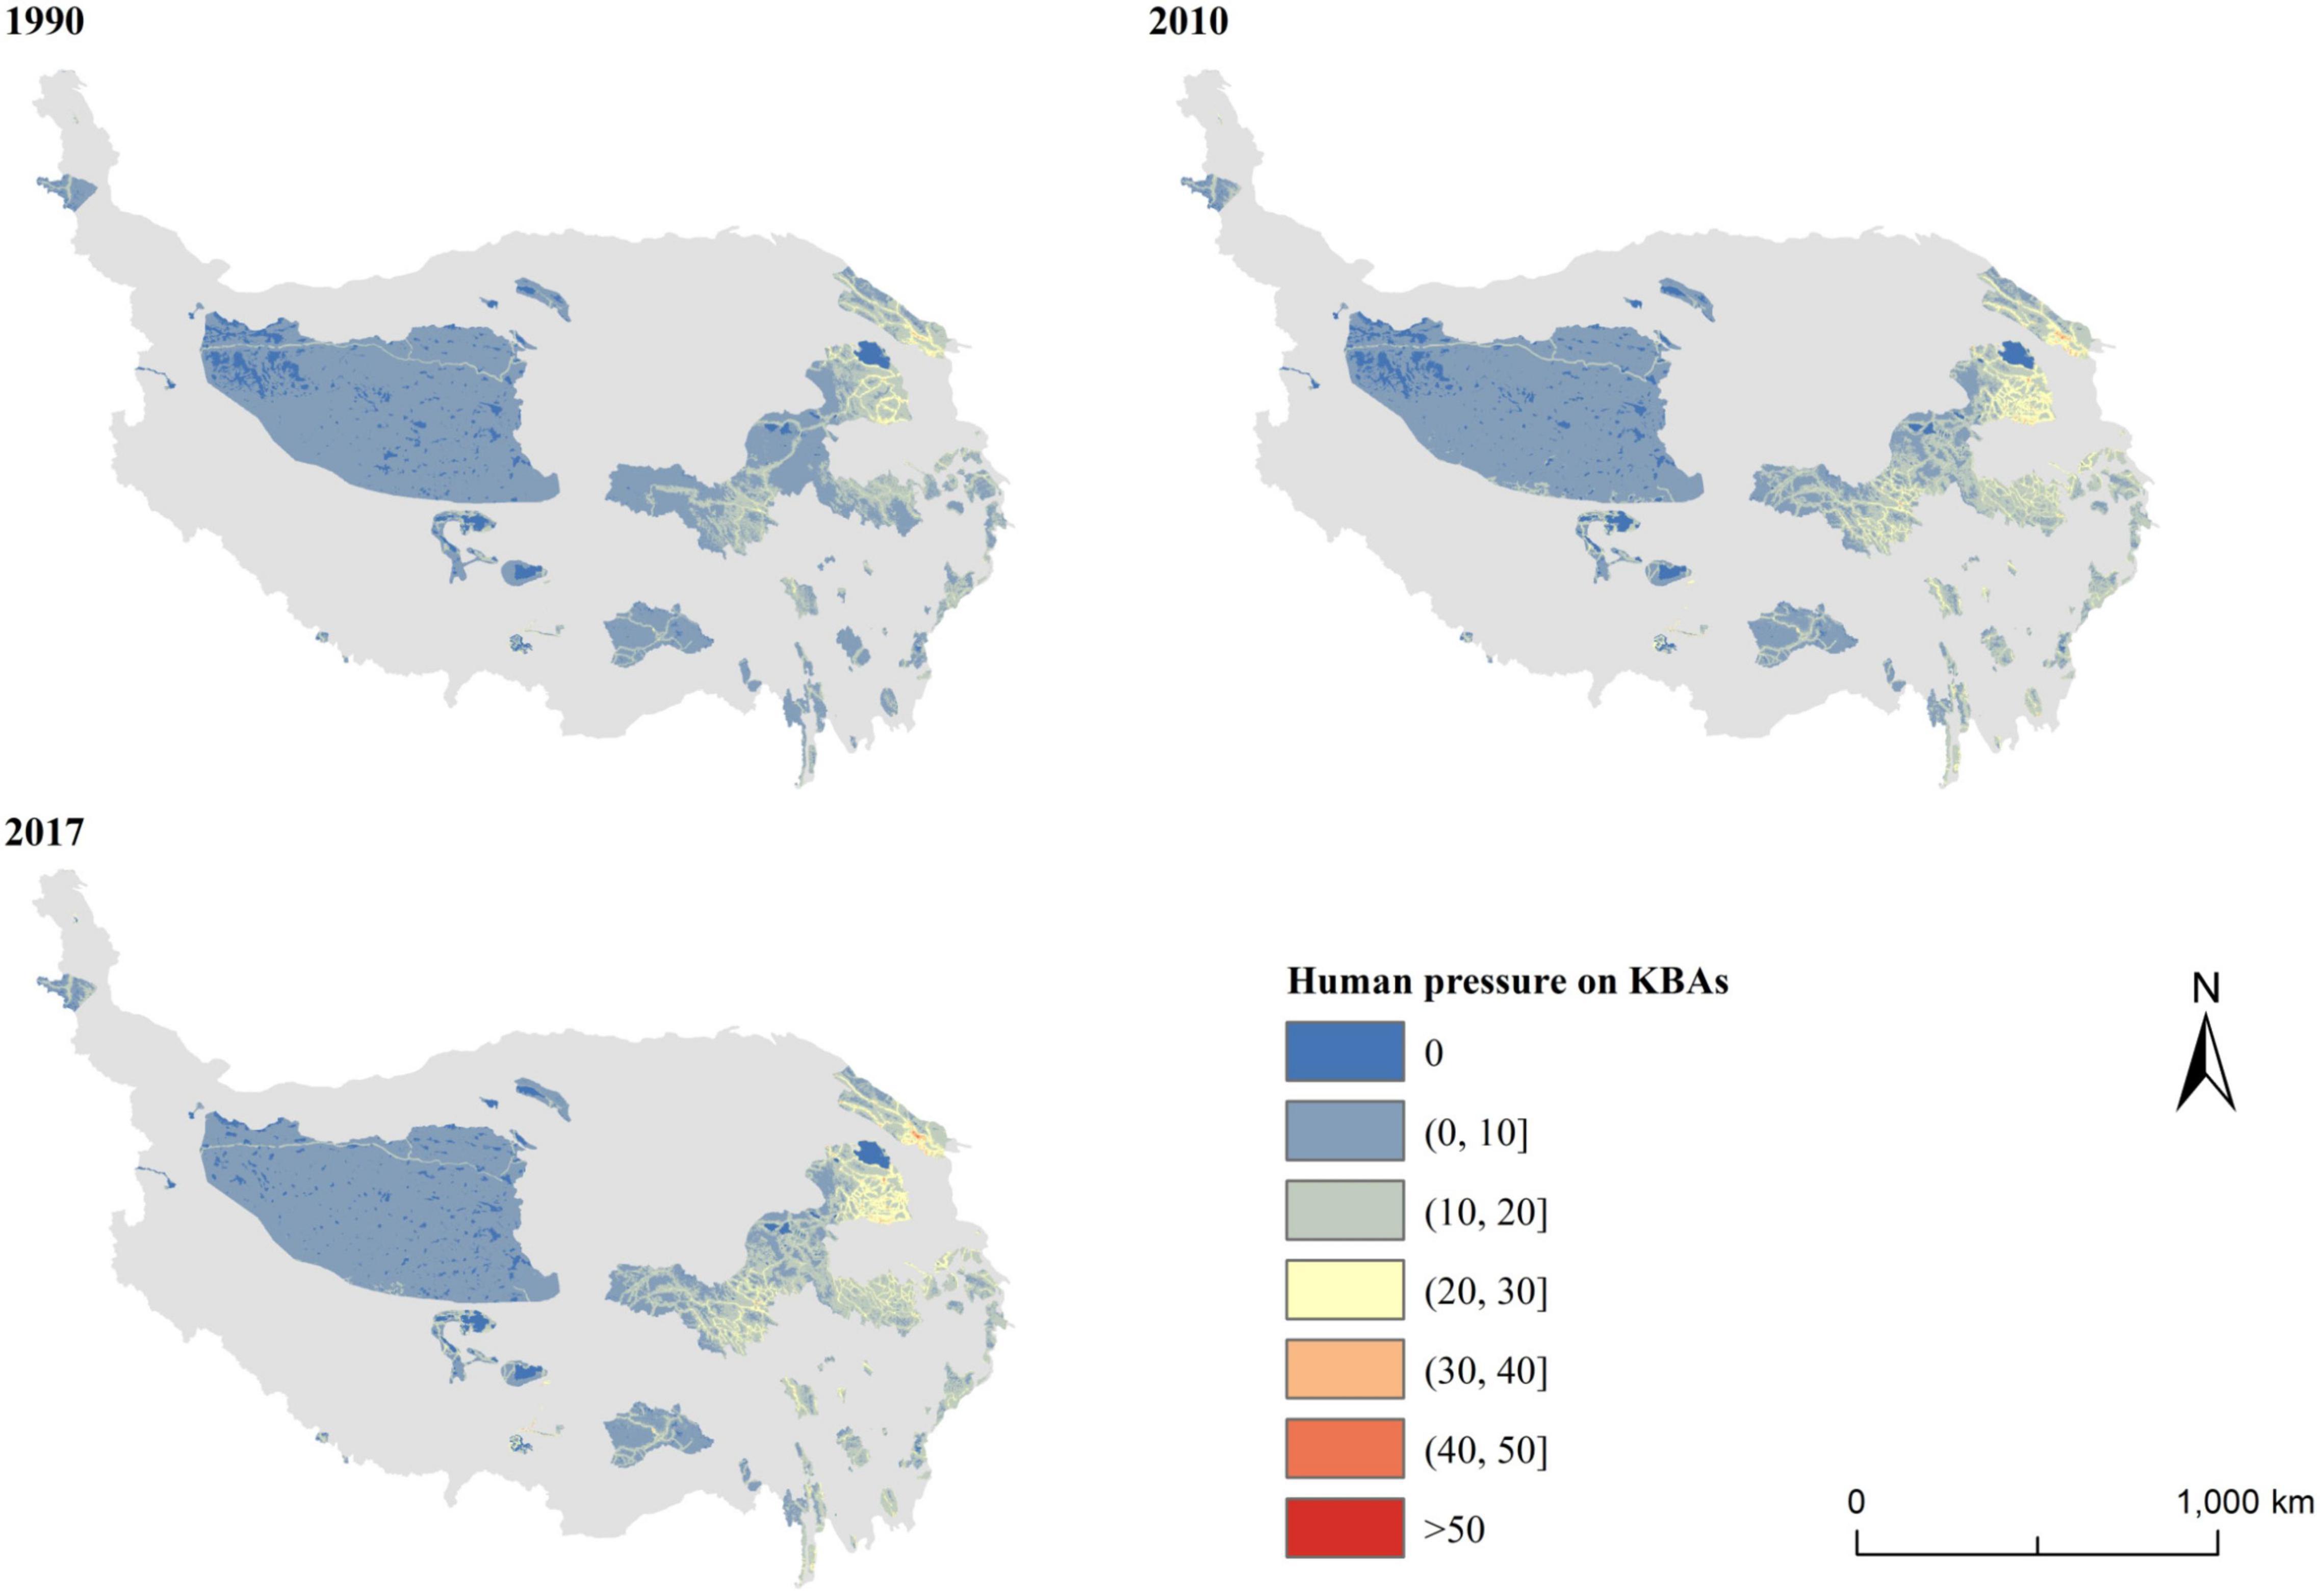
Figure 2. Spatiotemporal pattern of human pressure in KBAs during 1990–2017.
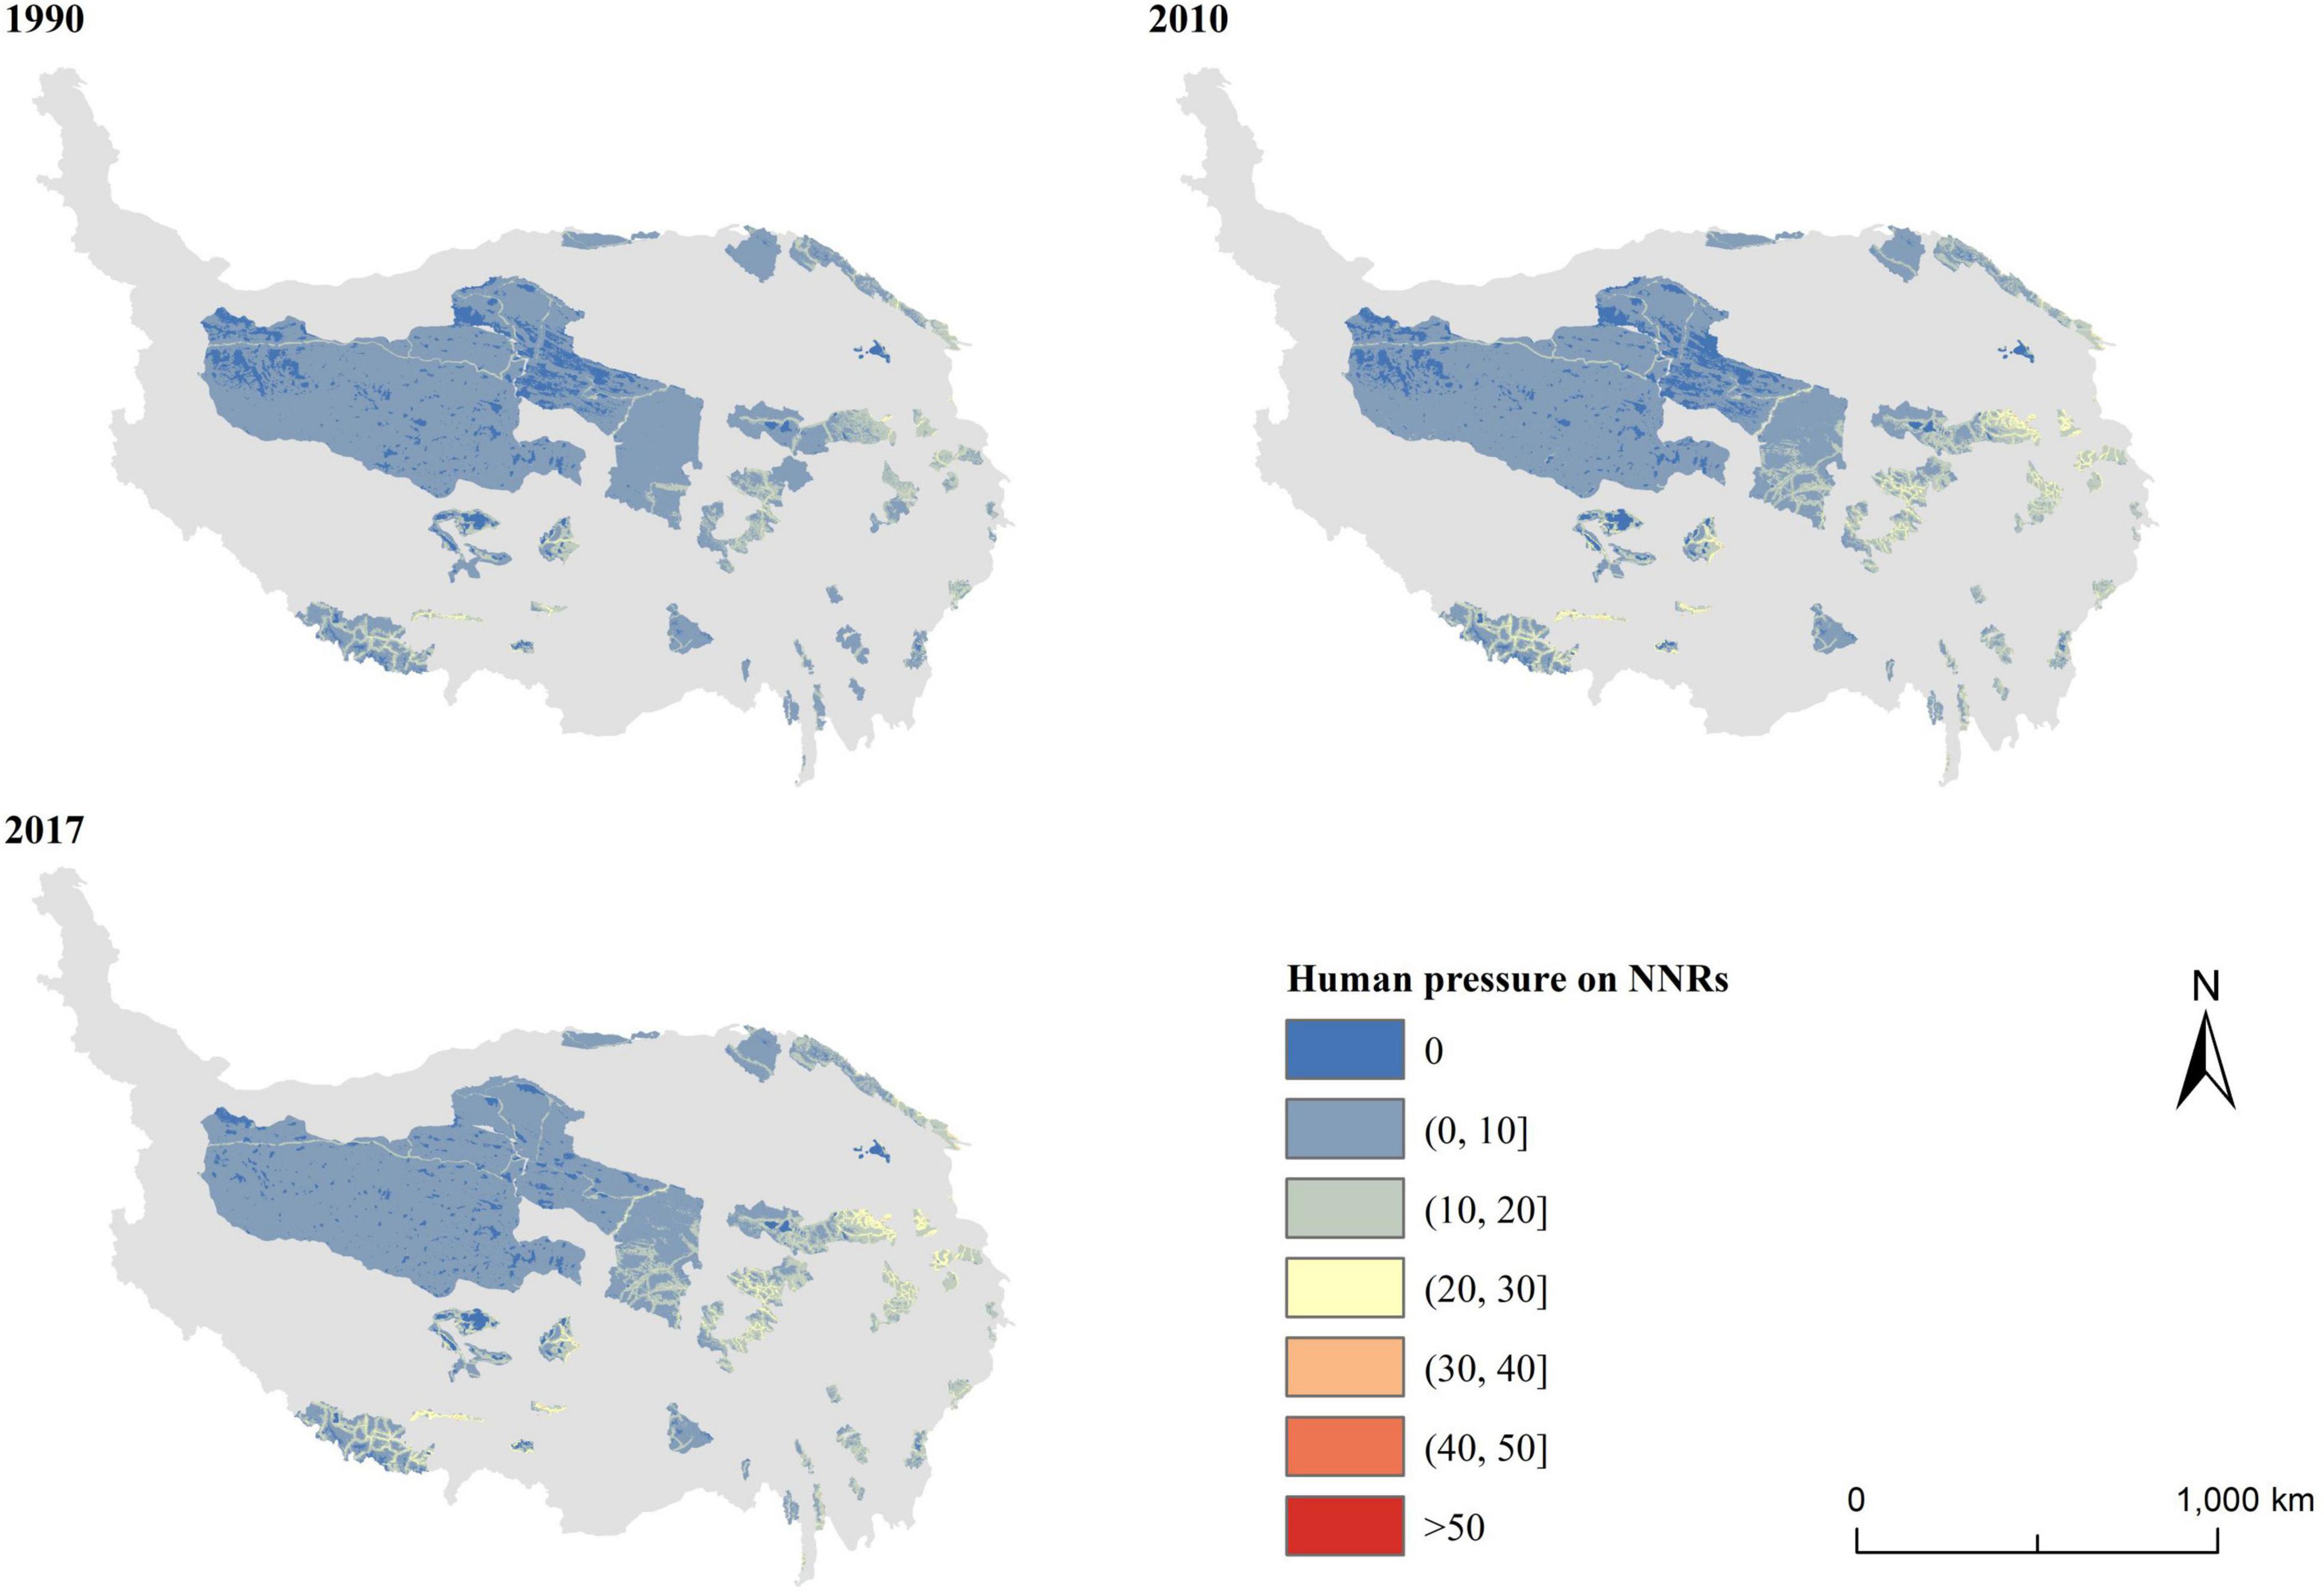
Figure 3. Spatiotemporal pattern of human pressure in NNRs during 1990–2017.

Figure 4. Mean value of human pressure in NNRs and KBAs during 1990–2017.
In general, the high-pressure areas inside KBAs were more widely distributed than those inside NNRs (Table 3). There was no area with human pressure above 50 within NNRs, but 0.02% of KBAs in 2017 had human pressures above 50. The proportion of areas with human pressures above 10 within KBAs increased from 21.10% in 1990 to 34.41% in 2017, and within NNRs increased from 10.37% in 1990 to 16.07% in 2010 and subsequently decreased to 6.72% in 2017. The proportion of areas with human pressures above 20, 30, and 40 in KBAs and NNRs showed a continuously increasing trend from 1990 to 2017, but the expanded areas in KBAs were wider than those in NNRs. Only a small number of areas within KBAs were free from human pressure (human pressure = 0), and the proportion of this type of area continued to shrink from 7% in 1990 to 5.53% in 2017. Similarly, areas free from human pressure within NNRs also showed a downward trend from 11.57% in 1990 to 6.72% in 2017.
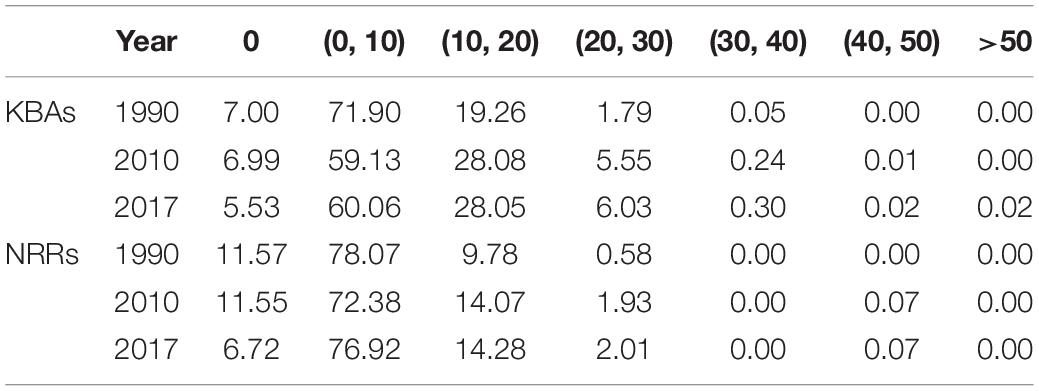
Table 3. Proportions of areas with various degree of human pressures in key biodiversity areas (KBAs) and national natural reserves (NNRs) during 1990–2017 (%).
Kernel density analysis results showed that the aggregation areas of KBAs with human pressure above 10 appeared inside the KBAs located in the eastern Qinghai–Tibet plateau (Figure 5). From 1990 to 2017, the agglomeration of human pressure above 10 gradually spread from east to west. The same trend also appears in the areas with human pressure above 10 of NNRs (Figure 6). Grids with high human pressure are mainly present in low-altitude areas that are highly accessible to humans. Over the past few years, increasing traffic and construction activities have occurred, and these areas have been greatly disturbed by humans. In KBAs, the areas under no human pressure are scattered. There were four agglomerations in 1990, and by 2017 the northwest agglomeration had disappeared. Among the NNRs, the accumulation area of under no human pressure area was larger, and mainly distributed in the northwest, the north of the central parts, and a few areas in the east. From 1990 to 2017, the range of the agglomeration areas in the northwest and central parts has reduced significantly, indicating that the influence of human activities has gradually increased. The accumulation area of the high pressure area has expanded, while the accumulation area of the no pressure area has gradually reduced.
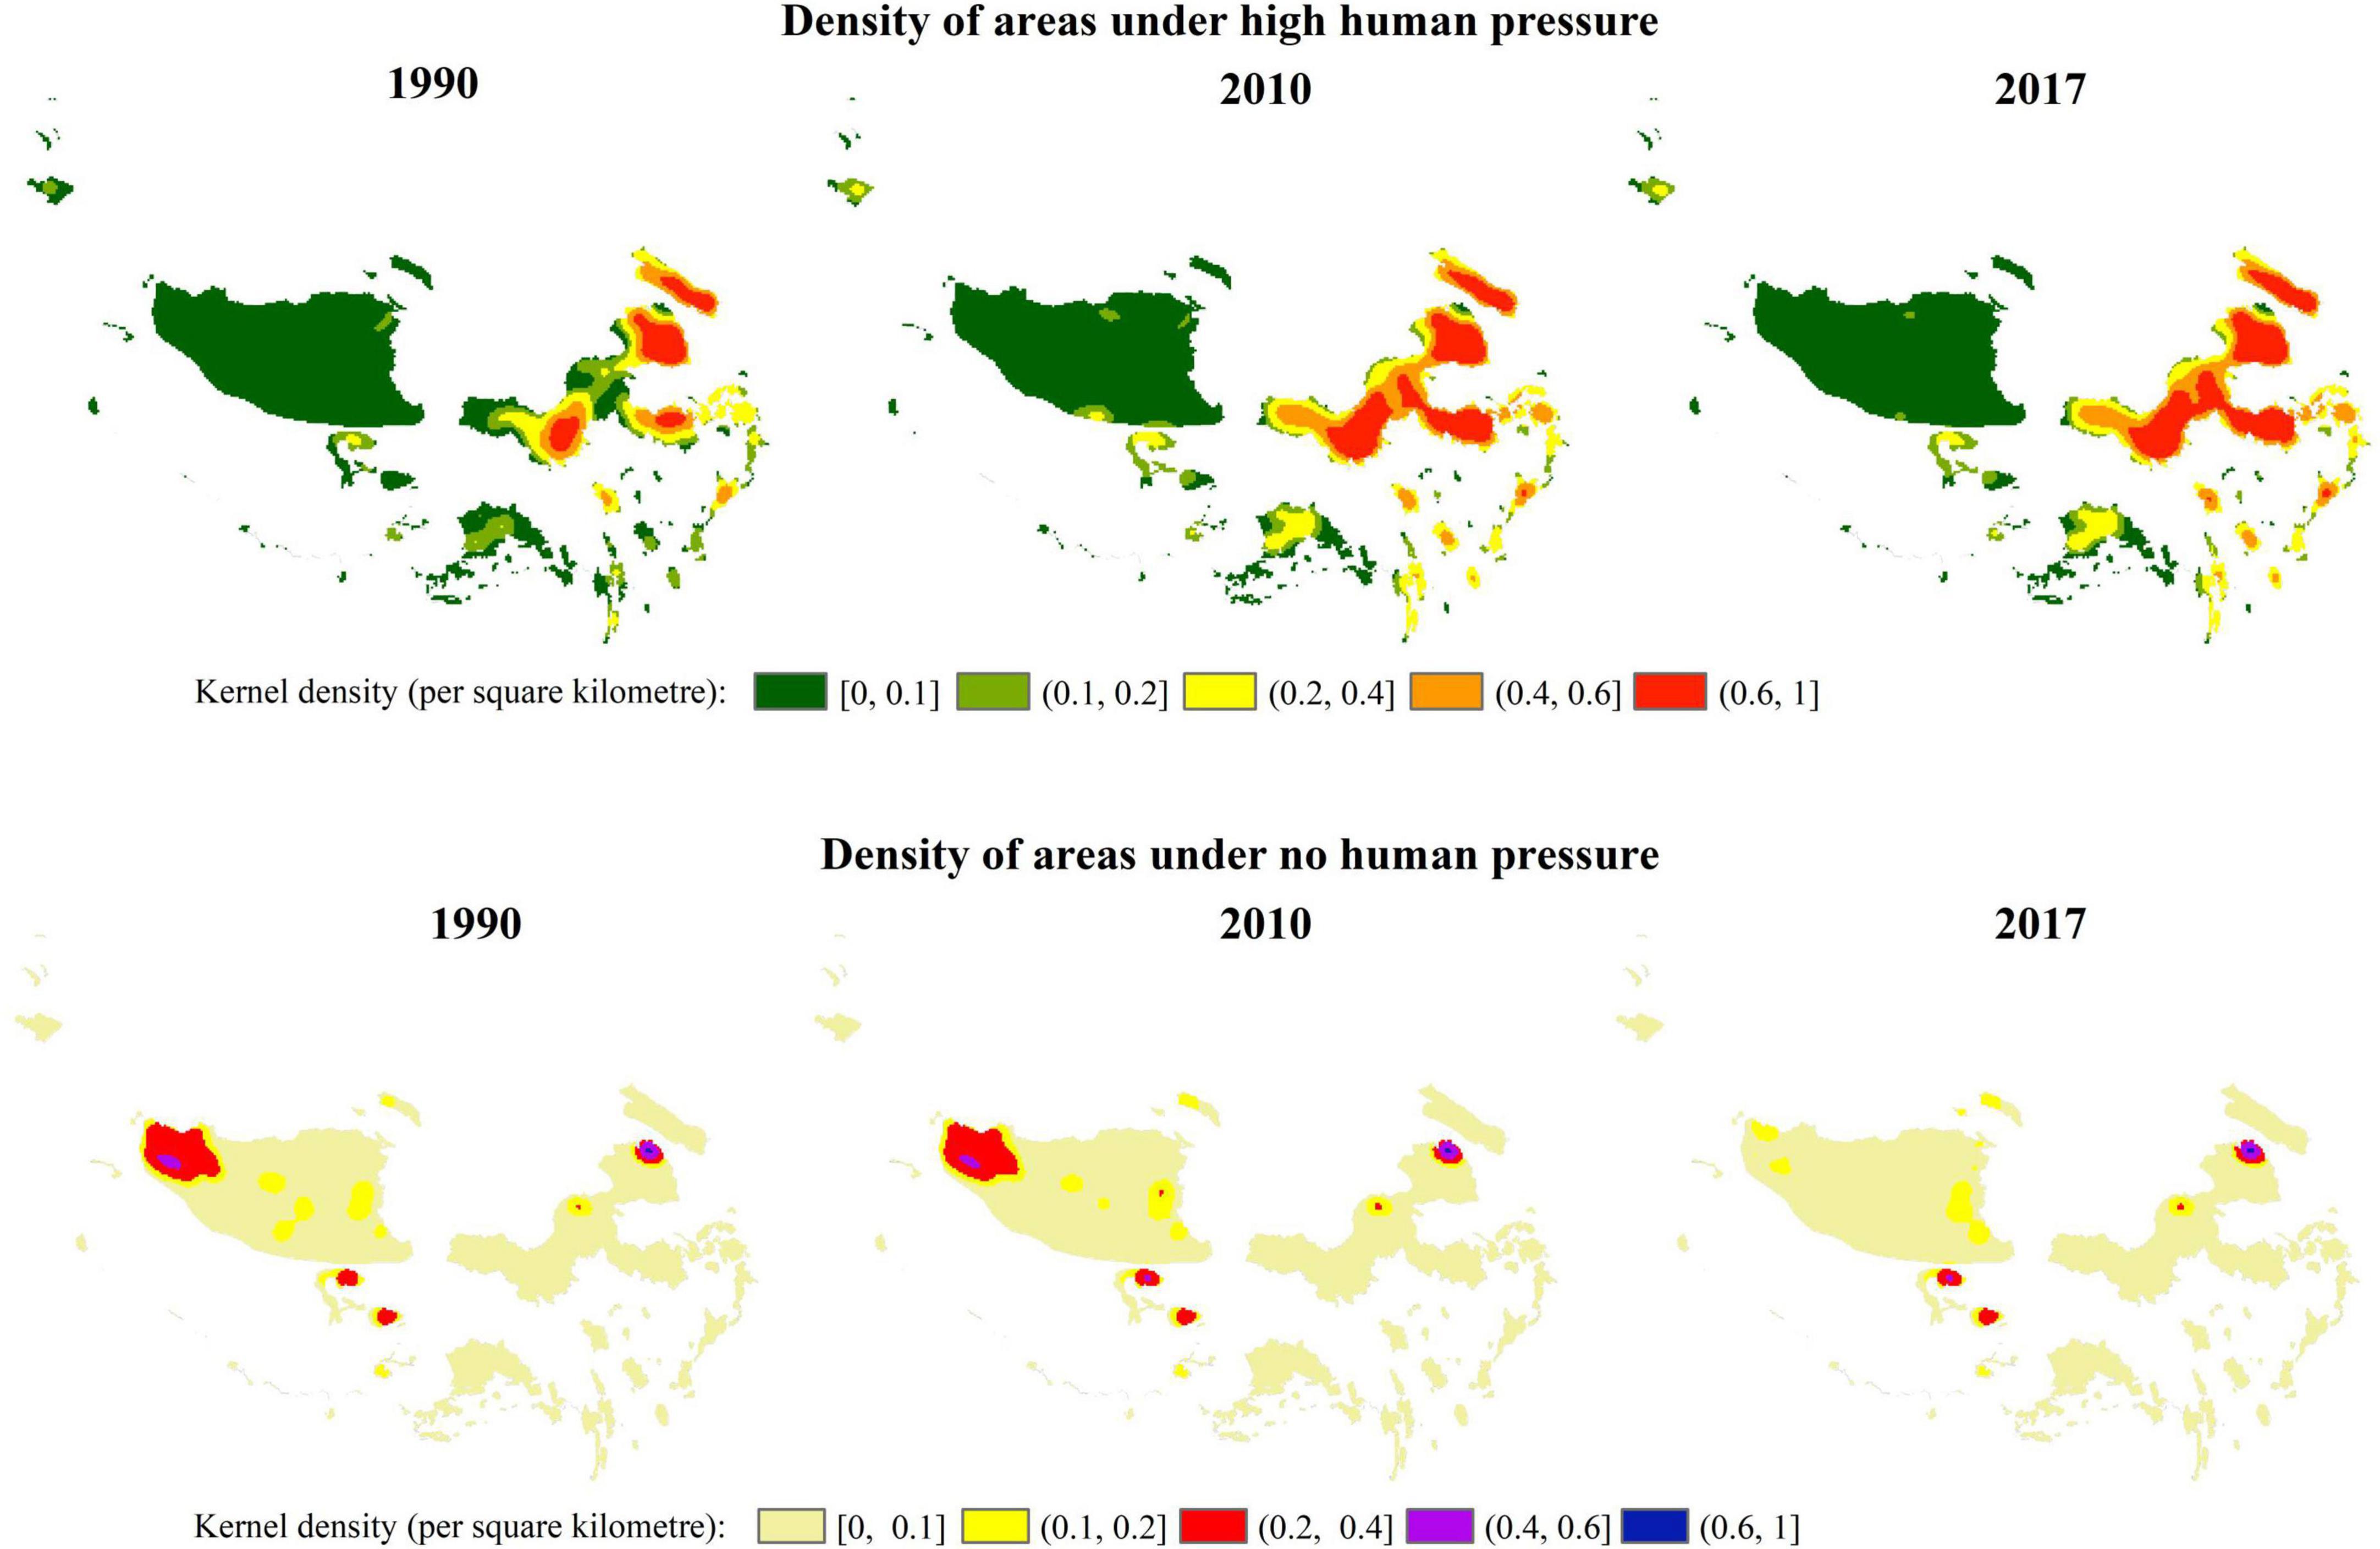
Figure 5. Aggregation areas of KBAs with human pressure above 10 and under no human pressure in KBAs during 1990–2017.
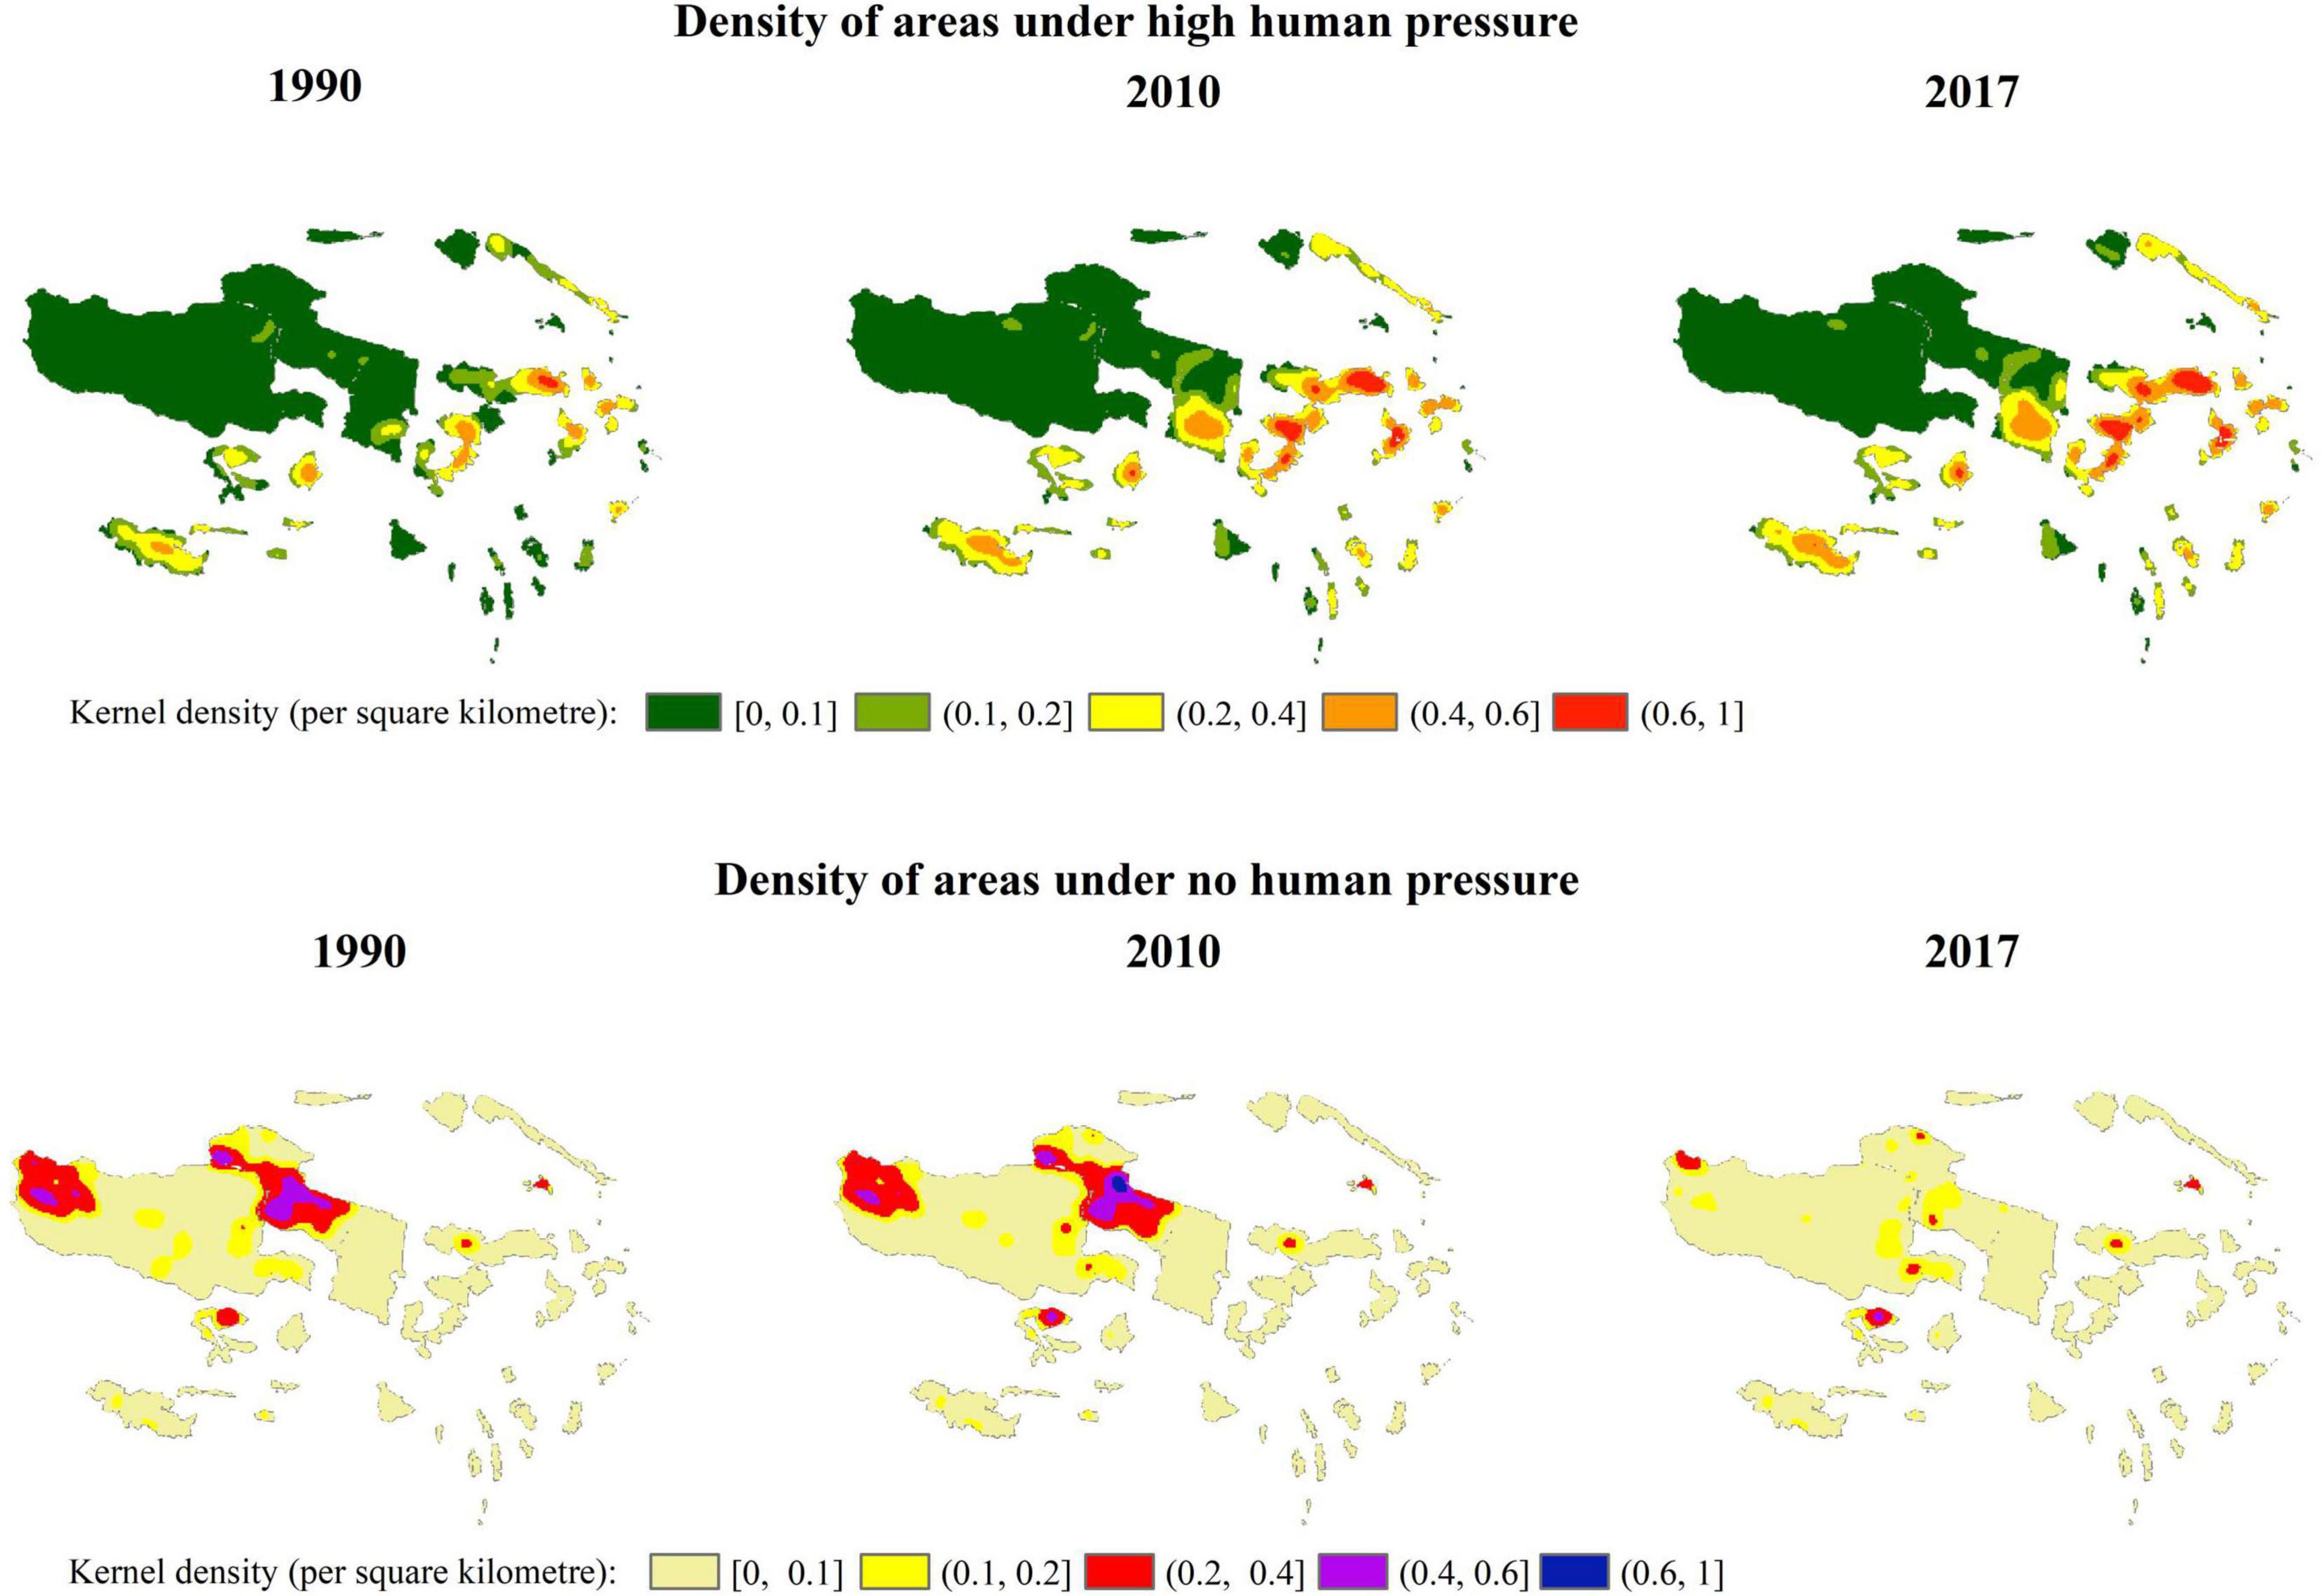
Figure 6. Aggregation areas of KBAs with human pressure above 10 and under no human pressure in NNRs during 1990–2017.
Impact of Conservation Policy on Key Biodiversity Areas and National Natural Reserves
According to the Wilcoxon signed-rank test results, the average annual growth rate in human pressure of KBAs and NRRs significantly declined after the implementation of conservation policies in 2010 (Table 4). The average annual growth rate of human pressure in KBAs declined from 0.078% before 2010 to 0.015% after 2010. Likewise, the average annual growth rate in human pressure within the NRRs was 0.059%, and it declined to 0.009% after 2010.
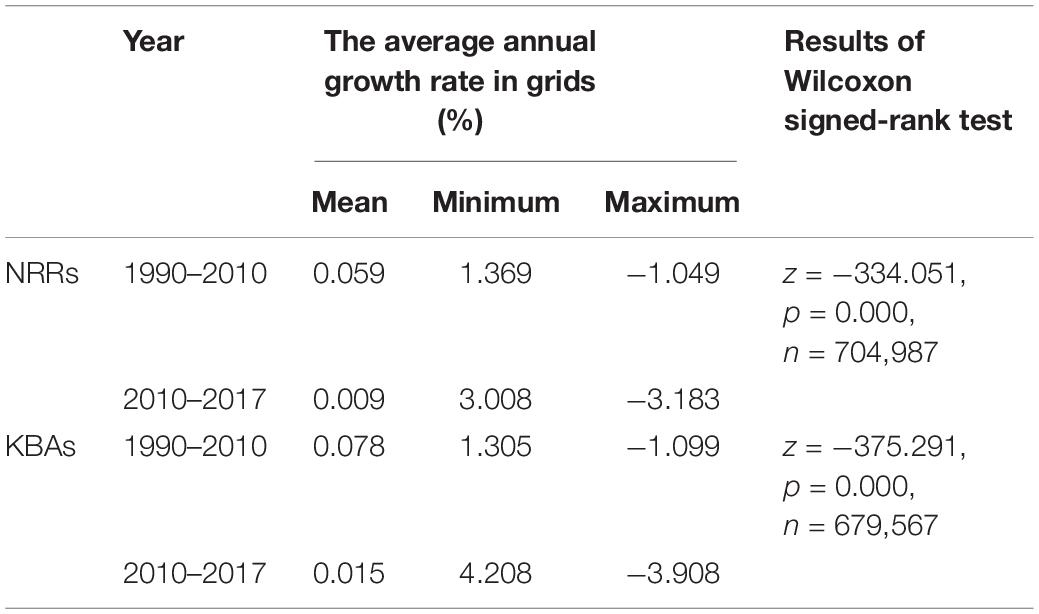
Table 4. The variation of average annual growth of human pressure between 1990–2010 and 2010–2017.
The implementation of conservation policies helps to expand areas with negative growth in human pressure (Figure 7). This effect was starker in NNRs. The area with negative growth in human pressure in the NRRs expanded from 18.31% in 1990–2020 to 31.74% in 2010–2017, and this type of area in KBAs expanded from 17.01% in 1990–2020 to 30.15% in 2010–2017.
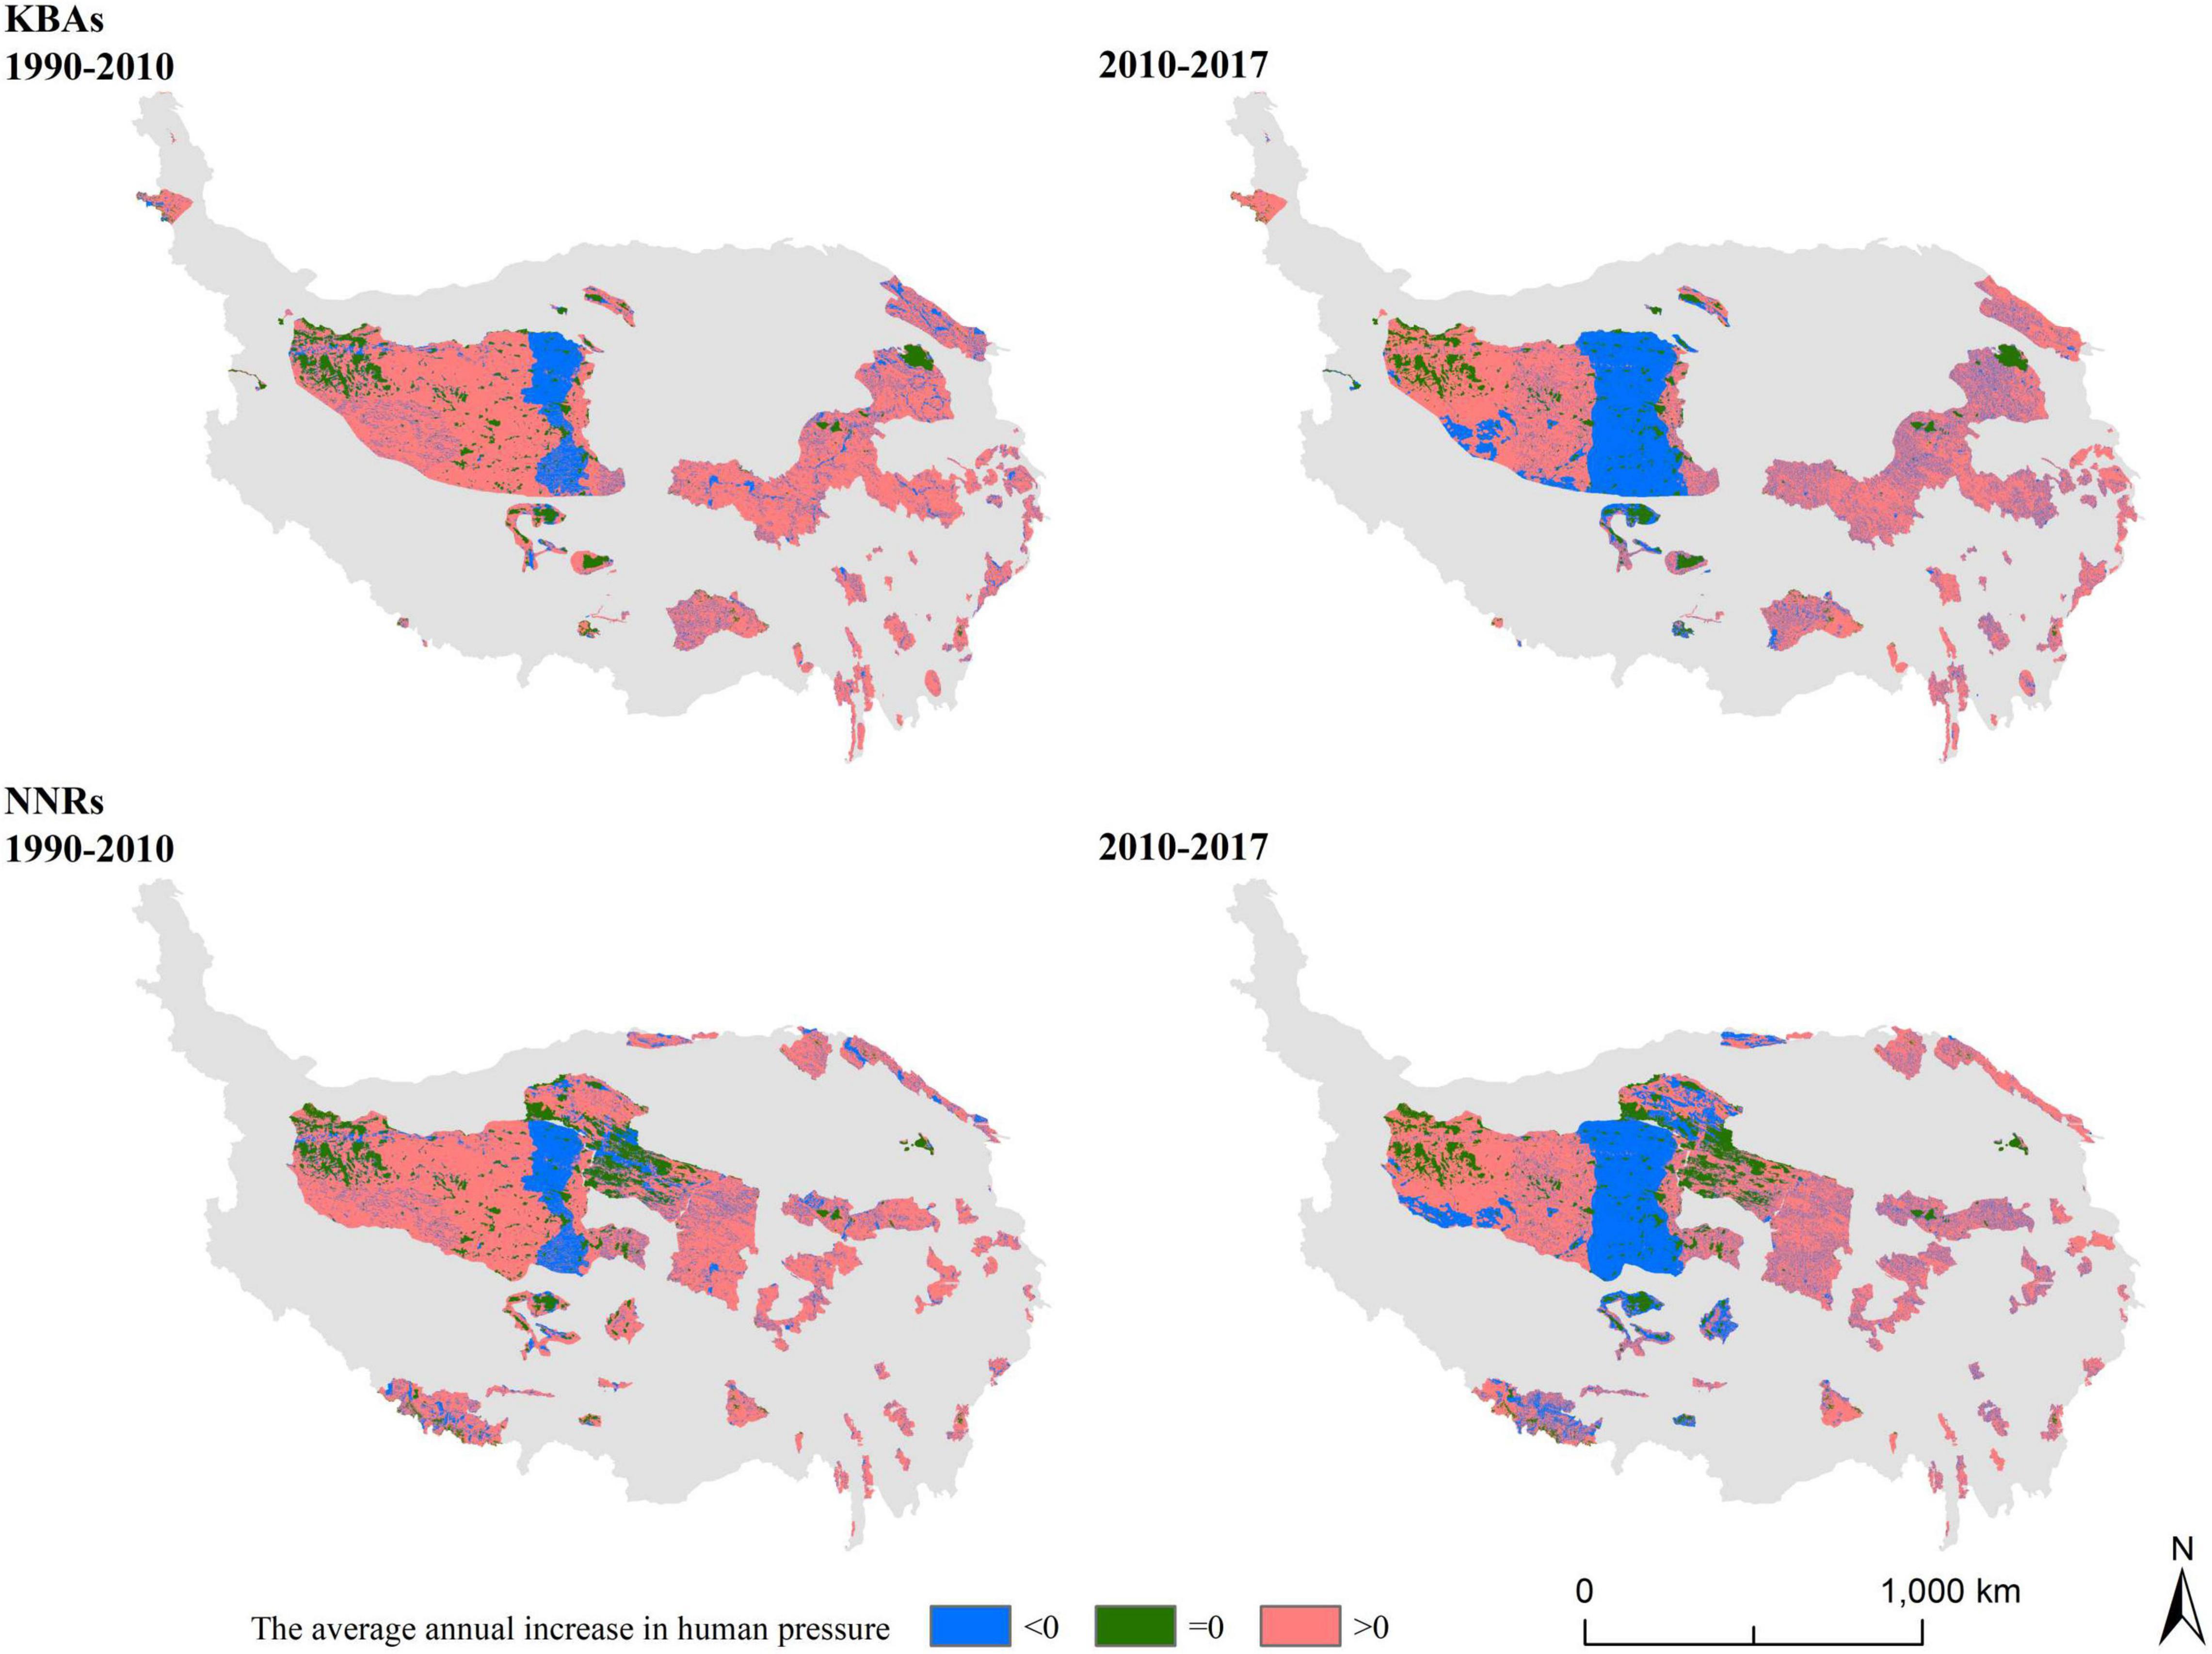
Figure 7. Average annual increase in human pressure.
Discussion
Contribution and Implications
This study is the first to report the spatiotemporal variation of human pressure on KBAs in the Qinghai–Tibet Plateau. Thus, it improves our understanding of the pressure of human activities on the ecosystem. The Qinghai–Tibet Plateau is a developing area with relatively little human activity, but the findings suggest that areas with a higher human pressure exist in the plateau, which is similar to the findings of Hua et al. (2022), who observed that areas that are under high human pressure have appeared inside NNRs. However, this study found that such areas were distributed more widely within KBAs, and compared with NNRs, the scale of such areas in KBAs is continuously expanding. This study identified sites of high magnitude and rapid growth, and hence, it can provide clear spatial guidance for the management of human pressure on ecosystems.
The Qinghai–Tibet Plateau is of high ecological importance and it has received substantial conservation efforts; however, ecological problems appeared under the past NNRs-based protection scheme (Fu et al., 2021). This study found that human activities have enormous pressure on KBAs, indicating a theoretical variable for identifying the reasons for ecosystem problems on the Qinghai–Tibet Plateau. This study suggests that poor protection of KBAs and increased pressure from human activities on KBAs may be reasons for this dilemma. KBAs have many typical species (such as individual geographically restricted species) and threatened ecosystems, which contribute significantly to the global persistence of biodiversity at the genetic, species, and ecosystem levels (International Union for Conservation of Nature [IUCN], 2016). The effects of human pressure on these species and ecosystems are likely to be widespread. Therefore, increased human pressure on KBAs may be an important reason for the emergence of ecosystem problems in the Qinghai–Tibet Plateau.
Practically, this study helps focus policy attention on KBAs and provides a reference for the adjustment of the spatial scope of PAs. In fact, not only did KBAs go unnoticed in China, around 4,900 KBAs (33.0%) remained without official attention globally in 2019 (Maxwell et al., 2020). In the post-2020 conservation era, managers should pay more attention to KBAs (Maxwell et al., 2020). According to this study, managers should design tailored managerial policies for KBAs according to their ecological importance and human pressure. Furthermore, protection should be promptly strengthened in areas of high importance and severe human pressure. In contrast, areas with high human pressure and low ecological importance may be used for human economic development. This is an appropriate way for improving conservation efficiency from the overall perspective (Fuller et al., 2010). Considering the massive disappearance of the accumulation area under no human pressure, more ecologically dynamic monitoring on human activities in KBAs located in the northwest and in NNRs situated in the northwest and north of the central parts of the Qinghai–Tibet Plateau must be implemented.
Many developing countries worldwide, including China, are in the initial stage of acting on KBAs. This study found that KBAs were subjected to higher human pressures than NNRs, which has long been a focus for ecological conservation in China. This underscores the importance of focusing on KBAs. Further, KBAs play an important role in maintaining biodiversity (International Union for Conservation of Nature [IUCN], 2016). If KBAs are not under timely protection, the increase in human pressure will accelerate biodiversity loss and threaten the sustainability of socio-geographic systems. China is presently in the process of reforming its conservation system, which is characterized by the spatial adjustment of conservation areas. Therefore, it is necessary to incorporate KBAs into a new network of conservation areas and develop protection policies specific to them.
Limitations and Suggestions for Future Research
This study also had some limitations. First, it only considered the pressure of human activities and not the carrying capacity of the ecosystem. Different types of ecosystems have different adaptability to human pressure; therefore, measuring human pressure alone cannot directly reflect the degree of damage to the ecosystem. Future research should address this gap to reveal the actual state of the ecosystem. Second, this study did not directly consider the environmental pollution indicators caused by human beings. Future studies should examine the relationship between the human footprint and the real situation of environmental pollution to reveal the impacts of human activities in the ecosystem. Finally, this study did not consider dynamic traffic flow in human pressure assessments. The negative impacts of different traffic flows were different. For example, traffic flow has decreased significantly after COVID-19, which has played a positive role in ecosystem restoration. Therefore, future research should incorporate traffic flow analysis into the human pressure analysis.
Conclusion
This study compared the spatiotemporal patterns of human pressure on KBAs and NNRs during 1990–2017, and found that KBAs suffered more human pressure than NNRs. From 1990 to 2017, the human pressure on KBAs showed an upward trend, and the rate of increase of KBAs was greater than that of NNRs. Moreover, the average human pressure on KBAs was greater than that on NNRs. Areas of severe human pressure appeared within KBAs in 2017. Areas without human pressure are small within KBAs, and the proportion of this type of area continued to shrink during 1990–2017. Influenced by human activities, the accumulation area of the high pressure area expands, while the accumulation area of the no pressure area gradually shrinks, especially in KBAs. Furthermore, this study compared the effects of ecological conservation policies on the changing trend of human pressure in KBAs and NNRs. Results revealed that human pressure on both KBAs and NNRs significantly declined after the implementation of ecological conservation policies. After the implementation of ecological conservation policies (2010–2017), the average annual increase in human pressure in each grid of KBAs and NNRs was significantly lower than that before the implementation of ecological conservation policies (1990–2010), and the declining trend was more evident in NNRs than in KBAs. Our research provides novel insights on the spatiotemporal variation of human pressure on KBAs in the Qinghai–Tibet Plateau, thereby improving our understanding of the pressure of human activities on ecosystems and offering implications for post-2020 area-based conservation.
Data Availability Statement
The original contributions presented in this study are included in the article/supplementary material; further inquiries can be directed to the corresponding author.
Author Contributions
YZ and L-EW: methodology, software and validation, formal analysis, and original draft preparation. YZ, L-EW, and LZ: writing—review and editing. YZ and LZ: visualization. LZ: supervision. L-EW: funding acquisition. All authors have read and agreed to the published version of the manuscript.
Funding
This study was supported by the National Natural Science Foundation (4217011372), the Second Tibetan Plateau Scientific Expedition and Research Program (2019QZKK1002), Youth Innovation Promotion Association of Chinese Academy of Sciences, and China Postdoctoral Science Foundation (2020M680659).
Conflict of Interest
The authors declare that the research was conducted in the absence of any commercial or financial relationships that could be construed as a potential conflict of interest.
Publisher’s Note
All claims expressed in this article are solely those of the authors and do not necessarily represent those of their affiliated organizations, or those of the publisher, the editors and the reviewers. Any product that may be evaluated in this article, or claim that may be made by its manufacturer, is not guaranteed or endorsed by the publisher.
References
Alves-Pinto, H., Geldmann, J., Jonas, H., Maioli, V., Balmford, A., Latawiec, A. E., et al. (2021). Opportunities and challenges of other effective area-based conservation measures (OECMs) for biodiversity conservation. Perspect. Ecol. Conserv. 19, 115–120. doi: 10.1016/j.pecon.2021.01.004
Bao, C., and Liu, R. W. (2019). Spatiotemporal evolution of the urban system in the Tibetan Plateau. J. Geo Inform. Sci. 21, 1330–1340. doi: 10.12082/dqxxkx.2019.180681
BirdLife International (2019). World Database of Key Biodiversity Areas. Available online at: www.keybiodiversityareas.org (accessed June 20, 2019).
Chen, D. L., Xu, B. Q., Yao, T. D., Guo, Z. T., Cui, P., Chen, F. H., et al. (2015). Assessment of past, present and future environmental changes on the Tibetan Plateau. Sci. Bull. 60, 3025–3035. doi: 10.1360/N972014-013
Chen, M. G., and Zhang, S. (2020). Regional economic imbalance in China and the influence factors: based on night-time light data. Stat. Res. 37, 40–54. doi: 10.19343/j.cnki.11-1302/c.2020.06.004
Chi, Y., Liu, D., Wang, J., and Wang, E. (2020). Human negative, positive, and net influences on an estuarine area with intensive human activity based on land covers and ecological indices: an empirical study in Chongming Island, China. Land Use Policy 99:104846. doi: 10.1016/j.landusepol.2020.104846
de Queiroz, M. G., da Silva, T. G. F., Zolnier, S., Jardim, A. M. D. R. F., de Souza, C. A. A., Júnior, G. D. N. A., et al. (2020). Spatial and temporal dynamics of soil moisture for surfaces with a change in land use in the semi-arid region of Brazil. Catena 188:104457. doi: 10.1016/j.catena.2020.104457
Donald, P. F., Buchanan, G. M., Balmford, A., Bingham, H., Couturier, A. R., de la Rosa, G. E., et al. (2019). The prevalence, characteristics and effectiveness of Aichi Target 11’s “other effective area-based conservation measures” (OECMs) in Key Biodiversity Areas. Conserv. Lett. 12:e12659. doi: 10.1111/conl.12659
Duan, Q., and Luo, L. (2021). A Dataset of Human Footprint Over the Qinghai-Tibet Plateau During 1990–2017. Beijing, National Tibetan Plateau Data Center.
Fu, B. J., Ouyang, Z. Y., Shi, P., Fan, J., Wang, X. D., Zheng, H., et al. (2021). Current condition and protection strategies of qinghai-tibet plateau ecological security barrier. Bull. Chin. Acad. Sci. 36, 1298–1306. doi: 10.16418/j.issn.1000-3045.20210919001
Fuller, R. A., McDonald-Madden, E., Wilson, K. A., Carwardine, J., Grantham, H. S., Watson, J. E., et al. (2010). Replacing underperforming protected areas achieves better conservation outcomes. Nature 466, 365–367. doi: 10.1038/nature09180
Garrett, J. K., Donald, P. F., and Gaston, K. J. (2020). Skyglow extends into the world’s Key Biodiversity Areas. Anim. Conserv. 23, 153–159. doi: 10.1111/acv.12480
General Office of the CPC Central Committee, and General Office of the State Council of China (2019). Guiding Opinions on Establishing a Natural Reserve System with National Parks as the Main Body. Beijing. Available online at: http://www.gov.cn/zhengce/2019-06/26/content_5403497.htm (accessed June 26, 2019).
Gibbons, J. D., and Chakraborti, S. (2011). Nonparametric Statistical Inference. Boca Raton, FL: Chapman & Hall/CRC Press (Taylor & Francis).
Gosselin, F., and Callois, J. M. (2021). On the time lag between human activity and biodiversity in Europe at the national scale. Anthropocene 35:100303. doi: 10.1016/j.ancene.2021.100303
Hua, T., Zhao, W., Cherubini, F., Hu, X., and Pereira, P. (2022). Continuous growth of human footprint risks compromising the benefits of protected areas on the Qinghai-Tibet Plateau. Glob. Ecol. Conserv. 34:e02053. doi: 10.1016/j.gecco.2022.e02053
International Union for Conservation of Nature [IUCN] (2016). A Global Standard for the Identification of Key Biodiversity Areas. Gland: International Union for Conservation of Nature (IUCN).
Jonas, H. D., Barbuto, V., Jonas, H. C., Kothari, A., and Nelson, F. (2014). New steps of change: looking beyond protected areas to consider other effective area-based conservation measures. Parks 20, 111–128. doi: 10.2305/IUCN.CH.2014.PARKS-20-2.HDJ.en
Keys, P. W., Barnes, E. A., and Carter, N. H. (2021). A machine-learning approach to human footprint index estimation with applications to sustainable development. Environ. Res. Lett. 16:044061. doi: 10.1088/1748-9326/abe00a
Kroeger, S. B., Hanslin, H. M., Lennartsson, T., D’Amico, M., Kollmann, J., Fischer, C., et al. (2022). Impacts of roads on bird species richness: a meta-analysis considering road types, habitats and feeding guilds. Sci. Tot. Environ. 812:151478. doi: 10.1016/j.scitotenv.2021.151478
Kullberg, P., Di Minin, E., and Moilanen, A. (2019). Using key biodiversity areas to guide effective expansion of the global protected area network. Glob. Ecol. Conserv. 20:e00768. doi: 10.1016/j.gecco.2019.e00768
Li, J., Li, X., Gao, J., Ma, G., and Qi, X. (2021a). Micro-scale fragmentation of the alpine meadow landscape on the Qinghai-Tibet Plateau under external disturbances. Catena 201:105220. doi: 10.1016/j.catena.2021.105220
Li, J., Zhao, Y., Shao, X., Huang, D., Shang, J., Li, H., et al. (2021b). The Mixed Addition of Biochar and Nitrogen Improves Soil Properties and Microbial Structure of Moderate–Severe Degraded Alpine Grassland in Qinghai-Tibet Plateau. Front. Plant Sci. 12:765041. doi: 10.3389/fpls.2021.765041
Li, M., Wu, J., Feng, Y., Niu, B., He, Y., and Zhang, X. (2021c). Climate variability rather than livestock grazing dominates changes in alpine grassland productivity across Tibet. Front. Ecol. Evol. 9:631024. doi: 10.3389/fevo.2021.631024
Li, Y. (2021). Knowledge products of the International Union for Conservation of Nature (IUCN) and their domestic application status. China Land 2, 12–16. doi: 10.13816/j.cnki.ISSN1002-9729.2021.02.03
Lieb, Z., Tumurbaatar, B., Elfström, B., and Bull, J. (2021). Impact of livestock guardian dogs on livestock predation in rural Mongolia. Conserv. Sci. Pract. 3:e509. doi: 10.1111/csp2.509
Liu, F., Liu, F. G., Zhou, Q., Chen, Q., Wang, S. Z., Guo, R., et al. (2021). Ecological risk and regional differentiation in the Qinghai-Tibet Plateau. J. Nat. Resour. 36, 3232–3246. doi: 10.31497/zrzyxb.20211216
Luo, X., Yang, J., Sun, W., and He, B. (2021). Suitability of human settlements in mountainous areas from the perspective of ventilation: a case study of the main urban area of Chongqing. J. Cleaner Prod. 310:127467. doi: 10.1016/j.jclepro.2021.127467
Ma, Z., Chen, Y., Melville, D. S., Fan, J., Liu, J., Dong, J., et al. (2019). Changes in area and number of nature reserves in China. Conserv. Biol. 33, 1066–1075. doi: 10.1111/cobi.13285
Maxwell, S. L., Cazalis, V., Dudley, N., Hoffmann, M., Rodrigues, A. S., Stolton, S., et al. (2020). Area-based conservation in the twenty-first century. Nature 586, 217–227. doi: 10.1038/s41586-020-2773-z
Mottl, O., Flantua, S. G., Bhatta, K. P., Felde, V. A., Giesecke, T., Goring, S., et al. (2021). Global acceleration in rates of vegetation change over the past 18,000 years. Science 372, 860–864. doi: 10.1126/science.abg1685
Mu, H., Li, X., Wen, Y., Huang, J., Du, P., Su, W., et al. (2022). A global record of annual terrestrial Human Footprint dataset from 2000 to 2018. Sci. Data 9, 1–9. doi: 10.1038/s41597-022-01284-8
National Bureau of Statistics of China [NBSC] (2020). China Statistical Yearbook. Beijing: China Statistics Press.
National Development and Reform Commission of China [NDRC], and Ministry of Natural Resources of China [MNRC] (2020). The Overall Plan for Major Projects in the Protection and Restoration of National Important Ecosystems (2021-2035). Beijing: National Development and Reform Commission of China.
Nogueira, J. G., Sousa, R., Benaissa, H., De Knijf, G., Ferreira, S., Ghamizi, M., et al. (2021). Alarming decline of freshwater trigger species in western Mediterranean key biodiversity areas. Conserv. Biol. 35, 1367–1379. doi: 10.1111/cobi.13810
Parzen, E. (1962). On estimation of a probability density function and mode. Ann. Math. Stat. 33, 1065–1076.
Pavlik, B. M., Louderback, L. A., Vernon, K. B., Yaworsky, P. M., Wilson, C., Clifford, A., et al. (2021). Plant species richness at archaeological sites suggests ecological legacy of Indigenous subsistence on the Colorado Plateau. Proc. Natl. Acad. Sci. U.S.A. 118:e2025047118. doi: 10.1073/pnas.2025047118
Polazzo, F., Dos Anjos, T. B. O., Arenas-Sánchez, A., Romo, S., Vighi, M., and Rico, A. (2022). Effect of multiple agricultural stressors on freshwater ecosystems: the role of community structure, trophic status, and biodiversity-functioning relationships on ecosystem responses. Sci. Tot. Environ. 807:151052. doi: 10.1016/j.scitotenv.2021.151052
Pringle, R. M. (2017). Upgrading protected areas to conserve wild biodiversity. Nature 546, 91–99. doi: 10.1038/nature22902
Sanderson, E. W., Jaiteh, M., Levy, M. A., Redford, K. H., Wannebo, A., and Woolmer, G. (2002). The human footprint and the last of the wild. Bioscience 52, 891–904.
Shen, W., Zhang, H., Zou, C., Cao, X., and Tang, X. (2004). Approaches to prediction of impact of Qinghai-Tibet Railway construction on alpine ecosystems alongside and its recovery. Chin. Sci. Bull. 49, 834–841. doi: 10.1360/03wd0376
Shrestha, M., Piman, T., and Grünbühel, C. (2021). Prioritizing key biodiversity areas for conservation based on threats and ecosystem services using participatory and GIS-based modeling in Chindwin River Basin, Myanmar. Ecosyst. Serv. 48:101244. doi: 10.1016/j.ecoser.2021.101244
Strassburg, B. B., Iribarrem, A., Beyer, H. L., Cordeiro, C. L., Crouzeilles, R., Jakovac, C. C., et al. (2020). Global priority areas for ecosystem restoration. Nature 586, 724–729. doi: 10.1038/s41586-020-2784-9
Tian, L., and Chen, J. (2022). Urban expansion inferenced by ecosystem production on the Qinghai-Tibet plateau. Environ. Res. Lett. 17:035001. doi: 10.1088/1748-9326/ac3178
Trentman, M. T., Tank, J. L., Davis, R. T., Hanrahan, B. R., Mahl, U. H., and Roley, S. S. (2022). Watershed-scale land use change increases ecosystem metabolism in an agricultural stream. Ecosystems 25, 441–456. doi: 10.1007/s10021-021-00664-2
Trombulak, S. C., and Frissell, C. A. (2000). Review of ecological effects of roads on terrestrial and aquatic communities. Conserv. Biol. 14, 18–30. doi: 10.1046/j.1523-1739.2000.99084.x
Venter, O., Sanderson, E. W., Magrach, A., Allan, J. R., Beher, J., Jones, K. R., et al. (2016). Sixteen years of change in the global terrestrial human footprint and implications for biodiversity conservation. Nat. Commun. 7, 1–11. doi: 10.1038/ncomms12558
Wang, L., Wu, W. M., Bolan, N. S., Tsang, D. C., Li, Y., Qin, M., et al. (2021). Environmental fate, toxicity and risk management strategies of nanoplastics in the environment: current status and future perspectives. J. Hazardous Mater. 401:123415. doi: 10.1016/j.jhazmat.2020.123415
Wildlife Conservation Society (2013). Myanmar Biodiversity Conservation Investment Vision. Wildlife Conservation Society, Yangon, Myanmar. New York, NY: Wildlife Conservation Society.
Xie, X., Fang, B., Xu, H., He, S., and Li, X. (2021). Study on the coordinated relationship between Urban Land use efficiency and ecosystem health in China. Land Use Policy 102:105235. doi: 10.1016/j.landusepol.2020.105235
Yu, H., Wang, Y., and Zhang, Y. L. (2016). When Will the Turning Point of China’s Environmental Kuznets Curve Come? Special Report on the Environmental Strategy and Policy. 197. Beijing: Ministry of Ecology and Environment the People’s Republic of China.
Yu, H., Yang, J., Sun, D., Li, T., and Liu, Y. (2022). Spatial responses of ecosystem service value during the development of urban agglomerations. Land 11:165.
Zhang, B. F., Miao, C. H., Song, Y. N., and Wang, J. J. (2020). Correction of DMSP/OLS stable night light images in China. J. Geo inform. Sci. 22, 1679–1691. doi: 10.12082/dqxxkx.2020.190397
Zhao, F., and Lu, T. (2017). Ecological effects of roads on land use and landscape pattern in Eastern Tibetan Plateau. China. Ecol. Sci. 36, 146–151. doi: 10.14108/j.cnki.1008-8873.2017.04.020
Zhao, J., Zhao, Z., and Zhang, H. (2021). The impact of growth, energy and financial development on environmental pollution in China: new evidence from a spatial econometric analysis. Energy Econ. 93:104506. doi: 10.1016/j.eneco.2019.104506
Keywords: human pressure, key biodiversity areas, spatiotemporal pattern, Qinghai-Tibet, national natural reserves
Citation: Zeng YX, Wang L-e and Zhong LS (2022) Spatiotemporal Variations of Human Pressure on Key Biodiversity Areas in the Qinghai–Tibet Plateau: A Comparative Analysis. Front. Ecol. Evol. 10:960634. doi: 10.3389/fevo.2022.960634
Received: 03 June 2022; Accepted: 16 June 2022;
Published: 01 July 2022.
Edited by:
Jun Yang, Northeastern University, ChinaReviewed by:
Chenxi Li, Xi’an University of Architecture and Technology, ChinaHuisheng Yu, Northeastern University, China
Liguo Wang, Jiangxi Agricultural University, China
Copyright © 2022 Zeng, Wang and Zhong. This is an open-access article distributed under the terms of the Creative Commons Attribution License (CC BY). The use, distribution or reproduction in other forums is permitted, provided the original author(s) and the copyright owner(s) are credited and that the original publication in this journal is cited, in accordance with accepted academic practice. No use, distribution or reproduction is permitted which does not comply with these terms.
*Correspondence: Ling-en Wang, wangle@igsnrr.ac.cn