Empirical evidence of type III functional responses and why it remains rare
 Gregor Kalinkat
 Björn C. Rall
 Stella F. Uiterwaal4,5
  Wojciech Uszko
- 1Leibniz-Institute of Freshwater Ecology and Inland Fisheries (IGB), Berlin, Germany
- 2Senckenberg Biodiversity and Climate Research Centre, Frankfurt, Germany
- 3Ecological Networks, Technische Universität Darmstadt, Darmstadt, Germany
- 4School of Biological Sciences, University of Nebraska, Lincoln, NE, United States
- 5Living Earth Collaborative, Washington University in St. Louis, St. Louis, MO, United States
- 6Department of Ecology and Environmental Science, Umeå University, Umeå, Sweden
More than 70 years after its introduction, the framework of resource density-dependent consumption rates, also known as predator-prey functional responses, remains a core concept in population and food web ecology. Initially, three types of responses were defined: linear (type I), hyperbolic (type II), and sigmoid (type III). Due to its potential to stabilize consumer-resource population dynamics, the sigmoid type III functional response immediately became a “holy grail” in population ecology. However, experimentally proving that type III functional responses exist, whether in controlled laboratory systems or in nature, was challenging. While theoretical and practical advances make identifying type III responses easier today, decades of research have brought only a limited number of studies that provide empirical evidence for type III response curves. Here, we review this evidence from laboratory- and field-based studies published during the last two decades. We found 107 studies that reported type III responses, but these studies ranged across various taxa, interaction types, and ecosystems. To put these studies into context, we also discuss the various biological mechanisms that may lead to the emergence of type III responses. We summarize how three different and mutually independent intricacies bedevil the empirical documentation of type III responses: (1) challenges in statistical modeling of functional responses, (2) inadequate resource density ranges and spacing, and (3) biologically meaningful and realistic design of experimental arenas. Finally, we provide guidelines on how the field should move forward based on these considerations.
1. Introduction
1.1. What are functional responses?
Researchers use functional responses to quantitatively describe the interactions of consumers and resources, including, but not limited to, predator-prey, parasitoid-host, parasite–host, or filter-feeder-plankton interactions. The functional response concept (Solomon, 1949; Holling, 1959a,b) is a cornerstone of population and food-web ecology and is still widely relevant (e.g., DeLong, 2021; Gobin et al., 2022). Solomon (1949) introduced the idea by stating:
“…there must be a functional response to (say) an increase in the host density, because of the increased availability of victims: as host density rises, each enemy will attack more host individuals,…”.
Holling (1959b) subsequently defined three basic functional response types: the rectilinear type I, H1, (often linear without satiation, H0), the hyperbolic type II, H2, and the sigmoid type III, H3 (Figures 1A–C; Table 1). Over the following decades, scientists developed dozens of modifications for these three basic functional response types: dome-shaped types (e.g., Jeschke et al., 2004), multi-resource types (e.g., Oaten and Murdoch, 1975; Koen-Alonso, 2007), consumer-interference types (Beddington, 1975; DeAngelis et al., 1975; Crowley and Martin, 1989), consumer-resource-ratio types (Hassell and Varley, 1969; Arditi and Ginzburg, 1989), and many more (see Jeschke et al., 2002). Combining types is possible, e.g., sigmoid consumer-resource-ratio responses (e.g., Hossie and Murray, 2016). H1 has long been considered the dominant form in filter feeders (Jeschke et al., 2004). However, Sarnelle and Wilson (2008) suggested that H1 is often an artifact due to the lack of low resource densities in laboratory settings (Figure 1C). Moreover, natural resource densities are frequently narrow, with very high densities missing, leading to unsaturated H0 (Coblentz et al., 2022a; Figure 1C).
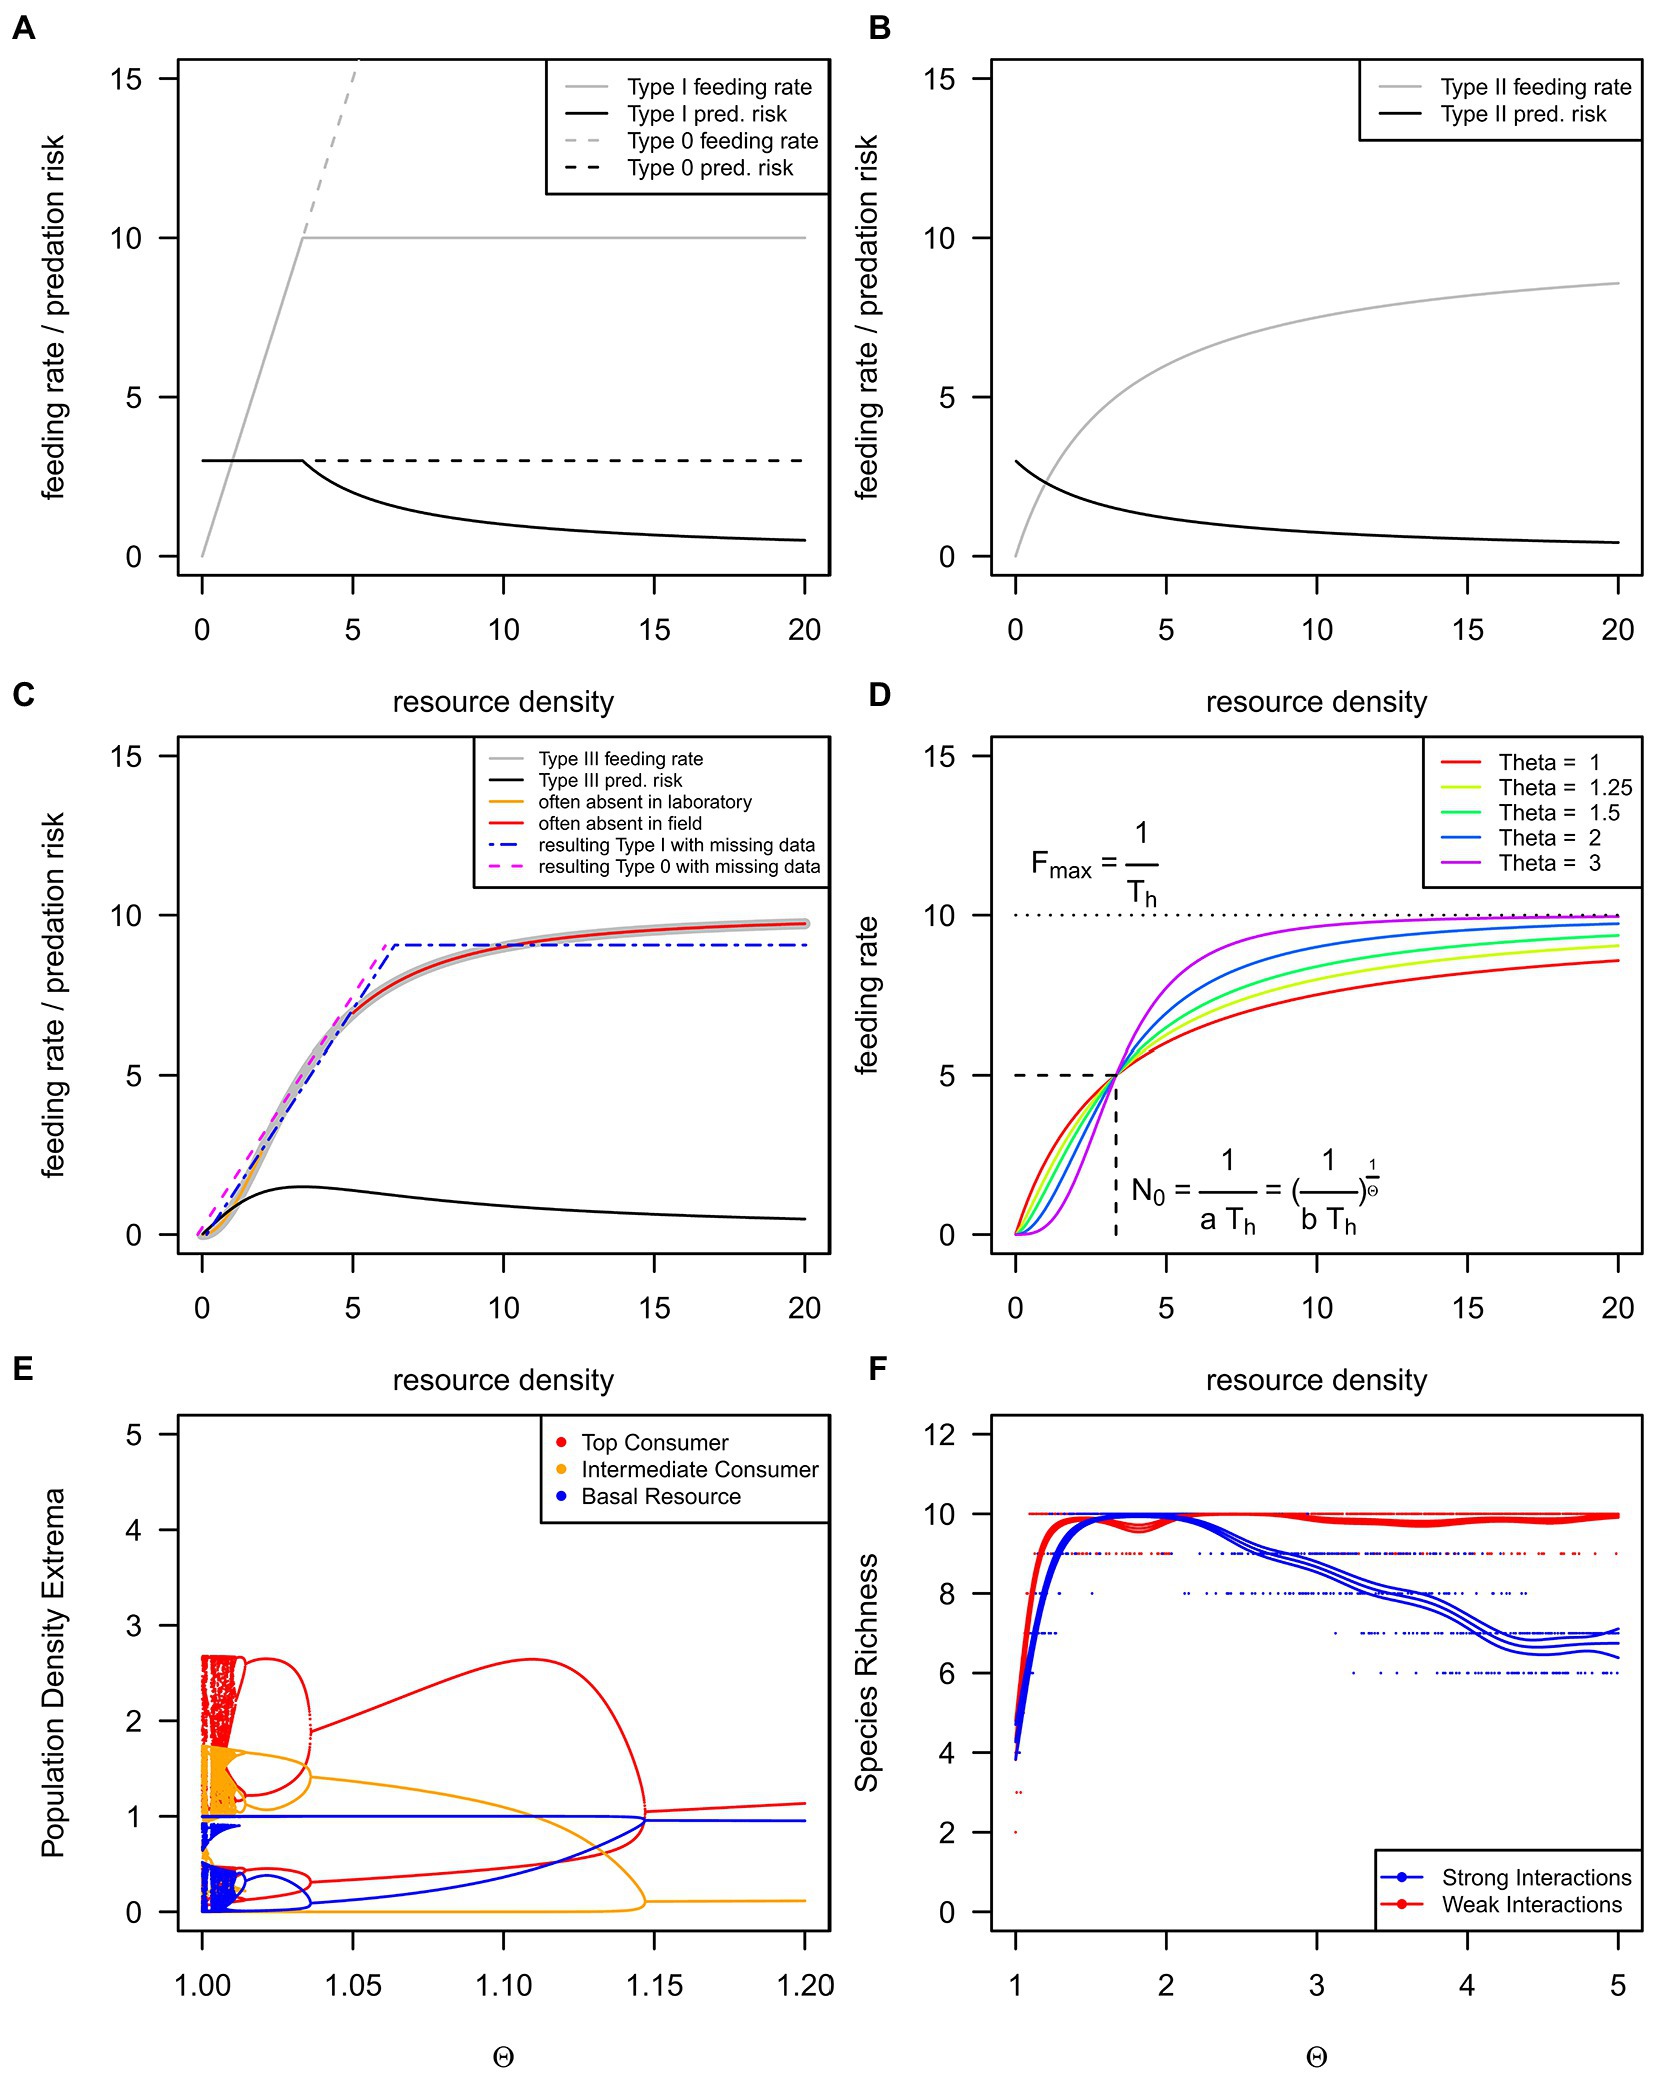
Figure 1. We show the three basic functional response types as grey lines and the corresponding per-resource item consumption risks as black lines (A–C). The type I functional response appears in the literature as a rectilinear [(A), solid grey line, H1] or strictly linear function [(A), dashed grey line, H0], but see Table 1 for details. An inadequate resource density range may lead to incorrect response type classification (C). The rectilinear functional response (H1) may be found if low resource densities are lacking in experiments (Sarnelle and Wilson, 2008), as shown by the orange line and blue dotted-dashed line in (C). The strictly linear functional response (H0) may be found if high, saturating resource densities rarely occur in natural conditions (Coblentz et al., 2022a); see magenta dashed and red lines in (C). The generalized or θ-sigmoid functional response (D) can exhibit differently strong s-shapes controlled by the θ exponent. (E) The population dynamics of a three-species food chain (Otto et al., 2007) across a gradient of the θ exponent. Every data point denotes a single maximum or minimum of a time series, but see Rall et al. (2023) for methodology and Rall (2023) for code. (F) The species richness of a 10-species food web (Williams and Martinez, 2004) across a gradient of the θ exponent, but see Rall et al. (2023) for methodology and Rall (2023) for code.
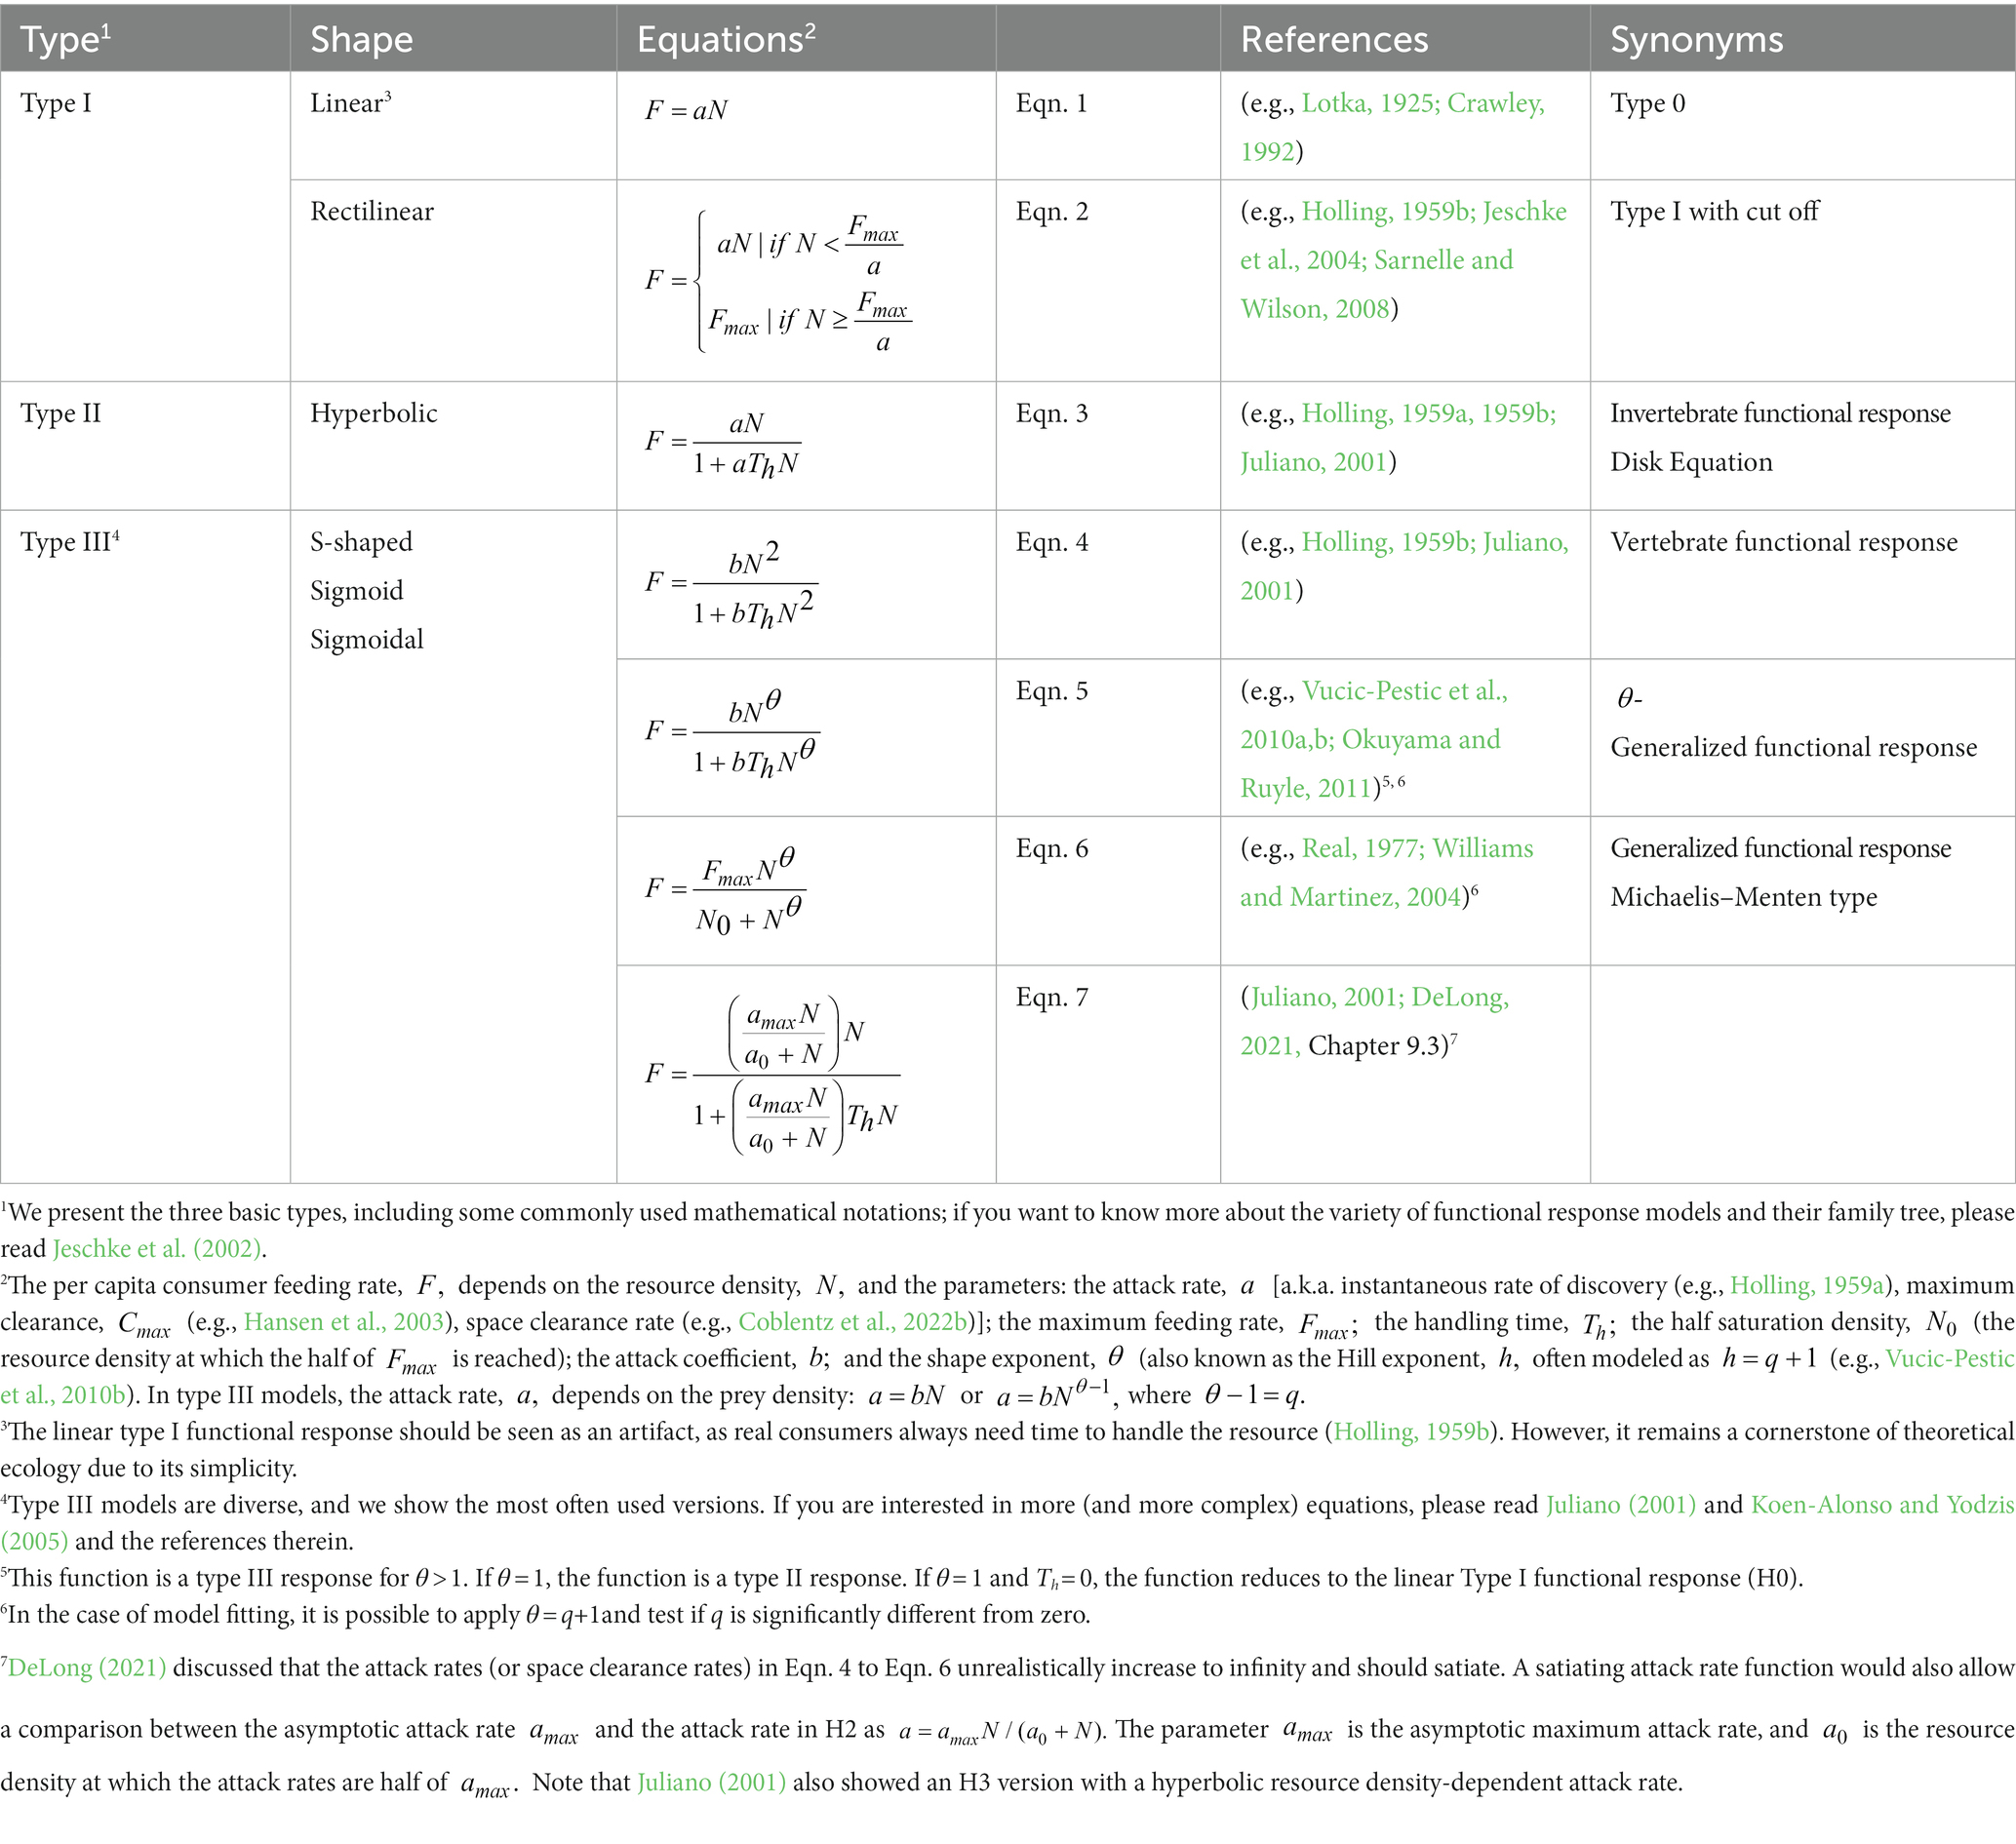
Table 1. The three basic functional response models introduced by Holling (1959b), including some newer interpretations and generalizations.
Real (1977) developed a functional response type allowing for seamless shifting from H2 to H3 (see Figure 1D and Eqns 5/6 in Table 1 for details): the generalized or θ-sigmoid response. If the shaping parameter θ (Theta) is 1, the generalized response becomes H2, and if the shaping parameter θ is larger than 1, the generalized response becomes H3 (see Figure 1D and Eqns 5/6 in Table 1 for details). Because of their implications for population dynamics, we focus on resource-density-dependent H3 (θ > 1, see Eqn. 4–7) and why they are rare compared to the most often reported H2 (θ = 1).
1.2. Why is it essential to investigate the functional response type?
We can answer this question by looking at populations and communities. The risk of resource individuals being consumed decreases for H2 with increasing resource densities (Figure 1B; black lines). If resources grow in abundance, top-down control exerted by the consumer diminishes, leading to the well-known consumer-resource cycles (e.g., the lynx-snowshoe hare cycles; Elton and Nicholson, 1942). Due to the initial increase in predation risk with increasing resource densities (Figure 1C; black line), H3 tends to stabilize consumer-resource systems (Murdoch and Oaten, 1975). If resource abundance increases, consumers’ top-down pressure increases. Resources cannot escape the consumers’ control, and the resulting population dynamics lead to a stable equilibrium (Murdoch and Oaten, 1975; Rall et al., 2008).
For instance, the population dynamics of a three-species food chain (Otto et al., 2007) are chaotic for H2 (Figure 1E; very left side of the graph). If the shape becomes more sigmoid (H3), regular cycles occur first (θ ≈ 1.02), followed by stable equilibrium dynamics (θ ≈ 1.04; Figure 1E; middle to the right side of the graph). These changes in population dynamics also affect biodiversity (Figure 1F; Williams and Martinez, 2004). While the functional response becomes more sigmoid (H3), species diversity increases and remains on a diversity plateau. In the case of weak interactions, biodiversity may decrease again for extreme s-shapes (θ ≈ 2.2; Figure 1F). This decrease happens because population densities are trapped at low values, and higher trophic levels cannot be sustained (Rall et al., 2008). Natural ecosystems are assumed to be stable and biodiverse (MacArthur, 1955), contrasting the mathematical findings of diverse systems (May, 1972). These mathematical predictions are, however, based on simple H1 and H2 responses, whereas more recent studies showed that large ecosystems could be stable and biodiverse because of the H3 response (e.g., Williams and Martinez, 2004; Rall et al., 2008). Considering these theoretical findings, H3 should also be frequent in nature and subsequently frequently reported in the literature.
1.3. The appearance of type III functional responses in former literature
Contrasting the considerations above, review studies that compared the appearance of different functional response types in the literature concluded that the proportion of H3 is generally below ~15% (Jeschke et al., 2004; Kalinkat and Rall, 2015). Therefore, meta-studies typically focused on the parameters of the H2 model (Hansen et al., 2003; Englund et al., 2011; Pawar et al., 2012; Rall et al., 2012; Li et al., 2018; Uiterwaal et al., 2022). We postulate that this previous focus on H2 created a precarious knowledge gap, particularly given that the shape of the functional response is essential if we want to learn about the stability of natural systems in times of global change and beyond.
Here, we address if and why the sigmoid type III functional response, H3, is still rare in the literature. First, we review the conditions leading to H3. Second, we reviewed studies from the past ~20 years that found H3. Third, we highlight the experimental and statistical challenges of detecting H3. Fourth, we provide an outlook in our conclusion on where the field should be moving.
2. What causes type III functional responses?
2.1. Learning, adaptive foraging, and prey switching
Various mechanisms can cause the H3 response. Holling (1966) assigned H2 to invertebrate consumers and H3 to vertebrate consumers. He justified this separation by suggesting that vertebrates can learn to use more abundant resources better. This early classification was the basis for the H3 occasionally being called the “vertebrate functional response.” However, Holling (1966) acknowledged that invertebrate consumers like cephalopods or Hymenoptera might also be able to generate an H3. This idea was later proven correct: researchers found H3 for many different invertebrate consumers (e.g., Hassell et al., 1977; Akre and Johnson, 1979; Colton, 1987; Sarnelle and Wilson, 2008; Kreuzinger-Janik et al., 2019).
All empirical examples for H3 by Holling (1966) included at least one alternative resource. This remarkable feature was picked up in later research and became known as prey switching (e.g., Murdoch et al., 1975; Akre and Johnson, 1979) or adaptive foraging (e.g., Kondoh, 2003; Heckmann et al., 2012). Prey switching was used as the overarching hypothesis to explain H3 responses (e.g., Akre and Johnson, 1979), independent of whether the predator was a vertebrate. Later research showed that two single-resource-H3 combined in a multi-species functional response framework might lead to patterns that look like prey switching (Kalinkat et al., 2011). In other words, researchers need to consider that H3 can come about in single resource scenarios, in which prey switching would not be the mechanism leading to the sigmoid shape of the functional response. Many older studies that documented an H3 in the presence of an alternative resource did not test the single-resource case. Thus, in many cases, prey switching may not be the true reason for finding H3 (see Colton, 1987; Kalinkat et al., 2011; DeLong, 2021).
2.2. Physiology and other behavior
Hassell et al. (1977) reviewed studies showing H3 in invertebrates without an alternative resource. The authors argued that it is energetically inefficient to continue foraging with the same effort at low resource densities, which would lead to a decrease in encounters with decreasing resource availability. This insight is also true for filter feeders that reduce their clearance rate if resources become scarce (e.g., Sarnelle and Wilson, 2008; Sarnelle et al., 2015; Uszko et al., 2015). Hassell et al. (1977) also indicated that this effect is even more evident if consumers are faced with a sub-optimal resource (e.g., not the optimal size). Along the same line, induced defenses of the resource may shift H2 to H3 (Hammill et al., 2010) as better-defended resources require more energy to consume. In addition, the clumping of resource organisms can also induce a shift to H3 (Hossie and Murray, 2016).
2.3. Environment
The resources’ role in explaining the H3 seems promising, following the discussion by Hassell et al. (1977) and the findings of Hammill et al. (2010). For instance, spatial refuges in a structurally complex habitat protect a certain number of resource individuals, creating less consumption pressure at very low resource densities and, ultimately, an H3 (e.g., Scheffer and De Boer, 1995). This mechanism is related to the relative size of consumers and resources: resources much smaller than the consumer can escape into small refuges inaccessible to large predators (Vucic-Pestic et al., 2010a; Kalinkat et al., 2013a; Barrios-O’Neill et al., 2015, 2016). However, a habitat-induced shift in predator-hunting strategy can also lead to H3 (Hossie and Murray, 2010). Notably, body size alone can cause an H3 even without habitat (Barbosa et al., 2014), explainable by the energy-saving principles mentioned above (see also Kalinkat et al., 2013b).
Additionally, the temperature may influence the functional response shape (Uszko et al., 2017; Daugaard et al., 2019). Warming can induce a shift from H3 to H2, which may potentially destabilize population dynamics (Daugaard et al., 2019). However, suppose consumers are more likely to reduce search rates at low resource densities below and above their optimum temperature. In that case, warming can lead to more complex shifts in functional response shapes (Uszko et al., 2017).
2.4. Conclusions on mechanisms
In conclusion, we can roughly categorize H3-inducing effects into changes in physiology, behavior, or morphology that can but do not have to be induced by the presence of an alternative resource. Environmental properties, such as the availability of refuges or changing temperatures, can also cause H3. Additionally, the different mechanisms leading to H3 may interact. For instance, only smaller resource individuals can hide in refuges that large consumers cannot access. Generally, suboptimal resources or circumstances for the predator may lead to H3 (Hassell et al., 1977; Vucic-Pestic et al., 2010a,b; Barrios-O’Neill et al., 2016; Uszko et al., 2017; Daugaard et al., 2019). These mechanisms can manifest across various taxonomic groups, habitat types, and consumer types, challenging the common belief that H3 is restricted to only a handful of specific scenarios.
3. Literature review
We found 107 studies that reported H3 [see the data and data methods by Kalinkat et al. (2023) on Zenodo for details] and categorized them according to (1) habitat, (2) taxonomy, (3) consumer types, (4) experimental setting (field vs. laboratory), and (5) methodology. Further, we (6) checked if the observed H3 could be attributed to any of the above mechanisms.
We noticed that organisms from terrestrial habitats feature disproportionately often in studies that found H3 (~17% freshwater, ~25% marine, and ~ 57% terrestrial). This finding contrasts the recently assembled functional response database in which habitats were relatively evenly distributed in the functional response literature (Uiterwaal et al., 2022). Experimental arenas for terrestrial organisms often provide refuges, which may generate H3 (e.g., Vucic-Pestic et al., 2010a,b). Nevertheless, H3 can also occur in unstructured (e.g., pelagic) habitats (e.g., Sarnelle and Wilson, 2008). Researchers in different habitat types possibly employed different standard experimental settings or model fitting techniques that could cause the mismatch. However, analyzing this was beyond the scope of the present review.
The consumer taxonomy was also unevenly distributed: ~79% of all studies included invertebrate consumers, ~21% vertebrate consumers, and protists and fungi occurred only in single studies (<1% each). This finding further confirms that H3 is not exclusive to vertebrate consumers (Hassell et al., 1977). The relatively high frequency of invertebrates in our analyses might be because invertebrates are well-suited laboratory animals in a field where laboratory studies dominate (see below).
The consumer types were dominated by true predators (~64%), followed by parasitoids (~21%), filter feeders (~13%), and grazers and parasites that occurred only in single studies (<1% each). This uneven distribution is partially due to the abundance of biological control studies, which predominantly use terrestrial invertebrate predators.
Laboratory studies (82%) dominated the literature for experimental settings compared to field-based studies (18%). Given the vast discrepancy in logistics and costs, this might be expected. While data for a simple laboratory study can be generated in a few days, field-based studies are often more laborious, time-consuming, and costly.
The method used to estimate the functional response was nearly always counting resource items before and after the experiment and applying a standardized statistical model fit (e.g., Juliano, 2001). We found this combination in 99% of the laboratory studies in the dataset, which are 82% of all studies. Methods that have also been used include stomach content analyzes (7%, 37% of field studies), fecal analyzes (5%, 26% of field studies), and counting of prey items delivered to juveniles (2%, 11% of field studies). We also found more advanced methods like radioactive labeling of food items (Fussmann et al., 2005) and complex population modeling approaches (Koen-Alonso and Yodzis, 2005; Maszczyk et al., 2018).
The search for a specific mechanism explaining the functional response shape was the goal of only a few studies. In most cases, the H3 was simply the better statistical fit, and mechanisms were minimally discussed. One of the rare examples where authors tested a mechanism was by Hammill et al. (2010), where induced prey defenses caused a shift from H2 toward H3. If the study authors did not explicitly test for a mechanism, we assigned it based on the study design and discussion provided by the authors, which was possible for 61% of all studies. Prey switching (15% of all studies) and energy saving at low prey densities (10% of all studies) were relatively common. Field studies documented prey-switching disproportionately often, and this finding is likely caused by the fact that alternative resources are naturally present. But as it is nearly impossible to measure single-resource functional responses in the field without alternative prey, it is also unclear if prey switching was the mechanism causing H3 or whether the single-prey functional response would have also been H3 (Kalinkat et al., 2011).
In conclusion, we see a strong need for future studies that explicitly test for the mechanisms behind the H3 in various taxa. We also encourage researchers to consider potential mechanisms of different functional response shapes when designing and interpreting their feeding experiments and field observations.
4. Future challenges
4.1. Experimental design
Several studies have discussed the challenges in setting up functional response experiments to make them logistically feasible while simultaneously ensuring biologically realistic conditions. For instance, arena size and edges, experimental duration, and consumers’ starvation may substantially affect functional response parameter estimates (Li et al., 2018; Uiterwaal and DeLong, 2018; Uiterwaal et al., 2019; Juliano et al., 2022). More specifically, the detection of H3 might be biased if using resources unknown to the consumer or generally non-favorable experimental settings (Hassell et al., 1977).
We mentioned above that several biological and environmental mechanisms might lead to H3. For instance, if no habitat structure is provided, the probability of detecting H3 is reduced (e.g., Vucic-Pestic et al., 2010a). Therefore, habitat structure is an essential part of experimental design for many (but not all) consumer-resource interactions. Also, energy savings at low resource densities can lead to H3, so low resource densities are necessary for any setup (Sarnelle and Wilson, 2008). In addition, using logarithmic scaling for choosing the experimental resource densities further improves the detectability of H3 (Uszko et al., 2020; Novak and Stouffer, 2021b).
To establish low prey densities, larger experimental arenas are needed. Larger experimental arenas, however, lead to a concentration of consumers and resources at the arena edges (Uiterwaal et al., 2019), increasing foraging rates and altering parameter estimates. In some cases, resource aggregation can conversely cause resource density to shrink virtually (Vucic-Pestic et al., 2010a), eventually leading to reduced predation, rendering H3 detection difficult. Thus, efforts to reduce resource densities through large arenas should consider the behavioral effects of these arenas on experimental organisms.
4.2. Statistical approaches
The chance of detecting H3 depends on the amount and quality of the acquired data. Reduced availability and high variability of observed data, especially at low resource densities, can prevent a correct characterization of the response type. In particular, H2 may be chosen due to its parsimony compared to the generalized functional response (two versus three fitted parameters, respectively) if the variance is high (Marshal and Boutin, 1999). Additionally, the best-fitting functional response model may depend on the sample size (Novak and Stouffer, 2021a). For instance, the weaker an H3 is (e.g., θ close to 1), the more data is needed to find significant results supporting an H3 (Marshal and Boutin, 1999).
A hallmark of H3 is an accelerating feeding rate at low resource densities. The classical approach is fitting a polynomial to the predation risk data (see Figures 1A–C; black lines) and checking for the significance of the (negative) quadratic term (Juliano, 2001). Subsequently, the researchers fit either H2 (Eqn. 3) or H3 (Eqn. 4) to the feeding data. Alternatively, testing the significance of the shaping exponent, θ (Eqn. 5–6), in the generalized functional response model (e.g., Vucic-Pestic et al., 2010b) or comparing a variety of models using information criteria (e.g., Rosenbaum and Rall, 2018) might be promising alternatives. However, all these methods may fail to detect H3, especially if the acquired data at low resource densities are scarce (Okuyama, 2013).
Rosenbaum and Rall (2018) compared several methods to fit functional responses. The new approach presented by the authors was the only way to estimate the generalized functional response model parameters correctly. All other models, including the widely used Rogers Random Predator Equation (Juliano, 2001), systematically misestimated the attack coefficient (for ). Moreover, the method is suitable to fit also more complex H3 formulations (e.g., Eqn. 7), as it simulates the process of predation over time. Uszko et al. (2020) employed this new method and suggested a logarithmic data transformation to improve fit precision and accuracy. Novak and Stouffer (2021b) additionally pointed out the varying geometric complexity of different models (i.e., their flexibility in fitting data) as an essential factor in model choice and parameter estimation. These recent advances, coupled with the development of open-source fitting scripts (e.g., as provided by Rosenbaum and Rall, 2018), can significantly improve the detection of functional response types and reliable parameter estimation.
4.3. Recommendations for future functional response experiments
Researchers planning functional response experiments should take the following advice into account:
(1) Particularly in terrestrial and benthic environments, it is desirable to include habitat structure. Habitat provides hiding space and creates more realistic interactions.
(2) Use a well-balanced experimental arena size.
(3) Always incorporate low resource densities; otherwise, detecting an H3 is impossible!
(4) Space your resource density levels logarithmically.
(5) Use reliable, up-to-date fitting techniques combined with the generalized functional response model to distinguish between H2 and H3.
5. Conclusion
We were motivated to write this review by our observation that Holling’s type III functional responses (H3) seemed underreported in the literature. Moreover, the classical view that H3 is the “vertebrate functional response” seems outdated, as even “simple” consumers may exhibit an H3 (e.g., Sarnelle et al., 2015; Kreuzinger-Janik et al., 2019). Also, H3 is known to stabilize ecosystems and enhance biodiversity. It should therefore be common in the experimental literature, but on the other hand, it seems that many researchers do not fully consider H3 when studying functional responses. We were startled to find just slightly more than 100 H3 studies in 20 years. Still, it is a fair share compared to the 543 studies from 1959 to 2021 reported in a current type-independent functional response database (DeLong and Uiterwaal, 2018, version 2; Uiterwaal et al., 2022). Given what we know about the challenges in experimental design and model fitting, we think that it is very likely that there are many more scenarios out there where H3 responses prevail in nature. Nevertheless, their detection remains limited in both laboratory experiments and field studies. Given the importance of H3 and the need to improve realism in investigating and applying functional response models (Griffen, 2021), we encourage researchers to design experiments to discover type III functional responses.
Data availability statement
All code and data presented in our review are accessible online. Find the data, including a methods description, from the literature review here: https://doi.org/10.5281/zenodo.7620216 (Kalinkat et al., 2023). Find a stable version of the code here: https://doi.org/10.5281/zenodo.7637479 (Rall, 2023). Find the code history here: https://github.com/b-c-r/rare-type-3-responses. Find the methods of the simulation model and a code description here: https://doi.org/10.5281/zenodo.7619822 (Rall et al., 2023).
Author contributions
GK and BCR contributed equally to this manuscript. GK developed the original idea for this manuscript and wrote the first draft with contributions from SFU, BCR, and WU. BCR led the revision with contributions from GK, SFU, and WU. All authors approved the final manuscript and contributed to the literature research and edited the manuscript.
Funding
BCR gratefully acknowledges the funding by the German Science Foundation (DFG) to the Research Unit Kili-SES (FOR 5064). The publication of this article was funded by the Open Access Fund of the Leibniz Association.
Acknowledgments
We thank our funders and two reviewers that helped improve our manuscript substantially.
Conflict of interest
The authors declare that the research was conducted in the absence of any commercial or financial relationships that could be construed as a potential conflict of interest.
Publisher’s note
All claims expressed in this article are solely those of the authors and do not necessarily represent those of their affiliated organizations, or those of the publisher, the editors and the reviewers. Any product that may be evaluated in this article, or claim that may be made by its manufacturer, is not guaranteed or endorsed by the publisher.
References
Akre, B. G., and Johnson, D. M. (1979). Switching and sigmoid functional response curves by damselfly naiads with alternative prey available. J. Anim. Ecol. 48, 703–720. doi: 10.2307/4191
Arditi, R., and Ginzburg, L. R. (1989). Coupling in predator-prey dynamics: ratio-dependence. J. Theor. Biol. 139, 311–326. doi: 10.1016/S0022-5193(89)80211-5
Barbosa, P. R. R., Oliveira, M. D., Giorgi, J. A., Silva-Torres, C. S. A., and Torres, J. B. (2014). Predatory behavior and life history of Tenuisvalvae notata (Coleoptera: Coccinellidae) under variable prey availability conditions. Fla. Entomol. 97, 1026–1034. doi: 10.1653/024.097.0304
Barrios-O’Neill, D., Kelly, R., Dick, J. T. A., Ricciardi, A., MacIsaac, H. J., and Emmerson, M. C. (2016). On the context-dependent scaling of consumer feeding rates. Ecol. Lett. 19, 668–678. doi: 10.1111/ele.12605
Barrios-O’Neill, D., Dick, J. T. A., Emmerson, M. C., Ricciardi, A., and MacIsaac, H. J. (2015). Predator-free space, functional responses and biological invasions. Funct. Ecol. 29, 377–384. doi: 10.1111/1365-2435.12347
Beddington, J. R. (1975). Mutual interference between parasites or predators and its effect on searching efficiency. J. Anim. Ecol. 44:331. doi: 10.2307/3866
Coblentz, K. E., Novak, M., and DeLong, J. P. (2022a). Predator feeding rates may often be unsaturated under typical prey densities. Ecol. Lett. 26, 302–312. doi: 10.1111/ele.14151
Coblentz, K. E., Squires, A., Uiterwaal, S., and Delong, J. P. (2022b). Quantifying predator functional responses under field conditions reveals interactive effects of temperature and interference with sex and stage. J. Anim. Ecol. 91, 1431–1443. doi: 10.1111/1365-2656.13703
Colton, T. F. (1987). Extending functional-response models to include a 2nd prey type - an experimental test. Ecology 68, 900–912. doi: 10.2307/1938361
Crawley, M. J. (1992). “Population dynamics of natural enemies and their prey,” in Natural Enemies. ed. M. J. Crawley (Oxford, UK: Blackwell Scientific Publications), 40–89.
Crowley, P. H., and Martin, E. K. (1989). Functional responses and interference within and between year classes of a dragonfly population. J. North Am. Benthol. Soc. 8, 211–221. doi: 10.2307/1467324
Daugaard, U., Petchey, O. L., and Pennekamp, F. (2019). Warming can destabilize predator–prey interactions by shifting the functional response from type III to type II. J. Anim. Ecol. 88, 1575–1586. doi: 10.1111/1365-2656.13053
DeAngelis, D. L., Goldstein, R. A., and O’Neill, R. V. (1975). A model for trophic interaction. Ecology 56, 881–892. doi: 10.2307/1936298
DeLong, J. P.. (2021). Predator Ecology: Evolutionary Ecology of the Functional Response. Oxford: Oxford Academic. doi: 10.1093/oso/9780192895509.001.0001
DeLong, J., and Uiterwaal, S.. (2018). The FoRAGE (Functional Responses from around the Globe in all Ecosystems) database: a compilation of functional responses for consumers and parasitoids. doi: 10.5063/DB807S
Elton, C., and Nicholson, M. (1942). The ten-year cycle in numbers of the lynx in Canada. J. Anim. Ecol. 11:215. doi: 10.2307/1358
Englund, G., Öhlund, G., Hein, C. L., and Diehl, S. (2011). Temperature dependence of the functional response: temperature dependence of consumption. Ecol. Lett. 14, 914–921. doi: 10.1111/j.1461-0248.2011.01661.x
Fussmann, G. F., Weithoff, G., and Yoshida, T. (2005). A direct, experimental test of resource vs consumer dependence. Ecology 86, 2924–2930. doi: 10.1890/04-1107
Gobin, J., Hossie, T. J., Derbyshire, R. E., Sonnega, S., Cambridge, T. W., Scholl, L., et al. (2022). Functional responses shape node and network level properties of a simplified boreal food web. Front. Ecol. Evol. 10:898805. doi: 10.3389/fevo.2022.898805
Griffen, B. D. (2021). Considerations when applying the consumer functional response measured under artificial conditions. Front. Ecol. Evol. 9:713147. doi: 10.3389/fevo.2021.713147
Hammill, E., Petchey, O. L., and Anholt, B. R. (2010). Predator functional response changed by induced defenses in prey. Am. Nat. 176, 723–731. doi: 10.1086/657040
Hansen, P. J., Bjørnsen, P. K., and Hansen, B. W. (2003). Zooplankton grazing and growth: scaling within the 2-2,000-μm body size range. Limnol. Oceanogr. 42, 687–704. doi: 10.4319/lo.1997.42.4.0687
Hassell, M. P., Lawton, J. H., and Beddington, J. R. (1977). Sigmoid functional responses by invertebrate predators and parasitoids. J. Anim. Ecol. 46, 249–262. doi: 10.2307/3959
Hassell, M. P., and Varley, G. C. (1969). New inductive population model for insect parasites and its bearing on biological control. Nature 223, 1133–1137. doi: 10.1038/2231133a0
Heckmann, L., Drossel, B., Brose, U., and Guill, C. (2012). Interactive effects of body-size structure and adaptive foraging on food-web stability. Ecol. Lett. 15, 243–250. doi: 10.1111/j.1461-0248.2011.01733.x
Holling, C. S. (1959a). Some characteristics of simple types of predation and parasitism. Can. Entomol. 91, 385–398. doi: 10.4039/Ent91385-7
Holling, C. S. (1959b). The components of predation as revealed by a study of small-mammal predation of the european pine sawfly. Can. Entomol. 91, 293–320. doi: 10.4039/Ent91293-5
Holling, C. S. (1966). The functional response of invertebrate predators to prey density. Mem. Entomol. Soc. Can. 98, 5–86. doi: 10.4039/entm9848fv
Hossie, T. J., and Murray, D. L. (2010). You can’t run but you can hide: refuge use in frog tadpoles elicits density-dependent predation by dragonfly larvae. Oecologia 163, 395–404. doi: 10.1007/s00442-010-1568-6
Hossie, T. J., and Murray, D. L. (2016). Spatial arrangement of prey affects the shape of ratio-dependent functional response in strongly antagonistic predators. Ecology 97, 834–841. doi: 10.1890/15-1535.1
Jeschke, J. M., Kopp, M., and Tollrian, R. (2002). Predator functional responses: discriminating between handling and digesting prey. Ecol. Monogr. 72:18. doi: 10.1890/0012-9615(2002)072[0095:PFRDBH]2.0.CO;2
Jeschke, J. M., Kopp, M., and Tollrian, R. (2004). Consumer-food systems: why type I functional responses are exclusive to filter feeders. Biol. Rev. 79, 337–349. doi: 10.1017/S1464793103006286
Juliano, S. A. (2001). “Nonlinear curve fitting: predation and functional response curves,” in Design and Analysis of Ecological Experiments. eds. S. M. Scheiner and J. Gurevitch (London: Chapman and Hall), 178–196.
Juliano, S. A., Goughnour, J. A., and Ower, G. D. (2022). Predation in many dimensions: spatial context is important for meaningful functional response experiments. Front. Ecol. Evol. 10:845560. doi: 10.3389/fevo.2022.845560
Kalinkat, G., Brose, U., and Rall, B. C. (2013a). Habitat structure alters top-down control in litter communities. Oecologia 172, 877–887. doi: 10.1007/s00442-012-2530-6
Kalinkat, G., and Rall, B. C. (2015). “Effects of climate change on the interactions between insect pests and their natural enemies” in Climate Change and Insect Pests. eds. C. Björkman and P. Niemelä (Wallingford: CABI), 74–91.
Kalinkat, G., Rall, B. C., Uiterwaal, S. F., and Uszko, W. (2023). Rare type III responses: data and data methods (v1.0.0). Zenodo. doi: 10.5281/zenodo.7620216
Kalinkat, G., Rall, B. C., Vucic-Pestic, O., and Brose, U. (2011). The allometry of prey preferences. PLoS One 6:e25937. doi: 10.1371/journal.pone.0025937
Kalinkat, G., Schneider, F. D., Digel, C., Guill, C., Rall, B. C., and Brose, U. (2013b). Body masses, functional responses and predator-prey stability. Ecol. Lett. 16, 1126–1134. doi: 10.1111/ele.12147
Koen-Alonso, M. (2007). “A process-oriented approach to the multispecies functional response,” in From Energetics to Ecosystems: The Dynamics and Structure of Ecological Systems the Peter Yodzis Fundamental Ecology Series. eds. N. Rooney, K. S. MCann, and D. L. G. Noakes (Dordrecht: Springer), 1–36.
Koen-Alonso, M., and Yodzis, P. (2005). Multispecies modelling of some components of the marine community of northern and Central Patagonia. Argent. Can. J. Fish. Aquat. Sci. 62, 1490–1512. doi: 10.1139/f05-087
Kondoh, M. (2003). Foraging adaptation and the relationship between food-web complexity and stability. Science 299, 1388–1391. doi: 10.1126/science.1079154
Kreuzinger-Janik, B., Brüchner- Hüttemann, H., and Traunspurger, W. (2019). Effect of prey size and structural complexity on the functional response in a nematode- nematode system. Sci. Rep. 9:5696. doi: 10.1038/s41598-019-42213-x
Li, Y., Rall, B. C., and Kalinkat, G. (2018). Experimental duration and predator satiation levels systematically affect functional response parameters. Oikos 127, 590–598. doi: 10.1111/oik.04479
Lotka, A. J.. (1925). Elements of Physical Biology. Baltimore, MD, USA: Williams & Wilkens Company, Baltimore.
MacArthur, R. (1955). Fluctuations of animal populations and a measure of community stability. Ecology 36:533. doi: 10.2307/1929601
Marshal, J. P., and Boutin, S. (1999). Power analysis of wolf-moose functional responses. J. Wildl. Manag. 63, 396–402. doi: 10.2307/3802525
Maszczyk, P., Babkiewicz, E., Czarnocka-Cieciura, M., Gliwicz, Z. M., Uchmański, J., and Urban, P. (2018). Ideal free distribution of daphnia under predation risk–model predictions and experimental verification. J. Plankton Res. 40, 471–485. doi: 10.1093/plankt/fby024
May, R. M. (1972). Will a large complex system be stable? Nature 238, 413–414. doi: 10.1038/238413a0
Murdoch, W. W., Avery, S., and Smyth, M. E. B. (1975). Switching in predatory fish. Ecology 56, 1094–1105. doi: 10.2307/1936149
Murdoch, W. W., and Oaten, A. (1975). Predation and population stability. Adv. Ecol. Res. 9, 1–131. doi: 10.1016/S0065-2504(08)60288-3
Novak, M., and Stouffer, D. B. (2021a). Systematic bias in studies of consumer functional responses. Ecol. Lett. 24, 580–593. doi: 10.1111/ele.13660
Novak, M., and Stouffer, D. B. (2021b). Geometric complexity and the information-theoretic comparison of functional-response models. Front. Ecol. Evol. 9:740362. doi: 10.3389/fevo.2021.740362
Oaten, A., and Murdoch, W. W. (1975). Switching, functional response, and stability in predator-prey systems. Am. Nat. 109, 299–318. doi: 10.1086/282999
Okuyama, T. (2013). On selection of functional response models: Holling’s models and more. BioControl 58, 293–298. doi: 10.1007/s10526-012-9492-9
Okuyama, T., and Ruyle, R. L. (2011). Solutions for functional response experiments. Acta Oecol. 37, 512–516. doi: 10.1016/j.actao.2011.07.002
Otto, S. B., Rall, B. C., and Brose, U. (2007). Allometric degree distributions facilitate food-web stability. Nature 450, 1226–1229. doi: 10.1038/nature06359
Pawar, S., Dell, A. I., and Savage, V. M. (2012). Dimensionality of consumer search space drives trophic interaction strengths. Nature 486, 485–489. doi: 10.1038/nature11131
Rall, B. C. (2023). Rare Type III functional responses (Code): Version 1.0.0. doi: 10.5281/zenodo.7637479
Rall, B. C., Brose, U., Hartvig, M., Kalinkat, G., Schwarzmüller, F., Vucic-Pestic, O., et al. (2012). Universal temperature and body-mass scaling of feeding rates. Philos. Trans. R. Soc. B Biol. Sci. 367, 2923–2934. doi: 10.1098/rstb.2012.0242
Rall, B. C., Guill, C., and Brose, U. (2008). Food-web connectance and predator interference dampen the paradox of enrichment. Oikos 117, 202–213. doi: 10.1111/j.2007.0030-1299.15491.x
Rall, B. C., Kalinkat, G., Uiterwaal, S. F., and Uszko, W. (2023). Rare type III responses: methods for code and simulation models (v1.0.0). Zenodo. doi: 10.5281/zenodo.7619822
Rosenbaum, B., and Rall, B. C. (2018). Fitting functional responses: direct parameter estimation by simulating differential equations. Methods Ecol. Evol. 9, 2076–2090. doi: 10.1111/2041-210X.13039
Sarnelle, O., White, J. D., Geelhoed, T. E., and Kozel, C. L. (2015). Type III functional response in the zebra mussel, Dreissena polymorpha. Can. J. Fish. Aquat. Sci. 72, 1202–1207. doi: 10.1139/cjfas-2015-0076
Sarnelle, O., and Wilson, A. E. (2008). Type III functional response in daphnia. Ecology 89, 1723–1732. doi: 10.1890/07-0935.1
Scheffer, M., and De Boer, R. J. (1995). Implications of spatial heterogeneity for the paradox of enrichment. Ecology 76, 2270–2277. doi: 10.2307/1941701
Solomon, M. E. (1949). The natural control of animal populations. J. Anim. Ecol. 18, 1–35. doi: 10.2307/1578
Uiterwaal, S. F., Dell, A. I., and DeLong, J. P. (2019). Arena size modulates functional responses via behavioral mechanisms. Behav. Ecol. 30, 483–489. doi: 10.1093/beheco/ary188
Uiterwaal, S. F., and DeLong, J. P. (2018). Multiple factors, including arena size, shape the functional responses of ladybird beetles. J. Appl. Ecol. 55, 2429–2438. doi: 10.1111/1365-2664.13159
Uiterwaal, S. F., Lagerstrom, I. T., Lyon, S. R., and DeLong, J. P. (2022). FoRAGE database: a compilation of functional responses for consumers and parasitoids. Ecology 103:e3706. doi: 10.1002/ecy.3706
Uszko, W., Diehl, S., Englund, G., and Amarasekare, P. (2017). Effects of warming on predator-prey interactions - a resource-based approach and a theoretical synthesis. Ecol. Lett. 20, 513–523. doi: 10.1111/ele.12755
Uszko, W., Diehl, S., Pitsch, N., Lengfellner, K., and Müller, T. (2015). When is a type III functional response stabilizing? Theory and practice of predicting plankton dynamics under enrichment. Ecology 96, 3243–3256. doi: 10.1890/15-0055.1
Uszko, W., Diehl, S., and Wickman, J. (2020). Fitting functional response surfaces to data: a best practice guide. Ecosphere 11:e03051. doi: 10.1002/ecs2.3051
Vucic-Pestic, O., Birkhofer, K., Rall, B. C., Scheu, S., and Brose, U. (2010a). Habitat structure and prey aggregation determine the functional response in a soil predator-prey interaction. Pedobiologia 53, 307–312. doi: 10.1016/j.pedobi.2010.02.003
Vucic-Pestic, O., Rall, B. C., Kalinkat, G., and Brose, U. (2010b). Allometric functional response model: body masses constrain interaction strengths. J. Anim. Ecol. 79, 249–256. doi: 10.1111/j.1365-2656.2009.01622.x
Keywords: population dynamics, predator-prey interactions, food webs, filter feeder, resource density, stability, chaos, biodiversity
Citation: Kalinkat G, Rall BC, Uiterwaal SF and Uszko W (2023) Empirical evidence of type III functional responses and why it remains rare. Front. Ecol. Evol. 11:1033818. doi: 10.3389/fevo.2023.1033818
Edited by:
Dennis Murray, Trent University, CanadaCopyright © 2023 Kalinkat, Rall, Uiterwaal and Uszko. This is an open-access article distributed under the terms of the Creative Commons Attribution License (CC BY). The use, distribution or reproduction in other forums is permitted, provided the original author(s) and the copyright owner(s) are credited and that the original publication in this journal is cited, in accordance with accepted academic practice. No use, distribution or reproduction is permitted which does not comply with these terms.
*Correspondence: Gregor Kalinkat, gregor.kalinkat@igb-berlin.de; Björn C. Rall, b-c-r@mailbox.org
†These authors have contributed equally to this work