Multiscale ecological niche modeling exhibits varying climate change impacts on habitat suitability of Madrean Pine-Oak trees
 Joshua D. Carrell
 April I. Phinney
 Kaeli Mueller
 Brennan Bean6
- 1Department of Wildland Resources, Utah State University, Logan, UT, United States
- 2Ecology Center, Utah State University, Logan, UT, United States
- 3Climate Adaptation Science Program, Utah State University, Logan, UT, United States
- 4Department of Geosciences, Utah State University, Logan, UT, United States
- 5Department of Environment and Society, Utah State University, Logan, UT, United States
- 6Department of Mathematics and Statistics, Utah State University, Logan, UT, United States
Anthropogenic climate change and increasing greenhouse gas emissions are expected to globally impact the biological function, community structure, and spatial distribution of biodiversity. Many existing studies explore the effect of climate change on biodiversity, generally at a single spatial scale. This study explores the potential effects of climate change on the habitat suitability of seven tree species at two distinct spatial scales: the Coronado National Forest (CNF), a local management area, and the Sierra Madre Occidental (SMO), an ecoregional extent. Habitat suitability was determined by extrapolating Ecological Niche Models (ENMs) based on citizen-science tree occurrence records into future climatic conditions using projected 30-year normals for two anthropogenic emissions scenarios through the end of the century. These ENMs, examined at a spatial resolution of 1 km2, are constructed using a mean average ensemble of three commonly used machine learning algorithms. The results show that habitat suitability is expected to decrease for all seven tree species at varying degrees. Results also show that climate-forcing scenario choice appears to be far less important for understanding changes in species habitat suitability than the spatial scale of modeling extent. Additionally, we observed non-linear changes in tree species habitat suitability within the SMO and CNF dependent on forest community type, latitude, and elevational gradient. The paper concludes with a discussion of the necessary steps to verify the estimated alters of these tree species under climate change. Most importantly, provides a framework for characterizing habitat suitability across spatial scales.
1. Introduction
Observed changes in Earth’s physical and biological systems are directly related to the forcings of anthropogenic climate change (Rosenzweig et al., 2008; Hansen and Stone, 2016). Increasing greenhouse gas concentrations are expected to impact the world’s climate through rising temperatures, prolonged drought, and increasing contrasts between wet and dry seasons (Yanahan and Moore, 2019). These human-driven alterations are negatively impacting biodiversity globally (Kannan and James, 2009). These observed impacts include the progressive decoupling of species interactions (i.e., plants and pollinators), extinctions of local populations along range boundaries, and the extension of species geographic limits toward the poles or higher elevations (Hughes, 2000). Due to global-scale impacts of anthropogenic climate change, it is likely that all species may encounter varying alterations to their livelihood, habitat, and geographic range limits.
For biodiversity occupying sensitive habitats (i.e., mountains), climate change poses a significant threat to species physiology, distribution, and community structure (Hao et al., 2007; Draper et al., 2019). Montane plants and plant communities, referred to as the sentinels of climate change (Malanson et al., 2019), often respond sooner to environmental changes than other species and communities. Additionally, temperature increases caused by climate change are more significant at higher elevations (Chen et al., 2011; Pepin et al., 2015). While some species perish, others survive by in situ adaptation or relocation to a higher or lower elevation (Colwell and Rangel, 2009). This observation varies among species as the ability of a species to survive environmental change is determined by their specific biological traits. Plant traits such as propagule production and dispersal, post-fire regeneration, and shade intolerance drive the relative ability to out-compete other species in any given location (Alexander et al., 2018). This trend may lead to decreased suitable habitat for high elevation plant species and communities. These communities may become increasingly fragmented as small, resilient patches of remnant vegetation and become stranded among new vegetative communities (Coe et al., 2012; Yanahan and Moore, 2019).
There are numerous studies, often model based, that examine how species habitat suitability is altering due to climatic change (Morin and Thuiller, 2009; Elith et al., 2010; Iverson and McKenzie, 2013). However, there is little reported research examining the importance of modeling the effects of climate change on plant species at various spatial scales. This study fills this gap in the literature by comparing the sensitivity of habitat suitability modeling to both changes in modeling domain and changes in the climate. The region of comparison is the Coronado National Forest (CNF), a topographically and ecologically complex management area.
While land managers of the CNF often focus primarily on the ecological occurrences within the forest boundaries, ecological function rarely follows geopolitical boundaries. Thus, in addition to examining species responses to anthropogenic climate change at the local scale, we also examine responses at the regional scale. The CNF represents the northernmost limits of the Sierra Madre Occidental (SMO), a mountain range that extends across the United States and Mexico, comprising the Madrean archipelago and mountains of Sonora, Mexico. By incorporating a regional scale for comparison, we develop a separate scenario and alternative evidence for alterations observed or not observed at the local scale. Regional models have been commonly linked to their larger counterparts, the continental and global scale (Gallien et al., 2012; Taucare-Ríos et al., 2016).
The primary objective of this study is to examine how anthropogenic climate change may alter the spatial distribution and quality of suitable habitat for seven common tree species (i.e., four pine, three oak) that provide the general structure of Madrean Pine-Oak Woodlands found throughout the SMO and CNF. To predict the geographic response of each dominant species to anthropogenic climate change, we employ Ecological Niche Modeling (ENM), a spatially explicit modeling approach to predict species habitat suitability across space using a mean average ensemble of three commonly used machine learning statistical models. We fit models with environmental variables that reflect current conditions along with future projections of climate under two anthropogenic emissions scenarios, formulated in 30-year climate normals for three time periods: 2040, 2070, and 2,100. These scenarios are based on social analogs, that range from moderate to severe in greenhouse gas emissions. Niche models are then developed for each tree species for current (2022) conditions, along with the three future climate conditions under the two emissions scenarios, at the two spatial scales of interest: Local and Regional. Additionally, we explore habitat suitability change for each tree species across elevation and latitude within the CNF using Generalized Additive Models (GAMs). We anticipate that habitat suitability will decrease in geographic range and in quality (characterized by the maximum values of habitat suitability) for all species examined in both climate change scenario. We anticipate our proposed framework will provide an important template for local-scale and regional-scale explorations of climate-induced habitat suitability change and should assist land managers who are anticipating the impacts of anthropogenic climate change.
2. Materials and methods
2.1. The local and regional scale
This study uniquely examines two separate spatial scales with the smaller scale being a subset of the larger. This purpose serves to examine how species are predicted to respond to climate change based on the extent and range of environmental variables you incorporate. The regional scale is represented by the SMO (Figure 1A). The SMO is known for its high biological and cultural diversity and enormous environmental and economic importance (González-Elizondo et al., 2013). At approximately 290,000 km2, the SMO is home to a high diversity of flora, including 24 different species of Pinus, 54 species of Quercus, and many other trees species (Silva-Flores et al., 2014). Due to such a large geographic range of forested land, the SMO presents challenges in the management of species, and is often filtered down to distinct management zones.
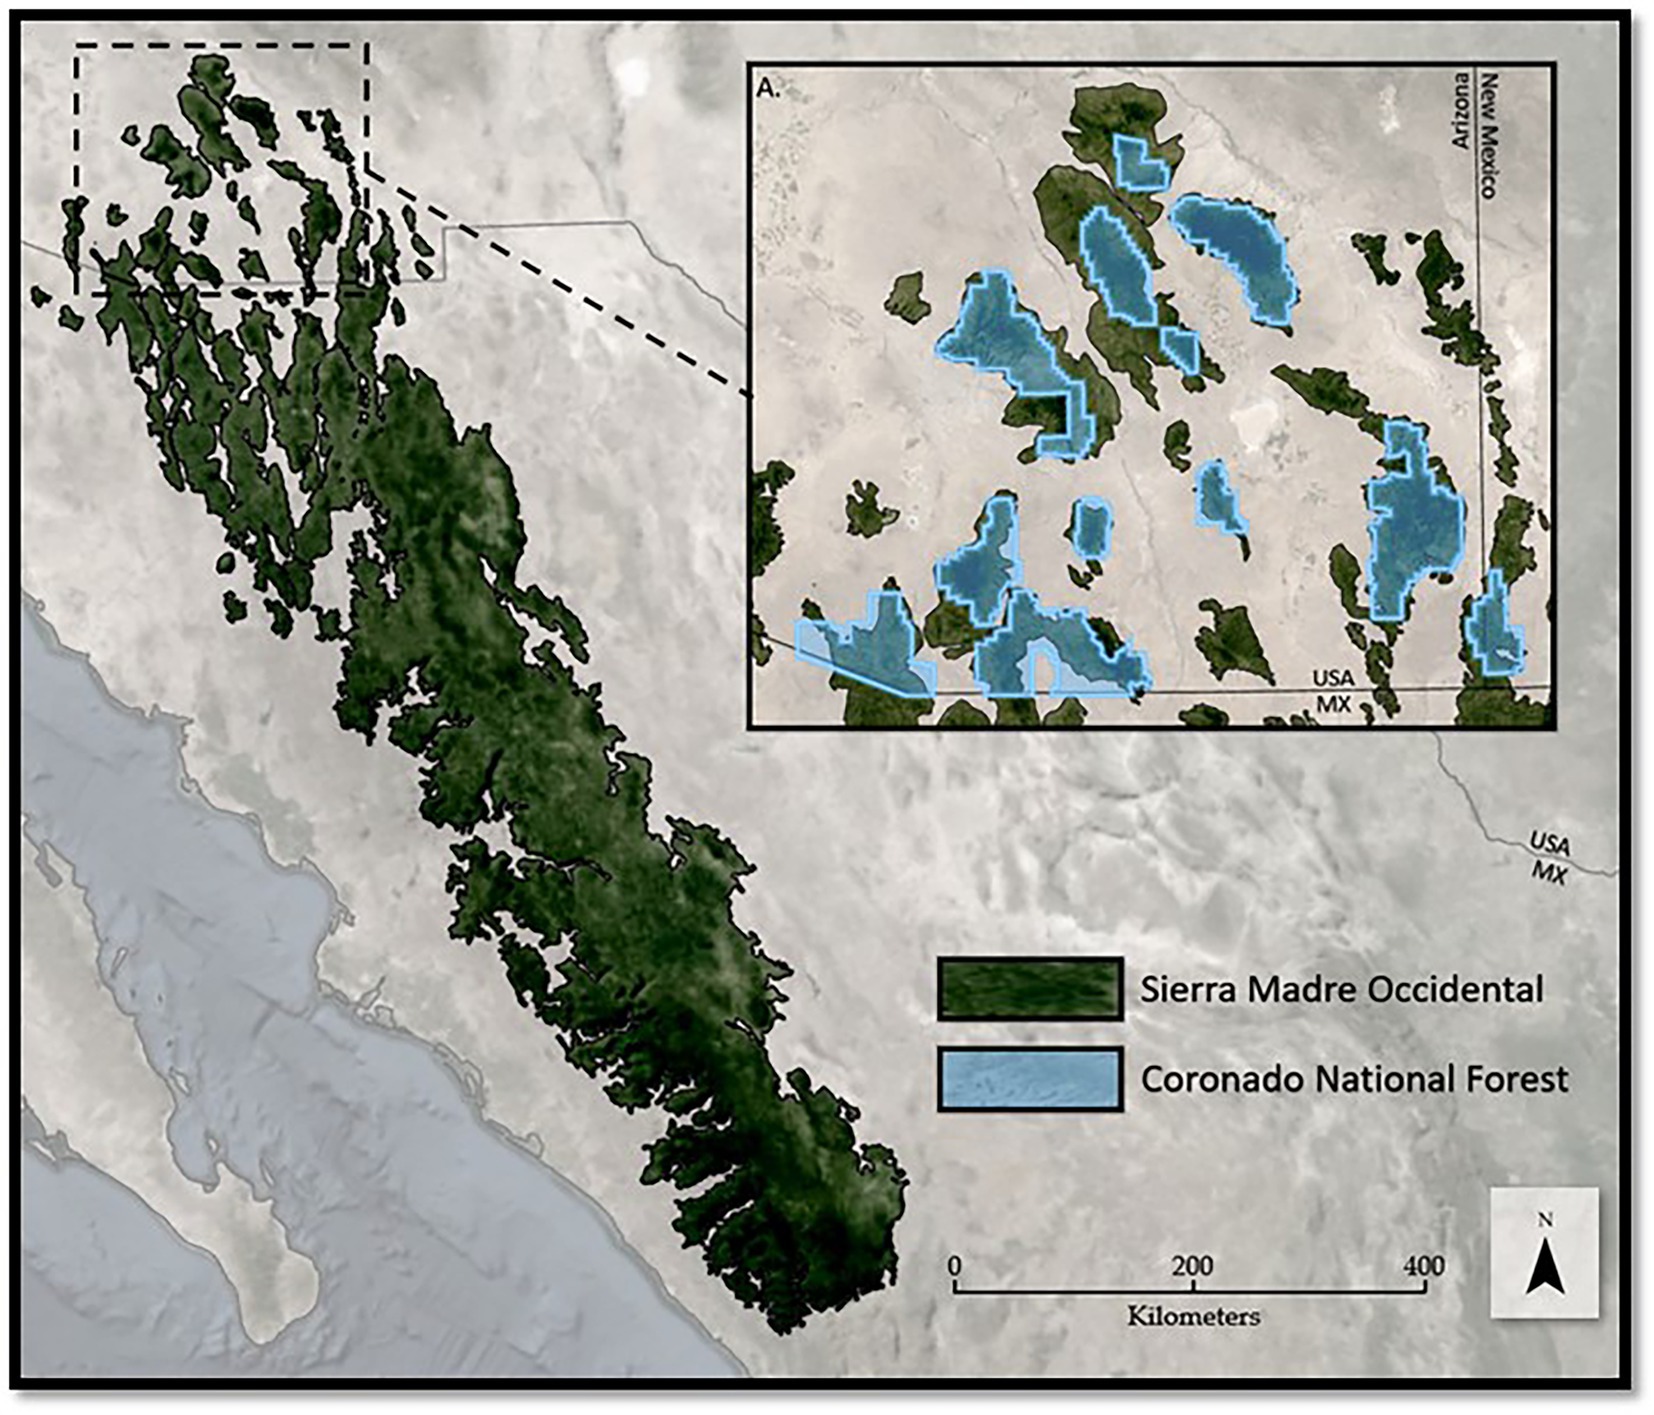
Figure 1. The spatial extent of (A) the Sierra Madre Occidental (SMO) symbolized in dark green and, (B) the Coronado National Forest boundary in light blue overlaid.
The local-scale, CNF, extends to Southeastern Arizona and Southwestern New Mexico, USA and borders northern Mexico (Figure 1B). With an area of approximately 7,200 km2, CNF comprises 12 geographically distinct management areas across 16 isolated mountain ranges, often called the “Sky Islands,” that form the northernmost extent of the Madrean Archipelago. Located in the Sonoran Desert, these ranges produce an orographic effect, creating cooler, wetter climatic conditions at higher elevations that reach upwards of 3,267 meters above the surrounding desert floor (Figure 1). These high elevation Sky Islands are biodiversity hotspots supporting over 7,000 floral and faunal species with many plant and animal communities usually only seen in more northern latitudes (Yanahan and Moore, 2019). The American Southwest climate, in which the CNF is located, is predicted to increase in temperature by 5–8 degrees Fahrenheit (13–15 Celsius), decrease in precipitation by 10%, and increase in the number and duration of periods of high temperature (Service U.F, 2013).The CNF, like the SMO, presents unique and challenging opportunities for land managers and climate change research due to abrupt variations in topographic variables (i.e., elevation, slope, aspect) and the isolation between mountain ranges.
2.2. Tree species
The highly variable climate across the elevational gradient of the SMO and CNF (Figure 2A) allows for the development of distinct forest communities. These communities range from Broadleaf Evergreen Oak woodlands at lower elevations to Spruce-Fir forests at high elevations. Forest communities are distinct assemblages of trees at different successional stages or compositional maturity (Davis, 1981). While somewhat variable in occurrence across the landscape, the SMO and CNF houses major forest communities of interest (Service, 2013) (in general order of ascending elevation): (1) Broadleaf Oak, (2) Coniferous Woodland; (3) Coniferous Transition Forests; (4) Coniferous Mixed Forests; (5) Engelmann Spruce-Alpine Fir Forests; and (6) Bristlecone Pine-Limber Pine Forests. A portion of this study focuses primarily on the first four communities mentioned (Figure 2B), with data provided from the United States Department of Agriculture (USDA) Forest Service, Service Southwestern Region GIS Data (USDA Forest Service, 2022). Due to limited data availability, the two highest elevation forest communities, Engelmann Spruce-Alpine Fir Forests and Bristlecone Pine-Limber Pine Forests located in the Pinaleño range, were excluded from this study.
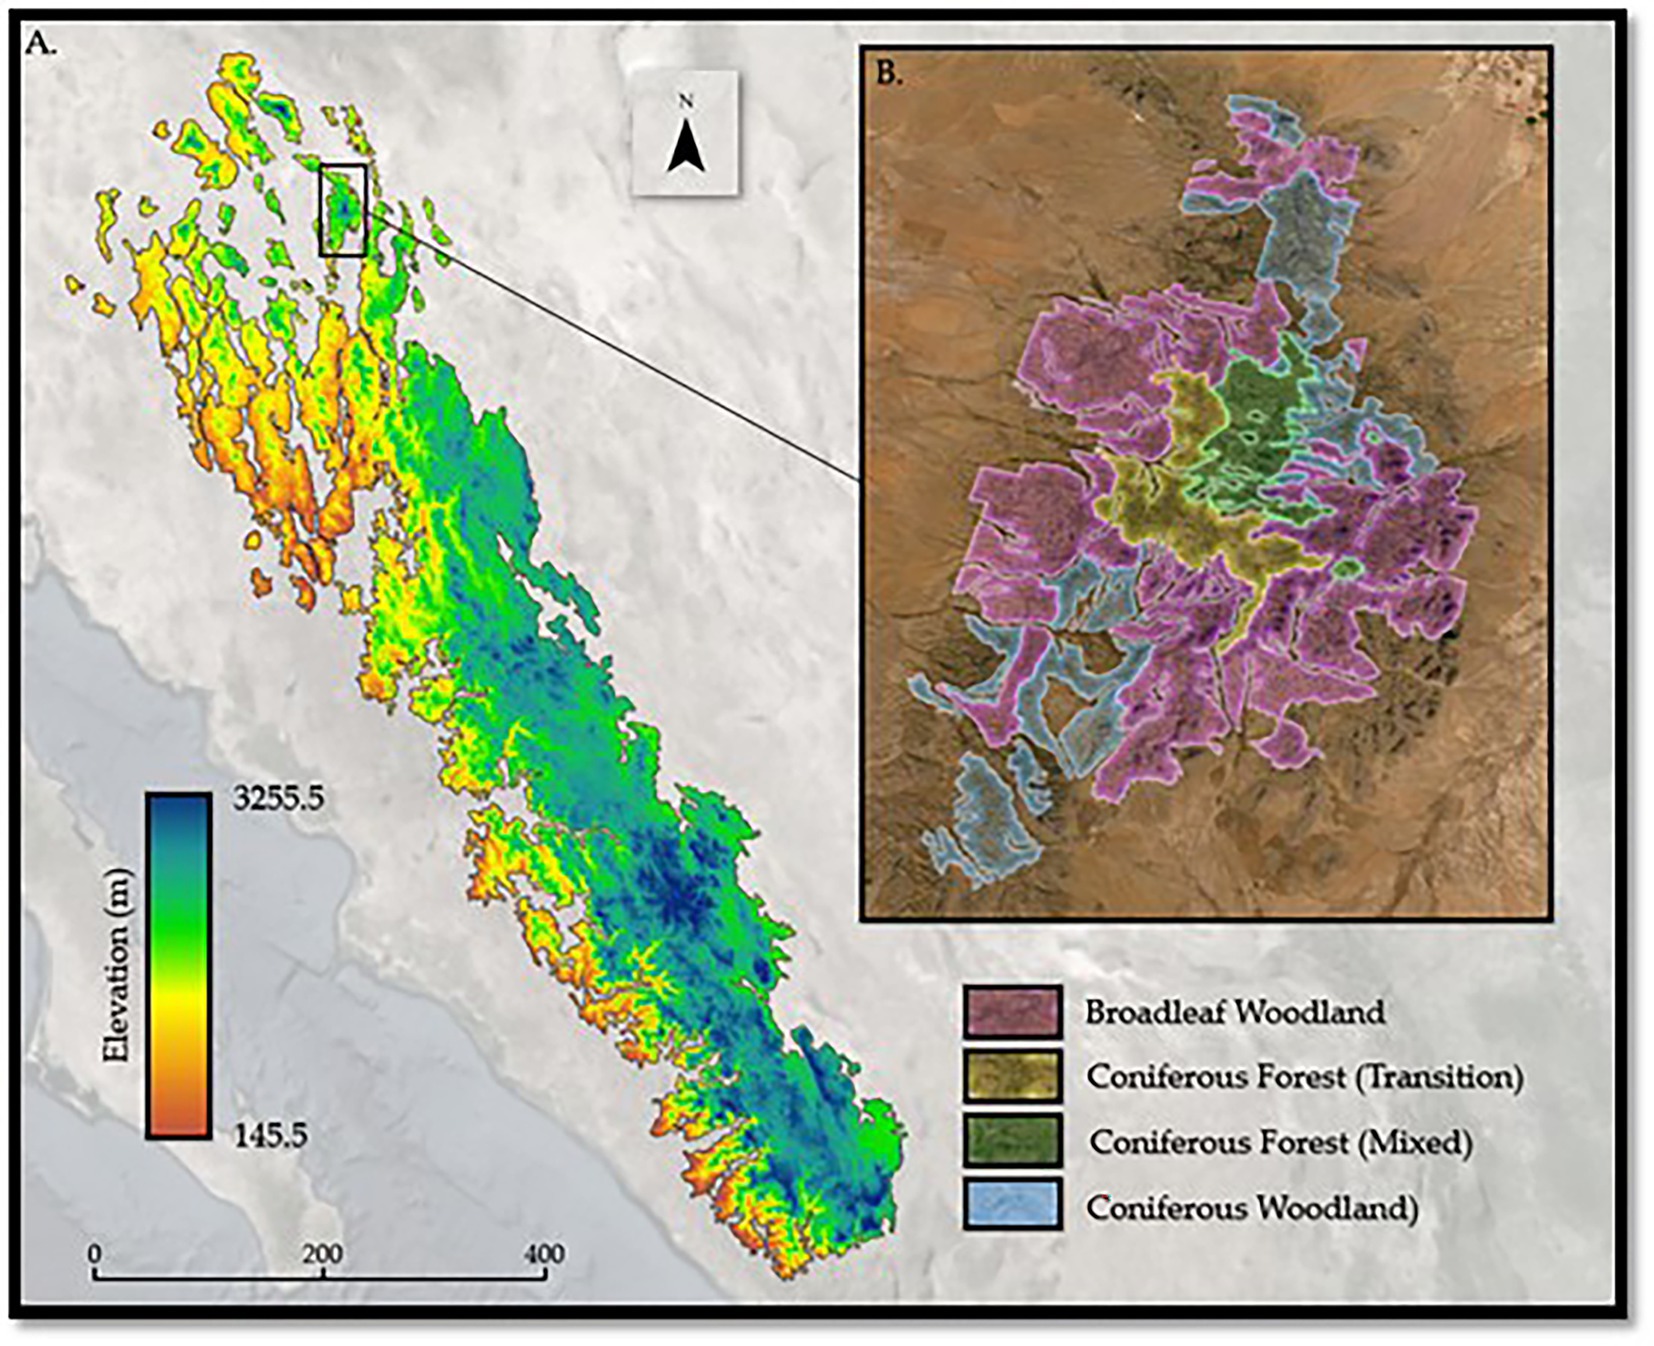
Figure 2. (A) Elevation gradient for the spatial extent of the Sierra Madre Occidental and, (B) Expert-defined spatial extents of the four forest communities of interest.
Ecological community composition may range from few to many species, resulting in a complex system of species competing or relying on each other for resources. Forest communities, represented by dominant, co-dominant, and understory (sub-canopy) plants, rely on the dominant species, whose crowns commonly rise above the general canopy. Dominant trees provide various functions that guide overall forest community function and structure (Power et al., 1996). Observations suggest that dominant tree species direct the ecological processes that regulate microbial soil community assembly, which play a critical role in maintaining forest functional and structural stability (Ma et al., 2019). Dominant tree species are also driving factors in shaping spatial patterns of plant biodiversity, locally and regionally (Hao et al., 2007; Draper et al., 2019). Examining the spatial distribution of habitat suitability of dominant tree species under climate change is a relatively new approach to understanding ecosystem vulnerability, environmental change, and spatial conservation prioritization (Périé and de Blois, 2016; Wan et al., 2017; Dyderski et al., 2018). This study, while analogous to the overall topic, uniquely examines the seven dominant tree species of the SMO and CNF (Table 1).
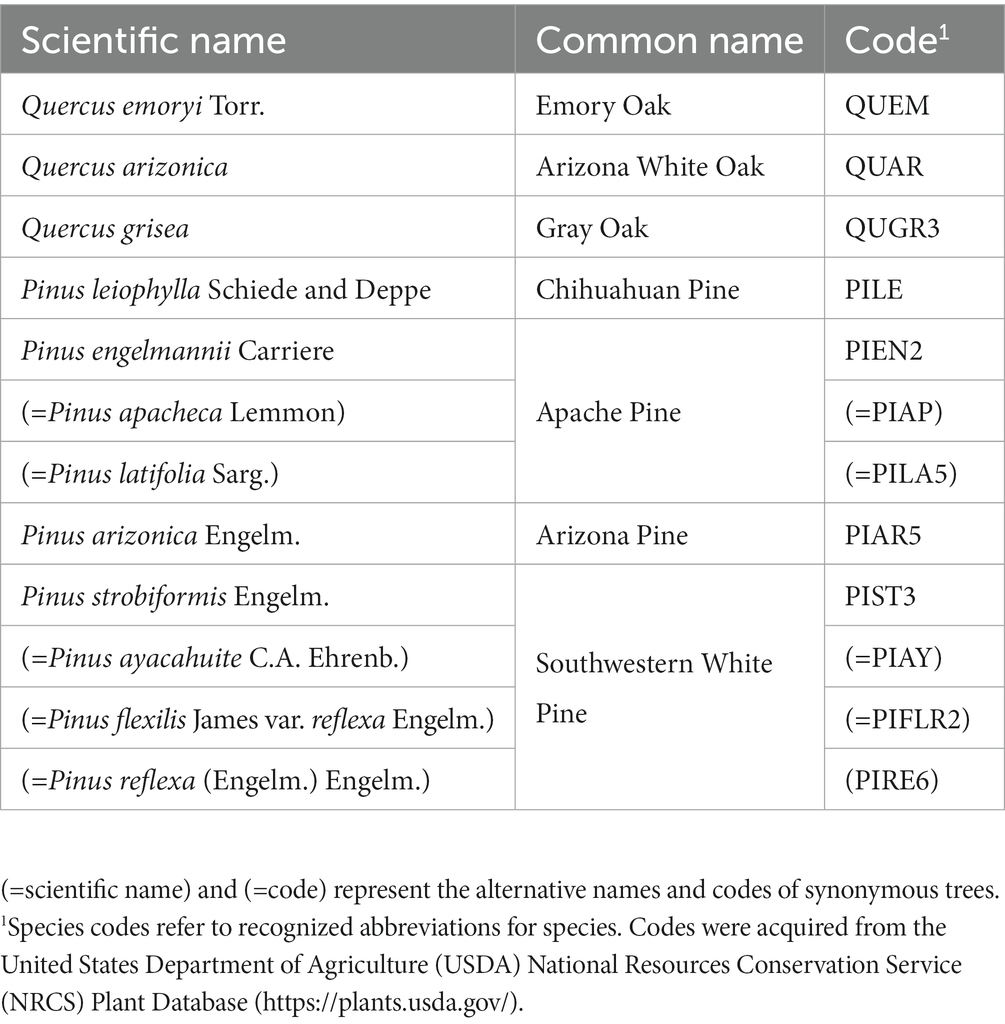
Table 1. Scientific name, common name, and species code of the seven tree species of interest.
2.3. Environmental predictor variables
Ecological niche model requires the use of environmental predictor variables, and variable selection should reflect known drivers of species distribution and habitat selection. The drivers of plant distribution are primarily climatic, edaphic (i.e., soils), and topographic. Thus, we gathered a collection of environmental variables that are commonly associated with plant distribution and habitat for examination. It is noted that many variables are highly correlated with others, which is known to obscure the contributions of individual variables in predictions (Zurell et al., 2020). In this study, the primary interest is in the final predictions, rather than any of the model coefficients and multicollinearity is known to not affect prediction quality, provided that predictions are made within the observed region of observations (Kutner et al., 2004). While multicollinearity does not affect predictions, there is still value in simplified model representations that achieve similar accuracy to models using many more variables. As such, we created a subset of variables by developing a matrix of all variable values extracted to each species occurrence. Then, pairs of variables in the matrix were examined, and if shared a correlation of more than 0.8 was present, we removed the second variable from consideration thereafter. Selecting variables that contribute to the understanding of species distribution and habitat suitability while reporting values beneath a threshold of 0.8 is a suggested rule of thumb in handling multicollinearity in statistical modeling (Grewal et al., 2004; Kim, 2019). This led to the collection of 22 variables used in subsequent ENM (Table 2).
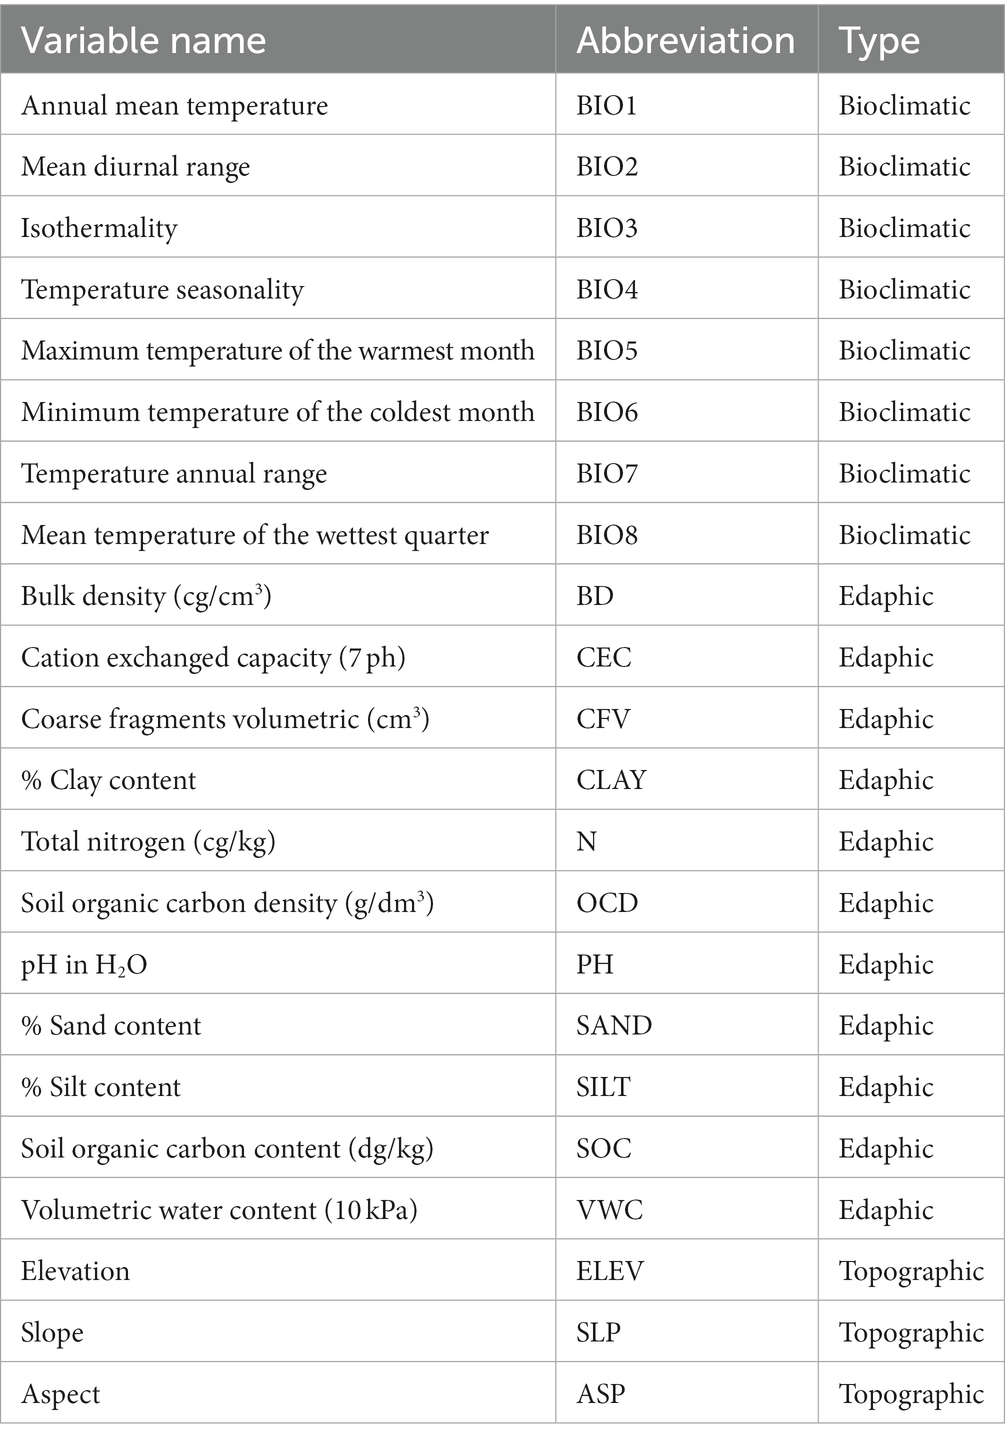
Table 2. Name and assigned abbreviation for the 22 predictor variables used in this study.
In order to examine how species habitat suitability may change under future climate scenarios, we employed the use of bioclimatic variables commonly used in climate modeling research (Priti et al., 2016; Booth, 2018), produced from two distinct future anthropogenic emissions scenarios from the Coupled Model Intercomparison Project 6 (CMIP6) (Karger et al., 2018; Hamed et al., 2022), primary data modeling developed by the Geophysical Fluid Dynamics Laboratory (GFDL), downscaled to a 1-km2 spatial resolution by the Climatologies at high resolution for the earth’s land surface areas (CHELSA) research (Karger et al., 2017). The two scenarios, known as Shared Socioeconomic Pathway (SSP) 3–7.0 and SSP 5–8.5, are sectioned into three distinct 30-year normal: 2040 (2011–2040), 2070 (2041–2070), and 2,100 (2071–2,100). Each SSP, derived from anthropogenic emission scenarios, ranges from moderate to extreme climatic change through the end of the century (Alizadeh et al., 2022). SSP 3–7.0 infers that future global climate results in the medium to the high end of the range of future forcing pathways, leading to exceptionally high aerosol emissions and land use change (Meinshausen et al., 2020). SSP 5–8.5, while similar in overall trajectory, represents the high end of the range of future pathways with a reference scenario in a high fossil fuel development world throughout the 21st century (Meinshausen et al., 2020).
While more than two scenarios exist, data availability and the feasibility of SSP 3–7.0 and SSP 5–8.5 becoming a reality drove selection over other available SSP used in this study. Thus, we developed seven ENMs that use the 19 bioclimatic variables associated with a specific time frame (Current, 2040, 2070, 2,100) and SSP (3–7.0 and 5–8.5). Edaphic variables were selected from the International Soil Reference and Information Centre (ISRIC) world soil information (Ribeiro et al., 2015), while topographic variables were derived from a global 1-km resolution digital elevation model (DEM) derived from the U.S. Geological Survey (USGS) NASA Shuttle Radar Topography Mission (SRTM) (USGS, 2021. Topographic and Edaphic variable data remained consistent across all models regardless of scenario or time as this is beyond the scope of this climate change-based study and projected changes in topographic and edaphic variables across time are largely unavailable.
2.4. Ecological niche modeling
Ecological Niche Modeling (ENM) is the process of relating geographically referenced species occurrence records (i.e., presence/absence records), environmental variables (i.e., elevation, soil moisture, annual mean temperature, etc.), and using statistical algorithms to predict habitat suitability for a given species across a region of interest (Pearson, 2007; Elith and Franklin, 2013). ENM is often considered synonymous with Species Distribution Modeling (SDM) and Habitat Suitability Modeling (HSM), though (Brown and Griscom, 2022) highlight some important differences between the terms in certain contexts. ENM is commonly applied to studies researching the distributions of plant species (Carrell et al., 2022), and consequences of future climatic change on their geographic distribution (Nakao et al., 2013; Moor et al., 2015). Our study uses ENM to investigate the geographic alterations in suitable habitat of tree species of the SMO and CNF under various anthropogenic climate change emissions scenarios (Figure 3). In ENM, no one model is constituted as “best.” Therefore, we implemented a mean ensemble approach, which simply averages probability outputs of predictive models, from three machine learning algorithms commonly applied in ENM. Ensemble models are examined to bolster model defensibility and account for possible alternate states of modeled system (Araújo and New, 2007; Forester et al., 2013). These models include: (1) Random Forest (Breiman, 2001); (2) Maximum Entropy (Elith et al., 2011); (3) Boosted Regression Trees (De'ath, 2007). The three models were chosen due to their observed robust performances in ENM studies (Fourcade et al., 2014; Mi et al., 2017; Yu et al., 2020). Random Forest, Maximum Entropy, and Boosted Regression Tree models were developed using default parameters found in the randomForest (RColorBrewer and Liaw, 2018), dismo (Hijmans et al., 2017), and gbm (Ridgeway and Ridgeway, 2004) packages in R, respectively. For model validation, Random Forest does not require a validation dataset by using an out-of-bag evaluation (Cutler et al., 2012), while Boosted Regression Trees and Maximum Entropy models were validated using a k-fold cross validation (Hastie et al., 2009).
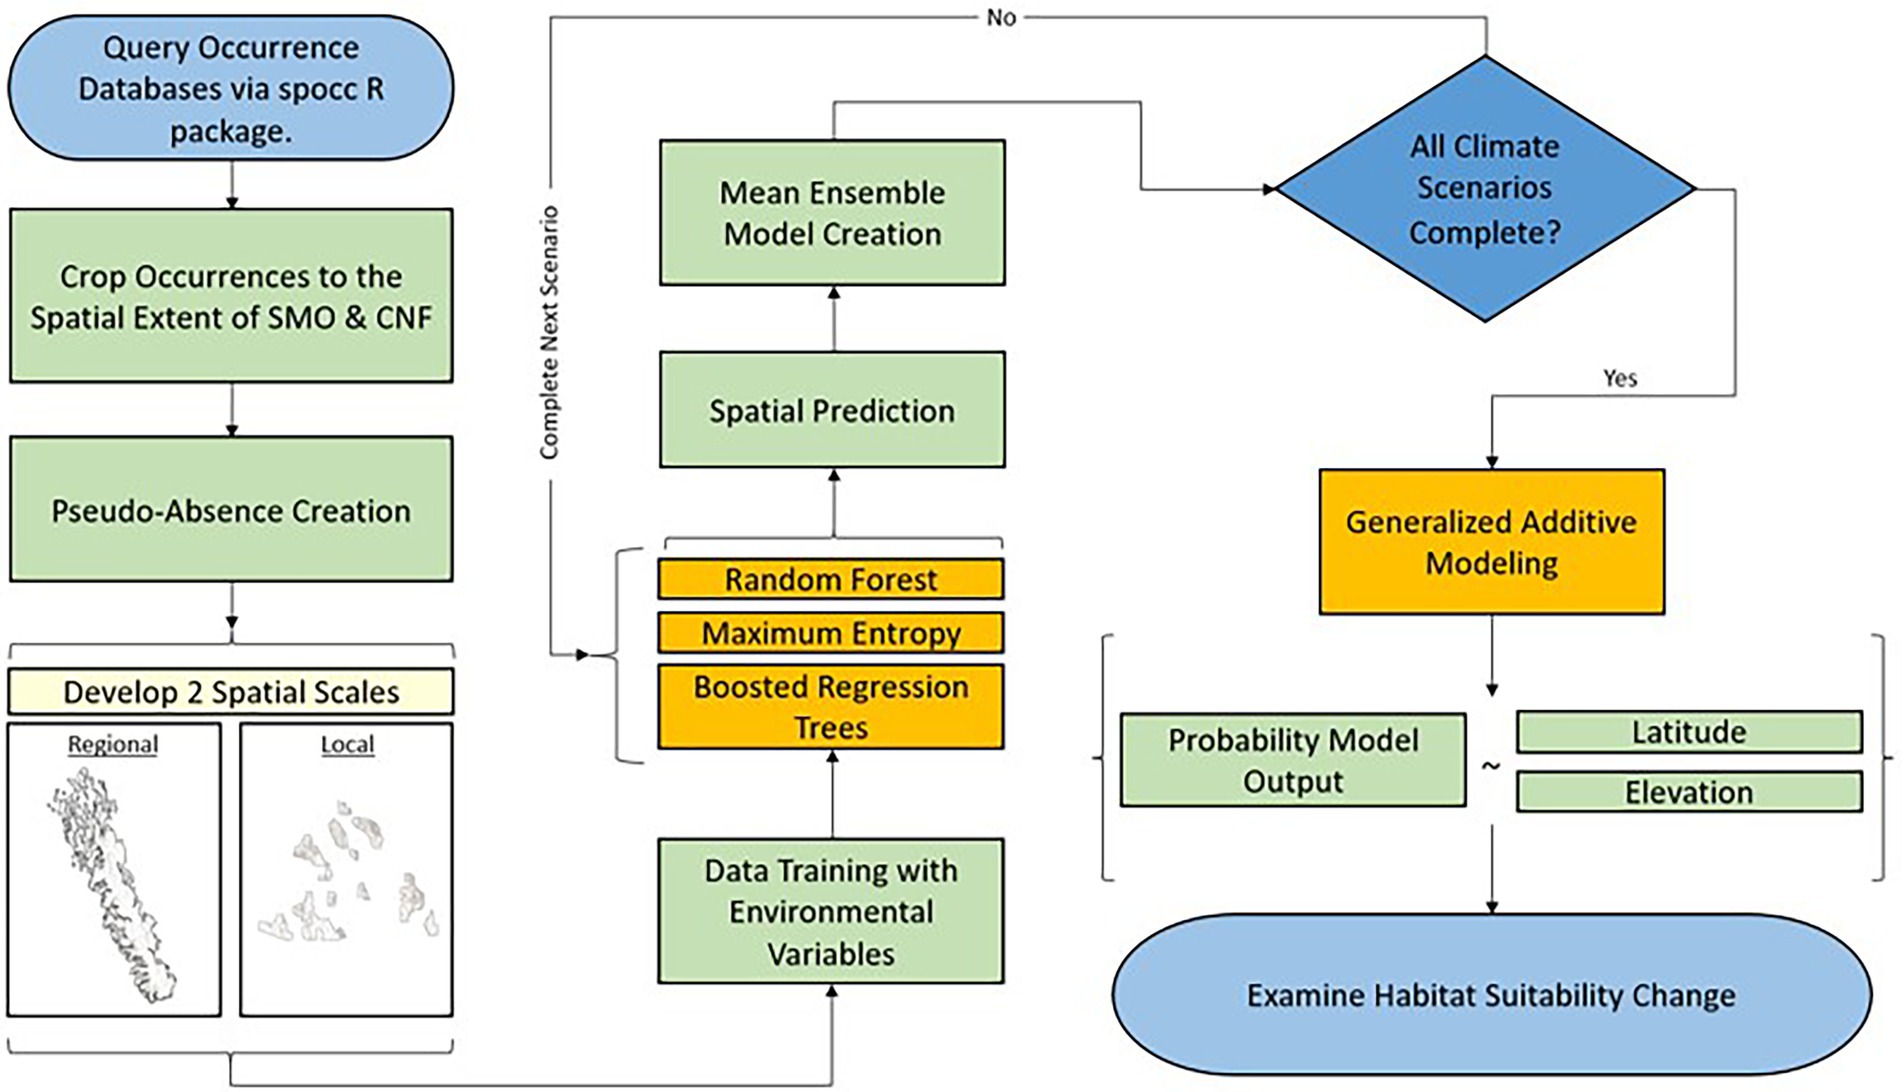
Figure 3. Methodology flow-chart.
Species presence data was gathered from commonly used citizen-science databases [e.g., Inaturalist (Matheson, 2014), Global Biodiversity Information Facility (Robertson et al., 2014), ‘USGSs’ Biodiversity Information Serving Our Nation (Guala, 2019), etc.] obtained through the Interface to Species Data Sources (spocc) R package (Chamberlain et al., 2021). The number of occurrence records used in both spatial scales are listed by species in Table 3. The use of species occurrence records collected through citizen-science methodology has been applied to a number of ecological modeling studies and is observed to improve ENM accuracy (Amano et al., 2016; Milanesi et al., 2020; Feldman et al., 2021; Matutini et al., 2021). Species pseudo-absences are generated at a 2–1 ratio for every observed presence in the dataset through random sampling of points across the modeling extent of the SMO and CNF, consistent with other pseudo-absence generated studies (Barbet-Massin et al., 2012; Liu et al., 2019).
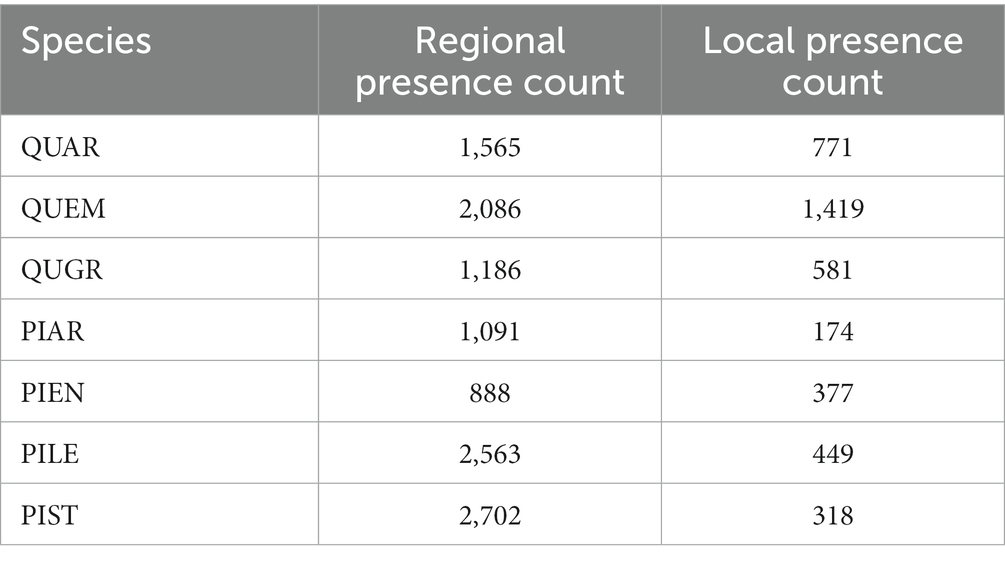
Table 3. Number of presence records used in both spatial modeling scales listed by species.
Given that three different models were used and each have different conditions and modes of prediction, a maximum kappa classification threshold was implemented for consistency across statistical algorithm selection (Duan et al., 2014). We used the PresenceAbsence R package (Freeman and Moisen, 2008), which calculates the thresholds for any dataset using presence/absence response variables. By selecting “MaxKappa” as the threshold metric, model thresholds are optimized to the find the threshold that gives the maximum value of Kappa, which uses information from a confusion matrix to assess the improvement over chance prediction (Freeman and Moisen, 2008). Model accuracy was measured using the Area Under the Curve (AUC), Sensitivity, Specificity, and the True Skill Statistic (TSS). These metrics measure the ability of the models to correctly classify the presence and pseudo-absences in the training data. Specifically, AUC is an important index as it provides a measure of overall accuracy that is not dependent upon a particular threshold (DeLeo, 1993; Fielding and Bell, 1997). Sensitivity represents the proportion of correctly predicted presence records and quantifies omission errors, while specificity represents predicted absence records and quantifies commission errors (Shabani et al., 2018). TSS is a performance measurement and shows of SDMs in which predictions are expressed as presence–absence maps and shows significant correlation with those of the threshold-independent AUC statistic (Shabani et al., 2018). Each mean ensemble model predicts the [0.1] interval that represents the estimated probability of species occurrence (i.e., habitat suitability). Predictions are produced in a spatially explicit raster at a 1-km2 spatial resolution.
2.5. Generalized additive models
As previously mentioned, habitat suitability was estimated using an ensemble of three machine learning algorithms at a 1 km2 resolution at a local and regional scale. Post-ENM modeling, we examined both models in their current extent, and clipped both models to the geographic boundaries of the CNF (Figure 1A) This process allows for the examination of local vs. regional scale models at 2 different scales and the examination of local vs. regional models when observed at the same scale. A shapefile of the plant communities of interest (Figure 2B; USDA Forest Service, 2022), was used to partition the model grid cells into the distinct geographic boundaries of expertly defined plant communities. Grid membership in the partition was based on the geographic coordinates of the grid centroid. A GAM was used to relate the gridded estimates of habitat suitability to a gridded map of elevation and latitude obtained from a 1km2 digital elevation model of North America (Portal, 2007) and a shapefile of latitude from ESRI (2011). The gridded elevation and latitude maps were resampled using bilinear interpolation to produce co-located elevation values for the grid of suitability predictions. In this study, the GAM includes only a single predictor:
The assumptions made by the GAM model are that the data vary smoothly (though no model form needs to be specified), and that the variance of the data about the true model form is constant. The satisfaction of these assumptions allows for the estimate of prediction intervals as in ordinary least squares (OLS) regression. The key difference between OLS and GAM modeling is that the GAM does not require pre-specifying the model form that describes the relationship between and . This allows great flexibility in determining smoothed representation of saturated scatterplots without having to guess a model form a priori. The popularity of GAMs for visualizing trends is evident in the default smoothing options of R’s most popular data visualization package ggplot2 (Wickham et al., 2016).
3. Results
3.1. Ecological niche models
Common modeling metrics (AUC, Sensitivity, Specificity, TSS) were generated producing the following values for all models developed at both the CNF and SMO scales and are reported as (Median, Mean) (Table 4). Statistically, models performed consistent with the standards of modeling accuracies and analogous research (Marmion et al., 2009; Williams et al., 2009). With AUC mean values above 0.90, it is inferred that the models have high predictive capability according to the predictor and response variables provided. Metrics for each specific model are found in the Supplementary Table S1.
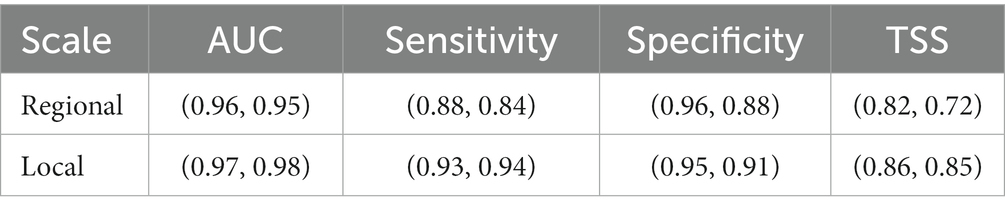
Table 4. Modeling metrics reported as (Median, Mean) for all models developed at either the Regional or Local scale.
3.2. End of century observations
Habitat suitability is observed to alter in both spatial distribution and quality (i.e., overall modeled probability) for all seven tree species of interest, regardless of the emissions scenario (Figure 4). For pine species, habitat suitability is observed to be negatively impacted by anthropogenic climate change in both quality and spatial distribution across the entire SMO extent. Pinus engelmannii (PIEN), is observed to be most negatively affected among the pine species. PIEN models produced a maximum probability prediction of 98% under current conditions with high values above 81% in both southern and northern extents of the SMO (Figure 4.2A). Under the predicted emission scenarios of SPP 3–7.0 and SSP 5–8.5 for the year 2,100, PIEN is predicted to decrease significantly, ranging in maximum probability of 61% (SPP 3–7.0) and 56% (SSP 5–8.5) (Figures 4.2B,C). The other 3 pine species exhibit characteristics that are complex to describe spatially. Pinus leiophylla (PILE) is observed to decrease in habitat suitability across the SMO over time but retain more pixels than others that could be interpreted as moderate suitability at 41–60% (Figure 4.3). Pinus arizonica (PIAR) (Figure 4.1) and Pinus strobiformis (PIST) (Figure 4.4) are observed to have more pixels that could be interpreted as low suitability (0–40%). However, PIAR and PIST contain pixel values that reach a maximum probability of 79 and 81%, respectively, ranging from 9 to 11% greater than the highest pixel predicted for PILE (70%).
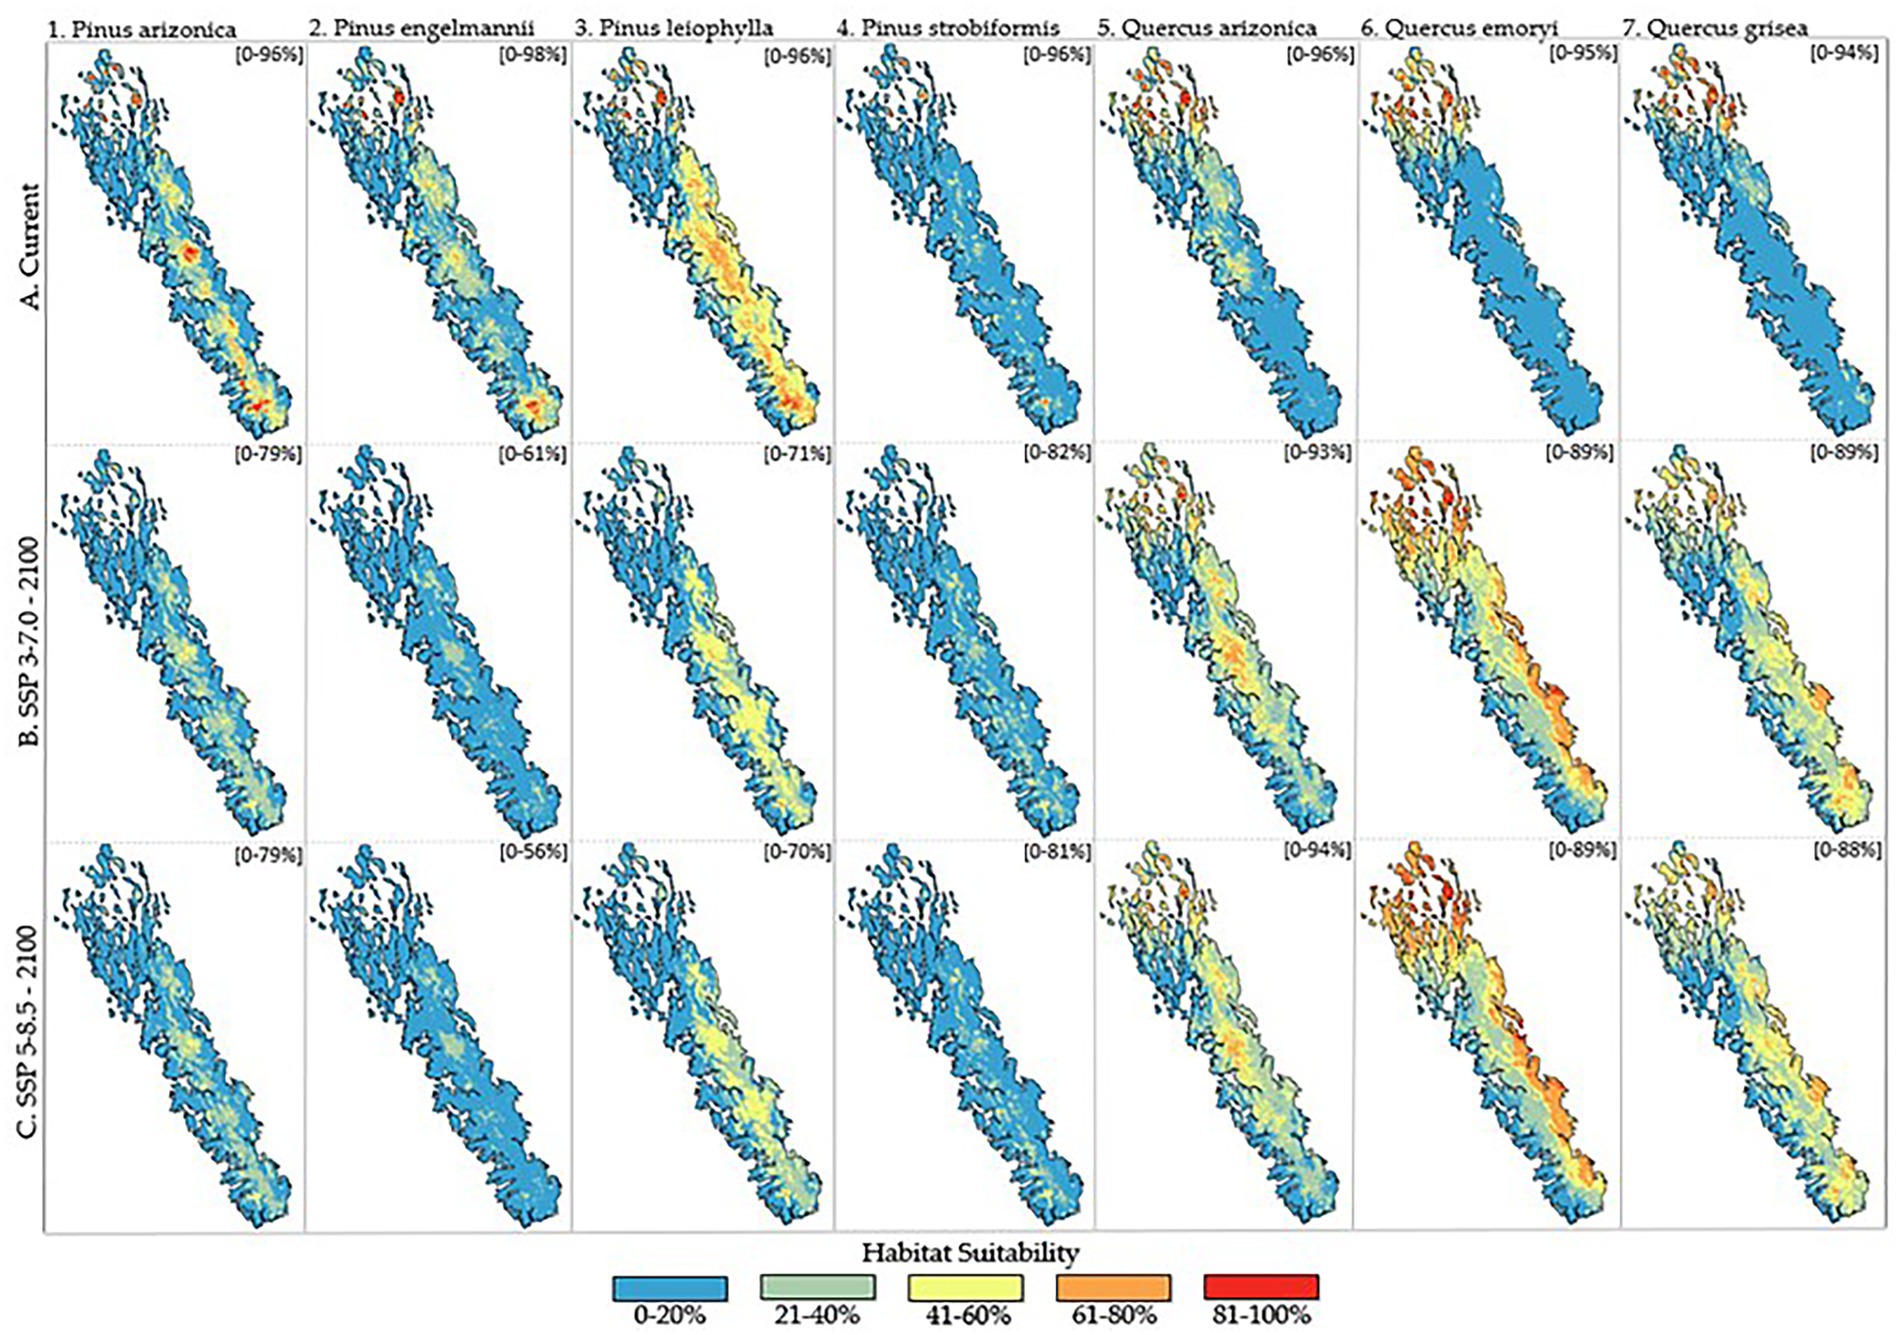
Figure 4. Habitat suitability for the seven tree species of interest across the Sierra Madre Occidental for current climatic conditions, end-of-century (2100) climatic conditions for SSP 3–7.0, and end-of-century (2100) climatic conditions for SSP 5–8.5. Habitat suitability probability is represented on a gradient of blue (low suitability) to red (high suitability). Predicted model probability range is in the upper right corner of each species map as [lower-upper%]. Figure column is assigned numerically while column is assigned alphabetically for rapid lookup (i.e., Pinus Strobiformis at end-of-century conditions for SSP 3–7.0 = 4.4.B).
Oak species are predicted to fare much better than pine species, in terms of both habitat quality and spatial distribution within the extent of the SMO. The highest predicted probability values of oak species were those reported by Quercus arizonica (QUAR) models (Figure 4.5) for current and end-of-century conditions for both scenarios, which ranged from 96 to 93 to 94%, respectively. Quercus emoryi (QUEM) (Figure 4.6) and Quercus grisea (QUGR) (Figure 4.7), exhibit decreases in maximum probability prediction in both future scenarios to a greater, but not extreme extent than QUAR, with values ranging from 95–89% (QUEM) and 94–88% (QUGR). Increased suitability is observed for all oak species in more southernly extents of the SMO in future scenarios. Among these, QUEM may show the greatest increase in habitat suitability across the SMO in terms of habitat suitability, spatial exhibiting pixels to increase from a reported 0–40% suitability (Figure 4.6A) to greater than 80% (Figures 4.6B,C).
When compared visually, emissions scenarios show little variation on the predicted habitat suitability of species at the end of the century. Models reported contrasting, yet to be considered insignificant, maximum probability predictions for each species in SSP 3–7.0 and SSP 5–8.5. For example, PIAR shows a maximum probability of 79% at the end of the century for both future scenarios. The other 3 pines show a slight decrease of 61 to 56% (PIEN), 71 to 70% (PILE), and 82 to 81% (PIST) for SSP 3–7.0 and SSP 5–8.5, respectively. With exception of QUAR, which reports a higher maximum probability in SSP 5–8.5 (94%) than SSP 3–7.0 (93%), oaks follow suit with either constant or decreasing values among emissions scenarios at a fixed 89% (QUEM) or 89 to 88% (QUGR).
3.3. Spatial scale comparisons
A primary focus of this study was to not only observe species responses to anthropogenic climate change in terms of habitat suitability and spatial distribution, but to do so at both local and regional spatial scales. Model outputs were cropped to the boundaries of the CNF (i.e., local scale) and end-of-century predictions under SSP 5–8.5 (see Figure 5) were compared. The magnitude of differences in predicted habitat suitability for each species across the two model scales varied greatly depending on species. Some species, such as PIEN, showed similar predictions for suitability in the CNF using the two modeling scales. Other species, like QUEM, showed differences in model predictions that were larger than the projected changes in suitability due to climate change. The general trend observed among pine species is a decrease in habitat suitability when comparing SMO and CNF modeling extents. Variation from this trend is observed in PIAR and PIST models as some areas are shown to increase in habitat suitability in the SMO modeling extent. Another observation among pine species is that the SMO modeling extent may result in a spatially focused prediction, with less values predicted at 41–60% and more at 61–80%. Consistent with previous observations in section 3.2 (End of Century Observations), PIEN shows very little habitat suitability while PILE shows consistent values for both modeling extents at the end of the century for SSP 5–8.5.
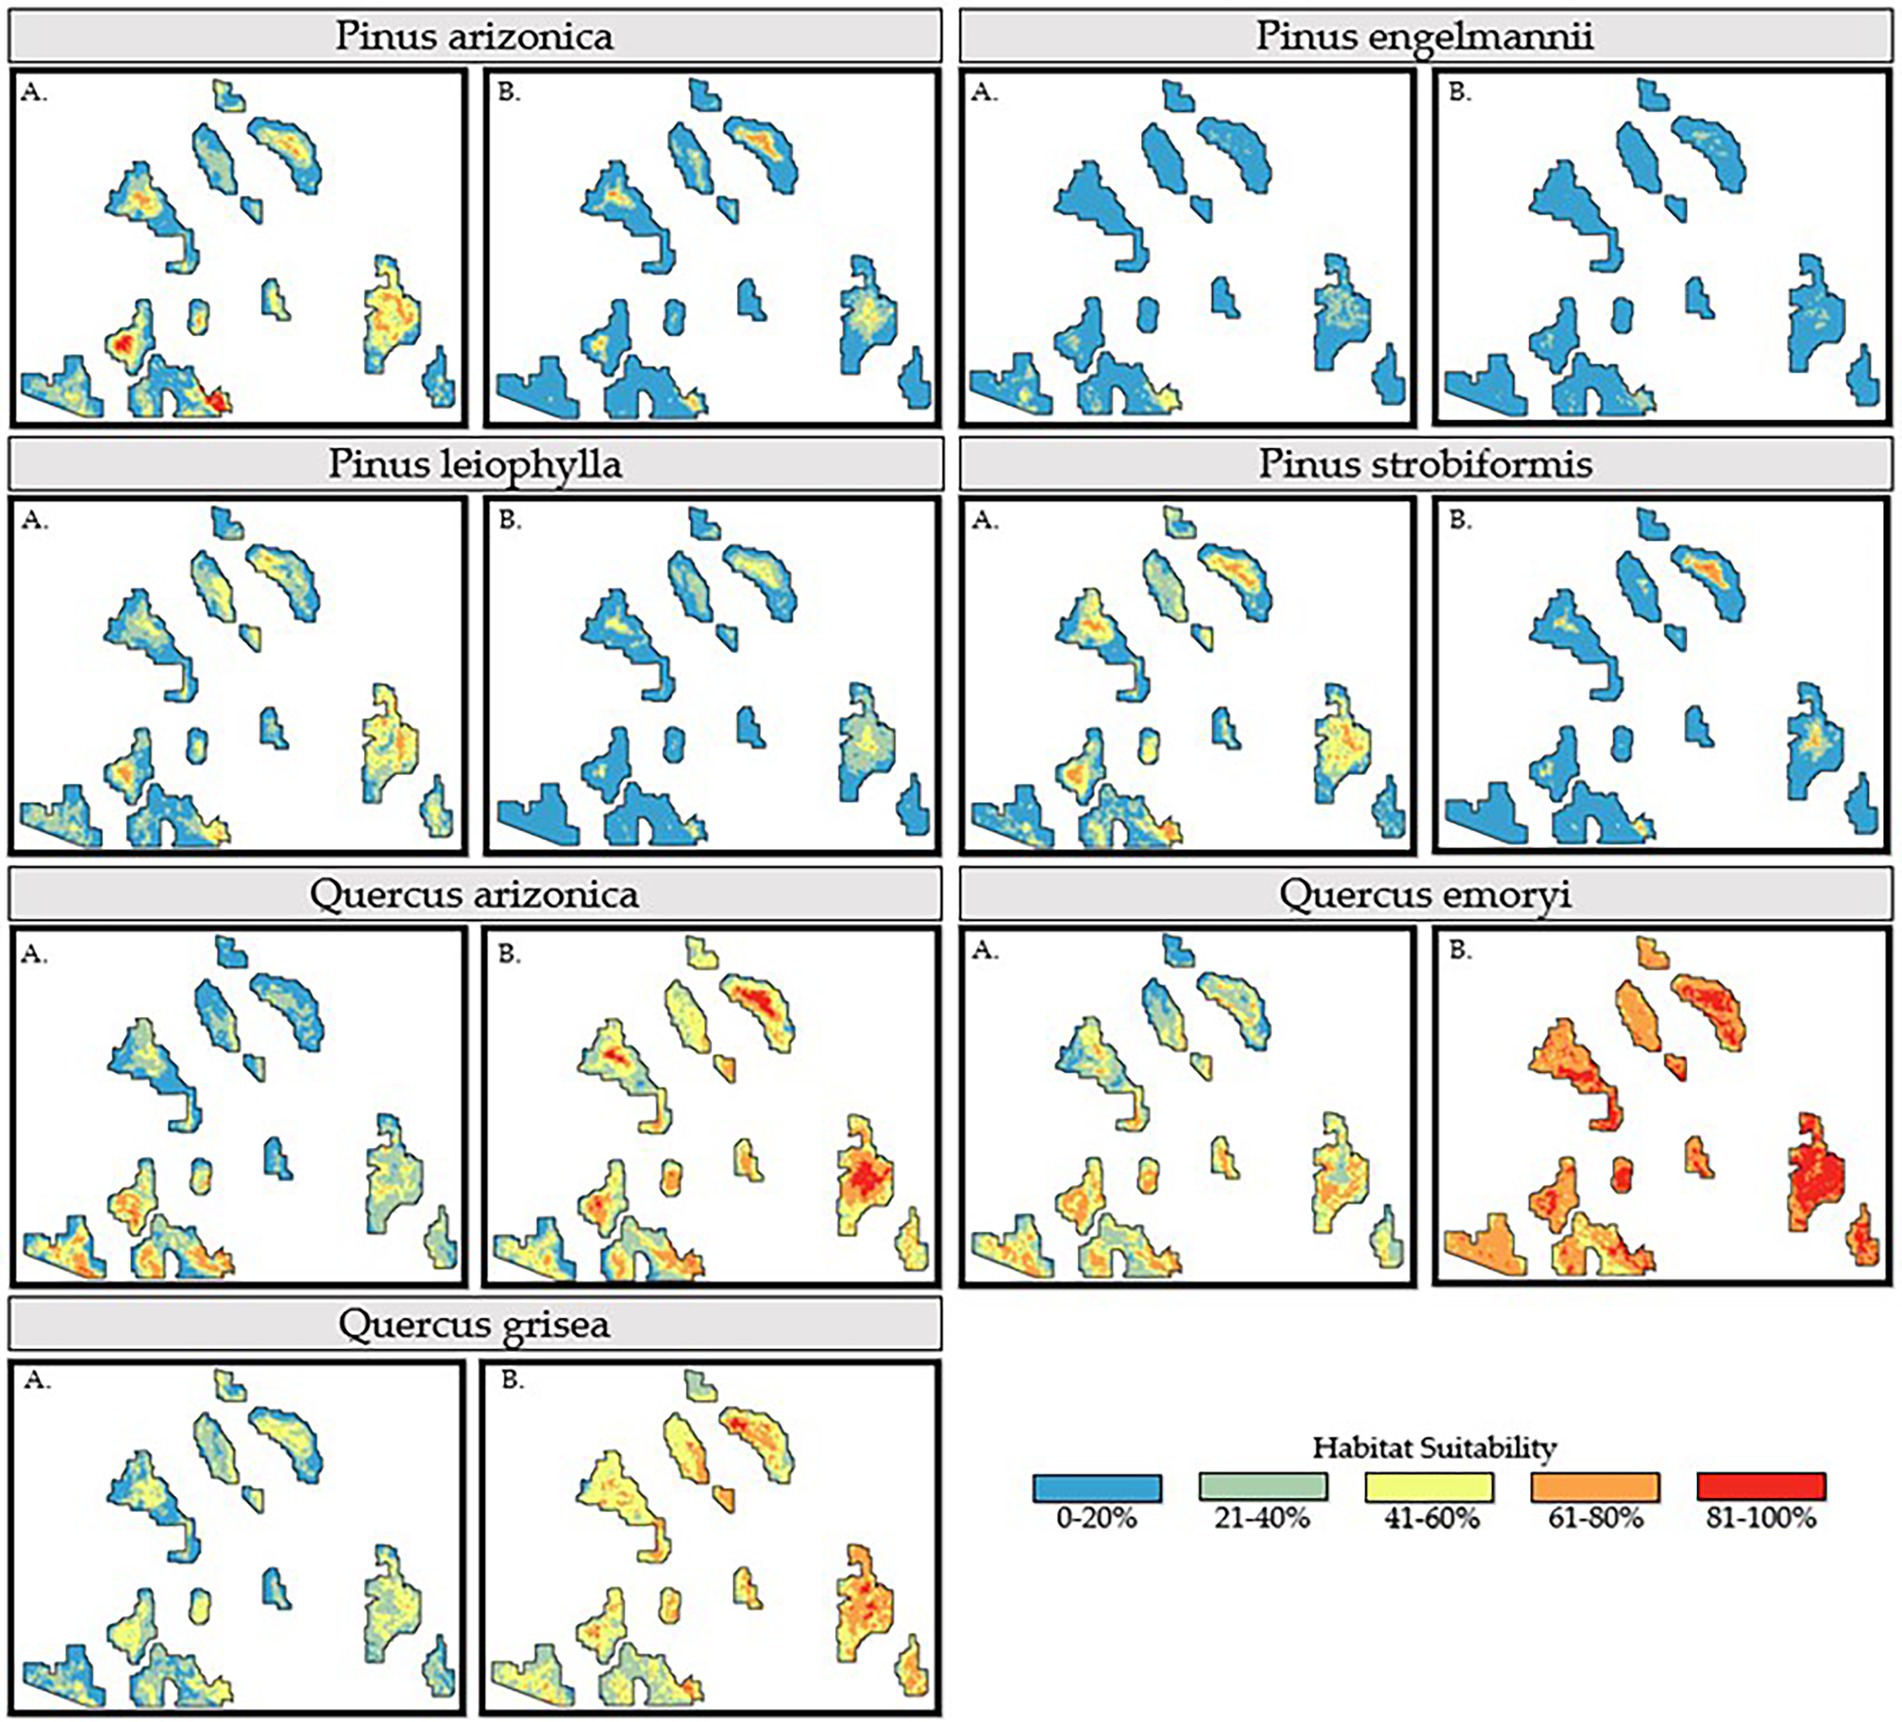
Figure 5. Habitat suitability models of all seven tree species of interest under the SPP 5–8.5 emissions scenario for 2,100. Each species model is cropped to the boundary of the Coronado National Forest under two distinct modeling scales: (A) Coronado National Forest and, (B) Sierra Madre Occidental.
Oak species show more consistency as compared to pine species among observed predictions in both modeling extents when compared in section 3.2 (End of Century Observations). Both modeling extents show higher estimates of habitat suitability when compared to most pine species, however, there are arguably more significant variations in predicted habitat suitability when comparing the two modeling extents. All three oak species visually show increased values predicted in habitat suitability in regional modeling extents than local modeling extents. QUEM, when cropped to the SMO modeling extent shows no pixels reporting values below 41%, with a large portion reporting greater than 61%. QUAR shows increases in the northern ranges of the CNF with values ranging from an observed 0–40% in CNF modeling extents to greater than 41% with most pixels reporting 81% and above in SMO modeling extents. Regardless of the specific pixel value being reported, visually, there is significant difference in the comparison between model outputs produced from the CNF modeling extent and SMO modeling extent.
3.4. Forest community suitability
All species showed variability in habitat suitability across community type and climate change scenario (Figure 6). The most notable observation is the decreasing values in habitat suitability across time for all species, except for QUEM, which reports slight increase over time. Perhaps equally interesting is the lack of variation among modeling extents for the pine species in estimated suitability across time. When examining modeling extent, Oak species show quite significant variation in reported habitat suitability for all communities across time, with the SMO modeling extent estimating much higher suitability than the CNF. Additionally, pine species show consistent higher prediction values in habitat suitability for forest communities that are higher in elevation. Most interestingly, only one oak species (QUGR) follows the general trend observed among the pine species. This may suggest that higher elevations are becoming increasingly important for pine species survival, and QUAR and QUEM may be potential invaders to higher elevation forest communities.
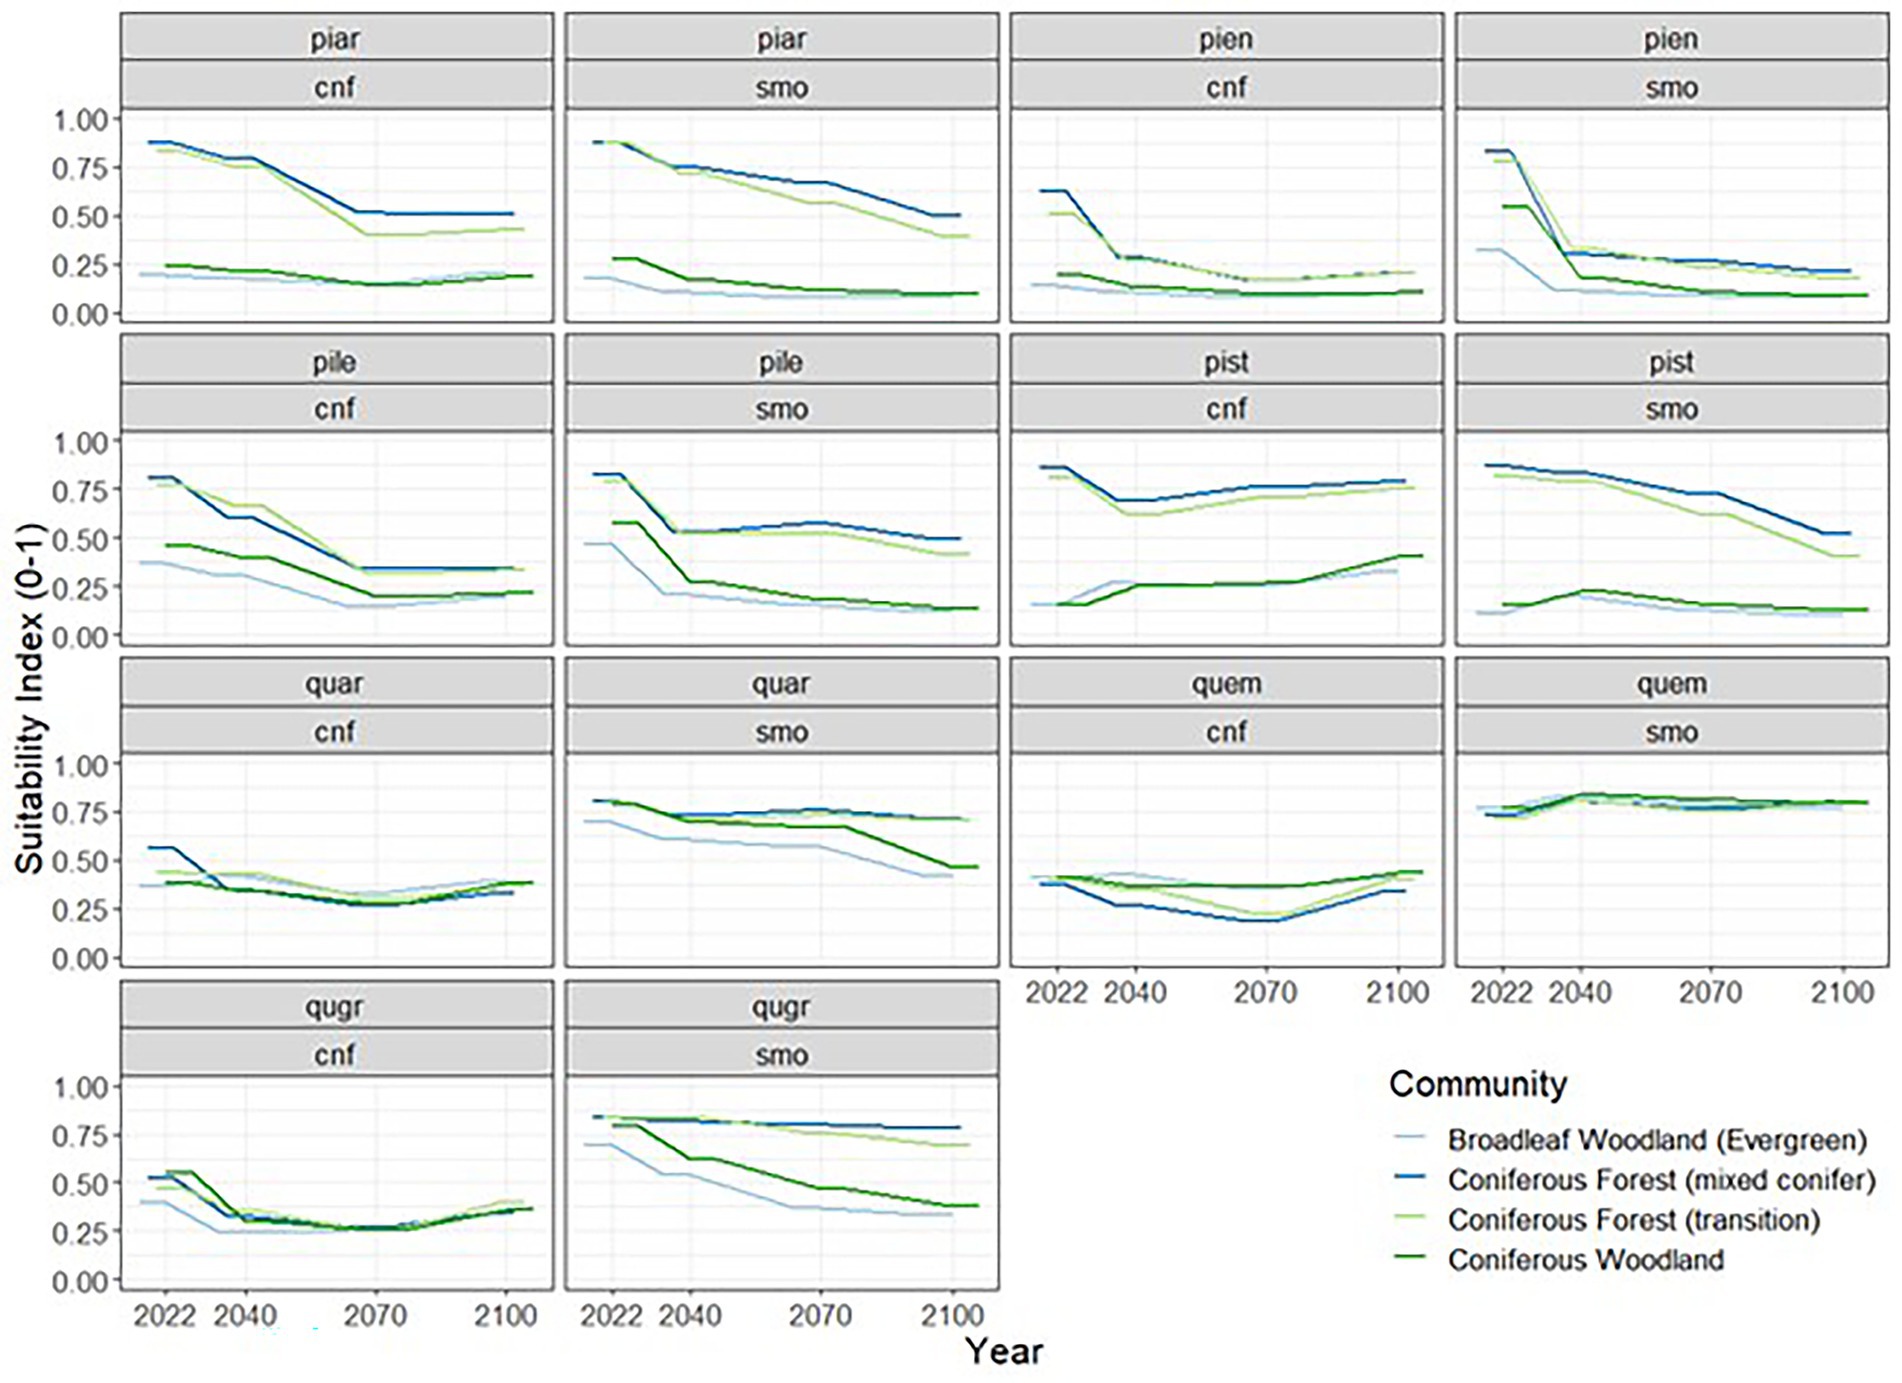
Figure 6. Projected change in habitat suitability of the seven tree species of interest within four common forest community boundary designations in the Coronado National Forest. Lines represent the mean estimated suitability.
It is important to note that these models only consider the suitability of individual species to their environment and do not account for competition among species. This means that even small changes in the bioclimatic suitability for one species could translate into a large and non-linear shift in the relative abundance of all species. Berger et al. (2008) highlights various approaches for modeling competition among plants. As a specific example, Seidl et al. (2014) demonstrates that live tree legacies play an important role in the ability of forests to recover from disturbances. Thus, the future of tree growth is partially a function of habitat suitability, and another part habitat legacy. However, much work needs to be done to explore the interaction of competition models in the face of a changing climate, which lies beyond the scope of this current effort.
3.5. Suitability and elevation
The two most natural characterizations of habitat suitability are over space and time. However, elevation drives climate variability over small geographical distances like the CNF (Randin et al., 2009). The GAMs produced visually compare the estimated changes in mean habitat suitability across elevation for both climate change scenarios and spatial modeling extents (Figure 7). GAM estimates across elevation allow us to visualize species responses to anthropogenic climate change that are difficult to detect accurately in mapping products like Figures 4, 5. All pine species are observed to show decreased habitat suitability for elevations below approximately 2,700 m, when compared to current conditions. Above approximately 2,700 m, all pines modeled to the extent of the SMO increase in habitat suitability, while the same species modeled at the CNF extent do not. Pine species also show a much higher level of agreement among the estimates for different emissions scenarios within modeling extents than the same emission scenarios across modeling extents.
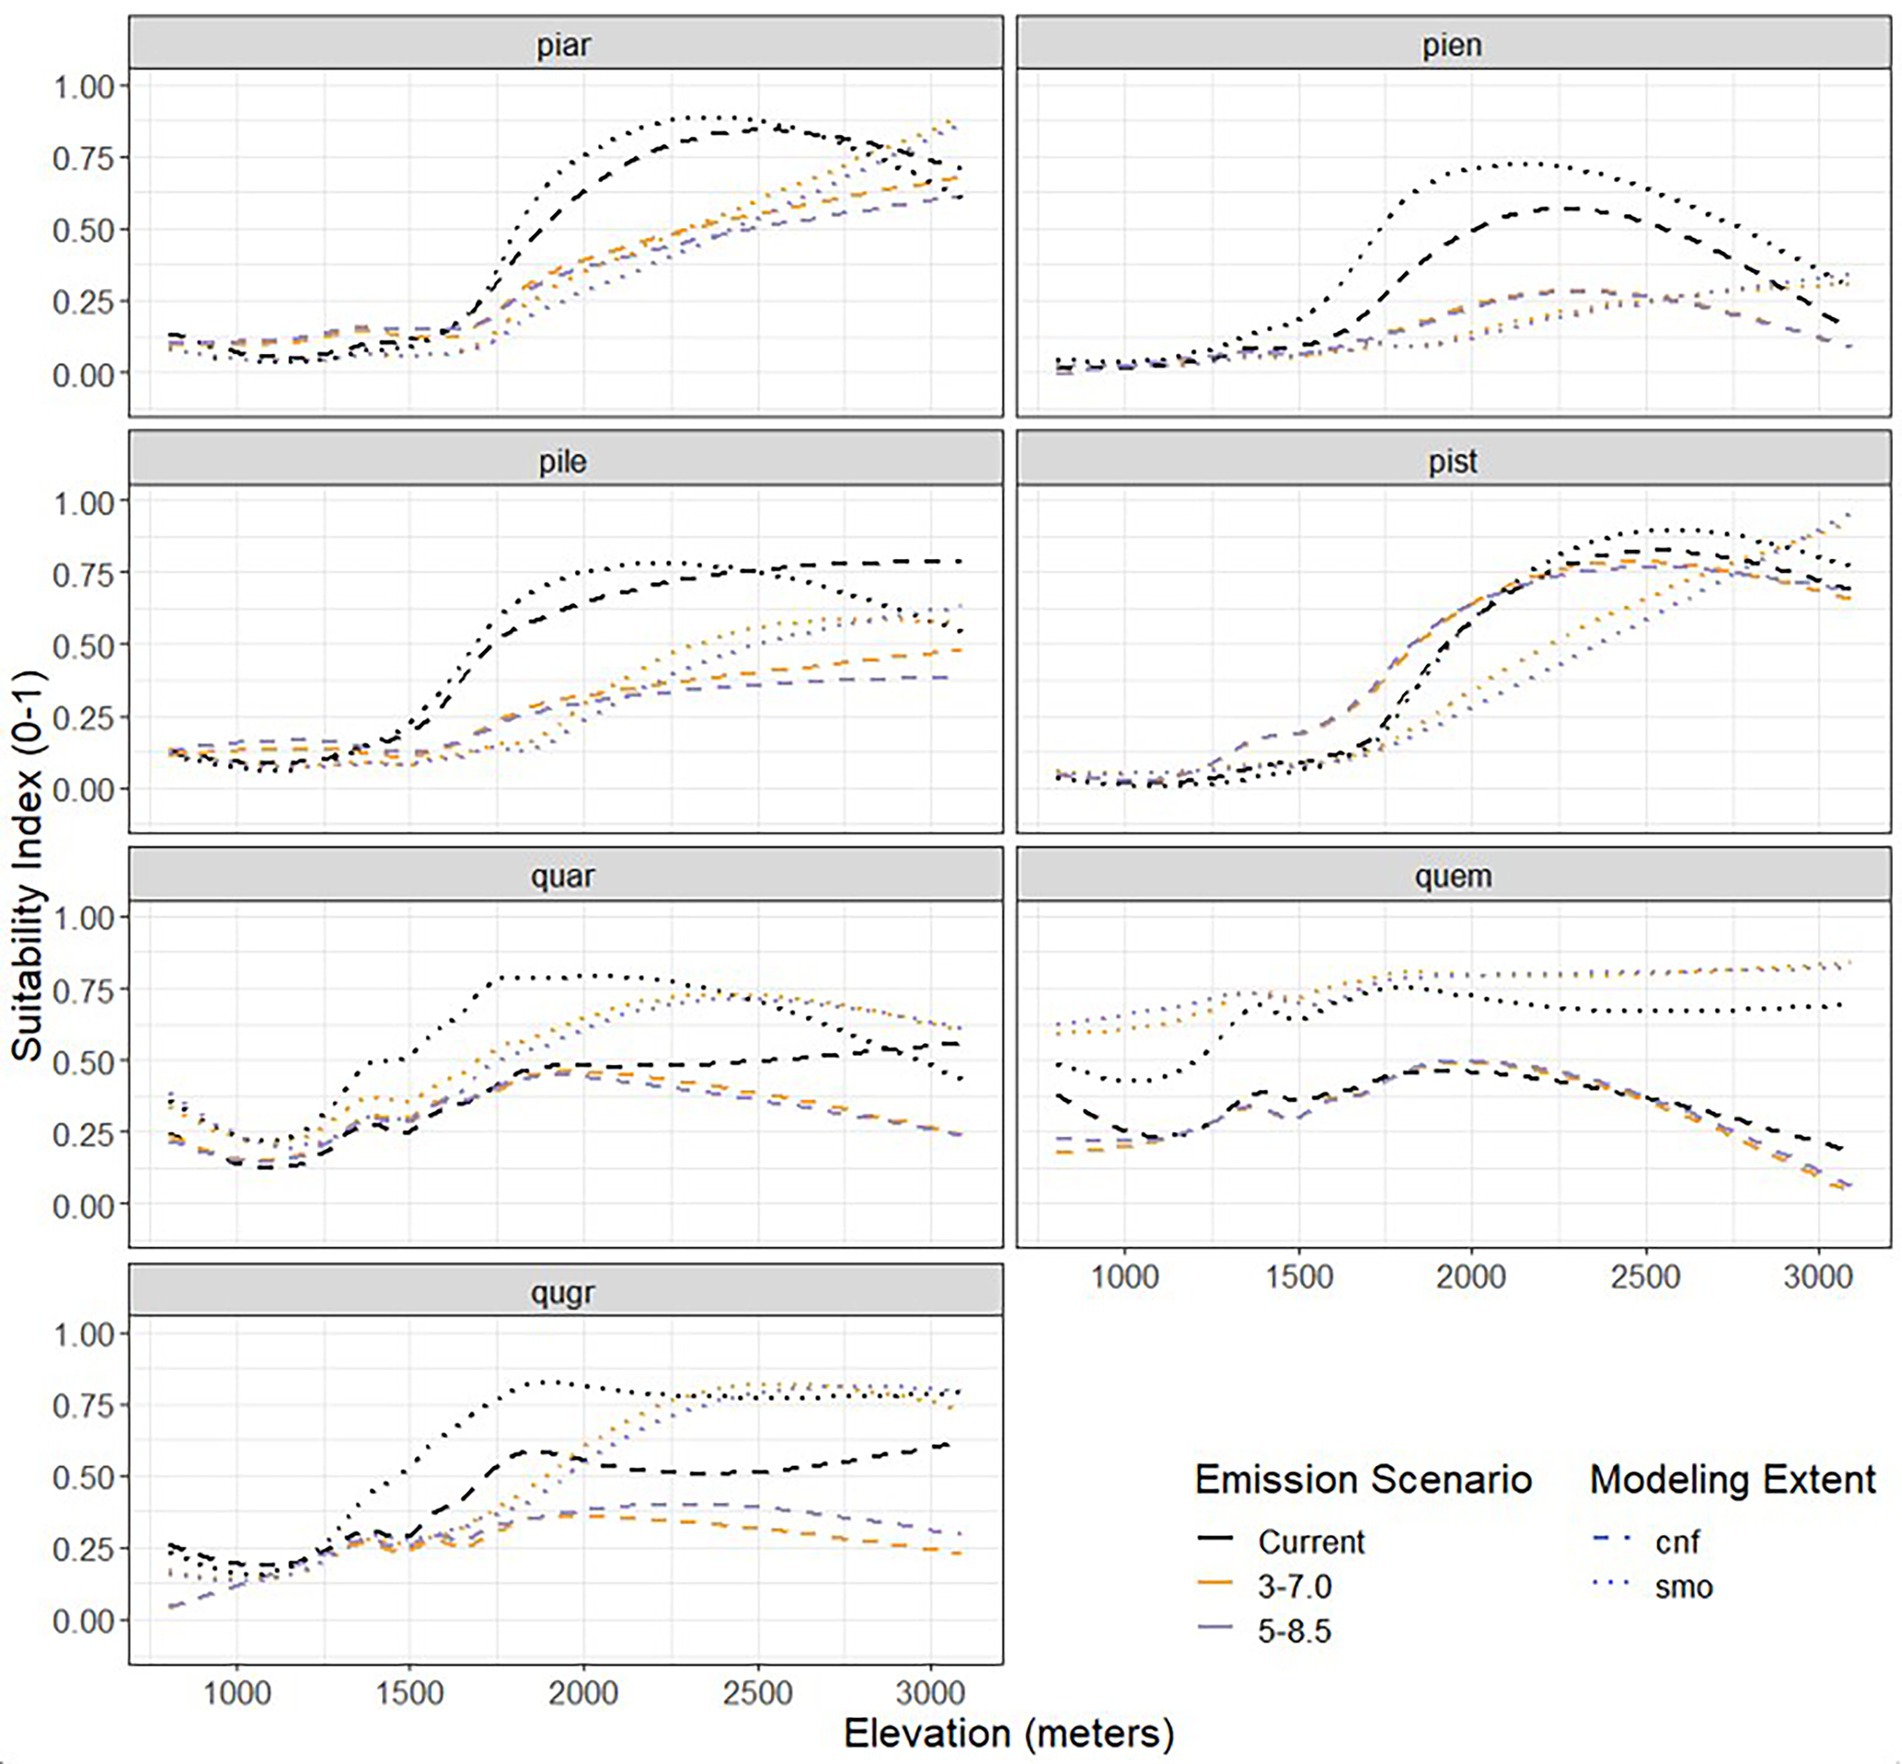
Figure 7. Comparison of the smoothed relationship between mean habitat suitability and elevation for the seven tree species of interest in the Coronado National Forest for current conditions (black, solid) and 2,100 estimates (colored, dashed) under different emissions scenarios.
Generalized additive models estimates of oak species suitability across elevation varies drastically depending on the species. Most notably, models developed at the SMO modeling extent show higher suitability across all elevation than those developed at the CNF modeling extent. The commonly highest values in habitat suitability across elevation for pines were reported by current conditions while oaks report varying results, with each species exhibiting a different emission scenario as the highest. Oaks also report a dip in habitat suitability, at approximately 1,500 m, which is most likely the result of combinations in available land for habitat at that elevation.
3.6. Suitability and latitude
Figure 8 shows smoothed estimates of mean habitat suitability for all seven species across latitude within the SMO. Latitude is observed to be a driving factor in species response to a changing climate (Colwell et al., 2008) and represents and interesting variable to consider among multiple-scale modeling comparisons. Arguably, latitude would play little role in species response to climate change within the spatial extents of the CNF. The SMO, however, is a reasonably large ecoregion spanning more than 10 degrees in latitude. Habitat suitability of pine species was similarly reported to respond to climate change across latitude, with a small over decrease in suitability for PIEN. Oak species show similar responses across latitudes with general increases in habitat suitability under future emissions scenarios. Future emission scenarios for QUAR and QUGR eventually taper off at cross with current conditions at high latitudes, while QUEM exhibits higher values in habitat suitability across all latitudes. Interestingly all species respond to latitude greater than 32 degrees with an abrupt increase. This is likely due to the patchiness and sharp increases in elevation across space for mountain ranges occupying of the Madrean Archipelago and CNF.

Figure 8. Comparison of the smoothed relationship between mean habitat suitability and latitude for the seven tree species of interest in the Coronado National Forest for current conditions (black, solid) and 2,100 estimates (colored, dashed) under different emissions scenarios.
4. Discussion
Our results indicate substantial alterations in habitat suitability among all tree species across all emissions scenarios and spatial scales. Pine species habitat suitability is generally observed to decrease in both spatial distribution and habitat quality. Changes in habitat suitability for oak species are more localized and species specific. These results align with anticipated shifts in species distribution from recent, analogous research (Du et al., 2021; Erfanian et al., 2021; Rödder et al., 2021). Our study also suggests that when modeling species distribution and habitat suitability under predicted anthropogenic emissions scenarios at local and regional scales, climate forcing scenario choice appears to be far less important for understanding drivers in species habitat suitability than the spatial scale of the models. This claim suggests that conservation efforts based on ENMs must consider and address their spatial scale of choice, and where possible, consider the sensitivity of model results to varying spatial extents. Ignoring options in the spatial extent at which models are used to train data overlooks the fact that all model results are conditional on a somewhat arbitrary choice of modeling extent.
One shortcoming of models developed at smaller spatial scales is niche truncation (Chevalier et al., 2022). Local scale models incorporate a limited range of climate, omitting outside climatic influences that may ultimately affect the whole ecological niche of species (Peterson et al., 2018). Regional models overcome this shortcoming by providing a greater range of climate model inputs, thus avoiding inappropriate model extrapolation. That in mind, the SMO spans multiple countries with vastly different opinions of forest management. It thus becomes difficult to distinguish climate effects from geopolitical effects at the regional scale. This reinforces the need for researchers to carefully consider the consequences of their spatial modeling extent choice.
Ecological niche models techniques presented in this study ignore the reality of biotic relationships and that species are in competition with each other for limited resources (Fern et al., 2019). One goal addressed was to examine if alterations among species occupying a particular community (i.e., Broadleaf woodland, Coniferous Woodlands, etc.) would invade the boundaries of another community, which was examined in Figure 5. However, each species occupying a community generally neighbors the spatial boundaries of other plants. This means that even small changes in habitat suitability could lead to drastic and non-linear changes in the competitive balance between species, resulting in large alterations in community composition and distribution (Alexander et al., 2015, 2016). Future studies would benefit from more direct investigations of the change in the competition among species, rather than looking solely at the habitat suitability of species individually.
Another consideration is the matter of spatial resolution. Small-scale variability is difficult to derive from course-grained, global climate data. Additionally, substantial changes in species habitat suitability projected in larger-scale studies may overlook small-scale areas like the CNF, which may present resilience to certain aspects of climate change. Local-specific features such as streams and springs could influence micro-climate forest communities to be more or less resilient (Wieser et al., 2003; Anderson et al., 2007). However, the smallest spatial resolution of climate data freely available at the time of this study was 1 km2, which would not capture fine-resolution microclimate. The heterogeneity that occurs with scale highlights the need for spatial models to match the scale of specific management boundaries (i.e., local, regional, global). This would allow models to be more applicable to the immediate climate adaptation science and land stewardship efforts.
Additionally, differences between modeled alterations and realized alterations may be the result of tipping points generated by extreme events (Saccone et al., 2009; Niu et al., 2014). Alters in typical climate conditions over a 30-year period may not be substantial enough to considerably change habitat suitability while increases in the yearly variance may supply a sufficient threat in forest resilience (Wang et al., 2016). For example, one exceptional drought could provide the catalyst for widespread forest fires or insect outbreaks that would noticeably alter the ecology of the CNF. Wildfires (expected to be more frequent and widespread in the future) could have large consequences due to the different fire resilience and post-fire rejuvenation of each species (Barton and Poulos, 2018). Additionally, our results imply significant changes in species habitat suitability across elevational, community, and latitudinal gradients, but realized changes in species distribution and habitat suitability may be a result of temporal lags in individual response to climate change. Our study reinforces the point that modeling efforts may allow us to anticipate the future, but ultimately should be used in conjunction with observations in current and stochastic environmental occurrences.
Modeling the future is an exciting topic in the field of landscape ecology and management, however the true consequences of anthropogenic climate change will be realized in observation over time (Gonzalez et al., 2010; Tewari et al., 2017). The results of this study call for the long-term monitoring of forest species. Our models, reliant on geo-referenced species presence largely collected by citizen science, allow land managers to develop a more-focused resampling and ground-truthing program, to continually update and add to the reliability of habitat models. We also suggest a distinct monitoring of seedling and seedling habitat suitability, which present a significant role in forest change over time as tree regeneration is the driving factor in long-term survival (Ribbens et al., 1994; Warren et al., 2012). Additionally, we suggest that when considering the use of ENM for applied conservation efforts, to do so at multiple scales (Bradter et al., 2013; Hallman and Robinson, 2020). Doing so will allow for (1) the capture of a greater range of influencing environmental drivers on species habitat suitability and, (2) a greater confidence in model result and interpretation. Opportunities abound in the application of ENM to multiple spatial scales of interest as local, complex study areas like the CNF may misrepresent changes only observable at the regional scale, which in an era of global environmental change, may be costly to management and potentially fatal to biodiversity.
Data availability statement
The original contributions presented in the study are included in the article/Supplementary material, further inquiries can be directed to the corresponding author.
Author contributions
JC, AP, KM, and BB: conceptualization, writing – original draft preparation, and writing – review and editing. JC and BB: methodology, software, analysis, data curation, visualization, and supervision. JC, AP, and KM: investigation. JC: resources. All authors have read and agreed to the published version of the manuscript.
Funding
This project was supported by the Utah State University Ecology Center, and the National Science Foundation under Grant No. 1633756.
Acknowledgments
The authors would like to thank Thad Nicholls, Sarah Klain, Wei Zhang, and Nancy Huntly for their generous support, editing, and feedback during the duration of this study. The authors would also like to thank the reviewers for their valuable feedback and comments. Analysis and visualization for this paper was completed in R 4.2.0 (R Core Team 2021) and ArcGIS Pro (Version 2.9, ESRI Inc.). Data manipulations and visualizations were created using the suite of R packages included in the Tidyverse [cite Wickham et al., 2016 with color palettes supplied by the RColorBrewer package (Neuwirth and R. Color Brewer, 2014)]. Spatial data analysis and visualizations were created using the sf (Pebesma, 2018), terra (Hijmans et al., 2022), and ggmap (Kahle and Wickham, 2013) packages. Lastly, random forest modeling was developed using the randomForest package (RColorBrewer and Liaw, 2018), Maximum Entropy using the dismo package (Hijmans et al., 2017), Boosted Regression Trees using the gbm package (Ridgeway and Ridgeway, 2004), and Generalized Additive Models were developed using the mgcv package (Wood, 2004, 2017).
Conflict of interest
The authors declare that the research was conducted in the absence of any commercial or financial relationships that could be construed as a potential conflict of interest.
Publisher’s note
All claims expressed in this article are solely those of the authors and do not necessarily represent those of their affiliated organizations, or those of the publisher, the editors and the reviewers. Any product that may be evaluated in this article, or claim that may be made by its manufacturer, is not guaranteed or endorsed by the publisher.
Supplementary material
The Supplementary material for this article can be found online at: https://www.frontiersin.org/articles/10.3389/fevo.2023.1086062/full#supplementary-material
References
Alexander, J. M., Chalmandrier, L., Lenoir, J., Burgess, T. I., Essl, F., Haider, S., et al. (2018). Lags in the response of mountain plant communities to climate change. Glob. Chang. Biol. 24, 563–579. doi: 10.1111/gcb.13976
Alexander, J. M., Diez, J. M., Hart, S. P., and Levine, J. M. (2016). When climate reshuffles competitors: a call for experimental macroecology. Trends Ecol. Evol. 31, 831–841. doi: 10.1016/j.tree.2016.08.003
Alexander, J. M., Diez, J. M., and Levine, J. M. (2015). Novel competitors shape species’ responses to climate change. Nature 525, 515–518. doi: 10.1038/nature14952
Alizadeh, M. R., Adamowski, J., and Inam, A. (2022). Integrated assessment of localized SSP–RCP narratives for climate change adaptation in coupled human-water systems. Sci. Total Environ. 823:153660. doi: 10.1016/j.scitotenv.2022.153660
Amano, T., Lamming, J. D. L., and Sutherland, W. J. (2016). Spatial gaps in global biodiversity information and the role of citizen science. Bioscience 66, 393–400. doi: 10.1093/biosci/biw022
Anderson, P. D., Larson, D. J., and Chan, S. S. (2007). Riparian buffer and density management influences on microclimate of young headwater forests of western Oregon. For. Sci. 53, 254–269. doi: 10.1093/forestscience/53.2.254
Araújo, M. B., and New, M. (2007). Ensemble forecasting of species distributions. Trends Ecol. Evol. 22, 42–47. doi: 10.1016/j.tree.2006.09.010
Barbet-Massin, M., Jiguet, F., Albert, C. H., and Thuiller, W. (2012). Selecting pseudo-absences for species distribution models: how, where and how many? Methods Ecol. Evol. 3, 327–338. doi: 10.1111/j.2041-210X.2011.00172.x
Barton, A. M., and Poulos, H. M. (2018). Pine vs. oaks revisited: conversion of Madrean pine-oak forest to oak shrubland after high-severity wildfire in the Sky Islands of Arizona. For. Ecol. Manag. 414, 28–40. doi: 10.1016/j.foreco.2018.02.011
Berger, U., Piou, C., Schiffers, K., and Grimm, V. (2008). Competition among plants: concepts, individual-based modelling approaches, and a proposal for a future research strategy. Perspect. Plant Ecol. Evol. Syst. 9, 121–135. doi: 10.1016/j.ppees.2007.11.002
Booth, T. H. (2018). Why understanding the pioneering and continuing contributions of BIOCLIM to species distribution modelling is important. Austral Ecol. 43, 852–860. doi: 10.1111/aec.12628
Bradter, U., Kunin, W. E., Altringham, J. D., Thom, T. J., and Benton, T. G. (2013). Identifying appropriate spatial scales of predictors in species distribution models with the random forest algorithm. Methods Ecol. Evol. 4, 167–174. doi: 10.1111/j.2041-210x.2012.00253.x
Brown, C. H., and Griscom, H. P. (2022). Differentiating between distribution and suitable habitat in ecological niche models: a red spruce (Picea rubens) case study. Ecol. Model. 472:110102. doi: 10.1016/j.ecolmodel.2022.110102
Carrell, J. D., Hammill, E., and Edwards, T. C. (2022). Balancing rare species conservation with extractive industries. Land 11:2012. doi: 10.3390/land11112012
Chamberlain, S., Ram, K., and Hart, T. (2021). Package 'spocc': Interface to species occurrence data sources. Available at: https://cran.r-project.org/web/packages/spocc/index.html.
Chen, I.-C., Hill, J. K., Ohlemüller, R., Roy, D. B., and Thomas, C. D. (2011). Rapid range shifts of species associated with high levels of climate warming. Science 333, 1024–1026. doi: 10.1126/science.1206432
Chevalier, M., Zarzo-Arias, A., Guélat, J., Mateo, R. G., and Guisan, A. (2022). Accounting for niche truncation to improve spatial and temporal predictions of species distributions. Front. Ecol. Evol. 10. doi: 10.3389/fevo.2022.944116
Coe, S.J., Finch, D.M., and Friggens, M.M. (2012). An assessment of climate change and the vulnerability of wildlife in the Sky Islands of the southwest. Fort Collins, CO: US Department of Agriculture, Forest Service, Rocky Mountain Research Station. 208, 273.
Colwell, R. K., Brehm, G., Cardelús, C. L., Gilman, A. C., and Longino, J. T. (2008). Global warming, elevational range shifts, and lowland biotic attrition in the wet tropics. Science 322, 258–261. doi: 10.1126/science.1162547
Colwell, R. K., and Rangel, T. F. (2009). Hutchinson's duality: the once and future niche. Proc. Natl. Acad. Sci. 106, 19651–19658. doi: 10.1073/pnas.0901650106
Cutler, A., Cutler, D. R., and Stevens, J. R. (2012). “Random forests” in Ensemble machine learning: Methods and applications. eds. C. Zhang and Y. Ma (Boston, MA: Springer US), 157–175.
Davis, M. B. (1981). “Quaternary history and the stability of forest communities” in Forest Succession: Concepts and Application. eds. D. C. West, H. H. Shugart, and D. B. Botkin (New York, NY: Springer New York), 132–153.
De'ath, G. (2007). Boosted trees for ecological modeling and prediction. Ecology 88, 243–251. doi: 10.1890/0012-9658(2007)88[243:BTFEMA]2.0.CO;2
DeLeo, J.M. (1993). Receiver operating characteristic laboratory (ROCLAB): software for developing decision strategies that account for uncertainty. In International symposium on uncertainty modeling and analysis, IEEE, 318–325.
Draper, F. C., Asner, G. P., Honorio Coronado, E. N., Baker, T. R., García-Villacorta, R., Pitman, N. C. A., et al. (2019). Dominant tree species drive beta diversity patterns in western Amazonia. Ecology 100:e02636. doi: 10.1002/ecy.2636
Du, Z., He, Y., Wang, H., Wang, C., and Duan, Y. (2021). Potential geographical distribution and habitat shift of the genus Ammopiptanthus in China under current and future climate change based on the MaxEnt model. J. Arid Environ. 184:104328. doi: 10.1016/j.jaridenv.2020.104328
Duan, R.-Y., Kong, X.-Q., Huang, M.-Y., Fan, W.-Y., and Wang, Z.-G. (2014). The predictive performance and stability of six species distribution models. PLoS One 9:e112764. doi: 10.1371/journal.pone.0112764
Dyderski, M. K., Paź, S., Frelich, L. E., and Jagodziński, A. M. (2018). How much does climate change threaten European forest tree species distributions? Glob. Chang. Biol. 24, 1150–1163. doi: 10.1111/gcb.13925
Elith, J., and Franklin, J. (2013). “Species distribution modeling” in Encyclopedia of Biodiversity. ed. S. A. Levin. 2nd ed (Amsterdam: Elsevier Inc.), 692–705.
Elith, J., Kearney, M., and Phillips, S. (2010). The art of modelling range-shifting species. Methods Ecol. Evol. 1, 330–342. doi: 10.1111/j.2041-210X.2010.00036.x
Elith, J., Phillips, S. J., Hastie, T., Dudík, M., Chee, Y. E., and Yates, C. J. (2011). A statistical explanation of MaxEnt for ecologists. Divers. Distrib. 17, 43–57. doi: 10.1111/j.1472-4642.2010.00725.x
Erfanian, M. B., Sagharyan, M., Memariani, F., and Ejtehadi, H. (2021). Predicting range shifts of three endangered endemic plants of the Khorassan-Kopet Dagh floristic province under global change. Sci. Rep. 11, 1–13. doi: 10.1038/s41598-021-88577-x
ESRI (2011). World latitude and longitude grids. Available at: https://www.arcgis.com/home/item.html?id=f11bcdc5d484400fa926dcce68de3df7
Feldman, M. J., Imbeau, L., Marchand, P., Mazerolle, M. J., Darveau, M., and Fenton, N. J. (2021). Trends and gaps in the use of citizen science derived data as input for species distribution models: a quantitative review. PLoS One 16:e0234587. doi: 10.1371/journal.pone.0234587
Fern, R. R., Morrison, M. L., Wang, H.-H., Grant, W. E., and Campbell, T. A. (2019). Incorporating biotic relationships improves species distribution models: modeling the temporal influence of competition in conspecific nesting birds. Ecol. Model. 408:108743. doi: 10.1016/j.ecolmodel.2019.108743
Fielding, A. H., and Bell, J. F. (1997). A review of methods for the assessment of prediction errors in conservation presence/absence models. Environ. Conserv. 24, 38–49. doi: 10.1017/S0376892997000088
Forester, B. R., Dechaine, E. G., and Bunn, A. G. (2013). Integrating ensemble species distribution modelling and statistical phylogeography to inform projections of climate change impacts on species distributions. Divers. Distrib. 19, 1480–1495. doi: 10.1111/ddi.12098
Fourcade, Y., Engler, J. O., Rödder, D., and Secondi, J. (2014). Mapping species distributions with MAXENT using a geographically biased sample of presence data: a performance assessment of methods for correcting sampling bias. PLoS One 9:e97122. doi: 10.1371/journal.pone.0097122
Freeman, E. A., and Moisen, G. (2008). PresenceAbsence: an R package for presence absence analysis. J. Stat. Softw. 23:31. doi: 10.1016/j.ecolmodel.2008.05.015
Gallien, L., Douzet, R., Pratte, S., Zimmermann, N. E., and Thuiller, W. (2012). Invasive species distribution models–how violating the equilibrium assumption can create new insights. Glob. Ecol. Biogeogr. 21, 1126–1136. doi: 10.1111/j.1466-8238.2012.00768.x
Gonzalez, P., Neilson, R. P., Lenihan, J. M., and Drapek, R. J. (2010). Global patterns in the vulnerability of ecosystems to vegetation shifts due to climate change. Glob. Ecol. Biogeogr. 19, 755–768. doi: 10.1111/j.1466-8238.2010.00558.x
González-Elizondo, M., González-Elizondo, M., González, L.R., Enríquez, I.L., Rentería, F.R., and Flores, J.T. (2013). Ecosystems and diversity of the Sierra Madre occidental. In: Gerald J. Gottfried, Peter F. Ffolliott, Brooke S. Gebow, Lane G. Eskew, and Loa C. Collins Merging science and management in a rapidly changing world: Biodiversity and management of the Madrean archipelago III and 7th conference on research and resource Management in the Southwestern Deserts; 2012 may 1–5 Tucson, AZ. RMRS-P-67 204–211).
Grewal, R., Cote, J. A., and Baumgartner, H. (2004). Multicollinearity and measurement error in structural equation models: implications for theory testing. Mark. Sci. 23, 519–529. doi: 10.1287/mksc.1040.0070
Guala, G. (2019). What you probably Didn't know about biodiversity information serving our nation (BISON). Biodivers. Inf. Sci. Stand. 3:e37476. doi: 10.3897/biss.3.37476
Hallman, T. A., and Robinson, W. D. (2020). Comparing multi-and single-scale species distribution and abundance models built with the boosted regression tree algorithm. Landsc. Ecol. 35, 1161–1174. doi: 10.1007/s10980-020-01007-7
Hamed, M. M., Nashwan, M. S., and Shahid, S. (2022). A novel selection method of CMIP6 GCMs for robust climate projection. Int. J. Climatol. 42, 4258–4272. doi: 10.1002/joc.7461
Hansen, G., and Stone, D. (2016). Assessing the observed impact of anthropogenic climate change. Nat. Clim. Chang. 6, 532–537. doi: 10.1038/nclimate2896
Hao, Z., Zhang, J., Song, B., Ye, J., and Li, B. (2007). Vertical structure and spatial associations of dominant tree species in an old-growth temperate forest. For. Ecol. Manag. 252, 1–11. doi: 10.1016/j.foreco.2007.06.026
Hastie, T., Tibshirani, R., Friedman, J. H., and Friedman, J. H. (2009). The elements of statistical learning: Data mining, inference, and prediction Springer.
Hijmans, R. J., Bivand, R., Pebesma, E., and Sumner, M. D. (2022). “Package ‘terra’.” Vienna, Austria: Maintainer.
Hijmans, R. J., Phillips, S., Leathwick, J., Elith, J., and Hijmans, M. R. J. (2017). Package ‘dismo’. Circles 9, 1–68.
Hughes, L. (2000). Biological consequences of global warming: is the signal already apparent? Trends Ecol. Evol. 15, 56–61. doi: 10.1016/S0169-5347(99)01764-4
Iverson, L. R., and Mckenzie, D. (2013). Tree-species range shifts in a changing climate: detecting, modeling, assisting. Landsc. Ecol. 28, 879–889. doi: 10.1007/s10980-013-9885-x
Kannan, R., and James, D. A. (2009). Effects of climate change on global biodiversity: a review of key literature. Trop. Ecol. 50:31.
Karger, D. N. C. O., Böhner, J., Kawohl, T., Kreft, H., Soria-Auza, R. W., Zimmermann, N. E., et al. (2018). Data From: Climatologies at High Resolution for the Earth’s Land Surface Areas EnviDat.
Karger, D. N., Conrad, O., Böhner, J., Kawohl, T., Kreft, H., Soria-Auza, R. W., et al. (2017). Climatologies at high resolution for the earth’s land surface areas. Sci. Data 4:170122. doi: 10.1038/sdata.2017.122
Kim, J. H. (2019). Multicollinearity and misleading statistical results. Korean J. Anesthesiol. 72, 558–569. doi: 10.4097/kja.19087
Kutner, M.H., Nachtsheim, C.J., Neter, J., and Wasserman, W. (2004). Applied linear regression models. Irwin, NY: McGraw-Hill.
Liu, C., Newell, G., and White, M. (2019). The effect of sample size on the accuracy of species distribution models: considering both presences and pseudo-absences or background sites. Ecography 42, 535–548. doi: 10.1111/ecog.03188
Ma, H., Zou, W., Yang, J., Hogan, J. A., Xu, H., and Chen, J. (2019). Dominant tree species shape soil microbial community via regulating assembly processes in planted subtropical forests. Forests 10:978. doi: 10.3390/f10110978
Malanson, G. P., Resler, L. M., Butler, D. R., and Fagre, D. B. (2019). Mountain plant communities: Uncertain sentinels? Prog. Phys. Geog. Earth Environ. 43, 521–543. doi: 10.1177/0309133319843873
Marmion, M., Parviainen, M., Luoto, M., Heikkinen, R. K., and Thuiller, W. (2009). Evaluation of consensus methods in predictive species distribution modelling. Divers. Distrib. 15, 59–69. doi: 10.1111/j.1472-4642.2008.00491.x
Matutini, F., Baudry, J., Pain, G., Sineau, M., and Pithon, J. (2021). How citizen science could improve species distribution models and their independent assessment. Ecol. Evol. 11, 3028–3039. doi: 10.1002/ece3.7210
Meinshausen, M., Nicholls, Z. R., Lewis, J., Gidden, M. J., Vogel, E., Freund, M., et al. (2020). The shared socio-economic pathway (SSP) greenhouse gas concentrations and their extensions to 2500. Geosci. Model Dev. 13, 3571–3605. doi: 10.5194/gmd-13-3571-2020
Mi, C., Huettmann, F., Guo, Y., Han, X., and Wen, L. (2017). Why choose random Forest to predict rare species distribution with few samples in large undersampled areas? Three Asian crane species models provide supporting evidence. PeerJ 5:e2849. doi: 10.7717/peerj.2849
Milanesi, P., Mori, E., and Menchetti, M. (2020). Observer-oriented approach improves species distribution models from citizen science data. Ecol. Evol. 10, 12104–12114. doi: 10.1002/ece3.6832
Moor, H., Hylander, K., and Norberg, J. (2015). Predicting climate change effects on wetland ecosystem services using species distribution modeling and plant functional traits. Ambio 44, 113–126. doi: 10.1007/s13280-014-0593-9
Morin, X., and Thuiller, W. (2009). Comparing niche- and process-based models to reduce prediction uncertainty in species range shifts under climate change. Ecology 90, 1301–1313. doi: 10.1890/08-0134.1
Nakao, K., Higa, M., Tsuyama, I., Matsui, T., Horikawa, M., and Tanaka, N. (2013). Spatial conservation planning under climate change: using species distribution modeling to assess priority for adaptive management of Fagus crenata in Japan. J. Nat. Conserv. 21, 406–413. doi: 10.1016/j.jnc.2013.06.003
Niu, S., Luo, Y., Li, D., Cao, S., Xia, J., Li, J., et al. (2014). Plant growth and mortality under climatic extremes: an overview. Environ. Exp. Bot. 98, 13–19. doi: 10.1016/j.envexpbot.2013.10.004
Pearson, R. G. (2007). Species’ distribution modeling for conservation educators and practitioners. Synthesis Am. Mus. Nat. Hist. 50, 54–89.
Pebesma, E. J. (2018). “Simple features for R: standardized support for spatial vector data.” R J. 10.1. 439.
Pepin, N., Bradley, R. S., Diaz, H. F., Baraer, M., Caceres, E. B., Forsythe, N., et al. (2015). Elevation-dependent warming in mountain regions of the world. Nat. Clim. Chang. 5, 424–430. doi: 10.1038/nclimate2563
Périé, C., and De Blois, S. (2016). Dominant forest tree species are potentially vulnerable to climate change over large portions of their range even at high latitudes. PeerJ 4:e2218. doi: 10.7717/peerj.2218
Peterson, A. T., Cobos, M. E., and Jiménez-García, D. (2018). Major challenges for correlational ecological niche model projections to future climate conditions. Ann. N. Y. Acad. Sci. 1429, 66–77. doi: 10.1111/nyas.13873
Portal, L.C.M.A.A. (2007). North America elevation 1-kilometer resolution GRID, U.S.G. Survey. Available at: https://www.sciencebase.gov/catalog/item/4fb5495ee4b04cb937751d6d
Power, M. E., Tilman, D., Estes, J. A., Menge, B. A., Bond, W. J., Mills, L. S., et al. (1996). Challenges in the quest for keystones: identifying keystone species is difficult—but essential to understanding how loss of species will affect ecosystems. Bioscience 46, 609–620. doi: 10.2307/1312990
Priti, H., Aravind, N., Shaanker, R. U., and Ravikanth, G. (2016). Modeling impacts of future climate on the distribution of Myristicaceae species in the Western Ghats, India. Ecol. Eng. 89, 14–23. doi: 10.1016/j.ecoleng.2016.01.006
Randin, C. F., Engler, R., Normand, S., Zappa, M., Zimmermann, N. E., Pearman, P. B., et al. (2009). Climate change and plant distribution: local models predict high-elevation persistence. Glob. Chang. Biol. 15, 1557–1569. doi: 10.1111/j.1365-2486.2008.01766.x
R Core Team (2021). R: A language and environment for statistical computing, R Foundation for Statistical Computing. Vienna, Austria. Available at: https://www.R-project.org/
Rcolorbrewer, S., and Liaw, M.A. (2018). Package ‘randomforest’. University of California, Berkeley: Berkeley, CA
Ribbens, E., Silander, J. A. Jr., and Pacala, S. W. (1994). Seedling recruitment in forests: calibrating models to predict patterns of tree seedling dispersion. Ecology 75, 1794–1806. doi: 10.2307/1939638
Ribeiro, E.C., Batjes, N.H., Leenaars, J.G., Van Oostrum, A., and De Jesus, J.M. (2015). Towards the standardization and harmonization of world soil data: procedures manual ISRIC world soil information service (WoSIS version 2.0). Available at: http://www.isric.org/sites/default/files/isric_report_2015_03.pdf
Ridgeway, G., and Ridgeway, M.G. (2004). The gbm package. R Foundation for Statistical Computing, Vienna 5.
Robertson, T., Döring, M., Guralnick, R., Bloom, D., Wieczorek, J., Braak, K., et al. (2014). The GBIF integrated publishing toolkit: facilitating the efficient publishing of biodiversity data on the internet. PLoS One 9:e102623. doi: 10.1371/journal.pone.0102623
Rödder, D., Schmitt, T., Gros, P., Ulrich, W., and Habel, J. C. (2021). Climate change drives mountain butterflies towards the summits. Sci. Rep. 11, 1–12. doi: 10.1038/s41598-021-93826-0
Rosenzweig, C., Karoly, D., Vicarelli, M., Neofotis, P., Wu, Q., Casassa, G., et al. (2008). Attributing physical and biological impacts to anthropogenic climate change. Nature 453, 353–357. doi: 10.1038/nature06937
Saccone, P., Delzon, S., Pagès, J. P., Brun, J. J., and Michalet, R. (2009). The role of biotic interactions in altering tree seedling responses to an extreme climatic event. J. Veg. Sci. 20, 403–414. doi: 10.1111/j.1654-1103.2009.01012.x
Seidl, R., Rammer, W., and Spies, T. A. (2014). Disturbance legacies increase the resilience of forest ecosystem structure, composition, and functioning. Ecol. Appl. 24, 2063–2077. doi: 10.1890/14-0255.1
Service U.F (2013). “Coronado National Forest Draft Land and resource management plan” in Cochise, Graham, Pima, Pinal, and Santa Cruz counties, Arizona, and Hidalgo County, New Mexico. ed. S. Region
Shabani, F., Kumar, L., and Ahmadi, M. (2018). Assessing accuracy methods of species distribution models: AUC, specificity, sensitivity and the true skill statistic. Glob. J. Hum. Soc. Sci. 18, 6–18.
Silva-Flores, R., Pérez-Verdín, G., and Wehenkel, C. (2014). Patterns of tree species diversity in relation to climatic factors on the Sierra Madre occidental, Mexico. PLoS One 9:e105034. doi: 10.1371/journal.pone.0105034
Taucare-Ríos, A., Bizama, G., and Bustamante, R. O. (2016). Using global and regional species distribution models (SDM) to infer the invasive stage of Latrodectus geometricus (Araneae: Theridiidae) in the Americas. Environ. Entomol. 45, 1379–1385. doi: 10.1093/ee/nvw118
Tewari, V. P., Verma, R. K., and Von Gadow, K. (2017). Climate change effects in the Western Himalayan ecosystems of India: evidence and strategies. Forest Ecosyst. 4, 1–9. doi: 10.1186/s40663-017-0100-4
USDA Forest Service (2022). Geospatial Data. Available at: https://www.fs.usda.gov/detailfull/r3/landmanagement/gis/?cid=stelprdb5201889&width=full
USGS. (2021). SRTM30+ global 1-km digital elevation model (DEM): version 11: land surface. U.S.G. Survery. Available at: https://catalog.data.gov/dataset/srtm30-global-1-km-digital-elevation-model-dem-version-11-land-surface: Data.gov
Wan, J.-Z., Wang, C.-J., and Yu, F.-H. (2017). Spatial conservation prioritization for dominant tree species of Chinese forest communities under climate change. Clim. Chang. 144, 303–316. doi: 10.1007/s10584-017-2044-7
Wang, C., Liu, C., Wan, J., and Zhang, Z. (2016). Climate change may threaten habitat suitability of threatened plant species within Chinese nature reserves. PeerJ 4:e2091. doi: 10.7717/peerj.2091
Warren, R. J., Bahn, V., and Bradford, M. A. (2012). The interaction between propagule pressure, habitat suitability and density-dependent reproduction in species invasion. Oikos 121, 874–881. doi: 10.1111/j.1600-0706.2011.20174.x
Wickham, H., Chang, W., and Wickham, M. H. (2016). Package ‘ggplot2’. Create Elegant Data Visualisations Using the Grammar of Graphics. 2nd, 1–189.
Wieser, G., Hecke, K., Tausz, M., Häberle, K.-H., Grams, T. E., and Matyssek, R. (2003). The influence of microclimate and tree age on the defense capacity of European beech (Fagus sylvatica L.) against oxidative stress. Ann. For. Sci. 60, 131–135. doi: 10.1051/forest:2003005
Williams, J. N., Seo, C., Thorne, J., Nelson, J. K., Erwin, S., O’brien, J. M., et al. (2009). Using species distribution models to predict new occurrences for rare plants. Divers. Distrib. 15, 565–576. doi: 10.1111/j.1472-4642.2009.00567.x
Wood, S. N. (2004). Stable and efficient multiple smoothing parameter estimation for generalized additive models. J. Am. Stat. Assoc. 99, 673–686. doi: 10.1198/016214504000000980
Wood, S. (2017). Generalized additive models: an introduction with R 2. New York: Chapman and Hall/CRC.
Yanahan, A., and Moore, W. (2019). Impacts of 21st-century climate change on montane habitat in the Madrean Sky Island archipelago. Divers. Distrib. 25, 1625–1638. doi: 10.1111/ddi.12965
Yu, H., Cooper, A. R., and Infante, D. M. (2020). Improving species distribution model predictive accuracy using species abundance: application with boosted regression trees. Ecol. Model. 432:109202. doi: 10.1016/j.ecolmodel.2020.109202
Keywords: ecological niche modeling, spatial scale, habitat suitability, anthropogenic climate change, Sierra Madre Occidental, Coronado National Forest, oak-pine forests
Citation: Carrell JD, Phinney AI, Mueller K and Bean B (2023) Multiscale ecological niche modeling exhibits varying climate change impacts on habitat suitability of Madrean Pine-Oak trees. Front. Ecol. Evol. 11:1086062. doi: 10.3389/fevo.2023.1086062
Edited by:
Daniel Maynard, ETH Zürich, SwitzerlandReviewed by:
Sonia Smeraldo, University of Naples Federico II, ItalyAlejandra Zarzo-Arias, National Museum of Natural Sciences (CSIC), Spain
Copyright © 2023 Carrell, Phinney, Mueller and Bean. This is an open-access article distributed under the terms of the Creative Commons Attribution License (CC BY). The use, distribution or reproduction in other forums is permitted, provided the original author(s) and the copyright owner(s) are credited and that the original publication in this journal is cited, in accordance with accepted academic practice. No use, distribution or reproduction is permitted which does not comply with these terms.
*Correspondence: Joshua D. Carrell, jcarrell@colostate.edu