Transoceanic migration network of dragonfly Pantala flavescens: origin, dispersal and timing
 Kumar Sanat Ranjan
 Amit A. Pawar
 Arnab Roy
  Sandeep Saha
- Department of Aerospace Engineering, Indian Institute of Technology Kharagpur, Kharagpur, West Bengal, India
The awe-inspiring multi-generational, transoceanic migration circuit of dragonfly species, Pantala flavescens stretches from India to Africa. Understanding the collective role of wind, precipitation, fuel, breeding, and life cycle driving the migration remains elusive. We identify the transoceanic migration route from years 2002 to 2007 by imposing an energetics-based time-constraint on a modified Dijkstra’s path-planning algorithm incorporating active wind compensation. The prevailing winds play a pivotal role; the Somali Jet enables migration across the Indian Ocean from Africa to India, whereas the return requires stopovers at the disappearing islands of the Maldives and Seychelles. The migration timing, identified using monthly-successful trajectories, life cycle, and precipitation data, corroborates sightings. A branched-network hypothesis connects our sighting in Cherrapunji (North-East India), the likely origin, to the known migration circuit.
1 Introduction
Every year millions of insects fly thousands of kilometers for conducive breeding habitats and foraging grounds (Williams, 1957; Holland et al., 2006; Dingle, 2014; Chapman et al., 2015). The sheer volume of the migration has tremendous consequences on the global ecology (Bauer and Hoye, 2014; Chapman et al., 2015; Hu et al., 2016). Migratory insects connect distant ecosystems across oceans, transport nutrients and propagules over long distances, and structure food webs (Bauer and Hoye, 2014; Hu et al., 2016). Although the consequences on the food cycle, distribution of nutrients, pollination, modulating disease-causing micro-organisms (Satterfield et al., 2020), panmixia (Troast et al., 2016) are of universal significance, predicting transoceanic route for insect migration has had limited success (Hedlund et al., 2021; Hobson et al., 2021). Identifying the migration route accurately could help understand gene flow and population dynamics of pests (Cao and Wu, 2019), disease outbreaks due to parasites (Huestis et al., 2019) and locate the migrant carcass which drives seasonal transport of nutrients like nitrogen and phosphorus (Satterfield et al., 2020). Improving the prediction of the migration route and timing is a prerequisite to applying the concept of “migratory connectivity” to insects (Gao et al., 2020), assisting population management and pest control strategies and aiding full annual cycle studies (Marra et al., 2015). Furthermore, studies show the population of the migrating insects declining (Dirzo et al., 2014; Hallmann et al., 2017; Sánchez-Bayo and Wyckhuys, 2019). An increase in surface temperature shifts the overwintering sites away and stretches the migration range as in the migration of the Agrotis ipsilon(Zeng et al., 2020). Similarly, alterations in the microclimate of the stopover sites and origin have been conjectured to be the cause of declining populations of Pantala flavescens (Cao et al., 2018). Consequently, long-range migration becomes more strenuous, leading to ecological concerns regarding the arrival of migrant species that regulate the local vector population and outbreak of diseases (Huestis et al., 2019; Satterfield et al., 2020). Therefore, assessing the impact of climate change on the survivability of the migration relies intrinsically on route identification.
The annual migration circuit of dragonfly species, Pantala flavescens, is a multi-generational, transoceanic path (Anderson, 2009) spanning 14000−18000 km from India to Africa (Hobson et al., 2012). Intriguingly, P. flavescens crosses the Indian Ocean from Africa to India without stopovers with assistance from winds associated with the Inter-Tropical Convergence Zone (ITCZ); an extraordinary feat for an insect with wings a few inches wide (Anderson, 2009; Hedlund et al., 2021). Anderson (2009) proposed the route India-Maldives-Seychelles-Africa-India (Figure 1) based on his observations. Migratory routes range from simple round trips to complex circuits with merging and splitting branches (Satterfield et al., 2020) and the entirety of the transoceanic migration network of P. flavescens is a subject of multiple contemporary investigations (Borisov et al., 2020; Hedlund et al., 2021; Hobson et al., 2021). Our understanding of transoceanic migration of P. flavescens has been enhanced significantly by wind trajectory analysis (Chapman et al., 2012; Hedlund et al., 2021; Hu et al., 2021) that reveals how wind assists migration and stable isotope analysis (Hobson et al., 2012) that indicates probable origins of the migration circuit. Yet, almost a century later (Fraser, 1924) determining P. flavescens’s migration route still poses a challenge; there remain crucial but inexplicable observations (Hedlund et al., 2021). For instance, the arrival of P. flavescens at the Maldives (Anderson, 2009) and Seychelles (Bowler, 2003) which are sparsely situated islands on the migratory route during a specific period of the year. Similarly, Hobson et al. (2012) hypothesized that the migration originates in North and East India, while Anderson (2009) noted the arrival of P. flavescens in South-East India and Sri Lanka with retreating monsoons. In addition, a comprehensive understanding of how the life-cycle of the migrating dragonflies is linked to the migration timing as well as to breeding at stop-over locations is currently lacking. For instance, the literature indicates that there can be multiple possibilities once the migrants arrive in Maldives; they may breed (Olsvik and Hamalainen, 1992) or replenish energy reserves for the next transoceanic leg (Anderson, 2009). The destination of the next leg may either be Seychelles (Anderson, 2009) or perhaps mainland Africa (Hedlund, et al. 2021). Thus, comprehending the complexity and the inherent uncertainties affecting the multigenerational transoceanic migration presents a unique challenge.
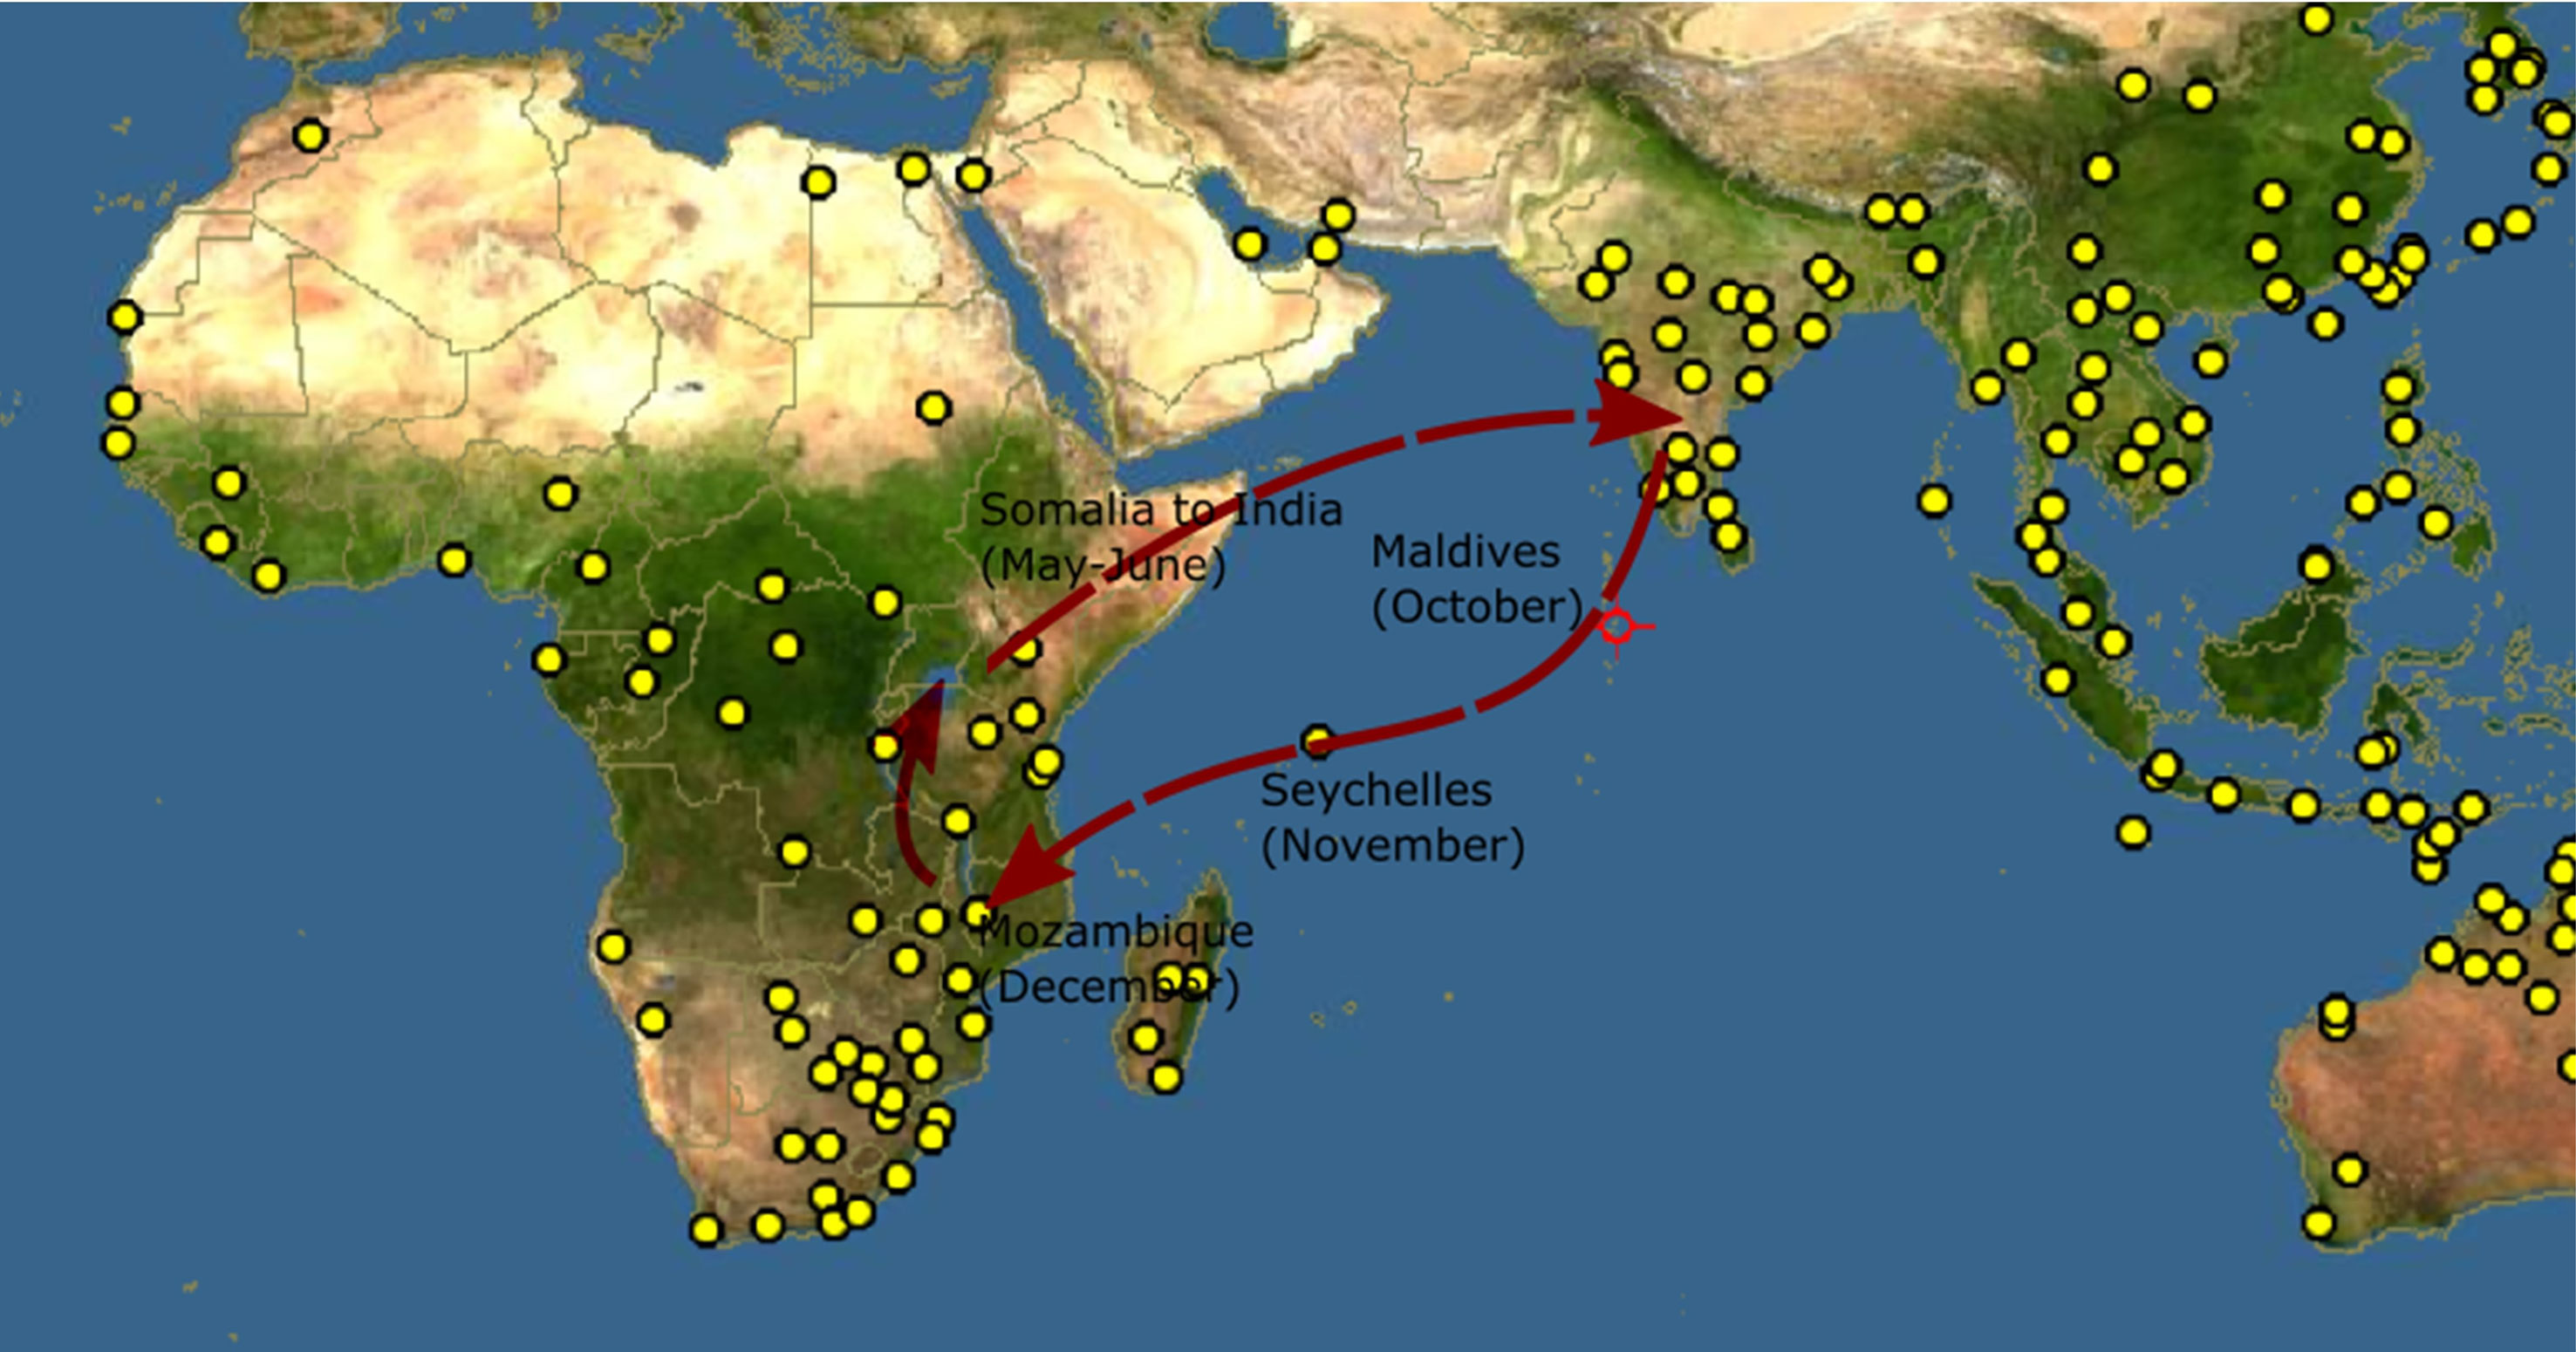
Figure 1 Proposed migration route of Pantala flavescens (Anderson, 2009). The yellow dots indicate locations where Pantala flavescens have been reported, Source: http://www.discoverlife.org.
Field investigations are challenging in the absence of sophisticated lightweight trackers that can be employed over a large geographical extent for studying the migratory patterns of P. flavescens (Drake and Gatehouse, 1995; Holland et al., 2006; Hedlund et al., 2021; Hobson et al., 2021). Existing migration studies (Stefanescu et al., 2007; Chapman et al., 2008; Chapman et al., 2010; Chapman et al., 2016; Westbrook et al., 2016; Wu et al., 2018; Menz et al., 2022) successfully explain important features like heading and displacement; yet understanding transoceanic migration involves additional challenges. Predicting the migration timing of P. flavescens that is consistent with the precipitation, wind patterns at the reported altitude, and the sightings over the entire migration circuit is daunting for multiple reasons. A self-consistent approach must account for the energetics (Hedlund et al., 2021) of the migrant for estimating the endurance while predicting the wind-assisted trajectory for destinations situated on islands. The trajectory analyses by Hobson et al. (2021); Hedlund et al. (2021) assume that P. flavescens fly downwind; remaining on course during ocean crossings would require wind compensation, alongside wind assistance, to reach stopovers. We propose a complementary approach using an optimal path-planning algorithm (Dijkstra, 1959) applied to micro-aerial vehicles (MAVs) that allows wind compensation. The constraints for MAVs and P. flavescens, indeed, are analogous. The migrants must choose an altitude with favorable tailwind while suitably compensating for wind direction (Srygley, 2003) and fly on an intended path like MAVs. Further, the stopovers can only be on an island similar to waypoints in MAV missions. In addition, the stopovers must be located such that the migrant can reach the destination with limited energy reserves like MAVs. The combination of all these constraints makes the timing of migration the key to deciding the success of the migration. The optimal route does not constitute the migration trajectory per se; rather, migration occurs along a near-optimal path, determining which using trackers is nigh impossible.
In the present study, we identify the optimal trajectory and verify the consistency of the timing for the entire migration with the reported observations. In order to determine the trajectory, we present an adapted energetics model (Pennycuick, 2008) for P. flavescens and find that the utmost duration of flight at the optimal velocity, 4.5m/s, for maximizing range is 90 hours; an estimate consistent with Hedlund et al. (2021); Hobson et al. (2021). In our approach, the total energy expenditure is defined by the velocity at which the migrant is flying. We implicitly assume that the average power consumed in the entire flap-glide cycle, (comprising of a powered and a gliding phase) is identical to that of continuous flapping at the given velocity (Pennycuick, 2008). Thereafter, we apply Dijkstra’s algorithm (Dijkstra, 1959) to obtain the optimal path for minimizing time of flight under the influence of wind for the transoceanic legs of the migration. An optimal trajectory requiring a flight time less than 90 hours is considered successful. The migration time window is identified from the number of monthly-successful trajectories over a period of six years (2002–2007) (Anderson, 2009), life cycle and the local precipitation data and compared to sightings of P. flavescens for each stopover.
2 Materials and methods
2.1 Dragonfly energetics model
We designate the energetics model applied to P. flavescens as the Dragonfly Energetics Model (DEM). Dragonfly species P. flavescens cover large distances in a single flight during the trans-oceanic migration. The energetics involved in their migration though important has not yet been understood. However, there have been significant advances in bird migration theories, which have led to accurate calculations of energetics. In the present study, we develop a computational model for P. flavescens’s migration energetics by adapting the model proposed by Pennycuick (2008). The model is motivated by the long range transport aircrafts that involve energetics that are similar to the migration process, and is generic to any flying species, and has been applied to insects (Warfvinge et al., 2017) and birds (Pennycuick, 2008).
2.1.1 Energetics model for migration range, time of flight and maximum range velocity
The migration range and the time of flight are obtained by numerically integrating the instantaneous migration speed. Figure 2 shows an overview of the migration energetics model. The migration can last up to the point where the fat is completely burnt and defines the upper limit for the time of flight. The migration speed varies over time; for the major part of the course of migration, the migrant flies at a speed close to the maximum range speed (Vmr) that corresponds to the speed at which the lift to drag ratio is maximum. Before achieving Vmr the migrant flies instantaneously at a speed that fulfills the “constant specific work” (work done per unit mass) criterion. The criterion agrees with the observation that flight muscle fraction in migrants is nearly constant (Pennycuick, 2008). The constant specific work is obtained from the chemical power (Pchem), muscle mass (mmusc) and the wing beat frequency (f). The chemical power (Pchem) is obtained from the mechanical power (Pmech) required to fly and the metabolic power (Pmet). Hence the energetics model involves two steps: Calculation of the power curve (the relationship between mechanical power and speed) and then migration range calculation using the power curve. We describe the associated parameters to compute the energetics model.
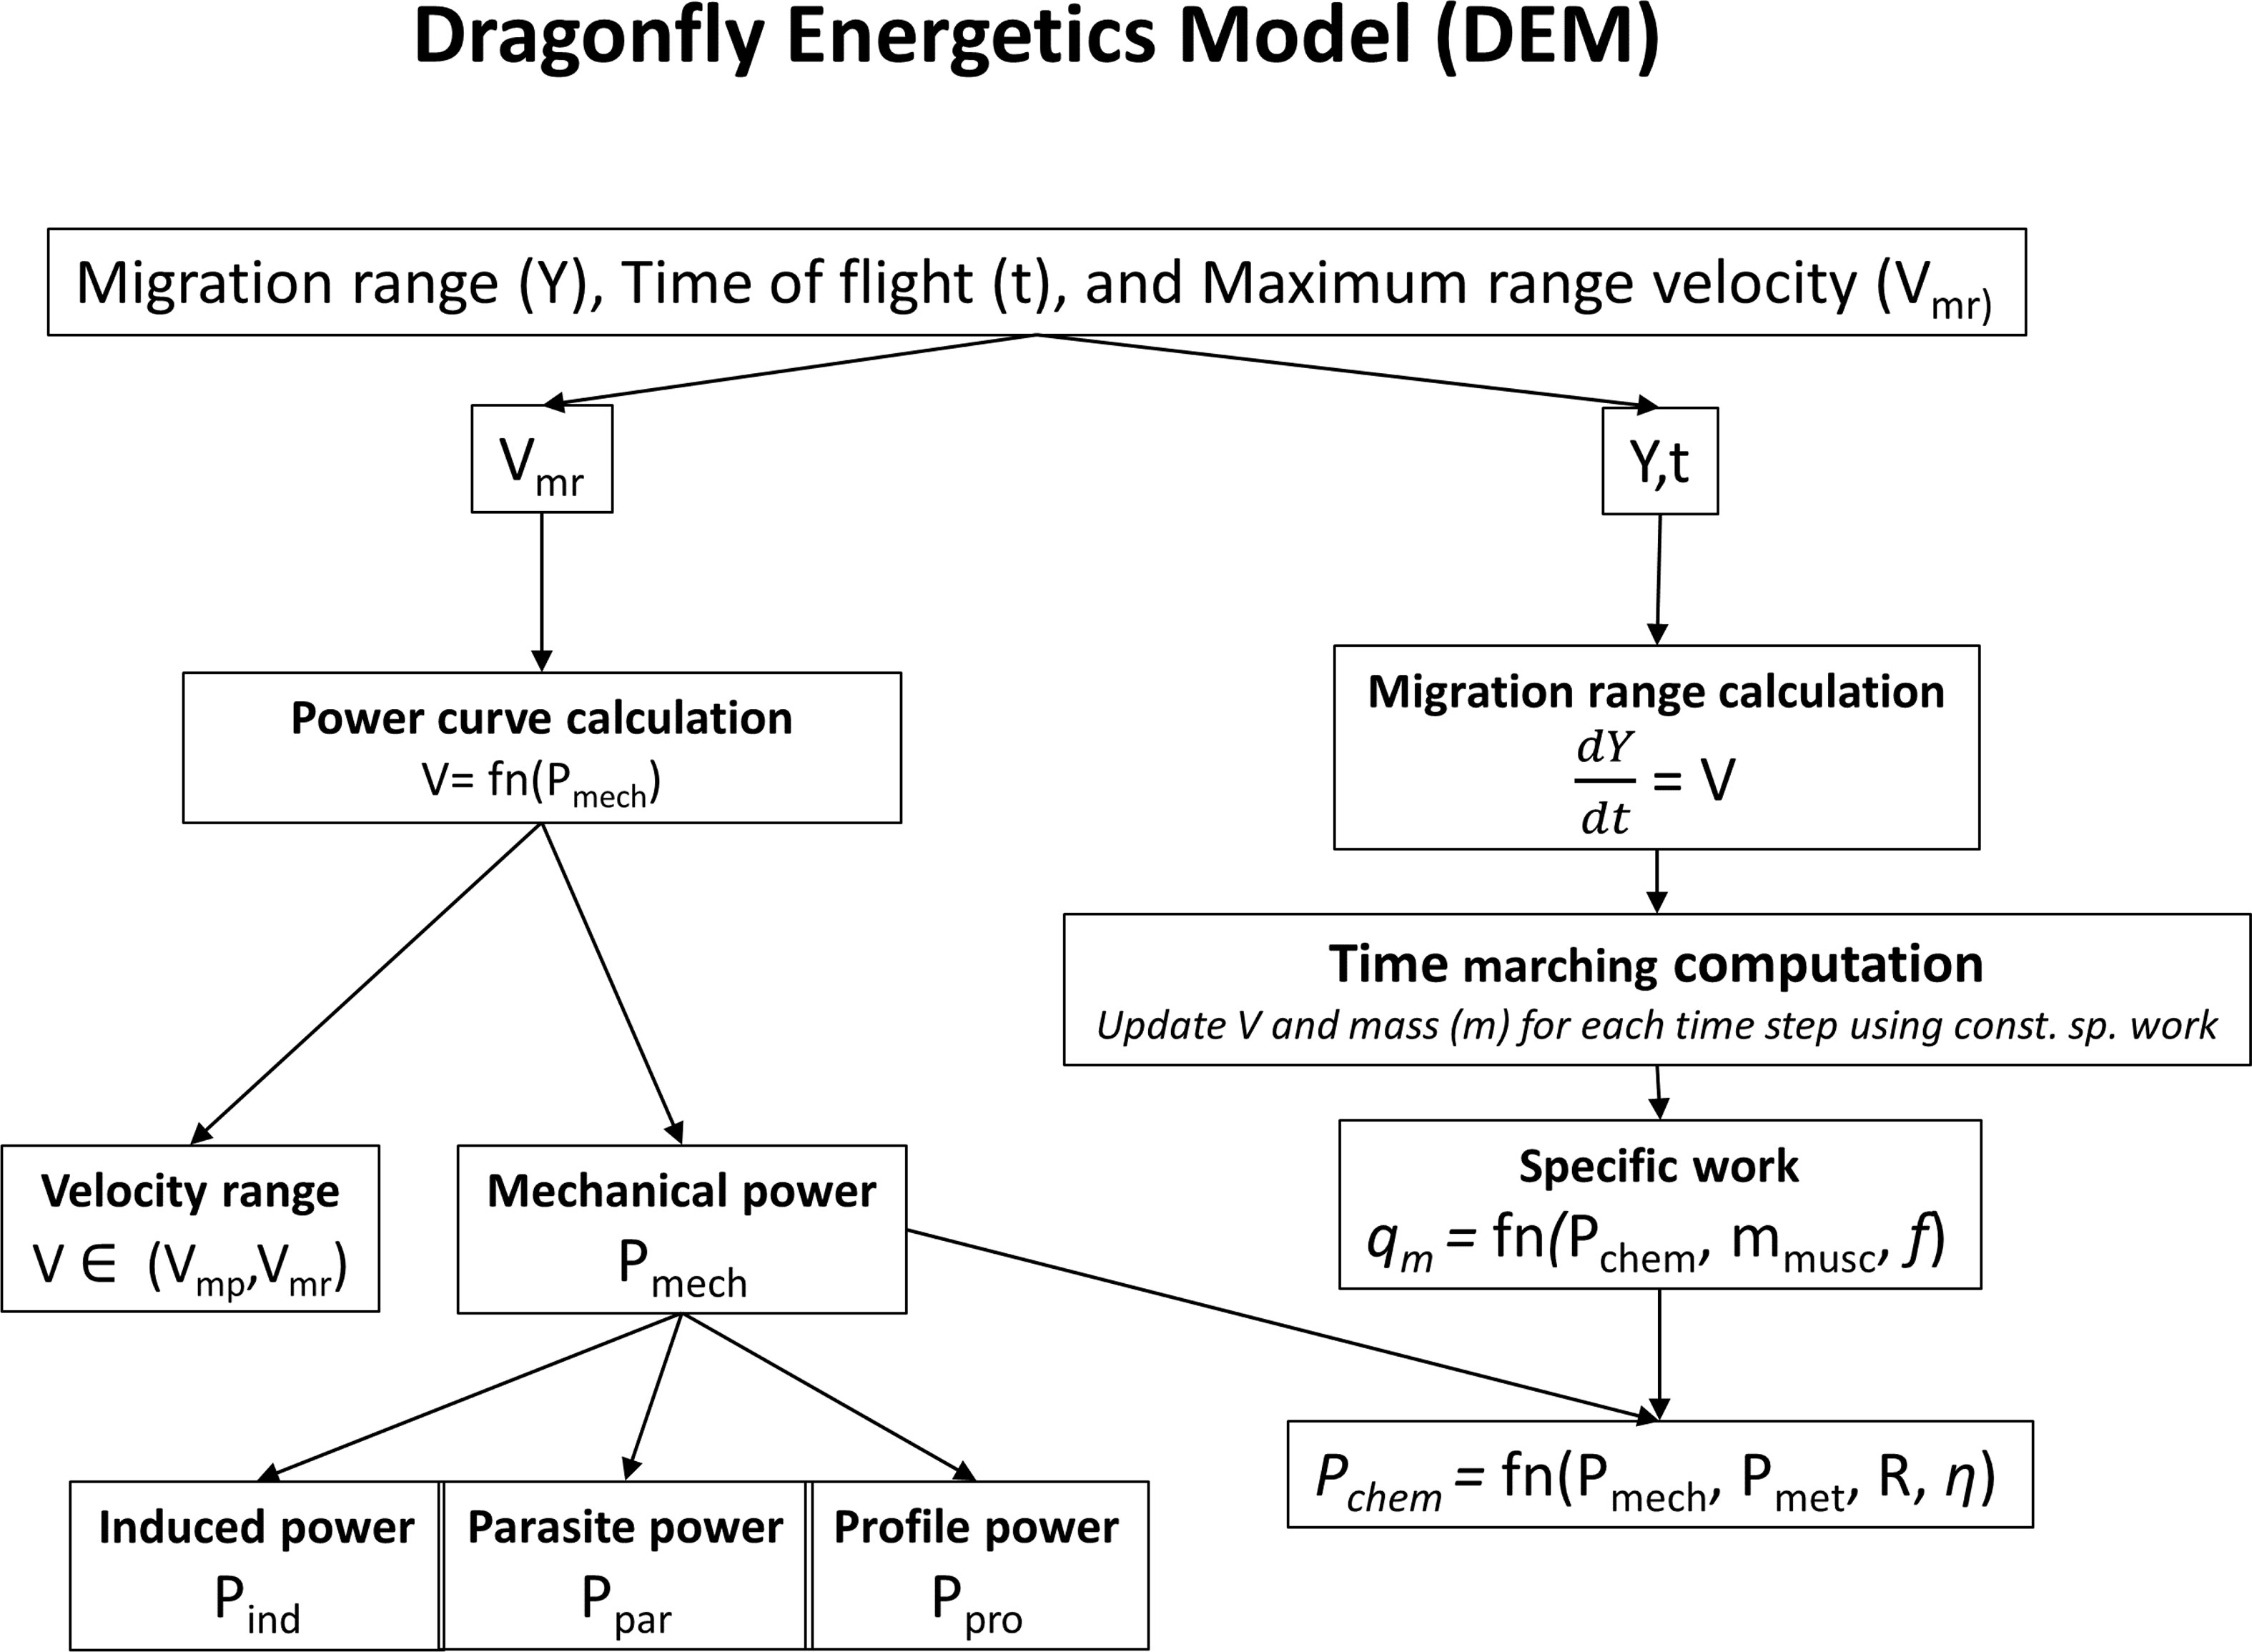
Figure 2 Overview of migration energetics model.
2.1.2 Power curve calculation
The required inputs for power curve calculation are three morphological parameters (mass (m), wing span (B), and wing area (S)), gravity (g), and air density (ρ) at the desired height. The power curve is used to determine the total mechanical power (Pmech) required to maintain a horizontal flight, the minimum power speed (Vmp), and maximum range speed (Vmr). The minimum power speed (Vmp) is the speed at which the power required to fly is minimum. The maximum range speed (Vmr) can alternatively be viewed as the speed at which a flier can cover the maximum distance per unit of fuel consumed. The total mechanical power required to fly at any particular speed consists primarily of three components of power; the induced power (Pind), the parasite power (Ppar), and the profile power (Ppro).
2.1.2.1 Induced power
The induced power is the rate at which the flight muscles of the insect have to provide work to impart downward momentum to the air at a rate that is sufficient to support the weight of the insect. The induced power is estimated using the actuator disc theory assuming a continuous beating of the wings as an actuator disc, and the pressure difference between the upper and the lower surface providing the aerodynamic force. The force multiplied by the induced power factor (k), which accounts for the loss in efficiency due to the real flapping of the wings, gives the real induced power (Eq. 1).
where Vt is true air speed.
2.1.2.2 Parasite power
The parasite power is the rate of work required to overcome the drag acting on the insect’s body, excluding the wings. The parasite power can be found from the drag acting on the body (Eq. 2),
where, Sb is the body frontal area, which is the maximum cross-sectional area of the insect, and CDb is the body drag coefficient.
2.1.2.3 Profile power
A flying insect needs profile power to overcome the drag acting on the wings and it is essentially a consequence of the induced and parasite powers. The profile power is estimated from the minimum of the sum of induced power (Eq. 1) and parasite power (Eq. 2) that is termed as the absolute minimum power (Pam) (Eq. 3); the power required to fly at the minimum power speed Vmp (Eq. 4).
The profile power is then set at a fraction (X1) of the absolute minimum power Pam. Here and profile power, Ppro ≡ X1Pam. The total mechanical power, Pmech, is then given by the summation of individual powers,
To maximize the range of migration the maximum range speed, Vmr needs to be determined from the power curve. The speed Vmr is obtained by drawing a tangent from the origin to the power curve (Pennycuick, 2008). The power curve (Pmech versus velocity) is calculated over a range extending from the minimum power speed Vmp (Eq. 4) to the maximum range speed Vmr.
2.1.3 Migration range calculation
The migration range is obtained by solving the range equation dY/dt = V where Y is the distance covered from the source and V is the instantaneous migration speed. The instantaneous speed, V, varies over time because the mass of the insect changes as a function of time due to burning of fat and protein; consequently the aerodynamic and morphological parameters evolve over time. The model incorporates these changes; the rate at which fuel burns depends on the chemical power (Pchem), the lift to drag ratio (N) and the wingbeat frequency (f). We initialize the migration range calculation with values obtained from the insect’s measured morphological (for instance see Supplementary Material Table S5) and external parameters (ρ,g).
2.1.3.1 Chemical power
Chemical power is expended by an insect by burning fuel to generate the required mechanical power and support its metabolism. To determine chemical power Pchem (Eq. 6); the mechanical power (Pmech), basal metabolic rate (Pbmr), conversion efficiency (η), and respiration ratio (R) are incorporated. During flight, apart from efforts to maintain flight, insects need to maintain their metabolism at a rate higher than that required at rest (basal metabolic rate). The respiration ratio (R) accounts for the increase in metabolism due to continuous flight. Only a fraction of the chemical power expended is converted into mechanical power, which is accounted for by the conversion efficiency (η). Combining all these factors final expression for chemical power is given by:
where the metabolic power Pmet is defined as Pmet = ηPbmr. Here Pbmr ≡ 3.79(m–mfat)0.723. Here mfat is the fat mass and mfat = 0.35m at t = 0.
2.1.3.2 Lift to drag ratio
Lift to drag ratio is a measure of distance covered by the insect per unit fuel energy consumed and can be related to the chemical power (Eq. 7).
2.1.3.3 Wingbeat frequency
The wingbeat frequency (wingbeats per second) is a measure of power available from flight muscles, that is generated by the contraction and expansion of the muscle during flapping. Based on dimensional analysis the wingbeat frequency is correlated to the body mass (m), wing span (B), wing area (S), air density (ρ) and gravity (g). To some degree, the wingbeat frequency is under the control of the insect, but usually it does not vary much from the natural wingbeat frequency, which is determined by physics of beating wings (Eq. 8)
2.1.3.4 Time marching computation
A MATLAB code was developed for the numerical solution of the energetics model. The time marching computation is performed to compute the morphological parameters and flight parameters at time intervals of 6 minutes. In order to obtain the instantaneous mass of the insect m, we require the rate of mass burnt, dm/dt. It is obtained using the mass burning relation, dm/dt = Pchem/e where e is the energy density of the fuel. We assume that the insect obtains the 95% of the chemical power by burning fat and the rest from muscle mass consisting of protein. Therefore, mfat is updated after each time step till mfat≥0. A constant specific work criterion (eq. 9) was used to compute muscle-burning rate.
where, mmusc is flight muscle mass and ζ is Volume fraction of mitochondria in flight muscles.
Substituting the expressions for Pmech (Eq. 5), wingbeat frequency (Eq. 8) and mmusc = 0.15m a fourth degree polynomial for specific work (qm) is obtained in terms of instantaneous migration velocity. The specific work is computed at t = 0 and set as a constant for the rest of the time marching procedure to solve for the migration velocity until V≤Vmr; thereafter the migration occurs at Vmr.
The flowchart in Figure 3 shows the algorithm used for migration range calculations. The model is validated with the results of Pennycuick (2008) for the bird Great Knot (see Supplementary Material Section 1).
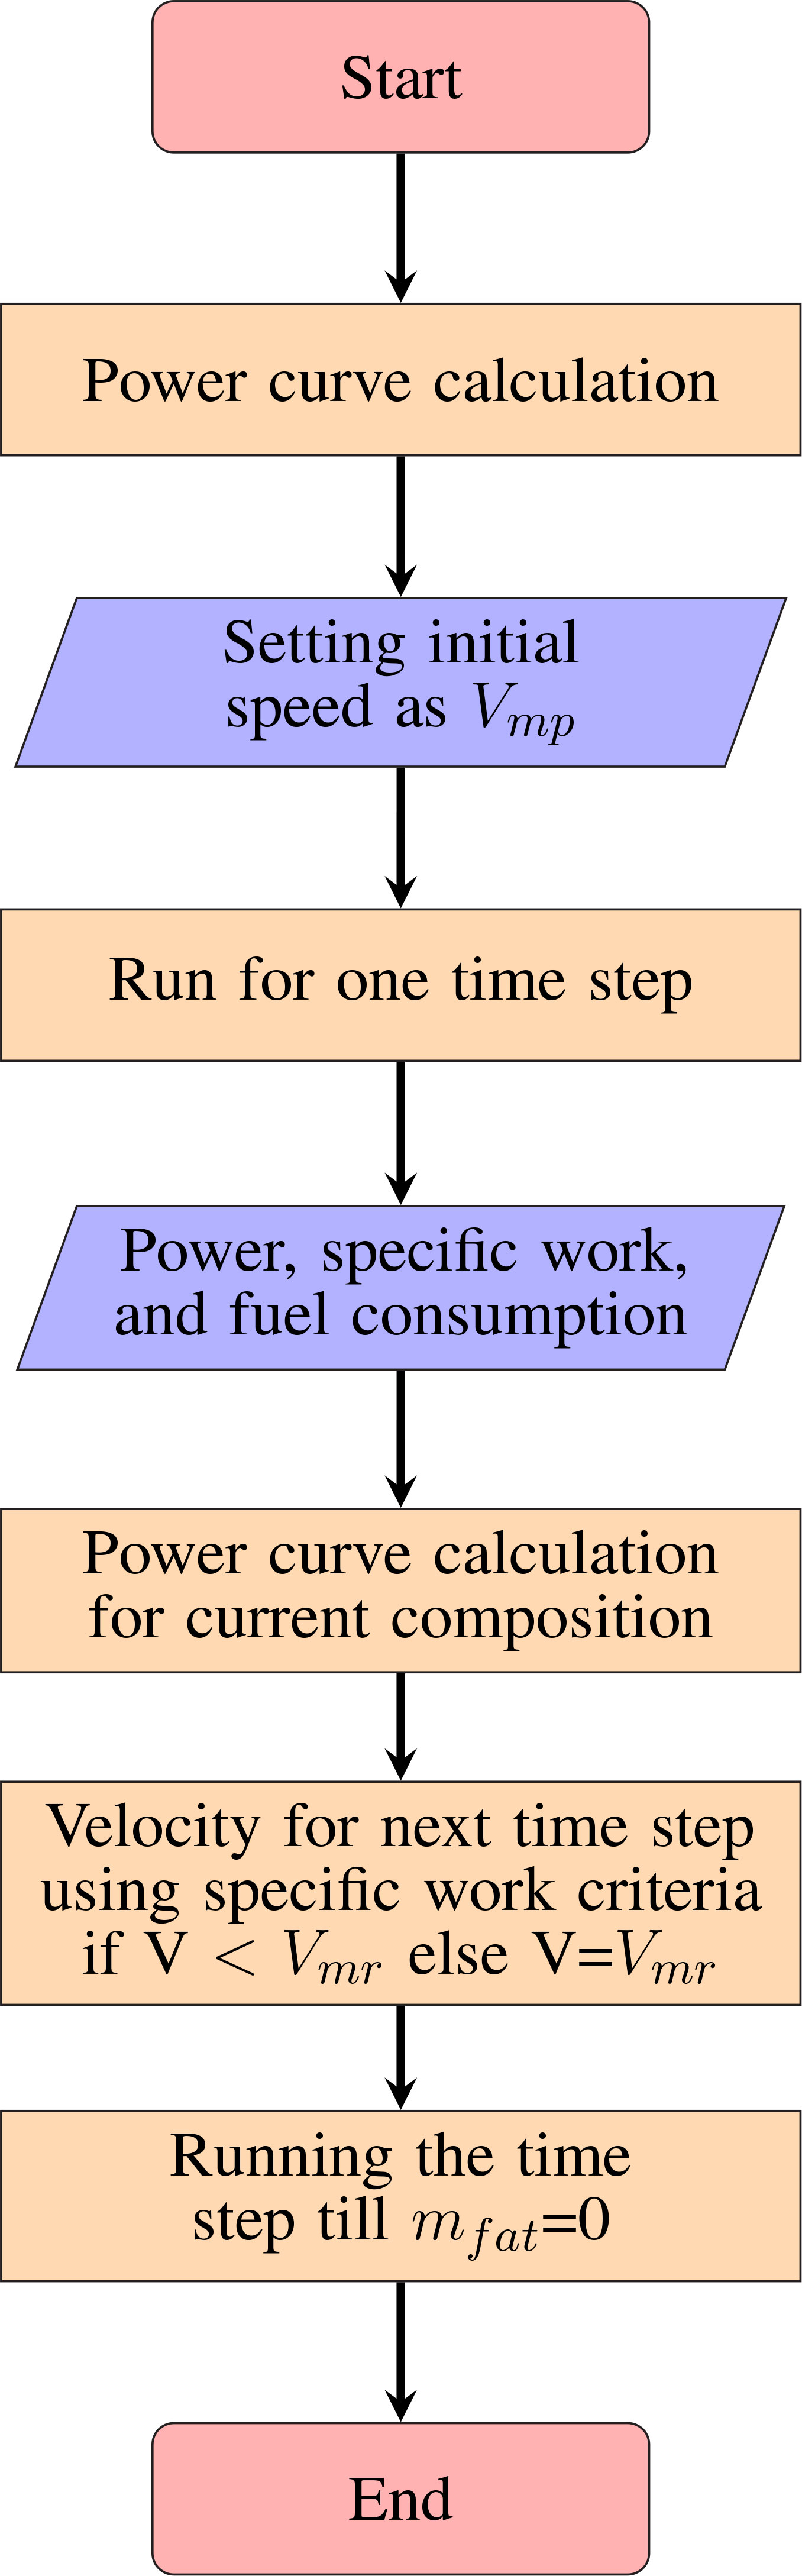
Figure 3 Flowchart of time marching computation for migration range calculation.
2.1.4 Energetics of Pantala flavescens
We captured dragonflies at the IIT Kharagpur campus to determine the input parameters for the DEM. We measured morphological parameters (mass, wing span, wing area, and frontal area), using weighing balance and vernier (see further details in SI Table S4; Figure S2). Other relevant data like, aspect ratio (AR = B2/S), fat mass (mfat=0.35m), and muscle mass (mmusc = 0.15m) were extracted using these parameters. Migratory dragonflies like Anax junius (Wikelski et al., 2006; May and Matthews, 2008) and monarch butterfly (Brower et al., 2006) have an estimated fat content in the range 27–33%. Furthermore, long-distance migrants like monarch butterflies and birds (Dingle, 2014) as well as swarming migratory locusts store greater fat content (Du et al., 2022). Hence we have assumed that fat content is 35% for Pantala flavescens. Profile power constant and induced power factor for the calculations are identical to that of birds, as they were found to be satisfactorily applicable by May (1991) and Azuma and Watanabe (1988) in their calculations of the power curve for dragonflies and similar U-shaped power curve has been estimated for large insects like moths as well (Warfvinge et al., 2017). The body drag co-efficient Cdb was obtained from May (1991) for dragonflies with similar mass. The DEM parameters and results are detailed in the Supplementary Material Section 2.
2.2 Dragonfly Path planning model (DPM)
Dijkstra’s algorithm (Dijkstra, 1959) was used to evaluate the role of wind in the migration of P. flavescens. The algorithm searches for the shortest path between the starting and the end point, given that at least one such path exists. We marked the stopovers as the starting and the end points. An open-source MATLAB code of Dijkstra’s algorithm (Aryo, 2021) was developed further by modifying the cost matrix for computing the optimal path and the associated time. The combination of the cost matrix along with Dijkstra’s algorithm is designated as the dragonfly path planning model (DPM) here after. Figure 4 shows the flowchart for the DPM.
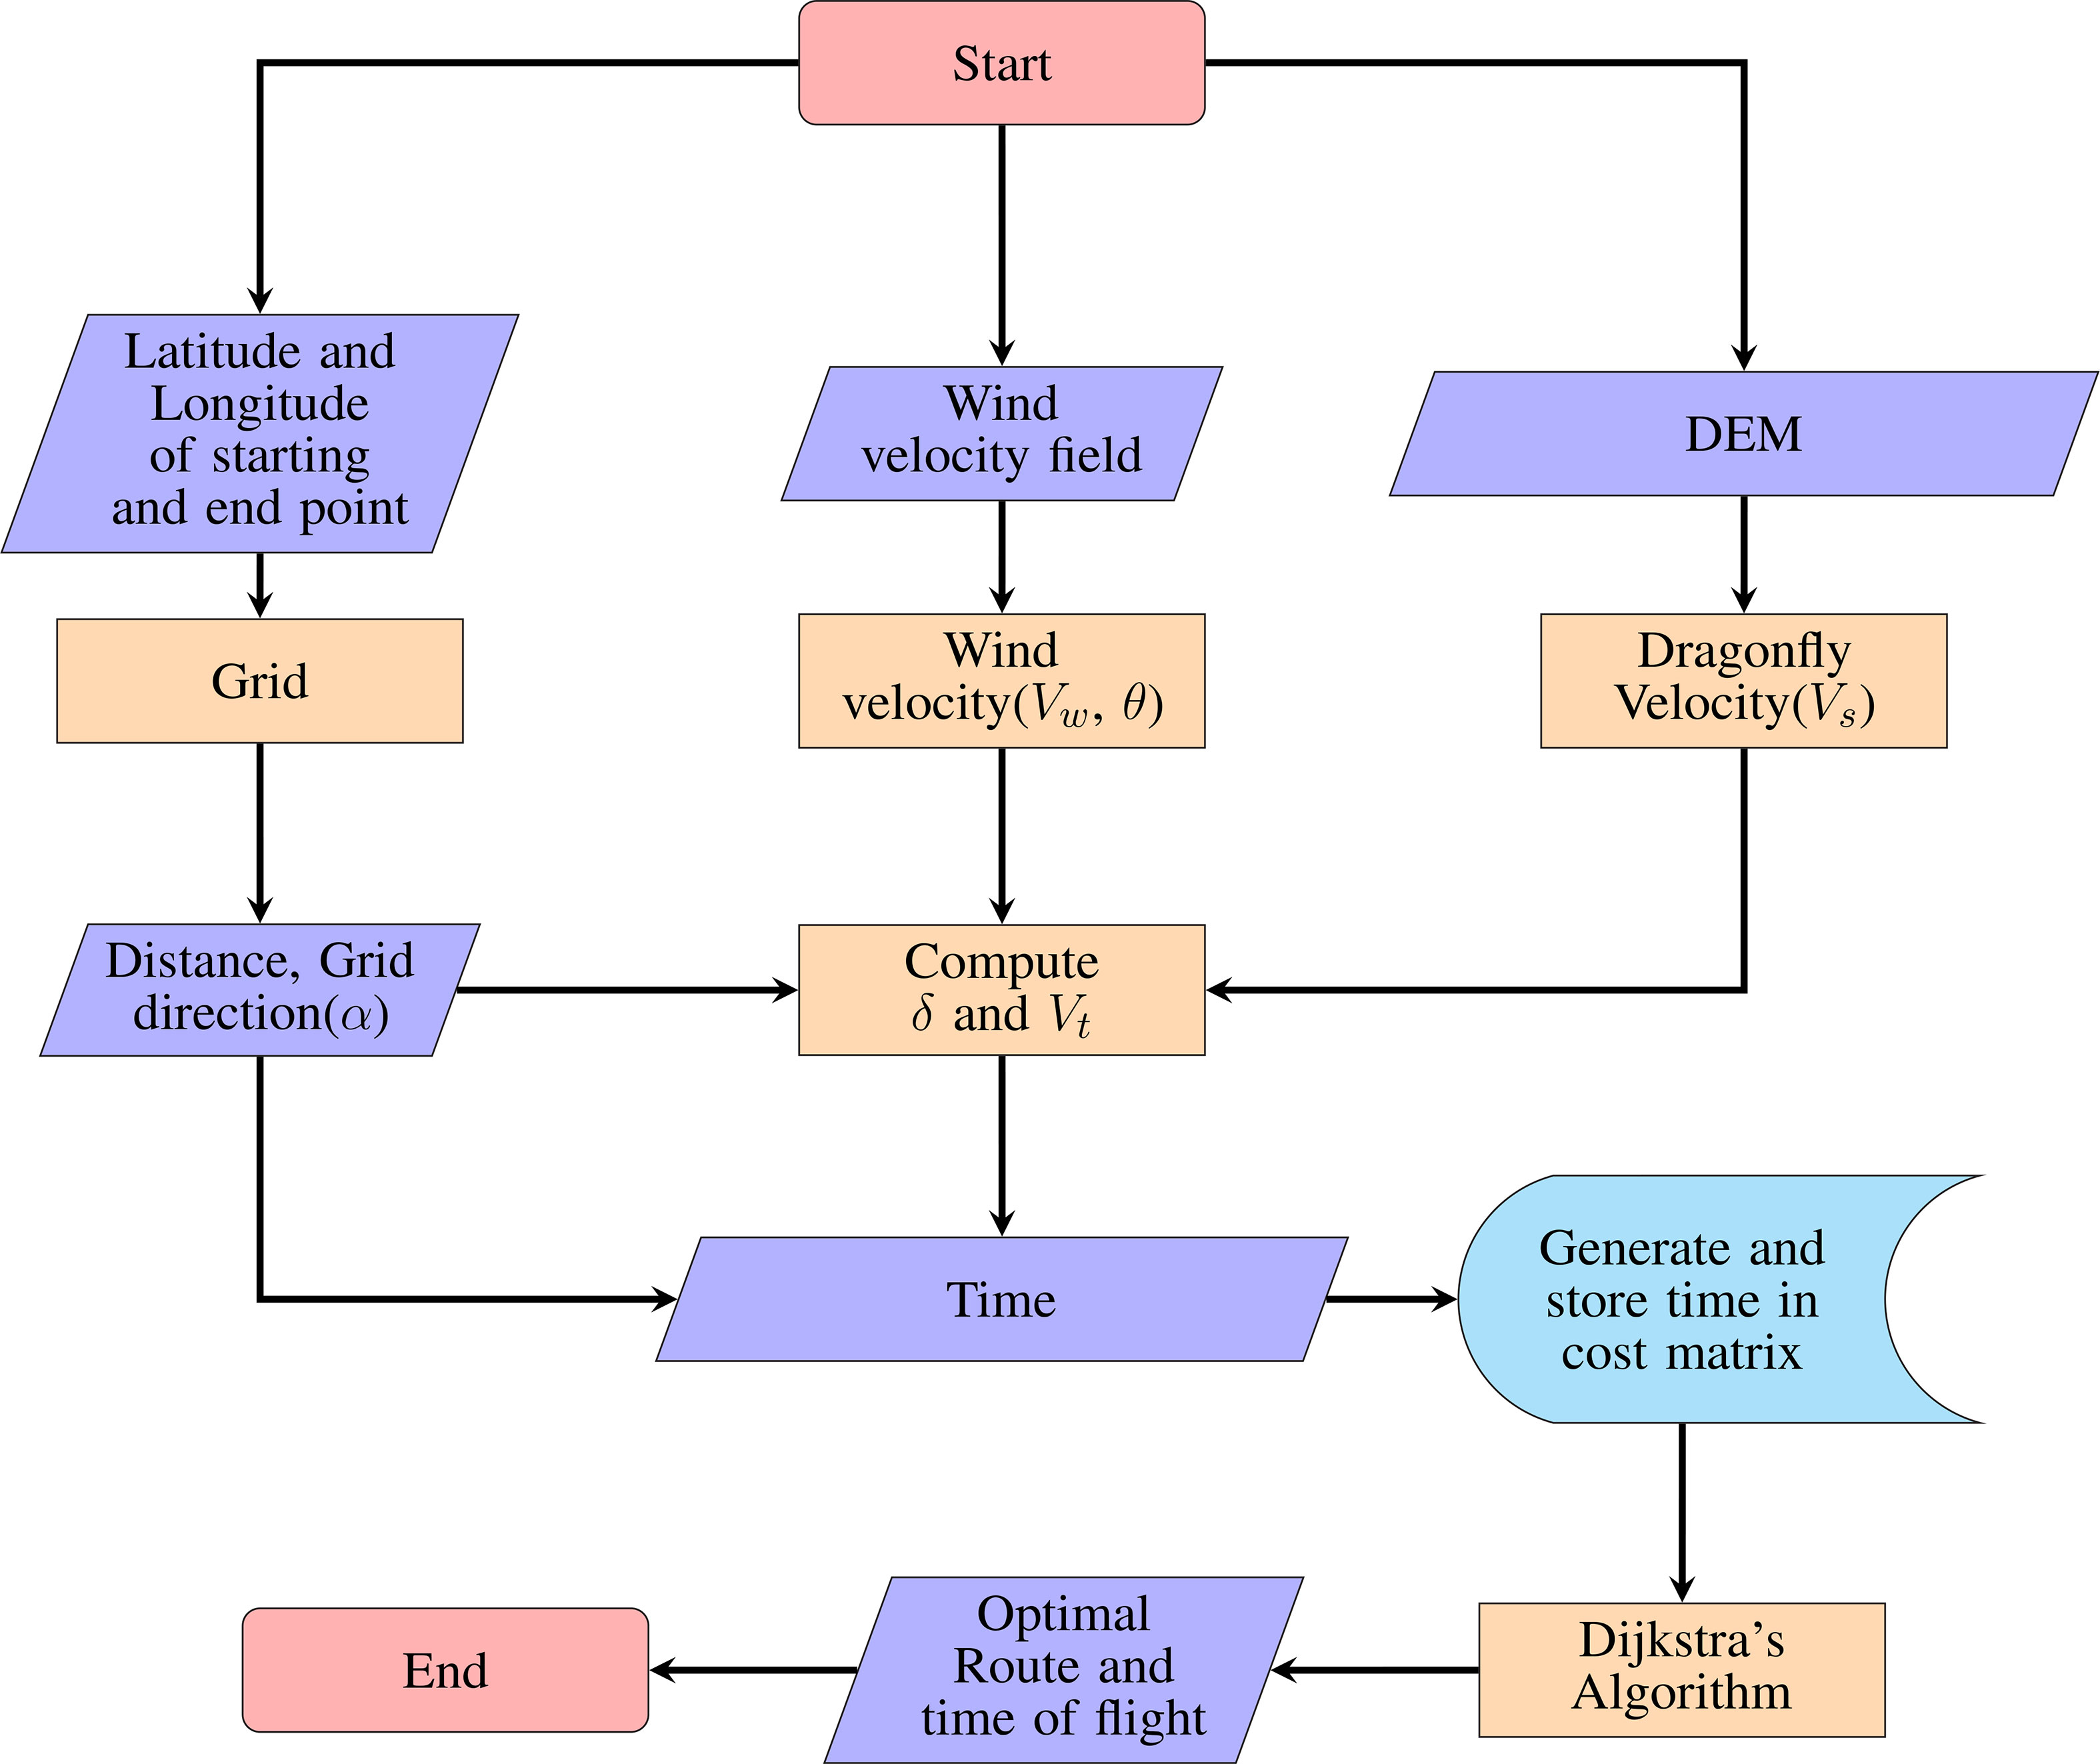
Figure 4 Flowchart for dragonfly path planning algorithm.
Either of the two optimization criteria, the time of flight and the distance covered, can be used for generating the cost matrix. However, the primary constraint during migration is the fuel reserve which places an upper limit on the time of flight, but the distance covered depends on the time of flight, the migration velocity of the insect and the local wind velocity. Therefore, the time of flight is a more fundamental constraint associated with the fuel reserve and hence chosen as the cost function function (Warfvinge et al., 2017).
Three key inputs are required for the generation of the cost matrix: the dragonfly migration velocity, which in this case is Vmr and is obtained from DEM; the local wind velocity obtained from NOAA (NOAA, 2019); the global position in terms of latitude and longitude. We select the latitude and the longitude of the starting and end points while initializing the DPM. Thereafter the rectangular area between the starting and end point, with the diagonal as the geodesic distance between the two points, is discretized with 30 grid-points in each direction. The wind data from NOAA is available at various spatial and temporal resolutions. Spatial resolution of the data is 2.5°×2.5° on the global grid (144×73) for longitudes 0.0°E to 357.5°E, and latitudes 90.0°N to 90.0°S. The data is available at 17 Pressure levels between 1000 and 10 hpa. The temporal resolutions of the available data are 4-times daily, daily mean and monthly mean values. Pantala flavescens has been reported to migrate at heights above 1000m (Anderson, 2009), and the closest corresponding pressure level in the available dataset is 850hpa. We used “daily mean” of “U-wind” and “V-wind” with “multiple pressure level” data file corresponding to 850hpa for a particular day (NOAA, 2019) for the DPM simulations. The velocity data from NOAA was used to create an interpolant in MATLAB using “griddata” to obtain the velocity field on the grid points. A separate discretization grid is used for each transoceanic leg of the migration.
Each node of the grid is assigned wind velocity, latitude and longitude, dragonfly migration velocity, and possible flight directions (track). We consider eight possible directions for each internal node (see Figure 5A); the boundary nodes have fewer directions. Based on the latitude and longitude distance between any two nodes is calculated. Also, based on dragonfly migration speed (Vs), local wind velocity, and the track, a resultant velocity between two neighboring nodes is computed. The resultant velocity and the distance determine the time taken to travel between the two nodes that serves as the cost function between any two nodes. We compute the cost matrix using all possible combinations of nodes; that is the time taken to travel for each possible route constitutes the associated entry of the cost matrix. Using the cost matrix in Dijkstra’s algorithm (Dijkstra, 1959), we calculate the optimal time and the optimal route for each leg of the transoceanic migration. We also calculate the total distance and the fuel consumed from the optimal route.
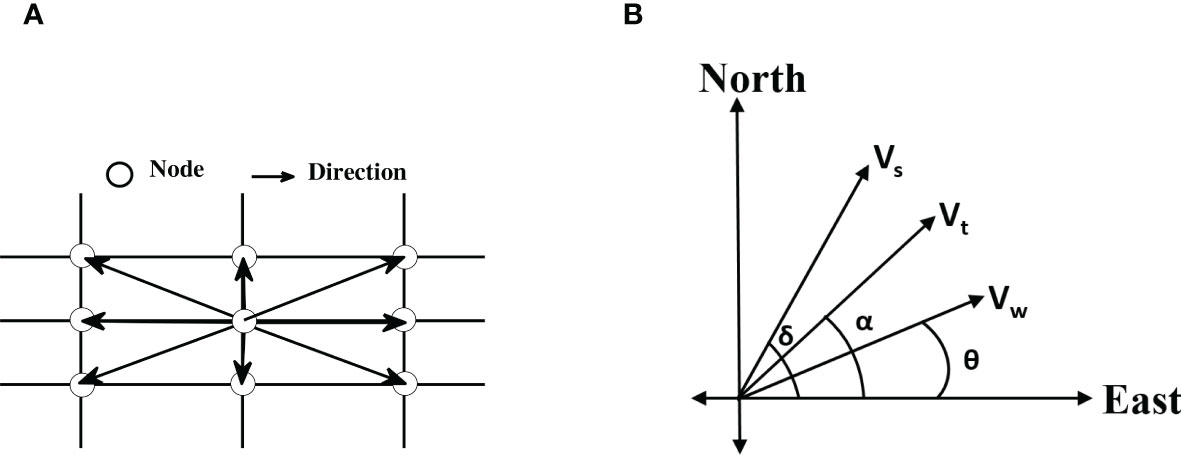
Figure 5 (A) A section of the grid showing all possible directions of movement from a node. (B) Schematic representation of dragonfly speed (Vs), wind speed (Vw), resultant speed (Vt), dragonfly heading (θ), wind direction (δ), and dragonfly track (α). At any node Vs, Vw, θ, and α are known, and Vt and δ are calculated using the schematic.
Here Vw is the magnitude of wind velocity calculated from two planar components, u-wind (u component of wind velocity, positive in due east) and v-wind (v component of wind velocity, positive in due north). The magnitude of dragonfly velocity is Vs (we assume Vs=Vmr), and Vt is the magnitude of resultant velocity, θ is wind direction, α is dragonfly track, that is the direction relative to the ground and is fixed by the grid (see Figure 5A). Here δ is dragonfly heading; the direction relative to the wind field that is required to maintain the track. All angles are measured with respect to due east (see Figure 5B).
2.3 Passive tracer trajectory
We simulate the trajectory of a migrating dragonfly species, Pantala flavescens, under the influence of the atmospheric wind field as if it acts as a passive tracer particle and gets purely convected by the wind field. We have developed a MATLAB script for solving the equations of motion (Eq. 10) using the modified Euler method (further details of the numerical method are provided in Pozrikidis (2016); Giri et al. (2022)). The velocity and grid used for passive tracer simulation is the same as for the DPM simulation. The difference in the two simulations is that, the end location is fixed in the DPM simulation, and we calculate the path and the time required to reach that location. Whereas the time of flight is fixed (90 hours) for the passive tracer simulations, and we obtain the end location by time marching at an interval of Δt = 60s. The time resolution Δt is small enough to ensure that the results are converged. The particle at any instant assumes the local wind velocity (ux, uy) and the velocity of the particle is updated at each time step (Δt = 60s) after advancing the particle location X(t), Y(t) in time.
3 Results and discussion
3.1 Transoceanic migration route reveals that Pantala flavescens actively compensate for wind
Figure 6 shows the optimal path for the transoceanic legs of the P. flavescens’s migration circuit and corroborates existing observations (Fraser, 1924; Corbet, 1962; Mitra, 1974; Anderson, 2009; Hobson et al., 2012; Hedlund et al., 2021). The flight from Somalia (Location 5) to India (Location 1) is the longest leg (2802kms) but requires merely 45h and no stopovers because of strong tailwinds (∼ 15m/s). The migration from India (Location 1) to Mozambique (Location 4) is more precarious and involves stopovers at Locations 2 (the Maldives) and 3 (Seychelles). The trajectory from India to the Maldives is tortuous and requires 48h for 1137kms only. The stark difference between the time required and the distance covered in the two optimal paths highlights the pivotal role of wind. Further, comparing the optimal path with the trajectory of a passive tracer reveals that active wind compensation is imperative for P. flavescens to cross the Indian ocean; a passive tracer convecting downwind strays from the optimal paths (see Figures 6C–E). Previous studies have provided evidence of similar active wind compensation during long distance migration by hawkmoths, butterflies, dragonflies and birds (Gibo, 1986; Srygley et al., 1996; Srygley and Oliveira, 2001; Srygley and Dudley, 2008; Tarroux et al., 2016; Wynn et al., 2020; Menz et al., 2022). The flight from the Maldives to Seychelles (2565kms) and the subsequent flight from Seychelles to Mozambique (2056kms) are even more critical in the success of the migration because the time required is 90h and 81h respectively, nearly extinguishing their energy reserves. Therefore, we deduce that P. flavescens actively perform wind compensation (Srygley, 2003; Chapman et al., 2010) while flying at a minimum pace (4.5m/s) to maximize their range (Hedlund et al., 2021).
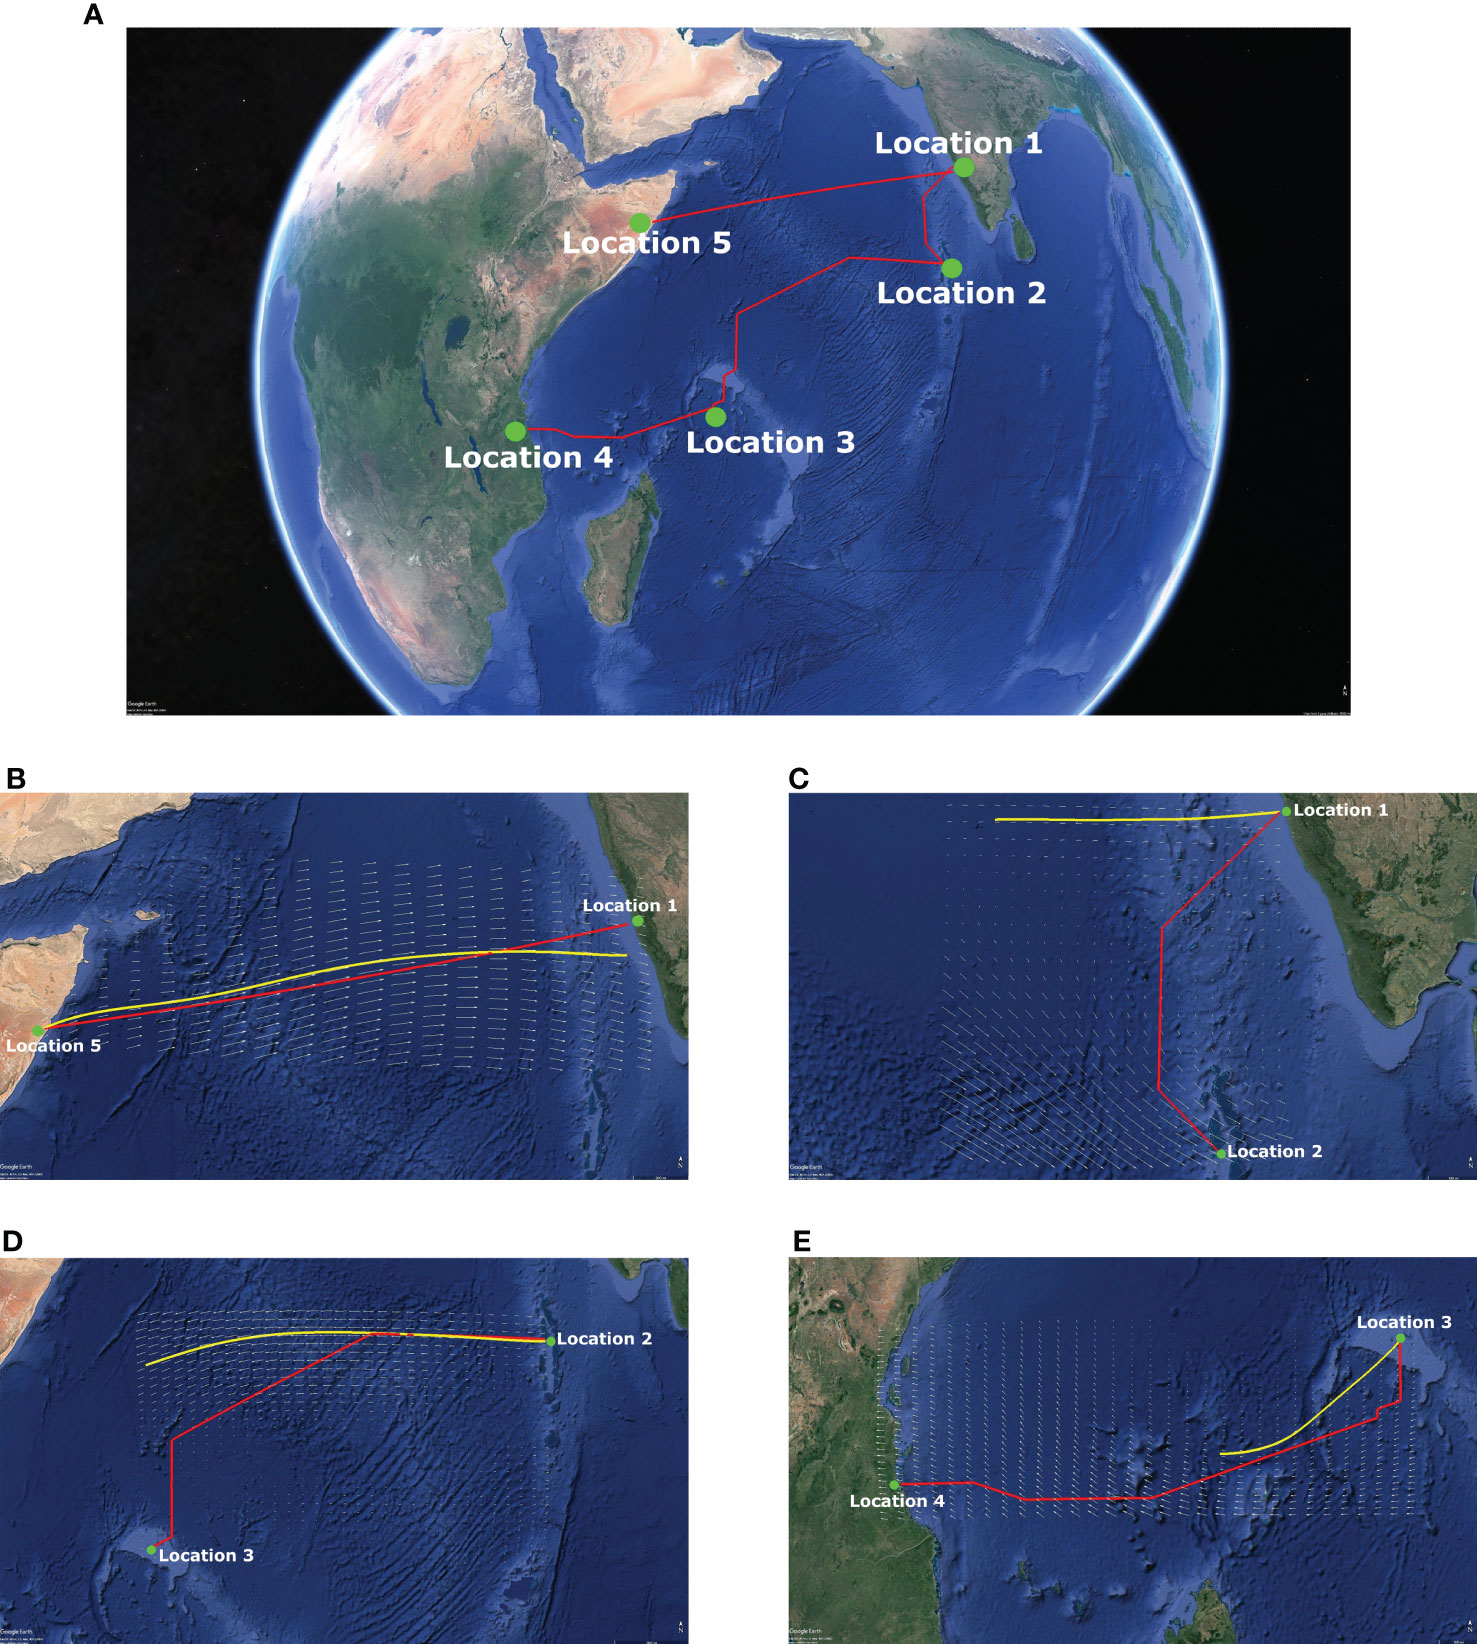
Figure 6 Transoceanic migration route with active wind compensation contrasted with passive tracer paths. (A) Transoceanic migration path with active wind compensation (---) and the trajectory of a passive tracer (---) transported by the local wind (shown as vector field) at 850 hPa for the transoceanic legs of P. flavescens's annual migration circuit. (B) Location 5 [7.5N 49.5E](Somalia) to Location 1 [13.5N 74.5E](India) on 15/06/2016: 2802 kms in 45 h; (C) Location 1 to Location 2 [5N 73E](Maldives) on 15/10/2016: 1137 kms in 48 h; (D) Location 2 to Location 3 [4.5S 55.5E](Seychelles) on 17/11/2016: 2565 kms in 90 h; (E) Location 3 to Location 4 [10S 39.5E](Mozambique) on 18/12/2016: 2056 kms in 81 h.
3.2 Precipitation data, life cycle estimates combined with monthly successful trajectories predict the migration timing window
P. flavescens are obligate migrants, whose migration timing shadows the movement of the Inter-Tropical Convergence Zone, pursuing evanescent pools for breeding (Anderson, 2009). Indeed, their sightings at the stopovers reported in the literature (see Table 1) and the months of high precipitation (see Figure 7) approximately coincide. Therefore, migration occurs only when both wind assistance and rainfall are available simultaneously, creating the migration time window. We present the total monthly successful trajectories for years 2002–2007 in Figure 7 to identify the migration time window. Figure 7A reveals that precipitation in India (Location 1) peaks between May and September and also the successful trajectories from Somalia to India, thus constituting the time window favorable for migration. The arrival of P. flavescens in June–July, aided by the Somali Jet, is well documented (Corbet, 2004; Anderson, 2009; May, 2013). Thereafter, the migrants breed and the offsprings typically emerge after 45–60 days (Kumar, 1984; Corbet, 2004; Suhling et al., 2004). Furthermore, Figure 7B reveals that the wind assistance from India to the Maldives is available except from June to August. The ITCZ passes over southern India and the Maldives in October, bringing rainfall, and the onset of migration from India to the Maldives lasting till December. Upon arrival in the Maldives the migrants either breed (Olsvik and Hamalainen, 1992) in evanescent pools created by rainfall (Corbet, 2004) or migrate towards Seychelles (Campion, 1913; Bowler, 2003; Anderson, 2009) to breed (Wain et al., 1999). Breeding in the Maldives might be preferable as crossing the Indian Ocean to reach Seychelles between October and December, although not impossible, remains unfavorable (see Figure 7C). Thereafter the precipitation in and migration to Seychelles is more favorable from January to March, corroborating sightings (Samways, 1998; Samways et al., 2010; Seychelles Bird Records Committee, 2014; Alphonse-Island, 2016). The onward journey to the African mainland is also favored by the wind and precipitation in the period December to March, as seen in Figure 7D). Indeed, sightings from Mozambique and Malawi, South Africa, and Lake Tanganyika support our findings (see Table 1). Pantala flavescens may breed twice on the African mainland before migrating to India, thus spawning 4–5 generations every year (Corbet, 2004).
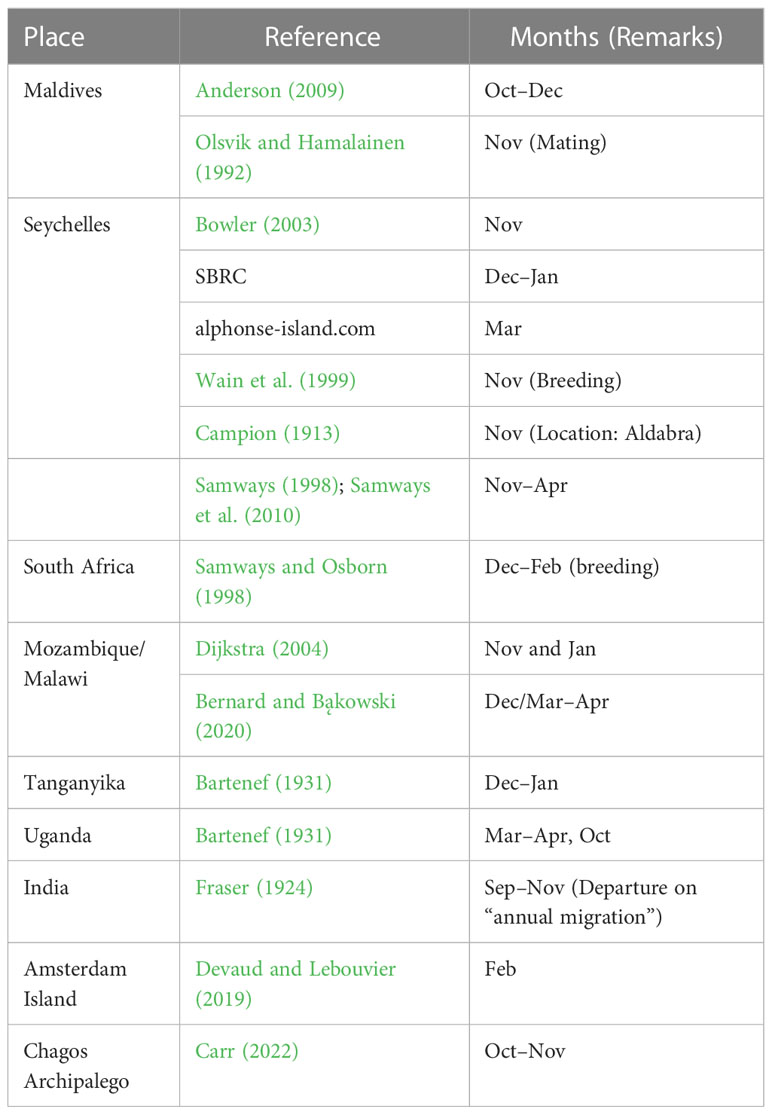
Table 1 Sighting of Pantala flavescens at different locations and the timing reported in the literature.
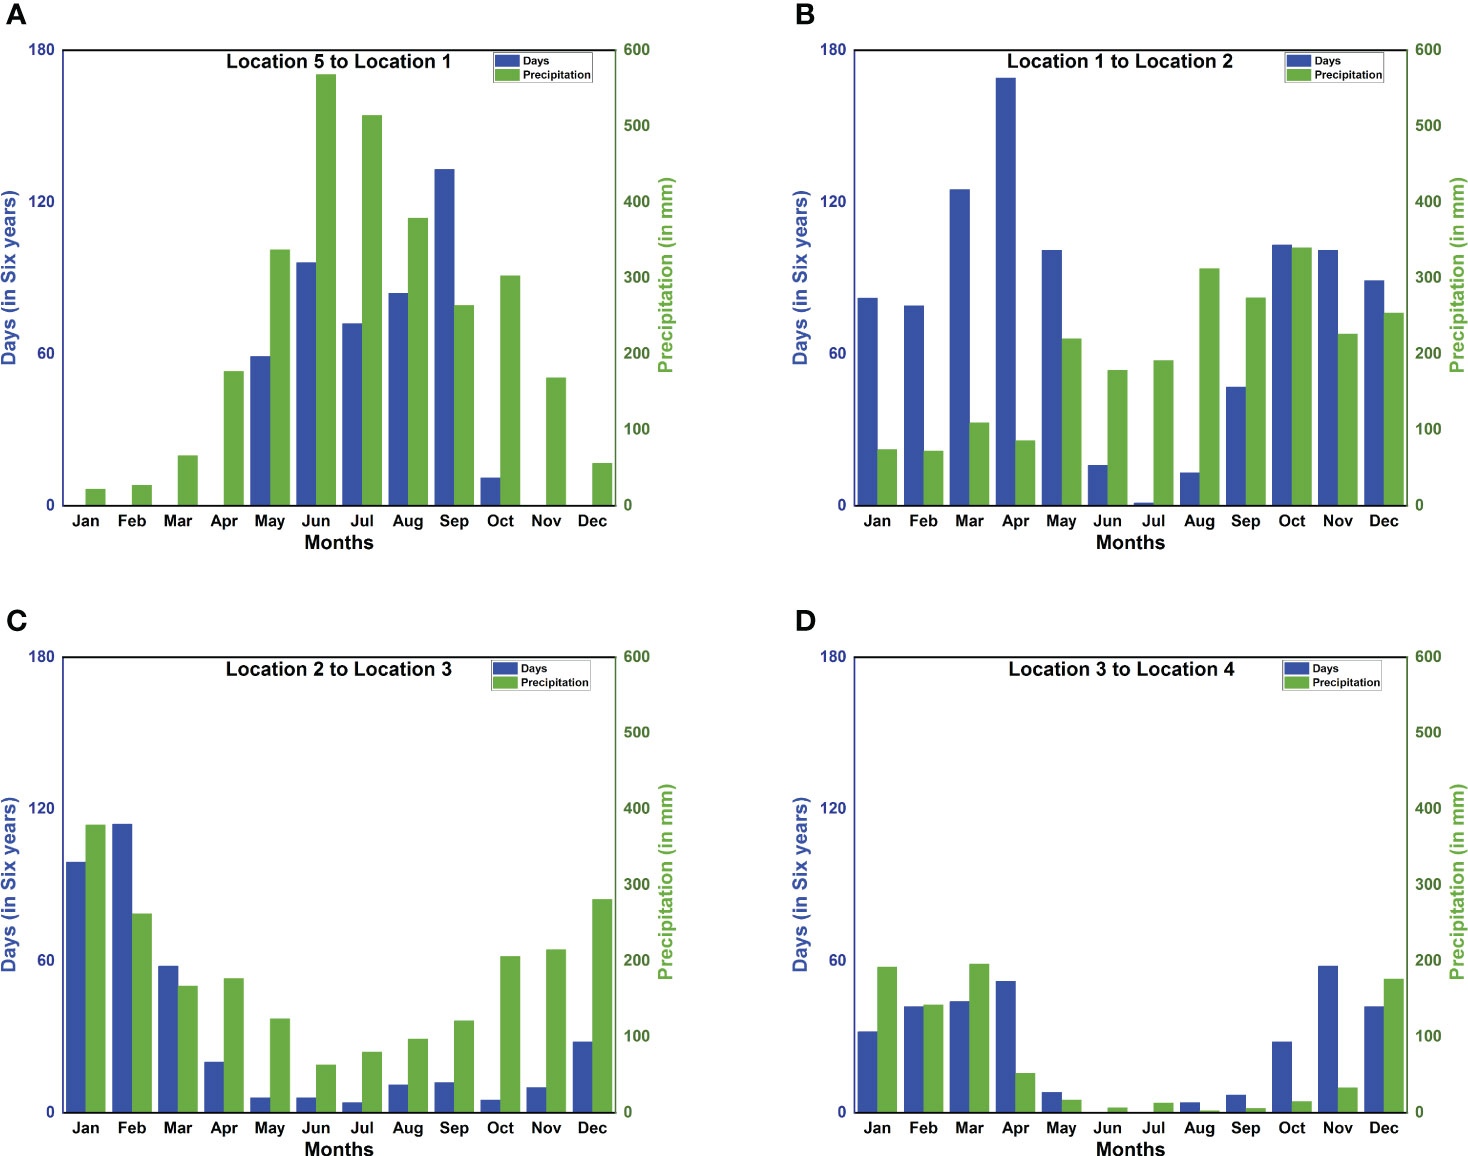
Figure 7 Correlation between precipitation and monthly successful trajectories reveals the migration time window. Month-wise distribution of the total number of days out of six consecutive years (2002–2007) on which the migration is completed within 90 hours for all four legs (blue bars) and monthly precipitation (green bars) at (A) Location 1 [13.5N 74.5E](India); (B) Location 2 [5N 73E](Maldives); (C) Location 3 [4.5S 55.5E](Seychelles); (D) Location 4 [10S 39.5E](Mozambique).
3.3 Fresh sighting links the origin of transoceanic migration to branched migration network that provides clue to widespread dispersal
Existing studies (Anderson, 2009; Borisov et al., 2020; Hedlund et al., 2021) suggest an alternate route for P. flavescens to cross the Indian Ocean directly from various departure sites in India and the Maldives to arrive in Somalia during November and December. We computed the successful trajectories for emigration from Locations 1 (India), 2 (Maldives) to Location 5 (Somalia), and indeed winds are not favorable until September (see Figure 8A), and most successful trajectories occur in December, consistent with Hedlund et al. (2021). The passage of the ITCZ in October through this region renders the direct crossing feasible. November seems more favorable for migration than December because there is more precipitation in Somalia.
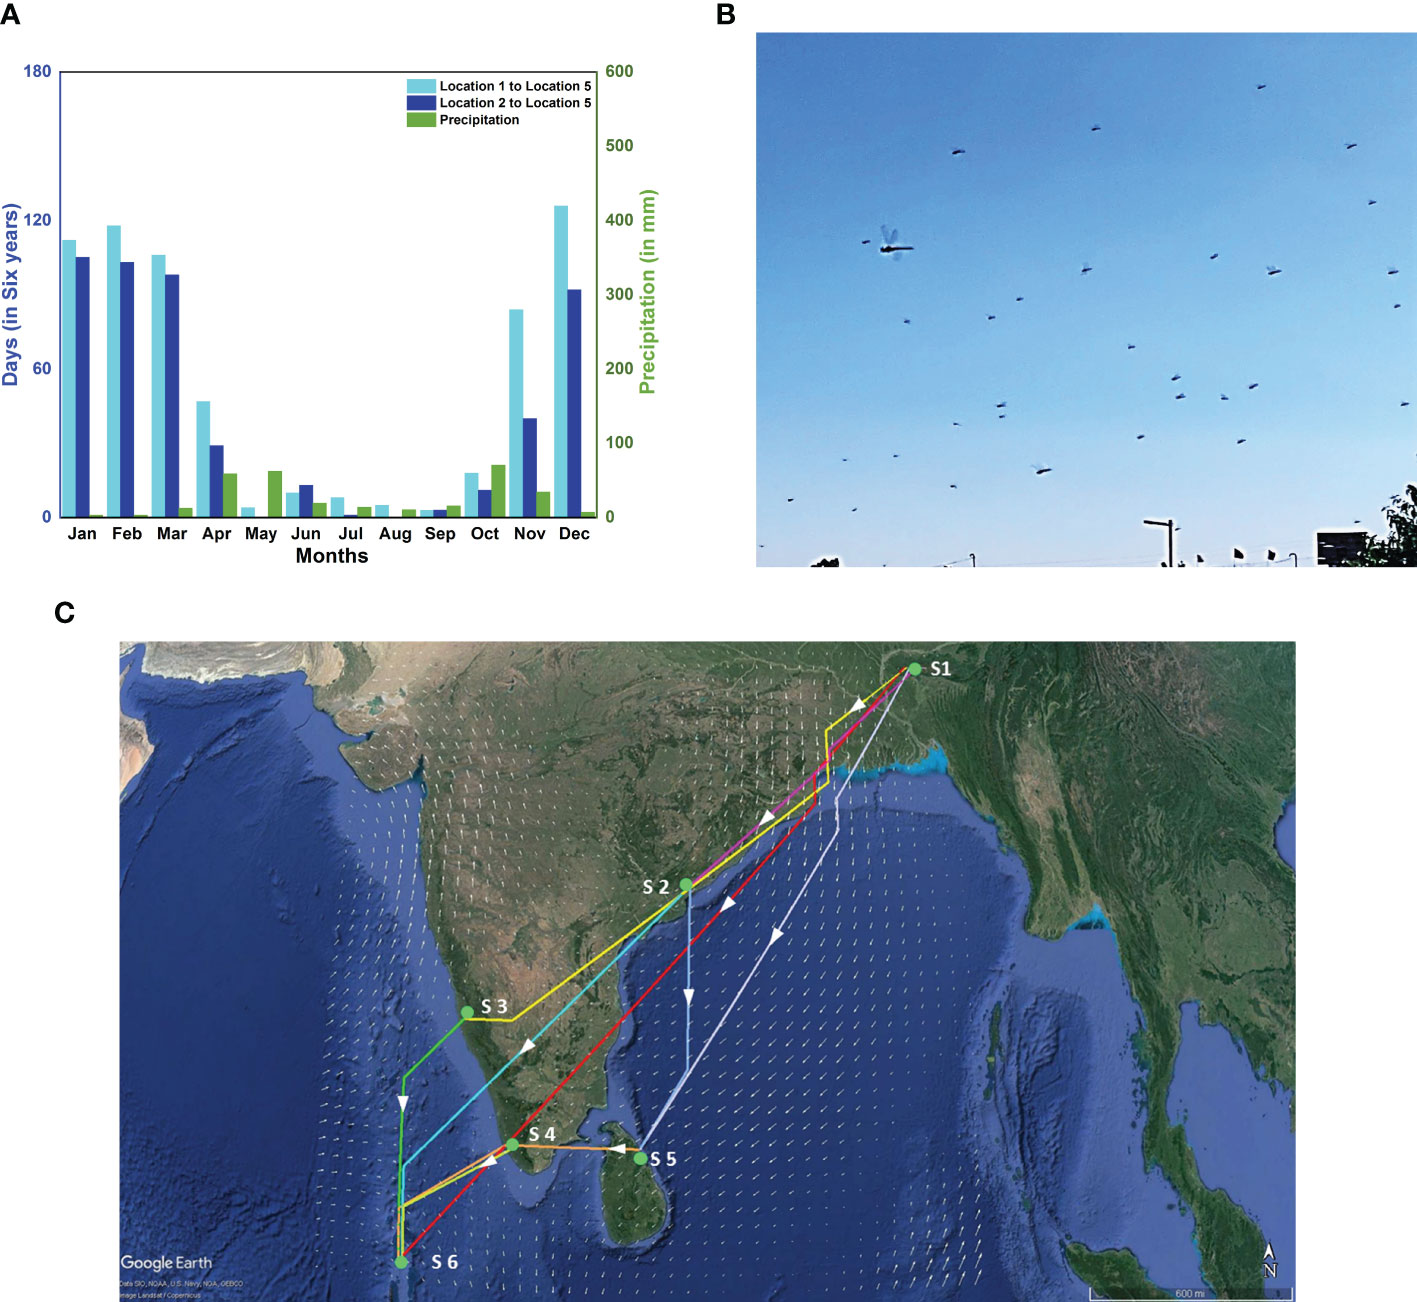
Figure 8 Alternate routes, fresh sighting of a migration swarm and branched network. (A) Month-wise distribution of the total number of days out of six consecutive years (2002-2007) on which the migration is completed within 90 hours for two alternate routes; Location 1 to Location 5 (cyan bar) and Location 2 to Location 5 (blue bar), and monthly precipitation at Location 5 (green bar). (B) Sighting of migration swarm of P. flavescens at Cherrapunji, Meghalaya (S1) on 2nd November 2019. (C) Branched network showing various possible paths to reach the Maldives(S6) starting from Cherrapunji(S1) on 2nd November 2019, with stopovers at Visakhapatnam [17.5N 82.5E](S2), Mangalore[13N 75E] (S3), Thiruvananthapuram[9N 77E] (S4) and in Sri Lanka[9N 81E] (S5).
The possibility of the alternate route implies the existence of branching networks (Drake and Gatehouse, 1995; Satterfield et al., 2020). The concept of a branched network allows a complex migratory pattern to emerge naturally and connect unexplained albeit important observations reported hitherto. For instance, P. flavescens arrive in South-Eastern India and eastern Sri Lanka along with the NE monsoons from October to December (Corbet, 1988; Anderson, 2009). Furthermore, the origin of P. flavescens reaching the Maldives is speculated as North-Eastern India (Hobson et al., 2012; Hedlund et al., 2021). We sighted P. flavescens swarms in Cherrapunji (25.2N 91.7E, NE India (S1)) on 1st and 2nd November 2019 (see Figure 8B). The swarm exhibited a well-coordinated motion predominantly from the north-east to the south-west direction (see Supplementary Movie S1) aligned with the local wind on those days, indicating a destination potentially in South-Eastern India or Sri Lanka. A branched migration network coupled with the sighting in Cherrapunji allows us to conjecture that, indeed, the transoceanic migration of P. flavescens plausibly originates in NE India with stopovers in SE India and Sri Lanka. We investigate the branched networks on this pathway further using optimal paths (see Figure 8C; Table 2). A direct flight from Cherrapunji to the Maldives (S6) requires the migrant to cover a distance of around 3000km, requiring approximately 115h, which is significantly higher than the threshold of 90h. There is ample land mass between these two sites, and multiple refuelling stopovers may be anticipated. Figure 8C shows the branching network of various possibilities of reaching S6 from S1 with stopovers at Visakhapatnam (S2), Mangalore (S3), Thiruvananthapuram (S4) and in Sri Lanka (S5). From the figure, it can be observed that S2 and S4 are preferable stopovers as they are in the path of multiple optimal routes, and they are more likely to be selected by migrating P. flavescens. The timely sightings at Cherrapunji, SE India and Sri Lanka and the branched networks revealed by the optimal paths lend further credibility to the NE India being the origin of the transoceanic migration of the P. flavescens.
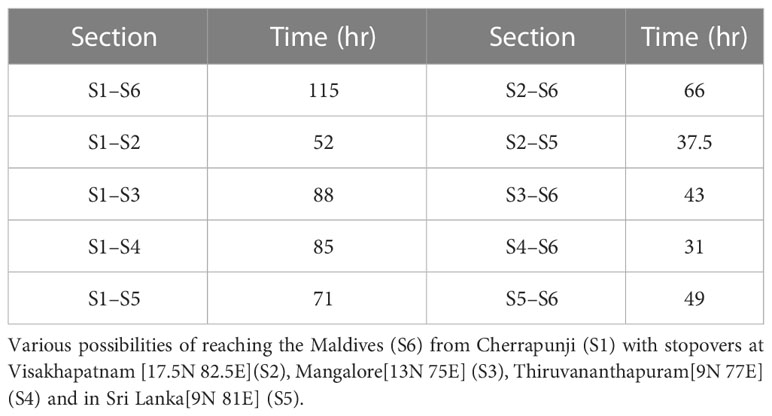
Table 2 Time to cover different section of the branching network.
The branched network in Figure 8C perhaps provides a glimpse of the complex migratory network of P. flavescens, potentially spanning Asia and Africa. The appearance of P. flavescens in Japan, China, Indonesia, Sri Lanka, NE India, and southern Islands of the Indian ocean such as Amsterdam Island and Chagos Archipelago (see Figure 1; Table 1) prompts us to speculate that branching and dispersal of migrating P. flavescens emerge from all the locations that are part of a more complex migratory circuit spanning Asia, Africa and beyond (Sparrow et al., 2020). The migration significantly impacts global ecology, and its success is linked to any stressors of the climate and local ecological systems. There have been reports of islands of the Maldives (Yamamoto and Esteban, 2010) and Seychelles (Obura et al., 2022) disappearing which can be detrimental to the migration of P. flavescens and, in turn, to the global ecology (Liao et al., 2023).
4 Conclusions
In conclusion, we found that the migration from India to Africa commences from October with stopovers in the Maldives and Seychelles, as suggested by Anderson (2009). The arrival timing predictions for the Maldives, Seychelles, and Mozambique agree with prior observations (Campion, 1913; Olsvik and Hamalainen, 1992; Wain et al., 1999; Anderson, 2009) (see Table 1). The migration time window indicates the possibility of breeding in the Maldives and Seychelles, that is consistent with Olsvik and Hamalainen (1992)’s and Wain et al. (1999)’s observations, respectively. The direct crossing of the Indian Ocean aided by the Somali Jet is feasible, May onwards, during the migration from Africa to India, corroborating existing reports (Corbet, 2004; Anderson, 2009; Hedlund et al., 2021). An alternate route involving the direct crossing of the Indian Ocean for the onward journey from India and the Maldives to the African continent is also feasible in November and December, as reported by Hedlund et al. (2021). Furthermore, the identification of alternate routes implies the existence of a branched and complex network of migratory routes. We also correlated our spotting of swarms of migrant P. flavescens in Cherrapunji, India on 1st, 2nd November 2019 with two seemingly disconnected results in the literature; Hobson et al. (2012); Hedlund et al. (2021) predicted that the migration of P. flavescens begins in NE India and Corbet (1988); Anderson (2009) reported the arrival of P. flavescens in SE India and Sri Lanka. Indeed all the observations fit into an extensive, branched migration circuit of P. flavescens that originates in NE India and has stopovers spread across the Indian subcontinent and potentially explains the closeness of the local populations (Christudhas and Mathai, 2014). A branched migratory pattern with multiple stopovers provides a clue to the widespread dispersal of P. flavescens throughout SE Asia and Africa (see Figure 1; Table 1). P. flavescens initiate migration from various sites and probably halt at stopovers when they find cues for favorable conditions. Furthermore, the availability of micro-insects (Anderson, 2009) and aerial planktons (May, 2013; Troast et al., 2016) for feeding en route could increase the continuous flight duration and, consequently, the range. The migration in swarms is also likely to reduce the aerodynamic drag on each individual. Thus, the energetics constraints imposed in our model are conservative and underestimate the probability of migration success. Our conclusions raise questions like the importance of the swarm dynamics in insect migration. Furthermore, the impact of the gradual disappearance of the islands of the Maldives (Yamamoto and Esteban, 2010) and Seychelles (Obura et al., 2022) on the survival of the transoceanic migration of P. flavescens and the consequences on the global ecology have perhaps remained underappreciated so far.
Data availability statement
The raw data supporting the conclusions of this article will be made available by the authors, without undue reservation.
Author contributions
The study was conceived and designed by KR and SS. Field work and experimental data collection were done by KR and AP. Codes were written by KR and SS. Simulations and data analysis were done by KR. KR and SS wrote the paper. Valuable insights, feedback, and inputs were provided by AR throughout the work and manuscript drafting. The final work and paper have been shaped by ideas and feedback from all the authors. All authors contributed to the article and approved the submitted version.
Funding
This work has been supported by grants, IIT/SRIC/ISIRD/2015-2016, ECR/2016/000473, and CRG/2021/004703. We thank all the funding agencies.
Conflict of interest
The authors declare that the research was conducted in the absence of any commercial or financial relationships that could be construed as a potential conflict of interest.
Publisher’s note
All claims expressed in this article are solely those of the authors and do not necessarily represent those of their affiliated organizations, or those of the publisher, the editors and the reviewers. Any product that may be evaluated in this article, or claim that may be made by its manufacturer, is not guaranteed or endorsed by the publisher.
Supplementary material
The Supplementary Material for this article can be found online at: https://www.frontiersin.org/articles/10.3389/fevo.2023.1152384/full#supplementary-material
References
Alphonse-Island. (2016). Available at: https://www.alphonse-island.com/en/blog/2016/05/how-often-does-fascinating-phenomenon-occur-seychelles.
Anderson R. C. (2009). Do dragonflies migrate across the western Indian ocean? J. Trop. Ecol. 25, 347–358. doi: 10.1017/S0266467409006087
Aryo D. (2021) Dijkstra Algorithm. Available at: https://www.mathworks.com/matlabcentral/fileexchange/36140-dijkstra-algorithm.
Azuma A., Watanabe T. (1988). Flight performance of a dragonfly. J. Exp. Biol. 137, 221–252. doi: 10.1242/jeb.137.1.221
Bartenef A. (1931). Ûber die geographische verbeitung von Pantala flavescens fabr.(Odonata, libellulinae). Zool. Jb.(Syst.) 60, 471–488.
Bauer S., Hoye B. J. (2014). Migratory animals couple biodiversity and ecosystem functioning worldwide. Science 344, 1242552. doi: 10.1126/science.1242552
Bernard R., Bąkowski M. (2020). New data on dragonflies (Odonata) of Mozambique, with a new country record of phyllogomphus selysi schouteden 1933. Afr. Invertebrates 61, 17. doi: 10.3897/AfrInvertebr.61.48320
Borisov S. N., Iakovlev I. K., Borisov A. S., Ganin M. Y., Tiunov A. V. (2020). Seasonal migrations of Pantala flavescens (Odonata: libellulidae) in middle Asia and understanding of the migration model in the afro-Asian region using stable isotopes of hydrogen. Insects 11, 890. doi: 10.3390/insects11120890
Bowler J. (2003). The odonata of aride island nature reserve, Seychelles: patterns in seasonal abundance and breeding activity (Opuscula zoologica fluminensia). Opuscula Zoologica Fluminensia 210, 1–22.
Brower L. P., Fink L. S., Walford P. (2006). Fueling the fall migration of the monarch butterfly. Integr. Comp. Biol. 46, 1123–1142. doi: 10.1093/icb/icl029
Campion H. (1913). No. xxvii.–ODONATA. transactions of the linnean society of London. 2nd Series: Zool. 15, 435–446.
Cao L.-Z., Fu X.-w., Hu C.-x., Wu K.-m. (2018). Seasonal migration of pantala flavescens across the bohai strait in northern China. Environ. Entomol. 47, 264–270. doi: 10.1093/ee/nvy017
Cao L. Z., Wu K. M. (2019). Genetic diversity and demographic history of globe skimmers (Odonata: libellulidae) in China based on microsatellite and mitochondrial DNA markers. Sci. Rep. 9, 1–8. doi: 10.1038/s41598-019-45123-0
Carr P. (2022). Odonata of the chagos archipelago, central Indian ocean: an update. Notulae odonatologicae 9, 229–235. doi: 10.5281/zenodo.4268581
Chapman J. W., Bell J. R., Burgin L. E., Reynolds D. R., Pettersson L. B., Hill J. K., et al. (2012). Seasonal migration to high latitudes results in major reproductive benefits in an insect. Proc. Natl. Acad. Sci. 109, 14924–14929. doi: 10.1073/pnas.1207255109
Chapman J. W., Nesbit R. L., Burgin L. E., Reynolds D. R., Smith A. D., Middleton D. R., et al. (2010). Flight orientation behaviors promote optimal migration trajectories in high-flying insects. Science 327, 682–685. doi: 10.1126/science.1182990
Chapman J. W., Nilsson C., Lim K. S., Bäckman J., Reynolds D. R., Alerstam T. (2016). Adaptive strategies in nocturnally migrating insects and songbirds: contrasting responses to wind. J. Anim. Ecol. 85, 115–124. doi: 10.1111/1365-2656.12420
Chapman J. W., Reynolds D. R., Mouritsen H., Hill J. K., Riley J. R., Sivell D., et al. (2008). Wind selection and drift compensation optimize migratory pathways in a high-flying moth. Curr. Biol. 18, 514–518. doi: 10.1016/j.cub.2008.02.080
Chapman J. W., Reynolds D. R., Wilson K. (2015). Long-range seasonal migration in insects: mechanisms, evolutionary drivers and ecological consequences. Ecol. Lett. 18, 287–302. doi: 10.1111/ele.12407
Christudhas A., Mathai M. T. (2014). Genetic variation of a migratory dragonfly characterized with random DNA markers. J. Entomol Zool Stud. 2, 182–184.
Corbet P. S. (1988). Current topics in dragonfly biology. 3. a discussion focussing on the seasonal ecology of Pantala flavescens in the Indian subcontinent. Societas Internationalis Odonatol. Rapid Commun. (Supplements) 8, 1–24.
Corbet P. S. (2004). Dragonflies: behaviour and ecology of odonata (revised edition) (Colchester, UK: Harley Books).
Devaud M., Lebouvier M. (2019). First record of Pantala flavescens (Anisoptera: libellulidae) from the remote Amsterdam island, southern Indian ocean. Polar Biol. 42, 1041–1046. doi: 10.1007/s00300-019-02479-3
Dijkstra E. W. (1959). A note on two problems in connexion with graphs. Numerische Mathematik 1, 269–271. doi: 10.1007/BF01386390
Dijkstra K.-D. B. (2004). Dragonflies (Odonata) of mulanje, Malawi. IDF Report, Newsletter of the International Dragonfly Fund 6, 23–29.
Dirzo R., Young H. S., Galetti M., Ceballos G., Isaac N. J., Collen B. (2014). Defaunation in the anthropocene. science 345, 401–406. doi: 10.1126/science.1251817
Drake V. A., Gatehouse A. G. (1995). Insect migration: tracking resources through space and time (Cambridge, UK: Cambridge University Press).
Du B., Ding D., Ma C., Guo W., Kang L. (2022). Locust density shapes energy metabolism and oxidative stress resulting in divergence of flight traits. Proc. Natl. Acad. Sci. 119, e2115753118. doi: 10.1073/pnas.2115753118
Fraser F. C. (1924). A survey of the odonate (Dragonfly) fauna of Western India with special remarks on the genera macromia and idionyx and descriptions of thirty new species. Records Zool. Survey India 26, 423–522. doi: 10.26515/rzsi/v26/i5/1924/162660
Gao B., Hedlund J., Reynolds D. R., Zhai B., Hu G., Chapman J. W. (2020). The “migratory connectivity” concept, and its applicability to insect migrants. Movement Ecol. 8, 1–13. doi: 10.1186/s40462-020-00235-5
Gibo D. (1986). “Flight strategies of migrating monarch butterflies (Danaus plexippus l.) in southern Ontario,” in Insect flight: dispersal and migration. Proceedings in Life Sciences. (Berlin, Heidelberg: Springer), 172–184.
Giri A., Biswas N., Chase D. L., Xue N., Abkarian M., Mendez S., et al. (2022). Colliding respiratory jets as a mechanism of air exchange and pathogen transport during conversations. J. Fluid Mechanics 930, R1. doi: 10.1017/jfm.2021.915
Hallmann C. A., Sorg M., Jongejans E., Siepel H., Hofland N., Schwan H., et al. (2017). More than 75 percent decline over 27 years in total flying insect biomass in protected areas. PloS One 12, e0185809. doi: 10.1371/journal.pone.0185809
Hedlund J. S., Lv H., Lehmann P., Hu G., Anderson R. C., Chapman J. W. (2021). Unraveling the world’s longest non-stop migration: the Indian ocean crossing of the globe skimmer dragonfly. Front. Ecol. Evol. 525. doi: 10.3389/fevo.2021.698128
Hobson K. A., Anderson R. C., Soto D. X., Wassenaar L. I. (2012). Isotopic evidence that dragonflies (Pantala flavescens) migrating through the Maldives come from the northern Indian subcontinent. PloS One 7, e52594. doi: 10.1371/journal.pone.0052594
Hobson K. A., Jinguji H., Ichikawa Y., Kusack J. W., Anderson R. C. (2021). Long-distance migration of the globe skimmer dragonfly to Japan revealed using stable hydrogen (δ 2h) isotopes. Environ. Entomol. 50, 247–255. doi: 10.1093/ee/nvaa147
Holland R. A., Wikelski M., Wilcove, D. S. (2006). How and why do insects migrate? Science 313, 794–796. doi: 10.1126/science.1127272
Hu G., Lim K. S., Horvitz N., Clark S. J., Reynolds D. R., Sapir N., et al. (2016). Mass seasonal bioflows of high-flying insect migrants. Science 354, 1584–1587. doi: 10.1126/science.aah4379
Hu G., Stefanescu C., Oliver T. H., Roy D. B., Brereton T., Van Swaay C., et al. (2021). Environmental drivers of annual population fluctuations in a trans-Saharan insect migrant. Proc. Natl. Acad. Sci. 118, e2102762118. doi: 10.1073/pnas.2102762118
Huestis D. L., Dao A., Diallo M., Sanogo Z. L., Samake D., Yaro A. S., et al. (2019). Windborne long-distance migration of malaria mosquitoes in the sahel. Nature 574, 404–408. doi: 10.1038/s41586-019-1622-4
Kumar A. (1984). On the life history of Pantala flavescens (Fabricius)(Libellulidae: odonata). Ann. Entomol. 2, 43–50.
Liao J., Wu Z., Wang H., Xiao S., Mo P., Cui X. (2023). Projected effects of climate change on species range of pantala flavescens, a wandering glider dragonfly. Biology 12, 226. doi: 10.3390/biology12020226
Marra P. P., Cohen E. B., Loss S. R., Rutter J. E., Tonra C. M. (2015). A call for full annual cycle research in animal ecology. Biol. Lett. 11, 20150552. doi: 10.1098/rsbl.2015.0552
May M. L. (1991). Dragonfly flight: power requirements at high speed and acceleration. J. Exp. Biol. 158, 325–342. doi: 10.1242/jeb.158.1.325
May M. L. (2013). A critical overview of progress in studies of migration of dragonflies (Odonata: anisoptera), with emphasis on north America. J. Insect Conserv. 17, 1–15. doi: 10.1007/s10841-012-9540-x
May M. L., Matthews J. H. (2008). Migration in odonata: a case study of anax junius. Dragonflies Damselflies: Model. Organisms Ecol. Evol. Res. 1, 63–77. doi: 10.1093/acprof:oso/9780199230693.003.0006
Menz M. H., Scacco M., Bürki-Spycher H., Williams H. J., Reynolds D. R., Chapman J. W., et al. (2022). Individual tracking reveals long-distance flight-path control in a nocturnally migrating moth. Science 377, 764–768. doi: 10.1126/science.abn1663
Mitra T. R. (1974). Another record of migratory flights of the dragonfly pantala flavescens (Fabricius)(Odonata, libellulidae) in Calcutta. Entomologist’s Rec. J. Variation. 86, 53–54.
NOAA. (2019). NCEP reanalysis data provided by the NOAA/OAR/ESRL PSD (Boulder, Colorado, USA). Available at: https://psl.noaa.gov/data/gridded/data.ncep.reanalysis.html (Accessed 02-April-2019).
Obura D., Gudka M., Samoilys M., Osuka K., Mbugua J., Keith D. A., et al. (2022). Vulnerability to collapse of coral reef ecosystems in the Western Indian ocean. Nat. Sustain. 5, 104–113. doi: 10.1038/s41893-021-00817-0
Olsvik H., Hamalainen M. (1992). Dragonfly records from the Maldives islands, Indian ocean (Odonata). Opuscula Zoologica Fluminensia 89, 1–7.
Pozrikidis C. (2016). Fluid dynamics: theory, computation, and numerical simulation (New York, NY: Springer).
Samways M. J. (1998). Establishment of resident odonata populations on the formerly waterless cousine island, Seychelles: an island biogeography theory (IBT) perspective. Odonatologica 27, 253–258.
Samways M., Hitchins P., Bourquin O., Henwood J. (2010). Tropical island recovery: cousine island, Seychelles (Oxford: John Wiley & Sons).
Samways M., Osborn R. (1998). Divergence in a transoceanic circumtropical dragonfly on a remote island. J. Biogeogr. 25, 935–946. doi: 10.1046/j.1365-2699.1998.00245.x
Sánchez-Bayo F., Wyckhuys K. A. G. (2019). Worldwide decline of the entomofauna: a review of its drivers. Biol. Conserv. 232, 8–27. doi: 10.1016/j.biocon.2019.01.020
Satterfield D. A., Sillett T. S., Chapman J. W., Altizer S., Marra P. P. (2020). Seasonal insect migrations: massive, influential, and overlooked. Front. Ecol. Environ. 18, 335–344. doi: 10.1002/fee.2217
Seychelles Bird Records Committee. (2014). Available at: https://www.seychellesbirdrecordscommittee.com/2014-accepted-records.html.
Sparrow D. J., De Knijf G., Smith M. S., Sparrow R., Michaelides M., Konis D., et al. (2020). The circumtropical pantala flavescens is a regular visitor to Cyprus and reproducing on the island (Odonata: libellulidae). Odonatologica 49, 289–311. doi: 10.5281/zenodo.4268553
Srygley R. B. (2003). Wind drift compensation in migrating dragonflies pantala (Odonata: libellulidae). J. Insect Behav. 16, 217–232. doi: 10.1023/A:1023915802067
Srygley R. B., Dudley R. (2008). Optimal strategies for insects migrating in the flight boundary layer: mechanisms and consequences. Integr. Comp. Biol. 48, 119–133. doi: 10.1093/icb/icn011
Srygley R. B., Oliveira E. G. (2001). Sun compass and wind drift compensation in migrating butterflies. J. Navig. 54, 405–417. doi: 10.1017/S0373463301001448
Srygley R. B., Oliveira E. G., Dudley R. (1996). Wind drift compensation, flyways, and conservation of diurnal, migrant Neotropical Lepidoptera. Proc. R. Soc. London Ser. B: Biol. Sci. 263, 1351–1357. doi: 10.1098/rspb.1996.0198
Stefanescu C., Alarcón M., Àvila A. (2007). Migration of the painted lady butterfly, Vanessa cardui, to north-eastern Spain is aided by African wind currents. J. Anim. Ecol. 76, 888–898. doi: 10.1111/j.1365-2656.2007.01262.x
Suhling F., Schenk K., Padeffke T., Martens A. (2004). A field study of larval development in a dragonfly assemblage in African desert ponds (Odonata). Hydrobiologia 528, 75–85. doi: 10.1007/s10750-004-3047-8
Tarroux A., Weimerskirch H., Wang S.-H., Bromwich D. H., Cherel Y., Kato A., et al. (2016). Flexible flight response to challenging wind conditions in a commuting Antarctic seabird: do you catch the drift? Anim. Behav. 113, 99–112. doi: 10.1016/j.anbehav.2015.12.021
Troast D., Suhling F., Jinguji H., Sahlén G., Ware J. (2016). A global population genetic study of Pantala flavescens. PloS One 11, e0148949. doi: 10.1371/journal.pone.0148949
Wain W. H., Wain C. B., Lambert T. (1999). Odonata of north island, Seychelles archipelago. Notulae odonatologicae 5, 47–50.
Warfvinge K., KleinHeerenbrink M., Hedenström A. (2017). The power–speed relationship is U-shaped in two free-flying hawkmoths (manduca sexta). J. R. Soc. Interface 14, 20170372. doi: 10.1098/rsif.2017.0372
Westbrook J. K., Nagoshi R. N., Meagher R. L., Fleischer S. J., Jairam S. (2016). Modeling seasonal migration of fall armyworm moths. Int. J. Biometeorol. 60, 255–267. doi: 10.1007/s00484-015-1022-x
Wikelski M., Moskowitz D., Adelman J. S., Cochran J., Wilcove D. S., May M. L. (2006). Simple rules guide dragonfly migration. Biol. Lett. 2, 325–329. doi: 10.1098/rsbl.2006.0487
Williams C. (1957). Insect migration. Annu. Rev. Entomol. 2, 163–180. doi: 10.1146/annurev.en.02.010157.001115
Wu Q. L., Hu G., Westbrook J. K., Sword G. A., Zhai B. P. (2018). An advanced numerical trajectory model tracks a corn earworm moth migration event in Texas, USA. Insects 9, 115. doi: 10.3390/insects9030115
Wynn J., Padget O., Mouritsen H., Perrins C., Guilford T. (2020). Natal imprinting to the earth’s magnetic field in a pelagic seabird. Curr. Biol. 30, 2869–2873. doi: 10.1016/j.cub.2020.05.039
Yamamoto L., Esteban M. (2010). Vanishing island states and sovereignty. Ocean Coast. Manage. 53, 1–9. doi: 10.1016/j.ocecoaman.2009.10.003
Keywords: transoceanic migration, Pantala flavescens, branched network, migration energetics, wind compensation, insect migration
Citation: Ranjan KS, Pawar AA, Roy A and Saha S (2023) Transoceanic migration network of dragonfly Pantala flavescens: origin, dispersal and timing. Front. Ecol. Evol. 11:1152384. doi: 10.3389/fevo.2023.1152384
Received: 27 January 2023; Accepted: 01 June 2023;
Published: 21 June 2023.
Edited by:
Danish Ali Ahmed, Gulf University for Science and Technology, KuwaitReviewed by:
Jay E. Diffendorfer, United States Department of the Interior, United StatesPhilippe Vernon, CNRS UMR 6553 EcoBio/University of Rennes 1, France
Copyright © 2023 Ranjan, Pawar, Roy and Saha. This is an open-access article distributed under the terms of the Creative Commons Attribution License (CC BY). The use, distribution or reproduction in other forums is permitted, provided the original author(s) and the copyright owner(s) are credited and that the original publication in this journal is cited, in accordance with accepted academic practice. No use, distribution or reproduction is permitted which does not comply with these terms.
*Correspondence: Sandeep Saha, ssaha@aero.iitkgp.ac.in