Dynamic change, driving mechanism and spatiotemporal prediction of the normalized vegetation index: a case study from Yunnan Province, China
 Yang Han
 Yilin Lin1,2,3*
  Peng Zhou
- 1Faculty of Land Resources Engineering, Kunming University of Science and Technology, Kunming, China
- 2Key Laboratory of Geospatial Information Integration Innovation for Smart Mines, Kunming, China
- 3Spatial Information Integration Technology of Natural Resources in Universities of Yunnan Province, Kunming, China
- 4School of Surveying and Land Information Engineering, Henan Polytechnic University, Jiaozuo, China
- 5School of Geomatics and Spatial Information, Shandong University of Science and Technology, Qingdao, China
- 6College of Marine Sciences, Shanghai Ocean University, Shanghai, China
Vegetation indexes have been widely used to qualitatively and quantitatively evaluate vegetation cover and its growth vigor. To further extend the study of vegetation indexes, this paper proposes to study the spatial and temporal distribution characteristics and specific driving mechanisms of vegetation indexes based on the example of Yunnan Province, China, and also adds the study of spatial and temporal prediction methods of vegetation indexes. This paper used data on this region’s normalized vegetation index (NDVI), three meteorological factors, and eight social factors from 1998 to 2019. The dynamic change in and driving mechanism of the NDVI were studied using mean value analysis, univariate linear trend regression analysis, and partial correlation analysis. In addition, the Fourier function model and the CA–Markov model were also used to predict the NDVI of Yunnan Province from 2020 to 2030 in time and space. The results show that: (1) The NDVI value in Yunnan Province is high, showing a significant growth trend. The increased vegetation coverage area has increased in the past 22 years without substantial vegetation degradation. (2) The positive promotion of meteorological factors is greater than the negative inhibition. The partial correlation of relative humidity among meteorological factors is the highest, which is the main driving factor. (3) The NDVI value is significantly positively correlated with population and economy and negatively correlated with pasture land and agricultural area. (4) The NDVI values are predicted well in time (R = 0.64) and space (Kappa = 0.8086 and 0.806), satisfying the accuracy requirements. This paper aims to enrich the theoretical and technical system of ecological environment research by studying the dynamic change, driving mechanism, and spatiotemporal prediction of the normalized vegetation index. Its results can provide the necessary theoretical basis for the simulation and prediction of vegetation indexes.
1. Introduction
Vegetation is an essential component of terrestrial ecosystems and is the link between elements of natural geography such as the atmosphere, water, organisms, rocks, and soil (Hédl et al., 2017; Xiao et al., 2018; Li et al., 2021), and it is the most fundamental component of the ecosystem on which all organisms need to depend directly or indirectly. Any change in terrestrial ecosystems will inevitably affect vegetation type, quantity, or quality (Torres-García et al., 2022). Especially as a result of global warming, which has led to a series of changes in vegetation phenology events (Huang et al., 2019; Liu et al., 2020), the frequency of extreme climate events has increased significantly worldwide, causing severe negative impacts on agricultural production, water resources, and the socioeconomic development of ecosystems (Zhao et al., 2018). Therefore, long-term dynamic monitoring and the study of vegetation changes and their driving factors are of great value to understanding global changes’ impact and achieving effective ecosystem management (Tong et al., 2019). Ecological problems such as global natural disasters, accelerated desert degradation, and soil erosion are frequent, especially in northern latitudes (Myneni et al., 1997; Tucker et al., 2001). In the past 30 years, ecosystems in more than half of the global regions and countries have experienced different degrees of degradation due to economic development and population growth. Issues such as land degradation, soil erosion, and desertification have occurred in China, especially in the northern regions (Wang et al., 2002). This has led researchers to conduct studies focusing on the northern part. In contrast, Yunnan Province, China, is a rare region with ultra-high vegetation cover and diverse vegetation, which needs to be studied due to the area’s unique geomorphological and vegetation characteristics. Therefore, a timely, scientific, and accurate assessment of the dynamics of vegetation indices in Yunnan, understanding the driving mechanisms of vegetation indexes changes, and modeling and predicting the development of vegetation indexes are essential references for the ecological effects in other similar regions.
The NDVI is closely related to vegetation cover, leaf area index, biomass, and land use, which can reflect the greenness of vegetation from macroscopic aspects and is related to photosynthesis in the vegetation canopy (Zhu, 2016). Studies addressing the dynamics of the NDVI and its response characteristics to climate change and human activities have been better developed in recent years. For example, nationwide, Jin et al. (2020) used time series data of the NDVI and meteorological factors such as precipitation and temperature to establish a residual analysis model to achieve quantitative separation of climate change effects on the NDVI and arrived at the conclusion that there are significant spatial differences in the impact of climate change and human activities on the NDVI changes, but the positive contribution is generally dominant. Liu et al. (2014) analyzed the differences in the correlation between the NDVI and climate change for different vegetation types in China, and the differences in the relationship between NDVI change trends and temperature and precipitation in different eco-geographical zones were also studied. Piao et al. (2015) analyzed the driving factors of vegetation change in China based on the leaf area index and believed that the increase in atmospheric CO2 concentration and nitrogen deposition might be the main reasons for promoting vegetation recovery in China. Li et al. (2020) analyzed the dominant factors of vegetation productivity changes in China from 1992 to 2013, and the results showed that radiation made the largest contribution to vegetation productivity changes, followed by temperature and precipitation. Chen et al. (2020) explored the response of vegetation to precipitation anomalies under different climatic and eco-geographical conditions in China. With the refinement of the research scale, Wang et al. (2013) found that climate warming had caused the edge of the cold-temperate forest in the southern part of the Greater Hinggan Mountains to retreat 140 kilometers northward in the past century. The combined effects of moisture conditions and temperature promoted the growth of vegetation in the arid-humid transition zone in northern China (Sun R. et al., 2021). Decreased temperature led to reduced evaporation of soil moisture, alleviating the slight drought trend in southwestern China and resulting in a general increase in the vegetation index in the region (Sun et al., 2021a). The continuous warming of the climate has affected the senescence period and growing season length of grasslands in the temperate zone of China to varying degrees (He et al., 2022). Precipitation plays a decisive role in the changes in the NDVI in the Yarlung Zangbo River Basin on the Tibetan Plateau (Sun et al., 2019), while temperature is the dominant factor in the changes in the NDVI during the growing season in the permanently frozen area of Northeast China. Li et al. (2018) took the Inner Mongolia Plateau of China as their research object and concluded that the NDVI was positively correlated with extreme precipitation and extreme low temperature, negatively correlated with extreme high temperature, and that the sensitivity of different vegetation types to extreme climate was not the same. Many studies have analyzed the relationship between the NDVI and regional and meteorological factors (Tucker and Choudhury, 1987). Still, only a few studies have examined the driving mechanisms between the NDVI and relative humidity and other social factors, especially in Yunnan Province, China.
Therefore, this paper selects annual normalized difference vegetation index (NDVI) spatial distribution data (1998–2019) in China to study the dynamics of the vegetation index in Yunnan Province and analyzes the spatial and temporal changes in meteorological factors using air temperature, relative humidity data, and precipitation data and explores the partial correlation and significance with the NDVI. In addition, the influence of eight social factors on the NDVI is also investigated. These studies reveal the dynamics of the 22-year NDVI in Yunnan Province and its specific driving mechanisms in relation to meteorological and social aspects. Finally, the spatial distribution of the NDVI in Yunnan Province from 2020 to 2030 is predicted through simulations using mathematical and statistical models (Fourier function model) and physical statistical models (CA-Markov model). This paper is intended to provide theoretical support and a reference basis for ecological protection construction in the region.
2. Materials and methods
2.1. Study area
Yunnan Province lies between 21° 8′ and 29° 15′ north latitude and 97° 31′ and 106° 11′ east longitude, with a total area of 394,100 square kilometers, accounting for 4.1% of the total land area of the country and ranking eighth in size in China. In addition, the region is known as the Kingdom of Plants. It is the province with the most significant number of plant species, mainly including tropical, subtropical, temperate, and cold-temperate plants, among which ancient, derived, and exotic plants are abundant. Yunnan accounts for more than 60% of China’s 30,000 species of higher plants. More than 150 tree species are classified as national priorities for protection and development at the first, second, and third levels. The vegetation resources of Yunnan Province are remarkable, and the study of local vegetation indexes has essential reference values for ecological planning and conservation (Figure 1).
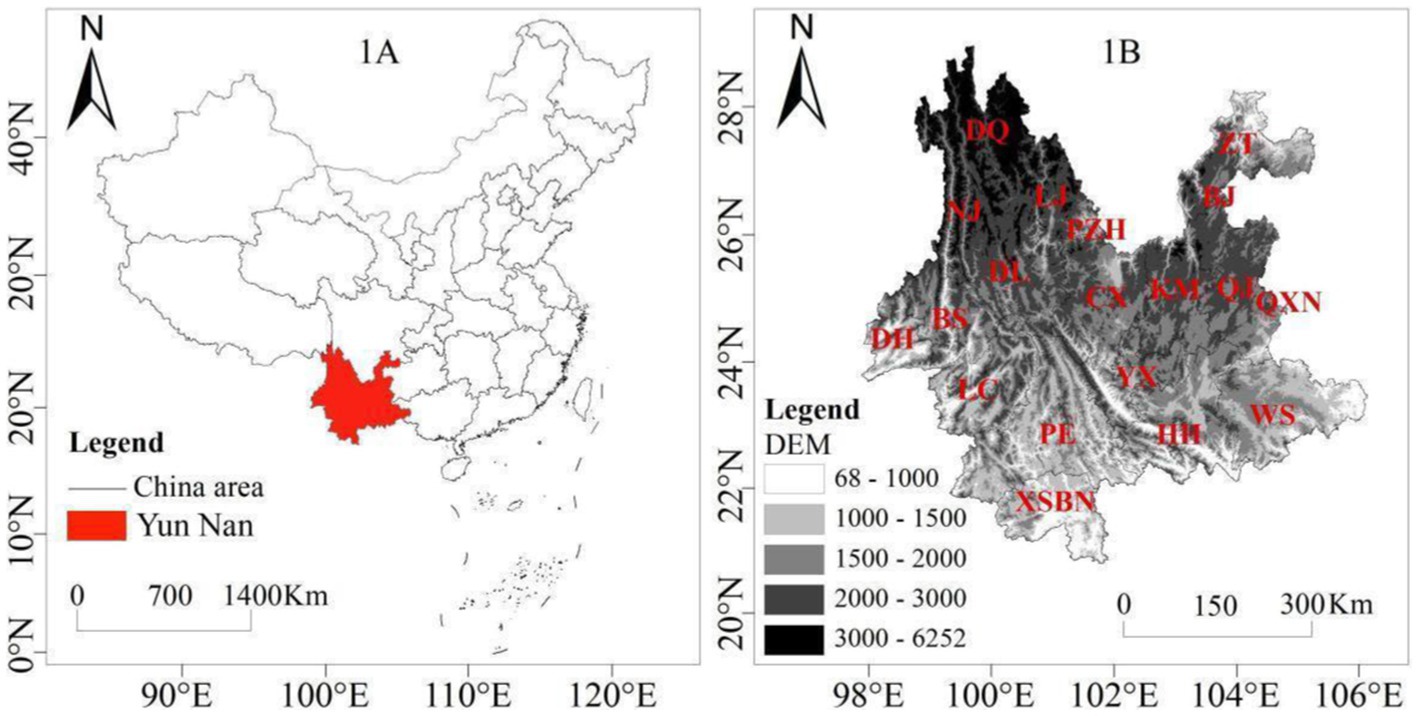
Figure 1. Location of the study area and its basic geomorphology.
2.2. Data
2.2.1. Normalized difference vegetation index data
China’s annual normalized vegetation index data comes from the registration and publication system of resources and environmental science data.1
2.2.2. Other data
The air temperature data were obtained from the National Centre for Atmospheric Sciences in the UK.2 The relative humidity data were obtained from the National Earth System Science Data Center3 in China. The TRMM precipitation data were obtained from NASA Release 7 data, and the monthly precipitation data from 1998 to 2019 were selected to calculate the annual average rainfall. In addition, the social factors associated with the NDVI changes were obtained by statistically and categorically classifying the statistical yearbook data.4
2.3. Methods
2.3.1. Average analyses of the normalized difference NDVI
In this paper, the annual NDVI and the three meteorological data were processed into an overall average of 22 years using the maximum value synthesis method. And the NDVI and the three meteorological factors are analyzed temporally and spatially. In addition, the annual data are analyzed temporally using the average of the NDVI and three meteorological data from raster images. The Maximum Value Composite (MVC) method is employed, with the specific calculation process as follows:
In the formula, MNDVIi represents the maximized NDVI value for the i year; i is an integer from 1 to 22, representing the years from 1998 to 2019; NDVIij represents the monthly NDVI values for the i year, and j is an integer from 1 to 12, representing January to December.
2.3.2. Spatial trend analysis methods
A one-dimensional linear regression analysis model was used to quantitatively analyze the change in vegetation cover trends in Yunnan Province from 1998 to 2019, calculated as follows:
Where represents the slope of the trend line, represents the NDVI value in the first year of the image, and t = 22 (1998–2019) represents the observation time series of the data; > 0 represents an increase in the NDVI value and an increasing trend of vegetation cover; < 0 illustrates a decrease in the NDVI value and a decreasing trend of vegetation cover. We use the Mann-Kendall significance test to evaluate the significance of the NDVI spatial trends. The M-K test is a non-parametric method suitable for detecting trends in time series data. By calculating the test statistic and the corresponding value of p, we can determine whether the NDVI spatial trend is significant.
2.3.3. Partial correlation analysis
Partial correlation analysis is a standard method for examining the relationship between changes in the NDVI (Normalized Difference Vegetation Index) and the climatic factors. In this study, we employed a second-order partial correlation analysis model to identify the primary driving factors of the NDVI. Among the four variables, the partial correlation coefficient between any two variables is calculated by excluding the influence of the other two variables, which is referred to as the second-order partial correlation coefficient. The significance of partial correlation coefficients is assessed using an F-test based on the partial correlation analysis. The calculation formula is as follows:
A positive correlation is indicated by r > 0, while a negative correlation is represented by r ≤ 0. In this context, i, j, h, and m denote the combinations of the NDVI, the temperature, the precipitation, and the relative humidity, respectively. For instance, when investigating the partial correlation relationship between the NDVI and the temperature, the influence of the precipitation and the relative humidity is eliminated. This study also analyzes the spatiotemporal variations of the NDVI with the temperature, the precipitation, and the relative humidity, and explores the relationships between the NDVI and these factors. In addition, we integrate and select eight social factors to analyze the impact of anthropogenic factors on the NDVI based on local statistical bureau information. IBM SPSS statistical software is used for the analysis of the NDVI. By utilizing 22 years of average the NDVI data, this study examines the correlation between the NDVI and the eight social factors.
2.3.4. Prediction model
2.3.4.1. Fourier function model
This paper predicts the future NDVI over the study area based on the historical data from 2000 to 2019. Three functions (i.e., the polynomial function, trigonometric function, and Fourier function) are selected for fitting the NDVI variation during 2000–2019. Then, the mathematical and statistical parameters (i.e., R2, SSE, and RMSE) were calculated to compare the capacities of these fitting functions. Finally, the best-fit process was selected to predict the future NDVI over the study area for 2020–2030.
2.3.4.2. CA-Markov model
The Markov chain is a “non-sequential” state of affairs process, where the state of the change process Sn at time n + 1 is only related to the state at time n and is not related to the state before Sn (Mokarram and Pham, 2022; Sun et al., 2022; Zhou et al., 2022). Thus, Pij represents the probability of shifting from a vegetation index type Ei to another type of Ej and is calculated as:
In this paper, the number of NDVI change-type areas in 2012 and the NDVI change-type area in 2015 are constructed as a Markov transfer matrix:
The NDVI type transfer state, where X(0) is the initial state vector, is calculated in this paper to obtain the probability of change of each the NDVI type in 2012 to each the NDVI type change in 2015 and the area size of each the NDVI type in 2017 and 2018 is inferred with this probability. The Markov model focuses on simulating quantitative changes. The CA model and Markov model were coupled to compensate for the deficiency of the Markov model in spatial analysis. Adaptive inertia mechanism-based meta-cellular automata simulations were applied to predict the distribution of each the NDVI type for 2020–2030.
2.4. Data preprocessing steps
To ensure the accuracy and consistency of the data, we adopted the following preprocessing steps:
1. The NDVI data preprocessing: Firstly, we used ArcGIS software and the maximum value composite method to eliminate the influence of clouds, atmosphere, and solar zenith angle, generating monthly the NDVI data. Next, we obtained the annual NDVI data by calculating the average values of the monthly data.
2. Data consistency processing: We projected all data to the same coordinate system and used ArcGIS to resample to achieve the same spatial resolution (1 km x 1 km). Furthermore, for the lower spatial resolution of the TRMM precipitation data, we applied the Kriging spatial interpolation method to achieve the same resolution.
3. Data synthesis: We integrated temperature, precipitation, and relative humidity data into yearly data for 1998–2019, ensuring they have the same temporal resolution. Then, we calculated the annual averages of the NDVI and meteorological data using the multivariate analysis - band collection statistics method.
4. Data clipping: By applying mask extraction and raster clipping, we retained the data required for the study area.
5. Data classification: Based on the spatial distribution of the meteorological data and the NDVI data, we divided them into five classes. At the same time, we classified the significance of the NDVI trends into five categories: significant degradation, moderately significant degradation, no significant change, moderately significant improvement, and significant improvement.
6. The NDVI spatial prediction preparation: Before conducting spatial predictions, we reclassified the NDVI, dividing it into five categories: Lower (<0.5), Low (0.5–0.6), Normal (0.6–0.7), High (0.7–0.8), and Higher (>0.8).
7. Correlated data selection: We selected eight statistical yearbook data closely related to the NDVI, including population density, GDP, industrial output, agricultural output, construction production output, forest area, grassland area, and cultivated land area, covering annual data from 1998 to 2019.
3. Results
3.1. Characteristics of NDVI time dimensional changes
In this study, we extracted the annual average NDVI values from raster images generated by the maximum value composite method and analyzed their temporal changes (Figure 2). We found that the NDVI values in Yunnan Province showed an overall upward trend, with an average NDVI of 0.768 and an annual increase of 0.00614. We also discovered that, over the 22-year period, the temporal changes in the NDVI values only experienced a continuous decline from 2009 to 2011, reaching the lowest point in 2011 and then steadily rebounding until 2014. These results indicate that the temporal changes in Yunnan Province’s NDVI values not only reflect a significant increase in vegetation but also exhibit only one substantial fluctuation, further justifying our selection of this study area. Moreover, based on the unique change trends in the study area, research on the temporal changes in NDVI values in the study area is more targeted and facilitates the identification of the main driving factors behind vegetation changes.
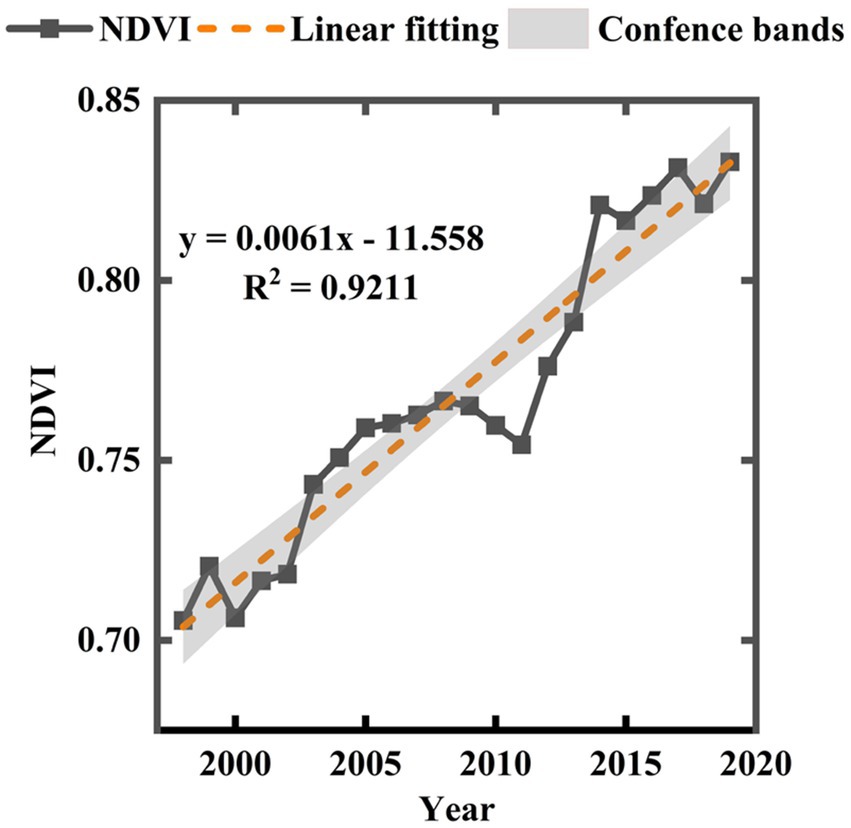
Figure 2. Temporal variation of NDVI in Yunnan from 1998 to 2019.
In this section, we have discussed in detail the temporal change characteristics of the NDVI, analyzing its change trends and patterns on different time scales. To gain a deeper understanding of the dynamic change characteristics of the NDVI, in the following sections, we will focus on studying the spatial distribution and changes in the NDVI.
3.2. Characteristics of NDVI spatial distribution variation
In this paper, we analyzed the spatial variation in the NDVI in Yunnan Province over a 22-year period using the maximum value synthesis method (Figure 3A). We found that high vegetation cover areas and higher vegetation cover areas in Yunnan Province accounted for 51.45 and 34.17%, respectively, and low vegetation cover areas accounted for 0.95%. The NDVI values in Yunnan Province show an overall increase from northeast to southwest, with scarce vegetation areas mainly in the northwest and some central urban peripheral areas; high vegetation areas are distributed primarily in the southwest, some significant sites, and the northeast Zhaotong (ZT) area. We analyzed the spatial trends of the NDVI in Yunnan Province over a 22-year period using a one-dimensional linear regression equation model at the metascale (Figure 3B). We found that the direction of increasing NDVI values accounted for 95.02% and decreasing NDVI values accounted for 4.98%, with a vast difference between the two. The NDVI values were only reduced in urban and mountainous areas, such as Kunming (KM) and Yuxi (YX) in the central part of the study area, and urban areas in Lijiang (LJ) and Dali (DL) in the north-central part of the study area as well as in the spreading areas of the Hengduan Mountains in the northwest. We further tested the significance of the regression trend by using the F-trend test method (Figure 3C). We found that the significant increase and decrease in the NDVI accounted for 89.3 and 0.3%, respectively. The size of regions with an increasing trend in the NDVI was much larger than that of sites with a decreasing trend. Among them, the NDVI was significantly reduced in urban areas such as Yuxi (YX) and Qujing (QJ), and there was no significant change in many places in the northwest mountain range area and other mountain range areas. The distribution trend is more dispersed and patchier.
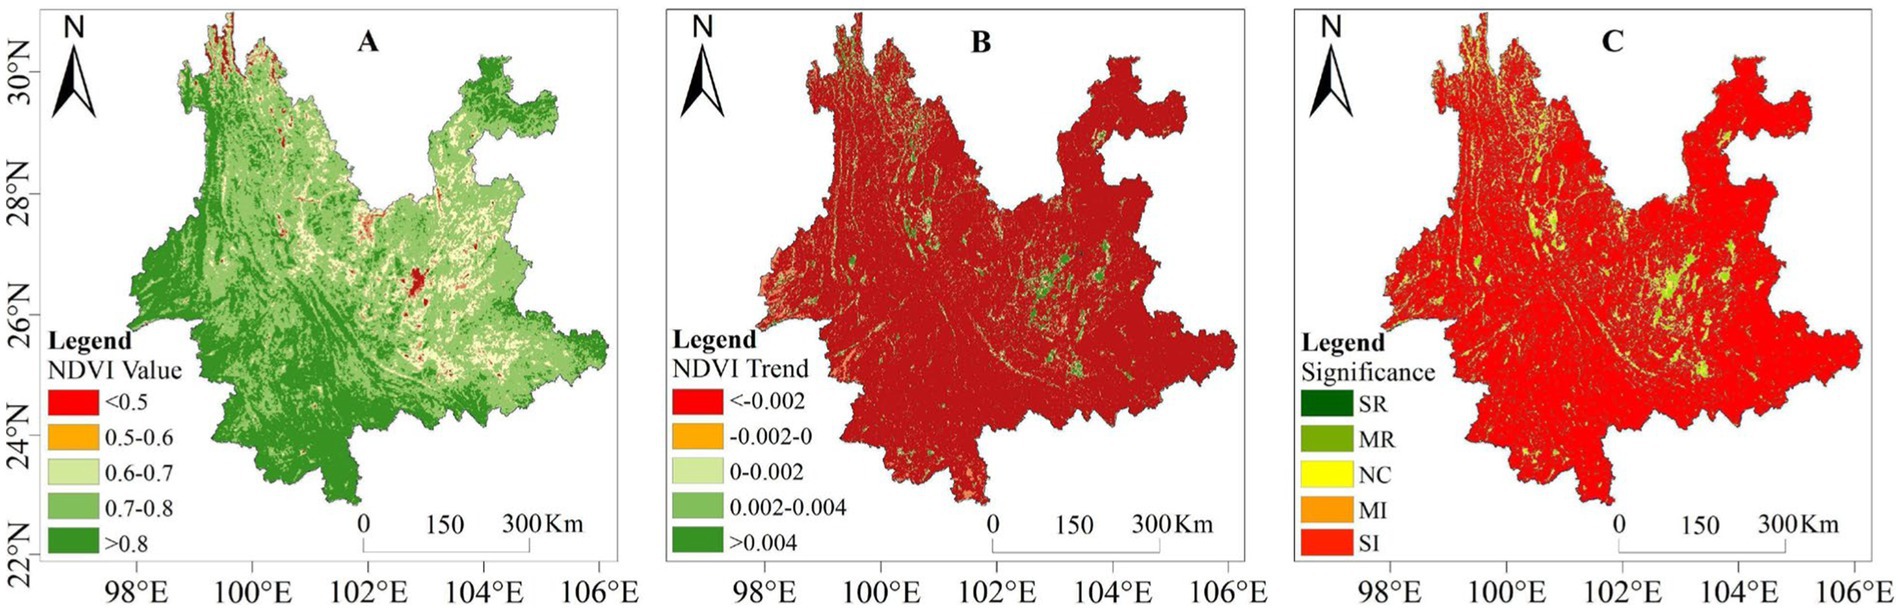
Figure 3. Spatial change and significance test distribution of NDVI in Yunnan from 1998 to 2019. (A) Spatial variation of NDVI values. (B) Trend changes in NDVI. (C) NDVI significance test. SR, significantly reduced; MR, moderately reduced; NC, no significant change; MI, moderately increased; SI, significantly increased.
Therefore, the spatial variation and spatial movement of the NDVI and the spatial trend significance test results indicate that the areas with high NDVI values and the regions with increasing trends are much greater than the areas with low NDVI values and areas with decreasing trends in Yunnan Province.
In this section, we explored the spatial change characteristics of the NDVI and analyzed its distribution patterns in detail. To gain a deeper understanding of the various factors influencing the spatiotemporal changes in the NDVI, in the following sections, we focused on investigating the impact of climatic and socio-economic factors on the NDVI and attempted to identify the relationships and mechanisms involved.
3.3. Correlation analysis of the NDVI and climate factors
3.3.1. Impact of air temperature, precipitation, and relative humidity on the NDVI time dimension
This paper analyzes the temporal variation between meteorological factors and NDVI values through the annual mean values of air temperature, precipitation, and relative humidity extracted from raster images generated by the maximum value synthesis method (Figure 4). In terms of temporal variation, we found that the multi-year averages of NDVI values, air temperature, precipitation, and relative humidity in Yunnan Province showed multi-peaked variations, with the annual average maximum value of NDVI occurring in 2019 at 0.833. The average yearly maximum values of air temperature, precipitation, and relative humidity occurred in 2019, 2001, and 2018, with maximum values of 15.7°C, 1377 mm, and 74.5%, respectively.
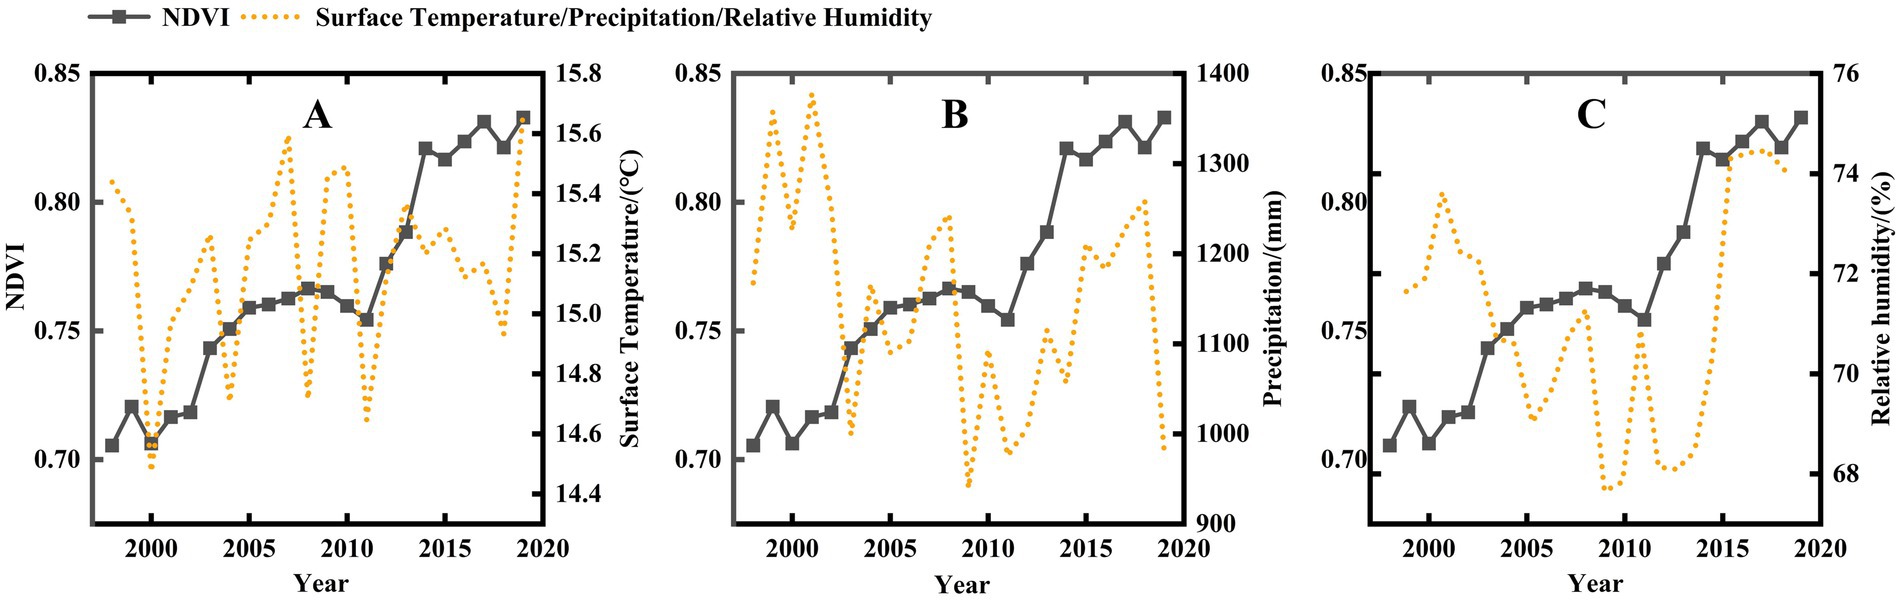
Figure 4. Evolution of annual mean air temperature, annual mean precipitation, and annual mean relative humidity in Yunnan from 1998 to 2019. (A) Time variation of NDVI and temperature. (B) Time variation of NDVI and precipitation. (C) Time variation of NDVI and relative humidity.
We further found that by comparing the temporal variation in NDVI values over the years the temporal variation in the NDVI values from 1998 to 2002 was not insignificant, while air temperature reached a minimum value of 14.5°C in 2000 and precipitation and relative humidity were much higher than other years during this period; the annual average NDVI values from 2014 to 2019 were much higher than other years, and vegetation grew better. However, the air temperature during this period differed significantly from the NDVI temporal variation, while precipitation and relative humidity were in solid agreement with the NDVI temporal variation. Therefore, air temperature showed a negative correlation with NDVI material changes, and precipitation and relative humidity correlated positively.
3.3.2. Effects of air temperature, precipitation, and relative humidity on the spatial dimension of the NDVI
This paper uses the maximum value synthesis method to process the three examined meteorological data into an overall average of 22 years to generate spatial variations in raster images (Figure 5). In terms of spatial variation, combined with (Figure 3), we found that the spatial distribution in the NDVI with air temperature, precipitation, and relative humidity all showed a decreasing trend from south to north. The relative humidity matched the spatial distribution of the NDVI the best.
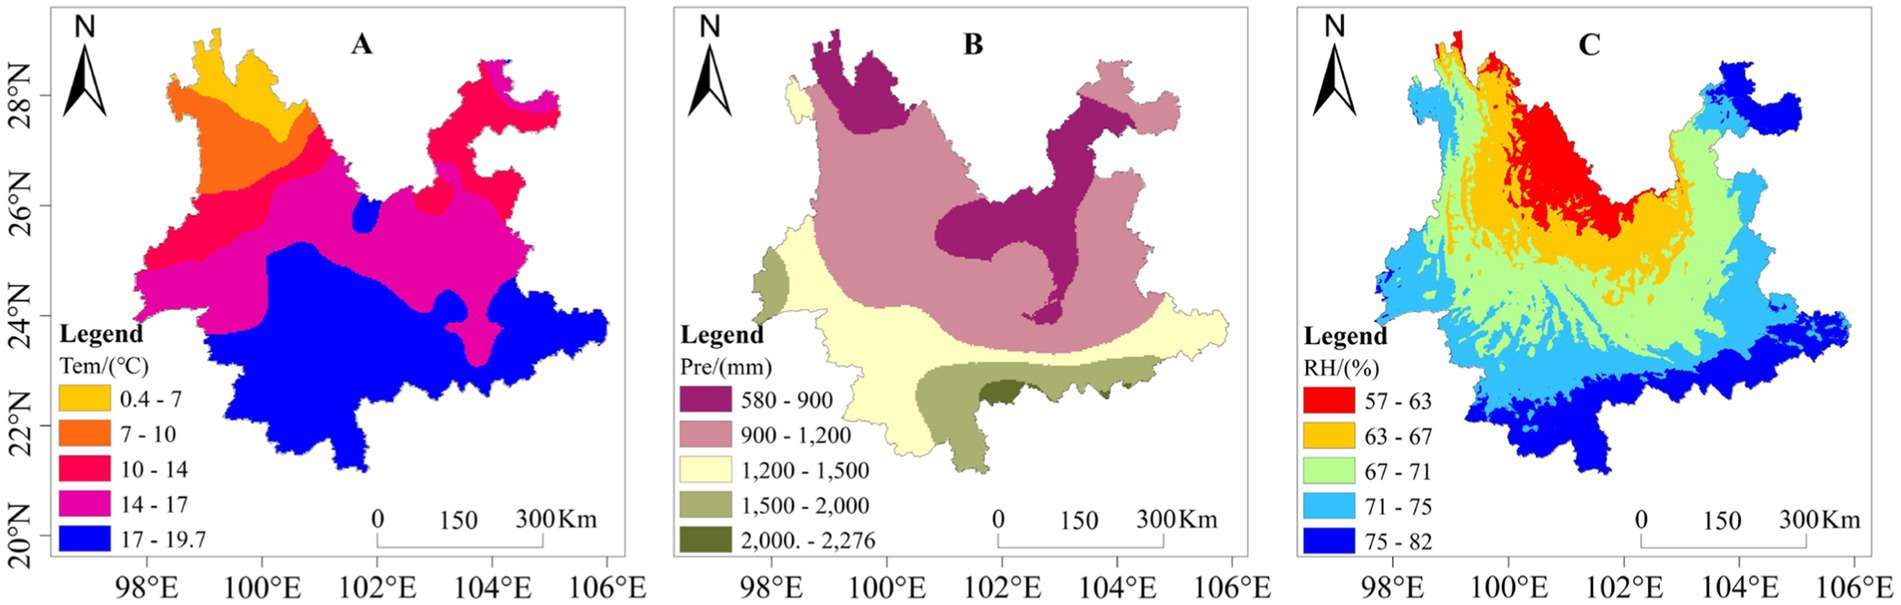
Figure 5. Spatial characteristics of air temperature, precipitation and relative humidity in Yunnan, 1998–2019. (A) Spatial distribution of temperature. (B) Spatial distribution of precipitation. (C) Spatial distribution of relative humidity.
We further found that the air temperature and relative humidity were numerically higher in the northeastern part of the study area, Zhaotong, at 15.5°C and 78.5%, respectively, while the precipitation was lower at 1050 mm, the NDVI was generally greater than 0.7, and the vegetation increased; in the central part of Kunming, the air temperature were higher at 16.9°C. The amount of precipitation and the relative humidity were lower at 67%, and 700 mm, respectively, and the vegetation did not increase as much as in the northern Zhaotong area. In the southern and southwestern parts of the study area, the air temperature, precipitation, and relative humidity were generally high in numerical values, 18.4°C, 2138 mm, and 79%, respectively, with the NDVI being 0.85, and the area observed the highest increase in vegetation. In the Northwest Transverse Range region, the air temperature, precipitation, and relative humidity were generally shallow, and vegetation showed an insignificant increase.
Therefore, there is some regional variability in the spatial variability and a spatial correlation between air temperature, precipitation, relative humidity, and the NDVI.
3.3.3. Partial correlation analysis between the NDVI and climatic factors
The related research results indicate that climate change is an important cause of increases in the NDVI, while air temperature, precipitation, and relative humidity are important indicators of climate change (Mao et al., 2022; Xu et al., 2022). Based on the findings of this paper on the temporal and spatial variation of the NDVI with air temperature, precipitation, and relative humidity, we further validated our results through a partial correlation model based on the image metric scale (Figures 6A–F).
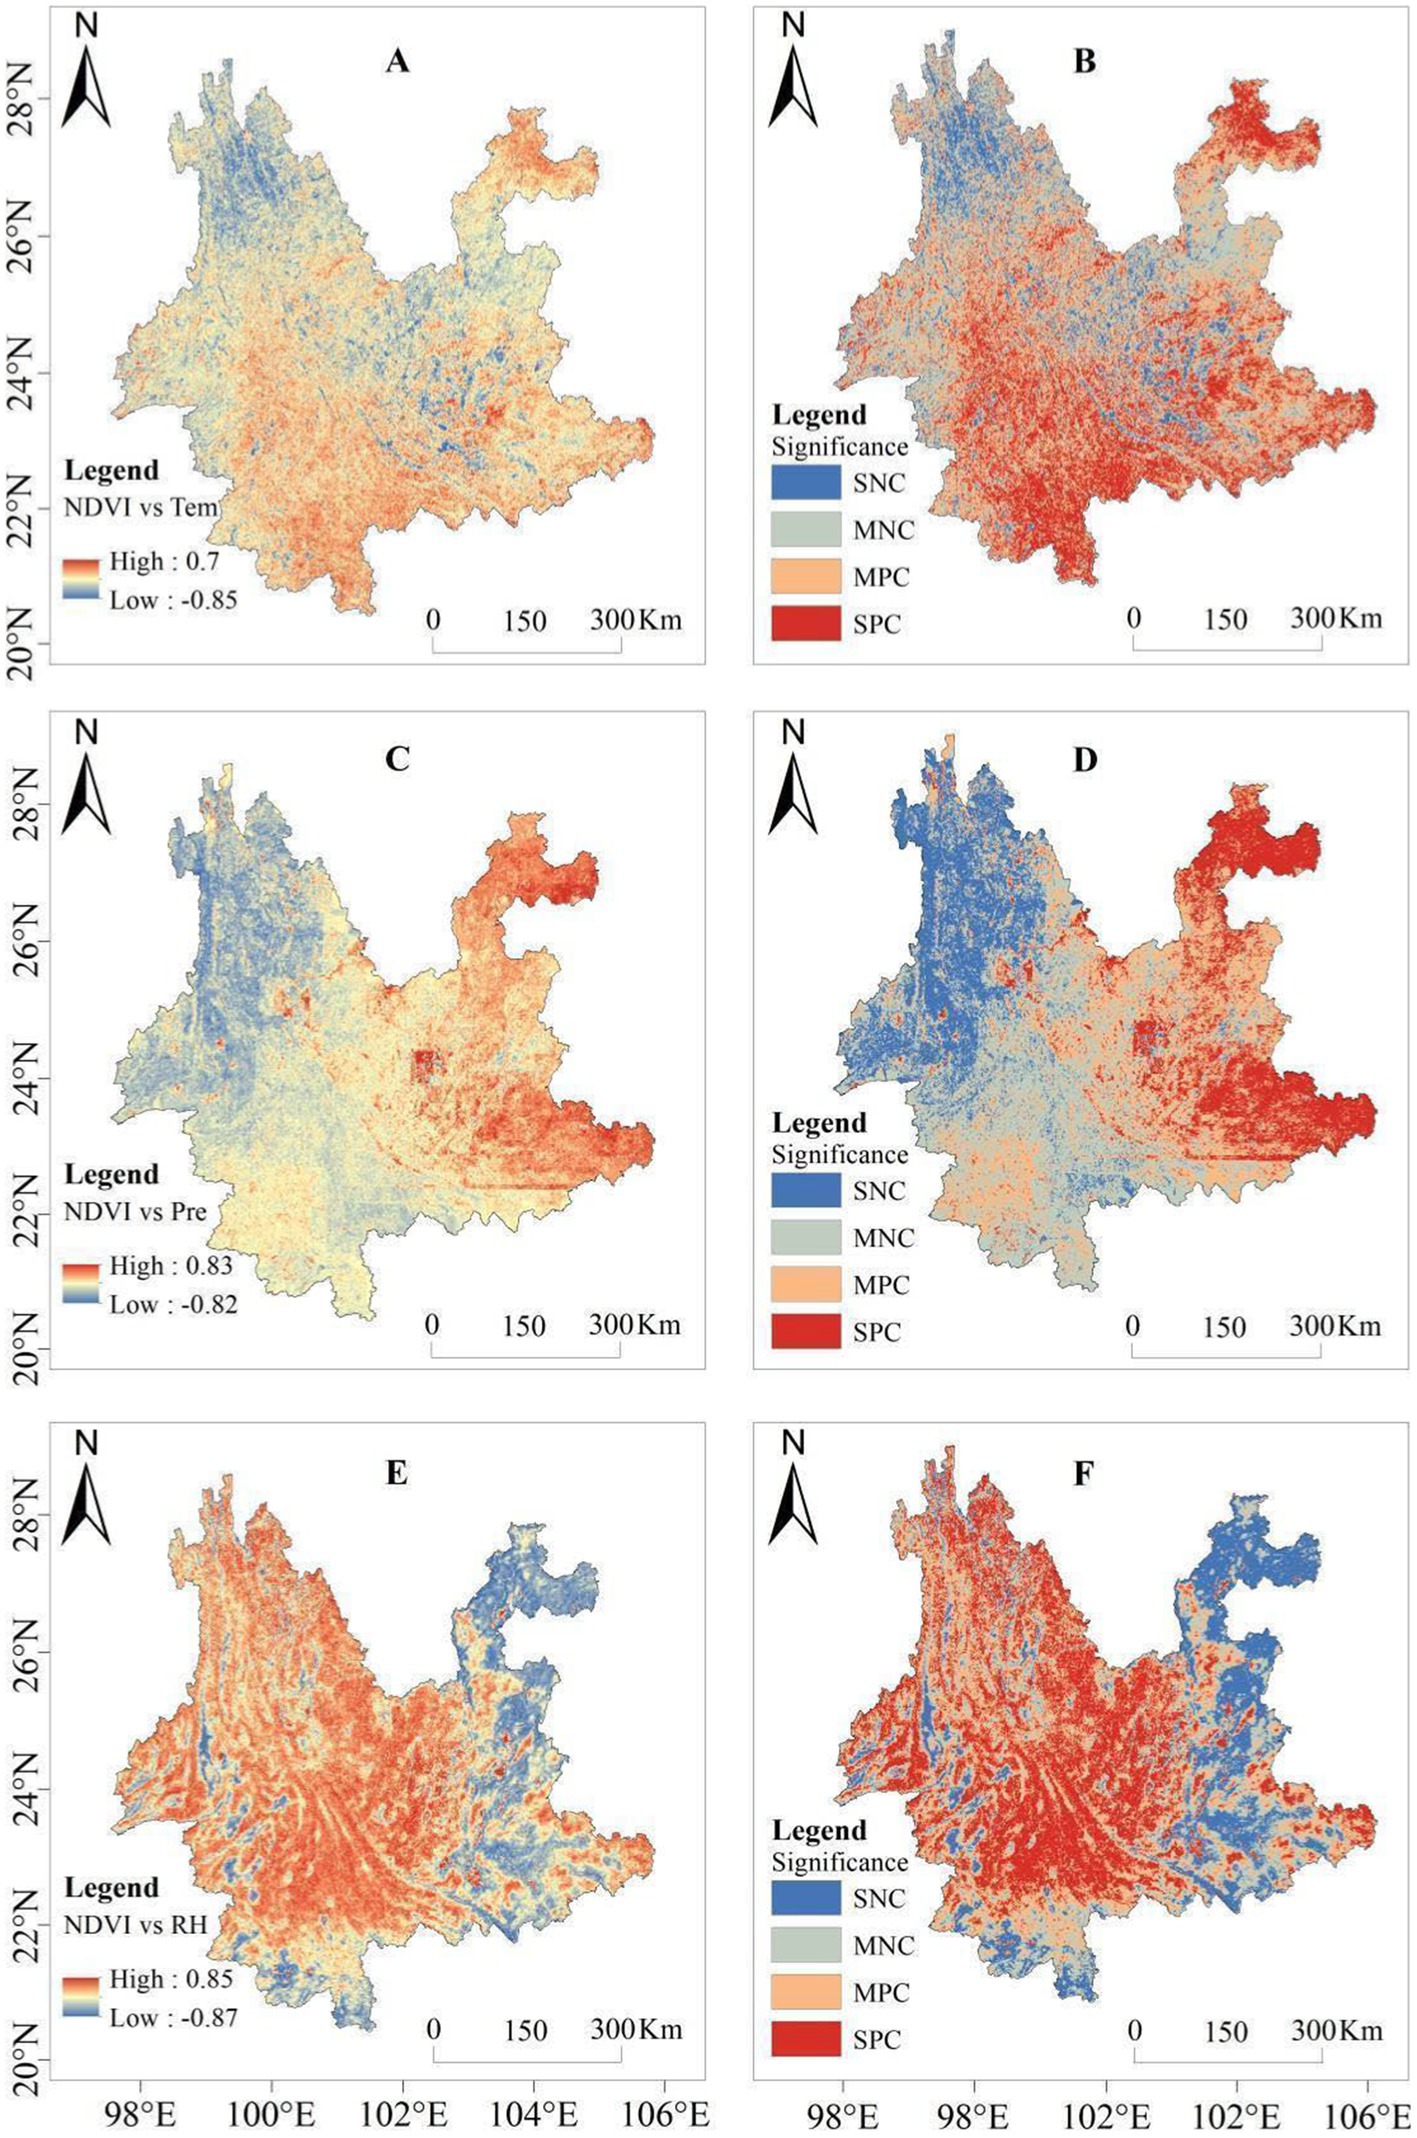
Figure 6. Partial correlation coefficients and significance of NDVI and meteorological factors in Yunnan Province from 1998 to 2019. (A) The partial correlation coefficient between NDVI and temperature; (B) the significance of the correlation between NDVI and temperature; (C) the partial correlation coefficient between NDVI and precipitation; (D) the significance of the correlation between NDVI and precipitation; (E) the partial correlation coefficient between NDVI and relative humidity, and (F) the significance of the correlation between NDVI and relative humidity. SNC, significantly negative correlation; MNC, moderately negative correlation; MPC, moderately positive correlation; SPC, significantly positive correlation.
We found an overall positive spatial correlation between the NDVI and air temperature, with this accounting for 61.6%. The positively correlated areas were mainly Pu’er (PE), Xishuangbanna (XSBN), Wenshan (WS), and Honghe (HH) in the south-central part of the study area. Negative correlations were dominant in areas such as Nujiang (NJ) in the northwestern part and Qujing (QJ) in the northeastern region. The positive and negative correlations were only 0.4% and were speckled in the study area. A total of 30.4% of the spatially negative correlations were found between NDVI and precipitation. The positive correlations were mainly in Zhaotong (ZT) and Wenshan in the northeastern part of the study area. The negative correlation was primarily in the central and western regions. Significant positive and negative correlation areas accounted for 1.70 and 11.20%, respectively. A significant positive correlation was found in southern Qujing (QJ) and Wenshan (WS) in the northeastern part of the study area. A significant negative correlation was found between Diqing and Nujiang (NJ) in the northwestern part of the study area. A total of 69.6% of the NDVI was spatially positively correlated with the relative humidity. The positive correlation areas were mainly Chuxiong (CX) and Yuxi (YX) in the central part of the study area and Pu′er (PE), Lincang (LC), and Baoshan (BS) in the west. The negative correlation was dominant in the Zhaotong (ZT) area in northeast China and Qujing (QJ) and Wenshan (WS) areas in south-central China. Significant positive and negative correlation areas accounted for 19.10 and 7.20%, respectively, with substantial positive correlation areas distributed in the central and western Dali (DL), Chuxiong (CX), and Lincang (LC) regions. The significant negative correlations were distributed in the local areas of Zhaotong (ZT), Qujing (QJ), and Wenshan (WS) in the north. They were especially significant in Zhaotong (ZT) and Qujing (QJ).
Figure 5 shows the spatial distribution of temperature, precipitation, and relative humidity within the entire study area, which helps to explain the differences in the spatial correlations between the NDVI and the climatic factors observed in Figures 6A–F. Notably, in Figure 5, we found that the spatial distribution of relative humidity was most closely aligned with the spatial distribution of the NDVI, which is consistent with the highest positive spatial correlation between the NDVI and the relative humidity shown in Figures 6A–F. It is the spatial distribution differences in the climatic factors within the study area, as shown in Figure 5, that cause significant disparities in the spatial correlations between the NDVI and climatic factors in various parts. These differences contribute to our in-depth understanding of the impact of climate change on vegetation growth in different regions, thereby providing a basis for developing appropriate vegetation conservation and management strategies.
Therefore, there is some regional variability in the spatial correlation between the NDVI and meteorological factors, which is consistent with previous findings (Cheng et al., 2022). There is an overall positive spatial correlation between the NDVI and air temperature and relative humidity, with the highest positive spatial correlation with relative humidity. The negative spatial correlation being with precipitation further suggests that a combination of meteorological factors influences the NDVI.
3.4. Characteristics of NDVI time dimensional changes
A social–ecological system (SES) is a complex adaptive system closely linked between humans and nature, with unpredictable, self-organizing, and non-linear characteristics, and vegetation is an essential part of the ecosystem with it being more inextricably linked with society (Tong et al., 2016). In this paper, we analyzed the correlation between the NDVI of vegetation and eight social factors in Yunnan Province from 1998 to 2019 by using a bias correlation model (Table 1). As seen in Table 1, the NDVI had the strongest positive correlation with population density (R2 = 0.951) and the weakest positive correlation with arable land. The NDVI was negatively correlated with agricultural and pasture area changes with R2 of −0.460 and −0.724, respectively. There were also strong positive correlations between the NDVI and changes in gross product, industry, gross construction product, and forest area.
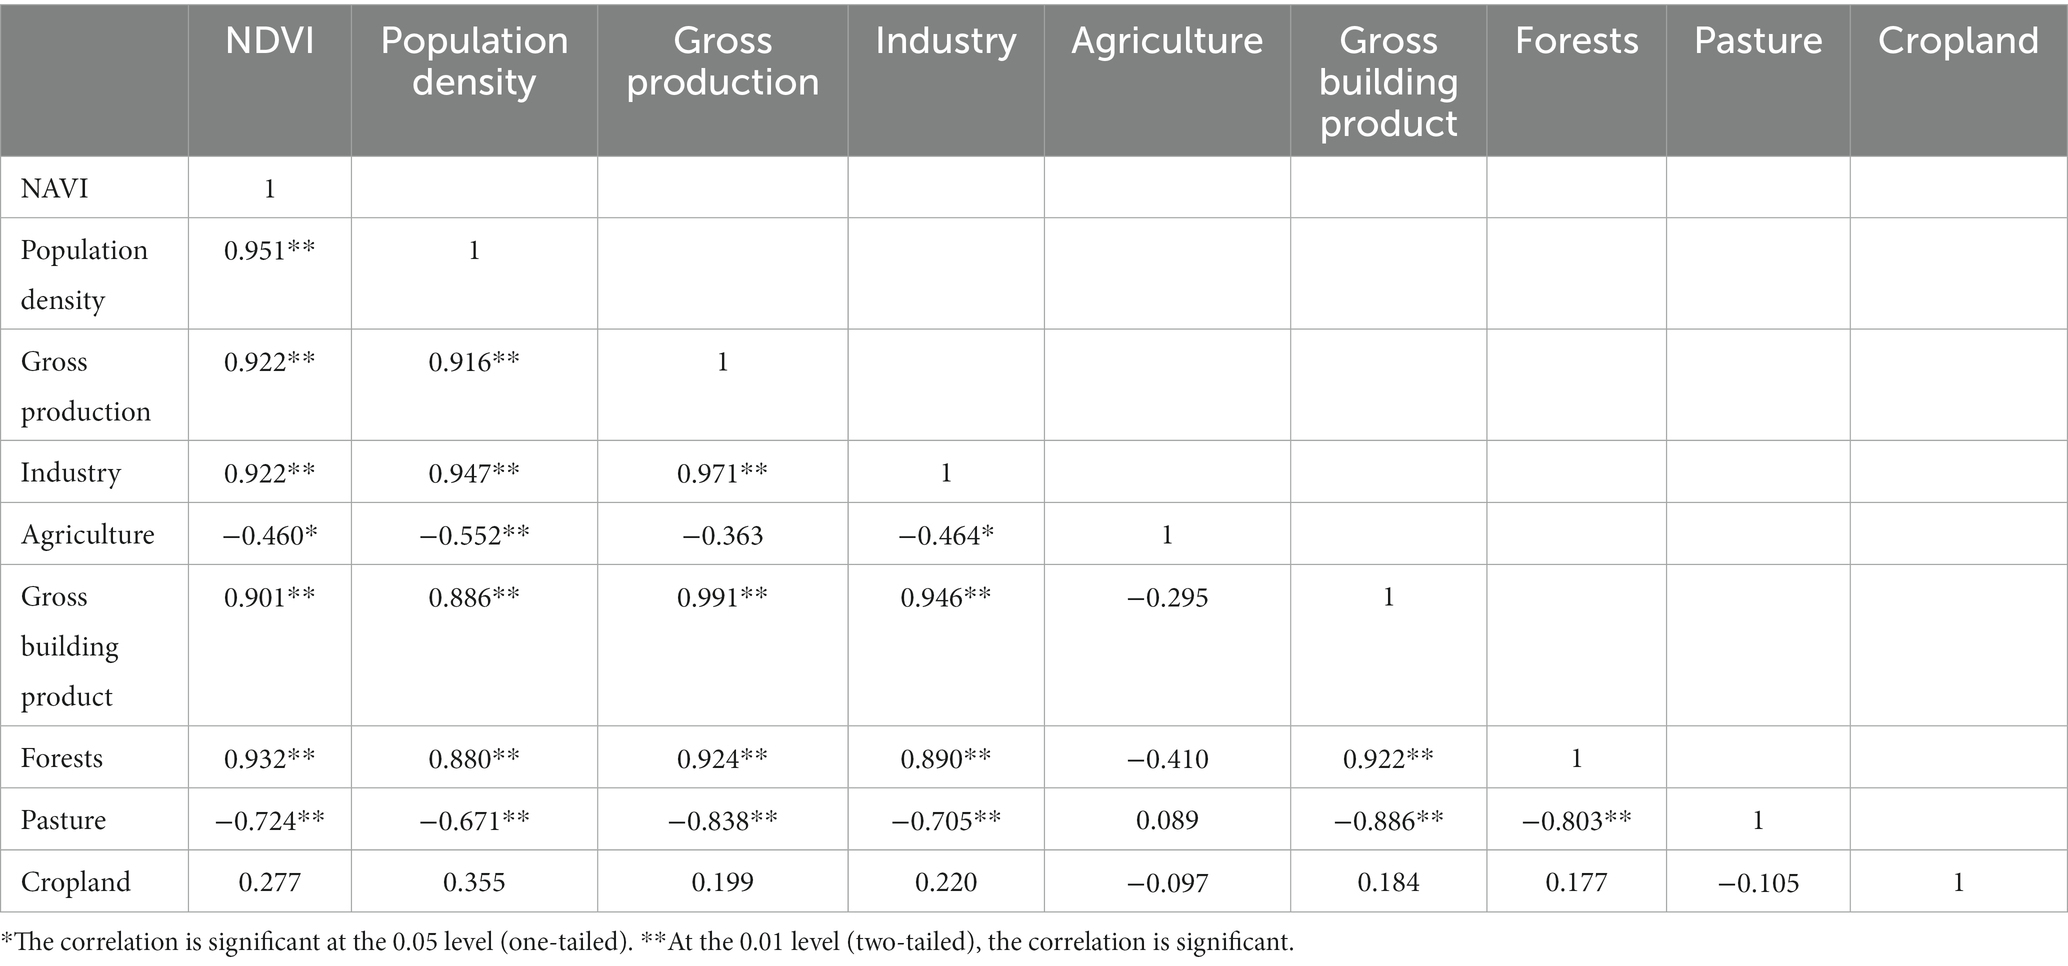
Table 1. Correlation between NDVI and social factors in Yunnan, 1998–2019.
Following our previous research, we have gained a thorough understanding of the spatiotemporal distribution characteristics of the NDVI and analyzed the influence of climatic and socio-economic factors on the NDVI. In the following sections, we employed advanced modeling methods to precisely simulate and predict the NDVI in both temporal and spatial dimensions.
3.5. Normalized vegetation index spatial and temporal simulation projections for 2020–2030
3.5.1. Impact of air temperature, precipitation, and relative humidity on the NDVI time dimension
A linear function and two periodic functions were constructed to fit the annual NDVI temporal variation for 1998–2019 (Table 2). The results show that the polynomial function includes the linear function better. In addition, the periodic functions (Fourier and trigonometric functions) performed much better than the linear function (primary function). The accuracy analysis (Table 2) showed that the Fourier function was the best-fitted function among the three functions constructed in this study. It effectively depicted the annual NDVI time-series variation in the study area.
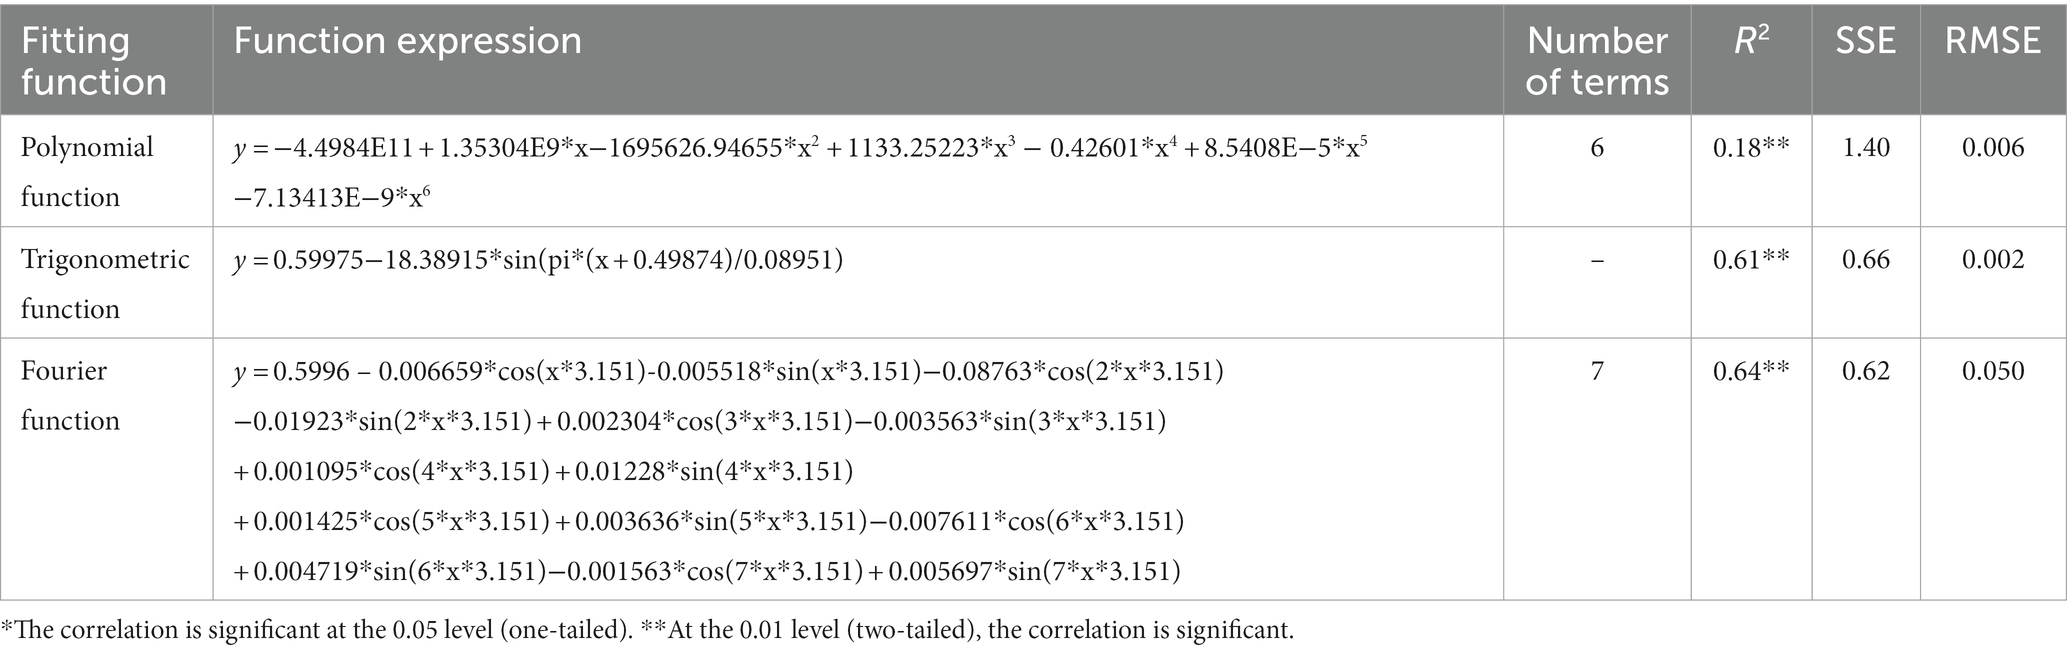
Table 2. The accuracy analysis of the results by different fitting functions.
The results of the prediction of the NDVI in Yunnan Province from 2020 to 2030 using the constructed Fourier function show (Figure 7) that the NDVI values in Yunnan Province show fluctuating changes. However, the NDVI values show a slight upward trend in general (0.0015/per year), reaching a maximum weight of 0.703 in September 2027 and a minimum of 0.498 in March 2030.
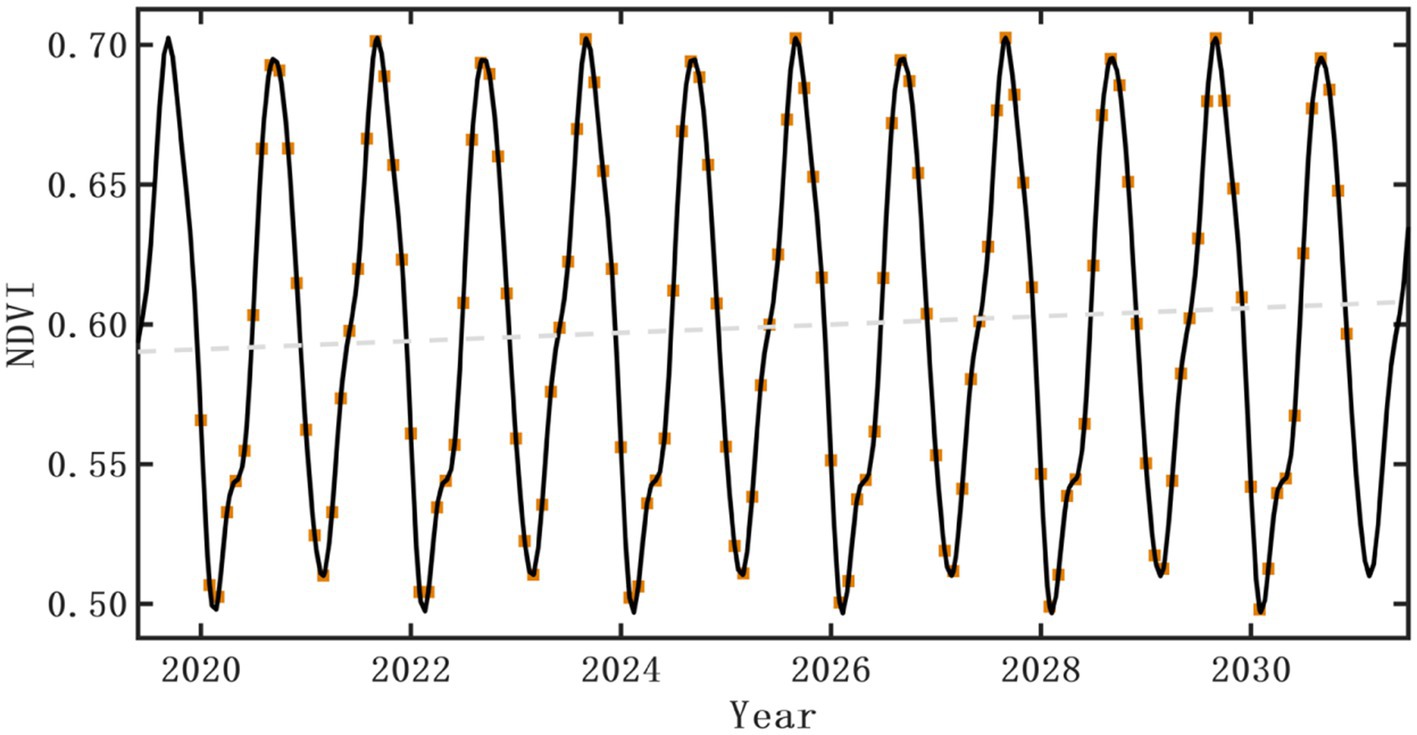
Figure 7. Fourier function model fitted prediction results of NDVI values for 2020–2030. The brown box represents the monthly NDVI values, the solid black line represents the finished prediction results, and the gray dashed line represents the linear fit. The linear fit function is y = 0.0015*x-2.4.
3.5.2. Modeled prediction of NDVI spatial distribution in 2020–2030
In this paper, based on the regional NDVI data of 2012 and 2015, the probability transfer matrix of each type of NDVI from 2012 to 2015 was obtained. The simulated data for 2017 and 2018 were obtained using the CA-Markov model. The decomposition results of the NDVI for 2017 and 2018 were compared with the simulation results (Figure 8). The simulation results were also verified with Kappa coefficients. The predicted Kappa coefficient values of the NDVI for 2015 and 2018 were 0.8086 and 0.806, respectively (generally, when the Kappa coefficient is greater than or equal to 0.75, the simulation prediction is considered to be more accurate) (Fu et al., 2018), so the simulation prediction of each type of NDVI change passed the accuracy test.
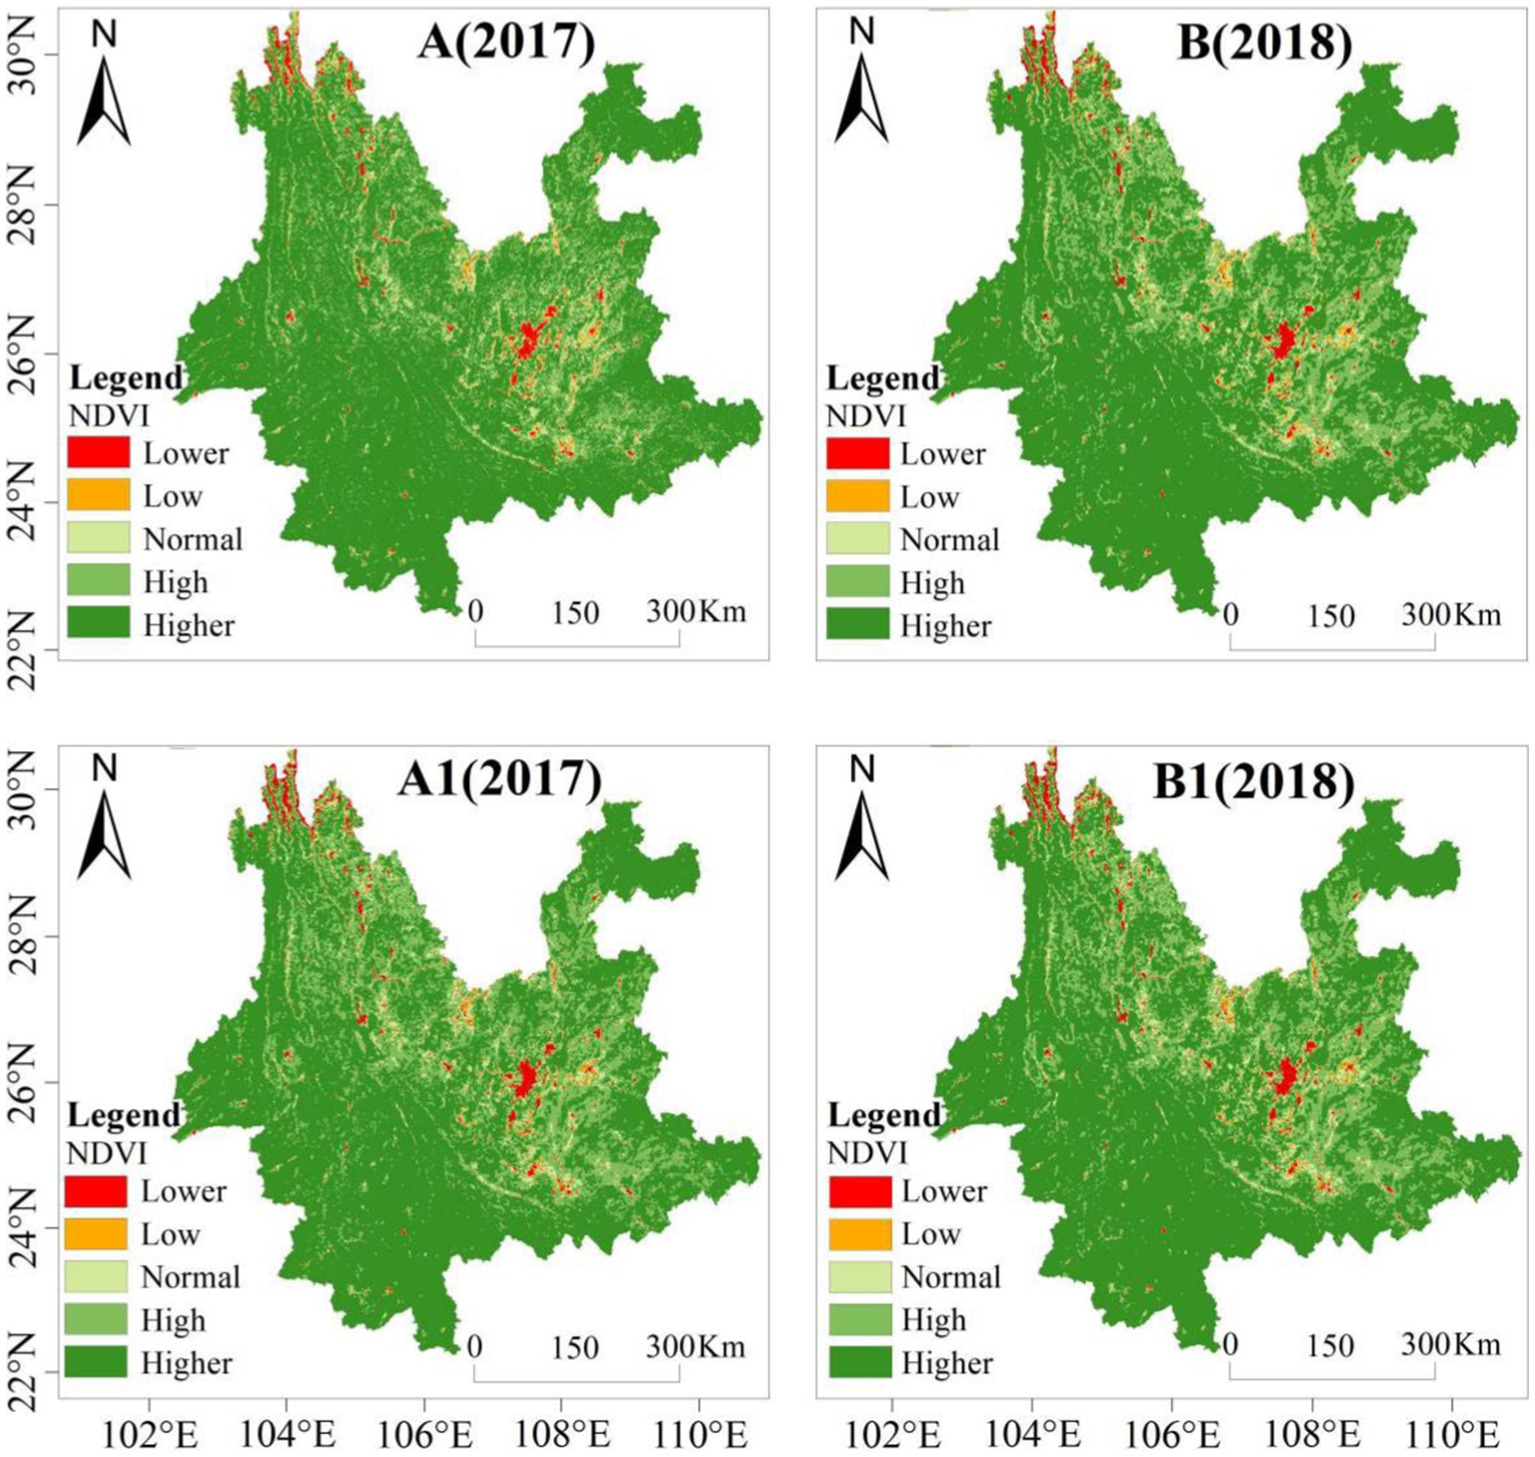
Figure 8. Comparative analysis of NDVI accuracy projections for 2017 and 2018. (A,B) Represent the original images for 2017 and 2018, respectively, while (A1,B1) represent the simulated prediction images. Note that lower indicates NDVI values <0.5; low represents NDVI values 0.5–0.6; normal denotes NDVI values 0.6–0.7; high corresponds to NDVI values 0.7–0.8; higher signifies NDVI values >0.8.
In this paper, the CA-Markov model further predicted the spatial variation in the NDVI values from 2020 to 2030 (Figure 9). Combined with Figure 10, we found that the NDVI Lower type will basically remain unchanged over the next 11 years from 2020 to 2030 and is still distributed in urban areas and the northwestern highlands. The NDVI Low type decreased by 0.4%. The NDVI Normal and High types decreased by 0.9 and 2.8%, respectively, while the NDVI Higher type increased by 4%. This indicates that the NDVI Normal and High types were transformed into Higher types, where by the decreasing and increasing areas were mainly distributed in the northwestern and eastern regions, respectively, with a scattered distribution. Therefore, the vegetation in Yunnan Province still has a clear increasing trend from 2020 to 2030.
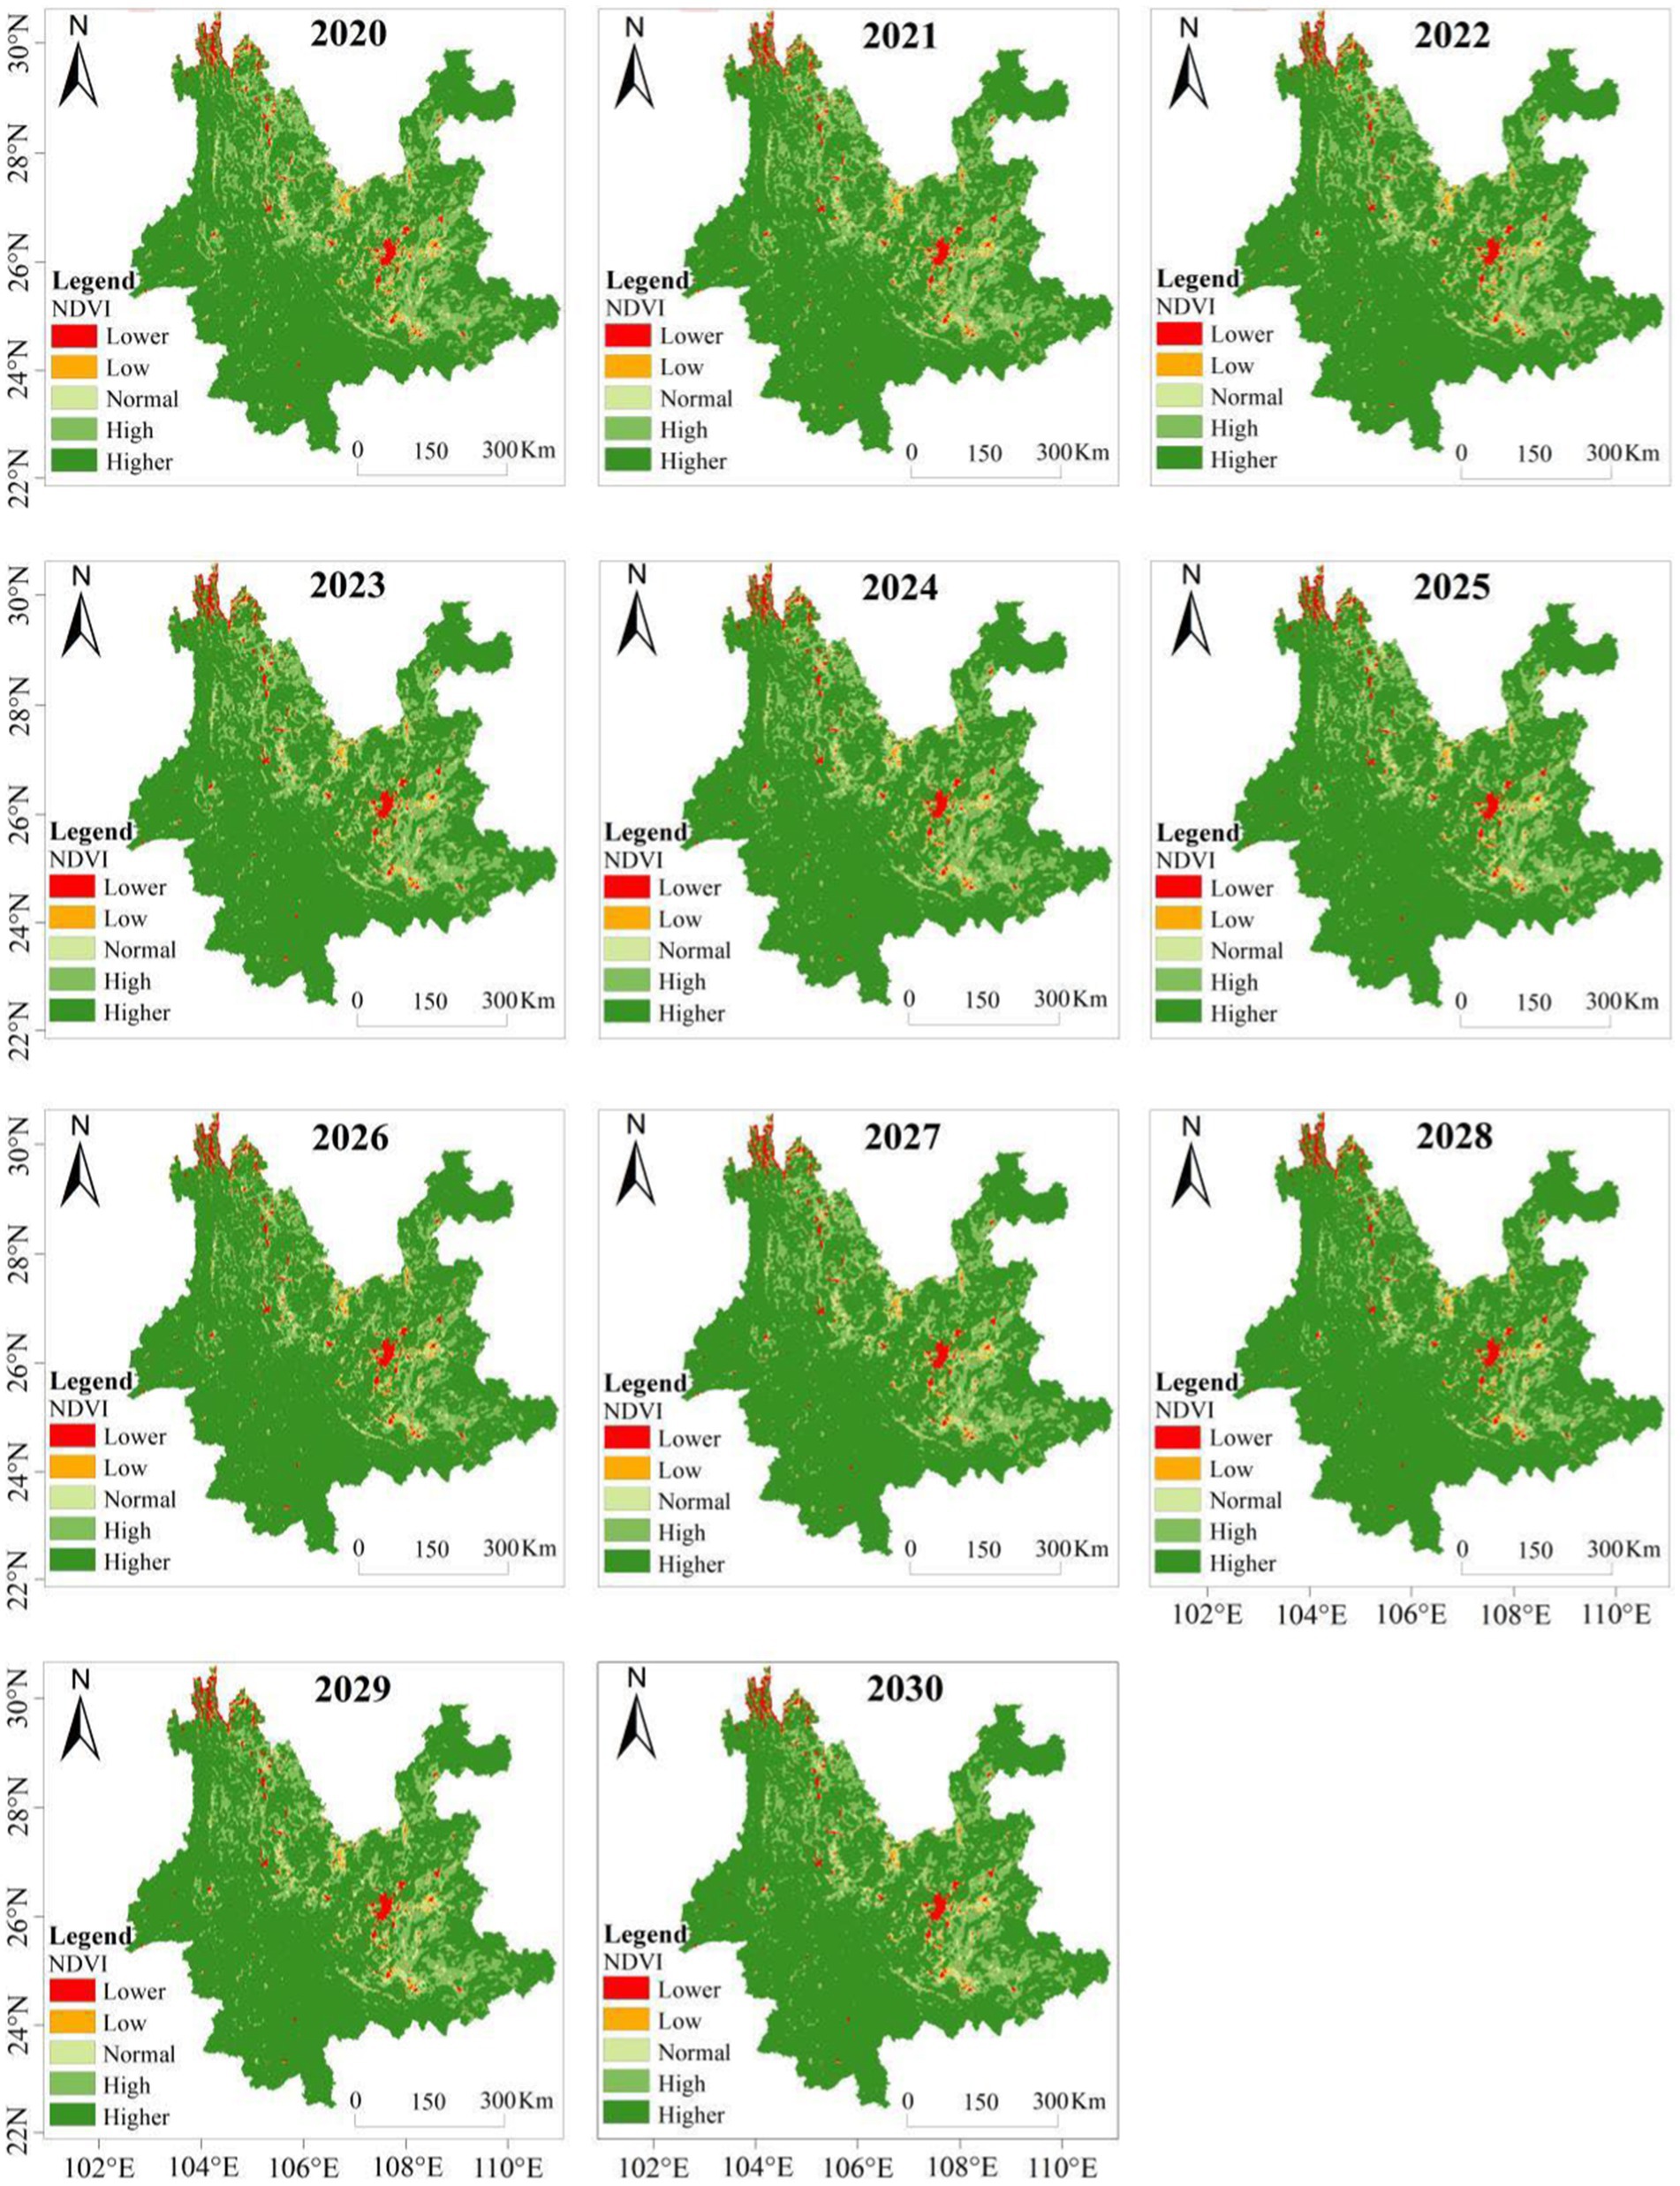
Figure 9. Projected spatial distribution of NDVI in Yunnan Province from 2020 to 2030.
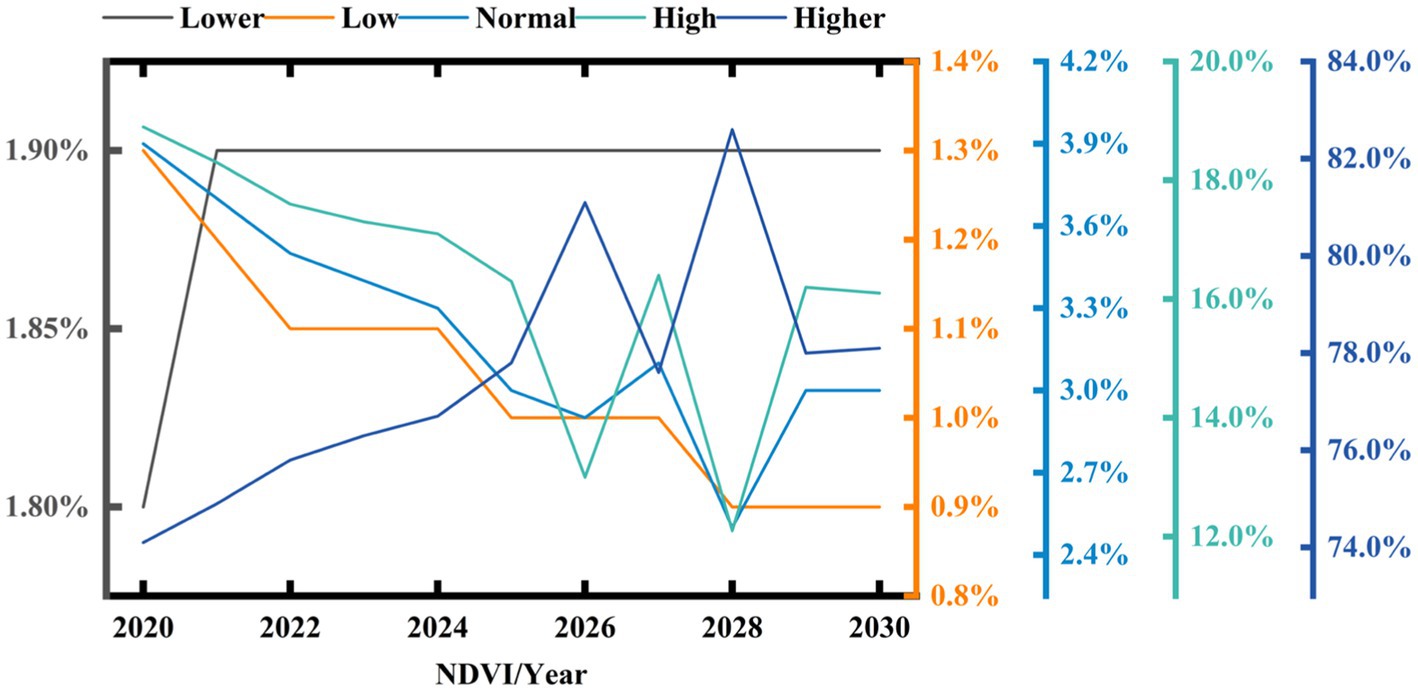
Figure 10. Percentage change of NDVI by type in Yunnan from 2020 to 2030.
Up to now, we have comprehensively understood the spatiotemporal distribution characteristics of the NDVI in the study area, the degree of influence of climatic factors on the NDVI, and successfully predicted the spatiotemporal change trends of the NDVI in the study area for 2020–2030. In the subsequent sections, we will continue to delve deeper into the relevant issues highlighted by these findings to ensure that our research conclusions are more rigorous and logical.
4. Discussion
4.1. Spatial and temporal distribution of the normalized difference vegetation index
Studying changes in vegetation dynamics in Yunnan Province is essential to improve vegetation ecological vulnerability assessment, especially as a result of climate change (Fernández et al., 2012; Min et al., 2015; Wang et al., 2016). In this study, we found a high increase in vegetation cover in Yunnan Province over the past 22 years (Figures 2, 3), with an annual growth rate of 0.00614, like previous results based on VIs (Li et al., 2021; Sun et al., 2021b). We also found that the temporal variation in NDVI values showed a significant decreasing trend in the mean NDVI values around 2011, with a faster rate of vegetation recovery in the subsequent years. On the one hand, this is attributed to the fact that meteorological factors (Figure 4) were at low values in around 2011, which made it unsuitable for vegetation growth. On the other hand, during this period, when the 11th and 12th Five-Year Plans converged, the development of industry and agriculture was promoted nationwide, and many natural areas in Yunnan Province were reclaimed. A total of 24.4% of agriculture and 56.7% of industrial enterprises above the scale were increased cumulatively in 4 years. The scale of arable land and buildings was fully expanded, and the vegetation growth environment was damaged, resulting in a sharp decrease in natural vegetation.
The spatial variation in NDVI values shows a trend of decreasing from south to north (Sun et al., 1998; Xie et al., 2021). The low NDVI values are mainly in the northwestern plateau, Gobi region, and urban areas. The plateau Gobi region indicates that the natural environment primarily influences vegetation, while the urban areas suggest that human activities affect vegetation changes. The higher NDVI values in the southern and southwestern regions are due to the favorable climate and more distribution of rivers in these regions, on the one hand, and a greater emphasis on vegetation ecosystem construction in these regions. Regarding spatial trend changes in NDVI values, vegetation in northwestern Yunnan Province is severely reduced, while vegetation in the southern and southwestern areas is better developed. This shows that the trend of plateau globalization in the northwest is due to the harsh natural environment. However, a series of policy measures implemented by the state to improve the ecological environment, such as ecological restoration and the planting of plantation forests, enhanced the environmental climate in the northwest (Du et al., 2019; Hu et al., 2022); more time is still needed for the poorer economy and small population in the northwest. In contrast, the environment is very suitable in the southern and southwestern regions, the population density is low, and the vegetation improvement shows more of a natural progression.
4.2. Effects of temperature, precipitation, relative humidity, and social factors on the normalized difference vegetation index
Meteorological factors influence vegetation growth, providing vegetation’s necessary water and heat conditions (Aili et al., 1907). Air temperature, precipitation, and relative humidity are the main controls among meteorological factors that affect vegetation index changes (Jiang et al., 2019). We found that the vegetation index showed a significant decreasing trend in regions with lower air temperature, precipitation, and relative humidity, most likely due to the inconvenience caused by low temperature, low precipitation, and low humidity regions to the natural growth of vegetation and the artificial cultivation of vegetation and other behaviors. Therefore, beneficial human activities in warmer climatic regions are conducive to increasing vegetation growth and the vegetation index.
Our analysis of the biased relationship between vegetation and meteorological factors revealed an overall positive spatial correlation between the NDVI and air temperature and relative humidity, with the highest positive spatial correlation being with relative humidity. In addition, there is a negative spatial correlation between the NDVI and precipitation, further indicating that the NDVI is affected by multiple meteorological factors. It was found that air temperature and relative humidity had different effects on the growth and development of vegetation at various stages due to climate warming. In general, they promoted vegetation growth (Liu et al., 2018). We further found that the areas with a negative correlation between the NDVI and precipitation were mainly in the south-central region, attributed to the fact that this region is mostly in the tropics, where precipitation itself is high. If precipitation increases further, it will weaken vegetation photosynthesis and, thus, reduce vegetation.
In addition, the vegetation/land change caused by human activities is the main factor that affects the NDVI (Zhang et al., 2016; Bai and Li, 2022) and an essential driver of vegetation cover change (Zhang et al., 2011, 2019). We found the strongest positive correlation between the NDVI values and population density. Negative correlations were found with changes in agricultural and grazing land areas. The influence of population density on vegetation dominated densely populated areas, cities, and peri-urban areas. The balanced population growth in Yunnan Province has exceeded 20% in the last 22 years. The continuous rise of economic growth and urban population has led to the expansion of metropolitan construction land area, resulting in a decreasing trend in vegetation cover in some areas. Still, overall, it remained significantly and positively correlated with the NDVI, stemming from the concentrated distribution of population growth in the study area.
We found that NDVI values were negatively correlated with changes in agricultural and grazing land areas. The increase in agriculture is attributed to the fact that, on the one hand, it represents an increase in agricultural land. On the other hand, excessive agricultural exploitation destroys the natural environment, causing problems such as land desertification, soil erosion, and soil pollution, which in turn leads to a significant decrease in vegetation cover. The livestock industry in the study area is more developed and has been further developed in recent years, leading to a further increase in grazing land. The increase in grazing land represents an increase in grazing, which mainly transforms the vegetation structure morphology and reduces the vegetation cover through behaviors such as animal foraging and trampling.
The NDVI is also significantly and positively correlated with GDP, industry, and construction GDP, indicating that improved socio-economics can increase natural vegetation cover. Since the 21st century, the state has attached great importance to preventing and controlling stone desertification and ecological restoration in Yunnan. It has implemented a series of environmental engineering measures that have played a vital role in the restoration of vegetation, not only improving the vegetation cover in the study area but also playing an essential role in improving the survival environment of vegetation communities, effectively reducing the degree of regional stone desertification, and improving the regional vegetation cover (Cheng et al., 2022).
Combining the results shown in Figure 6, we found that climatic and social factors synergistically affected vegetation index changes. The vegetation growth in the study area was positively and negatively inhibited by social factors, and the overall positive promotion of regional vegetation growth dominated. The development of ecological projects has led to an increase in vegetation cover. Still, the inhibitory effect of unreasonable human development in the development of the economy on vegetation growth should be addressed.
4.3. Normalized vegetation index spatial and temporal simulation prediction
In this paper, three functions were used to fit the time series of the historical NDVI in Yunnan Province, and it was found that the periodic function of the Fourier function performed the best. Roy et al. predicted future changes in the NDVI by using machine learning methods, but large data sets are needed for prediction (Ahmad et al., 2023). In contrast, this paper predicts the NDVI in Yunnan Province based on historical NDVI data in a simple and effective mathematical, statistical way (i.e., Fourier function). As confirmed by previous studies (Tchepel and Borrego, 2010; Güler and Özcan, 2019), these studies also used the Fourier function for analysis and prediction. Notably, the curve fit predicted using monthly data was better than that indicated by their use of interannual data by comparing it with Zhou et al. (2022). Thus, the Fourier function model was more suitable for relevant monthly data. In addition, the current use of CA-Markov models lies mainly in the simulation and prediction of land use patterns (Xu et al., 2022; Luan et al., 2023), and fewer research cases have been used for the simulation and prediction of the NDVI, which, as a type of cover, is a dynamic change in land cover. Simulating and predicting a single vegetation change is more straightforward than the interconversion between different land use types. Simulating and predicting a single vegetation change is shorter than the interconversion between different land use types.
Of course, there are uncertainties in the prediction set out in this paper. In time series prediction, the Fourier function is a mathematical, statistical method that uses historical data to fit and predict the NDVI, limited by the information provided by historical data; in addition, it can superimpose periodic information from historical data into the future predicted values. In spatial distribution prediction, since this study is the first attempt to directly simulate and predict the NDVI distribution now using the CA-Markov model, it focuses on affecting the spatial and temporal patterns under natural evolutionary conditions. At the same time, NDVI change is a complex process influenced by various uncertainties such as nature, human activities, and land use development policies. Therefore, how to adjust the model parameters based on a comprehensive analysis and integrated consideration of the effects of multiple factors also needs to be further explored in depth. In response to these situations, it is strongly recommended to use new and better methods in future investigations.
5. Summary and conclusion
To further expand upon research on the vegetation index, this paper plans to take Yunnan Province as an example; in addition to studying the spatiotemporal distribution characteristics and specific driving mechanism of its vegetation index, a new spatiotemporal prediction method of the vegetation index is also added. In this paper, the normalized vegetation index (NDVI) data from 1998 to 2019, three meteorological factors, and eight social factors were used to analyze the topographic characteristics of the region. The dynamic change and driving mechanism of the NDVI were are studied using mean value analysis, univariate linear trend regression analysis, and partial correlation analysis. In addition, the Fourier function and CA-Markov models were used to predict the time and space of the NDVI in Yunnan Province from 2020 to 2030. The main conclusions are as follows:
1. From 1998 to 2019, the NDVI value of Yunnan Province showed a significant growth trend, and the annual growth rate was 0.00614. In terms of time, the NDVI value fluctuated but showed an upward trend. In space, the NDVI gradually increased from north to south.
2. The NDVI has a positive spatial correlation with air temperature and relative humidity and a spatial correlation with precipitation. The positive promotion of meteorological factors is more significant than negative inhibition. The partial correlation of relative humidity among the meteorological factors is the highest, which is the main driving factor.
3. The NDVI values had the strongest positive correlation with people, the weakest positive correlation with cropland, and a negative correlation with pasture and agricultural area.
4. In the time series prediction, The NDVI values in Yunnan Province fluctuated, but there was a slight upward trend in the NDVI values (0.0015/per year). In the spatial distribution projection, the vegetation in Yunnan Province still has a significant increasing trend from 2020 to 2030.
This study provides necessary theoretical support for NDVI simulation and forecasting. The predicted NDVI values offer valuable information for decision-makers and strategists in ecological environments.
Data availability statement
The raw data supporting the conclusions of this article will be made available by the authors, without undue reservation.
Author contributions
YH, YL, and PZ: conceptualization, methodology, visualization, and writing – first draft. YH and PZ: software and funding acquisition. YL, JD, and ZC: validation. YH: formal analysis and investigation. JD and ZC: supervision. PZ: writing – review and editing. All authors contributed to the article and approved the submitted version.
Funding
This research was funded by the National Natural Science Foundation of China (grant no. 41761081), The Basic Research Program of Yunnan Province (grant no. 202201AU070112), The Kunming University of Science Technology introduced talent research start-up fund project (grant no. KKZ3202021055), and Yunnan Province Philosophy and Social Science Planning Project (grant no. PY202129).
Acknowledgments
The authors would like to thank the researchers who have provided the open-source algorithms, which have been extremely helpful to the research in this manuscript.
Conflict of interest
The authors declare that the research was conducted in the absence of any commercial or financial relationships that could be construed as a potential conflict of interest.
Publisher’s note
All claims expressed in this article are solely those of the authors and do not necessarily represent those of their affiliated organizations, or those of the publisher, the editors and the reviewers. Any product that may be evaluated in this article, or claim that may be made by its manufacturer, is not guaranteed or endorsed by the publisher.
Footnotes
References
Ahmad, R., Yang, B., Ettlin, G., Berger, A., and Rodríguez-Bocca, P. (2023). A machine-learning based ConvLSTM architecture for NDVI forecasting. Intl. Trans. in Op. Res. 2020, 1–24. doi: 10.1111/itor.12887
Aili, A., Xu, H., Zhao, X., Zhang, P., and Yang, R. (1907). Dynamics of vegetation productivity in relation to surface meteorological factors in the Altay Mountains in Northwest China. Forests 2022:13.
Bai, Y., and Li, S. (2022). Growth peak of vegetation and its response to drought on the Mongolian plateau. Ecol. Indic. 141:109150. doi: 10.1016/j.ecolind.2022.109150
Chen, Z., Wang, W., and Fu, J. (2020). Vegetation response to precipitation anomalies under different climatic and biogeographical conditions in China. Sci. Rep. 10, 1–16. doi: 10.1038/s41598-020-57910-1
Cheng, Y., Zhang, L., Zhang, Z., Li, X., Wang, H., and Xi, X. (2022). Spatiotemporal variation and influence factors of vegetation cover in the Yellow River Basin (1982–2021) based on GIMMS NDVI and MOD13A1. Water 14:3274. doi: 10.3390/w14203274
Cheng, Z., Zhao, T., Zhu, Y., and Li, H. (2022). Evaluating the coupling coordinated development between regional ecological protection and high-quality development: a case study of Guizhou. China. Land. 11:e0228426 doi: 10.3390/land11101775
Du, Z., Zhao, J., Pan, H., Wu, Z., and Zhang, H. (2019). Responses of vegetation activity to the daytime and nighttime warming in Northwest China. Environ. Monit. Assess. 191:721. doi: 10.1007/s10661-019-7855-8
Fernández, G., María, E., Baival, B., and Batjav, B. (2012). Cross-boundary and cross-level dynamics increase vulnerability to severe winter disasters (dzud) in Mongolia. Global Environ. Chang. 22, 836–851. doi: 10.1016/j.gloenvcha.2012.07.001
Fu, X., Wang, X., and Jeffrey Yang, Y. (2018). Deriving suitability factors for CA-Markov land use simulation model based on local historical data. J. Environ. Manage. 206, 10–19. doi: 10.1016/j.jenvman.2017.10.012
Güler, E., and Özcan, B. (2019). PM2.5 concentration prediction based on winters’ and Fourier analysis with least squares methods in Çerkezköy district of Tekirdağ. Int. J. Environ. Pollut. Environ. Modell. 4, 8–16.
He, Y. J., Kong, Z., Hu, X., Zhang, J., Wang, M., Peng, C. H., et al. (2022). Water and heat conditions separately controlled inter-annual variation and growth trend of NDVI in the temperate grasslands in China. Acta Ecol. Sin. 42, 766–777. doi: 10.5846/stxb202101130143 (in Chinese)
Hédl, R., Bernhardt-Römermann, M., Grytnes, J., Jurasinski, G., and Ewald, J. (2017). Resurvey of historical vegetation plots: a tool for understanding long-term dynamics of plant communities. Science 20, 161–163. doi: 10.1111/AVSC.12307
Hu, J., Zhou, Q., Cao, Q., and Hu, J. (2022). Effects of ecological restoration measures on vegetation and soil properties in semi-humid sandy land on the Southeast Qinghai-Tibetan plateau. China. Glob. Ecol. Conserv. 33:e02000. doi: 10.1016/j.gecco.2022.e02000
Huang, W., Ge, Q., Wang, H., and Dai, J. (2019). Effects of multiple climate change factors on the spring phenology of herbaceous plants in Inner Mongolia, China: evidence from ground observation and controlled experiments. Int. J. Climatol. 39, 5140–5153. doi: 10.1002/joc.6131
Jiang, H., Xu, X., Guan, M., Wang, L., Huang, Y., and Liu, Y. (2019). Simulation of spatiotemporal land use changes for integrated model of socioeconomic and ecological processes in China. Sustainability 11:3627. doi: 10.3390/su11133627
Jin, K., Wang, F., Han, J. Q., Shi, S. Y., and Ding, W. B. (2020). Effects of climate change and human activities on vegetation NDVI change in China from 1982 to 2015. J. Geogr. Sci. 75, 961–974. doi: 10.11821/dlxb202005006 (in Chinese).
Li, J., Chen, Q., Li, Q., Zhao, C., and Feng, Y. (2021). Influence of plants and environmental variables on the diversity of soil microbial communities in the Yellow River Delta wetland. China. Chemosphere. 274:129967. doi: 10.1016/j.chemosphere.2021.129967
Li, C., Wang, J., Hu, R., Yin, S., Bao, Y., and Ayal, D. Y. (2018). Relationship between vegetation change and extreme climate indices on the Inner Mongolia plateau, China, from 1982 to 2013. Ecol. Indic. 89, 101–109. doi: 10.1016/j.ecolind.2018.01.066
Li, M., Yin, L., Zhang, Y., Su, X., Liu, G., Wang, X., et al. (2021). Spatio-temporal dynamics of fractional vegetation coverage based on MODIS-EVI and its driving factors in Southwest China. Acta Ecol. Sinica. 41, 1138–1147. doi: 10.5846/STXB201907101451 (in Chinese)
Li, J., Yu, S. Y., and Liu, L. (2020). Determining the dominant factors of the variability of terrestrial ecosystem productivity in China during the last two decades. Land Degrad. Dev. 31, 2131–2145. doi: 10.1002/ldr.3580
Liu, Y., Wang, J., Dong, J., Wang, S., and Ye, H. (2020). Variations of vegetation phenology extracted from remote sensing data over the Tibetan plateau hinterland during 2000–2014. J. Meteorol. Res. 34, 786–797. doi: 10.1007/s13351-020-9211-x
Liu, S. H., Yan, D. H., Shi, X. L., and Yuan, Z. (2014). Interannual variation and correlation between vegetation NDVI and climatic factors in China. Arid Land Geography. 37, 480–489. doi: 10.13826/j.cnki.cn65-1103/x.2014.03.008 (in Chinese).
Liu, H., Zhang, M., Lin, Z., and Xu, X. (2018). Spatial heterogeneity of the relationship between vegetation dynamics and climate change and their driving forces at multiple time scales in Southwest China. Agric. For. Meteorol. 256–257, 10–21. doi: 10.1016/j.agrformet.2018.02.015
Luan, Y., Huang, G., and Zheng, G. (2023). Spatiotemporal evolution and prediction of habitat quality in Hohhot City of China based on the InVEST and CA-Markov models. J. Arid. Land 15, 20–33. doi: 10.1007/s40333-023-0090-8
Mao, X., Ren, H. L., and Liu, G. (2022). Primary interannual variability patterns of the growing-season NDVI over the Tibetan plateau and main climatic factors. Remote Sens. 14:5183. doi: 10.3390/rs14205183
Min, S. K., Son, S. W., and Seo, K. H. (2015). Changes in weather and climate extremes over Korea and possible causes: a review. Asia-Pacific J. Atmos. Sci. 51, 103–121. doi: 10.1007/s13143-015-0066-5
Mokarram, M., and Pham, T. M. (2022). CA-Markov model application to predict crop yield using remote sensing indices. Ecol. Indic. 139:108952. doi: 10.1016/j.ecolind.2022.108952
Myneni, R. B., Keeling, C. D., Tucker, C. J., Asrar, G., and Nemani, R. R. (1997). Increased plant growth in the northern high latitudes from 1981 to 1991. Nature 386, 698–702. doi: 10.1038/386698a0
Piao, S., Yin, G., Tan, J., Cheng, L., Huang, M., Li, Y., et al. (2015). Detection and attribution of vegetation greening trend in China over the last 30 years. Global 21, 1601–1609. doi: 10.1111/gcb.12795
Sun, C., Bao, Y., Vandansambuu, B., and Bao, Y. (2022). Simulation and prediction of land use/cover changes based on CLUE-S and CA-Markov models: a case study of a typical pastoral area in Mongolia. Sustainability 14:15707. doi: 10.3390/su142315707
Sun, R., Chen, S., and Su, H. (2021). Climate dynamics of the spatiotemporal changes of vegetation NDVI in northern China from 1982 to 2015. Remote. Sens. Basel. 13:187. doi: 10.3390/rs13020187
Sun, H., Wang, X., Fan, D., and Sun, O. J. (2021a). Contrasting vegetation response to climate change between two monsoon regions in Southwest China: the roles of climate condition and vegetation height. Sci. Total Environ. 802:149643 doi: 10.1016/j.scitotenv.2021.149643
Sun, W., Wang, Y., Fu, Y. H., Xue, B., Wang, G., Yu, J., et al. (2019). Spatial heterogeneity of changes in vegetation growth and their driving forces based on satellite observations of the Yarlung Zangbo River basin in the Tibetan plateau. J. Hydrol. 574, 324–332. doi: 10.1016/j.jhydrol.2019.04.043
Sun, H., Wang, C., Niu, Z., and Li, B. (1998). Analysis of the vegetation cover change and the relationship between NDVI and environmental factors by using NOAA time series data. J. Remote Sens. 3, 204–210.
Sun, H., Wang, J., Xiong, J., Bian, J., Jin, H., Cheng, W., et al. (2021b). Vegetation change and its response to climate change in Yunnan Province. China. Adv. Meteorol. 20:8857589. doi: 10.1155/2021/8857589
Tchepel, O., and Borrego, C. (2010). Frequency analysis of air quality time series for traffic related pollutants. J. Environ. Monit. 12, 544–550. doi: 10.1039/B913797A
Tong, L., Liu, Y., Wang, Q., Zhang, Z., Li, J., Sun, Z., et al. (2019). Relative effects of climate variation and human activities on grassland dynamics in Africa from 2000 to 2015. Ecol. Inform. 53:100979. doi: 10.1016/j.ecoinf.2019.100979
Tong, S., Zhang, J., Ha, S., Lai, Q., and Ma, Q. (2016). Dynamics of fractional vegetation coverage and its relationship with climate and human activities in Inner Mongolia. China. Remote. Sens. 8:776. doi: 10.3390/rs8090776
Torres-García, M. T., Oyonarte, C., Cabello, J., Guirado, E., Rodríguez-Lozano, B., and Salinas-Bonillo, M. J. (2022). The potential of groundwater-dependent ecosystems to enhance soil biological activity and soil fertility in drylands. Sci. Total Environ. 826:154111. doi: 10.1016/j.scitotenv.2022.154111
Tucker, C. J., and Choudhury, B. J. (1987). Satellite remote sensing of drought conditions. Remote Sens. Environ. 23, 243–251. doi: 10.1016/0034-4257(87)90040-X
Tucker, C. J., Slayback, D. A., Pinzon, J. E., Los, S. O., Myneni, R. B., and Taylor, M. G. (2001). Higher northern latitude normalized difference vegetation index and growing season trends from 1982 to 1999. Int. J. Biometeorol. 45, 184–190. doi: 10.1007/s00484-001-0109-8
Wang, R., Cherkauer, K. A., and Bowling, L. C. (2016). Corn response to climate stress detected with satellite-based NDVI time series. Remote Sens. 8:269. doi: 10.3390/rs8040269
Wang, X. Y., Zhao, C. Y., and Jia, Q. Y. (2013). Impacts of climate change on Forest ecosystems in Northeast China. Adv. Clim. Chang. Res. 4, 230–241. doi: 10.3724/SP.J.1248.2013.230
Wang, T., Zhu, Z., and Wu, W. (2002). Sandy desertification in the north of China. Science 45, 23–34. doi: 10.1007/BF02878385
Xiao, J., Wang, S., Bai, X., Zhou, D., Tian, Y., Li, Q., et al. (2018). Determinants and spatial-temporal evolution of vegetation coverage in the karst critical zone of South China. Acta Ecol. Sinica. 38, 8799–8812. doi: 10.5846/stxb201805061010 (in Chinese).
Xie, J., Lu, Z., Xiao, S., and Yan, C. (2021). Driving force and ecosystem service values estimation in the extreme arid region from 1975 to 2015: a case study of Alxa league. China. Chinese Geogr. Sci. 31, 1097–1107. doi: 10.1007/s11769-021-1244-2
Xu, X., Liu, J., Jiao, F., Zhang, K., Ye, X., Gong, H., et al. (2022). Ecological engineering induced carbon sinks shifting from decreasing to increasing during 1981-2019 in China. Sci. Total Environ. 864:161037 doi: 10.1016/j.scitotenv.2022.161037
Xu, D., Zhang, K., Cao, L., Guan, X., and Zhang, H. (2022). Driving forces and prediction of urban land use change based on the geodetector and CA-Markov model. Int. J. Digit. Earth. 15, 2246–2267. doi: 10.1080/17538947.2022.2147229
Zhang, C., Lu, D., Chen, X., Zhang, Y., Maisupova, B., and Tao, Y. (2016). The spatiotemporal patterns of vegetation coverage and biomass of the temperate deserts in Central Asia and their relationships with climate controls. Remote Sens. Environ. 175, 271–281. doi: 10.1016/j.rse.2016.01.002
Zhang, G., Xu, X., Zhou, C., Zhang, H., and Ouyang, H. (2011). Responses of grassland vegetation to climatic variations on different temporal scales in Hulun Buir grassland in the past 30 years. J. Geogr. Sci. 21, 634–650. doi: 10.1007/s11442-011-0869-y
Zhang, G., Yan, J., Zhu, X., Ling, H., and Xu, H. (2019). Spatio-temporal variation in grassland degradation and its main drivers, based on biomass: case study in the Altay prefecture. China. Glob. Ecol. Conserv. 20:e00723. doi: 10.1016/j.gecco.2019.e00723
Zhao, A., Zhang, A., and Liu, X. (2018). Spatiotemporal changes of normalized difference vegetation index (NDVI) and response to climate extremes and ecological restoration in the loess plateau. China. Theor. Appl. Climatol. 132, 555–567. doi: 10.1007/s00704-017-2107-8
Zhou, P., Zhao, D., Liu, X., Duo, L., and He, B.-J. (2022). Dynamic change of vegetation index and its influencing factors in Alxa league in the arid area. Front. Ecol. Evol. 10:922739. doi: 10.3389/fevo.2022.922739
Keywords: normalized vegetation index, spatiotemporal distribution, driving mechanism, CA-Markov model, Fourier function model, prediction
Citation: Han Y, Lin Y, Zhou P, Duan J and Cao Z (2023) Dynamic change, driving mechanism and spatiotemporal prediction of the normalized vegetation index: a case study from Yunnan Province, China. Front. Ecol. Evol. 11:1177849. doi: 10.3389/fevo.2023.1177849
Edited by:
Jie Luo, Aerospace Information Research Institute (CAS), ChinaReviewed by:
Peixiao Wang, Wuhan University, ChinaDaniel Fiifi Tawia Hagan, Nanjing University of Information Science and Technology, China
Copyright © 2023 Han, Lin, Zhou, Duan and Cao. This is an open-access article distributed under the terms of the Creative Commons Attribution License (CC BY). The use, distribution or reproduction in other forums is permitted, provided the original author(s) and the copyright owner(s) are credited and that the original publication in this journal is cited, in accordance with accepted academic practice. No use, distribution or reproduction is permitted which does not comply with these terms.
*Correspondence: Yilin Lin, 20200111@kust.edu.cn; Peng Zhou, 212104020091@home.hpu.edu.cn
†These authors have contributed equally to this work