Analysis of sediment from an irrigation dam in an agricultural valley impacted by the mega-drought in central Chile
 Jennery Jaque
 Naveska Melo Pinochet
 Adriana Aránguiz-Acuña
 Héctor Pizarro
- 1Departamento de Ciencias Geológicas, Universidad Católica del Norte, Antofagasta, Chile
- 2Laboratorio de Ecología Acuática, Departamento de Recursos Ambientales, Facultad de Ciencias Agronómicas, Universidad de Tarapacá, Arica, Chile
- 3Millennium Nucleus in Andean Peatlands (AndesPeat), Universidad de Tarapacá, Arica, Chile
- 4Departamento de Geología, FCFM, Universidad de Chile, Santiago, Chile
Central Chile has been affected since 2010 by an increasing mega-drought accompanied by a historically low precipitation rate, as a probable consequence of climate change. Additionally, the increasing pressure exerted by the withdrawals of human activities, such as agriculture and metal mining, promotes conditions of hydric scarcity. Despite this intensive use of the watersheds and the sustained and increasing aridity, it has not been explored whether an artificial sedimentary record can trace these changes in the agricultural valleys of the region. To unravel and evaluate the recent environmental/climatic variability, the effects of the mega-drought that has pertained since 2010, extractivist pressures on a Mediterranean valley in central Chile, and sediment records were obtained from an irrigation dam and studied through a multi-proxy analysis. The dam was built and has been in operation since 1975 and is located in the Aconcagua River Valley, Valparaíso, Chile. Magnetic properties, carbon content, mineral composition, and metal content were analyzed from sediments of a 120 cm long core. Changes in vegetation cover from 1990 to 2020 were analyzed through NDVI filters. Horizons associated with drier conditions were observed in the upper zone of the core, which corresponded from the year 2001 to the present, assuming a constant sedimentation rate of 2.72 cm·yr−1. Additionally, the characteristic alternation of dry–wet conditions was observed in the deep horizon of the dam sediments. The concentrations of Cu, Pb, Al, and As have increased over the years, while the concentration of Mo has decreased. Some of these elements are associated with copper mining, existing in the valley. Analysis of Landsat images from the year 2000 to the present has identified a significant decrease in vegetation cover associated with dry/wet periods, which may be related to cycles of El Niño/La Niña events. Although not all the proxies analyzed were sensitive enough to detect changes at the desired resolution, since the dam is very recent, the results shed light on the effects of the interaction between industrial activities and the decrease of water availability in multiple-use watersheds, suggesting variations in metals concentrations and changes in water availability, probably promoted by anthropic activities, climatic events, and increasing aridity in the Aconcagua River Valley.
1. Introduction
The Mediterranean area of central Chile is currently suffering from a long and intense period of drought that has not been seen in recent history (Garreaud et al., 2017), which has caused a decrease in the budgets of the lake and highland aquatic ecosystems, with dramatic consequences for local agriculture, livestock, and water supply for human consumption (Muñoz et al., 2020). During the mega-drought, the surface area of lakes in the Andes of central Chile has decreased between 7 and 28.34% (Fuentealba et al., 2021), and these changes have been associated with regional climate trends involving a decrease in precipitation and an increase in temperature (Garreaud et al., 2017). Moreover, the interaction with the increasing pressure of withdrawals from human activities, especially those at the industrial level, has created conditions of scarcity, where the water demand may exceed the recharge capacities of the hydrological systems (Le Goff et al., 2022). The combination of these water stress factors has put Chile in a condition of high risk among the countries of the Americas (Muñoz et al., 2020).
The Aconcagua River Basin is of transverse exorheic type, with an approximate area of 7,337 km2, which originates in the Cordillera de Los Andes and flows into the Concón Bay in the Valparaíso Region, Chile (Dirección General de Aguas, 2004; Soto Bäuerle et al., 2011). The Valparaíso Region is one of the most densely populated regions at the national level (1.8 million inhabitants), and the Aconcagua River Basin hosts a great variety of economic activities. These activities are mainly associated with the exploitation of natural resources, such as copper mining, industries, water treatment plants, and important agricultural activities (Aguilar et al., 2011; Instituto Nacional de Estadísticas, 2014; Dirección General de Aguas, 2019). Metallic mining in the area has focused on the exploitation of fine copper and its by-products, traces of which have been previously detected in different points of the basin (Fe, Mg, Cu, As, and , among others), and industrial activities in the manufacture, treatment, and sale of food, preservatives, cement, and industrial chemicals, among others. Agricultural activities have also impacted the natural basins, mainly through the extraction of water for irrigation and the use of agrochemicals and pesticides in their crops, such as Carbofuran and Chlorothalonil (Dirección General de Aguas, 2004). The area of the watershed allocated for agricultural use is equivalent to 12%. The largest avocado crops are found there, accounting for 41% of the total production of avocado trees in the country with high water demand. The most commercially appreciated cultivars require >500 mm of water per season to reach their highest relative production (Lahav and Whiley, 2007) and well-drained soils. These requirements allow avocado crops to cause an increase in soil erosion and loss of natural vegetation (Soto Bäuerle et al., 2011).
Many watersheds in the Valparaíso region have been impacted by the current climatic conditions and the consequent land use changes. An extreme example of these interacting factors is the La Ligua and Petorca watersheds. After suffering from high levels of aquifer exploitation, the Petorca province was declared a water scarcity zone in 1997 (Muñoz et al., 2020) and a groundwater restriction zone in 2014 (Dirección General de Aguas, 2019). In Petorca, the quality of life of the population and the availability of water for small farmers have been seriously affected due to the lack of water for irrigation (Bolados-García and Sánchez-Cuevas, 2017; Duran-Llacer et al., 2020). This has increased due to drought and climate change, and also to water theft by large growers, a result of the Chilean private management model of water that establishes the water market, which has triggered various social conflicts in the area (Bolados-García and Sánchez-Cuevas, 2017; Panez-Pinto et al., 2017). Such socio-environmental and economic conflicts could potentially occur in all regions where the frequency and magnitude of aridity periods are increasing. Therefore, it is important to quantify and study the impacts of environmental/climatic variability, the mega-droughts that currently affect the area, and the effects of extractivism resulting from the economic activities in the valley. In this context, multiproxy studies have been focused on the study of lake sediments to understand climate variability and the effects of extractivism in Chile (e.g., Bertrand et al., 2008; Von Gunten et al., 2009; Aránguiz-Acuña et al., 2020; Gayo et al., 2022). However, these sedimentary records usually reflect changes on the Holocene time scale. Meanwhile, sediments from an irrigation dam are time-constrained, meaning they can better archive the recent-past environmental conditions and current transformations of land use.
This study aimed to check the use of different proxies measured (magnetic properties, geochemical analysis, loss on ignition, satellite image processing, and reflectance spectrum) on a short sediment record from an irrigation dam in the Aconcagua River Valley to unravel the environmental and/or climatic history in central Chile between 1975 and 2019. In addition, this study seeks to link the magnetic and geochemical variations recorded in the sediments with the severe mega-drought that started in 2010 and polluting industrial activities.
2. Methodology
2.1. Study site and sampling
The Aconcagua Valley is located in the Aconcagua River basin in the Valparaiso region, which is 88 km east of the city of Valparaiso, Chile (Figure 1). The study area, known as the central valley, is a semi-arid region located at 800 m.a.s.l. and is mainly composed of volcanic, volcanic sedimentary, and intermediate acidic intrusive units (Rivano et al., 1993; Escribano, 2008; Naranjo, 2014; Figure 1). This valley is home to cities such as San Felipe and Los Andes, and its primary economic activities include mining, industry, and agricultural development (Gaete et al., 2007; Dirección General de Aguas, 2009). This valley, like others in the area, has been impacted by water scarcity since 2010, alternating between wet periods and agricultural growth (Maturana et al., 1997; Dirección General de Aguas, 2009; Garreaud et al., 2017).

Figure 1. Location of the study site. Aconcagua River Valley, Calle Larga town, Valparaíso Region, Central Chile (modified from Rivano et al., 1993).
The sampling site is specifically located in the town of Calle Larga at 806 m.a.s.l and corresponds to an artificial irrigation dam constructed for agricultural use. One sediment core 120 cm long and 10 cm in diameter was extracted from the bottom of the artificial irrigation reservoir in February 2019. The sedimentary core was extracted during a period of extreme drought when the reservoir was dry, using a trench to obtain the core (Supplementary Figure 1). The core was sliced every 1 cm, and a total of 120 samples of approximately 15 g each were collected for magnetic, petrographic, and geochemical analyses (Supplementary Figure 1). Samples were coded as TP+ depth (in cm) and sorted at 4 °C. In addition, Figure 2 shows the different techniques used and the parameters to be calculated.
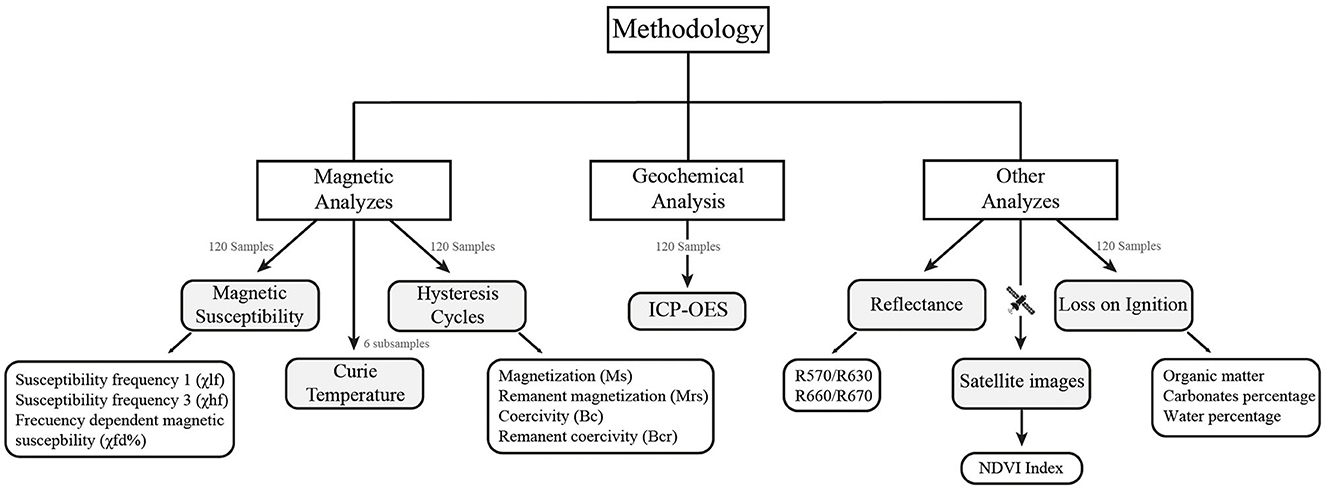
Figure 2. Flowchart of the methodologies used in this study: magnetic, geochemical, and other analyses performed with their respective measured parameters.
The first step was to perform a macroscopic description of the whole core, and then, X-ray images of the sedimentary core were taken. To radiograph the complete core (120 cm in total), we used a conventional radiograph and the ADAM software to obtain and improve the quality of the photographs. This allowed us to observe and analyze alternation patterns and changes in color and thickness (Mena et al., 2011).
2.2. Analysis of magnetic properties
To identify potential changes in the distribution of magnetic particles throughout the core, wet sediment samples were mounted on 8 cm3 standard-size paleomagnetic cubes for mass magnetic susceptibility (χ) measurements. The χ was measured using a Kappabridge MFK1-FA susceptibility bridge (AGICO Co.) under normal ambient conditions (22–24°C) and a 200 A/m field at Maini Equipment Center (Universidad Católica del Norte, UCN, Antofagasta, Chile). Measurements were performed at two different frequencies of 976 Hz (χlf) and 15.616 Hz (χhf), corresponding to low and high frequencies, respectively. This method allowed us to calculate the frequency-dependent magnetic susceptibility (Figure 2; Dearing et al., 1996)
where, χfd% is a widely used parameter to reflect the content of the particles close to the superparamagnetic/single domain (SP/SD) boundary (Maher et al., 2003; Yang et al., 2023).
Additionally, the same samples were subjected to hysteresis experiments at room temperature using a MicroMag AGM 2900-2 alternating gradient force magnetometer at UCN (Princeton Measurements Corp., Princeton, NJ, USA) with the purpose of determining magnetic mineral content and grain size. Magnetic hysteresis parameters were calculated using PmagPy routines (available at https://earthref.org/PmagPy/cookbook/; Tauxe, 1998, 2005).
Finally, six sub-samples (TP001, TP007, TP043, TP052, TP088, and TP097) were used to determine Curie temperatures by thermomagnetic experiments using a CS4 MFK1-FA (AGICO). Powdered samples were heated from room temperature to 700°C (and then cooled to room temperature) under a weak magnetic field (300 A/m) and 1 atm pressure in a non-inert (oxygen) atmosphere. Curie points were calculated using the method proposed by Hodel et al. (2017).
2.3. Chemical analysis
The sediment core samples were subjected to various analyses at different facilities. At the Center for Advanced Studies in Arid Zones (CEAZA), loss on ignition measurements were conducted on 1 cm3 cubes per sample. The cubes were heated in a muffle to 550°C for 4 h to obtain the percentage of organic matter and then to 950°C for 7 h to determine the percentage of carbonate.
The reflectance in the visible spectrum (380 to 750 nm) of the entire core was measured in the STS-VIS optical spectrometer. Two spectral indices were calculated: the ratio of clay detection of reflectance at wavelengths of 570 nm and 630 nm (R570/R630) and the relative absorption band depth 660–670 nm (RABD660;670) as an indicator of total chlorine (diagenetic products of chlorophyll) (Rein and Sirocko, 2002; Von Gunten et al., 2012; De Jong et al., 2013).
All samples (120) were analyzed by Inductively Coupled Plasma Optical Emission Spectrometry (ICP-OES, model OPTIMA 8000). Total concentrations of copper, zinc, cadmium, nickel, iron, aluminum, vanadium, molybdenum, and arsenic were measured for each sample. For this, the samples were disaggregated according to the EPA 3052 method with hydrochloric and hydrofluoric acid (Remeteiová et al., 2020).
2.4. Analysis of satellite images
Vegetation cover changes were analyzed using satellite images obtained from the Earth Explorer platform (USGS) of the Landsat 5 and 8 satellites for the period between 1990 and 2020 (every 5 years). The images were georeferenced to the UTM WGS 84 South Zone19 projection and vegetation cover filters were applied. The Normalized Difference Vegetation Index (NDVI) filters were obtained with the ERDAS IMAGINE 2014 software using the following formula:
In the above formula, ICR corresponds to the near-infrared reflectance (Band 4), while R corresponds to the red reflectance (Band 3). The numerical value given by the previous expression ranges from −1 to 1, with the value 0 indicating the approximate threshold of vegetation absence (Rouse et al., 1974). The numerical values are translated into the images with two colors: red for values close to −1 (loss of vegetation) and green for values close to 1 (increase of vegetation). A 25% variation in vegetation cover was used to visualize inter-period differences (Muñoz, 2013).
2.5. Data analysis
Chemical and magnetic data zones were identified by performing the CONISS analysis (Grimm, 1987) with TILIA software. For combinations of chemical and magnetic proxies that showed high and significant correlation coefficients, Spearman's rank correlation was used to calculate R, and p-values were also calculated for linearly detrended data. All analyses were conducted using ioGAS 64 software.
3. Results
3.1. Macroscopic sedimentary characteristics
The mineralogical composition of the sediment consisted mainly of feldspar, lithics, quartz, calcite, and magnetite. The grains were silt and clay-sized, and they were mainly spherical and elongated. Additionally, remnants of organic matter were observed in the bottom of the core.
Based on the macroscopic characteristics, the sedimentary core was divided into two sections. On the bottom section (between 120 and 48 cm), the sedimentary core was identified as a section, characterized by alternating light brown and gray (2 and 3 cm thick) and dark brown (1 and 1.5 cm thick) Horizons. The upper section (from the top to 48 cm depth) had a massive structure and millimeter parallel lamination with a variable contribution of vegetation remains. Another subsection was identified in the upper section, characterized by a reddish-brown color with no pattern or defined horizons and apparently poor in organic matter.
3.2. Magnetic properties of sediments
Magnetic susceptibility (χ) values varied slightly along the sedimentary core, ranging from 3.77 × 10⁻³ to 7.94 × 10⁻³ m3kg−1, with a mean value of 5.47 × 10⁻³ m3kg−1 (Figure 3). The frequency-dependent magnetic susceptibility (χfd%) values varied between 1.76 and 3.91%, with a mean value of 2.62% (Figure 3G). Although the curve was relatively homogeneous, some middle (42–64 cm) and bottom (81–99 cm) sections had χfd% values of > 3%. If the χfd% values were > 3%, this could be used as an indicator of the presence and concentration of small ferromagnetic particles that have magnetic sizes near the superparamagnetic (SP)/single (SD) magnetic limit (Maher and Taylor, 1988; Dearing et al., 1996). Their presence suggests that the number of very small ferromagnetic particles is significant in some samples from the middle and bottom of the sedimentary core.
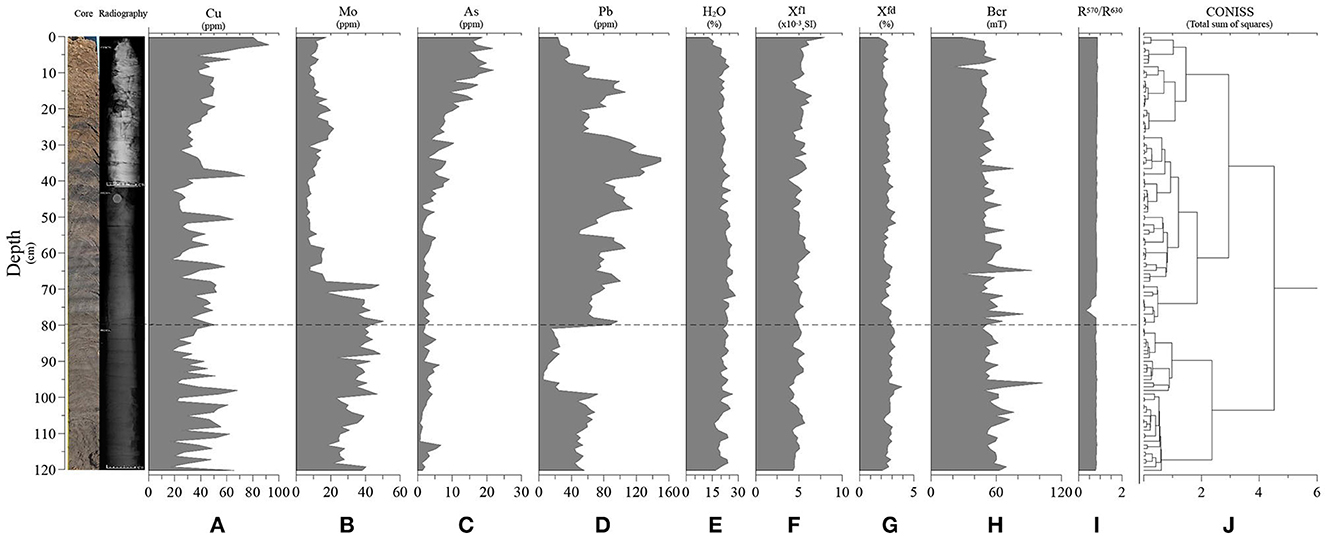
Figure 3. Geochemical analysis of sedimentary core. (A) Copper concentration (ppm); (B) molybdenum concentration; (C) arsenic concentration; (D) lead concentration; (E) water percentage; (F) magnetization; (G) frequency susceptibility dependence; (H) remanent coercivity; (I) R570/R630 ratio; (J) environmental relationship identified by CONISS analysis.
The measured thermomagnetic experiments showed irreversible behavior for all samples analyzed in all curves (Supplementary Figure 2). Two clear sections could be described: first, a smooth progressive increase up to approximately 580°C, and then a drastic change in the slope of the curve at approximately 580°C. This suggests the presence of nearly pure magnetite (Tc1) and a progressive decrease, indicated by a gentle slope between 580 and 680°C, which is an indicator of a mixture of Ti-rich and Ti-poor titanohematite-titanomaghemite (Tc3; Supplementary Figure 2; Tauxe, 1998).
This last magnetic phase is associated with a more oxidizing environment. Additionally, the top of the sediments (from 7 cm depth to the top) showed a progressive decrease in susceptibility from 500 to 570°C. This is probably associated with the presence of Ti-poor titanomagnetites. At the bottom of the sediments (97 cm depth), an abrupt increase was observed just before ~580 °C during heating (Hopkinson peak), which could indicate the presence of superparamagnetic grain (fine grain) magnetite within this slice (Dunlop and Özdemir, 2001). This is confirmed by a value of χ fd% > 3%, which is an indicator of the presence of magnetic particles of SP magnetic size.
All samples exhibited similar behavior in the hysteresis curves, as follows: (1) a strong ferromagnetic behavior and a weak paramagnetic behavior, which are clearly observed in the shape of the curves; (2) low coercivity values (Bc and Bcr), and (3) high magnetization values (Ms and Mr). The curves generated by the coercive force (Bc) and remaining coercivity force (Bcr) were relatively homogeneous along the core. Conversely, the saturation magnetization (Ms) and saturation remanence (Mr) curves were heterogeneous along the core. Similar behavior was observed in the curves generated by low-field magnetic susceptibility (χ lofi), high-field magnetic susceptibility (χ hifi), and ferrimagnetic susceptibility (χ ferry) values (Supplementary Figure 3).
The hysteresis values were plotted in the Theoretical Day Plot (Day et al., 1977; Dunlop, 2002a) to discriminate the magnetic size (and possible size mixtures ) of the Fe-bearing minerals. The measured values were plotted close to the pseudo-single-domain (PSD) field, between the single domain (SD) + multi-domain (MD) mixing curves and the single domain (SD) + superparamagnetic (SP) (10 nm) domain mixing curves (Supplementary Figure 4). This finding could be the result of a mixture of PSD and SP magnetic grains or a ternary mixture of SP+SD+MD (i.e., Dunlop, 2002b). This observation could be the result of an SP + PSD mixture dominated by PSD and MD magnetic grains. This interpretation is consistent with the shape of the hysteresis loops, the values calculated from these, and the low χfd% values (<3%) obtained, likely indicating a detrital origin of magnetic minerals (magnetite and titanomagnetite).
3.3. Chemical concentration of sediments
The concentration of quantified elements along the sediment core showed variable depth patterns. Arsenic concentration in the sedimentary core was more abundant in the upper section but decreased from 30 cm to the bottom. Molybdenum was present in low concentrations in recent sediments but increased from 70 cm in the older sediments (Figures 3B, C). Lead was low in the top sediments but reached high concentrations with peaks at medium depths (15 cm, 35 cm, 60 cm, and 80 cm), followed by a gap between 80 and 100 cm (Figure 3D). Copper had its maximum concentration in the top sediments and had other peaks at 40 cm, 50 cm, and around 70 cm, while deeper sediments had varying copper concentrations (Figure 3A). The Al concentration in the core was more abundant at the top, showing some peaks (7 cm, 12 cm, and 13 cm), which indicated an increasing concentration of aluminum toward the top. The other potentially toxic metals analyzed, such as nickel, iron, cadmium, and zinc, did not show significant variations over the years. There was only an abrupt increase in iron at the top of the sedimentary core associated with the years 2016 to 2019.
The water percentage was relatively homogeneous throughout the sedimentary core and did not present significant variations, with values ranging from 12 to 28%. Only in the sediments at the top of the core was a decrease in water percentage observed (Figure 3E), mainly due to direct exposure to air and heat when the dam went dry in 2019.
The percentage of carbonate, measured by loss on ignition at 925°C (LOI925), did not exceed 3% throughout the whole sediment core. However, in the case of organic matter (LOI550), concentrations varied between 2.3 and 4.4%. This variation could be associated with the observed lamination of light/gray and dark brown horizons, where the highest values of organic matter are related to dark brown horizons, and low organic matter values are associated with light brown/gray horizons. The percentage of organic matter decreased moving upward.
Regarding the reflectance ratio, R660/R670, only one point showed a deviation value of 1, with a single break at 43 cm. No variations were observed for the RABD660;670 index, suggesting constancy in lithogenic and diagenetic content during the analyzed period.
3.4. Satellite images of the central valley
According to the NDVI, there has been a change and growth in the density and arrangement of vegetation cover over the past 30 years (1990 to 2020). This change was concentrated in periods after the year 2000, as shown in Figure 4, where there was a significant increase in sectorized vegetation. This increase was mainly due to the expansion of agricultural livestock in the valley, as illustrated by the shape of the polygons in Figures 4B, C, especially between the years 2005 and 2010. During this period, the vegetation cover increased by 7,954 hectares (Figure 4D). However, since 2010, there has been a considerable loss of vegetation cover of 15,027 hectares (Figure 4E), with a slight recovery since 2015 equivalent to 3,479 hectares. Nevertheless, the net balance remains negative (Figure 4F).
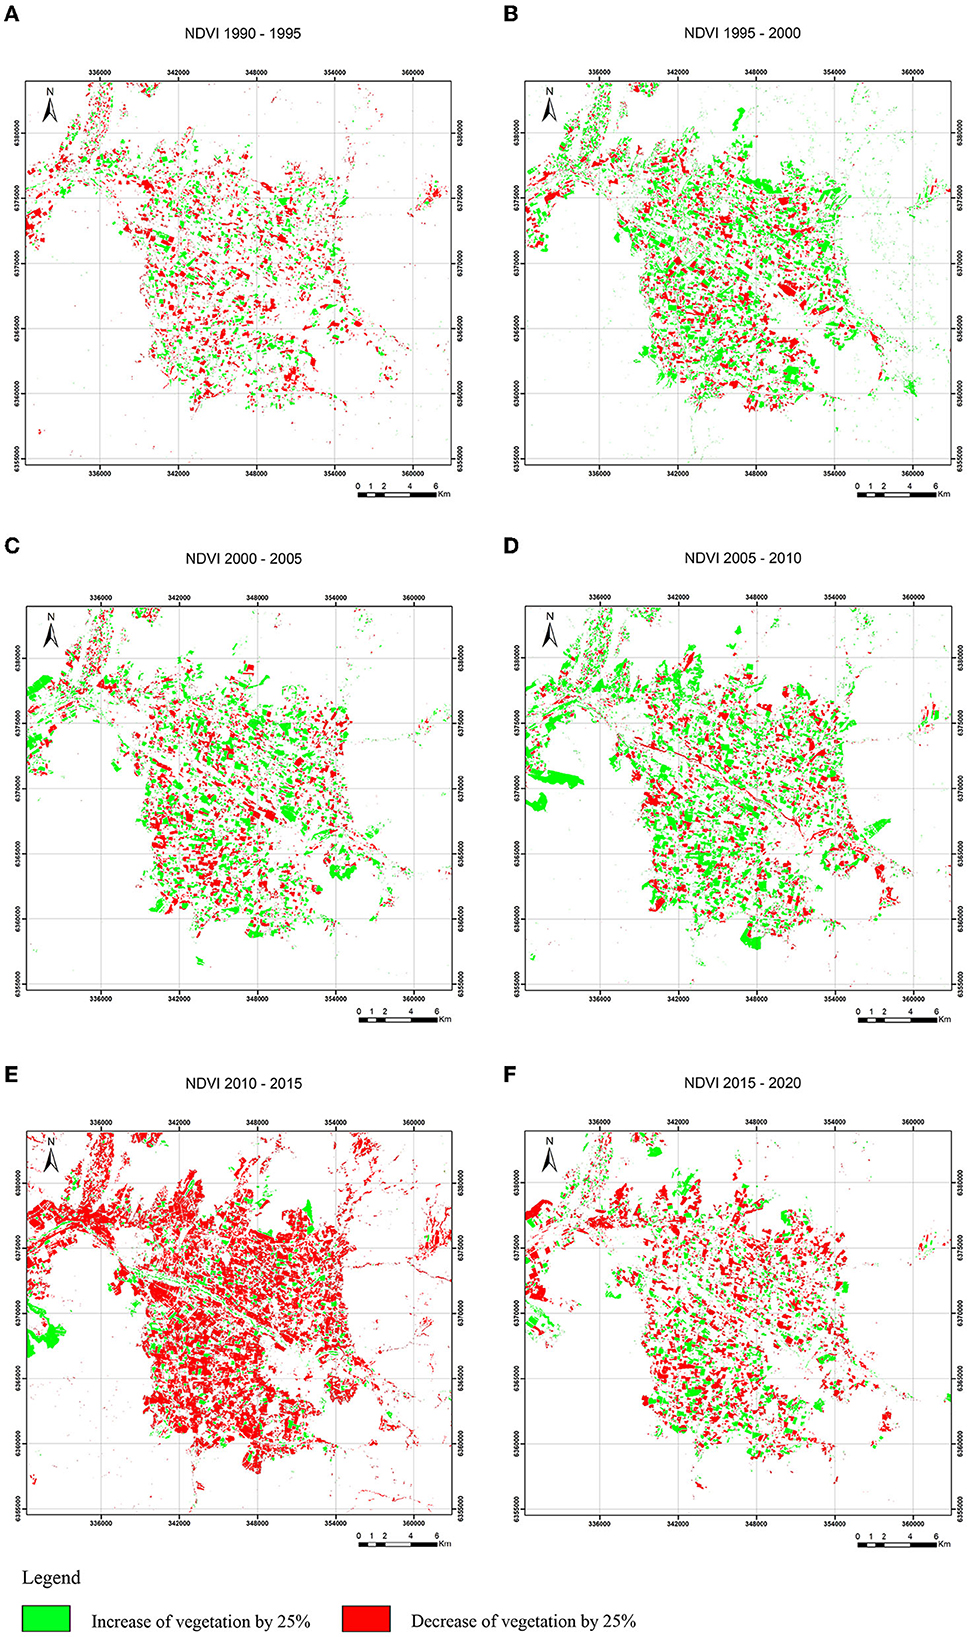
Figure 4. Linear regressions of Normalized Difference Vegetation Index (NDVI) made in the central valley between 1990 and 2020, divided into five annual windows: (A) 1990–1995; (B) 1995–2000; (C) 2000–2005; (D) 2005–2010; (E) 2010–2015; and (F) 2015–2020.
4. Discussion
Paleoenvironmental studies commonly use multi-proxy analyses, including both organic and inorganic variables, of lake and marine sediments to unravel past environmental and climatic conditions over thousands of years. However, identifying proxies that are sensitive enough to account for inter-annual changes. In this study, a sediment core was obtained from a short-dated irrigation dam in a region heavily affected by the current mega-drought. The core reflects climatic and anthropogenic events that have impacted the area from 1975 to 2019.
Since then, there have been no removals identified from the beginning of the dam to the date of sampling, it is plausible to assume a constant sedimentation rate for the period, calculated as 2.73 cm·yr−1 (120 cm of sediments in the 44 years between 1975 and 2019). Analyses and observations have allowed for the identification of proxies that were sensitive to changes that have occurred during the last four decades in central Chile. These proxies describe two different depositional environments and are related to water availability and other events.
The upper sediments up to 48 cm of the core (from 2019 to 2001, considering the constant assumed rate) could be related to drier conditions, with a massive structure and millimeter parallel lamination and a scarce contribution of vegetation remains. Another subsection was characterized by a reddish-brown color without lamination and poor organic matter. Ti-poor titanomagnetites are also recognized from thermomagnetic experiments in this region. Additionally, very small ferromagnetic particles were recorded in the break generated between 48 and 62 cm, which may be linked to authigenic processes over magnetic minerals (Dearing et al., 1996; Evans and Heller, 2003; Hao et al., 2008). The copper curve showed high values at depths of approximately 7 cm, 38 cm, and 51 cm, which corresponded to the years 2016, 2005, and 2000, respectively. In addition, from 41 cm to the top, the concentration of copper began to rise, reaching its highest concentration of 20 ppm.
In the bottom section, between 120 and 48 cm (corresponding to the period 1975–2001, considering the assumed constant rate), a section characterized by alternating light brown and gray (2 and 3 cm thick) and dark brown (1 and 1.5 cm thick) horizons was identified. This arrangement of horizons could be related to the alternation of dry/wet periods, in agreement with the cyclic behavior of the Mediterranean template climate of the valley (Naranjo, 2014; Garreaud et al., 2020). In addition, the intercalation of light/gray and dark brown horizons is consistent with the organic matter content measured by LOI550, with the highest organic matter values related to dark brown horizons. In contrast, low organic matter values are associated with light brown/gray horizons. The CONISS analysis defined a break at 80 cm (corresponding to 1990), primarily due to the strong break in the lead curve.
The upper horizon is well explained by drier environmental conditions. Higher metal concentrations measured, especially of Cu, Pb, and As, could be linked to contamination produced by the expansion of the surrounding mining and/or agricultural industries. Upstream in the basin is the Miocene Rio Blanco-Los Bronces copper–molybdenum deposit, among other mines near the sampling sites.
In general, the concentration of Cu in the sediments (40 ppm on average) is lower than the background concentrations of the Farellones Formation (120 ppm on average; Hollings et al., 2005) and the Abanic Formation (Hollings et al., 2005; Muñoz et al., 2006; between 28 and 80 ppm), which compose the substratum of the Aconcagua River. However, observed peaks of > 60 ppm could be associated with specific events that concentrate salts in the basin, such as a decrease in flow, or systematic inputs of these elements into the basin. High values associated with the years 2016, 2005, 2001, and 1996, respectively, could be related to specific natural disasters that occurred, such as debris flows and El Niño episodes (Higueras et al., 2004). Additionally, there are several peaks of similar magnitude below 96 cm, which corresponds to 1984. These peaks, such as the one that occurred in 2016, could be related to the break of a pipeline that transported copper concentrate, which resulted in a discharge of 50,000 liters of material into the river, which was documented in the press (Radio Cooperativa, 2016).
The current molybdenum concentration (17 ppm on the surface) is lower than that recorded in the Rio Blanco-Los Bronces Cu-Mo deposit, which is approximately 200 ppm on average (Crespo Mena, 2019). However, it is higher than the concentrations recorded in the substrate from the Aconcagua River (<5 ppm on average; Hollings et al., 2005). High concentrations of Cu and Mo have been reported in the upper basin (Gaete et al., 2007; Fierro et al., 2021); nevertheless, the relative mobility of some metals, such as Mo, is dependent on redox conditions, and oxidizing conditions increase the mobility in lacustrine sediments.
The arsenic concentration was lower than that measured in rocks from the Rio Blanco-Los Bronces deposit (61.66 ppm on average; Crespo Mena, 2019), where it is possible to recognize sulfides rich in As, such as arsenopyrite, tennantite, and enargite. The values were similar to those recorded in fluvial sediments of other intensively managed watersheds, such as the Maipo River (12 ppm on average; Tapia et al., 2022) and the Cachapoal River (10 ppm on average; Duran-Llacer et al., 2020).
In contrast, the lead concentration measured in the sediments was higher than that recorded in the rocks of the Rio Blanco-Los Bronces Cu-Mo deposit, Farellones, and Abanicos formations, where the average values are 26 ppm, 8 ppm, and 7 ppm, respectively, while in the sediments, it is 66 ppm, on average. The concentration curve is variable, with a high concentration from 80 cm and above and a peak value of 140 ppm at 35 cm (2006), mainly associated with intensive industrial activities and the use of fossil fuels.
The concentration of Al in the sediments ranges between 0.07 and 0.62 ppm, which is lower than the concentration in the rocks of the Aconcagua substrate. For the Farellones Formation, the concentration ranges from 14.98 to 19.66 ppm, and for Abanico Formation, it ranges from 13.43 to 20.0 ppm (Hollings et al., 2005). The highest Al values tend to be associated with periods of lower precipitation, such as the La Niña phase. This is similar to the relationship found by Tapia et al. (2022) between the As concentration in sediments and precipitation, where the concentration of this metal decreases during periods of greater rainfall. The value of R2 > 0.3 between Al and As concentration could indicate that part of the As concentration in the sediments could be linked to a climatic component (Supplementary Figure 5).
An exploratory analysis of the relation between climate data (Dirección General de Aguas, 2009) and hydric availability in the sampling area was performed. Monthly temperature series from 1979 to 2019 (NOOA Physical Sciences Laboratory, https://www.psl.noaa.gov/enso/mei/; Figure 5A) were used, where positive anomalies were considered indicators of the El Niño phase and negative anomalies of the La Niña phase. This same procedure was applied to the Pacific Decadal Oscillation (PDO) data series (data from the NOOA Physical Sciences Laboratory, https://www.ncei.noaa.gov/access/monitoring/pdo/; Figure 4B). The temperature series were positively correlated with the El Niño phases and negatively correlated with the La Niña phases, with precipitation and river flow values, such as the Rio Blanco and Chacabuquito (Figures 5C, D; Supplementary Figure 5), suggesting an influence of inter-annual climatic variability on water availability in the watersheds of the Valparaíso region.
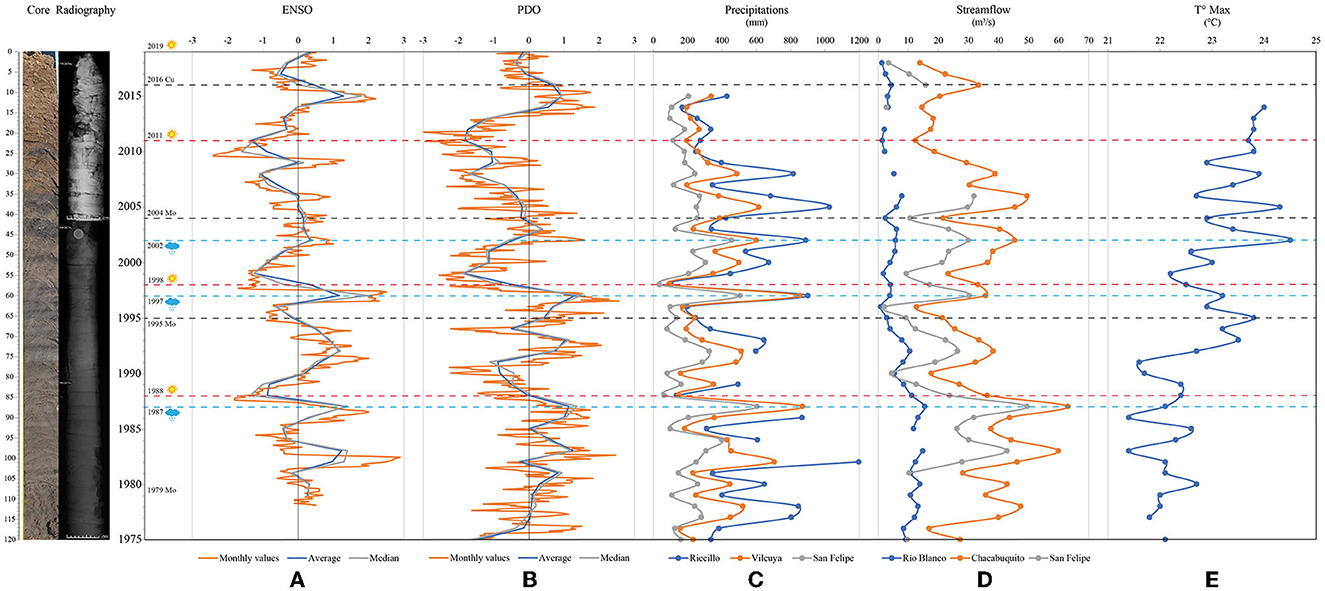
Figure 5. The meteorological database (https://climatologia.meteochile.gob.cl). (A) MEI index from www.esrl.noaa.gov/psd/enso/mei/ for the period of 1976–2010; (B) MEI index from https://www.ncei.noaa.gov/access/monitoring/pdo/ for the period of 1976–2020; (C) precipitation from Riecillos, Vilcuya, and San Felipe stations; (D) streamflow from Río Blanco, Chacabuquito, and San Felipe stations; (E) maximum temperature (°C).
These variations in water availability could be related to changes in vegetation cover. NDVI images from 2000 to 2010 showed an increase in coverage, mainly due to the expansion of agricultural livestock in the valley, while between 2010 and 2015, there was a significant loss of vegetation, which could be explained by the mega-drought (Garreaud et al., 2020). Although there has been a slight recovery in coverage, the trend continues to be negative. Between 1990 and 2010, there was an alternation between El Niño and La Niña phases, with a significant El Niño event occurring in 1998 (Figures 4A, B), while from 2010 to date, the predominance of La Niña begins, which is consistent with different NDVI images (Figures 4E, F).
5. Conclusions and recommendations
From the analysis carried out in a sedimentary core reflecting a short period of time associated with the current mega-drought in central Chile, it was possible to identify sufficiently sensitive variables that allowed us to visualize changes in the geochemical and loss of ignition (water percentage) results, triggered by the reduced hydric availability and decreasing vegetation cover detected by the NDVI index. However, in the case of magnetic properties, the accumulation time was too brief for the results to be conclusive.
The variations in the Cu and Mo concentrations and the high values of this last element measured along the sedimentary core in the Aconcagua Valley can be linked to pollution, mainly associated with the mining industry that is located upstream of the valley. The high Pb concentration recorded in the sediments can be linked to pollution associated with the agricultural industry and/or burning of fossil fuels. We also identify variations in the concentration of Al and As in the sediments, which could be linked to a climatic component that has been recognized in other basins of the central valley.
This region hosts complex and productive ecosystems of global relevance, which are especially vulnerable in the face of unpromising climate change scenarios. Future studies in this valley could complement the results obtained. The study of biological components could be applied to reconstruct the changes in organic markers associated with the use of agrochemicals and the effect of the proxies analyzed on the functioning of ecological communities. This is to help to complete an adequate evaluation of the risk generated by the drought on the agroecological systems and the availability of food and water for the ecological and human communities. In addition, the magnetic techniques used in this study could be applied to different types of sedimentary cores with longer residence times to obtain more conclusive results.
Data availability statement
The raw data supporting the conclusions of this article will be made available by the authors, without undue reservation.
Author contributions
JJ, NM, AA-A, and HP: conceptualization, writing—original draft, and writing—review and editing. JJ, NM, and HP: formal analysis and visualization. AA-A: funding acquisition and project administration. JJ and NM: methodology. AA-A and HP: supervision. All authors contributed to the article and approved the submitted version.
Acknowledgments
We would like to thank the ANID-FONDECYT 1200423 and ANID-FODECYT Postdoctorado 3210291 projects for their support. We also thank Agricola Brown Ltd., for its support with sampling. The chemical analysis was carried out with the technical assistance of Sue Ellen Vega, while the XRD images were provided by the Blanco Laboratory. Magnetic analysis was carried out at the MAINI Laboratory of the Universidad Católica del Norte, while LOI and reflectance analyses were conducted with the help of Dr. Antonio Maldonado of CEAZA.
Conflict of interest
The authors declare that the research was conducted in the absence of any commercial or financial relationships that could be construed as a potential conflict of interest.
Publisher's note
All claims expressed in this article are solely those of the authors and do not necessarily represent those of their affiliated organizations, or those of the publisher, the editors and the reviewers. Any product that may be evaluated in this article, or claim that may be made by its manufacturer, is not guaranteed or endorsed by the publisher.
Supplementary material
The Supplementary Material for this article can be found online at: https://www.frontiersin.org/articles/10.3389/fevo.2023.1179176/full#supplementary-material
Supplementary Figure 1. Process of sedimentary core extraction, and storage, of sedimentary core and sampling. (A) In 2019, a trench was made excavated during a period when the irrigation dam was dry (3 m length × 1 m width × 1.20 m depth). This sedimentary section represents the entire sedimentation history of the dam. (B) The sedimentary core was extracted from one of the walls of the irrigation dam. (C) Sedimentary core extracted. Subsequently, It it was stored in a refrigerated chamber at about 8°C. Then, in the CEAZA laboratory the sedimentary core was sliced at the CEAZA laboratory every 1 cm, and a total of 120 samples of approximately 15 g each were collected for different analysisanalyses. (D) Crucibles with 1 cm3 of sediment used for Loss loss on ignition; (E) paleomagnetic boxes with 8 g of sediment each, one used for magnetic techniques and non-magnetic techniques.
Supplementary Figure 2. Curie temperature (Tc) of 6 subsamples. In red color: heating curve and in blue color: cooling curve. Tc1: magnetite Tc calculated using the method proposed by Hodel et al. (2017). grad = | (KTn+1 –KTn)/(Tn+1 –Tn). (A) Curie temperature of sample TP001; (B) Curie temperature of sample TP007; (C) Curie temperature of sample TP043; (D) Curie temperature of sample TP052; (E) Curie temperature of sample TP088; (F) Curie temperature of sample TP097.
Supplementary Figure 3. 6 representative curves of hysteresis cycles from a total of 120 samples. This parameter was calculated using the program PmagPy program (Tauxe, 1998, 2005), (A) Hysteresis hysteresis cycle of the TP006 sample; (B) Hysteresis hysteresis cycle of the TP010 sample; (C) Hysteresis hysteresis cycle of the TP037 sample; (D) hysteresis of the TP047 sample; (E) Hysteresis hysteresis loop of the TP069 sample; (F) Hysteresis hysteresis loop of the TP115 sample.
Supplementary Figure 4. Hysteresis ratios plotted on a Day plot diagram (Day et al., 1977 after Dunlop, 2002a,b) for 120 samples.
Supplementary Figure 5. Relationship between the annual average of the ENSO measurements and other climatic parameters. (A) Al concentration vs. As concentration; (B) ENSO average vs. annual surface water flow record at the San Felipe meteorological station; (C) ENSO average vs. annual precipitation at the San Felipe meteorological station; (D) ENSO average vs. annual maximum temperature measured in the area. R2: Correlation coefficient, red circles: El Niño phase, and blue circles: La Niña phase. ENSO and PDO data taken are taken from the NOOA Physical Sciences Laboratory. Annual surface water flow, temperature, and precipitation data taken are taken from the DGA.
References
Aguilar, R., Hormazábal, C., Gaete, H., and Neaman, A. (2011). Spatial distribution of copper, organic matter and pH in agricultural soils affected by mining activities. J. Soil Sci. Plant Nutr. 11, 125–145. doi: 10.4067/S0718-95162011000300010
Aránguiz-Acuña, A., Luque, J. A., Pizarro, H., Cerda, M., Heine-Fuster, I., Valdés, J., et al. (2020). Aquatic community structure as sentinel of recent environmental changes unraveled from lake sedimentary records from the Atacama Desert, Chile. PloS ONE 15, e0229453. doi: 10.1371/journal.pone.0229453
Bertrand, S., Charlet, F., Charlier, B., Renson, V., and Fagel, N. (2008). Climate variability of southern chile since the last glacial maximum: a continuous sedimentological record from lago Puyehue (40 S). J. Paleolimnol. 39, 179–195. doi: 10.1007/s10933-007-9117-y
Bolados-García, P., and Sánchez-Cuevas, A. (2017). Una ecología política feminista en construcción: EL caso de las“Mujeres de zonas de sacrificio en resistencia”, Región de Valparaíso, Chile. Psicoperspectivas. 16, 33–42. doi: 10.5027/psicoperspectivas-Vol16-Issue2-fulltext-977
Crespo Mena, J. A. (2019).Origen y distribución de plata en el yacimiento tipo pórfido de Cu-Mo Río Blanco, Chile Central.
Day, R., Fuller, M., and Schmidt, V. A. (1977). Hysteresis properties of titanomagnetites: grain-size and compositional dependence. Physics Earth Planet. Int. 13, 260–267. doi: 10.1016/0031-9201(77)90108-X
De Jong, D., von Gunten, R., Maldonado, L. A., and Grosjean, M. (2013). Late Holocene summer temperatures in the central Andes reconstructed from the sediments of high-elevation Laguna Chepical, Chile (32 S). Climate Past 9, 1921–1932. doi: 10.5194/cp-9-1921-2013
Dearing, J. A., Hay, K. L., Baban, S. M., Huddleston, A. S., Wellington, E. M., Loveland, P., et al. (1996). Magnetic susceptibility of soil: an evaluation of conflicting theories using a national data set. Geophys. J. Int Geophys. 127, 728–734. doi: 10.1111/j.1365-246X.1996.tb04051.x
Dirección General de Aguas (2004). Diagnóstico y Clasificación de Cursos y Cuerpos de Agua según Objetivos de calidad en la Cuenca del Río Aconcagua. Gobierno de Chile.
Dirección General de Aguas. (2009). Diagnóstico y Clasificación de Sectores Acuíferos, Volumen 1. Gobierno de Chile. 23. Dirección General de Aguas. (2009). Diagnóstico y Clasificación de Sectores Acuíferos, Volumen 2. Gobierno de Chile Dirección General de Aguas. (2009). Diagnóstico y Clasificación de Sectores Acuíferos, Volumen 1. Gobierno de Chile.
Dirección General de Aguas. (2019). Proyecto de Actualización de la modelación hidrológica integrada del Aconcagua. Resumen Ejecutivo. Gobierno de Chile.
Dunlop, D. J. (2002a). Theory and application of the Day plot (Mrs/Ms versus Hcr/Hc) 1. Theoretical curves and tests using titanomagnetite data. J. Geophys. Res. Solid Earth 107, EPM-4. doi: 10.1029/2001JB000486
Dunlop, D. J. (2002b). Theory and application of the Day plot (Mrs/Ms versus Hcr/Hc) 2. Application to data for rocks, sediments, and soils. J. Geophys. Res. Solid Earth 107(B3), EPM-5. doi: 10.1029/2001JB000487
Dunlop, D. J., and Özdemir, Ö. (2001). Rock Magnetism: Fundamentals and Frontiers. Cambridge: Cambridge university press.
Duran-Llacer, I., Munizaga, J., Arum,í, J. L., Ruybal, C., Aguayo, M., Sáez-Carrillo, K., et al. (2020). Lessons to be learned: Groundwater depletion in Chile's Ligua and Petorca watersheds through an Interdisciplinary approach. Water 12, 2446. doi: 10.3390/w12092446
Escribano, J. (2008). Superficies de Bajo Relieve en la Cordillera de Chile Central Entre Los 32°30's y los 33°30's, y su Relación con el Alzamiento Andino. Chile: Universidad de Chile.
Evans, M. E., and Heller, F. (2003). Environmental Magnetism: Principles and Applications of Enviromagnetics. Amsterdam: Elsevier.
Fierro, P., Valdovinos, C., Lara, C., and Saldías, G. S. (2021). Influence of intensive agriculture on benthic macroinvertebrate assemblages and water quality in the Aconcagua River Basin (Central Chile). Water 13, 492. doi: 10.3390/w13040492
Fuentealba, M., Bahamóndez, C., Sarricolea, P., Meseguer-Ruiz, O., and Latorre, C. (2021). The 2010–2020 'megadrought drives reduction in lake surface area in the Andes of central Chile (32°-36°S). J. Hydrol. Reg. Stu. 38, 100952. doi: 10.1016/j.ejrh.2021.100952
Gaete, H., Aránguiz, F., Cienfuegos, G., and Tejos, M. (2007). Metales pesados y toxicidad de aguas del río Aconcagua en Chile. Química Nova 30, 885–891. doi: 10.1590/S0100-40422007000400023
Garreaud, R. D., Alvarez-Garreton, C., Barichivich, J., Boisier, J. P., Christie, D., Galleguillos, M., et al. (2017). The 2010–2015 megadrought in central Chile: Impacts on regional hydroclimate and vegetation. Hydrol. Earth Syst. Sci. 21, 6307–6327. doi: 10.5194/hess-21-6307-2017
Garreaud, R. D., Boisier, J. P., Rondanelli, R., Montecinos, A., Sepúlveda, H. H., and Veloso-Aguila, D. (2020). The central Chile mega drought (2010–2018): a climate dynamics perspective. Int. J. Climatol. 40, 421–439. doi: 10.1002/joc.6219
Gayo, E. M., Muñoz, A. A., Maldonado, A., Lavergne, C., Francois, J. P., Rodríguez, D., et al. (2022). A cross-cutting approach for relating anthropocene, environmental injustice and sacrifice zones. Earth's Future 10, e2021EF. doi: 10.1029/2021EF002217
Grimm, E. C. (1987). CONISS: a FORTRAN 77 program for stratigraphically constrained cluster analysis by the method of incremental sum of squares. Comput. Geosci. 13, 13–35. doi: 10.1016/0098-3004(87)90022-7
Hao, Q., Oldfield, F., Bloemendal, J., and Guo, Z. (2008). The magnetic properties of loess and paleosol samples from the Chinese Loess Plateau spanning the last 22 million years. Palaeogeography Palaeoecol. 260, 389–404. doi: 10.1016/j.palaeo.2007.11.010
Higueras, P., Oyarzun, R., Oyarzún, J., Maturana, H., Lillo, J., and Morata, D. (2004). Environmental assessment of copper-gold-mercury mining in the Andacollo and Punitaqui districts, northern Chile. Appl. Geochem. 19, 1855–1864. doi: 10.1016/j.apgeochem.2004.04.001
Hodel, F., Macouin, M., Triantafyllou, A., Carlut, J., Berger, J., Rousse, S., et al. (2017). Unusual massive magnetite veins and highly altered Cr-spinels as relics of a Cl-rich acidic hydrothermal event in Neoproterozoic serpentinites (Bou Azzer ophiolite, Anti-Atlas, Morocco). Precambrian Res. 300, 151–167. doi: 10.1016/j.precamres.2017.08.005
Hollings, P., Cooke, D., and Clark, A. (2005). Regional geochemistry of Tertiary igneous rocks in central Chile: implications for the geodynamic environment of giant porphyry copper and epithermal gold mineralization. Economic Geol. 100, 887–904. doi: 10.2113/gsecongeo.100.5.887
Lahav, E., and Whiley, A. W. (2007). Riego y Nutrición Mineral. Botánica, Producción y Usos. (Título Original: The Avocado, Botany, Production and Uses, pp 241-274. Ediciones Universitarias de Valparaíso. Valparaíso: Pontificia Universidad Católica de Valparaíso.
Le Goff, L., Blot, F., Peltier, A., Laffont, L., Becerra, S., Henríquez Ruiz, C., et al. (2022). From uncertainty to environmental impacts: reflection on the threats to water in Chacabuco Province (Chile): a combined approach in social sciences and geochemistry. Sust. Sci. 4, 1–19. doi: 10.1007/s11625-022-01127-w
Maher, B. A., MengYu, H., Roberts, H. M., and Wintle, A. G. (2003). Holocene loess accumulation and soil development at the western edge of the Chinese Loess Plateau: implications for magnetic proxies of palaeorainfall. Quaternary Sci. Rev. 22, 445–451. doi: 10.1016/S0277-3791(02)00188-9
Maher, B. A., and Taylor, R. M. (1988). Formation of ultrafine-grained magnetite in soils. Nature 336, 368–370. doi: 10.1038/336368a0
Maturana, J., Bello, M., and Manley, M. (1997). Antecedentes históricos y descripción del fenómeno El Niño, Oscilación del Sur. El Niño-La Niña 2000, 13–27.
Mena, A., Aguiar, P., Barreiro, J. D., Francés, G., Pérez Arlucea, M., Barreiro Lois, A., et al. (2011). El uso de la Tomografía Computarizada (TC) Como Técnica Sedimentaria: Aplicación en Testigos Oceánicos de la Cuenca Interior de Galicia (NW margen Ibérico).
Muñoz, A. A., Klock-Barría, K., Alvarez-Garreton, C., Aguilera-Betti, I., González-Reyes, Á., Lastra, J. A., et al. (2020). Water crisis in Petorca Basin, Chile: The combined effects of a mega-drought and water management. Water 12, 648. doi: 10.3390/w12030648
Muñoz, M., Fuentes, F., Vergara, M., Aguirr, L., Olov Nyström, J., Féraud, G., et al. (2006). Abanico East Formation: petrology and geochemistry of volcanic rocks behind the Cenozoic arc front in the Andean Cordillera, central Chile (33 50'S). Revista geológica de Chile 33, 109–140. doi: 10.4067/S0716-02082006000100005
Muñoz, P. (2013). Apuntes de Teledetección: índices de vegetación. Centro de Información de Recursos Naturales.
Naranjo, K. (2014). Evolución Geomorfológica asociada a la sedimentación 108 de LaCordillera de la Costa entre los Ríos Aconcagua y Cachapoal/Rapel. Chile: Universidad de Chile.
Panez-Pinto, A., Faúndez-Vergara, R., and Mansilla-Quiñones, C. (2017). Politización de la crisis hídrica en Chile: análisis del conflicto por el agua en la provincia de Petorca. Water Landscape. 10, 131–148. doi: 10.17561/at.10.3614
Radio Cooperativa. (2016). Empresa determinó causas del derrame de concentrado de cobre en Los Andes. (2016) Available online at: https://cooperativa.cl/noticias/pais/medioambiente/contaminacion/empresa-determino-causas-del-derrame-de-concentrado-de-cobre-en-los-andes/2016-02-28/141004.html (accessed February 28, 2016).
Rein, B., and Sirocko, F. (2002). In-situ reflectance spectroscopy–analyzing techniques for high-resolution pigment logging in sediment cores. Int. J. Earth Sci. 91, 950–954. doi: 10.1007/s00531-002-0264-0
Remeteiová, D., Ružičková, S., Mičková, V., Laubertová, M., and Slezáková, R. (2020). Evaluation of US EPA method 3052 microwave acid digestion for quantification of majority metals in waste printed circuit boards. Metals 10, 1511. doi: 10.3390/met10111511
Rivano, S., Sepúlveda, P., Boric, R., and Espiñeira, D. (1993). Hojas Quillota y Portillo, V Región. Servicio Nacional de Geología y Minería, Carta Geológica de Chile, 73.
Rouse, J. W., Haas, R. H., Schell, J. A., Deering, D. W., and Harlan, J. C. (1974). Monitoring the Vernal Advancement and Retrogradation (Green Wave Effect) of Natural Vegetation NASA/GSFC type III Final Report. Greenbelt, MD, USA.
Soto Bäuerle, M. V., Arriagada González, J., Castro Correa, C. P., Maerker, M., and Rodolfi, G. (2011). Relación entre el cambio de uso del suelo en la cuenca del Aconcagua y su litoral arenoso correlativo: Chile central. Revista de Geografía Norte Grande. 50, 187–202. doi: 10.4067/S0718-34022011000300011
Tapia, J., Mukherjee, A., Rodríguez, M. P., Murray, J., and Bhattacharya, P. (2022). Role of tectonics and climate on elevated arsenic in fluvial systems: Insights from surface water and sediments along regional transects of Chile. Environ. Pollut. 314, 120151. doi: 10.1016/j.envpol.2022.120151
Tauxe, L. (2005). Paleomagnetic Principles and Practice, Vol. 17. Cham: Springer Science and Business Media.
Von Gunten, L., Grosjean, M., Kamenik, C., Fujak, M., and Urrutia, R. (2012). Calibrating biogeochemical and physical climate proxies from non-varved 110 lake sediments with meteorological data: methods and case studies. J. Paleolimnol. 47, 583–600. doi: 10.1007/s10933-012-9582-9
Von Gunten, L., Grosjean, M., Rein, B., Urrutia, R., and Appleby, P. (2009). A quantitative high-resolution summer temperature reconstruction based on sedimentary pigments from Laguna Aculeo, central Chile, back to AD 850. The Holocene 19, 873–881. doi: 10.1177/0959683609336573
Yang, J., Xia, D., Chen, Z., Wang, S., Gao, F., Liu, X., et al. (2023). Differentiating detrital and pedogenic contributions to the magnetic properties of aeolian deposits in the southern Tibetan Plateau: implications for paleoclimatic reconstruction. Catena 220, 106736. doi: 10.1016/j.catena.2022.106736
Keywords: Aconcagua River Valley, environment/climatic variability, dam sediments, magnetic properties, metals concentrations, multi-proxy analysis
Citation: Jaque J, Melo Pinochet N, Aránguiz-Acuña A and Pizarro H (2023) Analysis of sediment from an irrigation dam in an agricultural valley impacted by the mega-drought in central Chile. Front. Ecol. Evol. 11:1179176. doi: 10.3389/fevo.2023.1179176
Received: 03 March 2023; Accepted: 29 May 2023;
Published: 30 June 2023.
Edited by:
Olga Solomina, Institute of Geography (RAS), RussiaReviewed by:
Abdelazim Negm, Zagazig University, EgyptJorge Mongil-Manso, Universidad Católica de Ávila, Spain
Copyright © 2023 Jaque, Melo Pinochet, Aránguiz-Acuña and Pizarro. This is an open-access article distributed under the terms of the Creative Commons Attribution License (CC BY). The use, distribution or reproduction in other forums is permitted, provided the original author(s) and the copyright owner(s) are credited and that the original publication in this journal is cited, in accordance with accepted academic practice. No use, distribution or reproduction is permitted which does not comply with these terms.
*Correspondence: Hector Pizarro, hpizarro@ing.uchile.cl
†These authors share first authorship