“Keep on rolling”: circulating cells in a botryllid ascidian torpor
 Yosef Hyams1,2
  Julia Panov3
  Elizaveta Taranenko3 Leonid Brodsky3
  Yuval Rinkevich4
  Baruch Rinkevich1*
- 1Israel Oceanographic and Limnological Research, National Institute of Oceanography, Haifa, Israel
- 2Marine Biology Department, Leon H. Charney School of Marine Sciences, University of Haifa, Haifa, Israel
- 3Tauber Bioinformatics Research Center, University of Haifa, Haifa, Israel
- 4Comprehensive Pneumology Center, Institute of Lung Biology and Disease, Helmholtz Zentrum Munchen, München, Germany
Hemocytes of the colonial tunicate Botrylloides leachii play important roles throughout the animal’s life span, including transport and storage of nutrients, respiration, regeneration, budding, sexual reproduction, defense responses, and tunic generation. Nevertheless, very little is known about the involvement of hemocytes or their functions in the remarkable torpor phenomenon characteristic of this species. Changes in water temperature result in rapid and dramatic morphological changes in which the entire colony degenerates, leaving remnants devoid of feeding and reproductive organs that form compacted and opaque masses of lacunae filled with hemocyte cells. Here, we study hemocyte populations in active and hibernating colonies at the morphological, cellular, and molecular levels using histological and transmission electron microscopy observations, primary cell culture observations, and single-cell transcriptomics. This study defines and captures the different cell types in torpor and control stages and further highlights torpor-associated cell types. Multinucleated cells (MNCs) appear only in torpor stages and under in vitro conditions and are most likely formed from cell fusions. Bacteria-carrying phagocytes are cells specific to a torpor state with yet unknown function. Single-cell sequencing analysis revealed 14 transcriptionally distinct cell clusters. The hibernating colonies had a low throughput of cells, yet all but two transcriptional clusters were present in hibernating colonies. A comparison of gene expressions in the same cell clusters revealed torpor-specific transcriptional modalities in seven of the cell types. Single-cell sequencing generates an enormous amount of valuable data that can serve researchers in future studies of ascidians and torpor phenomena and provide opportunities for future meta-analysis studies. However, the technical challenges create bottlenecks for the full exploitation of single-cell RNA sequencing (scRNA-seq) data. We developed an interactive, searchable, and intuitive cloud-based database where researchers can easily explore the single-cell transcriptomics data generated by us from active and torpid B. leachii colonies. The data can be interrogated and downloaded for further analysis and comparative studies. The Dashboard is available at: http://bleachii.tauberbioinformatics.org/seurat?id=Bleachii-v1. By elucidating hemocyte populations during hibernation, these results provide the basis for future studies of hibernation at the cellular and molecular levels in B. leachii and comparative studies of hibernation phenomena in other organisms.
1 Introduction
Botrylloides aff. leachii (B. leachii) are colonial ascidians that reside under rocks in shallow subtidal zones. Each colony consists of genetically identical units, zooids, which are embedded into a semi-translucent gelatinous organic matrix, the tunic. Each zooid has its own heart and hemocoelic circulatory system, which is shared by the whole colony as well as the entire set of zooids and is embedded into a tunic closed by terminal extensions of the vasculature, termed ampullae.
One unique characteristic of ascidians is their remarkable ability to regenerate full-size colonies after a prolonged dormancy state, known as torpor. B. leachii, similar to other marine and land-dwelling multicellular organisms, have the ability to enter dormancy states as a response to environmental and biological cues (Hand and Hardewig, 1996; Caceres, 1997; Storey, 2002; Storey, 2010). During dormancy, the organism expresses discreet physiological qualities and behaviors, allowing it to tolerate severe environmental settings through phases of metabolic decline, detained development, and caloric restriction (Storey, 2010). Certain organisms display daily dormancy bouts, while other taxa exhibit seasonal dormancy, termed “hibernation” when developing during the winter months and “aestivation” when taking place throughout summer (Storey and Storey, 2011). While many organisms are able to enter the dormancy state, torpor in B. leachii and other colonial ascidians is remarkable. The ascidians are capable of regenerating into a full-size colony from a small fraction intact during dormancy.
Recent studies have shown that torpor in B. leachii colonies begins with developmental arrest and is followed by tissue degradation until only remnants of the original size remain (Hyams et al., 2017). During this state, the colony lacks feeding and reproductive organs but is composed of vascular carpets made up of abnormally condensed and twisted masses of lacunae, which are packed with opaque piles of hemocyte cells (Figure 1).
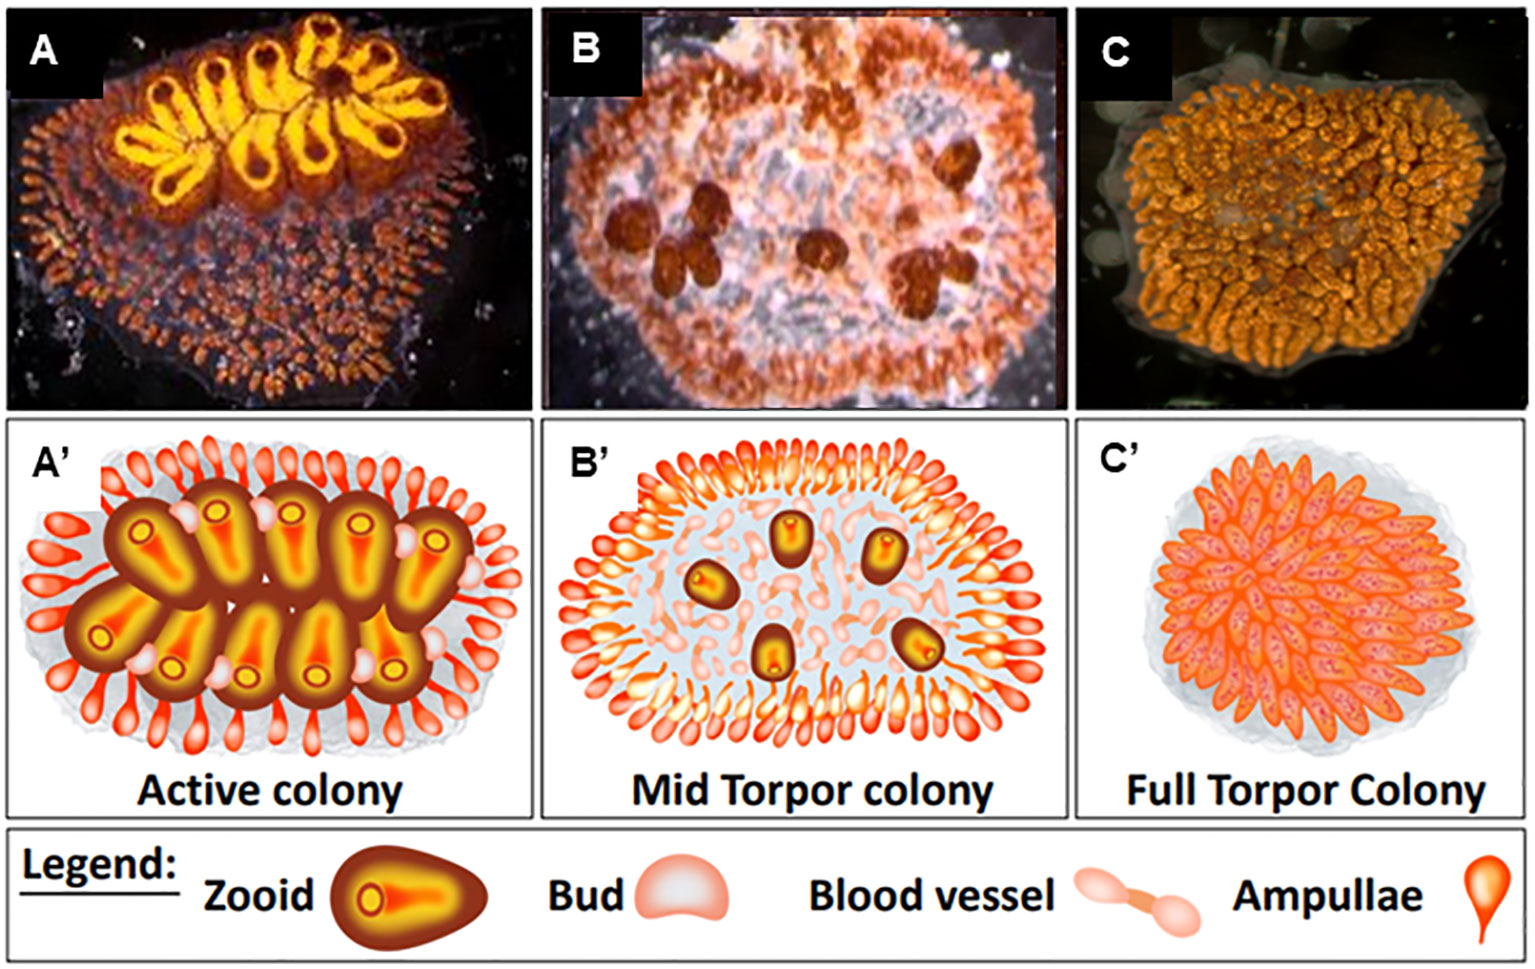
Figure 1 Distinct physiological states of Botrylloides leachii colony. (A′–C′) Schematic illustrations of (A–C) physiological states. (A, A′) Active colony. All functional zooids are arranged in two parallel chains of colonial systems. Each single zooid contains one functional oral siphon, and 1–4 parallel buds develop on the zooid epithelium walls. (B, B′) Mid-torpor colonies, small and less developed round-shaped zooids are detached from each other, and some of the developing buds are further detached from parent zooids. (C, C′) Fully torpid colony where the functional zooids and their buds are relapsed within the colony’s tunic matrix forming a compacted mass of vasculature. Bars, 2 mm. Illustrations (A′–C′) made by Oshrat Ben-Hamo.
In botryllid ascidians, hemocytes exert a wide range of functions, including transportation and storage of nutrients (Cima et al., 2016), respiration (Ballarin and Cima, 2005), whole-body regeneration (Rinkevich et al., 1995; Rinkevich et al., 2007; Rinkevich et al., 2008), budding (Brunetti, 1976; Voskoboynik et al., 2007; Rinkevich et al., 2013), sexual reproduction (Blanchoud et al., 2018a), defense reactions (Rinkevich and Shapira, 1998; Cima et al., 2016; Ballarin et al., 2021), and tunic generation (Hirose et al., 1995). While B. leachii hemocyte compositions and morphologies were investigated previously using cytological, histochemical, and histoenzymatical analyses (Cima et al., 2001; Cima et al., 2016; Blanchoud et al., 2017; Cima, 2022; Zeng et al., 2022), the classification of hemocyte cell types and their functions remains ambiguous (Vanni et al., 2022). The different classification criteria, the lack of unified terminology, the high structural diversity of hemocytes among ascidian species, and poorly documented intermediate stages of differentiation and dissimilarity of identical hemocytes resulting from different fixation methods (Burighel et al., 1997; Cima et al., 2001; Blanchoud et al., 2017) have all contributed to the challenges of cell classification and comparative studies.
Previously, we observed that during torpor, the regular distribution of hemocyte populations is altered, and two new cell types appear (Hyams et al., 2017; Hyams et al., 2022). The multinucleated cells (MNCs), containing 2–11 nuclei each, express high levels of Piwi, a well-characterized and evolutionary conserved stemness marker (Rinkevich et al., 2010), indicating their involvement in the regeneration abilities of B. leachii. Thus, we previously suggested that MNCs should be considered as stem cells. Bacteria-bearing phagocytes appeared at full torpor and comprised 1%–5% of the hemolymph cell population. Each cell contained 4–25 bacteria cells sizing 1–2 μm (Hyams et al., 2022).
Furthermore, we previously investigated the gene expression patterns of B. leachii colonies during active and torpor states in two colonial compartments, the whole zooid and whole ampullae (Hyams et al., 2022). Our findings showed that gene expression profiles change significantly in the torpor state compared to the active, naive state of the colony in both compartments. Changes in cellular composition during torpor contribute to the observed changes in gene expression profiles. Hemocyte populations have been shown to play a critical role in the ability of B. leachii to enter and exit torpor, highlighting the importance of understanding the cellular and molecular changes that occur during this process.
Several methods are available to study cellular populations. To analyze and study morphological structure and characteristics, histological analysis can be used coupled with histochemical staining. Transmission electron microscopy (TEM) is another method of visualizing morphological characteristics coupled with the use of antibodies to highlight proteins of interest. In addition, the development of colonies on the cellular level can be studied in primary cell cultures where the colonies are monitored daily. Finally, single-cell gene expression techniques have been used widely to study complex tissue for identifying transcriptome profiles of different cell populations. In ascidians, single-cell sequencing was previously used to investigate embryonic development (Winkley et al., 2021), as well as the development of the larval nervous system (Sharma et al., 2019).
In this study, we used the above-mentioned techniques to investigate the morphological and physiological changes as well as changes in gene expression patterns in individual cells between active and dormant states of B. leachii colonies.
2 Methods
2.1 Animals
Colonies of B. aff. leachi (hereby termed B. leachii) (Reem et al., 2018) were collected from the undersides of intertidal stones along the Israeli Mediterranean coast at depths ranging from 0.5 to 4 m. The colonies, along with the thin calcareous substrate layer of the stone to which they were attached, were carefully peeled off using industrial razor blades, following the protocol described in Rinkevich et al. (2007). After collection, specimens of B. leachii were transported to the seawater system at the National Institute of Oceanography (Haifa). Each colony was then tied onto a single 5 × 7.5 cm glass slide using a thin cotton string. The colonies were maintained in 25-L seawater tanks using established husbandry protocols (Rinkevich and Shapira, 1998). They were fed a varied diet on a daily basis, consisting of commercial powdered plankton, unicellular algae, and freeze-dried rotifers. Within a few days, many of the B. leachii specimens had started to glide onto or had completely moved to the glass slides, becoming firmly attached to the glass substrates. All colonies were cleaned once a week using fine brushes and industrial razor blades. Newly developing B. leachii colonies were cut by razor blades between systems to form independent fragments (ramets), each containing two to three genetically identical colonial systems (Rinkevich et al., 1996). Each ramet was then transferred to a separate glass slide to allow continual development into a large colony. In this way, 20 genotypes of ramets were developed and underwent further experimental conditioning. The ramets were acclimatized for a period of 2 weeks before any further experimental procedures.
2.2 Experimental assay
The generated 20 genotypes were randomly split into three experimental sets (each set containing at least one ramet of each genotype), reflecting three distinct physiological states: a) “active colonies” cultured in 20°C standing seawater tanks (Figures 1A, A′, n = 10). In these colonies, all functional zooids are arranged in two parallel chains of colonial systems. Each single zooid contains one functional oral siphon, and one to four parallel buds develop on the zooid epithelium walls. b) “Mid torpor” colonies (Hyams et al., 2017) (Figures 1B, B′, n = 10) were cultured for 5 days in 15°C standing seawater tanks. In this state, the zooids become small, round-shaped, and less developed. They detach from each other, and some of the developing buds further detach from the parent zooids. c) “Torpid colonies”, fully hibernating ramets, were maintained for 20 days in 15°C standing seawater tanks (Figures 1C, C′, n = 10). In this state, functional zooids and their buds are relapsed within the colony’s tunic matrix, forming a compacted mass of vasculature. All experimental ramets in the three distinct physiological states were examined daily for morphological changes using a stereomicroscope (Nikon SMZ1000) and photographed using a stereomicroscope camera (Olympus XC 30) to monitor their morphological statuses.
2.3 Histology
Active (n = 6) and torpid (n = 6) ramets were fixed for 1–2 h in Bouin’s solution and dehydrated in a graded series of ethanol and butanol (70%–100%), followed by tissue embedding in paraffin wax. By employing a hand-operated microtome (Leica 2045, Nußloch, Germany), cross serial sections (4–8 µm) were cut. The histological sections were de-waxed and stained with either alum hematoxylin and eosin (H&E) to elucidate morphological details or the reagent Schiff Feulgen reaction to stain DNA (Lillie, 1977).
2.4 Hemocyte characterization along active and torpor states
Histological sections from B. leachii colonies in the three distinct physiological states were used for the characterization of changes in hemocyte populations during the transition from active to torpor states: “active” colonies (n = 3), “mid torpor” colonies (n = 6), and “fully torpid” colonies (n = 5). Identifications of the different hemocyte cell populations were performed in an upright microscope (BX-50, Olympus, Hamburg, Germany). Four ampulla sections (10 µm each) from each ramet were photographed through a digital color camera (Olympus DP73, Hamburg, Germany), and the hemocyte populations for each physiological state were documented. Hemocyte descriptions followed the terminologies of Cima et al. (Cima et al., 2001; Cima, 2022), Hirose et al. (2003), and Hyams et al. (2017). The relative abundance of each type of hemocyte was determined by dividing the number of observed cells of a particular type by the total number of cells per square millimeter on the histological slide. Student’s t-test was used for statistical analysis.
2.5 Development of primary cell cultures
Whole populations of circulating hemocytes were isolated from the peripheral extended ampullae of six active and six torpid ramets and dispersed among the wells of 96-well plates. The cells were cultured in an incubator as described in Rinkevich and Rabinowitz (1993). Each well was observed under a Nikon inverted phase contrast microscope every day for 30 days. All morphological changes and changes in cell populations were quantified and recorded.
2.6 Transmission electron microscopy
“Active” (n = 4), “mid torpor” (n = 3), and “torpid” (n = 4) ramets were fixed at room temperature in 4% glutaraldehyde (EM grade cat: G 5882, Sigma, Roedermark, Germany), post-fixed in 1% OsO4 in ddH2O for 1 h (4°C), then washed (×3) in cold ddH2O, and inserted for overnight into 1% uranyl acetate diluted in ddH2O. Dehydration was performed at room temperature in graded ethanol series that included immersion (10 min each) in 50%, 70% and 95%, and then in 100% (×2, 10 min each) and transferred to propylene oxide (PO; 15 min); then, the samples were submerged in 1:1 PO/Epon for 1 h, in 1:2 PO/Epon overnight, and in 100% Epon for 2–3 h. Each ramet was inserted individually in a labeled mold. The mold was filled with 100% Epon and was allowed to polymerize (65°C oven, 24 h). Ultrathin sections (80–90 nm) were cut using an ultramicrotome (Ultracut, Leica) equipped with a diamond knife (Diatome), placed on 300 mesh nickel grids (Polysciences Inc., Warrington, PA, USA), and stained with uranyl acetate and lead citrate. Analyses were performed on a Jeol 1230 TEM at 80 kV. Digital photographs were taken using a Gatan MultiScan 701 camera.
2.7 Immunolocalization in TEM
Colonial ramets were fixed in 4% paraformaldehyde solution (EM grade cat: G 5882, Sigma, Germany) with 0.05% glutaraldehyde in phosphate buffer, washed several times in phosphate-buffered saline (PBS), and embedded into 2.3 M sucrose solution overnight (4°C). Ramets were mounted on pins for cryo-ultramicrotomy and then inserted in liquid nitrogen. Ultrathin cryosections (80–90 nm) were cut using an ultramicrotome machine (Ultracut; Leica) equipped with a diamond knife (Diatome) within a cryo-sectioning chamber. Each individual thawed cryo-section was transferred to a Formvar- and carbon-coated EM grid (Nickel) within a drop of 2.3 M sucrose solution. Non-specific epitopes were blocked with 1% bovine serum albumin (BSA) in PBS (1 h), and sections were then incubated with rabbit anti-Bl-Piwi antibodies (2 h, room temperature; Bl-Piwi2: rabbit polyclonal anti-B. leachii 1:4,000, Genemed Synthesis Inc., San Antonio, TX, USA) developed in the lab (Rinkevich et al., 2010), followed by incubation (1 h) with protein A gold conjugates (15-nm gold particles). The ultrathin sections were then counterstained (10 min on ice) using 0.5% uranyl acetate in 2% methylcellulose. Immunogold-labeled sections were analyzed in a Jeol 1230 TEM at 80 kV. Digital photographs were taken using a Gatan MultiScan 701 camera. For negative controls, the same protocol as above was used without the primary antibody.
2.8 Single-cell RNA sequencing
Whole hemocyte cells were extracted by puncturing marginal ampullae with a needle (27G) according to the established technique (Rinkevich et al., 2010). The cells of each sample were collected in a 1.5-ml tube, and the number of cells was estimated using a hemocytometer under the microscope. The number of hemocytes was diluted in different samples in order to start with a similar number of cells. Assays were prepared following the Drop-seq protocol (Bageritz and Raddi, 2019). Single cells (100/µl) from hemocyte suspensions of active (n = 3) and torpid (n = 2) colonies were inserted in a droplet containing barcoded beads (120/µl, ChemGenes Corporation, Wilmington, MA, USA) using a microfluidic polydimethylsiloxane device (Nanoshift) at rates of 4,000 µl/h for 15 min each colony. Droplet breakage was then performed using perfluoro octanol (Sigma-Aldrich). Beads were harvested, the hybridized mRNA transcripts were reverse transcribed (Maxima RT, Thermo Fisher, Waltham, MA, USA) and the left primers were digested by exonuclease I (New England Biolabs, Ipswich, MA, USA). After that, the beads were washed, counted, and aliquoted for pre-amplification (2,000 beads/reaction, equals ~100 cells/reaction) using a polymerase chain reaction (PCR) solution (12 cycles; primer: AAGCAGTGGTATCAACGCAGAGT [100 µM], 2× KAPA HiFi Hotstart Readymix [KAPA Biosystems, Woburn, MA, USA]). Cycle conditions: 3 min 95°C, 4 cycles of 20 s 98°C, 45 s 65°C, 3 min 72°C, followed by 8 cycles of 20 s 98°C, 20 s 67°C, 3 min 72°C, and then 5 min at 72°C. The PCR products of all individual cells from each sample were pooled together and purified (×2) by 0.6× clean-up beads (CleanNA, Waddinxveen, Netherlands), according to the manufacturer’s instructions. The cDNA quality of pooled samples (n = 5) was employed using Bioanalyzer High Sensitivity DNA Analysis (Agilent, Santa Clara, CA, USA). Then, 1 ng of pre-amplified cDNA from the estimated 1,000 cells in each sample was tagged by Nextera XT (Illumina, San Diego, CA, USA) with a custom P5 primer (Integrated DNA Technologies, Coralville, IA, USA). Single-cell libraries were sequenced in a 100-bp paired-end run on the Illumina HiSeq4000 using a 0.2 nM denatured sample and 5% PhiX spike-in. For read 1 priming, 0.5 µM Read1CustSeqB (primer sequence: GCCTGTCCGCGGAAGCAGTGGTATCAACGCAGAGTAC) was used.
2.9 Bioinformatics data analyses of scRNA-seq
Reads were mapped to the B. leachii reference genome (Blanchoud et al., 2018b) using a Drop-seq alignment pipeline with default parameters (https://github.com/broadinstitute/Drop-seq). The resulting raw expression tables were further analyzed using the Seurat R package (Satija et al., 2015). Due to very low unique molecular identifier (UMI) counts, it was decided not to filter any low-expressing cells in the torpor colonies. The gene expressions across all samples were normalized, and variable genes were selected using the Seurat package (Shalek et al., 2014). Principal component analysis (PCA) was performed on variable genes only. A total of 50 first principal components were used for the non-linear dimensionality reduction using the UMAP algorithm (McInnes et al., 2018). UMAP was performed with default parameters. To eliminate the batch effect after merging the cells from the active and torpid colonies, the Harmony algorithm was utilized (Korsunsky et al., 2019). The clustering of cells in the merged and batch-corrected data was performed using the Seurat implementation of the Louvain algorithm with default parameters (Satija et al., 2015).
To identify the markers of cell clusters, all genes with low variability across clusters were first filtered out. Next, using Seurat’s built-in function “FindMarkers”, marker genes were assigned for each of the identified clusters of cells. The function compares the expression of genes in cells of a cluster to its expression in all other cells and identifies a gene as a marker for the cluster if the gene’s expression has a log2 Fold Change > 1 and a p-value <0.05 using a Wilcoxon rank sum test. Annotation of marker genes was performed using the Aniseed database (Dardaillon et al., 2020) and BLASTx (Boratyn et al., 2013) alignment of sequences converted to protein sequences on all ascidian proteins. Overall functional annotation of the collection of all marker genes for each cluster was performed using the overrepresentation of Gene Ontology (GO) terms based on the ontological data from the Aniseed database (Dardaillon et al., 2020).
The density of expression for each cluster was calculated following Petegrosso and colleagues (Petegrosso et al., 2019). The density of expression was taken as a proxy of the overall activity of the cell cluster and calculated as the sum of expressions of all genes in the cells within a cluster divided by the number of cells in the cluster. Differential gene expression was inferred using the built-in Seurat “FindMarkers” function utilizing the Wilcoxon rank sum test for each cluster separately between active and torpid colonies. The threshold for significance was set as an adjusted p-value <0.05. Genes were annotated using the Aniseed GO terms database (Dardaillon et al., 2020).
All the obtained results have been effectively integrated into an intuitive and interactive Dashboard, providing users with seamless access and a user-friendly interface for convenient referencing and exploration. The Dashboard allows for effortless navigation through the various findings, enabling users to visualize and interpret the data in a comprehensive and efficient manner. Its user-friendly design ensures that accessing and exploring the results are both intuitive and straightforward. The Dashboard can be accessed at the following URL: http://bleachii.tauberbioinformatics.org/seurat?id=Bleachii-v1.
3 Results
The hemocyte populations in naive (active) colonies of B. leachii have been previously characterized by us and other laboratories (Rinkevich and Rabinowitz, 1993; Cima et al., 2001; Hirose et al., 2003; Blanchoud et al., 2017; Hyams et al., 2017; Jiménez-Merino et al., 2019; Cima, 2022; Hyams et al., 2022). Furthermore, we previously reported on cellular changes in torpid colonies, including the presence of two cell types that are almost unique to the torpor state: MNCs and bacteria-bearing cells (Hyams et al., 2017; Hyams et al., 2022). In this study, we utilized multiple imaging and sequencing techniques to systematically observe changes in the cellular composition of B. leachii colonies in both active and torpid states.
3.1 Morphological observations of B. leachii hemocytes in active and torpid colonies
As a first step toward understanding the cellular changes of B. leachii colonies in torpor conditions, the hematological properties of active and torpid B. leachii colonies were characterized. Hemocytes were collected from ampullae of B. leachii colonies under the stereomicroscope, and nine cell types were identified in histological sections. Figure 2 and Table 1 show the nine main types of hemocytes observed in active and torpid colonies of B. leachii. Hemoblasts are small, mostly spherical 3–5-µm cells with a high nucleocytoplasmic ratio. The nucleus is round and 2–3 µm in size and occupies most of the cell volume with a central nucleolus, often unrecognizable (Figure 2A). The cytoplasm of the observed cells is basophilic, indicating active biosynthesis. It forms a thin, homogeneous peripheral layer and occasionally exhibits small pseudopodia. MNCs are cells that appear mostly in the torpor state. These cells are spherical and 7–30 µm in size, with a diverse number of nuclei (2–10) that are 2 µm each (Figure 2B). Hyaline amebocytes have diverse ameboid shapes and vary in size, 8–25 µm. The cells often have a fusiform shape (Figures 2C, D). The cytoplasm contains granules (Figure 2C) and/or spherical vacuoles (Figure 2D) and carries lamellipodia and/or filopodia. The nucleus is large, 3–4 µm in size, and spherical or oval and looks grainy due to its highly basophilic content. Macrophage-like cells are large ameboid phagocytes, 10 µm to 25 µm in size, and spherical or oval when empty, mostly with engulfed heterogeneous material that occupies most of the cell volume (Figure 2E). Sometimes, granules and vacuoles are seen. Color morphs: black, brown, yellow colors, orange, pink, red, and blue. The nucleus is elliptic, 3 µm in size, and positioned at the periphery of the cell. Granular amebocyte is an ameboid cell, round or oval in shape, and 5–7 µm in size. These cells contain homogenous granules in the cytoplasm, which are stained gray by alum H&E stain. The nucleus is smooth, round, and 1–2 µm in size and may appear at any position within the cell (Figure 2F). Compartment cells contain clear compartments stained in pink and orange (Figure 2G). The nucleus is smooth and 1 µm in size and may appear in any part of the cell. Morula cells are mostly spherical cells and 8–10 µm in size. The cytoplasm is eosinophilic containing diverse vacuoles and granules, which are stained as pink, orange, and red with black and brown color morphs. The nucleus is located at the periphery and is hardly recognizable (Figure 2H). Pigment cells are spherical, grainy cells and 8 to 13 µm in size containing brown granules (Figure 2I). The nucleus is round, smooth, and 2 µm in size and may appear in any part of the cell. Nephrocytes are very similar to pigment cells with lighter brownish (Figure 2J) or yellow granules (Figure 2K).
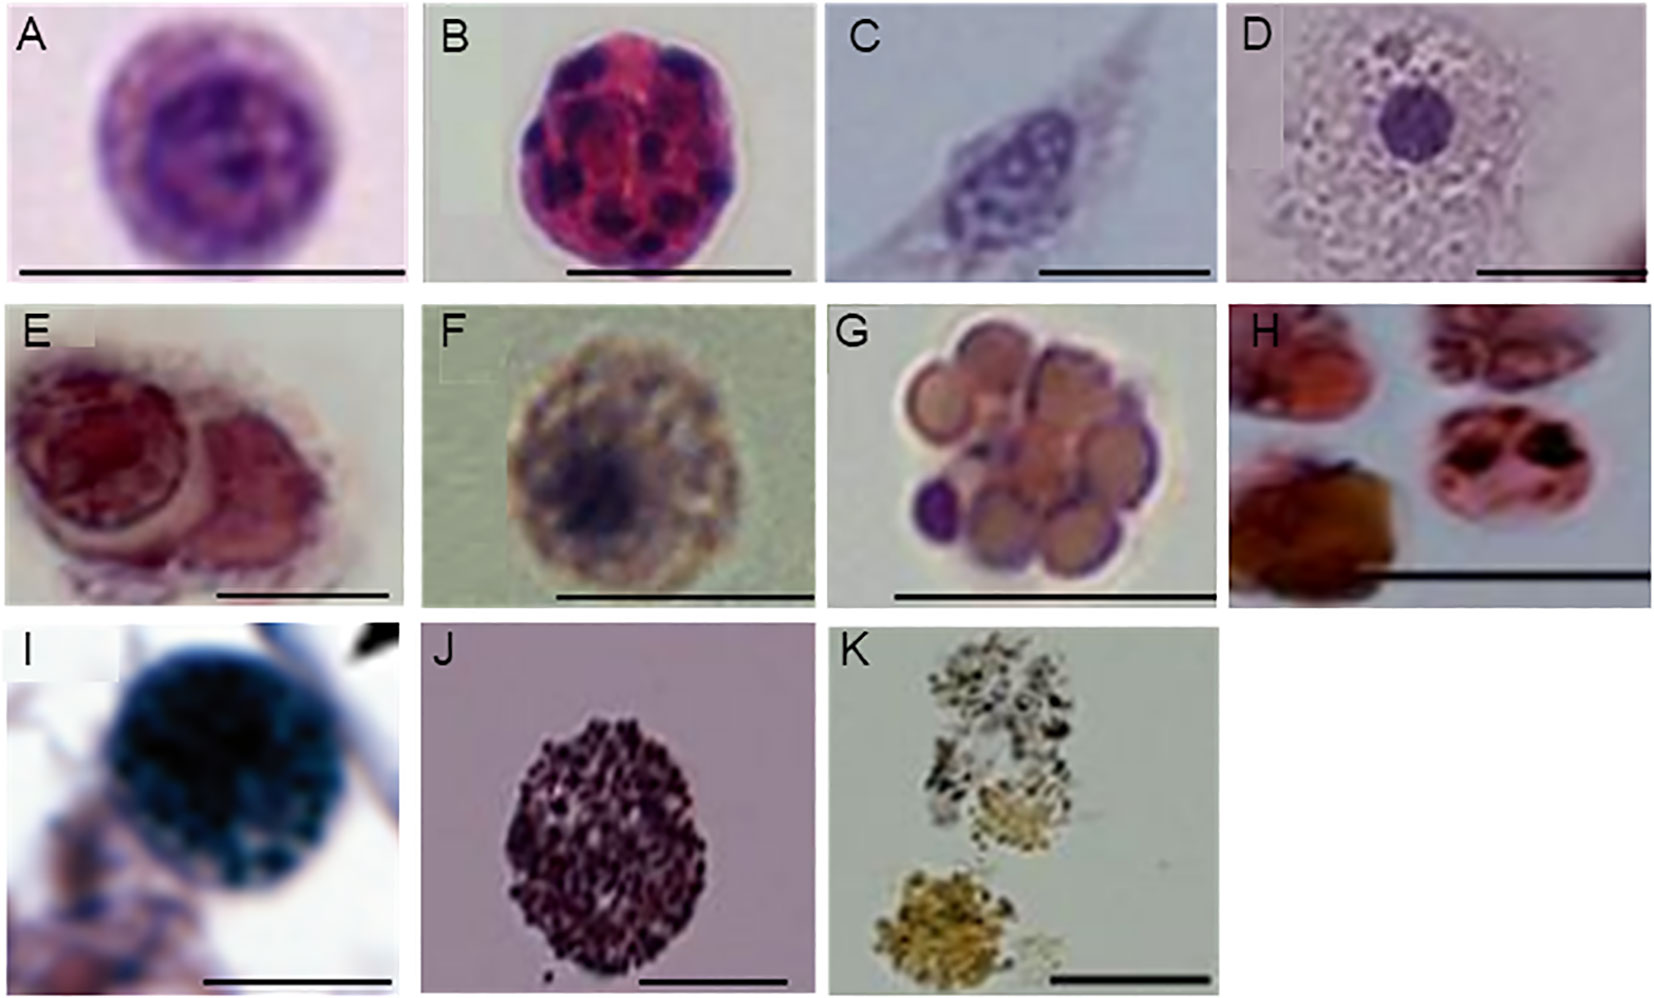
Figure 2 Characterization of Botrylloides leachii hemocytes. (A) Hemoblasts: characterized by a large nucleus, the associated nucleolus, and thin layer of cytoplasm. (B) Multinucleated cell (MNC): exhibits 10 nuclei. (C, D) Hyaline amebocytes: two representative types. (C) Hyaline amebocytes: filopodial cytoplasm, oval grainy nucleus. (D) Hyaline amebocytes: spreading cytoplasm that contains clear vacuoles and a spherical nucleus. (E) Macrophage-like cells: variable appearance of engulfed material, an elliptic peripheral nucleus (arrows). (F) Granular amebocyte: characterized by homogeneous granules and a small spherical nucleus. (G) Compartment cell: contains diverse vacuoles and a small peripheral nucleus. (H) Morula cells: contain vacuoles and granules in the cytoplasm with various contents. (I) Pigment cell: features micro-grainy cytoplasm with granules of different sizes. (J, K) Nephrocytes: bright granules, varying in color from brown to yellow. Bars, 10 µm.
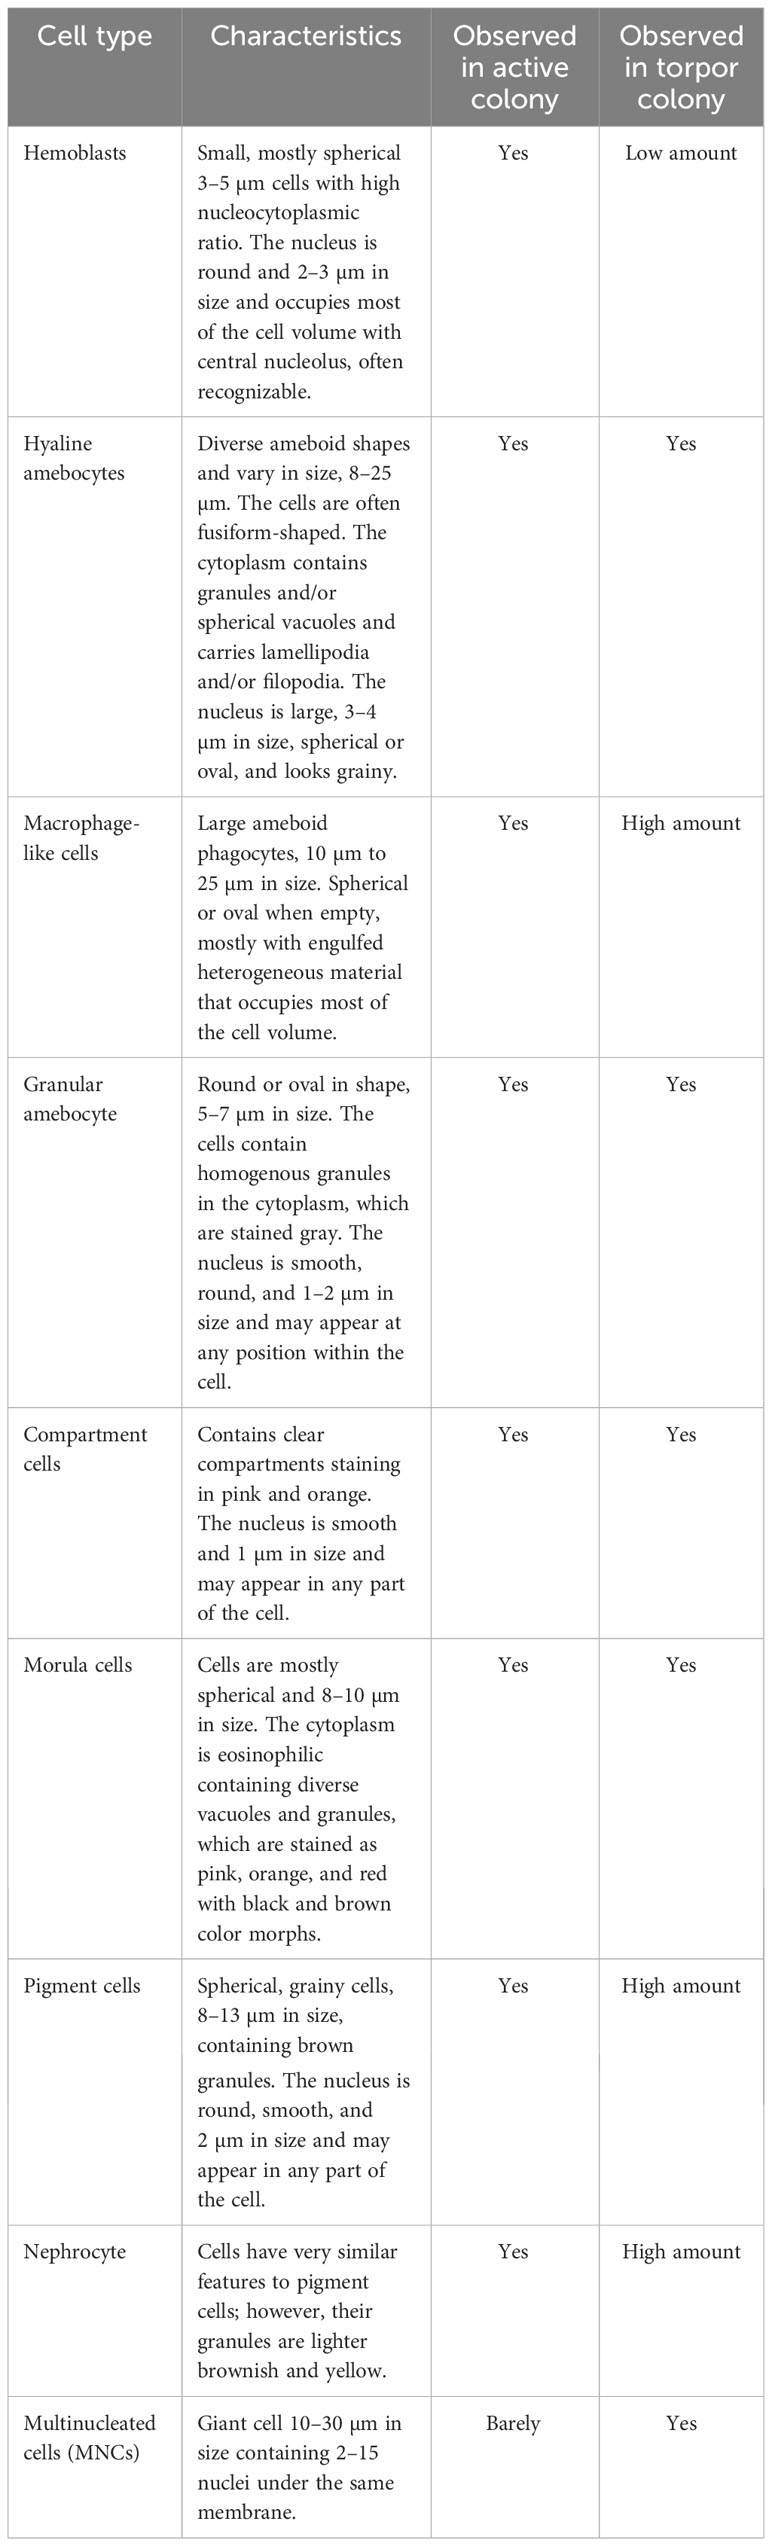
Table 1 Hemocyte populations and their characteristics in Botrylloides leachii active and hibernating colonies.
3.2 Hemocyte cell type population changes under torpor conditions
We next systematically evaluated four distinct types of cells, namely, hemoblasts, multinucleated cells, macrophage-like cells, and vacuolated cells, in active, mid-torpor, and fully torpid colonies of B. leachii. The mid-torpor phase represents the period when the colony is under physiological stress and enters the torpor state (see Methods).
To monitor variations in cell numbers across different physiological states, we selected three B. leachii colonies with distinct genotypes. We induced morphological and physiological changes in each colony corresponding to the active, mid-torpor, and full-torpor states using experimental conditioning (see Methods). For each colony and in each of the three states, we randomly selected and examined five ampullae to determine the number of cells of each of the aforementioned cell types. Cells were counted in the H&E-stained histological sections. Figure 3 presents the changes in the distribution of cell number per square millimeter of histological slide across the three physiological states (Supplementary Table 1).
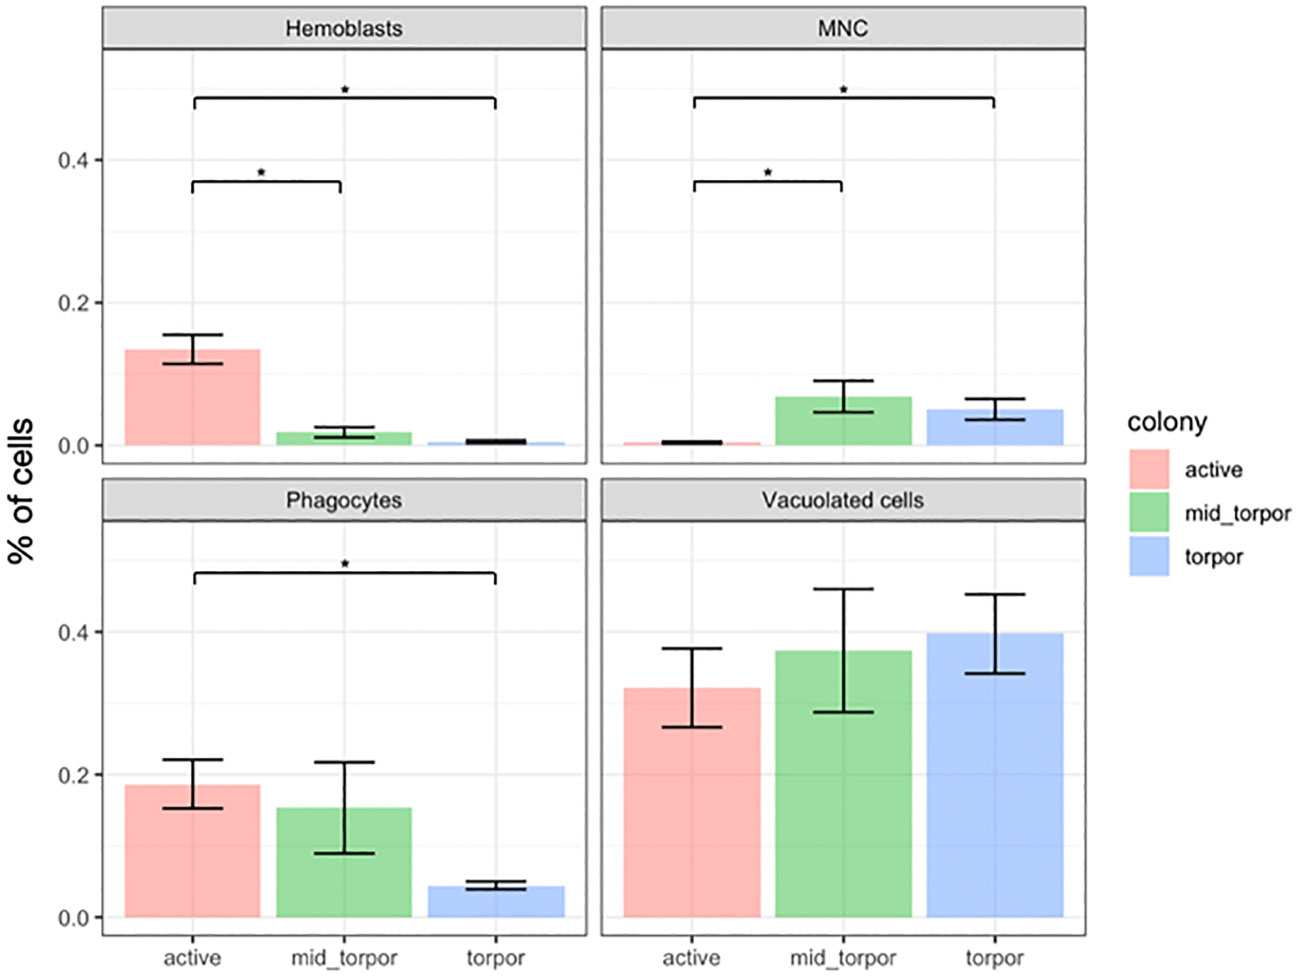
Figure 3 Cell frequency variations across physiological states in Botrylloides leachii colonies. Changes in percent of four types of hemocytes across three physiological states of B. leachii colonies. The number of cells was calculated per square millimeter of histological slide. Asterisk (*) indicates significant change (p-value <0.05) in cell number between physiological states as calculated by Student’s t-test.
We observed a significant decline in the number of hemoblast cells during the torpor state. Initially, the hemoblasts accounted for approximately 14% of all cells in active colonies. However, their population gradually decreased to approximately 2% during the mid-torpor state and further plummeted to a mere 0.5% of the entire cell population during full torpor (Figure 3; Supplementary Table 1).
Conversely, the number of multinucleated cells exhibited an increase during the mid-torpor and torpor states. These cells were rarely observed in active colonies, constituting less than 0.5% of all observed cells. In contrast, they accounted for over 6% of the cell population in mid-torpor colonies. The number of MNCs slightly declined during full torpor, representing 5% of all observed cells (Figure 3; Supplementary Table 1).
Phagocytes were observed as one of the most abundant cell types in active colonies, comprising more than 18% of the total cell population. Similarly, in mid-torpid colonies, the frequency of phagocytes remained high, constituting 15% of all cells. However, a significant decline in the number of phagocyte cells was observed in torpid colonies, where they accounted for less than 5% of the entire cell population (Figure 3; Supplementary Table 1).
The prevalence of vacuolated cells, which include pigment cells and nephrocyte cells, increased during the torpor state; however, the increase was not statistically significant due to high variation between the observations. Initially, vacuolated cells accounted for just over 32% of all observed cells in active colonies. During the mid-torpor phase, the proportion of vacuolated cells rose to 37%, and in the torpor state, these cells constituted almost 40% of all observed cells (Figure 3; Supplementary Table 1).
3.3 Primary cell cultures
We further validated our histological observations of live active and torpid B. leachii colonies using the primary cell cultures of circulating hemocyte cells from active (n = 6) and torpid (n = 6) ramets. We incubated cell cultures derived from both active and torpid colonies under similar conditions (see Methods) and observed them daily for a period of 30 days. By monitoring the cell cultures over time, we were able to investigate the changes that cell cultures from two distinct physiological conditions underwent and assess the effects of these conditions on the cellular behavior of B. leachii.
Our observations of the cell cultures from active and torpid colonies at day 0 were consistent with our histological observations of the colonies. Cell cultures prepared from active colonies were dominated by vacuolated cells and hemoblasts with sizes ranging from 3 to 15 µm. At this stage (day 0), MNCs were rarely observed in the active colony cultures (Figure 4A). However, the cell cultures of the hibernating colony at day 0 were dominated by hemocytes with sizes ranging from 8 to 30 µm, with vacuolated cells and MNCs being the most common types (Figures 4D, D1, D2) and hemoblasts being rare. The primary cultures from the hibernating colonies containing many MNCs remained stable over the course of the experimental procedure (30 days) with no significant cellular changes (Figures 4E, F). The cell cultures from active colonies underwent cellular changes during the experiment. On day 3, we observed the initiation of cell aggregations, with 3–25 cells per cell aggregate (Figures 4B, C, cell aggregates are denoted by arrowheads). The cell aggregates became more frequent with the passage of time.
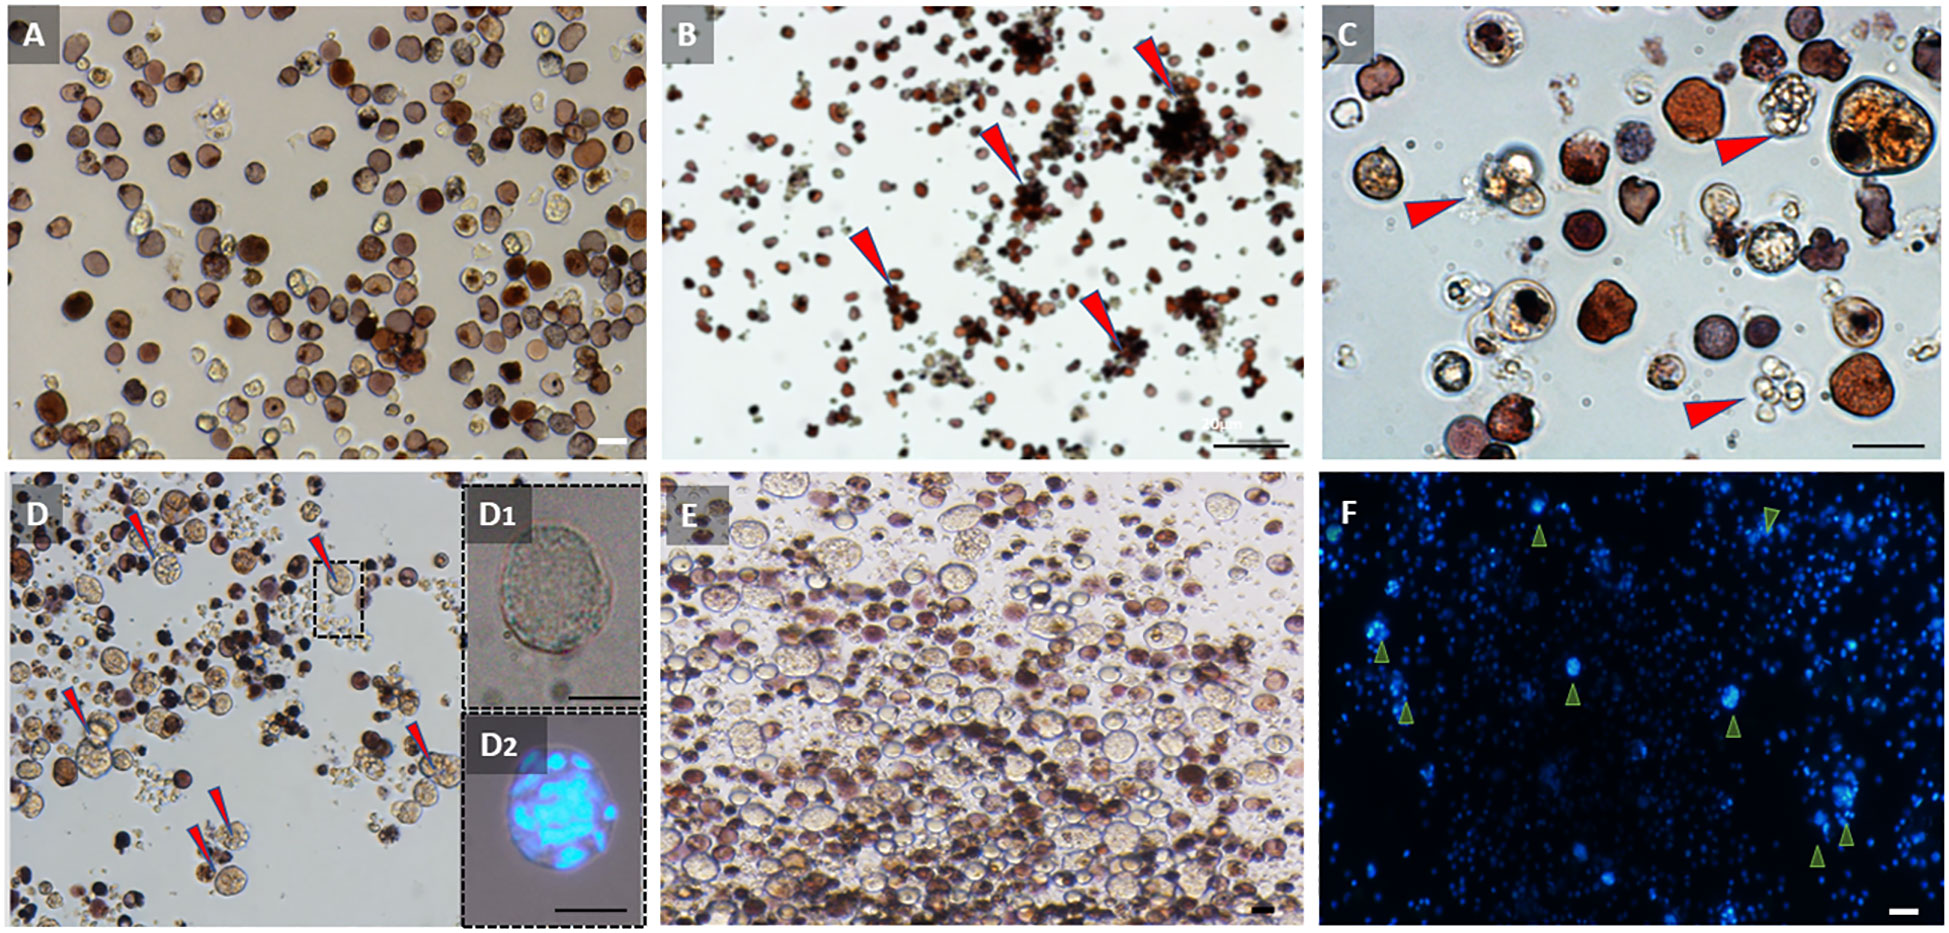
Figure 4 Observations of primary cultures of hemocytes from active and torpid Botrylloides leachii colonies. (A) Hemocytes from an active colony immediately following cell extractions (day 0). Most abundant cells are hemoblasts and vacuolated cells. (B) Hemocytes from an active colony 3 days after in vitro conditions. Hemocytes begin to aggregate into closely located bundles (red arrowheads). (C) Hemoblast aggregations (red arrowheads) from the active colony, 3 days following isolation. (D) Hemocytes from torpor colony immediately following cell extractions (day 0). Many multinucleated cells (MNCs) are observed (red arrowheads). (D1) Multinucleated cells (MNCs) in hibernating colony immediately after cell extractions (day 0). (D2) Multinucleated cells (MNCs) immediately after cell extraction (day 0) stained with DAPI. (E) Hemocyte cell distribution in torpid colony at day 20 under in vitro conditions. Numerous multinucleated cells (MNCs) can be observed, with no significant alterations in cell populations compared to torpid colonies at day 0. (F) Hemocyte cell distribution in torpid colony at day 20 under in vitro conditions. DAPI-stained image highlighting the presence of numerous multinucleated cells (MNCs) in the observed population (indicated by arrowheads). Bars, 10 µm.
3.4 Ultrastructural analysis of cells unique to the torpor state
To reveal the ultrastructure of cells unique to the torpor state (MNCs and bacteria-bearing cells), we utilized TEM, a high-resolution imaging technique that allows for the visualization of internal cellular structures in great detail.
TEM observations and immunostaining of Piwi were performed on two types of MNC morphs and bacteria-carrying cells. The first type of MNC morph denoted by Morph-1 (Figure 5A) is characterized by large cells (10–20 µm), each containing a large vacuole (8 µm in diameter) enclosed within a thin layer of cytoplasm. Each large vacuole typically contained three to eight separated nuclei, each 2 µm, and Golgi (Figure 5A′; nuclei and Golgi bodies are denoted by “nu” for nucleus and “go” for Golgi). An additional separate nucleus (2 µm) that features scattered chromatins (Figure 5A, red arrowhead) and several mitochondria was also observed in Morph-1 MNCs. The second type of MNC morph, denoted by Morph-2 (Figure 5B), has large cells (10–18 µm), multiple vacuoles (5–8 µm each) surrounded by a thin peripheral cytoplasmic layer, and several mitochondria (Figure 5B; mitochondria are denoted by “mt”). Cells of both MNC subpopulations (Morph-1 and Morph-2) expressed Piwi stemness marker in all nuclei (Figures 5C–C′). In addition, bacteria-carrying cells were observed in torpid colonies (Figure 5D). These cells were 10–30 µm in size, and each contained 5 to 15 intact bacterial cells.
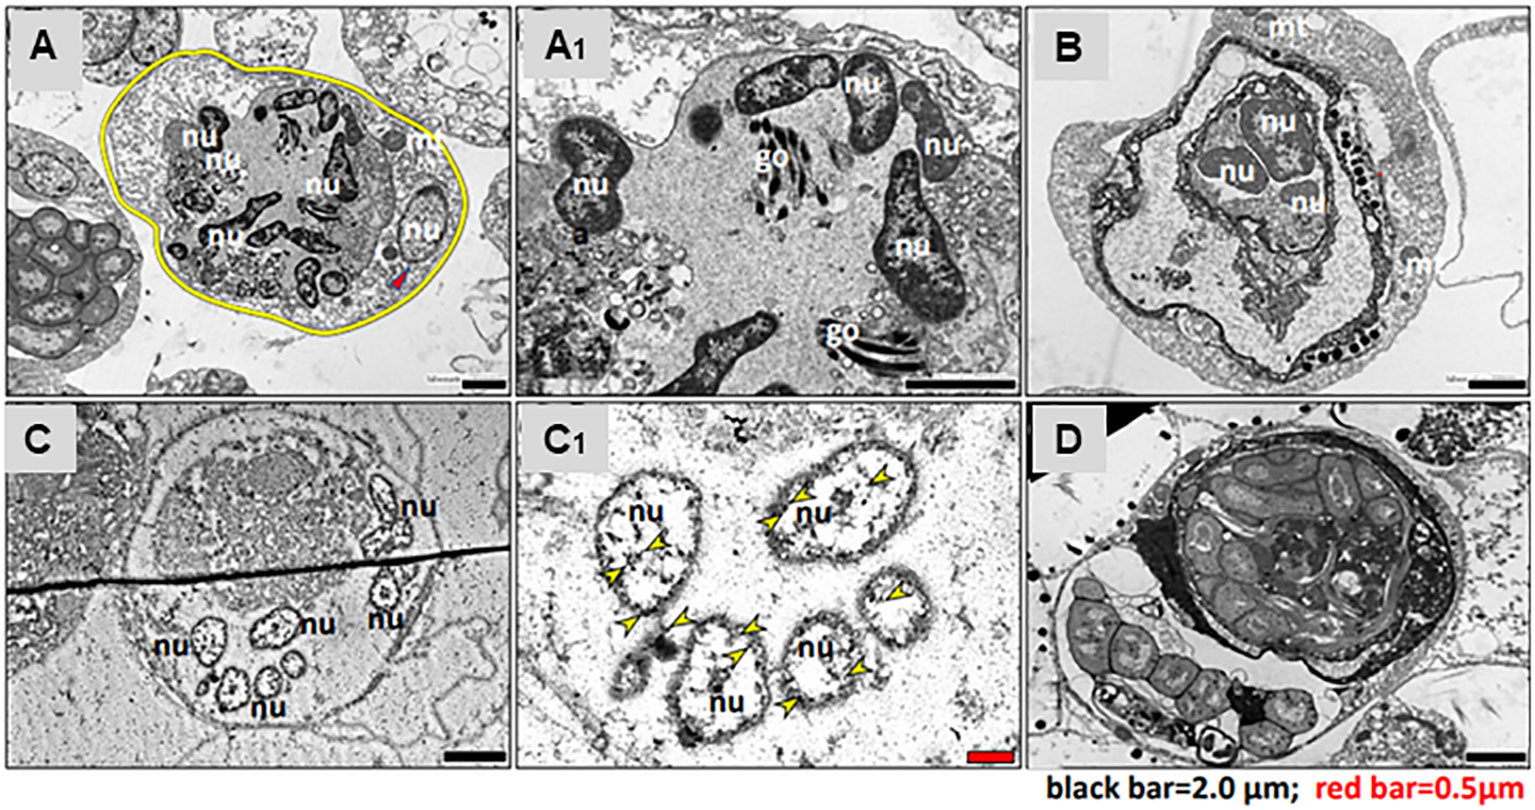
Figure 5 Transmission electron microscopy of torpor-specific hemocytes. (A) MNC Morph-1: the cell membrane, highlighted with a yellow circle, contains nine nuclei (nu) and a Golgi apparatus (go). (A1) Close-up view of MNC Morph-1, similar to panel (A), showing detailed structure. (B) MNC Morph-2: the cell contains three nuclei (nu) and two mitochondria (mt). (C) Immunostaining of MNCs for Piwi: the cell comprises six nuclei (nu), with each nucleus expressing Piwi protein. (C1) Immunostaining of MNC for Piwi, similar to panel (C); Piwi is indicated by yellow arrowheads. (D) Bacteria-bearing cell: the main part of cellular cytoplasm is populated with intact bacteria cells. nu, nuclei; go, Golgi; mt, mitochondria.
3.5 Single-cell sequencing
To further characterize the different types of hemocytes in active and torpid colonies of B. leachii, we utilized Drop-seq single-cell sequencing technology. Single-cell sequencing allows for the identification of gene expression profiles for individual cells, enabling the differentiation of cell types and subtypes within a heterogeneous tissue.
Whole hemocyte cells from three active and two torpid colonies were extracted from the marginal ampullae and collected in a cell suspension (see Methods). The number of cells was estimated using a hemocytometer under a microscope, and samples were diluted in order to initiate the sequencing with a similar number of cells. The cell suspensions were then sequenced using Drop-seq technology (see Methods).
Raw sequencing reads from each active and torpid colony were aligned to the B. leachii genome (Blanchoud et al., 2018b), and the number of cells in each colony and the amount of expressed genes in each cell were quantified. It was found that hibernating colonies had very low throughput of successfully sequenced cells (Figure 6A). In addition, even when a cell was successfully sequenced, the number of expressed genes in cells of torpid colonies was significantly lower than the number of expressed genes in cells of active colonies (Figure 6B).
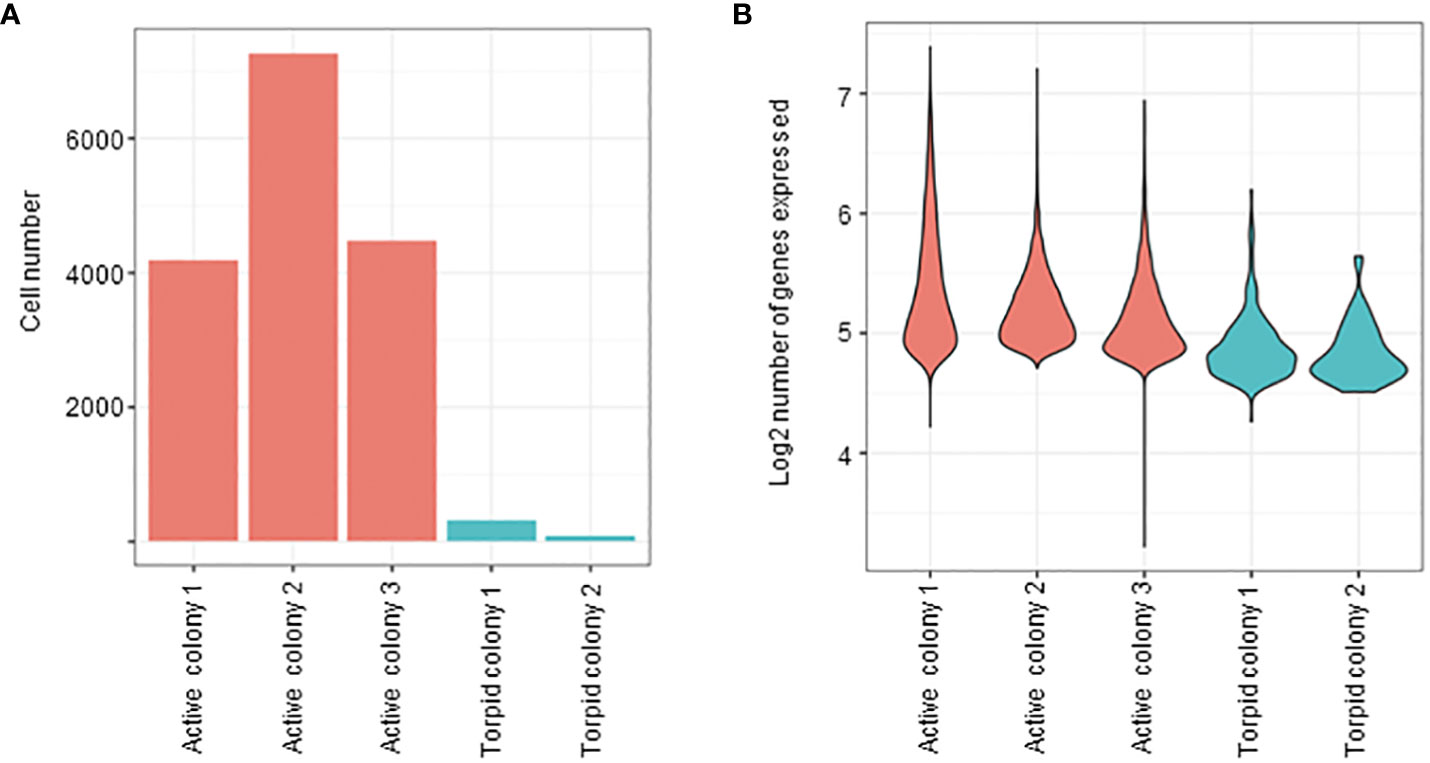
Figure 6 Cell abundances based on single-cell analysis. (A) Bar plot representing the number of cells in both active and hibernating colonies. (B) Violin plots illustrating the distribution of genes per cell (on logarithmic scale) in both active and torpid colonies. The width of the violins represents the density of the gene expression values, with wider sections indicating higher density.
Raw expression values across all cells from all colonies were normalized, and cells were embedded into two-dimensional space using UMAP (McInnes et al., 2018), a non-linear embedding algorithm (Figures 7A, B). Each point on the UMAP plot represents a single cell, and the distances between points represent similarities in gene expression across the entire transcriptome. The clustering of the cells was performed separately, and clusters were overimposed on the UMAP (seen as different colors of dots on the UMAP in Figures 7A, B). The distinct clusters represent different cell types with their own distinct transcriptional states. A total of 14 distinct cell clusters were identified in the hemocytes of B. leachii. The active colonies expressed cells from all 14 cell clusters, while two of these cell clusters (clusters 11 and 12) were not observed in the torpid colonies (Figures 7C, D).
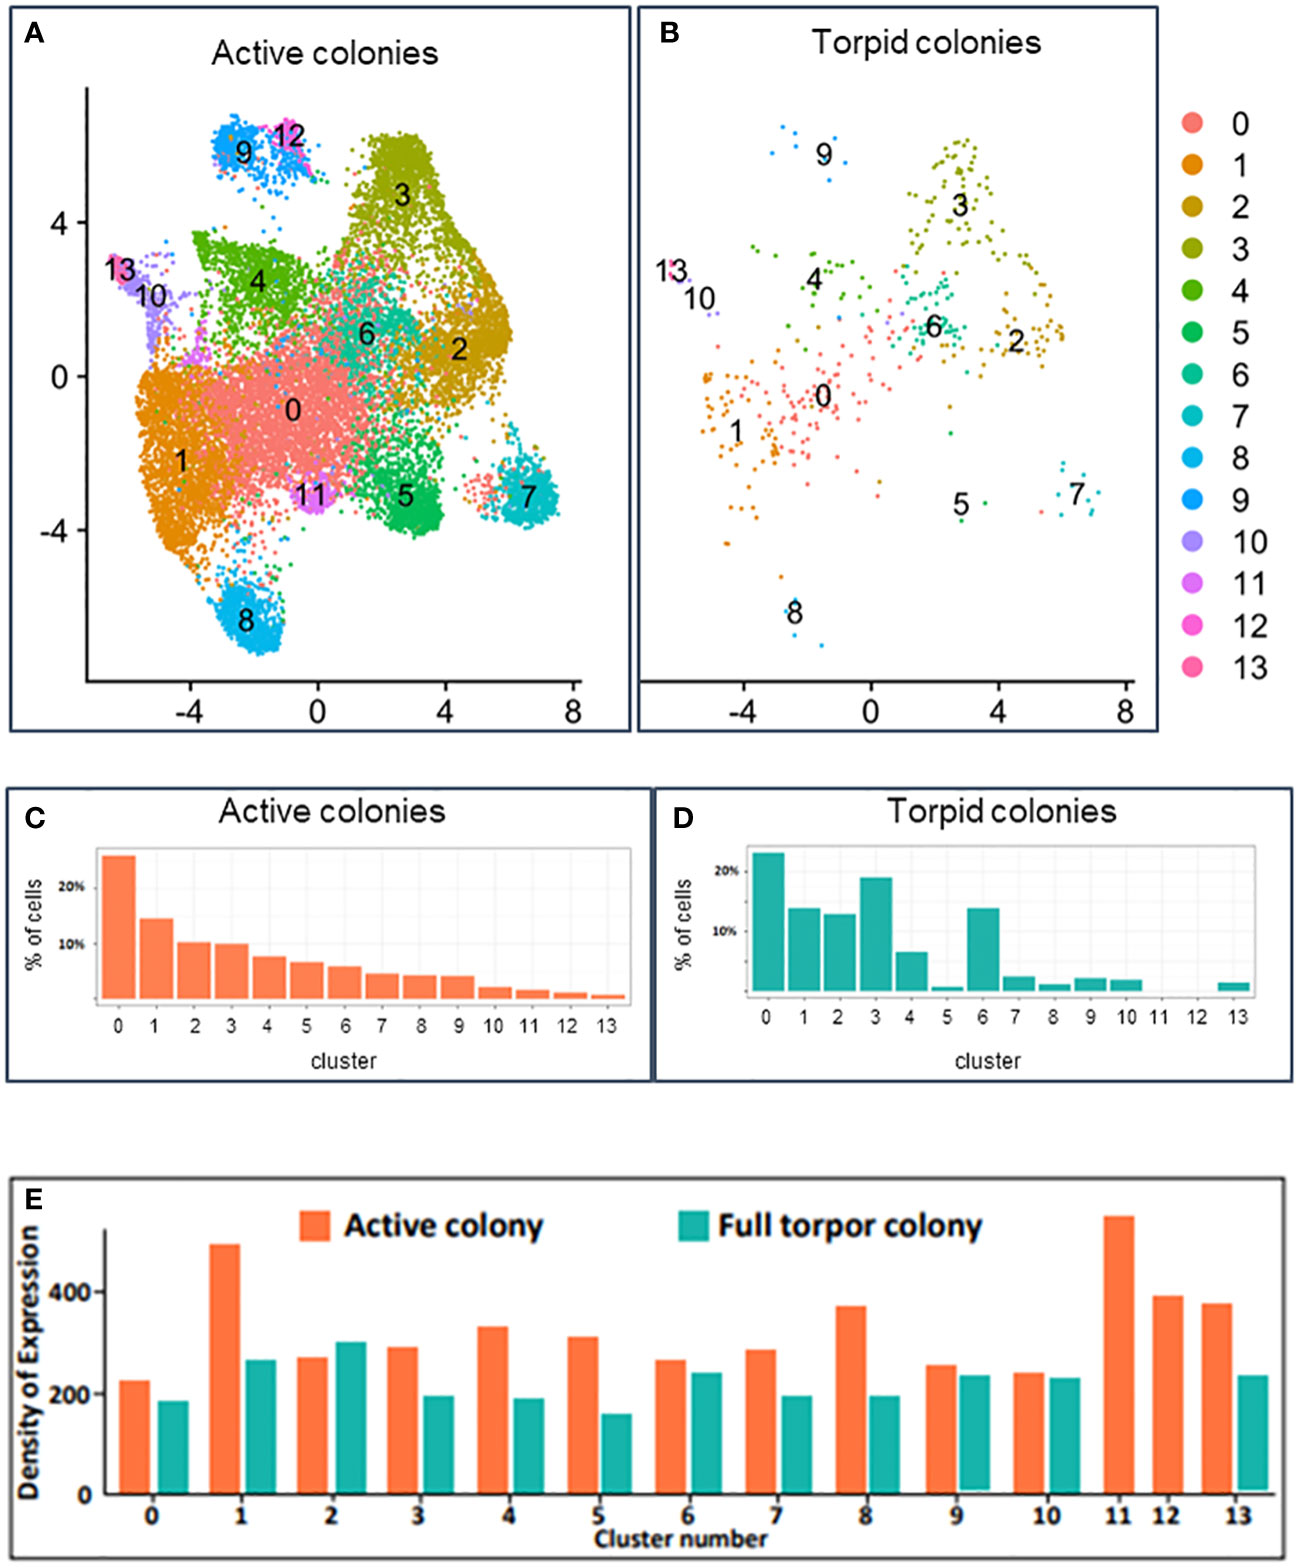
Figure 7 Single-cell transcriptomics analysis. (A) UMAP plot of unsupervised clustering of cells in active Botrylloides leachii colonies based on the expression levels. Each dot represents a cell, and colors indicate the unsupervised cluster assignment. (B) UMAP plot of unsupervised clustering of cells in torpid B. leachii colonies based on the expression levels. Each dot represents a cell, and colors indicate the unsupervised cluster assignment. (C) Percentage of cells in active colonies belonging to each cluster. (D) Percentage of cells in torpid colonies belonging to each cluster. (E) Expression density: the sum of expressions of all genes in all cells within a specific cluster divided by the number of cells in the cluster. Expression density calculation provides an estimate of the average expression per cell and can be used as a proxy of transcriptional activity of cells. Expression density is shown for active colonies (represented by orange) and torpid colonies (represented by green).
We next proceeded to identify marker genes for each of the cell clusters, genes that are highly expressed in one cluster and are almost not expressed in cells of all other clusters. We identified several marker genes for each cluster, as detailed in Supplementary Table 2. However, it is important to note that clusters 0 and 10 did not exhibit any significant markers. We then attempted to annotate the cell clusters as known cell types leveraging these found marker genes. However, the ascidian hemocytes are not well characterized, and most of the cell functions and also markers of the cells are not known. For most of the cell clusters, we were not successful in finding their known identity. Thus, we give a detailed review of the cell clusters, their marker genes, and the set of genes with differential expression in active and torpid colonies to assist further investigations into the hemocyte identity, functions, and changes in the torpor state.
In both the active and hibernating colonies, unsupervised cluster 0 was the most abundant cell type and consisted of 26% of cells in active colonies and 23% of cells in hibernating colonies (Figures 7C, D; Supplementary Table 3). Cluster 0, however, did not have a unique expression; i.e., we did not find any genes that had high expression in cells of this cluster and low expression in all other cells. The expression density, used as a proxy for the transcriptional activity of cells, in this cluster, was slightly lower in cells of hibernating colonies compared to cells in active colonies (Figure 7E; Supplementary Table 4). We found 10 significantly downregulated and 24 significantly upregulated genes in cells of cluster 0 in torpid colonies compared to cells of cluster 0 in active colonies (Supplementary Table 5).
Cluster 1 consisted of approximately 14% of cells in active and hibernating colonies (Figures 7C, D; Supplementary Table 3), and we identified three marker genes with high expression in these cells compared to all other cells (Figure 8A; Supplementary Table 2). The genes were not annotated in the Aniseed database and were not successfully aligned with BLASTx on any of the ascidian proteins. Interestingly, cluster 1 cells in active colonies showed high expression density (see Methods), indicating high gene activity in the cluster (Figure 7E; Supplementary Table 4). We found eight downregulated and eight upregulated genes in torpid compared to active colonies in cells of cluster 1 (Supplementary Table 6).
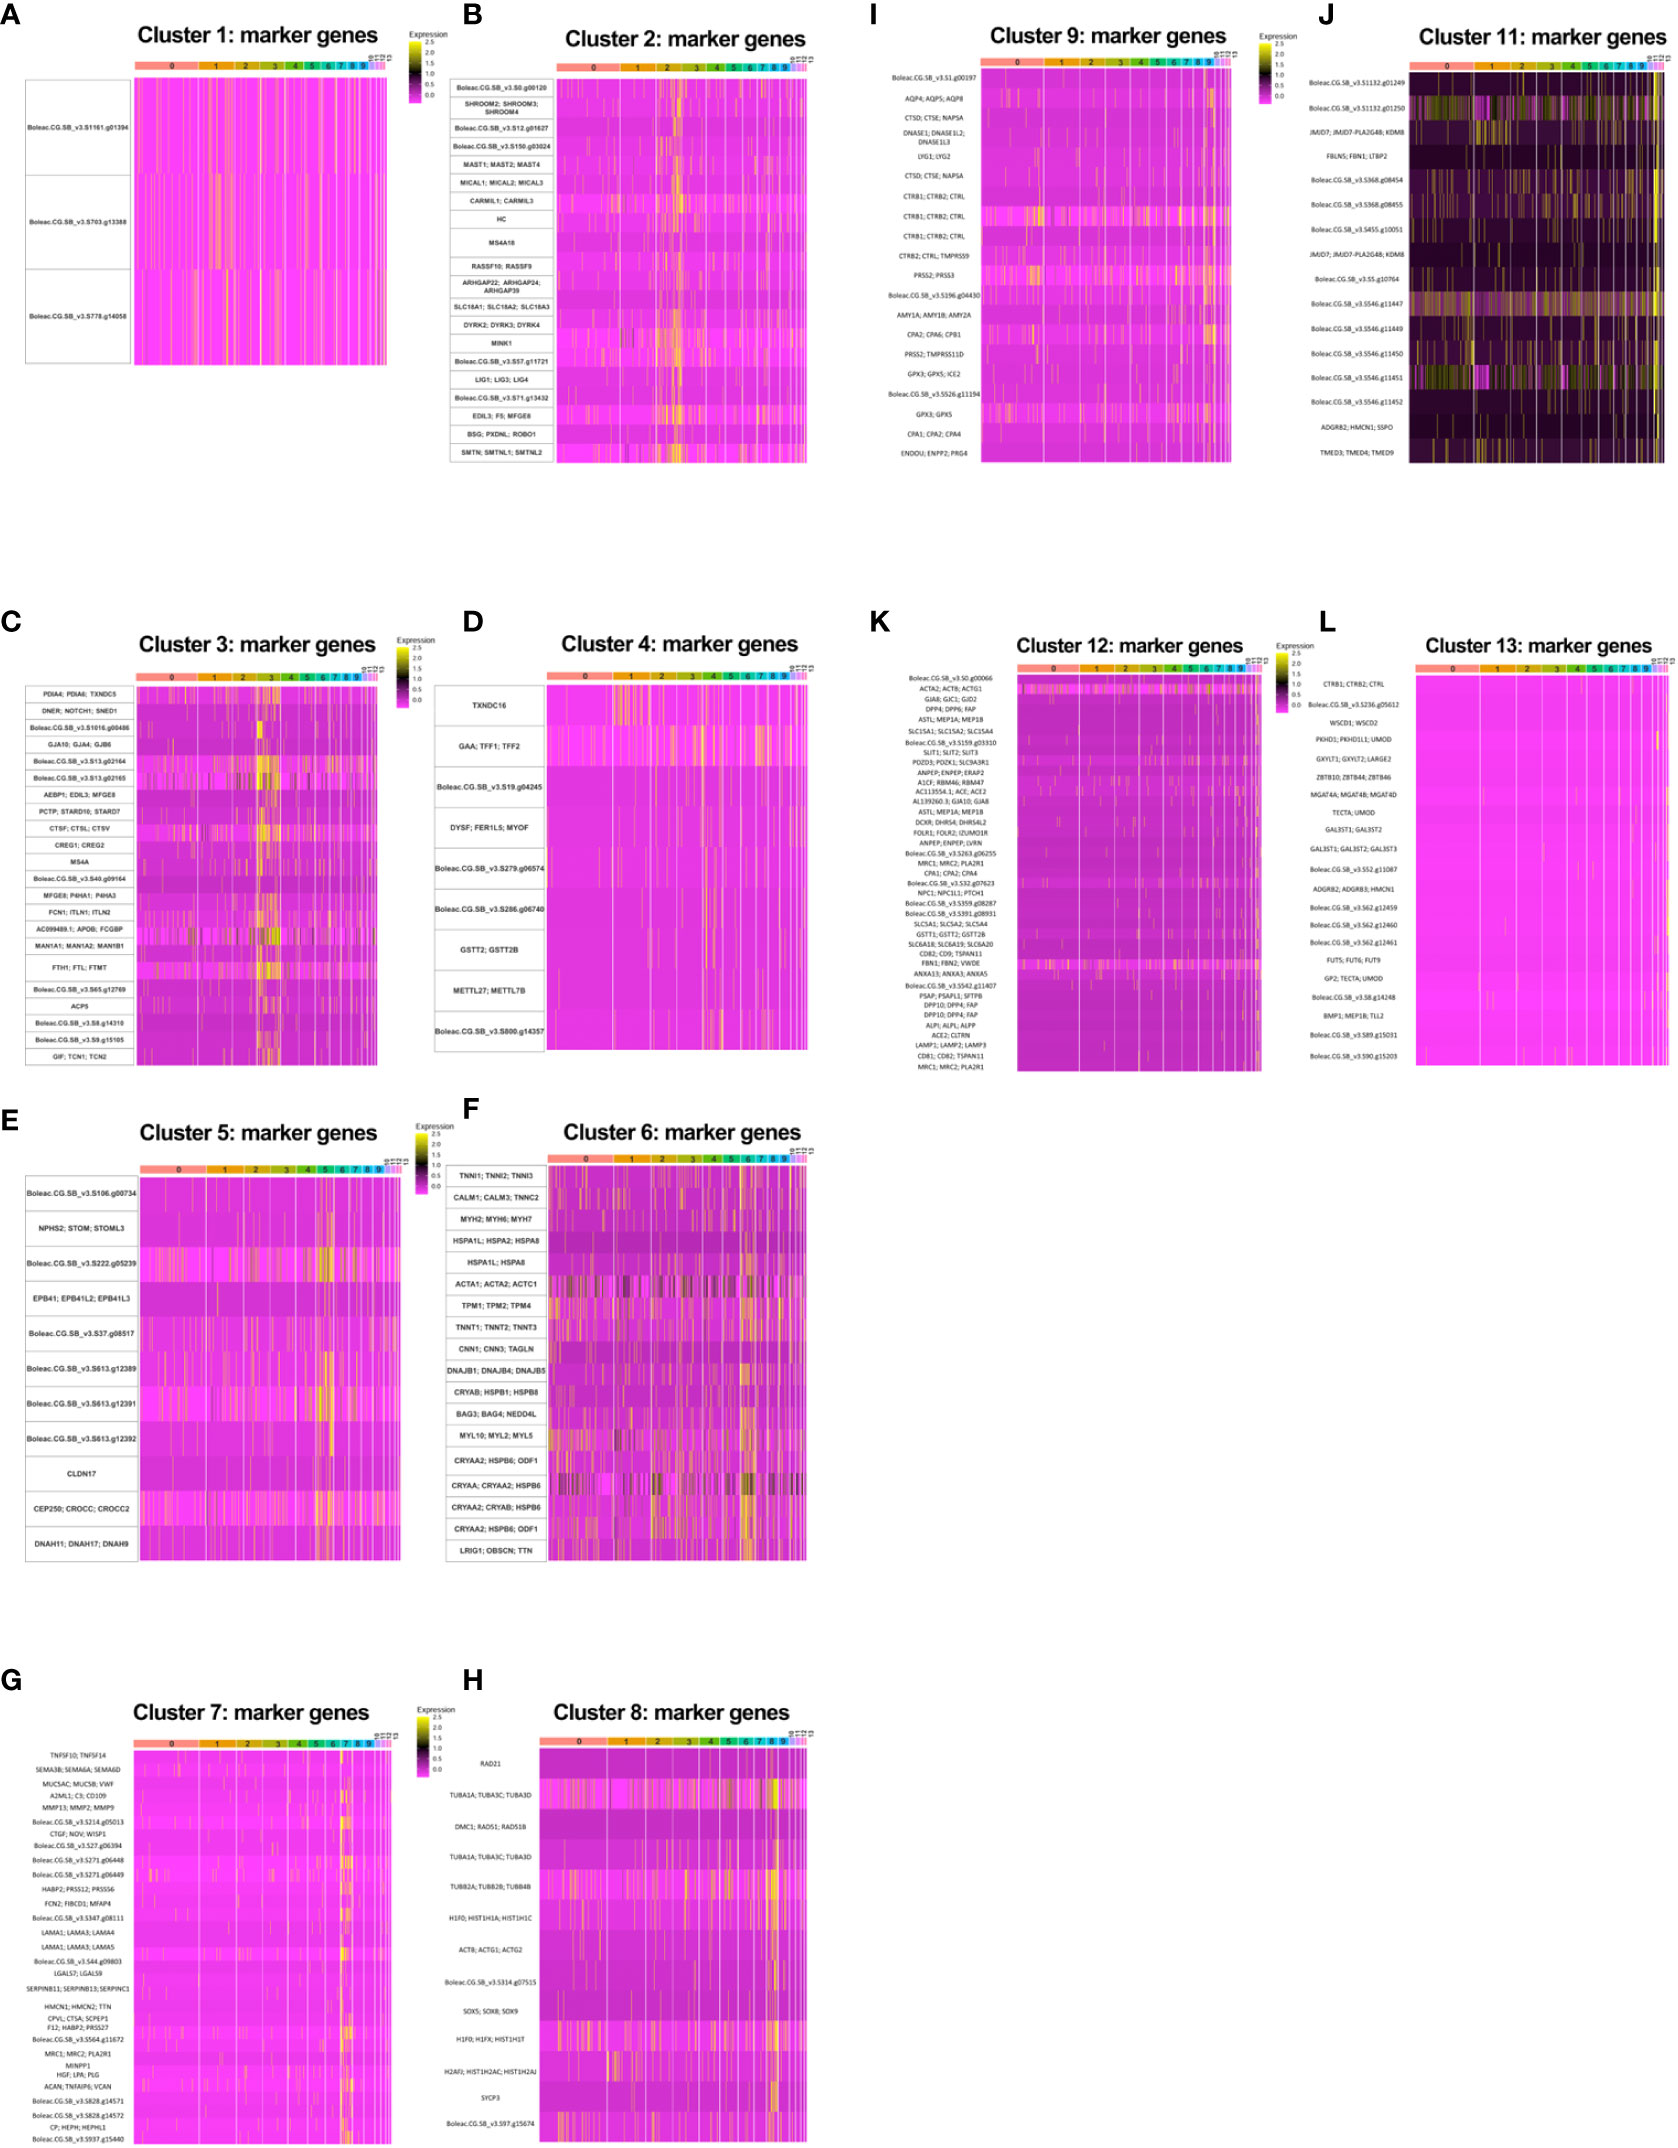
Figure 8 Cell cluster gene markers. (A) Heat map of gene markers for cells in cluster 1 in active and torpid colonies. (B) Heat map of gene markers for cells in cluster 2 in active and torpid colonies. (C) Heat map of gene markers for cells in cluster 3 in active and torpid colonies. (D) Heat map of gene markers for cells in cluster 4 in active and torpid colonies. (E) Heat map of gene markers for cells in cluster 5 in active and torpid colonies. (F) Heat map of gene markers for cells in cluster 6 in active and torpid colonies. (G) Heat map of gene markers for cells in cluster 7 in active and torpid colonies. (H) Heat map of gene markers for cells in cluster 8 in active and torpid colonies. (I) Heat map of gene markers for cells in cluster 9 in active and torpid colonies. (J) Heat map of gene markers for cells in cluster 11 in active and torpid colonies. (K) Heat map of gene markers for cells in cluster 12 in active and torpid colonies. (L) Heat map of gene markers for cells in cluster 13 in active and torpid colonies.
Cluster 2 consisted of 10% of cells in active colonies and 13% in torpid colonies. A total of 20 marker genes were identified in this cluster of cells, and 15 of these markers were well annotated (Figure 8B; Supplementary Table 2). Interestingly, one of the marker genes for cluster 2 was successfully aligned with the allorecognition gene in Botryllus schlosseri, a close relative of B. leachii (Supplementary Figure 1A). This gene, termed BHF (for Botryllus Histocompatibility Factor; Voskoboynik et al., 2013), encodes self/non-self and determines “graft” outcomes in this group of organisms. The BHF is significantly upregulated in colonies poised to allorecognition responses and predicts histocompatibility outcomes (fusion and rejection), and by employing whole-mount in situ hybridization, it was found to be highly expressed in the vasculature and the animal blood (Voskoboynik et al., 2013) (Supplementary Figure 1B). Cluster 2 cells of torpid colonies had a slightly (10%) higher expression activity than cells of active colonies (Figure 7E; Supplementary Table 4). Interestingly, most of the differentially expressed genes were upregulated in torpid colonies compared to active in cells of this cluster. A total of 32 upregulated and six downregulated genes were found (Supplementary Table 7). Many of the upregulated (in torpid colonies) genes were associated with ribosomal functions and gene translation, further indicating the activity of the cells in cluster 2 of torpid colonies.
Cluster 3 consisted of almost 10% of cells in the active colonies (Figure 7C; Supplementary Table 3). The number of cells in this cluster rose significantly to 19% of all cells (Fold Change = 1.9) in torpid colonies (Figure 7D; Supplementary Table 3). We identified 20 marker genes of this cluster with 15 genes that were well annotated (Figure 8C; Supplementary Table 2). Many of the marker genes were related to the “ferric iron binding” function. Interestingly, even though the cells of cluster 3 were more frequent in torpid colonies than in active colonies, the density of expression of these cells was higher in active colonies (Figure 7E; Supplementary Table 4). This again indicates the overall low transcriptional activity of torpid colonies. Differential expression analysis of genes in cluster 3 yielded seven downregulated and 17 upregulated genes in torpid compared to active colonies (Supplementary Table 8).
Cluster 4 contained 7% of cells in both active and torpid colonies (Figures 7C, D; Supplementary Table 3). Nine gene markers of this cluster were identified with five well-annotated genes (Figure 8D; Supplementary Table 2). As in cluster 3, in this cluster, the density of expression in torpid colonies was significantly lower (Fold Change = 0.58) than in torpid colonies (Figure 7E; Supplementary Table 4), indicating overall low expression activity in torpid cells. In cluster 4, two downregulated and 11 upregulated genes were found in torpid compared to active colonies (Supplementary Table 9).
Cluster 5 of hemocytes in active colonies contained approximately 7% of cells (Figure 7C; Supplementary Table 3). The number of cells in cluster 5 fell dramatically (Fold Change = 0.1) in torpid colonies and equated to only 0.7% of all cells (Figure 7D; Supplementary Table 3). In addition to the drastic reduction in the number of cells in torpid colonies, their activity levels calculated as expression density also fell by almost half (Fold Change = 0.51) (Figure 7E; Supplementary Table 4). We found 11 marker genes of cells in cluster 5. Five of these genes were successfully annotated with BLASTx alignment on ascidian proteins (Figure 8E; Supplementary Table 2). Interestingly, we found 64 highly upregulated (log2 Fold Change > 3) genes in torpid colonies compared to active colonies (Supplementary Table 10). These genes were mostly related to cation-coupled chloride cotransporters, which modulate the transport of sodium and/or potassium cations coupled with chloride anions across the cell membrane.
Hemocytes of cluster 6 rose significantly in number in torpid colonies compared to active colonies (Fold Change = 2.4), indicating their importance in the torpor state. In active colonies, these cells constituted only 0.5% of all cells, while in torpid colonies, their number rose to more than 1% of all cells (Figures 7C, D; Supplementary Table 3). The transcription activity of cluster 6 cells in torpid colonies was similar to the activity in active colonies (Figure 7E; Supplementary Table 4). We found 18 gene markers of this cell cluster, all of which were annotated with BLASTx (Figure 8F; Supplementary Table 2). The differentially expressed genes included 10 downregulated and 21 upregulated genes in torpid compared to active colonies (Supplementary Table 11).
The number of cells in cluster 7 fell by almost 50% from 4% of all cells in active colonies (Figure 7C; Supplementary Table 3) to 2% of all cells in torpid colonies (Figure 7D; Supplementary Table 3). The expression density of cells in cluster 7 fell in torpid colonies by almost 40% (Figure 7E; Supplementary Table 4). We found 30 gene markers for cluster 7 with 20 genes successfully annotated (Figure 8G; Supplementary Table 2). The differentially expressed genes included 49 genes, all of which were upregulated in torpid compared to active colonies (Supplementary Table 12).
Cluster 8 consisted of 4% of all cells in active colonies and fell to just above 1% of cells in torpor (Figures 7C, D; Supplementary Table 3). The expression density indicating the overall transcriptional activity of cells in cluster 8 was much lower in the torpor state than in active colonies (Fold Change = 0.28) (Figure 7E; Supplementary Table 4). We found 13 gene markers, 11 of which were annotated (Figure 8H; Supplementary Table 2). We found 35 differentially expressed genes, all of which were upregulated in torpid colonies compared to active ones (Supplementary Table 13). We found differentially upregulated genes to be associated with “ER to Golgi transport”.
Cluster 9 consisted of 4% of all cells in the active colonies and dropped to 2% of all cells in torpid colonies (Figures 7C, D; Supplementary Table 3). The overall transcriptional activity of cells remained similar in a torpor state (Figure 7E; Supplementary Table 4). We found 20 marker genes of cluster 8, 17 of which were successfully annotated (Figure 8I; Supplementary Table 2). Overall transcriptional activity of cells in cluster 8 fell by almost 50% in the torpor state compared to active colonies (Figure 7E; Supplementary Table 4). Differentially expressed genes of cluster 9 included one downregulated and 59 upregulated genes in torpid colonies compared to active colonies (Supplementary Table 14).
Cluster 10 consisted of close to 2% of all cells in both active and torpid colonies (Figures 7C, D; Supplementary Table 3). The expression density in cluster 10 revealed that the transcription activity of cells in this cluster in torpid colonies remains similar to the active colonies (Figure 7E; Supplementary Table 4). We found no significant gene markers for cells in cluster 10. Differentially expressed genes in cells of cluster 10 in active and torpid colonies included 51 genes, all of which were upregulated in torpid colonies (Supplementary Table 15).
Clusters 11 and 12 were unique to active colonies and consisted of 1.5% and 1.1% of all cells, respectively (Figures 7C, D; Supplementary Table 3). Interestingly, the overall transcriptional activity measured by expression density was higher than average in cluster 11 cells of active colonies (Figure 7E). In cluster 11, we found 16 marker genes, five of which were successfully annotated (Figure 8J; Supplementary Table 2). For cluster 12, we found 39 marker genes, with 32 of these genes successfully annotated (Figure 8K; Supplementary Table 2).
Cluster 13 contained 0.7% of all cells in active colonies. The proportion of cells increased in torpid colonies to constitute 1.5% of all cells (Figures 7C, D; Supplementary Table 3). Even though the proportion of cells increased in torpor, overall transcription activity was decreased in the torpor state (Figure 7E; Supplementary Table 4). We found 21 marker genes of cells in cluster 13 (Figure 8K; Supplementary Table 2). Comparing gene expression in active and torpid cells of cluster 13, we found four upregulated genes in torpid cells (Supplementary Table 16).
4 Discussion
The hemocytes of the colonial tunicate B. leachii play significant roles throughout the animal’s life cycle, encompassing a variety of crucial functions. These functions include nutrient transport and storage, respiration, regeneration, budding, sexual reproduction, defense responses, and tunic generation (Rinkevich et al., 2007; Rinkevich et al., 2013; Hyams et al., 2017). In this study, we systematically studied hemocyte populations in active and torpid colonies. We identified morphological, cellular, and molecular changes that B. leachii hemolymph undergoes under physiological stress in torpor conditions.
As the first step to elucidating the cell populations in the active and torpid colonies, we morphologically characterized nine cell types comprising distinctive cell populations in B. leachii hemocytes (Figure 2; Table 1). We did not observe significant variations in cell morphology between the active and torpid colonies. However, similar to our previous observations (Hyams et al., 2017; Hyams et al., 2022), we did identify two distinct cell types exclusive to torpor: MNCs and specialized macrophage-like cells containing intact bacterial cells within their cytoplasm, “bacteria-bearing cells”.
In our previous investigations (18), we documented changes in the quantities of hemocyte cells, including hemoblasts, morula cells, and phagocyte cells, between torpid and active colonies of B. leachii. Additionally, we reported the presence of MNCs (Hyams et al., 2017) and bacteria-bearing cells (Hyams et al., 2022) specifically in torpid colonies. To validate our earlier findings, we conducted a comprehensive analysis of four specific cell types and examined changes in their abundance during three distinct physiological states experienced by B. leachii colonies: the active state, mid-torpor state, and full torpor state. Our observations revealed notable changes in cell populations within torpid colonies (Figure 3; Supplementary Table 1). Specifically, we observed a significant decrease in the abundance of hemoblasts and phagocytes, whereas in a previous study (Hyams et al., 2017), we documented an increase in phagocytes in torpid colonies, suggesting that the cellular profiles and their changes along various physiological states are intricate and necessitate further experimentation. In contrast to the phagocytes, the number of MNCs exhibited a substantial increase in torpid colonies compared to the active state. We did not observe significant alterations in the quantity of vacuolated cells across the different physiological states.
Utilizing primary cell cultures, we made longitudinal observations of B. leachii hemocytes and found that while torpid colonies stayed relatively stable across the 30 days of our observations (Figure 4), the active colonies started changing after 3 days of the experiment. We observed the initiation of cell aggregations with 3–25 cells per cell aggregate and the subsequent formation of MNCs in cell cultures generated from active colonies (Figures 4B, C).
TEM observations further revealed the ultrastructure of MNCs and bacteria-bearing cells. We observed several types of MNC morphs. Some MNC morphs contained vacuoles with separate nuclei and Golgi apparatus in addition to a separate nucleus (Figures 5A–A′) and mitochondria. Other MNC morphs were characterized by large size with many vacuoles surrounded by a thin cytoplasmic layer and several mitochondria (Figure 5B). Cells of both MNC subpopulations expressed Piwi in all nuclei (Figures 5C–C′). We also observed torpor-specific cells with intact bacteria (Figure 5D). The potential significant roles of these cells in the animal’s biology have been discussed in previous studies (Lauzon et al., 2000; Hyams et al., 2017; Hyams et al., 2022).
Previously, MNCs were sporadically recorded during B. leachii development, including whole-body regeneration from minute vasculature fragments (Rinkevich et al., 2007; Rinkevich et al., 2010; Rinkevich et al., 2013), in blastogenic stage D (Alvarez-Dolado et al., 2003; Lauzon et al., 2013), and during colonial dormancy (Rinkevich et al., 2010; Hyams et al., 2017; Hyams et al., 2022). In addition, a wide range of studies have documented cell fusion in mammalian systems during the last two decades (Alvarez-Dolado et al., 2003; Knapp and Tanaka, 2012; Pesaresi et al., 2019; Yao and Wang, 2020), indicating that cellular fusion is a unanimous phenomenon, contributing to a range of repair/stress phenomena. Our observation of the emergence of MNCs at the beginning of dormancy, the display of stem cell marker (Piwi) in these highly differentiated sizable cells (ca 20 µm in size, inclusive of 11 nuclei/cell), and the documented appearance of MNCs during blastogenic stage D (Lauzon et al., 2000) suggest that the B. leachii MNCs are a fundamental cell type that appears as an outcome of hemoblast fusion (Figure 4) (Hyams et al., 2017). Several types of MNC morphs were documented (Hyams et al., 2017). All of these types of MNCs expressed the stemness marker Piwi in all their nuclei, suggesting that these cells may function as a pool of “primed” cells available for emergency needs such as for rapid regeneration at arousal from dormancy or at stage D of blastogenesis, where fast developmental response during reduced cell division cycles is needed. However, it is possible that some MNCs may also be the outcome of uncompleted mitotic cell cycles, yet this less likely option requires further investigation.
It is further unlikely that the B. leachii MNCs are phagocytic cells containing apoptotic cells inside the phagosome, as recorded at the take-over phase of blastogenesis (Voskoboynik et al., 2004; Franchi et al., 2016). The MNCs do not exhibit any apoptotic characteristic along torpor in B. leachii, and they were documented in dormant colonies for prolonged periods of several months (under our laboratory settings), which would be very unlikely for an apoptotic process.
Further, in order to investigate the molecular mechanisms underlying the cellular changes within torpid colonies, we employed a cutting-edge single-cell sequencing technique. This method allowed us to identify specific gene expression profiles of individual cells, enabling the differentiation of cell types and subtypes within a heterogeneous tissue. Single-cell sequencing is a powerful technology that can provide insights into the transcriptional programs of different cell populations and has been widely used to investigate transcriptional changes during development, disease progression, and cellular responses to external stimuli. The use of single-cell sequencing in our study allowed for a more comprehensive characterization of the different hemocyte types in B. leachii and provided new insights into the transcriptional differences between these cells in active and torpid colonies.
Despite the same methodology employed for the preparation of sequencing libraries for active and hibernating colonies, sequencing outcomes were extremely low in hibernating colonies (Figure 6). It could be a result of overall low mRNA expression in hemocytes under torpor conditions, a tenet supported by our recent work (Hyams et al., 2022) where we observed that total RNA is significantly lower in hibernating colonies. A different explanation may be related to the library preparation aspects and Drop-seq technology itself. It has been noted that several of the library preparation steps and the technical aspects of the sequencing process can generate unrepresentative and biased sequencing (Lindenbach and Rice, 1997; Wu et al., 2019; Denisenko et al., 2020; Ke et al., 2022; Oh et al., 2022). It should be taken into consideration that the lower RNA expression in torpid colonies could potentially lead to biases or missed low-abundance transcripts. We also acknowledge that there might be inherent variability in hemocyte populations across different individual colonies, even under the same physiological state, which could impact the results.
Analysis of gene expression profiles of the single-cell sequencing suggested 14 hemocyte types (cell clusters) in active B. leachii colonies (Figure 7A). Two of these cell types were not present in the torpid colonies (Figure 7B). In our comprehensive analysis, we thoroughly examined each cluster of cells and investigated their specific characteristics, revealing marker genes associated with each cluster (Figure 8) and comparing the number of cells within each cluster between active and torpid colonies. Additionally, we evaluated the overall transcriptional activity in active and torpid colonies, shedding light on the global gene expression patterns associated with these distinct states. Moreover, we identified differentially expressed genes in cells from active and torpid colonies within each cluster, uncovering key genes potentially driving the observed physiological differences. The detailed results from the analysis of the single-cell transcriptomics data have been integrated into an interactive Dashboard (http://bleachii.tauberbioinformatics.org/seurat?id=Bleachii-v1), providing a user-friendly platform for easy interrogation and utilization of the findings. The Dashboard allows users to explore the results in a convenient and intuitive manner, enabling them to delve deeper into the transcriptomic profiles of individual cells and gain valuable insights from the data.
This study focused on investigating the hemocyte cell populations within both active and torpid colonies of B. leachii. Notably, in torpid colonies, the circulating hemocytes represent the sole bodily compartment that “keeps on rolling” and remains active and functional, enabling the organism to successfully reemerge as a new functional colony when favorable environmental conditions arise. Understanding the cellular dynamics and the transcriptome changes in these circulating hemocytes provides valuable insights into the regenerative capabilities and adaptive strategies employed by B. leachii.
Data availability statement
The data presented in the study are deposited in the NCBI repository, accession number PRJNA1045036.
Ethics statement
There is no need for animal AC, since this species is a cosmopolitan invasive species.
Author contributions
BR conceived and designed the experiments. YH performed the experiments. BR, YR, and LB provided the resources. YH, JP, and ET analyzed the data. YH, BR, and JP wrote the manuscript with the contributions of all co-authors. All authors contributed to the article and approved the submitted version.
Funding
The author(s) declare financial support was received for the research, authorship, and/or publication of this article. This work received funding from the Laszlo N. Tauber Family Foundation and was funded by the United States–Israel Binational Science Foundation (BSF No. 2015012; to BR), by the BSF, as part of the joint program with the NSF, the National Science Foundation, USA (NSF/BSF no 2021650; to BR), and the ISF grant No. 172/17 (to BR).
Acknowledgments
We would like to extend our thanks to Dr M. Strunz (Comprehensive Pneumology Center, Helmholtz Zentrum, München) for performing the Drop-seq methodology, G. Paz for assistance in preparing the figures, O. Ben-Hamo (www.oshratbenhamo.wixsite.com/osher) for the artwork, and P. Maishev Tauber Bioinformatics Research Center, University of Haifa for developing the interactive Dashboard.
Conflict of interest
The authors declare that the research was conducted in the absence of any commercial or financial relationships that could be construed as a potential conflict of interest.
Publisher’s note
All claims expressed in this article are solely those of the authors and do not necessarily represent those of their affiliated organizations, or those of the publisher, the editors and the reviewers. Any product that may be evaluated in this article, or claim that may be made by its manufacturer, is not guaranteed or endorsed by the publisher.
Supplementary material
The Supplementary Material for this article can be found online at: https://www.frontiersin.org/articles/10.3389/fevo.2023.1196859/full#supplementary-material
Supplementary Figure 1 | Botryllus Histocompatibility Factor. (A) BLASTx alignment of amino acid sequence of B. leachii gene (Boleac.CG.SB-v3.S222.g05250) on Botryllus Histocompatibility Factor (BHF) protein sequence. (B) UMAP dot plot of B. leachii gene (Boleac.CG.SB-v3.S222.g05250) expression. Colored dots indicate cells with high expression of Boleac.CG.SB-v3.S222.g05250 gene.
References
Alvarez-Dolado M., Pardal R., Garcia-Verdugo J. M., Fike J. R., Lee H. O., Pfeffer K., et al. (2003). Fusion of bone-marrow-derived cells with Purkinje neurons, cardiomyocytes and hepatocytes. Nature 425, 968–973. doi: 10.1038/nature02069
Bageritz J., Raddi G. (2019). Single-cell RNA sequencing with drop-seq. Methods Mol. Biol. 1979, 73–85. doi: 10.1007/978-1-4939-9240-9_6
Ballarin L., Cima F. (2005). Cytochemical properties of Botryllus schlosseri haemocytes: indications for morpho-functional characterisation. Eur. J. Histochem. 49, 255–264. doi: 10.4081/952
Ballarin L., Karahan A., Salvetti A., Rossi L., Manni L., Rinkevich B., et al. (2021). Stem cells and innate immunity in aquatic invertebrates: bridging two seemingly disparate disciplines for new discoveries in biology. Front. Immunol. 12. doi: 10.3389/fimmu.2021.688106
Blanchoud S., Rinkevich B., Wilson M. J. (2018a). Whole-body regeneration in the colonial tunicate botrylloides leachii. Results Probl. Cell Differ 65, 337–355. doi: 10.1007/978-3-319-92486-1_16
Blanchoud S., Rutherford K., Zondag L., Gemmell N. J., Wilson M. J. (2018b). De novo draft assembly of the Botrylloides leachii genome provides further insight into tunicate evolution. Sci. Rep. 8, 5518. doi: 10.1038/s41598-018-23749-w
Blanchoud S., Zondag L., Lamare M. D., Wilson M. J. (2017). Hematological analysis of the ascidian Botrylloides leachii (Savigny, 1816) during whole-body regeneration. Biol. Bull. 232, 143–157. doi: 10.1086/692841
Boratyn G. M., Camacho C., Cooper P. S., Coulouris G., Fong A., Ma N., et al. (2013). BLAST: a more efficient report with usability improvements. Nucleic Acids Res 41, W29–W33. doi: 10.1093/nar/gkt282
Brunetti R. (1976) Biological cycle of Botrylloides leachi (Savigny) (Ascidiacea) in the Venetian lagoon., Vie Milieu. Available at: https://hal.science/hal-02989323 (Accessed May 26, 2023).
Burighel B., Cloney P., Cloney R. A. (1997). Microscopic anatomy of invertebrates, Vol. 15. (New York: John Wiley and Sons), 221–347.
Cima F. (2022). Searching for the Origin and the Differentiation of Haemocytes before and after Larval Settlement of the Colonial Ascidian Botryllus schlosseri: An Ultrastructural Viewpoint. J. Mar. Sci. Eng. 10, 987. doi: 10.3390/jmse10070987
Cima F., Franchi N., Ballarin L. (2016). “Origin and functions of tunicate hemocytes,” in Evol. Immune Syst. Conserv. Diversif (London: Elsevier Inc.), 29–49. doi: 10.1016/B978-0-12-801975-7.00002-5
Cima F., Perin A., Burighel P., Ballarin L. (2001). Morpho-functional characterization of haemocytes of the compound ascidian Botrylloides leachi (Tunicata, Ascidiacea). Acta Zool 82, 261–274. doi: 10.1046/j.1463-6395.2001.00087.x
Dardaillon J., Dauga D., Simion P., Faure E., Onuma T. A., DeBiasse M. B., et al. (2020). ANISEED 2019: 4D exploration of genetic data for an extended range of tunicates. Nucleic Acids Res. 48, D668–D675. doi: 10.1093/nar/gkz955
Denisenko E., Guo B. B., Jones M., Hou R., de Kock L., Lassmann T., et al. (2020). Systematic assessment of tissue dissociation and storage biases in single-cell and single-nucleus RNA-seq workflows. Genome Biol. 21, 130. doi: 10.1186/s13059-020-02048-6
Franchi N., Ballin F., Manni L., Schiavon F., Basso G., Ballarin L. (2016). Recurrent phagocytosis-induced apoptosis in the cyclical generation change of the compound ascidian Botryllus schlosseri. Dev. Comp. Immunol. 62, 8–16. doi: 10.1016/j.dci.2016.04.011
Hand S. C., Hardewig I. (1996). Downregulation of cellular metabolism during environmental stress: Mechanisms and implications. Annu. Rev. Physiol. 58, 539–563. doi: 10.1146/annurev.ph.58.030196.002543
Hirose E., Saito Y., Watanabe H. (1995). Regeneration of the tunic cuticle in the compound ascidian, Botrylloides simodensis. Dev. Comp. Immunol. 19, 143–151. doi: 10.1016/0145-305X(94)00062-K
Hirose E., Shirae M., Saito Y. (2003). Ultrastructures and classification of circulating hemocytes in 9 botryllid ascidians (Chordata: Ascidiacea). Zoolog. Sci. 20, 647–656. doi: 10.2108/zsj.20.647
Hyams Y., Panov J., Rosner A., Brodsky L., Rinkevich Y., Rinkevich B. (2022). Transcriptome landscapes that signify Botrylloides leachi (Ascidiacea) torpor states. Dev. Biol. 490, 22–36. doi: 10.1016/j.ydbio.2022.06.005
Hyams Y., Paz G., Rabinowitz C., Rinkevich B. (2017). Insights into the unique torpor of Botrylloides leachi, a colonial urochordate. Dev. Biol. 428, 101–117. doi: 10.1016/j.ydbio.2017.05.020
Jiménez-Merino J., Santos De Abreu I., Hiebert L. S., Allodi S., Tiozzo S., De Barros C. M., et al. (2019). Putative stem cells in the hemolymph and in the intestinal submucosa of the solitary ascidian Styela plicata. Evodevo 10, 1–19. doi: 10.1186/s13227-019-0144-3
Ke M., Elshenawy B., Sheldon H., Arora A., Buffa F. M. (2022). Single cell RNA-sequencing: A powerful yet still challenging technology to study cellular heterogeneity. BioEssays 44, 2200084. doi: 10.1002/bies.202200084
Knapp D., Tanaka E. M. (2012). Regeneration and reprogramming. Curr. Opin. Genet. Dev. 22, 485–493. doi: 10.1016/j.gde.2012.09.006
Korsunsky I., Millard N., Fan J., Slowikowski K., Zhang F., Wei K., et al. (2019). Raychaudhuri, Fast, sensitive and accurate integration of single-cell data with Harmony. Nat. Methods 16, 1289–1296. doi: 10.1038/s41592-019-0619-0
Lauzon R. J., Brown C., Kerr L., Tiozzo S. (2013). Phagocyte dynamics in a highly regenerative urochordate: Insights into development and host defense. Dev. Biol. 374, 357–373. doi: 10.1016/j.ydbio.2012.11.006
Lauzon R. J., Rinkevich B., Patton C. W., Weissman I. L. (2000). A morphological study of nonrandom senescence in a colonial urochordate. Biol. Bull. 198, 367–378. doi: 10.2307/1542692
Lillie R. D. (1977). Histopathologic technic and practical histochemistry. Ann. Intern. Med. 86, 376. doi: 10.7326/0003-4819-86-3-376_6
Lindenbach B. D., Rice C. M. (1997). trans-Complementation of yellow fever virus NS1 reveals a role in early RNA replication. J. Virol. 71, 9608–9617. doi: 10.1128/jvi.71.12.9608-9617.1997
McInnes L., Healy J., Saul N., Großberger L. (2018). UMAP: uniform manifold approximation and projection. J. Open Source Softw 3, 861. doi: 10.21105/joss.00861
Oh J. M., An M., Son D. S., Choi J., Cho Y. B., Yoo C. E., et al. (2022). Comparison of cell type distribution between single-cell and single-nucleus RNA sequencing: enrichment of adherent cell types in single-nucleus RNA sequencing. Exp. Mol. Med. 54, 2128–2134. doi: 10.1038/s12276-022-00892-z
Pesaresi M., Sebastian-Perez R., Cosma M. P. (2019). Dedifferentiation, transdifferentiation and cell fusion: in vivo reprogramming strategies for regenerative medicine. FEBS J. 286, 1074–1093. doi: 10.1111/febs.14633
Petegrosso R., Li Z., Kuang R. (2019). Machine learning and statistical methods for clustering single-cell RNA-sequencing data. Brief. Bioinform. 21, 1209–1223. doi: 10.1093/bib/bbz063
Reem E., Douek J., Rinkevich B. (2018). Ambiguities in the taxonomic assignment and species delineation of botryllid ascidians from the Israeli Mediterranean and other coastlines, Mitochondrial DNA Part A DNA Mapping. Seq. Anal. 29, 1073–1080. doi: 10.1080/24701394.2017.1404047
Rinkevich B., Rabinowitz C. (1993). In vitro culture of blood cells from the colonial protochordate Botryllus schlosseri. Vitr. Cell. Dev. Biol. - Anim. 29, 79–85. doi: 10.1007/BF02634375
Rinkevich B., Shapira M. (1998). An improved diet for inland broodstock and the establishment of an inbred line from Botryllus schlosseri, a colonial sea squirt (Ascidiacea). Aquat. Living Resour 11, 163–171. doi: 10.1016/S0990-7440(98)80113-7
Rinkevich B., Shlemberg Z., Fishelson L. (1995). Whole-body protochordate regeneration from totipotent blood cells. Proc. Natl. Acad. Sci. U. S. A. 92, 7695–7699. doi: 10.1073/pnas.92.17.7695
Rinkevich B., Shlemberg Z., Fishelson L. (1996). “Survival budding processes in the colonial tunicate Botrylloides from the medeterranean sea: The role of totipotent blood cells,” in Invertebr. Cell Cult. Look. Towar. 21st Century, 1–9.
Rinkevich Y., Paz G., Rinkevich B., Reshef R. (2007). Systemic bud induction and retinoic acid signaling underlie whole body regeneration in the urochordate Botrylloides leachi. PloS Biol. 5, 900–913. doi: 10.1371/journal.pbio.0050071
Rinkevich Y., Rinkevich B., Reshef R. (2008). Cell signaling and transcription factor genes expressed during whole body regeneration in a colonial chordate. BMC Dev. Biol. 8, 100. doi: 10.1186/1471-213X-8-100
Rinkevich Y., Rosner A., Rabinowitz C., Lapidot Z., Moiseeva E., Rinkevich B. (2010). Piwi positive cells that line the vasculature epithelium, underlie whole body regeneration in a basal chordate. Dev. Biol. 345, 94–104. doi: 10.1016/j.ydbio.2010.05.500
Rinkevich Y., Voskoboynik A., Rosner A., Rabinowitz C., Paz G., Oren M., et al. (2013). Repeated, long-term cycling of putative stem cells between niches in a basal chordate. Dev. Cell 24, 76–88. doi: 10.1016/j.devcel.2012.11.010
Satija R., Farrell J. A., Gennert D., Schier A. F., Regev A. (2015). Spatial reconstruction of single-cell gene expression data. Nat. Biotechnol. 33, 495–502. doi: 10.1038/nbt.3192
Shalek A. K., Satija R., Shuga J., Trombetta J. J., Gennert D., Lu D., et al. (2014). Single-cell RNA-seq reveals dynamic paracrine control of cellular variation. Nature 510, 363–369. doi: 10.1038/nature13437
Sharma S., Wang W., Stolfi A. (2019). Single-cell transcriptome profiling of the Ciona larval brain. Dev. Biol. 448, 226–236. doi: 10.1016/j.ydbio.2018.09.023
Storey K. B. (2002). “Life in the slow lane: Molecular mechanisms of estivation,” in Comp. Biochem. Physiol. - A Mol. Integr. Physiol. (133):733–754. doi: 10.1016/S1095-6433(02)00206-4
Storey K. B. (2010). Out cold: Biochemical regulation of mammalian hibernation - A mini-review. Gerontology 56, 220–230. doi: 10.1159/000228829
Storey K. B., Storey J. M. (2011). Hibernation: Poikilotherms (Chichester: ELS, Wiley). doi: 10.1002/9780470015902.a0003214.pub2
Vanni V., Anselmi C., Ballarin L., Drago L., Gasparini F., Gordon T., et al. (2022). Current knowledge on stem cells in ascidians. Adv. Aquat. Invertebr. Stem Cell Res. 273. doi: 10.3390/books978-3-0365-1635-6-9
Voskoboynik A., Newman A. M., Corey D. M., Sahoo D., Pushkarev D., Neff N. F., et al. (2013). Identification of a colonial chordate histocompatibility gene. Sci. (80-. ) 341, 384–387. doi: 10.1126/science.1238036
Voskoboynik A., Rinkevich B., Weiss A., Moiseeva E., Reznick A. Z. (2004). Macrophage involvement for successful degeneration of apoptotic organs in the colonial urochordate Botryllus schlosseri. J. Exp. Biol. 207, 2409–2416. doi: 10.1242/jeb.01045
Voskoboynik A., Simon-Blecher N., Soen Y., Rinkevich B., De Tomaso A. W., Ishizuka K. J., et al. (2007). Striving for normality: whole body regeneration through a series of abnormal generations. FASEB J. 21, 1335–1344. doi: 10.1096/fj.06-7337com
Winkley K. M., Reeves W. M., Veeman M. T. (2021). Single-cell analysis of cell fate bifurcation in the chordate Ciona. BMC Biol. 19, 1–26. doi: 10.1186/s12915-021-01122-0
Wu H., Kirita Y., Donnelly E. L., Humphreys B. D. (2019). Advantages of single-nucleus over single-cell RNA sequencing of adult kidney: Rare cell types and novel cell states revealed in fibrosis. J. Am. Soc Nephrol. 30, 23–32. doi: 10.1681/ASN.2018090912
Yao Y., Wang C. (2020). Dedifferentiation: inspiration for devising engineering strategies for regenerative medicine. NPJ Regen. Med. 5, 20. doi: 10.1038/s41536-020-00099-8
Keywords: Botrylloides leachii, hemocytes, torpor, transcriptomics, single cell RNA-seq, cell fusion, multinucleated cells, microbiome
Citation: Hyams Y, Panov J, Taranenko E, Brodsky L, Rinkevich Y and Rinkevich B (2023) “Keep on rolling”: circulating cells in a botryllid ascidian torpor. Front. Ecol. Evol. 11:1196859. doi: 10.3389/fevo.2023.1196859
Received: 30 March 2023; Accepted: 06 November 2023;
Published: 08 December 2023.
Edited by:
Rosa Maria Sepe, Anton Dohrn Zoological Station Naples, ItalyReviewed by:
Rita Marino, Anton Dohrn Zoological Station Naples, ItalyFederica Montesanto, University of Florida, United States
Copyright © 2023 Hyams, Panov, Taranenko, Brodsky, Rinkevich and Rinkevich. This is an open-access article distributed under the terms of the Creative Commons Attribution License (CC BY). The use, distribution or reproduction in other forums is permitted, provided the original author(s) and the copyright owner(s) are credited and that the original publication in this journal is cited, in accordance with accepted academic practice. No use, distribution or reproduction is permitted which does not comply with these terms.
*Correspondence: Baruch Rinkevich, buki@ocean.org.il