Anterior diaphyseal curvature of the femur and tibia has biomechanical consequences during unloaded uphill locomotion
 Alison A. Murray
 Marla MacKinnon1
  Joshua W. Giles
- 1Phenotypic Adaptability and Skeletal Evolution (PhASE) Lab, Department of Anthropology, University of Victoria, Victoria, BC, Canada
- 2Orthopaedic Technologies and Biomechanics Lab, Department of Mechanical Engineering, University of Victoria, Victoria, BC, Canada
The biomechanics of limb bone curvature are complex, and though anterior curvature clearly exhibits some relationship with behavior, the mechanisms shaping it and its biomechanical purpose remain unclear. Among both Neanderthals and humans, anterior limb bone curvature correlates strongly with other limb bone adaptations known to reflect high mobility, particularly in steep variable terrain. We developed a computational musculoskeletal model to test the impact of opposing patterns of human femoral and tibial anterior curvature on muscle kinetics during a proxy for uphill walking: stair-climbing. Femoral and tibial laser scans were used from two archaeological individuals matched for estimated body mass, bi-iliac breadth, and crural index but with reverse patterns of anterior diaphyseal curvature. A default OpenSim musculoskeletal model was modified twice – once to each individual’s anatomy – and the resulting models performed stair-climbing gait simulations with experimentally-collected motion capture data. Both custom MSk models followed the general gait kinematics expected based on stair-climbing gait studies, but differed in muscle kinetics in key areas. When a curved femur was paired with a straight tibia, the opposite pattern of recruitment of bi-articular superficial hamstring muscles was observed compared to the pairing of a straight femur with a curved tibia. Pairing a curved femur with a straight tibia was also associated with reduced soleal recruitment and an increased reliance on secondary ankle plantarflexors. These effects are attributed to variation in muscle moment arms about the knee and the relationships that curvature likely has with other three-dimensional morphological variation within the bone/limb. While the tissue-level mechanisms shaping anterior limb bone curvature remain poorly understood, results of the current study suggest that opposing patterns of variation in long bone curvature within the leg do elicit different kinetic solutions to the problem of achieving the same gait kinematics during uphill locomotion. This is an important first step not just in better understanding the biomechanical impact of anatomical variation in bone curvature on locomotion, but also contributes more broadly to the recognition in biological anthropology of variability in the relationship between locomotor function and underlying skeletal structure.
1 Introduction
Anterior limb bone diaphyseal curvature first attracted considerable anthropological attention in the early 20th century, when a high degree of femoral curvature was noted among newly emerging Neanderthal fossil discoveries (Klaatsch, 1901; Anthony and Rivet, 1907; Boule, 1908; 1911; 1912a; 1912b; 1913). Since then, widespread inter- and intra-specific variability in anterior limb bone curvature has been documented among humans and other hominins (Shackelford and Trinkaus, 2002; De Groote, 2011; Chapman et al., 2015; Macintosh et al., 2015; Brzobohatá et al., 2019), with Neanderthals in particular demonstrating high levels of femoral curvature relative to early (De Groote, 2008; De Groote, 2011) and/or more recent (Shackelford and Trinkaus, 2002; De Groote, 2011; Chapman et al., 2018) humans. Anterior limb bone curvature in both Neanderthals and humans, as well as among non-human primates, also consistently demonstrates significant correlations with limb bone robusticity (Shackelford and Trinkaus, 2002; Yamanaka et al., 2005; De Groote, 2008; De Groote, 2011; Macintosh et al., 2015; Hagihara, 2023), itself clearly linked to mechanical loading and mobility (Kontulainen et al., 2007; Weatherholt and Warden, 2016; Niinimäki et al., 2017; Macintosh and Stock, 2019). Temporal declines in anterior curvature from Neanderthals through Paleolithic and Mesolithic humans to recent modern humans (Shackelford and Trinkaus, 2002; Macintosh et al., 2015; Brzobohatá et al., 2019) do tend to parallel similar temporal declines in robusticity across these time periods (Ruff et al., 1993; Macintosh et al., 2014; Ruff et al., 2015), indicating that perhaps limb bone curvature shares similar functional relationships with loading. This is supported among non-human primates, in whom limb bone curvature clearly varies in relation to positional behavior and muscle mechanics (Swartz, 1990; Jungers et al., 1997; Yamanaka et al., 2005). Further, animal models have demonstrated a clear relationship between experimentally-induced neuromuscular paralysis during embryonic and early life growth and a failure to develop normal levels of long bone curvature (Lanyon, 1980; Hall and Herring, 1990). Though some relationship between mechanical loading and the development of, and variability in, diaphyseal curvature seems likely, the precise identification of the proximate causal factors driving variability in this trait have proven difficult to pinpoint.
The consequences of diaphyseal curvature on intra-bone strain distribution have been explored extensively both theoretically and experimentally in animal models. Weight-bearing limb bones among mammals experience predominantly bending moments (Lanyon and Baggott, 1976; Rubin and Lanyon, 1982; Rubin, 1984; Biewener and Taylor, 1986), and longitudinal curvature seems not to counteract this bending strain but rather to increase it (Biewener et al., 1983; Rubin, 1984; Bertram and Biewener, 1988; Biewener et al., 1988). This is difficult to explain if the most important factor shaping curvature is keeping tissue-level strain within an acceptable safety factor, but becomes more logical if load predictability is considered as an equally important factor shaping fracture risk. The arrangement of bone tissue in cross-section is one means of keeping a reasonable safety factor, by preferentially adding or redistributing tissue to areas under the most strain while maintaining the most economical mass of tissue possible (Rubin, 1984). When loading conditions are highly dynamic and variable, it becomes more difficult to achieve a beneficial arrangement that does not simply involve universally increasing tissue and thus mass. In dynamic loading conditions, morphology that can reduce the variability in loading direction may be particularly beneficial (Rubin, 1984). Curvature theoretically does just that, narrowing the range of bending directions produced by loads with highly variable directionality (Bertram and Biewener, 1988); the more curved a long bone is, the greater the probability that bending will occur in the direction of the curvature, regardless of the direction of the applied load (Bertram and Biewener, 1988). This advantage to predictability is at the expense of strength however: greater curvature is associated with reduced load-carrying capacity at the weakest point in a curved column (Bertram and Biewener, 1988). This classic hypothesis as to the function of longitudinal bone curvature, first proposed in 1988, has since been experimentally supported with finite element analysis (Jade et al., 2014). Limb bone architecture may reflect, at least in part, a compromise between strength and strain predictability in response to the prevailing loading conditions experienced during life. The optimal structure for this compromise depends both on the typical magnitude of peak loads experienced relative to a bone’s safety factor, and to the extent of variability in typical orientation of loads experienced (Bertram and Biewener, 1988). Among mammalian quadrupeds, mean limb bone curvature tends to fall within the optimal radius of curvature to maximize stress predictability without excessively compromising strength (Bertram and Biewener, 1988; Bertram and Biewener, 1992). Variability in limb bone anterior curvature may thus be particularly informative about variability in loading conditions experienced during locomotion.
In human bipedal walking and running, high variability in loading conditions is associated in particular with locomotion over uneven, variable, and/or sloped terrain. These terrain types elicit substantial variability in lower limb gait dynamics (Voloshina et al., 2013; Voloshina and Ferris, 2015) and joint kinematics and kinetics (Voloshina et al., 2013), as well as increased muscle activity (McIntosh et al., 2006; Voloshina et al., 2013; Alexander and Schwameder, 2016a), joint forces (Alexander and Schwameder, 2016b), and within-bone compressive and shear strains (Burr et al., 1996) among humans relative to walking over flat, even terrain. Uphill locomotion in the form of climbing stairs also elicits joint contact forces (Morrison, 1969; Andriacchi et al., 1980; Bergmann et al., 2001; Taylor et al., 2004) and joint moments (Costigan et al., 2002; Riener et al., 2002) as much as three times higher than those experienced in level walking. Perhaps not surprisingly then, inferred mobility over mountainous, rugged, and hilly terrains has been repeatedly associated with high lower limb bone cross-sectional bending strength in both humans and Neanderthals (Ruff, 1999; Carlson et al., 2007; Sparacello et al., 2008; Higgins, 2014; Holt and Whittey, 2019), even when inferred mobility levels themselves are otherwise relatively similar between groups (Ruff, 1999; Carlson et al., 2007). The geographic range of Neanderthals certainly encompassed mountainous habitats, including the mountain massifs of the Iberian peninsula (López-García et al., 2022), the cliffs of Dordogne and Crimea (Mednikova et al., 2017), the mountain ranges of the Levant along the Jordan Rift Valley in the eastern Mediterranean (Higgins, 2014; Henry et al., 2017), the Zagros Mountain range of present-day Iraq (Higgins, 2014; Pomeroy et al., 2020), and the Altai Mountains of central Asia (Rudaya et al., 2017). Though the development of their high anterior limb bone curvature has never been investigated in relation to these mountainous terrains, other distinct aspects of their morphology (short crural index) have been mathematically theorized to affect locomotion during uphill walking (Higgins and Ruff, 2011). This was not experimentally tested, however.
There is certainly reason to believe that limb bone anterior curvature may be associated with kinetic consequences during bipedal walking. Limb bone morphology can influence muscular parameters such as muscle moment arms and muscle-tendon lengths (Arnold et al., 2000), and thus can affect the force-generating ability of the key muscles and the forces and torques exerted in the major limb joints during movement. A virtual reconstruction of a Neanderthal lower body utilizing femora from Spy II and Neanderthal I, both of which are known to exhibit high curvature (Shackelford and Trinkaus, 2002; De Groote, 2011), has produced higher hamstring moment arms at the knee when squatting (using human gait data) than a comparative human (Chapman et al., 2010). Though preliminary, this early work suggests that there could be some kinetic consequences of curvature, however their scope and relationship to locomotion in steep terrain remains unknown. Currently, we do not know whether anterior curvature has any relationship with more complex joint kinematics and kinetics, gait parameters, or muscle activation during bipedal walking in general, and particularly over steep terrain. We also do not know how anterior femoral curvature tends to pattern relative to curvature of the more distal tibia and fibula in human or hominin populations in general, or the relationships that diaphyseal curvature in any of these bones has with other morphological variation of the whole bone or epiphyses.
Here we develop a computational MSk model to test the impact of opposing patterns of variation in human femoral and tibial anterior curvature specifically on lower limb muscle kinetics during a proxy for uphill walking: stair-climbing. Existing gait studies examining the kinematics and kinetics of stair-climbing have demonstrated a general pattern by which the hip and knee are flexed and the ankle is dorsiflexed at first foot contact with the stair followed by extension and plantarflexion across the stance phase (Riener et al., 2002). The stance phase is associated with an increasing hip flexion moment throughout, peaking at 3x greater than that produced during level walking (Riener et al., 2002), and an increasing hip flexion moment during the first portion of the stance phase (Costigan et al., 2002). These external moments cause the hip and knee to flex and require activation of the hip and knee extensors to counteract the undesired rotation (Joseph and Watson, 1967; Lyons et al., 1983; Costigan et al., 2002), with the lowest portion of the gluteus maximus acting as the main hip extensor during the initial and mid-stance phases (Lyons et al., 1983). The largest power production in the hip and knee joint occur right after foot contact, and these joints reach their maximum extension at the end of the stance phase (Riener et al., 2002); here, they can no longer further raise the center of mass (CoM). The ankle experiences its peak power production at the end of stance phase (Riener et al., 2002), when it plantarflexes to transfer body weight over to the other leg in preparation for its foot to plant on the next stair. Interestingly, ankle plantarflexion here seems to be primarily achieving this weight transfer to the other leg, rather than lifting CoM up on to the next stair, which is achieved instead by hip and knee extension of the other limb after foot contact (Joseph and Watson, 1967). We test the hypothesis that reversing the pattern of variation in femoral and tibial anterior curvature (curved femur with straight tibia and vice versa) will drive differences between models in this typical stair-climbing pattern of muscle kinetics. In quantifying the impact of opposite patterns of femoral and tibial curvature on uphill locomotion in a musculoskeletal analysis for the first time, we further aim to support future predictive simulation investigating the metabolic costs of variation in curvature when walking in different terrain gradients.
2 Materials and methods
2.1 Three-dimensional surface models and choice of model morphology
Two pairs of matched human right femoral and tibial three-dimensional (3D) laser surface scans were chosen from existing models collected by Macintosh and colleagues (Macintosh et al., 2014) and Davies (2012). These existing models include 234 matched pairs of femora and tibiae from 14 different archaeological populations of wide geographic and temporal spread and a range of subsistence strategies. As such, a wide range of human variation in curvature was thought to be represented. All of the laser surface models were scanned using a NextEngine 3D desktop laser scanner (NextEngine, Inc., CA, USA, www.nextengine.com), trimmed, aligned and fused using ScanStudio software (NextEngine, Inc.), and oriented to consistent axes using the RapidWorks software package. Further details of the scanning procedures are outlined by Macintosh and colleagues (Macintosh et al., 2014) and Davies (2012). For each bone, cross-sections were taken at every 1% of diaphyseal length from each laser scan using custom-made AsciiSection software (Davies et al., 2012). This software also identified the centroid of every cross-section; diaphyseal curvature was quantified as the perpendicular antero-posterior distance of the section centroid at each section location from the longitudinal axis linking the centroids of the most proximal and distal diaphyseal slices, at 20% and 80% of maximum bone length respectively. Being external laser scans, the positioning of section centroid location was derived from periosteal morphology alone, but these centroid locations have been shown to very highly predict the true position of the section centroid at the midshaft femur and tibia (Macintosh et al., 2013). Centroid locations at every 1% of diaphyseal length provided a collective model of diaphyseal curvature relative to a single diaphyseal axis rather than relative to periosteal morphology, similar to the approach of Yamanaka and colleagues (Yamanaka et al., 2005) for anthropoid primates.
In the larger set of 234 matched pairs of femora and tibiae, the maximum femoral anterior section centroid displacement observed was 11.95 mms (average 6.78 mm, N=234), while the maximum tibial anterior section centroid displacement observed was 8.3 mms (average 3.23, N=234). Further, when high diaphyseal curvature occurred, it was typically only in one of the two bones; femoral and tibial curvature were not correlated with each other. As such, the two matched pairs of femora and tibiae were chosen because they reflected the extreme opposite ends of variation: one individual had a curved femoral diaphysis but relatively straight tibial diaphysis (this individual and the model built from it is hereafter referred to as CFST), and one individual had a straight femoral diaphysis but relatively curved tibial diaphysis (this individual and the model built from it is hereafter referred to as SFCT; see Figure 1). Our Model CFST has a higher-than-average femoral curvature but straighter than average tibial curvature, while our Model SFCT reflects the straightest femur in the overall dataset paired with a much higher than average tibial curvature (see Table 1). Otherwise, the two individuals were both male and similar in estimated body mass, bi-iliac breadth, and crural index (see Table 1), all parameters that may otherwise influence gait kinematics and muscle kinetics (Gruss and Schmitt, 2004; Polk, 2004; Wall-Scheffler, 2012; Sheehan and Gormley, 2013; Gruss et al., 2017; Law et al., 2021). Body mass was estimated according to population-specific equations (Ruff et al., 2012) when possible (Model CFST), or with the mean of three non-specific equations (Ruff et al., 1997) when no population-specific equations existed (Model SFCT). These equations require supero-inferior (S-I) femoral head diameters, which were measured to the nearest 0.1 millimeter using digital sliding calipers at the time the remains were laser scanned. Bi-iliac breadth and crural index (ratio of tibia to femur length, recorded parallel to the long axis of the diaphysis) were obtained using an osteometric board, again at the time the remains were laser scanned.
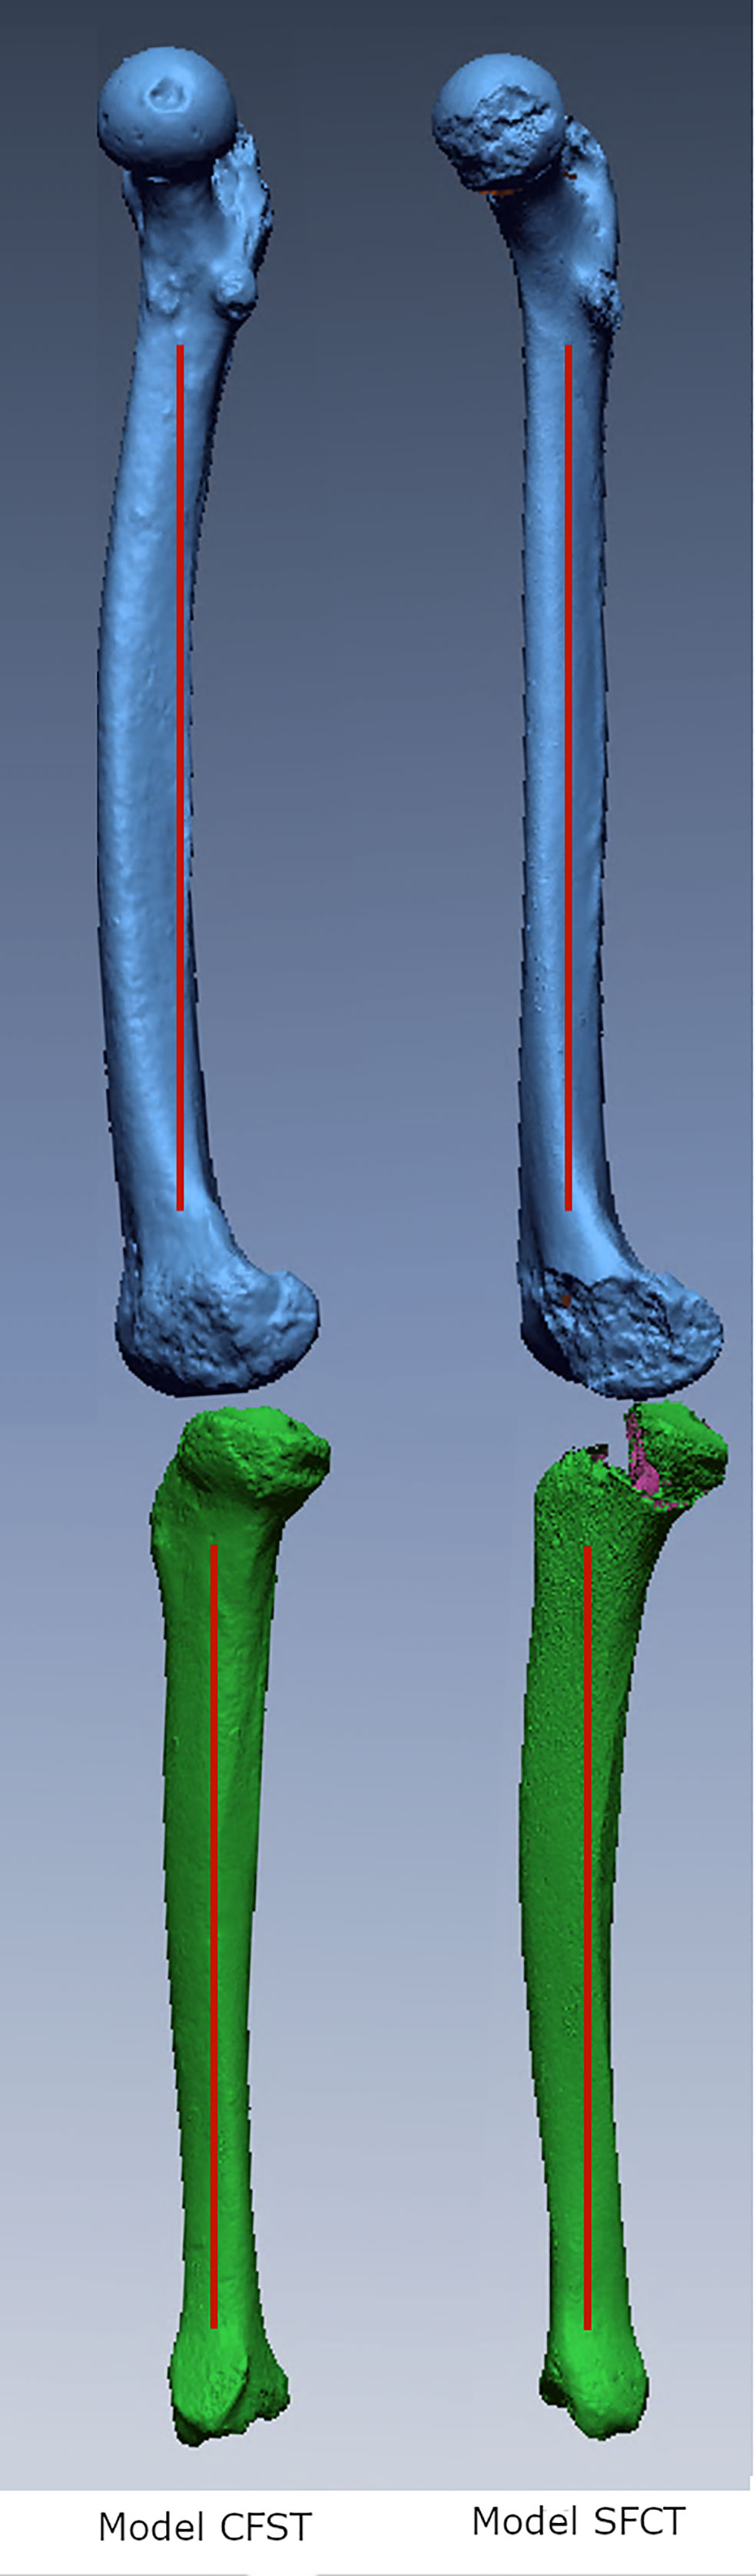
Figure 1 Medial view of three-dimensional laser surface scans of matched pairs of right femora and tibiae used to create Models CFST and SFCT.
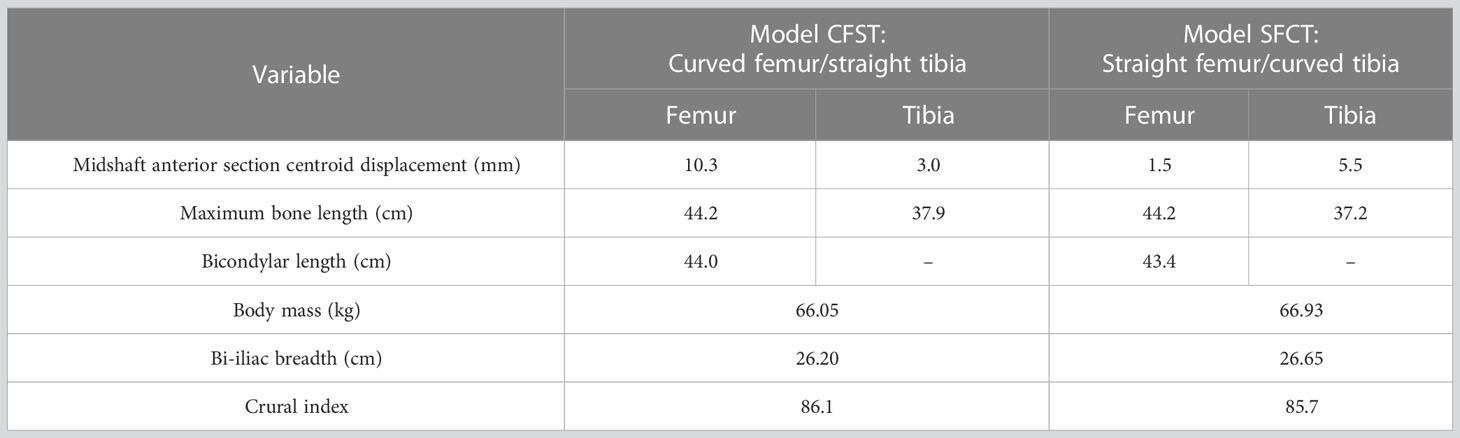
Table 1 Femoral, tibial, and body size descriptive statistics for Models CFST and SFCT.
2.2 Creation of custom Models CFST and SFCT: modification of base OpenSim model
An existing base musculoskeletal (MSk) model by Raabe & Chaudhari (Raabe and Chaudhari, 2016) was modified using the open-source software OpenSim (Delp et al., 2007) to create two custom models (see Figure 2 for an example of Model CFST). Custom muscle origin and insertion x, y, and z coordinates in 3D space were obtained from right femoral and tibial laser scans with the aid of bony landmarks for a set of key hip, knee, and ankle (tibio-talar) joint flexors and extensors (see Table 2) using the Geomagic Design X™ software package (3D Systems, Inc., USA). The muscle origin and insertion coordinates of the base OpenSim model were then modified to these custom coordinates. All other lower limb muscle coordinates were not modified. For muscles that wrap over bone, for example around a joint, intermediate points known as ‘via’ points were manually defined between the origin and insertion point. Muscles with multiple lines of action are represented in OpenSim by multiple individual muscle paths; for example, gluteus maximus has three lines of action, so is represented by three different muscle paths, referred to as gluteus maximus 1, 2, and 3, from most superior to most inferior. In these instances, multiple origin or insertion points were collected, and output provided for each line of action.
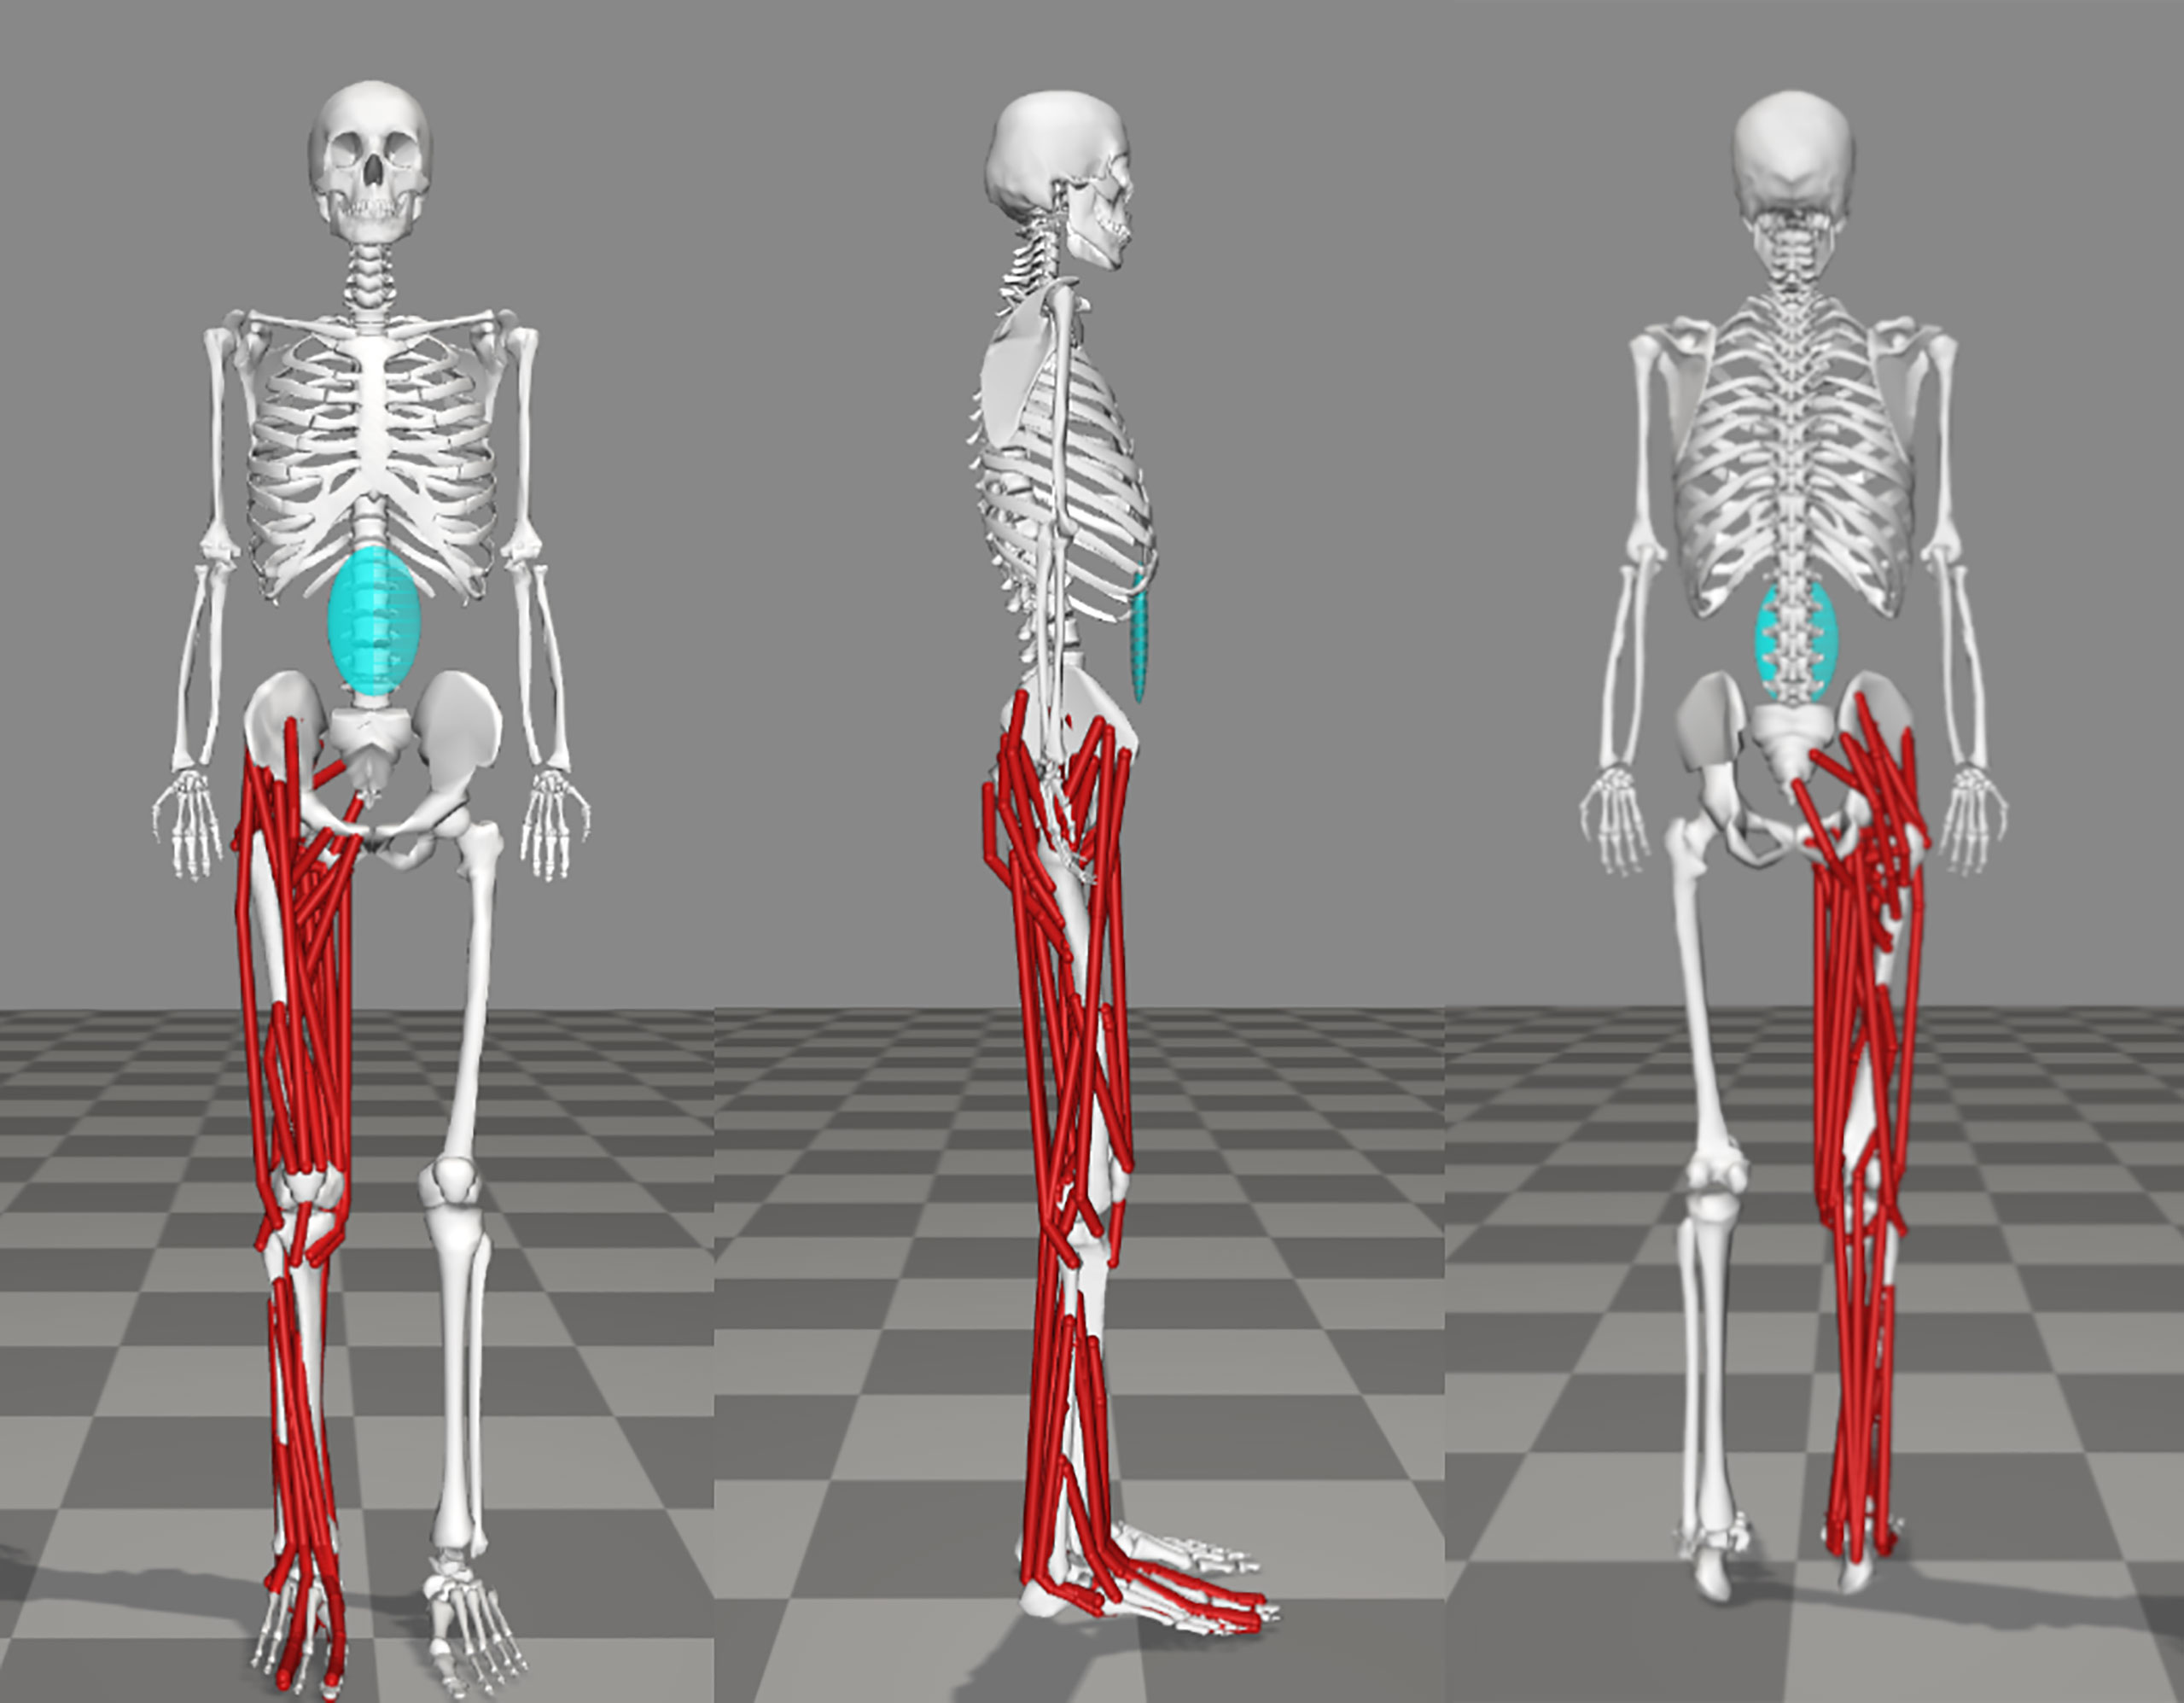
Figure 2 OpenSim musculoskeletal Model CFST with customized right limb and muscle paths, in anterior, lateral, and posterior views. Muscles for the remainder of the model are omitted for clarity.
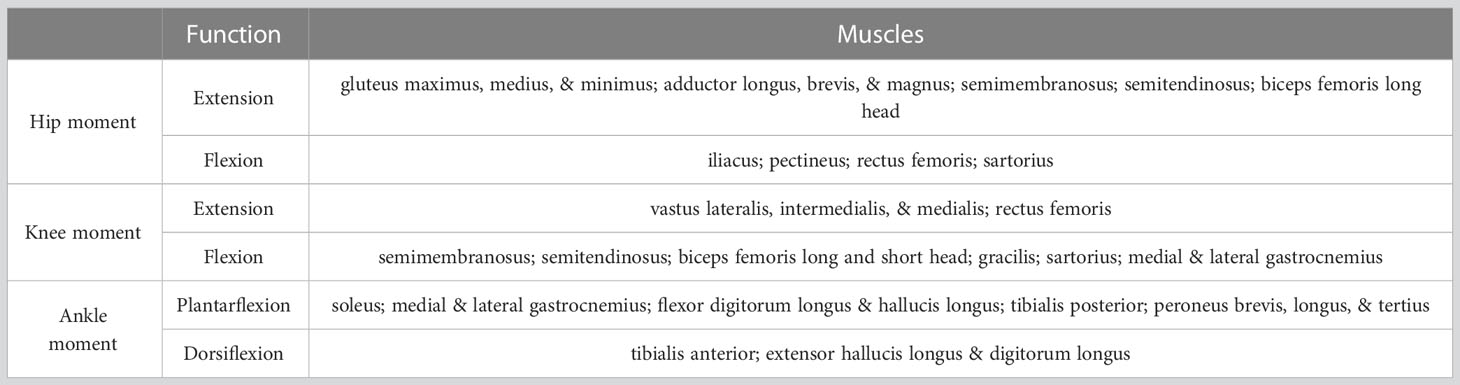
Table 2 Main muscles producing hip, knee, and/or ankle moments in the MSk models and their functions.
To identify the hip joint center of rotation and enable correct alignment of the femur with the pelvis in OpenSim, point coordinates from the center of a sphere fitted to each femoral head in GeoMagic were used. To identify the knee joint center of rotation, and to enable correct alignment of the femur with the tibia in OpenSim given the varying curvature of the bones, point coordinates were used from the following: i) the center of a circle fitted to each femoral epicondyle, ii) the midpoint of a vector connecting the two, iii) the most medial and lateral aspects of the proximal tibial condyles from the anterior view, iv) the midpoint of a vector connecting these two (passing through the intercondylar eminence), and v) the most proximal aspect of the tibial tuberosity. To identify the tibio-talar ankle joint center of rotation, and enable correct alignment of the tibia to the talus in OpenSim, a point coordinate was obtained from the distalmost aspect of the medial malleolus. However, point coordinates for the distalmost aspect of the lateral malleolus, and from the midpoint of a vector connecting the two, had to be estimated, as neither the fibula, nor its position relative to the tibia, was available for either individual. To estimate these missing points, a proxy tibia of the same length as each model tibia was chosen from the skeletal collections housed at the University of Victoria. The associated fibula was then positioned in anatomical position, and the vertical and horizontal distance between the distal tips of the medial and lateral malleoli were measured using digital calipers. These same distances were applied in GeoMagic to estimate where the distal end of the lateral malleolus likely was in life, and a point coordinate obtained from this location. A final point coordinate was obtained midway along a vector linking the two malleolar points. These points were used to construct the same bone fixed coordinate systems of the femur and tibia used in the base OpenSim model as defined in the ISB standard (Wu et al., 2002). Though there is surface damage to the proximal tibia of Model SFCT, this damage did not affect any morphology required to obtain the coordinate systems needed to build the custom MSk model. All coordinates required for the position of the knee joint and its center of rotation were on undamaged morphology, and no muscle origin or insertion coordinates were impacted. As such, the visible damage does not affect any of the model inputs or outputs.
Leg length for each individual was estimated as the distance between the coordinate at the center of the femoral head and the intermalleolar coordinate, with an additional five millimeters added to approximate the inter-condylar soft tissue of the knee. Each lower limb, including its bone geometry and muscle origin/insertion points, were then scaled such that the length was the same as the original base MSk model while maintaining the length relationship between the femur and tibia (crural index). Each custom limb was then imported into the base OpenSim model to replace the base right femur and tibia. The pelvis of each custom MSk model was scaled to the average bi-iliac breadth for males from the population-specific archaeological collection from which each pair of lower limb digital models was originally obtained: 26.20 cm for Model CFST and 26.65 cm for Model SFCT. Manual adjustments were then made in each custom model to the OpenSim definitions of the tibiofemoral and patellofemoral joints, which use a custom rotation-to-translation coupling to account for the relationship between knee flexion and tibiofemoral and patellofemoral kinematics. Specifically, the coupling equations were heuristically adjusted until normal femoral roll back and patellofemoral articulation were maintained throughout flexion. This process yielded two OpenSim models with unique femur and tibia curvature combinations, crural indices, and pelvis breadth, that agree with the source human populations, while maintaining the overall limb length of the base OpenSim model. Because, in both custom MSk models, some anatomy was estimated (e.g. the ankle joint center of rotation), error has inevitably been introduced into the outputs. However, for both models, estimated coordinates were obtained using the same procedure by the same observer for both models, in the hope that the effect of any introduced error will be similar between models, and thus the pattern of differences between them still meaningful.
2.3 Experimental data and MSk modeling process
To the authors’ knowledge, there are no available gait datasets that capture uphill walking with a sufficient incline to study the potential effects of lower limb bone anterior curvature. Therefore, the authors chose stairclimbing as a surrogate for the intended activity. The authors obtained an existing stair-climbing dataset of 17 subjects from the University of Tennessee, described in Rasnick and colleagues (Rasnick et al., 2016). These healthy control participants climbed a custom staircase where each step was separately mounted to a force plate. Each subject performed five trials of stair ascent at their self-selected speed ( ± 5%) up a set of five stairs, the first three of which were instrumented (FP-Stairs, American Mechanical Technology Inc., Watertown, MA, USA) and securely bolted to two force platforms (1200 Hz, BP600600 and and OR-6-7, American Mechanical Technology Inc., Watertown, MA, USA) (Rasnick et al., 2016). For each trial, kinematics and ground reaction forces were recorded, and the average of each variable of interest across the five trials was used for each subject. From the experimental data from 17 healthy controls, those from four males who most closely matched the body mass and stature of our two model individuals were chosen for inclusion in this study. These four males were 176–182 cm tall and weighed 75–79 kg. This selection of participants most closely matching in body size was done to mitigate any effect that scaling the custom models to experimental data might have had.
Regarding model scaling, the segment spatial and inertia properties were scaled using traditional marker-based scaling methods. The original marker set accompanying the base model was modified to match the marker set of the stair-climbing gait trials. Scaling was performed using the anatomical marker set while each subject maintained a static T-pose. In OpenSim, the pelvis dimensions were scaled based on the experimental subjects’ pelvis breadth as determined using Iliac Crest marker data, and in doing so the pelvic shape ratios were maintained. In order to minimize error in later calculations of the inverse kinematics, the thighs and shanks were scaled using marker distances from the greater trochanter to the lateral epicondyles and from the lateral epicondyles to the lateral malleolus, respectively. It is possible that this slightly changed the crural index of each model, but the femur and tibia curvature characteristics were maintained.
OpenSim’s Inverse Kinematics algorithm was then applied to each of the scaled custom models for the stair climbing marker motion data to reproduce each subject’s joint kinematics. These joint kinematics and the experimental ground reaction forces were coupled with each custom model for use in the next step. Specifically, the OpenSim Residual Reduction Algorithm – which makes small adjustments to the model kinematics and segment inertial properties – was then applied to minimize the dynamic inconsistencies produced when the previously determined kinematics were coupled with the measured ground reaction forces. Static Optimization was then applied to determine the muscle activations and forces across the stair climbing motions that were required to achieve the kinematics and dynamics output from the Residual Reduction Algorithm (Kuo, 1998). With these steps completed, four gait simulations were run for each of our two custom models – one simulation for each of the four experimental individuals, and outputs were recorded for each trial and averaged across all four. It is important to note that both custom models moved according to the same fixed set of experimental data, and thus gait parameters like speed, stride length, and frequency were constrained, and it was morphology that was varied. This is very different from predictive MSk modeling, in which morphology is constrained, and gait patterns that would best achieve a specified goal, like minimizing energy expenditure and metabolic cost, are predicted.
For analysis purposes, the start (i.e., 0%) of the gait cycle was identified as the instant of right foot toe-off and the end of one complete gait cycle was the instant just before the subsequent right foot toe-off (i.e., 100%).
2.4 Analyses and ethics
Analyses were focused on movement in the sagittal plane, to determine the relationship (if any) between anteroposterior diaphyseal curvature of the femur and tibia and muscle forces produced by the main hip, knee, and ankle flexors/extensors. Means and standard deviations in joint angle, muscle force, and muscle moment arm across the four individual gait trials performed by each model were quantified at every 1% of the gait cycle. Due to unequal variance between groups, Robust Cohen’s d (Algina et al., 2005) was used to quantify the effect size of mean model differences at every 1% of the gait cycle via an internal MATLAB algorithm using the following formula:
This measure of effect size replaces population means with 20% trimmed means (), and population standard deviation with 20% Winsorized variance (sw) (Algina et al., 2005). An effect size of 0.50 or higher was considered as indicative of a meaningful and large difference in mean values between models. Ethical approval for the use of anonymized, previously-collected human data for this research was obtained from the University of Victoria Human Research Ethics Board (Ethics Protocol Number 20-0416).
3 Results
All mean joint kinematics, muscle forces, and moment arms for each model, and effect sizes between models, are presented in the Supplementary Information at every 1% of the gait cycle.
3.1 Gait characteristics and joint position
Joint kinematics of the measured (right) lower limb across a full stair-climb gait cycle are presented in Figure 3. Key model characteristics and differences in joint position are presented in Table 3. For ease of interpretation, the stair-climbing gait was divided into three broad phases, depicted in Figure 4: Phase I) Leg swing and foot plant: 0 to ~28% of the gait cycle; Phase II) Stance – Weight lift: ~29 to ~89%; Phase III) Stance – Weight shift and heel raise: ~90–100%. Because both models utilized the same experimental stair-climbing data, the timing of peak flexion and extension and the ranges of motion for pelvic tilt and all three joints across the stair-climbing gait cycle were very similar: both models covered ~4° of rotation in the sagittal plane at the pelvis, ~50° at the hip, ~78° at the knee, and ~28° at the ankle. There were no mean differences in joint position between models that achieved an effect size of more than 0.50.
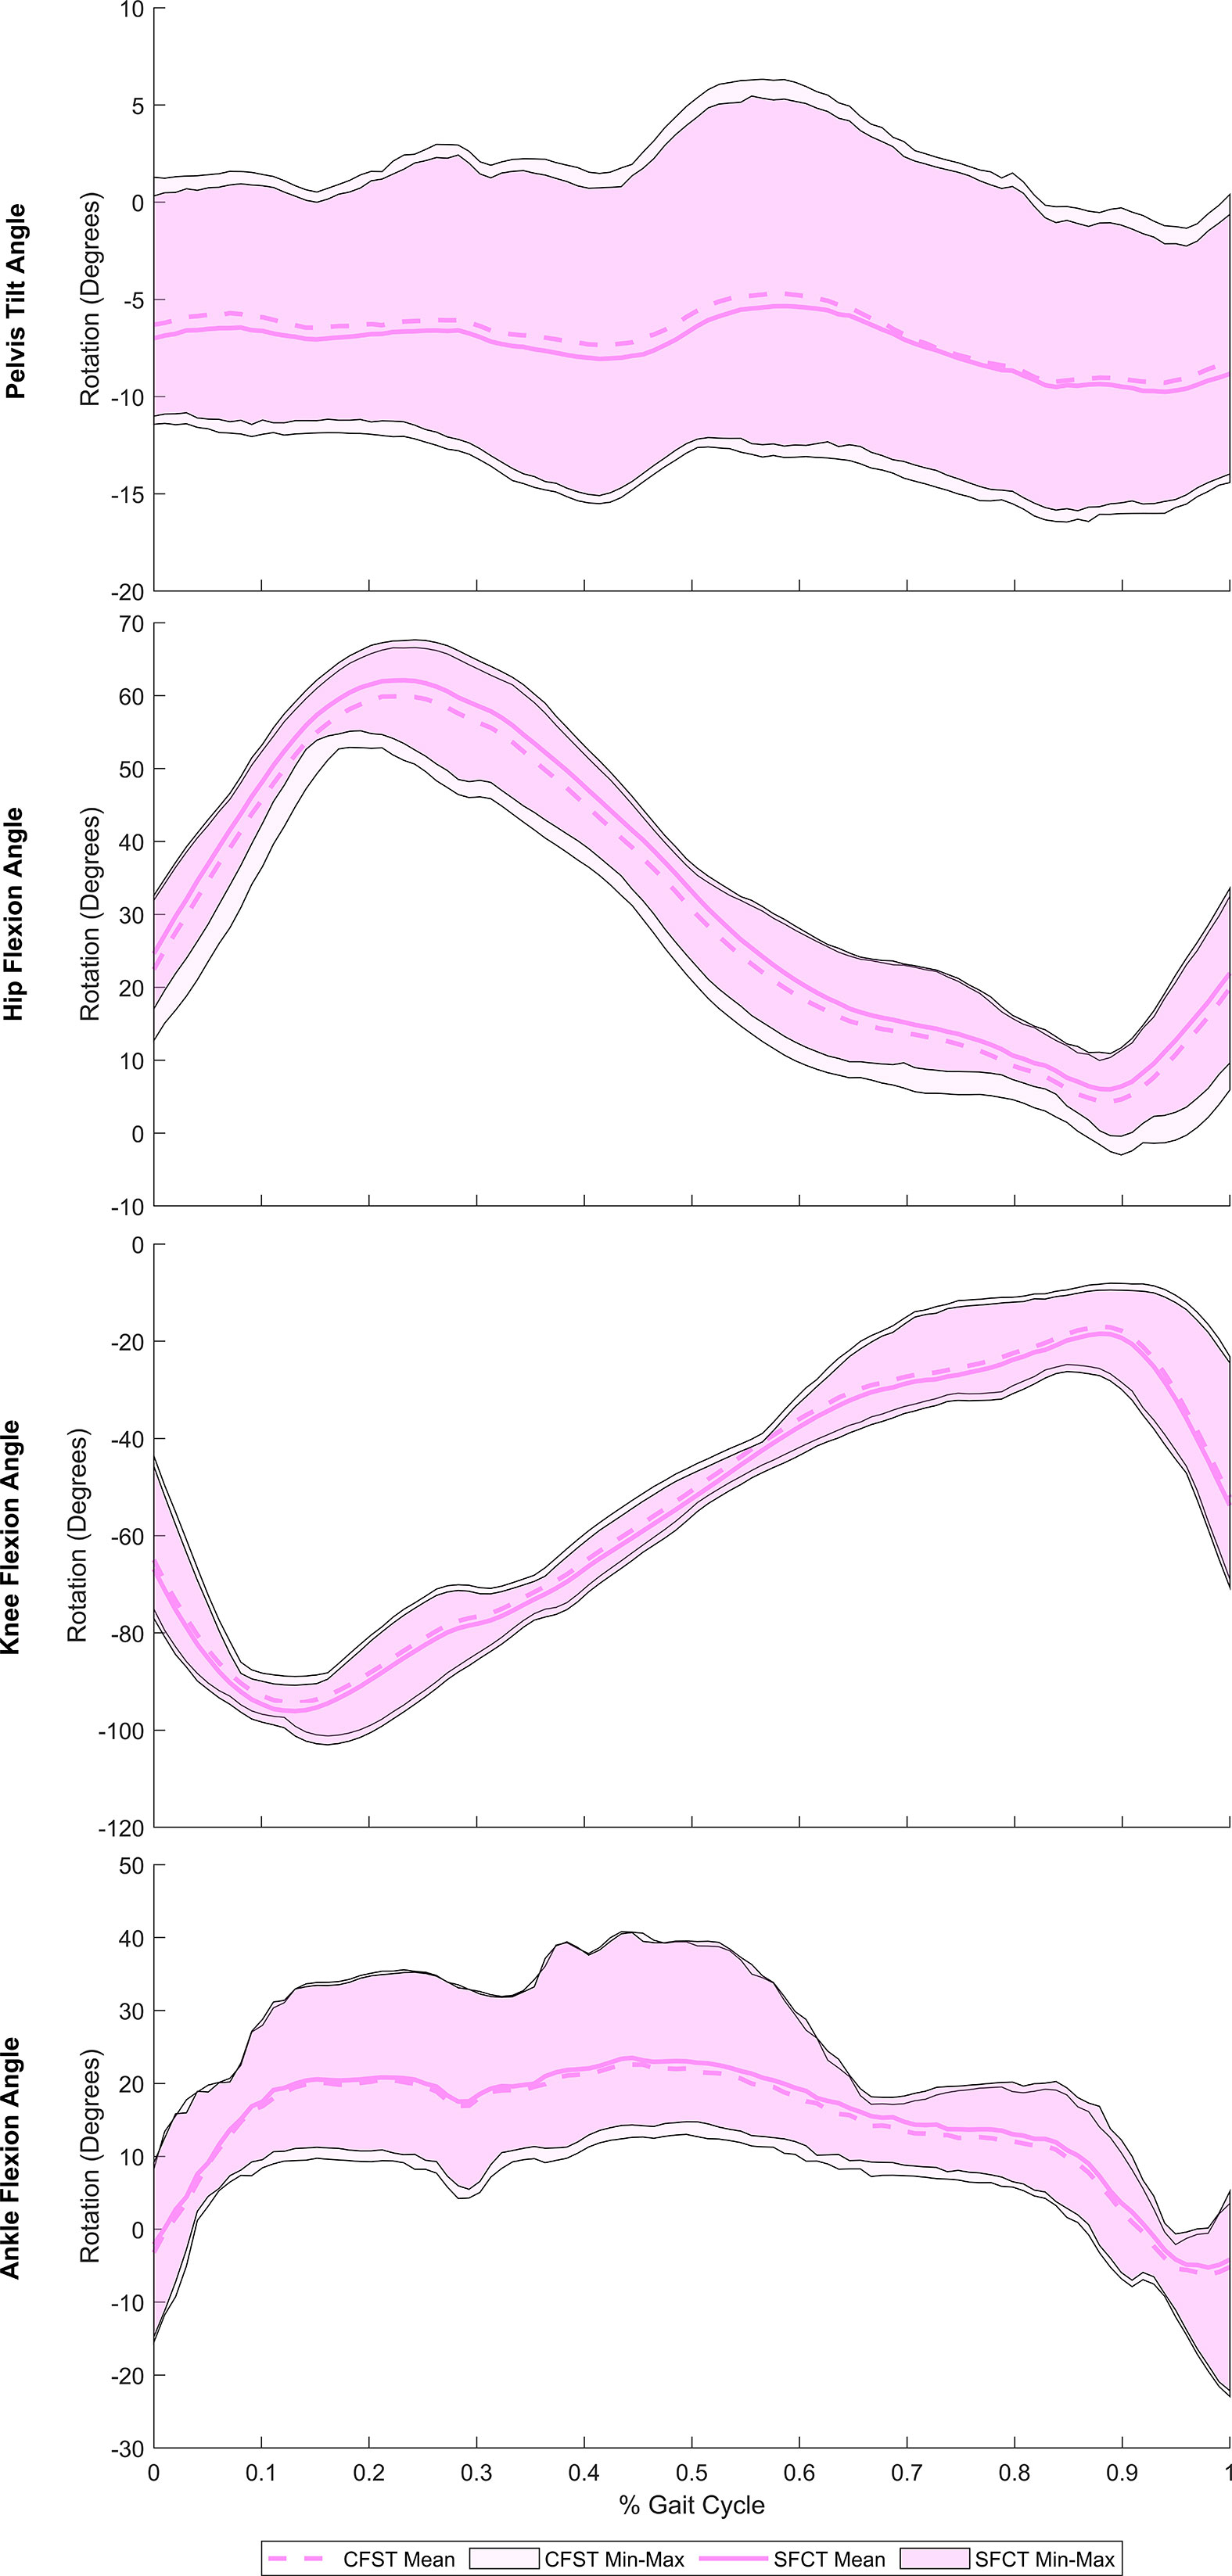
Figure 3 Mean joint rotation in the sagittal plane across a full stair-climbing gait cycle, by model. Spread on either side of the mean reflects the range (min-max) of values across the four individual gait trials. CFST: Model CFST – Curved femur, straight tibia; SFCT: Model SFCT – Straight femur, curved tibia.
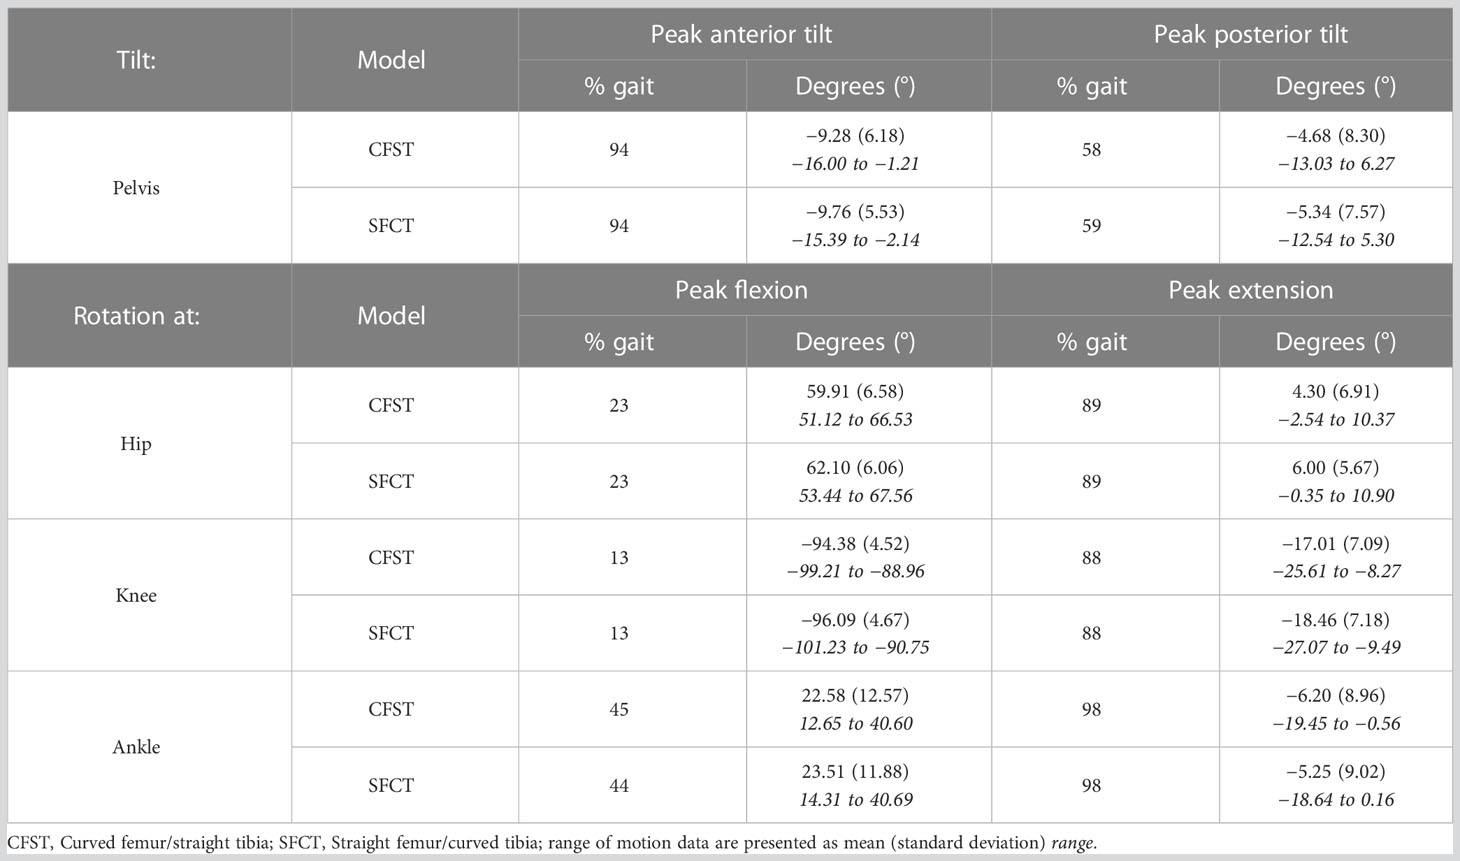
Table 3 Key joint range of motion characteristics.
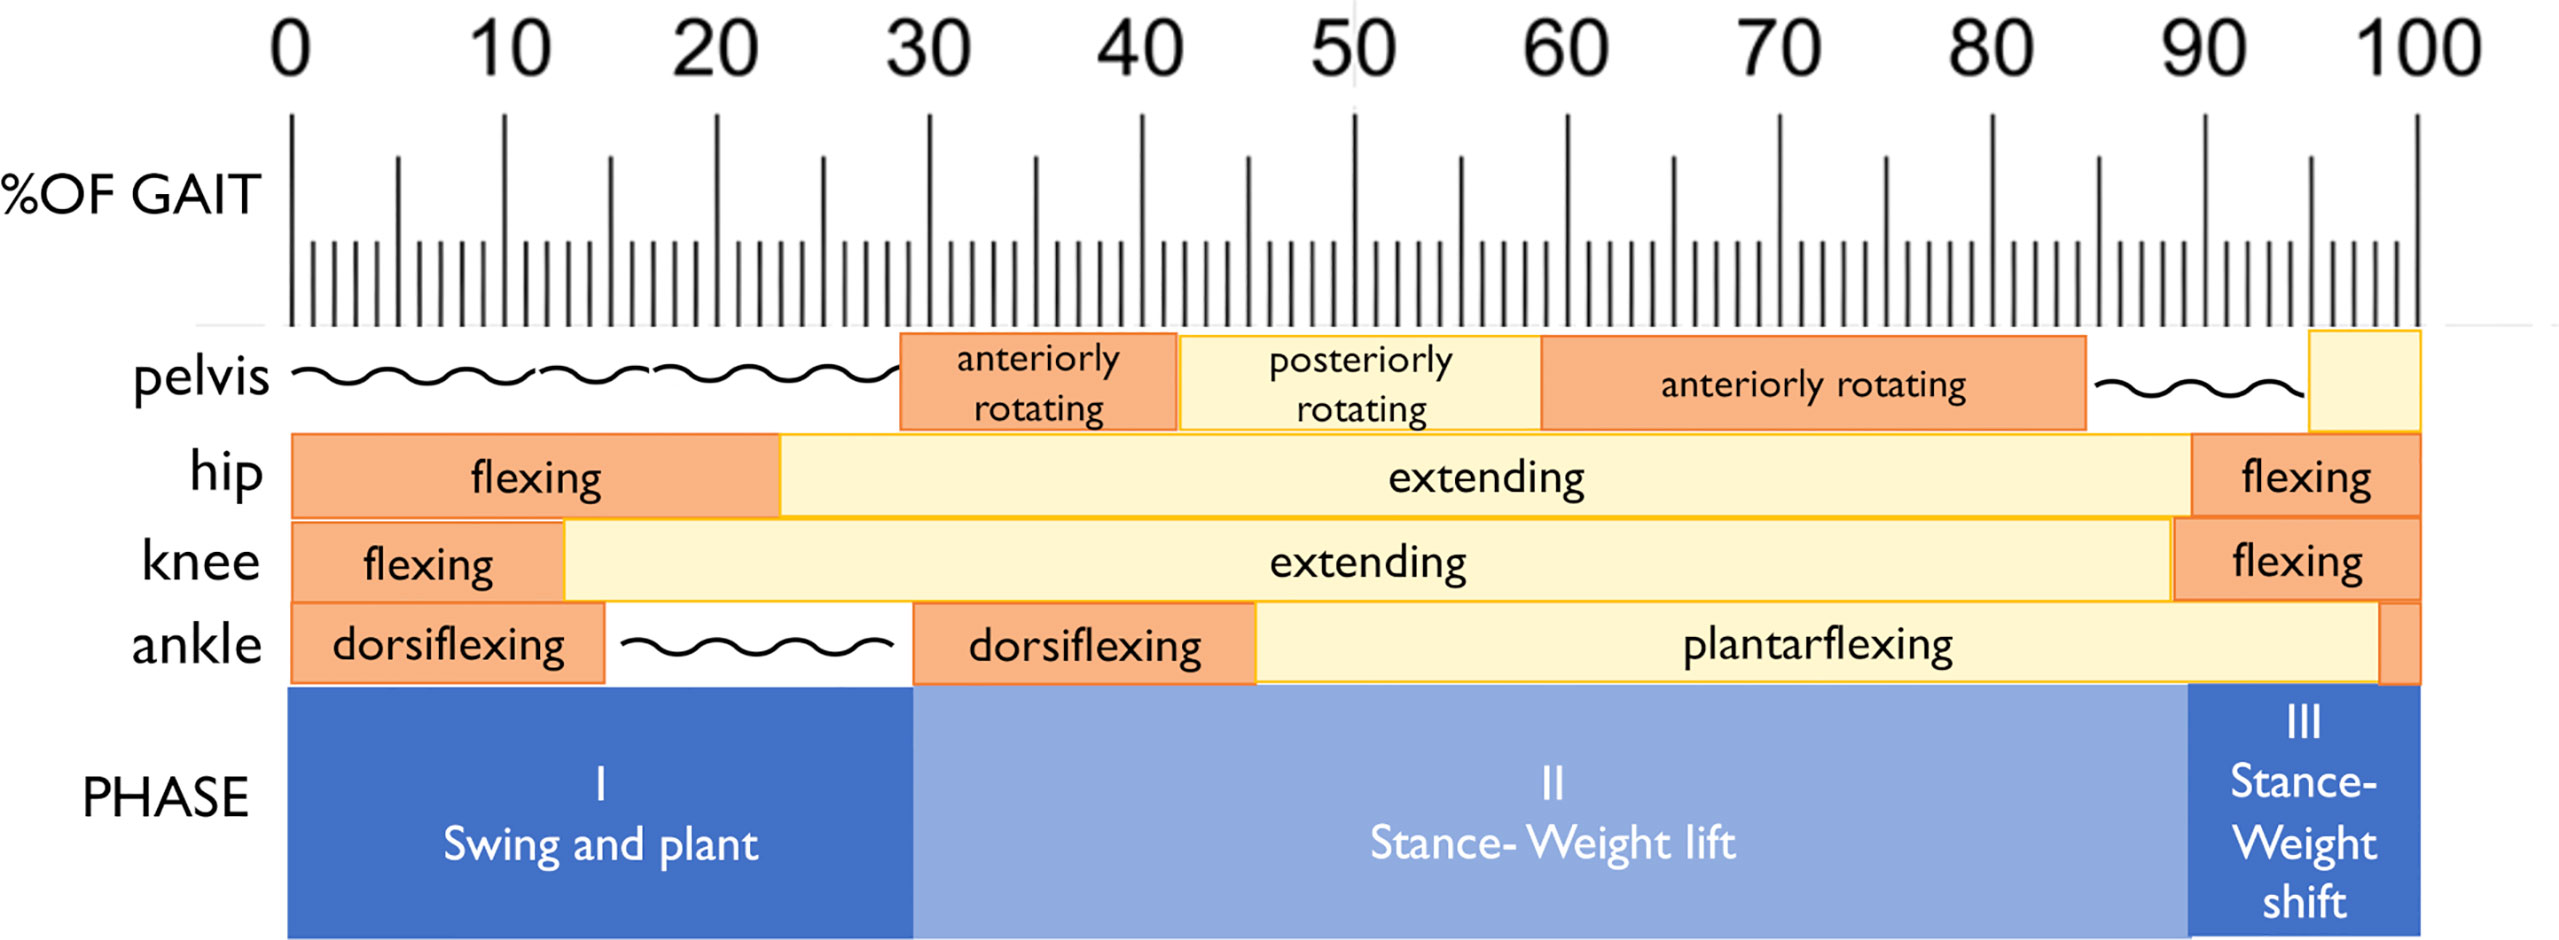
Figure 4 Division of the gait into three phases, with corresponding joint movements indicated.
Beginning with right toe-off at 0%, Phase I encompassed the unloaded leg swing through to foot plant on the next stair. Throughout, the pelvis maintained a stable anterior tilt of ~6.5° in both models. The hip initially flexed to bring the leg up and forward, reaching peak flexion at 23% of the gait cycle before extending in preparation for the foot plant. The knee also initially flexed to help lift the foot, reaching peak flexion at 13% of the gait cycle before extending in preparation for foot plant. The ankle initially dorsiflexed to re-elevate the toes after the plantarflexion of toe-off, reaching a stable flexed position of ~20° by 15% of the gait cycle and remaining there in both models for the remainder of Phase I. Once the foot planted by ~29% of the gait cycle, Phase II began, encompassing the anterior shifting and elevation of the center of mass (CoM) by the right leg that continued through to ~89% of the gait cycle. This phase was dominated by hip and knee extension, both reaching peak extension at 89% of the gait cycle. Initially, once the right foot was planted on the stair, slight anterior rotation of the pelvis and dorsiflexion of the ankle occurred in both models as the CoM shifted forward. Upon reaching peak dorsiflexion at 45%, the ankle then began to plantarflex for the remainder of Phase II. In order to keep the torso and head balanced over the stance foot as the leg joints extended and the CoM was raised, the pelvis also posteriorly rotated slightly from 41–59% of the gait cycle. At that point, the pelvis rotated anteriorly slightly again until about 85%, before holding steady for the remainder of Phase II. With the initiation of Phase III at ~90%, peak hip and knee extension had been reached and these joints began flexing due to high external flexion moments. At this point in stair-climbing, the CoM can only continue to be elevated and shifted over to the left foot through ankle plantarflexion, which was evident in both models and reached its peak at 98%. By then, the left foot had taken over weight-bearing and started to lift the CoM, accompanied by slight posterior rotation of the pelvis and by right foot toe-off, completing the gait cycle.
3.2 Muscle force production and recruitment
Despite largely very similar joint kinematics across the gait cycle, the opposing patterns of lower limb bone curvature did elicit some key differences in muscle recruitment patterns and force production magnitudes between models. Meaningful differences in muscle force production between models were identified as average force production of ≥ 20 N by at least one of the models and a large effect size identified by Robust Cohen’s d larger than 0.50. Force outputs from key muscles of the measured (right) lower limb demonstrating large differences between models are presented in Figure 5 (hip extensors), Figure 6 (knee extensors), and Figure 7 (ankle plantarflexors). Peak muscle force by model and muscle in each gait phase are presented in Tables 4, 5.
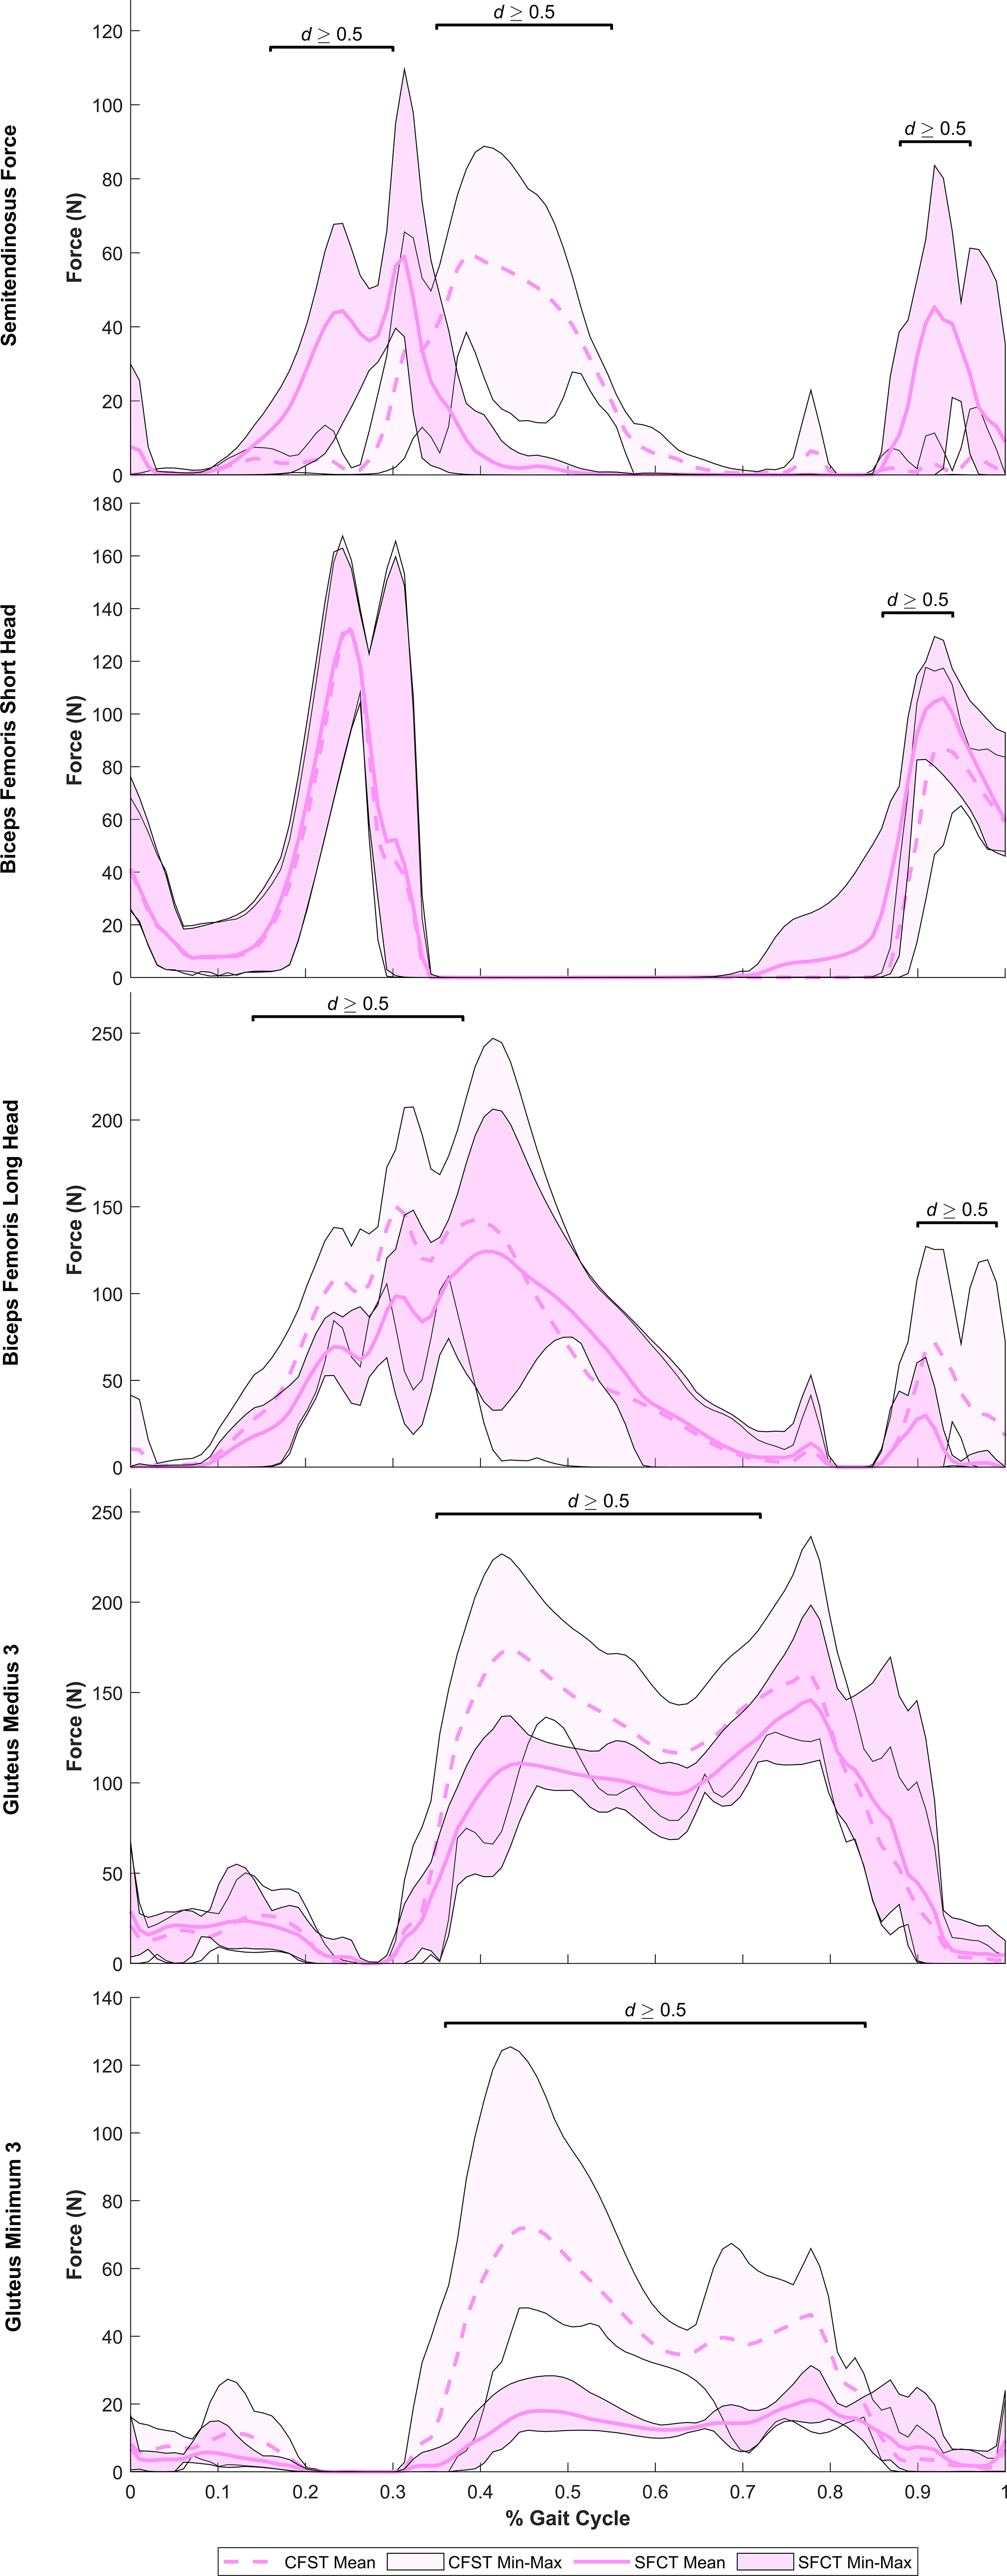
Figure 5 Mean force production (N) and range of values across the four individual gait trials by model for key hip extensor muscles exhibiting large model differences. Segments of the gait in which large effect sizes between mean differences (Robust Cohen’s d) were found are denoted with a solid black line. CFST: Model CFST – Curved femur, straight tibia; SFCT: Model SFCT – Straight femur, curved tibia.
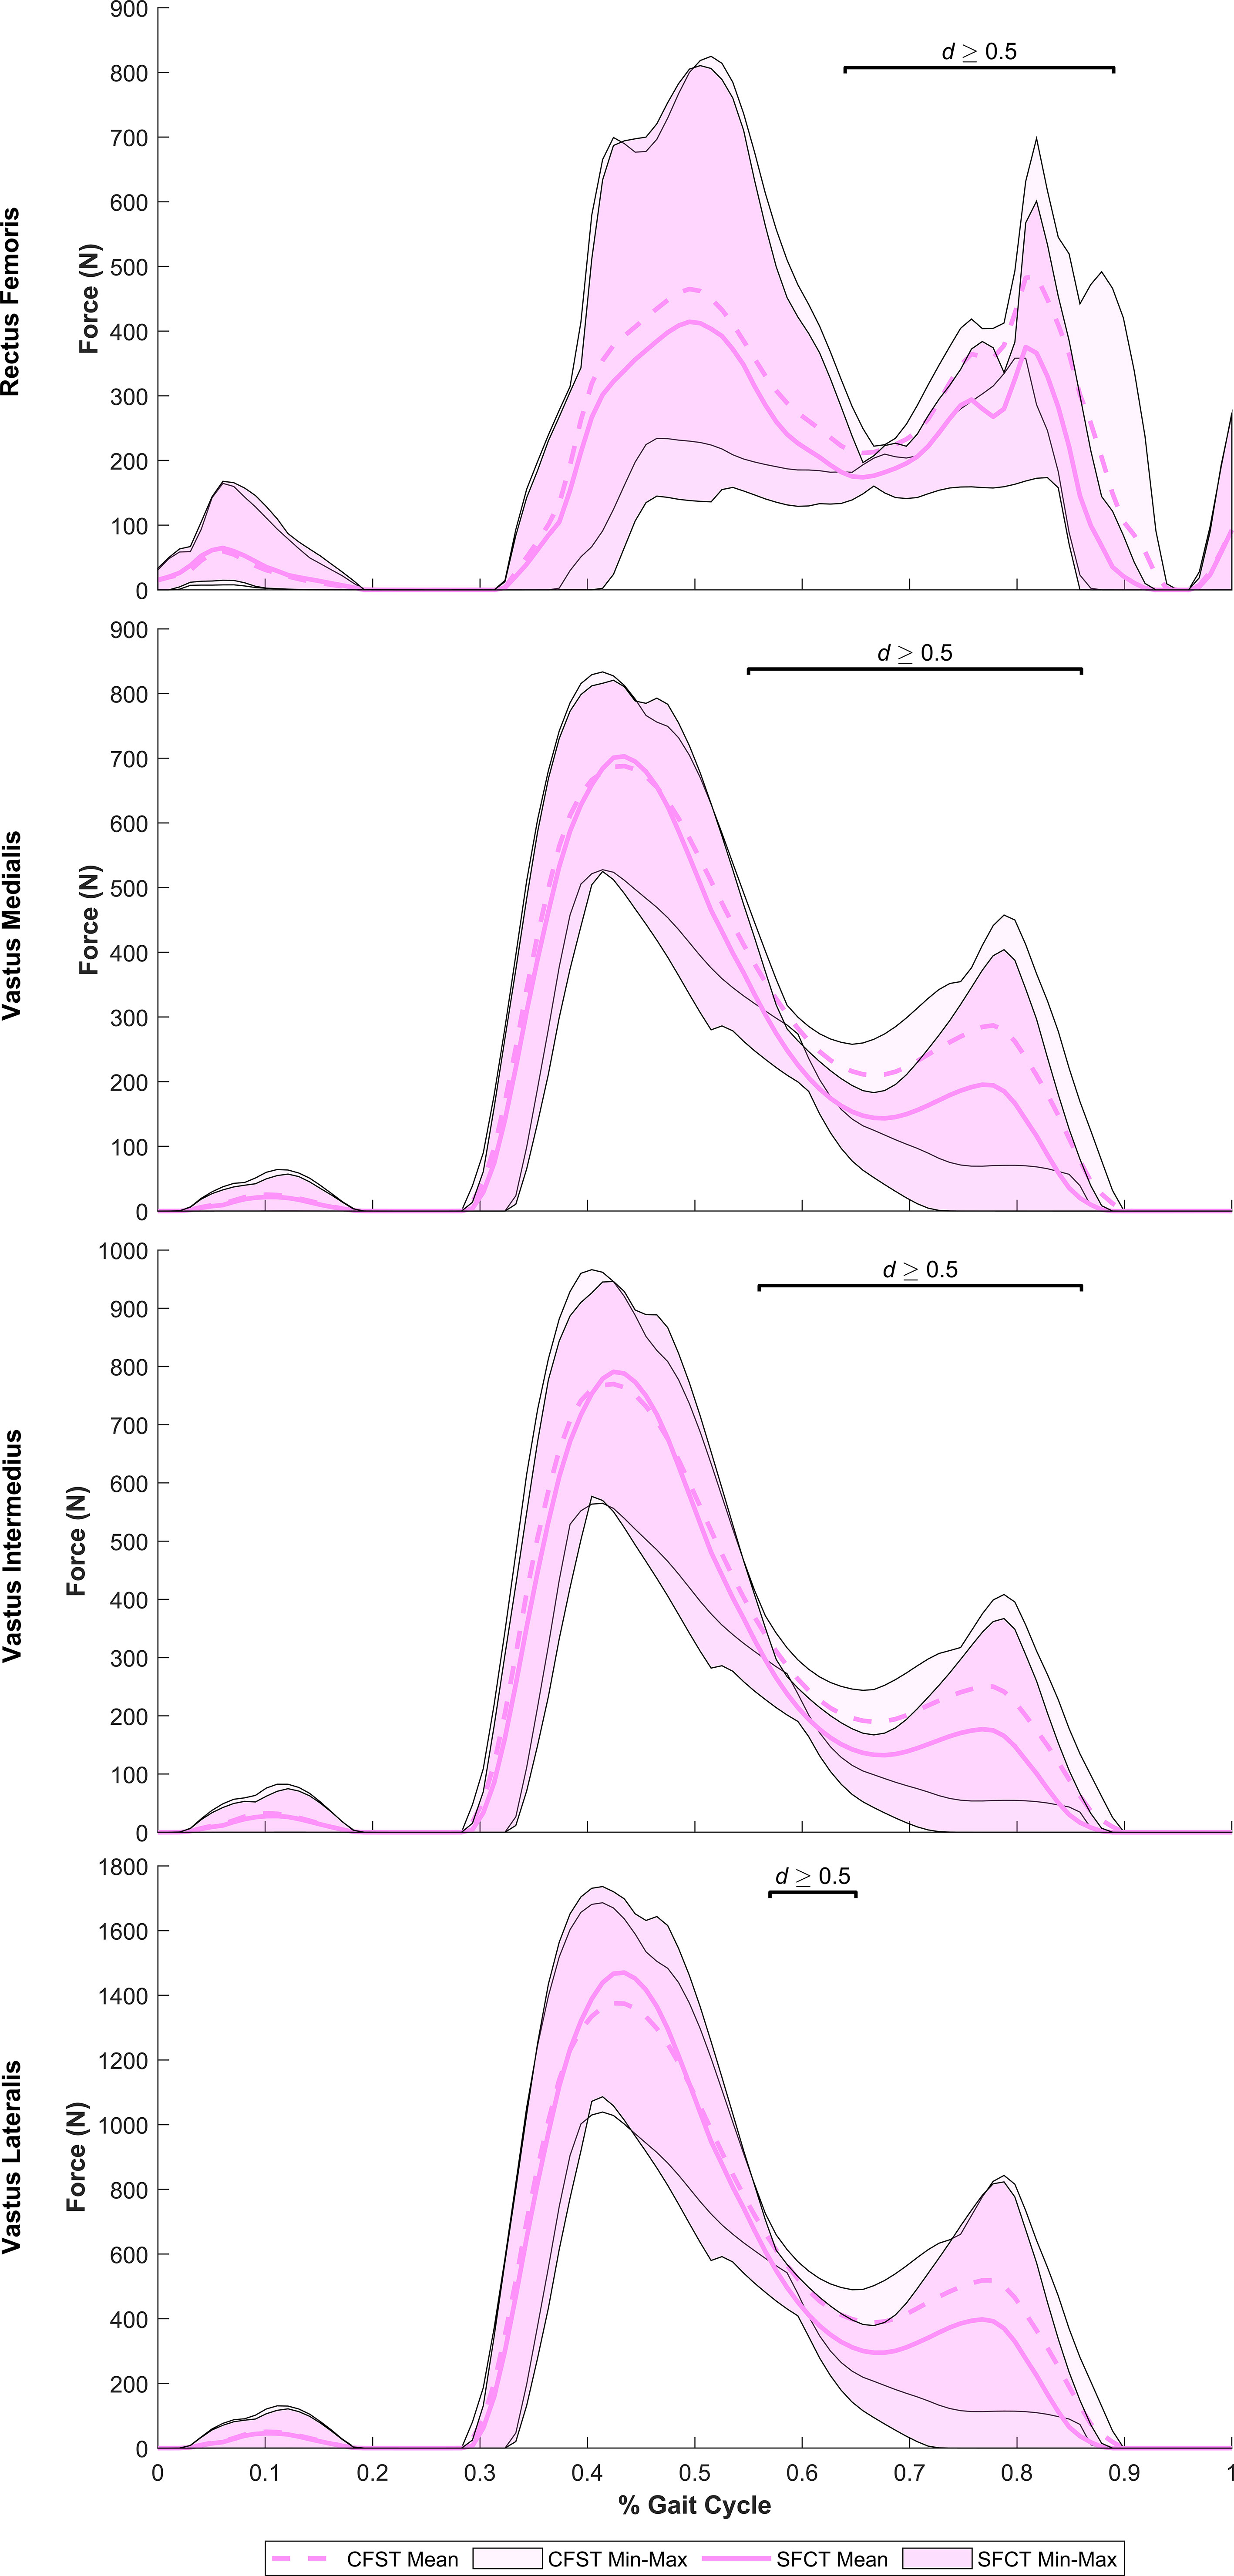
Figure 6 Mean force production (N) and range of values across the four individual gait trials by model for key knee extensor muscles exhibiting large model differences. Segments of the gait in which large effect sizes between mean differences (Robust Cohen’s d) were found are denoted with a solid black line. CFST: Model CFST – Curved femur, straight tibia; SFCT: Model SFCT – Straight femur, curved tibia.
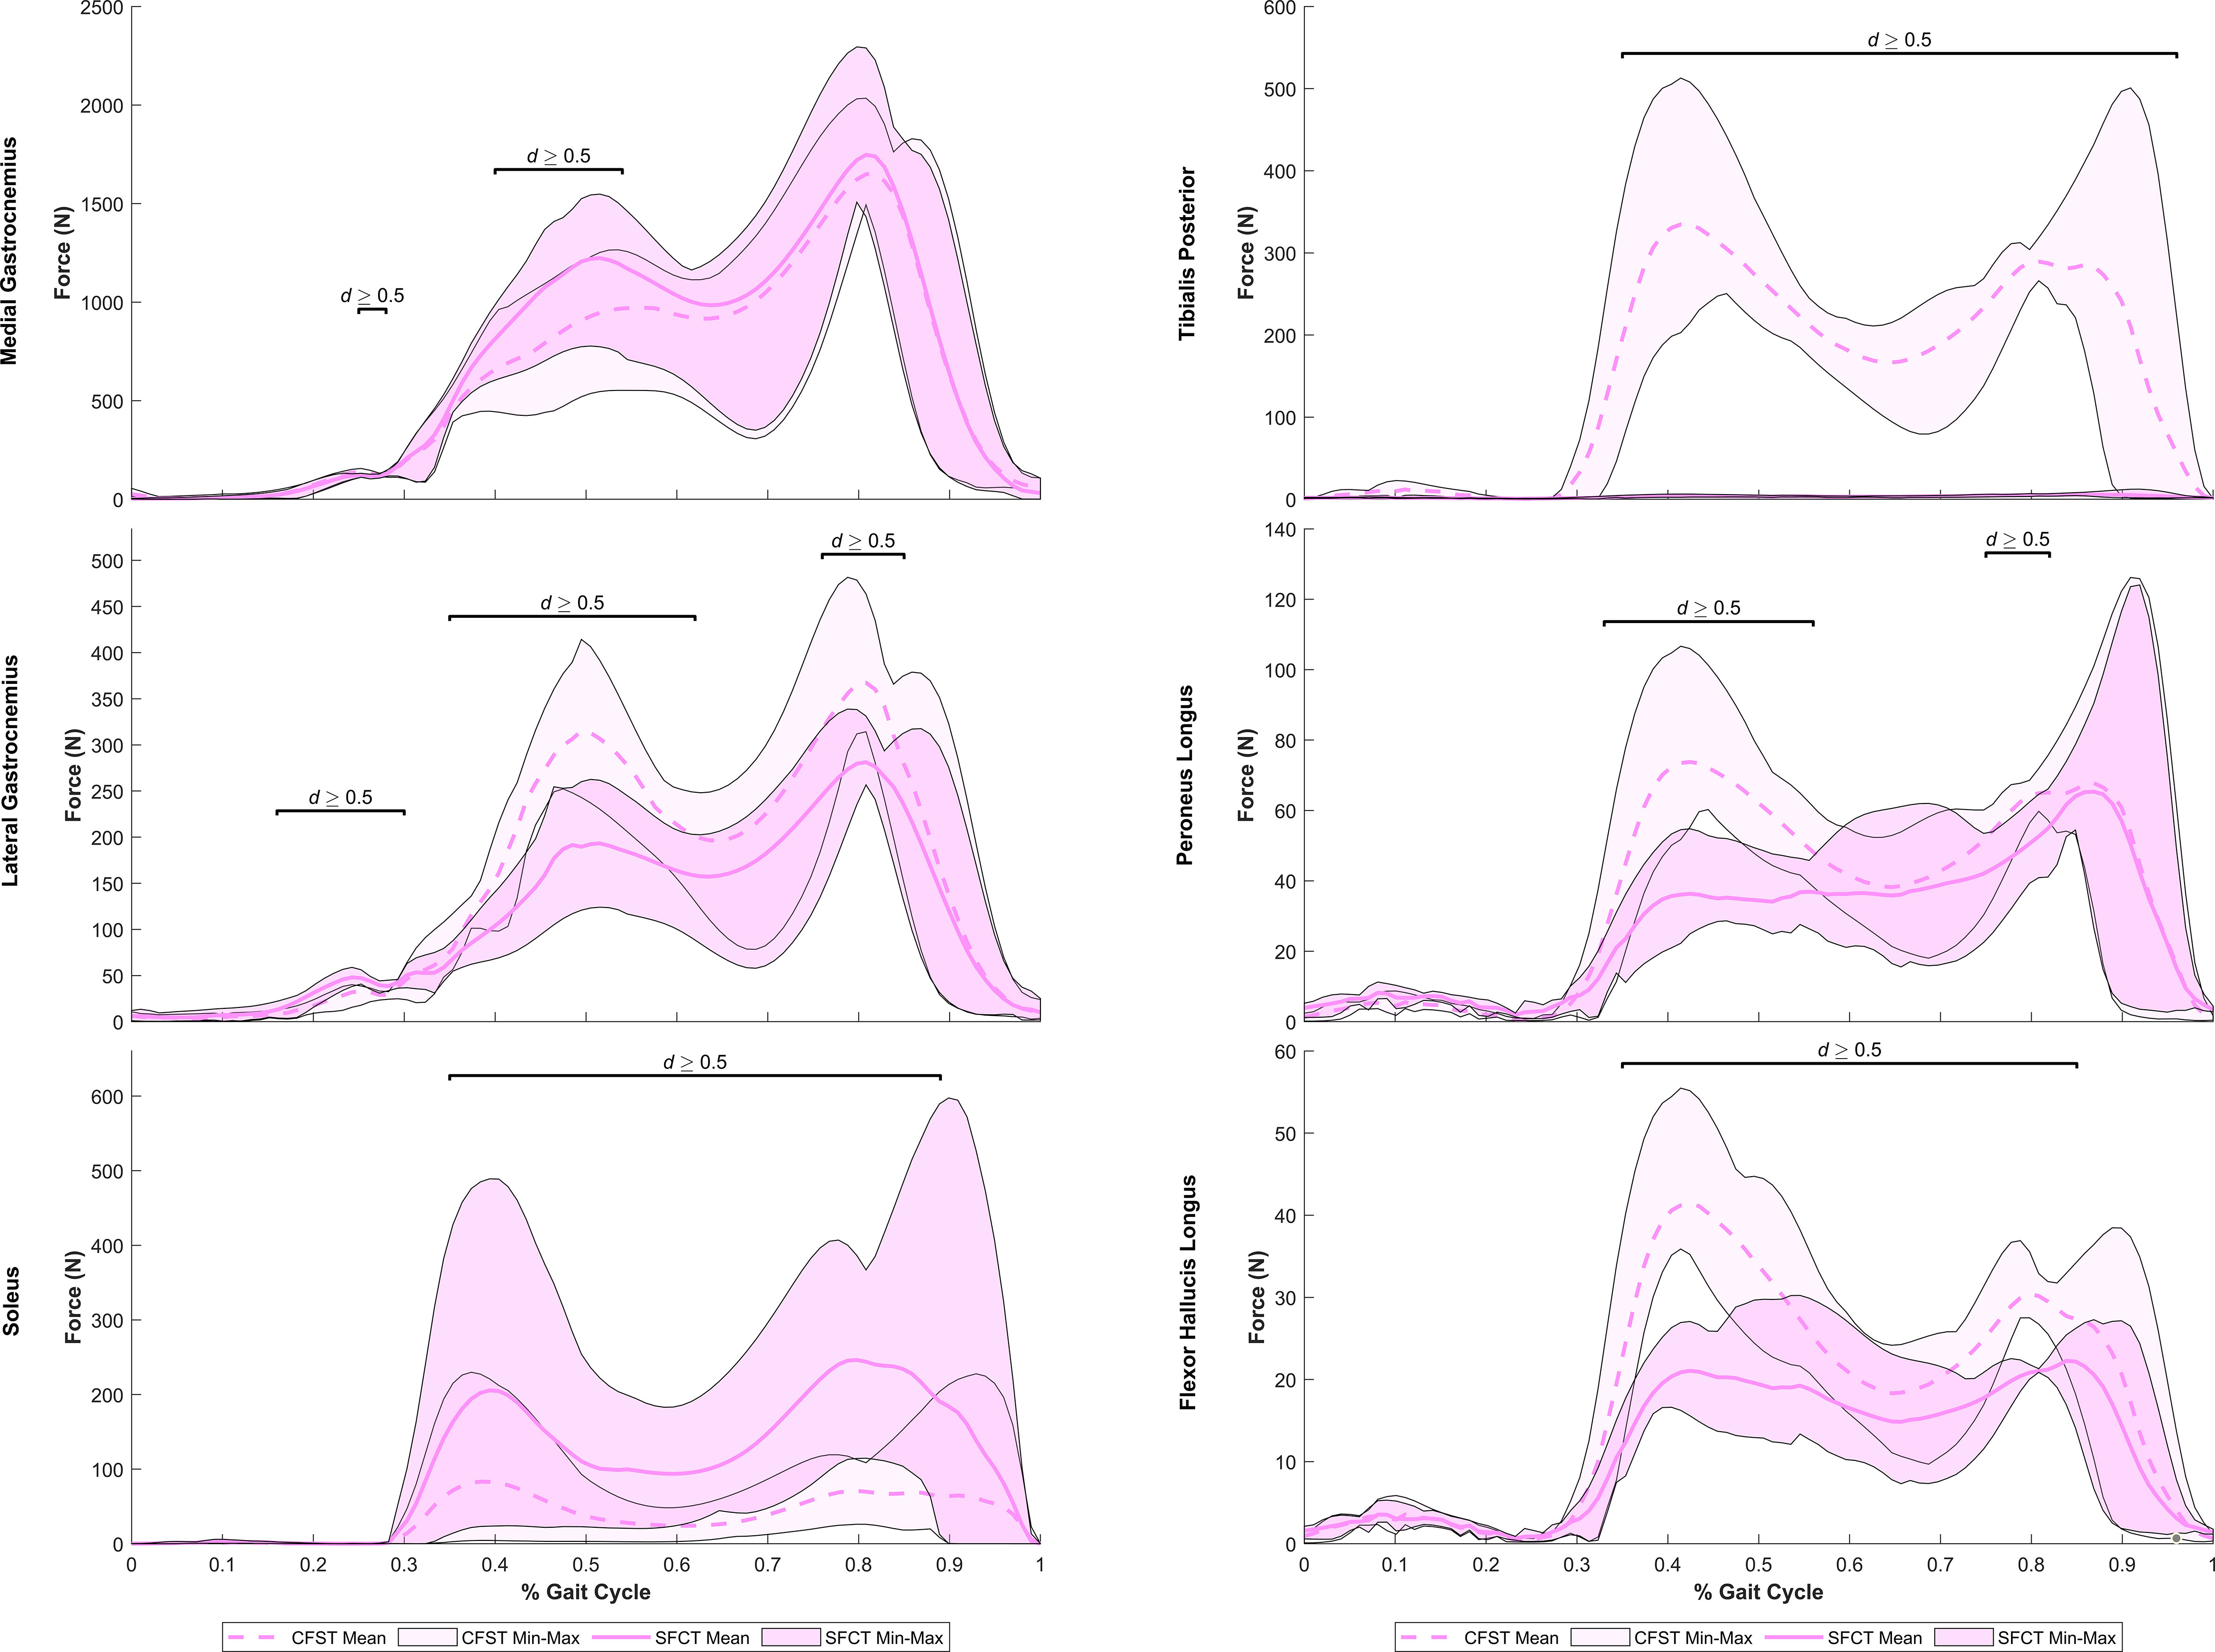
Figure 7 Mean force production (N) and range of values across the four individual gait trials by model for ankle plantarflexor muscles exhibiting large model differences. Segments of the gait in which large effect sizes between mean differences (Robust Cohen’s d) were found are denoted with a solid black line. CFST: Model CFST – Curved femur, straight tibia; SFCT: Model SFCT – Straight femur, curved tibia.
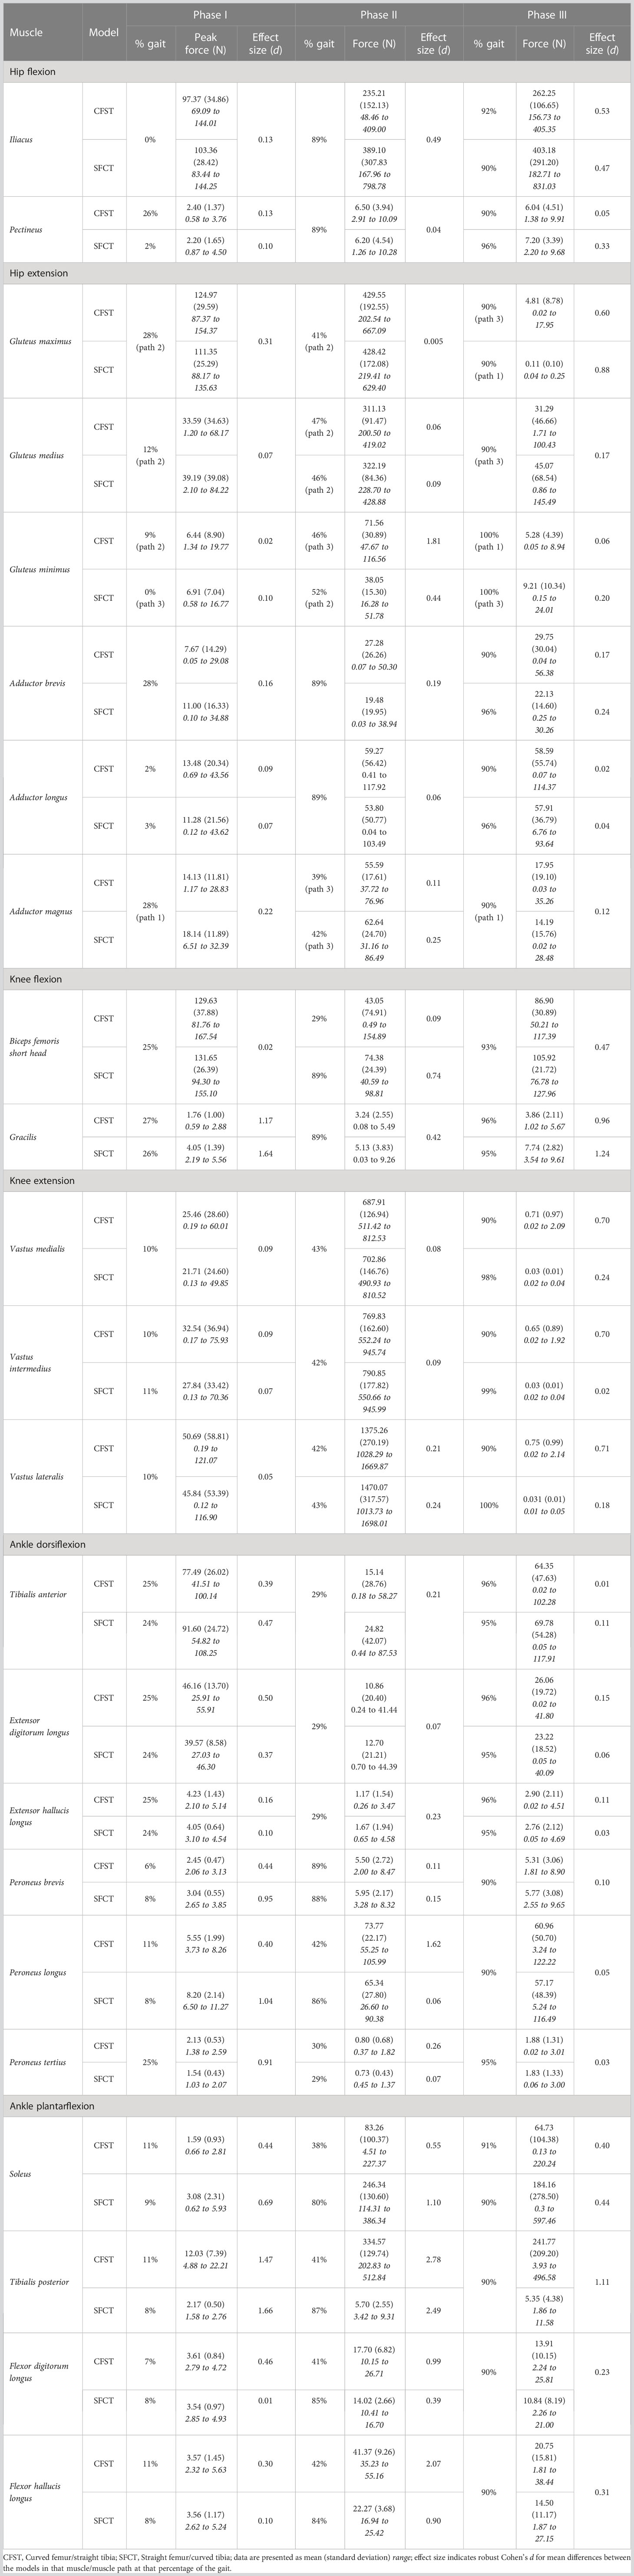
Table 4 Peak muscle force production by muscle and model: Single joint movers.
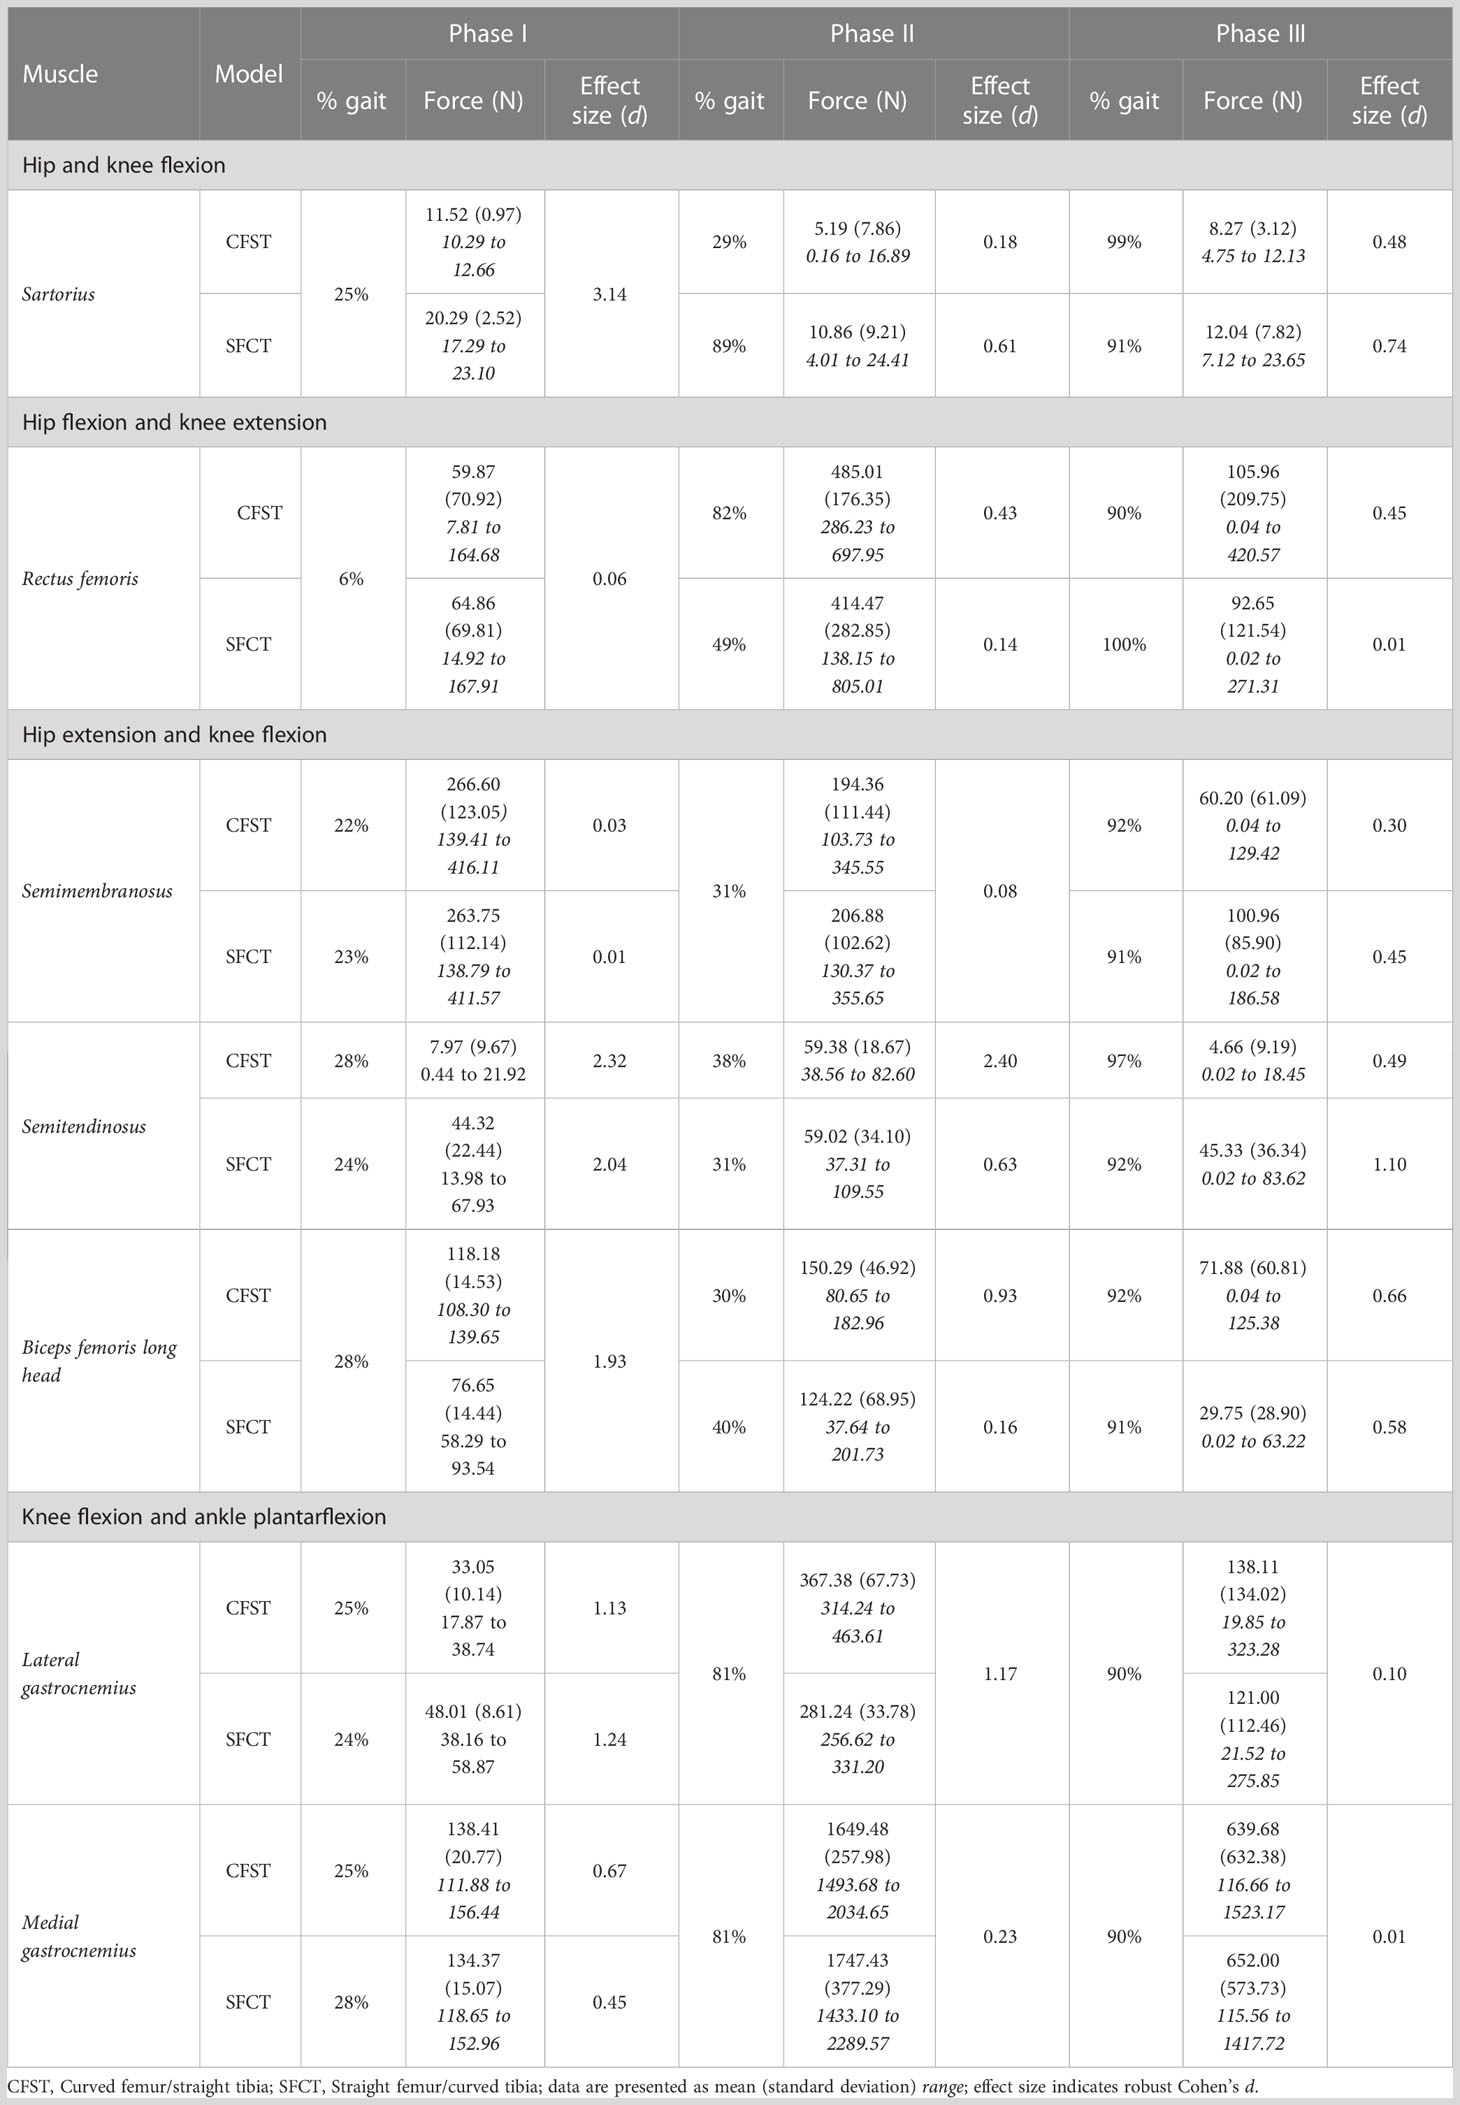
Table 5 Peak muscle force production by gait phase: Bi-articular movers.
Phase I: leg swing and plant (~0–28% of the gait cycle)
Immediately after toe-off, for ~the first 15% of the gait cycle, hip flexion was powered predominantly by iliacus and rectus femoris, knee flexion by biceps femoris short head, and ankle dorsiflexion by tibialis anterior. No major mean differences in the use of these muscles between models here were documented. The major divergence between models in muscle force production occurred between peak hip flexion (~23% of the gait) and foot plant (~28% of the gait). Just prior to foot plant, Model CFST generated 46% higher mean force with biceps femoris long head (28% of the gait, d=1.93), and 10–13% higher mean force with medial gastrocnemius (24–26% of gait, d=0.61–0.67). In contrast, Model SFCT produced 130–190% higher mean force with semitendinosus (19–28% of gait, d=1.45–3.08), and 28–59% higher mean force with lateral gastrocnemius (14–29% of gait, d=0.75–1.39). Being bi-articular movers, the activation of the gastrocnemius muscles to contribute to knee flexion in the second half of Phase I would produce an ankle plantarflexion moment. This was likely why ankle dorsiflexion stops around 16% of the gait cycle, and the ankle simply holds steady at ~20° of flexion through to foot plant at 28%, despite similar peak force production by the dorsiflexors tibialis anterior and extensors hallucis and digitorum longus in both models.
Phase II: stance phase – weight lift (~29–89% of the gait cycle)
During stair-climbing, when the foot plants on the stair and stance phase begins, external flexion moments are being applied at the hip and knee as weight shifts fully onto the right leg (Joseph and Watson, 1967; Lyons et al., 1983; Costigan et al., 2002). Across roughly the first half of the stance phase, both models countered high external hip and knee flexion moments with the gluteal muscles, biceps femoris long head, rectus femoris, vastus muscles, and medial gastrocnemius. By ~34% of the gait, powerful lifting of the CoM vertically up onto the next stair level had begun in earnest: single-joint knee and ankle flexors like biceps femoris short head and tibialis anterior ceased activity almost completely (producing<1 N), and force production by the single-joint hip and knee extensors, like gluteus maximus and the vastus muscles, and ankle plantarflexors, like soleus, increased dramatically. By 89% of the gait, the end of the stance phase, the hip and knee joints reached peak extension, and it was ankle plantarflexion that achieved the final transfer of the CoM up and over onto the left leg for its foot plant in Phase III (peak ankle plantarflexion at 98% of the gait cycle).
At the hip and knee, Model CFST consistently produced higher force from key hip and knee extensors than Model SFCT (see Figures 5, 6). For hip extension during the stance phase, Model CFST produced as much as 51% higher mean force with the distal-most line of action of gluteus medius (path 3; 36–73% of gait, d= 0.58–1.56), and as much as 153% higher mean force from the distal-most line of action of gluteus minimus (path 3: 36–84% of gait, d=0.66–3.83). For knee extension during the stance phase, Model CFST also produced as much as 123% higher mean force with rectus femoris (65–80% and 84–89% of gait, d=0.52–1.73), as much as 171% higher mean force with vastus medialis (57–73% and 81–88% of gait, d=0.52–2.04), as much as 127% higher mean force with vastus intermedius (57–71% and 82–87% of gait, d=0.52–1.49) and as much as 168% higher mean force with vastus lateralis (58–66% and 83–88% of gait, d=0.51–1.11).
At the ankle, medial gastrocnemius was the primary plantarflexor in both models, though produced as much as 30% higher mean force in Model SFCT in the first half of the stance phase (41–53% of gait, d=0.52–0.63). The remainder of ankle plantarflexion was powered in two quite distinct patterns: 1) predominantly soleus in Model SFCT, 2) predominantly lateral gastrocnemius and deep ankle plantarflexors in Model CFST (see Figure 7). First, Model SFCT produced as much as 120% higher mean force from soleus across the entire stance phase (37–88% of gait, d=0.53–1.22) than Model CFST. Second, Model CFST produced as much as 56% higher mean force from lateral gastrocnemius (36–63% and 77–84% of gait, d=0.51–1.65), as much as 68% higher mean force from peroneus longus (33–57% and 76–82% of gait, d=0.57–1.82), as much as 67% higher mean force from flexor hallucis longus (35–60% and 70–86% of gait, d=0.52–3.29), and most notably, from 183–195% higher mean force from tibialis posterior (35–89% of gait, d=1.01–12.75).
Interesting model differences also emerged during the stance phase in the recruitment of the bi-articular hip extensors and knee flexors biceps femoris long head and semitendinosus: Model CFST recruited the former primarily for knee flexion and the latter primarily for hip extension, while Model SFCT recruited them in the opposite pattern. Just prior to foot plant in Phase I, Model CFST had generated substantially more force with biceps femoris long head than Model SFCT to power the knee flexion occurring here. This continued in Phase II: in Model CFST, biceps femoris long head continued to produce 41–42% higher mean force through to its peak at 30% of the gait (d=0.93–1.19), and then tapered off as powerful hip and knee extension became more important. During this taper, it simultaneously increased its use of semitendinosus, such that from 36–55% of the gait, it was generating up to 195% higher mean force with this muscle than Model SFCT (d=1.13–5.09), before tapering its use down to virtually nothing. Model SFCT demonstrated the opposite pattern. Just prior to foot plant in Phase I, Model SFCT had generated substantially more force with semitendinosus than Model CFST to power the knee flexion occurring here, and that continued into Phase II. In Model SFCT, semitendinosus continued to produce 55–104% higher mean force until its peak at 31% of the gait (d=0.63–1.66), before tapering down as hip and knee extension became dominant.
Phase III: stance – weight shift and heel lift (~90–100% of the gait cycle)
From 90% onwards, weight was being transferred to the left leg, primarily through ankle plantarflexion, while the hip and knee began to flex in preparation for toe-off. At the ankle, Model CFST continued to produce much higher mean force with tibialis posterior through to 97% of the gait (172–191% higher, effect size 0.53–1.11). To assist with knee flexion in Phase III, several muscles demonstrated a burst of activity after having been relatively quiescent through the second half of Phase II, including biceps femoris long and short heads, and semitendinosus. These bursts differed in magnitude between the models, paralleling differences identified earlier in the gait cycle. Model CFST produced as much as 198% higher mean force with biceps femoris long head (91–100% of gait, d=0.52–1.44), while Model SFCT instead produced as much as 195% higher mean force with semitendinosus (90–96% of gait, effect size 0.84–2.07) and as much as 189% higher mean force with biceps femoris short head (86–91% of gait, d=0.68–1.24).
4 Discussion
The main purpose of this study was to develop the first computational MSk model testing the impact of opposing patterns of variation in human femoral and tibial anterior curvature on muscle kinetics during a proxy for uphill walking: stair-climbing. We tested the hypothesis that opposite patterns of variation in femoral and tibial anterior curvature would drive differences between models in typical stair-climbing muscle kinetics. General gait characteristics across the gait cycle in both models agreed well with these existing gait studies examining the kinematics, kinetics, and muscle activity of stair-climbing, both among healthy adults (Joseph and Watson, 1967; Lyons et al., 1983; Costigan et al., 2002; Riener et al., 2002) and following instrumented hip or knee joint replacement arthroplasty (Taylor et al., 1998; Bergmann et al., 2001; Heller et al., 2001b; Taylor et al., 2004). Both custom MSk models followed the general broad pattern outlined within them in terms of both joint position and muscle activation of the joint extensors/plantarflexors. However, our hypothesis was supported at key areas of the stance phase, suggesting that the distinct patterns of femoral and tibial morphology captured in our models affected the optimal solution OpenSim calculated in order to yield the experimentally-recorded stair-climbing gait kinematics and kinetics. Flipping the pattern of femoral and tibial anterior diaphyseal curvature was associated with two major effects in the leg muscles posterior to the curves: 1) reversing the timing of recruitment of bi-articular superficial hamstring muscles, and 2) eliciting differential recruitment of primary and secondary ankle plantarflexors. These effects likely reflect the impact that diaphyseal curvature can have on muscle moment arms and the relationships it has with other three-dimensional morphological variation within the limb.
4.1 Impact of opposing patterns of femoral and tibial curvature on bi-articular knee flexor moment arms
Flipping the pattern of femoral and tibial curvature was associated with a reversal in recruitment of the most superficial medial and lateral bi-articular knee flexors of the posterior thigh, semitendinosus and biceps femoris long head, respectively. The semitendinosus and biceps femoris long head share a common tendon origin at the ischial tuberosity of the pelvis (Sato et al., 2012). Semitendinosus runs down the medial aspect of the posterior thigh and inserts on the proximal medial surface of the tibia, while biceps femoris long head runs down the lateral aspect of the posterior thigh to insert on the fibular head (Timmins et al., 2020); both function to extend the hip and flex the knee. In combination with a range of other single and bi-articular knee flexors, there is thus considerable redundancy in which muscles can be utilized to ultimately extend the hip and flex the knee. When a curved femur was paired with a straight tibia during stair-climbing, semitendinosus was preferentially recruited for hip extension and biceps femoris long head for knee flexion. When the pattern of lower limb bone curvature was reversed however, and a straight femur paired with a curved tibia, the preferential use of these muscles switched to their other function: biceps femoris long head for hip extension and semitendinosus for knee flexion.
One possible explanation for this is that opposite patterns of diaphyseal curvature in the femur and tibia affected the moment arms of biceps femoris long head and semitendinosus about the knee. Pairing a curved femur with a straight tibia was associated with a much longer mean moment arm of biceps femoris long head (by as much as 15.4 mm; effect size up to 16.99) at the knee than when a straight femur was paired with a curved tibia, which instead was associated with a much longer mean moment arm of semitendinosus at the knee (by as much as 12.1 mm; effect size across the gait of 1.33 to 11.32). The moment arms of these two muscles at the hip were much more similar between models, within 1.5 mms of each other (no effect sizes > 0.50), so it likely that differences at the knee were primarily responsible for driving model differences. To power knee flexion, each model preferentially recruited the superficial hamstring muscle that was in the more optimal position (longer moment arm), and utilized the other primarily for its hip extension function.
There are also two additional bi-articular knee flexors, medial and lateral gastrocnemius, in the superficial calf compartment, which combine with the deeper soleus to form the triceps surae muscle group (Dalmau-Pastor et al., 2014). The medial and lateral heads of gastrocnemius originate on the medial and lateral femoral condyles, respectively, and travel down to join a large aponeurosis that continues on as the Achilles tendon and ultimately inserts on the calcaneus (Dalmau-Pastor et al., 2014). As such, these two muscles of the triceps surae group function both to flex the knee and plantarflex the ankle. Here, Model CFST always exhibited consistently longer mean moment arms of both gastrocnemius heads at the knee across the entire gait cycle. These differences were as much as 18.5 mm on average for the medial head (effect size 4.72 to 21.70) and as much as 13.8 mm for the lateral head (effect size up to 3.74 to 15.32). The moment arms of these two muscles at the ankle were much more similar between models, within 1.5 mm of each other, though always larger on average in Model CFST (effect sizes up to 0.97). Despite its shorter moment arms, Model SFCT still recruited medial and lateral gastrocnemius more heavily than Model CFST at key phases of Phases I and II, respectively. Other explanatory factors beyond moment arm lengths may thus be necessary to understand why.
4.2 Relationships between tibial curvature and other complex morphological variation in the distal leg
Pairing a curved femur with a straight tibia was associated with reduced soleal recruitment and an increased reliance on secondary ankle plantarflexors like peroneus longus, tibialis posterior, and flexor hallucis longus (FHL). These four muscles are primary or secondary ankle plantarflexors and have no direct function at the knee. Soleus is a multi-pennate muscle of the posterior calf and the deepest of the three muscles of the triceps surae muscle group, originating on the posterior proximal tibia and fibula before joining the same large aponeurosis as the gastrocnemius muscles, traveling inferiorly as the Achilles tendon before ultimately inserting on the posterior calcaneus (Dalmau-Pastor et al., 2014). As such, it is a primary ankle plantarflexor, while peroneus longus, tibialis posterior, and FHL are secondary ankle plantarflexors. Peroneus longus is the most superficial of the three peroneal muscles on the lateral calf, originating on the head and proximal two-thirds of the fibula and the lateral tibial condyle, traveling inferiorly before curving posteriorly around the lateral malleolus to insert on the plantar surface of the first metatarsal (Hallinan et al., 2019). Tibialis posterior and FHL are two of the three deep muscles of the posterior calf. The former originates on the posterior surfaces of the tibia, fibula, and tibiofibular interosseus membrane (Semple et al., 2009), while the latter originates primarily on the distal posterior surface of the fibular shaft, tibiofibular interosseous membrane, and fascia of the posterior tibial muscles (Sassu et al., 2010). Both travel inferiorly, curving sharply behind the medial malleolus to insert in complex multi-branched fashion on the tarsals and metatarsals (tibialis posterior) (Semple et al., 2009) and the base of the proximal phalanx of the big toe (Van De Graaf, 2002).
The reduced soleal recruitment of Model CFST and its increased reliance on secondary ankle plantarflexors like peroneus longus, tibialis posterior, and FHL were despite this model having a longer, more optimal, mean moment arm for soleus at the ankle in Phase II (61–89% of gait, effect size up to 0.99), and very similar or shorter, less optimal, moment arms for tibialis posterior and FHL at the ankle than Model SFCT. Though Model CFST did have longer mean moment arms for peroneus longus across the gait cycle, in the range of 3.7–3.8 mm longer (effect size of 2.02–10.62), overall muscle moment arms poorly explained the patterns of recruitment of ankle plantarflexors by either model. An alternative possibility as to why CFST may have had reduced soleal recruitment despite its larger moment arm and greater moment-generating capacity, requiring compensation by secondary plantarflexors, relates to a morphological feature not quantified in our models: tibial torsion. During normal walking on level ground, a large external ankle dorsiflexion moment at mid-stance is typically countered by an internal plantarflexion moment generated by the soleus muscle, and this moment at the ankle drives the knee posteriorly into extension, producing an effect known as the ‘plantar flexion knee extension couple’ (Schwartz and Lakin, 2003). However, when the tibia exhibits high levels of external torsion, with external rotation of the medial malleolus relative to the proximal tibia of beyond about 40°, the soleus does not generate an adequate internal plantarflexion moment to drive the plantar flexion-knee extension couple, and excessive knee flexion occurs (Schwartz and Lakin, 2003). Thus, tibial torsion can directly be associated with reduced soleal moment-generating capacity and indirectly with higher activation of the knee extensor muscles of the anterior thigh to counter the excess knee flexion.
We did not quantify tibial torsion in either of our custom models, however visual inspection suggests that the straighter tibia of CFST may exhibit greater external tibial torsion than SFCT, i.e. a more externally-rotated medial malleolus relative to the proximal epiphysis (see Figure 1). We can only speculate as to whether or not this difference in torsion between the models is related at all to the differences in curvature, and whether or not it is substantial enough to have reduced the effectiveness of soleus in Model CFST. However, across Phase II, Model CFST did demonstrate a pattern of low soleal recruitment, producing up to 120% less force with this muscle than Model SFCT (effect sizes up to 1.22), paired with substantially higher mean knee extensor force production, by up to 123% with rectus femoris (d up to 1.73), 171% with vastus medialis (d up to 2.04), 169% with vastus intermedius (d up to 1.49) and 168% with vastus lateralis (d up to 1.11). This pattern cannot be explained solely by muscle moment arm differences between models; though the knee extensors in Model CFST had larger mean moment arm lengths in Phase II, by as much as 9.3 mm in vastus intermedius, 5.75 mm in vastus lateralis, 7.5 mm in vastus medialis, and 7.3 mms in rectus femoris (d as high as 4.48), so too did soleus. Despite this, Model CFST never produced more than 83N of mean force with soleus across the entire gait cycle, and compensated with dramatic force production by secondary ankle plantarflexors like tibialis posterior, as high as 335 N. This is more than was produced even by the soleus of Model SFCT, and considerably more than was ever produced by the tibialis posterior of Model SFCT, which never exceeded 6N of mean force production, despite a longer, more optimal, moment arm. It is thus likely that a more complex combination of three-dimensional variation in long bone structural architecture is affecting model differences beyond simply patterns of curvature alone, though these are clearly contributing in key ways. Further research quantifying the relationship between long bone curvature and torsion in a larger sample of humans, as well as their combined impact on kinetics, will be important to expand from the current preliminary work to tease apart these more complex patterns.
It is important to note also that many of the ankle plantarflexors that exhibited model differences in the current study are strongly associated with the fibular head, large portions of its diaphysis, and/or the interosseous membrane between it and the neighboring tibia. However, no scans existed of the fibulae of the two individuals used to construct the custom MSk models. As a result, we do not know the extent to which variation in fibular curvature might be contributing to observed differences in muscle kinetics in the current study. The little evidence that exists of inter- and intra-individual variation in fibular curvature among and between humans (Hagihara, 2023; Tümer et al., 2019) suggests at least some influence of environmental or developmental factors on its development, but virtually nothing is yet known about fibular morphology in relation to tibial curvature, or its impacts on muscle kinetics.
5 Conclusion
In quantifying the impact of individual variation in anterior limb bone curvature in a musculoskeletal analysis for the first time, we demonstrated a previously-unknown relationship between opposing patterns of femoral and tibial diaphyseal curvature and dynamic muscle recruitment solutions to achieving the same gait pattern during stair-climbing. This is an important first step not just in better understanding the biomechanical impact of individual anatomical variation in diaphyseal curvature on locomotion in steep terrain, but also contributes more broadly to addressing some of the challenges that anatomical variation poses to inferring function from skeletal structure. Distinct curvatures between Neanderthals and modern humans may well have posed different problems in achieving bipedal locomotion in steep terrain. However, the importance of redundancy in the musculoskeletal system was clear, enabling different solutions to perform the same function by structurally different bones. The implications of such variability in the relationship between structure and function has become increasingly recognized in biological anthropology and in evolutionary biomechanics more specifically (Holowka et al., 2022; McClymont et al., 2022; Murray, 2022; Wallace et al., 2022). MSk modeling has been a crucial tool in highlighting this, as it enables the incorporation of various sources of individual morphological variation to better understand their impact on function (Sylvester et al., 2021). MSk models have already been employed in orthopedic biomechanics to investigate the impact of variation in joint characteristics like retro/anteversion of the proximal femur or tibial plateau on the performance of prosthetic hips and knees in patients following arthroplasty (Heller et al., 2001a; Okamoto et al., 2015), so clearly have potential for incorporating more diverse and complex morphological variation. The current study adds to our understanding of the impact of variation in femoral and tibial curvature on muscle kinetics during a proxy for locomotion in steep terrain, and provides support for the need for more extensive MSk modeling to better understand the relationships between diaphyseal curvature among bones within a limb, the relationships between curvature and other complex traits, and the combined effect of this variation on kinematics and kinetics during bipedal locomotion. However, the current study design can neither determine what the most optimal kinematics or muscle activation for the morphology of Models CFST or SFCT would be, nor whether one morphology is clearly optimal relative to the other when walking in a given set of conditions. To do so, predictive modeling would be required, for example with the minimization of energetic cost during uphill locomotion without any constraints being placed on kinematics. Predictive modeling is a challenge in biological anthropology as the required inputs, like accurate morphology, are often incomplete or missing altogether. MSk models are highly sensitive to the accuracy of the inputs (Broyde et al., 1945; Valente et al., 2014; Martelli et al., 2015; Synek et al., 2019; Kramer et al., 2022), so future work improving methods of estimating missing morphology, muscle characteristics, and gait parameters will be highly beneficial in supporting the use of MSk modeling to better understand the influence of morphological variation on locomotor biomechanics among fossil hominins or fragmentary human remains.
Data availability statement
The raw data supporting the conclusions of this article will be made available by the authors, without undue reservation.
Ethics statement
The collection of experimental gait data from human participants was reviewed and approved by the University of Tennessee Institutional Review Board. All participants in the study provided written informed consent prior to data collection. Ethics approval for the use of anonymized, previously-collected human data for this research was obtained from the University of Victoria Human Research Ethics Board.
Author contributions
AM and JG contributed to the conception and design of the study. MM and TC built the musculoskeletal models, ran the simulations, and produced the results. AM and JG wrote sections of the manuscript. All authors contributed to manuscript revision, and all read and approved the submitted version.
Funding
This research was financially supported by an NSERC Discovery Grant (AM; award no. RGPIN-2021-02442), a University of Victoria Internal Research/Creative Project Grant (AM and JG), a Work Integrated Digital Learning Subsidy (AM; award no. PO14659), and a Michael Smith Health Research British Columbia Scholar Award (JG; award no. SCH-2021-1562).
Acknowledgments
The authors would like to thank Dr. Songning Zhang as well as his co-authors for granting access to the stair-climbing experimental gait data that were used in the current study, and Hooman Shirzadi for his assistance with student training. Thank you also to three reviewers, whose comments greatly improved this manuscript.
Conflict of interest
The authors declare that the research was conducted in the absence of any commercial or financial relationships that could be construed as a potential conflict of interest.
Publisher’s note
All claims expressed in this article are solely those of the authors and do not necessarily represent those of their affiliated organizations, or those of the publisher, the editors and the reviewers. Any product that may be evaluated in this article, or claim that may be made by its manufacturer, is not guaranteed or endorsed by the publisher.
Supplementary material
The Supplementary Material for this article can be found online at: https://www.frontiersin.org/articles/10.3389/fevo.2023.1220567/full#supplementary-material
References
Alexander N., Schwameder H. (2016a). Effect of sloped walking on lower limb muscle forces. Gait Posture 47, 62–67. doi: 10.1016/j.gaitpost.2016.03.022
Alexander N., Schwameder H. (2016b). Lower limb joint forces during walking on the level and slopes at different inclinations. Gait Posture 45, 137–142. doi: 10.1016/j.gaitpost.2016.01.022
Algina J., Keselman H., Penfield R. (2005). An alternative to Cohen’s standardized mean difference effect size: A robust parameter and confidence interval in the two independent groups case. Psychol. Methods 10 (3), 317–328. doi: 10.1037/1082-989X.10.3.317
Andriacchi T. P., Andersson G. B., Fermier R. W., Stern D., Galante J. O. (1980). A study of lower-limb mechanics during stair-climbing. J. Bone Jt. Surg. 62, 749–757. doi: 10.2106/00004623-198062050-00008
Anthony R., Rivet P. (1907). Contribution à l’étude descriptive et morphologique de la diaphyse fémorale chez l’homme et les anthropoides. Ann. Des. Sci. Nat. - Zool Biol. Anim. 6, 1–221.
Arnold A. S., Salinas S., Hakawa D. J., Delp S. L. (2000). Accuracy of muscle moment arms estimated from MRI-based musculoskeletal models of the lower extremity. Comput. Aided Surg. 5 (2), 108–119. doi: 10.3109/10929080009148877
Bergmann G., Bergmann G., Deuretzabacher G., Deuretzabacher G., Heller M., Heller M., et al. (2001). Hip forces and gait patterns from routine activities. J. Biomech. 34, 859–871. doi: 10.1016/S0021-9290(01)00040-9
Bertram J. E. A., Biewener A. A. (1988). Bone curvature: Sacrificing strength for load predictability? J. Theor. Biol. 131 (1), 75–92. doi: 10.1016/S0022-5193(88)80122-X
Bertram J. E. A., Biewener A. A. (1992). Allometry and curvature in the long bones of quadrupedal mammals. J. Zool. 226 (3), 455–467. doi: 10.1111/j.1469-7998.1992.tb07492.x
Biewener A. A., Taylor C. R. (1986). Bone strain: A determinant of gait and speed? J. Exp. Biol. 123, 383–400. doi: 10.1242/jeb.123.1.383
Biewener A., Thomason J., Lanyon L. (1983). Mechanics of locomotion and jumping in the forelimb of the horse (Equus): in vivo stress developed in the radius and metacarpus. J. Zool L. 201, 67–82. doi: 10.1111/j.1469-7998.1983.tb04261.x
Biewener A. A., Thomason J. J., Lanyon L. E. (1988). Mechanics of locomotion and jumping in the horse (Equus): in vivo stress in the tibia and metatarsus. J. Zool. 214 (3), 547–565. doi: 10.1111/j.1469-7998.1988.tb03759.x
Broyde S., Dempsey M., Wang L., Cox P. G., Fagan M., Bates K. T. (1945). Evolutionary biomechanics: Hard tissues and soft evidence? Proc. R Soc. B Biol. Sci. 2021, 288. doi: 10.1098/rspb.2020.2809
Brzobohatá H., Krajíček V., Velemínský P., Velemínská J. (2019). Three-dimensional geometry of human tibial anterior curvature in chronologically distinct population samples of Central Europeans (2900 BC – 21 st century AD). Sci. Rep. 9 (1), 1–15. doi: 10.1038/s41598-019-40625-3
Burr D. B., Milgrom C., Fyhrie D., Forwood M., Nyska M., Finestone A., et al. (1996). In vivo measurement of human tibial strains during vigorous activity. Bone 18 (5), 405–410. doi: 10.1016/8756-3282(96)00028-2
Carlson K. J., Grine F. E., Pearson O. M. (2007). Robusticity and sexual dimorphism in the postcranium of modern hunter-gatherers from Australia. Am. J. Phys. Anthropol. 134, 9–23. doi: 10.1002/ajpa.20617
Chapman T., Moiseev F., Sholukha V., Louryan S., Rooze M., Semal P., et al. (2010). Virtual reconstruction of the Neandertal lower limbs with an estimation of hamstring muscle moment arms. Comptes Rendus - Palevol. 9 (6–7), 445–454. doi: 10.1016/j.crpv.2010.07.011
Chapman T., Sholukha V., Semal P., Louryan S., Rooze M., Van Sint Jan S. (2015). Femoral curvature variability in modern humans using three-dimensional quadric surface fitting. Surg. Radiol. Anat. 37 (10), 1169–1177. doi: 10.1007/s00276-015-1495-7
Chapman T., Sholukha V., Semal P., Louryan S., Van Sint Jan S. (2018). Further consideration of the curvature of the Neandertal Femur. Am. J. Phys. Anthropol. 165 (1), 94–107. doi: 10.1002/ajpa.23334
Costigan P. A., Deluzio K. J., Wyss U. P. (2002). Knee and hip kinetics during normal stair climbing. Gait Posture 16 (1), 31–37. doi: 10.1016/S0966-6362(01)00201-6
Dalmau-Pastor M., Fargues-Polo B., Casanova-Martínez D., Vega J., Golanó P. (2014). Anatomy of the triceps surae: A pictorial essay. Foot Ankle Clin. 19 (4), 603–635. doi: 10.1016/j.fcl.2014.08.002
Davies T. G. (2012). Cross-sectional variation in the human femur and tibia: the influence of physique and habitual mobility on diaphiseal morphology (Cambridge, UK: University of Cambridge).
Davies T. G., Shaw C. N., Stock J. T. (2012). A test of a new method and software for the rapid estimation of cross-sectional geometric properties of long bone diaphyses from 3D laser surface scans. Archaeol. Anthropol. Sci. 4, 277–290. doi: 10.1007/s12520-012-0101-8
De Groote I. (2008). A Comprehensive Analysis of Long Bone Curvature in Neanderthals and Modern Humans Using 3D morphometrics (London, UK: University College London).
De Groote I. (2011). Femoral curvature in Neanderthals and modern humans: A 3D geometric morphometric analysis. J. Hum. Evol. 60 (5), 540–548. doi: 10.1016/j.jhevol.2010.09.009
Delp S. L., Anderson F. C., Arnold A. S., Loan P., Habib A., John C. T., et al. (2007). OpenSim: Open-source software to create and analyze dynamic simulations of movement. IEEE Trans. BioMed. Eng. 54 (11), 1940–1950. doi: 10.1109/TBME.2007.901024
Gruss L. T., Gruss R., Schmitt D. (2017). Pelvic breadth and locomotor kinematics in human evolution. Anat. Rec. 300 (4), 739–751. doi: 10.1002/ar.23550
Gruss L. T., Schmitt D. (2004). “Bipedalism in Homo ergaster: An experimental study of the effects of tibial proportions on locomotor biomechanics,” in From Biped to Strider: The Emergence of Modern Human Walking, Running, and Resource Transport. Eds. Meldrum D. J., Hilton C. E. (New York, NY: Kluwer Academic/Plenum Publishers), 117–134.
Hagihara Y. (2023). Fibular diaphyseal curvature of the Jomon population. Anat. Sci. Int. 2023, 1–10. doi: 10.1007/s12565-023-00722-w
Hall B. K., Herring S. W. (1990). Paralysis and growth of the musculoskeletal system in the embryonic chick. J. Morphol. 206 (1), 45–56. doi: 10.1002/jmor.1052060105
Hallinan J. T. P. D., Wang W., Pathria M. N., Smitaman E., Huang B. K. (2019). The peroneus longus muscle and tendon: a review of its anatomy and pathology. Skeletal Radiol. 48 (9), 1329–1344. doi: 10.1007/s00256-019-3168-9
Heller M. O., Bergmann G., Deuretzbacher G., Claes L., Haas N. P., Duda G. N. (2001a). Influence of femoral anteversion on proximal femoral loading: Measurement and simulation in four patients. Clin. Biomech. 16 (8), 644–649. doi: 10.1016/S0268-0033(01)00053-5
Heller M. O., Bergmann G., Deuretzbacher G., Dürselen L., Pohl M., Claes L., et al. (2001b). Musculo-skeletal loading conditions at the hip during walking and stair climbing. J. Biomech. 34 (7), 883–893. doi: 10.1016/S0021-9290(01)00039-2
Henry D. O., Belmaker M., Bergin S. M. (2017). The effect of terrain on Neanderthal ecology in the Levant. Quat Int. 435, 94–105. doi: 10.1016/j.quaint.2015.10.023
Higgins R. W. (2014). “The effects of terrain on long bone robusticity and cross-sectional shape in lower limb bones of bovids, Neandertals, and Upper Paleolithic modern humans,” in Reconstructing Mobility: Environmental, Behavioral, and Morphological Determinants. Eds. Karlson C., Marchi D. (New York, NY: Springer), 227–252.
Higgins R. W., Ruff C. B. (2011). The effects of distal limb segment shortening on locomotor efficiency in sloped terrain: Implications for Neandertal locomotor behavior. Am. J. Phys. Anthropol. 146 (3), 336–345. doi: 10.1002/ajpa.21575
Holowka N. B., Kraft T. S., Wallace I. J., Gurven M., Venkataraman V. V. (2022). Forest terrains influence walking kinematics among indigenous Tsimane of the Bolivian Amazon. Evol. Hum. Sci. 4, e19. doi: 10.1017/ehs.2022.13
Holt B., Whittey E. (2019). The impact of terrain on lower limb bone structure. Am. J. Phys. Anthropol. 168 (4), 729–743. doi: 10.1002/ajpa.23790
Jade S., Tamvada K. H., Strait D. S., Grosse I. R. (2014). Finite element analysis of a femur to deconstruct the paradox of bone curvature. J. Theor. Biol. 341, 53–63. doi: 10.1016/j.jtbi.2013.09.012
Joseph J., Watson R. (1967). Telemetering electromyography of muscles used in walking up and down stairs. J. Bone Jt Surg. 49 (4), 774–780. doi: 10.1302/0301-620X.49B4.774
Jungers W. L., Godfrey L. R., Simons E. L., Chatrath P. S. (1997). Phalangeal curvature and positional behavior in extinct sloth lemurs (Primates, Palaeopropithecidae). Proc. Natl. Acad. Sci. U. S. A. 94 (22), 11998–12001. doi: 10.1073/pnas.94.22.11998
Kontulainen S. A., Hughes J. M., Macdonald H. M., Johnston J. D. (2007). “The biomechanical basis of bone strength development during growth,” in Optimizing Bone Mass and Strength The Role of Physical Activity and Nutrition During Growth. Eds. Daly R., Petit M. (Basel: Karger), 13–32.
Kramer P., Feuerriegel E., Lautzenheiser S., Sylvester A. (2022). Sensitivity of musculoskeletal models to variation in muscle architecture parameters. Evol. Hum. Sci. 4, e6. doi: 10.1017/ehs.2022.6
Kuo A. D. (1998). A least-squares estimation approach to improving the precision of inverse dynamics computations. J. Biomech. Eng. 120 (1), 148–159. doi: 10.1115/1.2834295
Lanyon L. E. (1980). The influence of function on the development of bone curvature. Exp. study rat tibia. J. Zool. 192 (4), 457–466. doi: 10.1111/j.1469-7998.1980.tb04243.x
Lanyon L. E., Baggott D. G. (1976). Mechanical function as an influence on the structure and form of bone. J. Bone Jt. Surg. - Ser. B. 58 (4), 436–443. doi: 10.1302/0301-620X.58B4.1018029
Law N. H., Li J. X., Law N. Y., Varin D., Lamontagne M. (2021). Effects of body mass and sex on kinematics and kinetics of the lower extremity during stair ascent and descent in older adults. Sport Med. Heal Sci. 3 (3), 165–170. doi: 10.1016/j.smhs.2021.06.001
López-García J. M., Blain H. A., Fagoaga A., Bandera C. S., Sanz M., Daura J. (2022). Environment and climate during the Neanderthal-AMH presence in the Garraf Massif mountain range (northeastern Iberia) from the late Middle Pleistocene to Late Pleistocene inferred from small-vertebrate assemblages. Quat Sci. Rev. 288, 107595. doi: 10.1016/j.quascirev.2022.107595
Lyons K., Perry J., Gronley J. K., Barnes L., Antonelli D. (1983). Timing and relative intensity of hip extensor and abductor muscle action during level and stair ambulation: An EMG study. Phys. Ther. 63, 1597–1605. doi: 10.1093/ptj/63.10.1597
Macintosh A., Davies T., Pinhasi R., Stock J. (2015). Declining tibial curvature parallels ∼6150 years of decreasing mobility in Central European agriculturalists. Am. J. Phys. Anthropol. 157 (2), 260–275. doi: 10.1002/ajpa.22710
Macintosh A., Davies T., Ryan T., Shaw C., Stock J. (2013). Periosteal versus true cross-sectional geometry: A comparison along humeral, femoral, and tibial diaphyses. Am. J. Phys. Anthropol. 150 (3), 442–452. doi: 10.1002/ajpa.22218
Macintosh A., Pinhasi R., Stock J. (2014). Lower limb skeletal biomechanics track long-term decline in mobility across ∼6150 years of agriculture in Central Europe. J. Archaeol. Sci. 52, 376–390. doi: 10.1016/j.jas.2014.09.001
Macintosh A., Stock J. (2019). Intensive terrestrial or marine locomotor strategies are associated with inter- and intra-limb bone functional adaptation in living female athletes. Am. J. Phys. Anthropol. 168 (3), 566–581. doi: 10.1002/ajpa.23773
Martelli S., Valente G., Viceconti M., Taddei F. (2015). Sensitivity of a subject-specific musculoskeletal model to the uncertainties on the joint axes location. Comput. Methods Biomech. Biomed. Eng. 18 (4), 1555–1563. doi: 10.1080/10255842.2014.930134
McClymont J., Davids K., Crompton R. H. (2022). Variation, mosaicism and degeneracy in the hominin foot. Evol. Hum. Sci. 4, 1–19. doi: 10.1017/ehs.2021.50
McIntosh A. S., Beatty K. T., Dwan L. N., Vickers D. R. (2006). Gait dynamics on an inclined walkway. J. Biomech. 39 (13), 2491–2502. doi: 10.1016/j.jbiomech.2005.07.025
Mednikova M. B., Shunkov M. V., Markin S. V. (2017). Robusticity of hand phalanges: Relevance to the origin of the altai Neanderthals. Archaeol. Ethnol. Anthropol. Eurasia 45 (3), 126–135. doi: 10.17746/1563-0110.2017.45.3.126-135
Morrison J. B. (1969). Function of the knee joint in various activities. BioMed. Eng. (NY) 4, 573–580.
Murray A. A. (2022). Variability and the form-function framework in evolutionary biomechanics and human locomotion. Evol. Hum. Sci. 4, 1–23. doi: 10.1017/ehs.2022.28
Niinimäki S., Narra N., Härkönen L., Abe S., Nikander R., Hyttinen J., et al. (2017). The relationship between loading history and proximal femoral diaphysis cross-sectional geometry. Am. J. Hum. Biol. 29 (4), e22965. doi: 10.1002/ajhb.22965
Okamoto S., Mizu-uchi H., Okazaki K., Hamai S., Nakahara H., Iwamoto Y. (2015). Effect of tibial posterior slope on knee kinematics, quadriceps force, and patellofemoral contact force after posterior-stabilized total knee arthroplasty. J. Arthroplasty 30 (8), 1439–1443. doi: 10.1016/j.arth.2015.02.042
Polk J. D. (2004). Influences of limb proportions and body size on locomotor kinematics in terrestrial primates and fossil hominins. J. Hum. Evol. 47 (4), 237–252. doi: 10.1016/j.jhevol.2004.07.003
Pomeroy E., Bennett P., Hunt C. O., Reynolds T., Farr L., Frouin M., et al. (2020). New Neanderthal remains associated with the ‘flower burial’ at Shanidar Cave. Antiquity 94 (373), 11–26. doi: 10.15184/aqy.2019.207
Raabe M. E., Chaudhari A. M. W. (2016). An investigation of jogging biomechanics using the full-body lumbar spine model: Model development and validation. J. Biomech. 49 (7), 1238–1243. doi: 10.1016/j.jbiomech.2016.02.046
Rasnick R., Standifird T., Reinbolt J. A., Cates H. E., Zhang S. (2016). Knee joint loads and surrounding muscle forces during stair ascent in patients with total knee replacement. PloS One 11 (6), 1–14. doi: 10.1371/journal.pone.0156282
Riener R., Rabuffetti M., Frigo C. (2002). Stair ascent and descent at different inclinations. Gait Posture 15, 32–44. doi: 10.1016/S0966-6362(01)00162-X
Rubin C. T. (1984). Skeletal strain and the functional significance of bone architecture. Calcif. Tissue Int. 36 (1 Supplement), 11–18. doi: 10.1007/BF02406128
Rubin C. T., Lanyon L. E. (1982). Limb mechanics as a function of speed and gait: a study of functional strains in the radius and tibia of horse and dog. J. Exp. Biol. 101, 187–211. doi: 10.1242/jeb.101.1.187
Rudaya N., Vasiliev S., Viola B., Talamo S., Markin S. (2017). Palaeoenvironments during the period of the Neanderthals settlement in Chagyrskaya cave (Altai Mountains, Russia). Palaeogeogr. Palaeoclimatol. Palaeoecol. 467, 265–276. doi: 10.1016/j.palaeo.2015.12.007
Ruff C. (1999). “Skeletal structure and behavioral patterns of prehistoric Great Basin populations,” in Understanding prehistoric lifeways in the Great Basin Wetlands: Bioarchaeological reconstruction and interpretation (Salt Lake City, Utah: University of Utah Press).
Ruff C. B., Holt B. M., Niskanen M., Sladék V., Berner M., Garofalo E., et al. (2012). Stature and body mass estimation from skeletal remains in the European Holocene. Am. J. Phys. Anthropol. 148, 601–617. doi: 10.1002/ajpa.22087
Ruff C., Holt B., Niskanen M., Sladek V., Berner M., Garofalo E., et al. (2015). Gradual decline in mobility with the adoption of food production in Europe. Proc. Natl. Acad. Sci. 112, 7147–7152. doi: 10.1073/pnas.1502932112
Ruff C. B., Trinkaus E., Holliday T. W. (1997). Body mass and encephalization in Pleistocene Homo. Nature 387, 173–176. doi: 10.1038/387173a0
Ruff C. B., Trinkaus E., Walker A. (1993). Postcranial robusticity in homo. I: temporal trends and mechanical interpretation. Am. J. Phys. Anthropol. 53, 21–53. doi: 10.1002/ajpa.1330910103
Sassu P., Acland R. D., Salgado C. J., Mardini S., Ozyurekoglu T. (2010). Anatomy and vascularization of the flexor hallucis longus muscle and its implication in free fibula flap transfer. Ann. Plast. Surg. 64 (2), 233–237. doi: 10.1097/SAP.0b013e3181a2c772
Sato K., Nimura A., Yamaguchi K., Akita K. (2012). Anatomical study of the proximal origin of hamstring muscles. J. Orthop. Sci. 17 (5), 614–618. doi: 10.1007/s00776-012-0243-7
Schwartz M., Lakin G. (2003). The effect of tibial torsion on the dynamic function of the soleus during gait. Gait Posture 17 (2), 113–118. doi: 10.1016/S0966-6362(02)00058-9
Semple R., Murley G. S., Woodburn J., Turner D. E. (2009). Tibialis posterior in health and disease: A review of structure and function with specific reference to electromyographic studies. J. Foot Ankle Res. 2, 24. doi: 10.1186/1757-1146-2-24
Shackelford L. L., Trinkaus E. (2002). Late Pleistocene human femoral diaphyseal curvature. Am. J. Phys. Anthropol. 118 (4), 359–370. doi: 10.1002/ajpa.10093
Sheehan K. J., Gormley J. (2013). The influence of excess body mass on adult gait. Clin. Biomech. 28 (3), 337–343. doi: 10.1016/j.clinbiomech.2013.01.007
Sparacello V. S., Pearson O. M., Peterson T. R. (2008). Untangling the effects of terrain and mobility on the cross-sectional geometry of the femur and tibia. Am. J. Phys. Anthropol. S46, 199. doi: 10.1002/ajpa.20806
Swartz S. M. (1990). Curvature of the forelimb bones of anthropoid primates: Overall allometric patterns and specializations in suspensory species. Am. J. Phys. Anthropol. 83 (4), 477–498. doi: 10.1002/ajpa.1330830409
Sylvester A. D., Lautzenheiser S. G., Kramer P. A. (2021). A review of musculoskeletal modelling of human locomotion. Interface Focus 11 (5), 2020060. doi: 10.1098/rsfs.2020.0060
Synek A., Lu S. C., Vereecke E. E., Nauwelaerts S., Kivell T. L., Pahr D. H. (2019). Musculoskeletal models of a human and bonobo finger: Parameter identification and comparison to in vitro experiments. PeerJ 2019 (8), 1–24. doi: 10.7717/peerj.7470
Taylor W. R., Heller M. O., Bergmann G., Duda G. N. (2004). Tibio-femoral loading during human gait and stair climbing. J. Orthop. Res. 22 (3), 625–632. doi: 10.1016/j.orthres.2003.09.003
Taylor S. J. G., Walker P. S., Perry J. S., Cannon S. R., Woledge R. (1998). The forces in the distal femur and the knee during walking and other activities measured by telemetry. J. Arthroplasty 13 (4), 428–437. doi: 10.1016/S0883-5403(98)90009-2
Timmins R., Woodley S., Shield A., Opar D. (2020). “Anatomy of the hamstrings,” in Prevention and Rehabilitation of Hamstring Injuries. Eds. Thorborg K., Opar D. (Cham, Switzerland: Springer Nature Switzerland AG), 1–30.
Tümer N., Arbabi V., Gielis W. P., de Jong P. A., Weinans H., Tuijthof G. J. M., et al. (2019). Three-dimensional analysis of shape variations and symmetry of the fibula, tibia, calcaneus and talus. J. Anat. 234 (1), 132–144. doi: 10.1111/joa.12900
Valente G., Pitto L., Testi D., Seth A., Delp S. L., Stagni R., et al. (2014). Are subject-specific musculoskeletal models robust to the uncertainties in parameter identification? PloS One 9 (11), e112625. doi: 10.1371/journal.pone.0112625
Voloshina A. S., Ferris D. P. (2015). Biomechanics and energetics of running on uneven terrain. J. Exp. Biol. 218 (5), 711–719. doi: 10.1242/jeb.106518
Voloshina A. S., Kuo A. D., Daley M. A., Ferris D. P. (2013). Biomechanics and energetics of walking on uneven terrain. J. Exp. Biol. 216 (21), 3963–3970. doi: 10.1242/jeb.081711
Wallace I. J., Kraft T. S., Venkataraman V. V., Davis H. E., Holowka N. B., Harris A. R., et al. (2022). Cultural variation in running techniques among non-industrial societies. Evol. Hum. Sci. 4, e14. doi: 10.1017/ehs.2022.12
Wall-Scheffler C. M. (2012). Size and shape: morphology’s impact on human speed and mobility. J. Anthropol. 2012, 1–9. doi: 10.1155/2012/340493
Weatherholt A. M., Warden S. J. (2016). Tibial bone strength is enhanced in the jump leg of collegiate-level jumping athletes: A within-subject controlled cross-sectional study. Calcif. Tissue Int. 98 (2), 129–139. doi: 10.1007/s00223-015-0078-2
Wu G., Siegler S., Allard P., Kirtley C., Leardini A., Rosenbaum D., et al. (2002). ISB recommendation on definitions of joint coordinate system of various joints for the reporting of human joint motion—Part I: Ankle, hip, and spine. J. Biomech. 35, 543–548. doi: 10.1016/S0021-9290(01)00222-6
Keywords: curvature, biomechanics, musculoskeletal modeling, stair-climbing, gait simulation, femur, tibia
Citation: Murray AA, MacKinnon M, Carswell TMR and Giles JW (2023) Anterior diaphyseal curvature of the femur and tibia has biomechanical consequences during unloaded uphill locomotion. Front. Ecol. Evol. 11:1220567. doi: 10.3389/fevo.2023.1220567
Received: 10 May 2023; Accepted: 17 July 2023;
Published: 01 August 2023.
Edited by:
Nicholas Baird Holowka, University at Buffalo, United StatesReviewed by:
Laura Gruss, Radford University, United StatesAdam Foster, Campbell University, United States
Andrew Yegian, Harvard University, United States
Copyright © 2023 Murray, MacKinnon, Carswell and Giles. This is an open-access article distributed under the terms of the Creative Commons Attribution License (CC BY). The use, distribution or reproduction in other forums is permitted, provided the original author(s) and the copyright owner(s) are credited and that the original publication in this journal is cited, in accordance with accepted academic practice. No use, distribution or reproduction is permitted which does not comply with these terms.
*Correspondence: Alison A. Murray, amacintosh@uvic.ca