Walking with individualized 3D-printed minimal footwear increases foot strength and produces subtle changes in unroll pattern
 Alexandra Allen
 Manuel Pinheiro
 Raf Schoenmaekers3
  Kristiaan D’Août
 Catherine Willems
- 1Evolutionary Morphology and Biomechanics, Department of Musculoskeletal and Ageing Science, Institute of Life Course and Medical Sciences, University of Liverpool, Liverpool, United Kingdom
- 2Department of Materials, Textiles and Chemical Engineering, Mechanics of Materials and Structures (MMS), Ghent University, Ghent, Belgium
- 3Department of Design, Koninklijke Academie voor Schone Kunsten (KASK) & Conservatorium, The School of Arts of HoGent and HoWest, Ghent, Belgium
Introduction: This 5-month follow-up study, involving 66 subjects (38 intervention, 28 control; 34 females, 32 males), evaluated the biomechanics of walking while wearing bespoke, 3D-printed footwear.
Methods: A 3D scanner was used to obtain foot shape, which was subsequently modified to yield a suitable instep and additional room in the forefoot and toe areas, to allow for potential shape changes of the foot. Shoes were manufactured using TPU laser sintering. Pre (T0) and post (T1) the intervention, plantar pressures were collected using a plantar pressure plate (3 trials per foot) and toe flexor strength (5 trials per foot) was measured using a dynamometer, for control and intervention groups. Plantar pressure peak patterns and center-of-pressure (CoP) timing was analysed using 2D and 1D Statistical Parametric Mapping, respectively. Toe strength changes were expressed in percent and per individual as: 100 x ((strength@T1strength@T0) / strength@T0).
Results: Peak pressure distribution did not differ between control and intervention populations, or between T0 and T1. Center-of-pressure unroll differed between barefoot and shod conditions at T0 for the intervention group. When barefoot, the intervention group at T1 showed a more lateral CoP in early stance and a more anterior CoP in late stance compared to T0. In the intervention group, toe strength increased significantly by 48.5% between T0 and T1.
Discussion: Overall, the results indicate that the bespoke, 3D-printed footwear did not significantly affect peak pressure distribution compared to barefoot walking. However, center-of-pressure patterns during gait were influenced, particularly in the intervention group, with analysis indicative of barefoot subjects' CoP moving faster in early and mid-stance than when shod. Additionally, the intervention led to a significant increase in toe strength. These findings contribute to our understanding of the biomechanical effects of customized 3D-printed footwear and highlight the potential benefits of such interventions in improving foot function and strength.
1 Introduction
Researchers have suggested that habitual use of footwear can cause pathological changes (Hoffmann, 1905; Frey et al., 1993; Zipfel and Berger, 2007; Hollander et al., 2017; Davis et al., 2021). Several studies have argued that being habitually barefoot is physically healthier than being habitually shod (Mafart, 2007; Zipfel and Berger, 2007) but also mental benefits have been reported (Rickard and White, 2021). In a classic study, Shulman (1949) surveyed the feet of 5,128 Chinese and Indian habitually barefoot (some would sometimes wear minimal sandals) volunteers and found far fewer foot defects than in conventionally shod populations. In another study, Sim-Fook and Hodgson (1958) also found fewer incidents of foot deformities in Chinese barefoot walkers than in shod counterparts within the population.
Footwear can provide benefits—such as protection against cold and mechanical injury, which have been the primary physiological and biomechanical benefit since their invention—without impairing a healthy foot function. Examples of less invasive footwear or minimal footwear (as defined by Esculier et al., 2015) exist all over the world and include the Kolhapuri sandal from India (Willems et al., 2017), the Nuvttohat boot from Northern Scandinavia, the N!ang n|osi sandal from Namibia (Willems et al., 2021) and the Huarache in Mexico (Wallace et al., 2018) and there is evidence that such footwear is at least 8,300 years old and possibly more (Kuttruff et al., 1998; Helm et al., 2023; Martínez-Sevilla et al., 2023). Even though these shoes originate in different environments and climates, they share an essential feature: they do not (or barely) constrain the foot (for instance, they have no raised heel, no arch support, and a thin, flexible sole). These shoes have all remained fundamentally unaltered over centuries and are used for intensive activities, including long-distance walking and endurance running.
Biomechanists concur that long-term use of minimal footwear increases foot strength (Curtis et al., 2021), but the time period required to return to a naturally strong foot for healthy, habitually, conventionally western shod adults transitioning to minimal footwear is unknown. Studies found that walking in minimal footwear for a period between two and six months is as effective as increasing foot muscle strength through foot strengthening exercises for the same time period (Curtis et al., 2021). Another study found foot strength to be significantly greater in a minimally shod population from northwestern Mexico, than in a conventionally shod population from urban areas in the United States (Holowka et al., 2018).
The undeformed foot outline is not symmetric. For example, the big toe typically extends 25 to 40 mm beyond the smallest toe. Moreover, our toes spread out and do not converge to a point in front, as the shape of many shoes does. Despite these obvious morphological features, toes have largely been neglected, both in research and often also in footwear production (in the last 200 years of industrial footwear production). Indeed, to the best of our knowledge, no data on the toe box area has been reported. In addition, the fit and style of footwear offered to consumers have been dictated by standard foot analogues (also called lasts) and grading systems ever since footwear was industrialized and commercialized, although the need for 3D imaging and fitting has been recognized (Thompson et al., 2011).
Manufacturing has been using lasts and fitting measurement standards that have not evolved much since footwear became industrialized. Studies into foot morphology to improve last design do exist (Barisch-Fritz et al., 2014; Barisch-Fritz et al., 2016; Grau and Barisch-Fritz, 2018), but differences in measurement and analysis methods complicate comparison between studies. An exception is Jurca et al. (2019), who compared 1.2 million scans of people in North America, Europe, and Asia and concluded that existing last grading tables should be updated to reflect the foot dimensions of current consumers. Proper fit is an essential customer expectation, yet the fitting standards of mass-produced footwear across the globe are mostly based on Western data and fashion trends. In general, the public is unaware of how their choice of footwear may affect their gait. The present longitudinal study aims to identify how bespoke minimal footwear, developed, and printed to individual 3D scan measurements, can affect gait over a five-month period.
This paper presents findings on the influence of regular activity in user customized 3D-printed minimal footwear on biomechanics. The study builds on our understanding of the musculoskeletal health factors associated with minimal footwear and uncover the benefits of footwear customized to individual foot morphology. It focuses on walking and as such should not be conflated with running, since these gaits are fundamentally different in mechanics and pressure magnitude.
Previous longitudinal studies utilizing off-the-shelf minimal footwear have found increases in foot strength over time (Curtis et al., 2021). We hypothesize that this will be the case when using bespoke 3D printed footwear too. To test this, we evaluate foot strength with a custom-built dynamometer before and after a five-month intervention period. We also explore peak and temporal pressure changes, both between barefoot and bespoke minimally shod conditions, to assess the effect of bespoke 3D printed footwear on gait.
2 Materials and methods
2.1 Subjects
Sixty-six healthy volunteers were recruited and allocated to either a Control group or Intervention group (see Table 1 for details). Subjects were only included if they met the following inclusion criteria: free from lower limb pathologies, injuries, or conditions affecting gait or for a minimum of six months prior to the start of the study, age between 18–65 years, and having a Body Mass Index (BMI) between 18.5–30. Due to the longitudinal nature of the study, Covid-19 impact and technical failures, further subjects were, by necessity, excluded from exploration of some longitudinal data. Before experiments, the participants read a participant information booklet and signed informed consent (Antwerp University ethics committee approval #8300201112278).
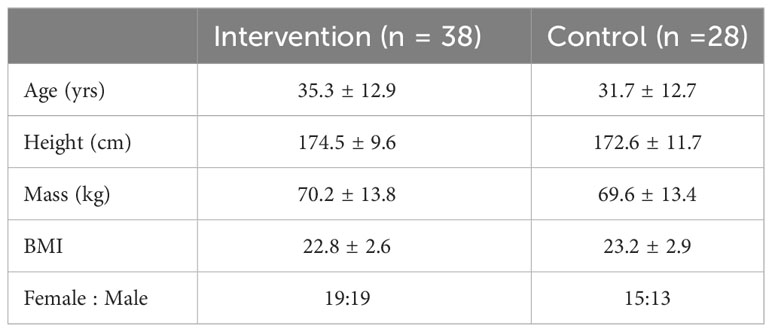
Table 1 Overview of subject biometrics.
The Intervention group walked in personalized 3D-printed footwear for 70% of the day, 6 days a week, for a period of five months. The Control group did not change any gait related habits. For Toe Flexion Strength (TFS) data, 29 Intervention and 13 Control subjects were included in statistical testing. Where less than the full recruitment sample was included in pressure statistical testing, the number of subjects included is described in Table 2.
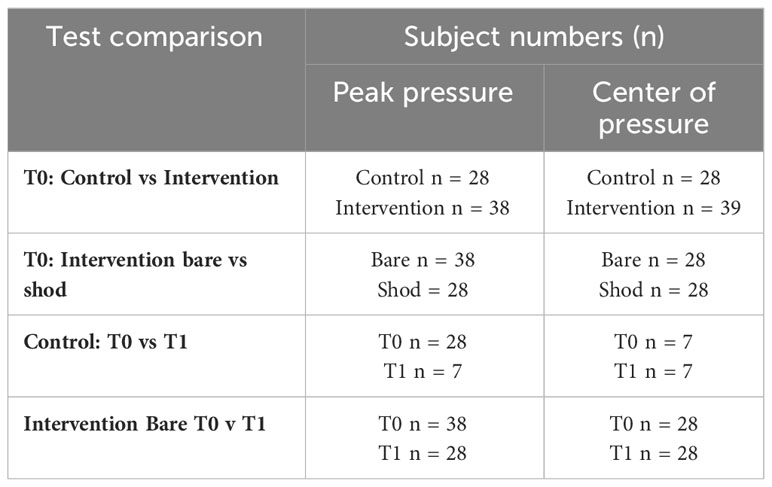
Table 2 Overview of tests and number of subjects analyzed.
2.2 Materials
Intervention study subjects were provided with a pair of 3D-printed footwear, produced from their own respective left and right 3D footscans. A Materialise Tiger 3D scanner (s.d. 0.5mm), which has excellent reliability and objectivity in linear measurements of the foot (Laštovička et al., 2022) was used to obtain high-quality footscans.
Ultrasint Thermoplastic Polyurethane (TPU) material in powder form was used for the 3D prints because of its high flexibility and durability. The Selective Laser Sintering (SLS) printing technique was utilized to print very fine structures with a high level of detail. The footwear was printed at BASF Forward AM (Additive Manufacturing) 3D printing facilities in Europe on a HP Multi-Jet fusion printer.
2.3 3D shoe description
We integrated design parameters in 3D structures based on the indigenous Indian footwear called Bantu (Willems, 2013), a type of closed Kolhapur shoe with woven upper and a braided connection between outsole and upper. The 5 mm sole was designed to retain a high degree of flexibility, allowing the foot to respond to terrain naturally, and corresponds with the thickness of the outsole, made from vegetable tanned buffalo leather. 3D-printed footwear and the production of the Bantu Footwear share common features, including the use of mono-materials, a lightweight design and a direct link between production and consumption (Willems, 2018).
The shoe designs were developed in two software systems, SideFX Houdini 18.x and Blender 3.x, mainly having an impact on the visual design. Even though the degree of automation was different in both systems, the principles in both systems were very similar and had no impact on the functional design.
Based on the original foot scans (left and right separately), a “local convex hull” was created to follow the shape of foot exactly (given the provided, necessary instep and required allowances). This shape respects the medial curve of the foot and merges the interdigital spaces between the toes. It also smooths out small scanning errors (< 0.5 mm).
Based on this shape and relative to biomechanical markers, the sole was carved out precisely. The biomechanical markers we used were: the distal ends of all five toes, the medial side of the 1st and lateral side of the 5th toe, the Metatarsale Tibiale and Metatarsale Fibulare (defining forefoot width), the top of the instep point (Cuneiform), the lateral and medial malleolus, the most posterior point of the foot, the Sphyrion Fibulare and Sphyrion Tibulare.
Starting from the flat shape of the sole, it was outset to provide some grip (of the shoe on the ground) at the bottom while maintaining flexibility and enough strength, given the printing material. Additionally, some small relief was added on top of the sole (+-0.5 mm) to add some grip and breathing space between the foot and the shoe.
In a similar way, the upper side of the shoe was closed, using an intricate mesh structure of which the inner grid follows the foot scan exactly and is built on top of the previously mentioned hull. The size, shape, direction, and connectivity of the mesh was technically a design balance between strength and flexibility (in the usual shoe-bending directions). Creatively (on the visible side of the shoe) it was an attempt to respect and honor Kolhapuri design principles, and specifically the Bantu model.
The relative shape and size of the sole, upper mesh and instep are a compromise between the design goal of providing minimal footwear, esthetics, and the strength and bendability limitations of the used 3D printing material.
Directly from the software binary STL files were exported, the models were cleaned and prepared for 3D printing.
Initial foot scans were imported into the software, and biomechanical markers (toes, arch etc.) were identified. Next, the scans were transformed using evidence-informed parameters stemming from previous research (Willems, 2015) to achieve a shoe with “barefoot” properties. The scaling from a raw scan to a more barefoot adjusted scan was focused on changing the toe box’s width and the distance between the medial and lateral surfaces of the first and fifth metatarsals, respectively.
Based on the anatomical differences between an Indian sample group (n = 20) of minimally shod people and a Belgian sample group of conventionally shod people (n = 20), the width of the toe box and metatarsal distance was increased by 15% to 30% of the relative toe and ball width variation between the two groups. This was considered a good compromise between having a forefoot allowance similar to minimalistic shoes while guaranteeing a secure fit between shoe and foot for individuals familiarized with conventional shoes. Nevertheless, after some preliminary testing, additional instep, length, and general allowances were added to the footwear’s upper to maximize comfort and provide some space between the foot and the shoe during movement or exercise. All foot scan transformations were performed using a custom-software routine developed in MatLab (R2021a).
Once the scan manipulation (Figure 1) toward a more barefoot fit was finished, the adjusted 3D scans were ready to be merged/imported into the two described software systems (Figure 2).
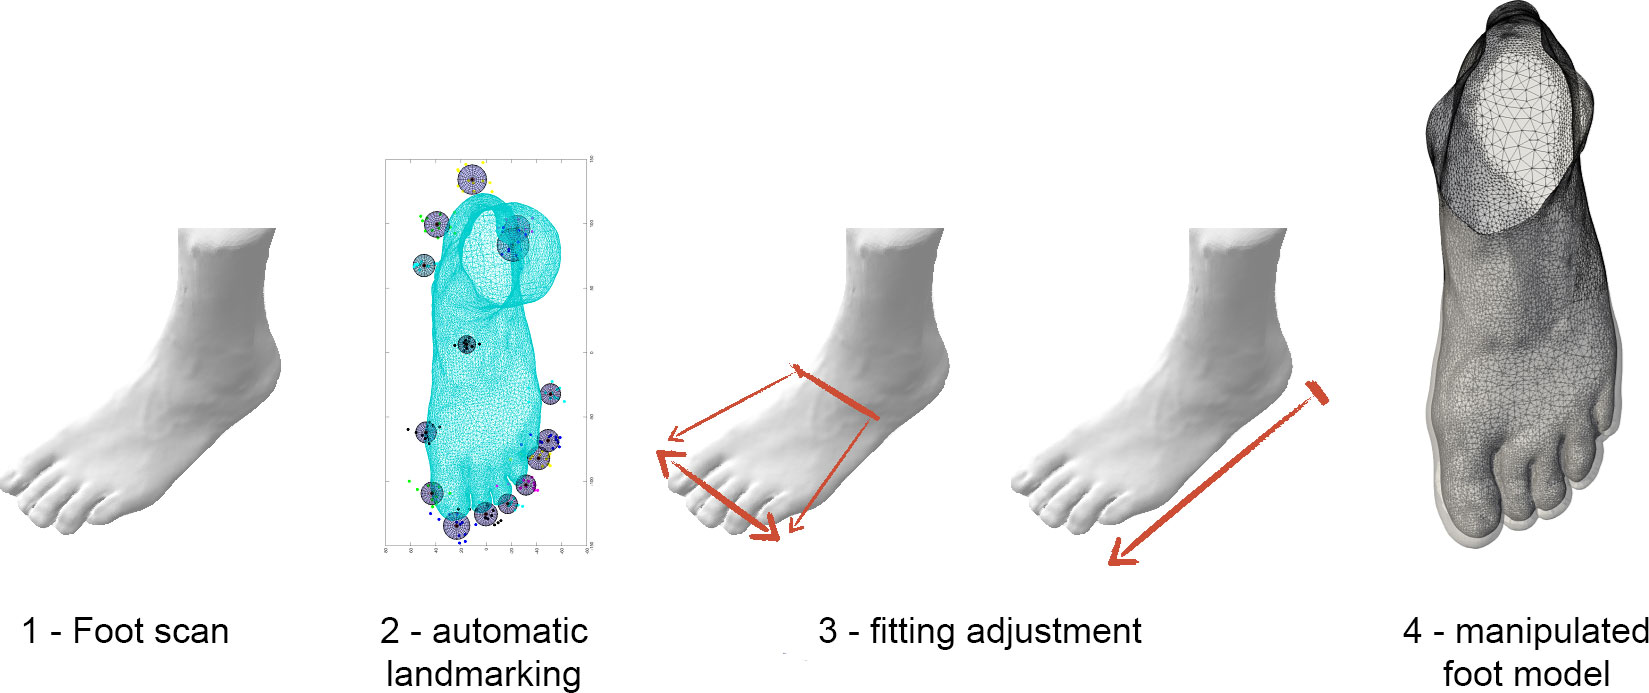
Figure 1 Foot manipulation - fitting protocol. (1) Scan the feet, (2) automatic landmarking, (3) fitting adjustment in width, volume, and length, (4) manipulated foot model.
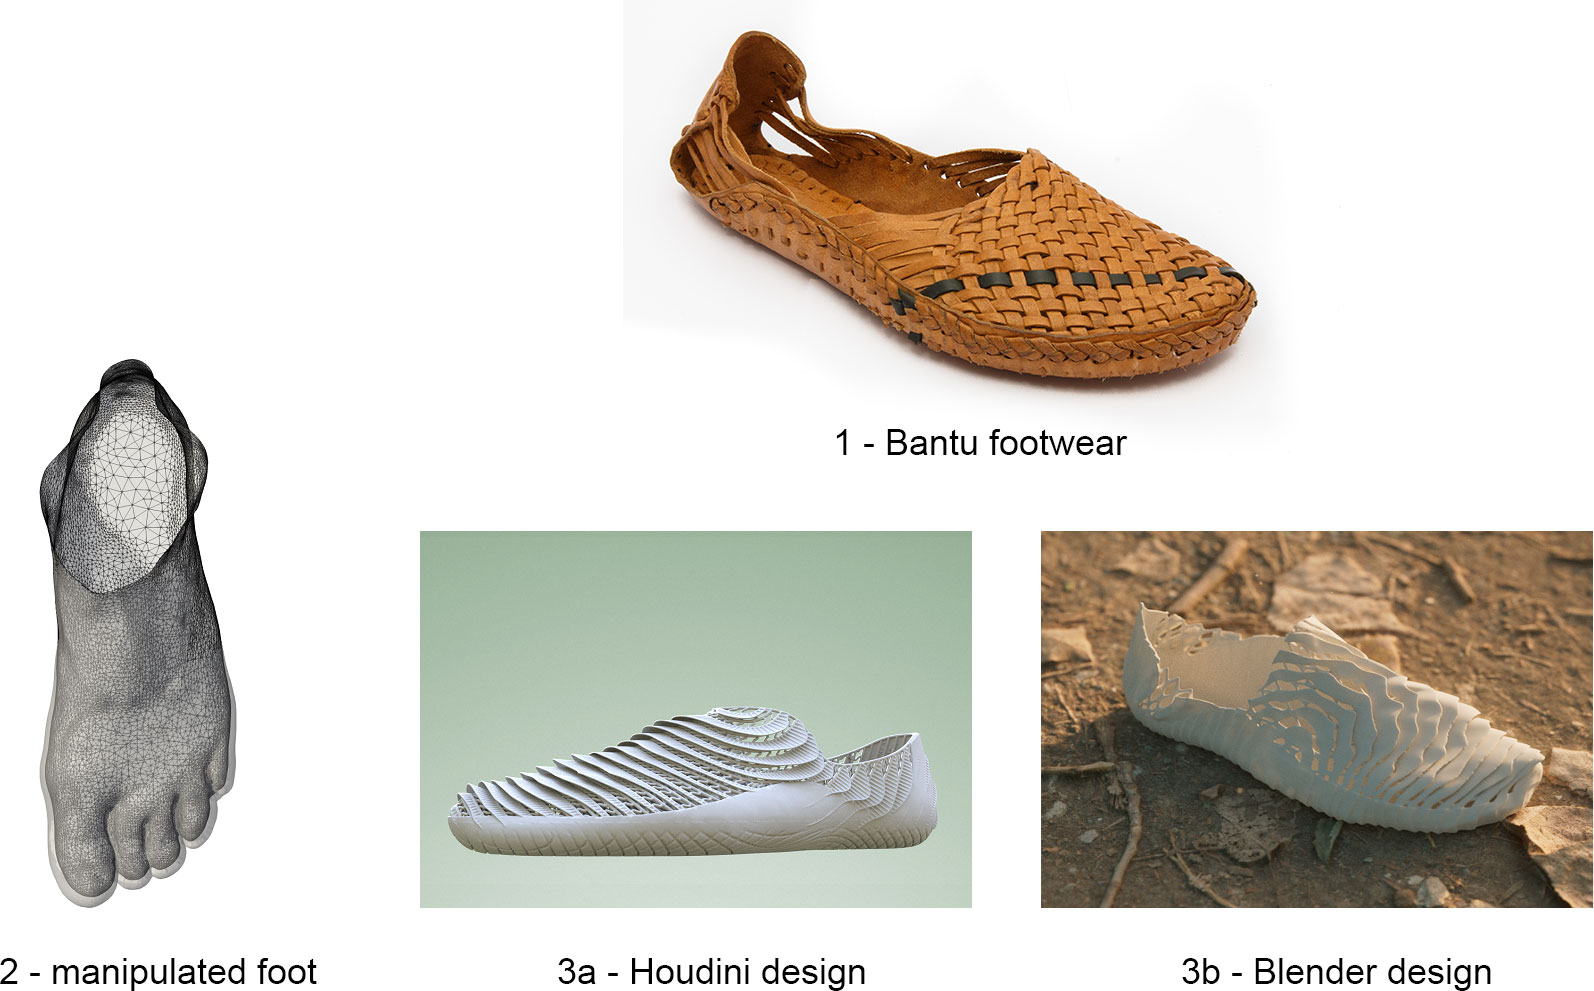
Figure 2 3D Bantu production - design protocol. (1) Original Bantu footwear, (2) manipulated foot, (3a) Houdini software design, (3b) Blender software design. Landmarks are used as guidelines for correct fitting, especially around the instep and the heel height.
Foot pressure recordings were collected using an RSScan Footscan USB at 300 Hz and a spatial resolution of 5.08 mm along the short axis (left to right) and 7.62 mm along the long axis (walking direction). Calibration was performed according to the manufacturer’s guidelines.
TFS was recorded as a representation of foot strength, following the methodology defined by Curtis et al. (2021) and utilizing the same custom dynamometer. We recorded the moment (Nm) generated by TFS with the device load plate angled at 25°, sample frequency 6 Hz and an accuracy of 0.1 Nm.
2.4 Protocol
Biometrics (age; height; mass) were collected from all subjects at the start of the study period. Biomechanical data was collected at the start of the study (Time 0, T0) and after 5 months (Time 1, T1).
All subjects were instructed to walk barefoot at their self-selected speed over a 7m walkway, with the pressure plate positioned approximately 4m from the beginning, to ensure a steady state of recordings at both study time intervals. Several recordings were completed for each subject until approximately 3 successful captures existed for both left and right feet. Intervention subjects additionally repeated the task wearing their bespoke 3D-printed minimal footwear at T0.
To measure TFS, subjects were directed to sit on a chair, arms next to their body. One foot was placed onto the dynamometer first, with the metatarsophalangeal (MTP) joint placed at the dynamometer plate division so that the hallux and lesser toes were positioned on the loading plate. The subject was coached by the experimenter to push as hard as they could against the load plate with their toes, while ensuring the heel remained on the base plate. Five repetitions were performed with 15 seconds of rest in between, before the process was repeated for the other foot. This procedure was carried out at T0 and T1 for both the control and intervention groups.
2.5 Analysis
Foot pressure data was explored in the context of peak pressure (i.e., spatially), and foot unroll (i.e., temporally). Analysis for both datasets shared initial preparation; numerical pressure data (N/cm2) over time were exported as ASCII text files from acquisition software to MatLab (R2021a). Pressure images were resampled to square 5 mm × 5 mm pixels, and right footprints were flipped to anatomically reflect the left, assuming symmetry at the population level, to maximize sample size.
Footprint plots determining peak pressure for each pixel over the duration of the step were produced for each recording. From these footprint plots, average peak pressure plots for each subject (at each time interval) were produced. Pedobarographic Statistical Parametric Mapping (Pataky and Goulermas, 2008; Pataky et al., 2008) methodology was selected to analyze peak pressures, utilizing the full pressure record without the requirement for landmark identification. Five test groups existed in this dataset, to account for subject group, footwear condition and time interval; Control barefoot T0 (n = 28), Control barefoot T1 (n = 7), Intervention barefoot T0 (n = 38), Intervention 3D printed bespoke minimal shod T0 (n = 28), Intervention barefoot T1 (n = 28). The subject pools at T1 were lower than at T0 because of dropouts and restrictions because of the Covid-19 pandemic. Within each of these groups, subject mean peak pressures were registered, scaled, and orientated to the mean peak pressure maps to that of a single reference subject; this allowed for comparative analysis of populations across control and intervention groups, footwear conditions and study interval time. The reference subject was selected based on consistently high-quality prints, showing a full plantar pressure image. Two-sample inference testing was used to compare Control T0 and Control T1 subjects; Control T0 and Intervention T0 subjects; Intervention T0 and Intervention T1 subjects; Intervention barefoot T0 and Intervention T0 subjects shod in 3D printed bespoke minimal footwear. Lower t-value limits for all comparisons were set to −1.5, with the upper value limit set to 1.5.
Center of pressure (CoP) analysis investigates temporal aspects of foot roll-off during walking and complements the pressure distribution analysis. Pressure recordings previously resampled and re-orientated for consistency were interpolated to 101 frames, across the temporal axis, from 0–100% of stance. CoP coordinates were calculated for each frame and normalized to foot length. CoP trajectories were calculated along both the posterior-anterior axis (with 0% representative of most posterior contact at heel to 100%, representative of most anterior contact at toe throughout stance) and the medio-lateral axis (with 0% representative of most lateral plantar pressure and 100% representative of most medial pressure throughout stance. Mean CoP anterior-posterior and mediolateral displacements over 0–100% of stance were calculated for sets of prints belonging to each individual and condition (footwear and time interval). Comparisons were made using one-dimensional statistical parametric mapping (1D-SPM) (Pataky et al., 2013). This technique allows to test for differences between full time series without having to discard data or make any prior assumptions about where differences may be. It uses random field theory to take into account that neighboring data points are not independent. We explored significant variations in timing of pressures during the stance phase for different groups (as described in peak pressure analysis); paired t-tests were used for all comparisons, except pre-intervention Control vs Intervention for which a standard two-sample t-test was used.
TFS data were exported from acquisition software as comma separated value (CSV) files and converted to MAT format for analysis within MatLab (R2021a). For each trial, the peak moment plateau was extracted, smoothed with a second-order Butterworth filter with a 1 Hz cut-off, and the maximum moment value was extracted. Subsequently, a mean of all trial maxima moments per subject at each time interval (T0 & T1) was calculated. This output was then normalized by body weight, on a subject-specific basis. Normality testing was carried out for both groups and the different time intervals and outliers were excluded (subjects retained: Control n = 13; Intervention n = 29; for some subjects we were able to measure TFS but not foot pressure). Paired t-tests were used for comparing within a subject group across time (Control T0 to T1; Intervention T0 to T1), while a 2-sample t-test was utilized to explore statistical differences across the Control and Intervention groups pre-intervention. Where significant differences were identified between groups peak TFS, percentage change from T0 to T1 was calculated for each included subject as in Curtis et al. (2021). A mean percentage change across individuals was determined to summarize the impact of intervention was calculated as:
3 Results
3.1 Peak pressure
Peak pressures were compared between barefoot Control and Intervention groups at T0, Intervention barefoot and shod conditions at T0, and both subject groups at T1 compared to T0. Two sample T-tests identified no significant differences in peak pressure in any group-wise comparison. This indicates that no significant differences exist between the barefoot peak pressures of the intervention (Figure 3) or control populations prior to the intervention, and that no changes occurred in either the control population’s peak pressure distribution, or that of the intervention population over the subsequent 5-month period. When exploring the T0 peak pressure of the Intervention group under two conditions (barefoot and 3D printed bespoke minimal footwear), no significant difference was found, indicating that during a short walking test, the shoes did not obstruct natural barefoot peak pressures.
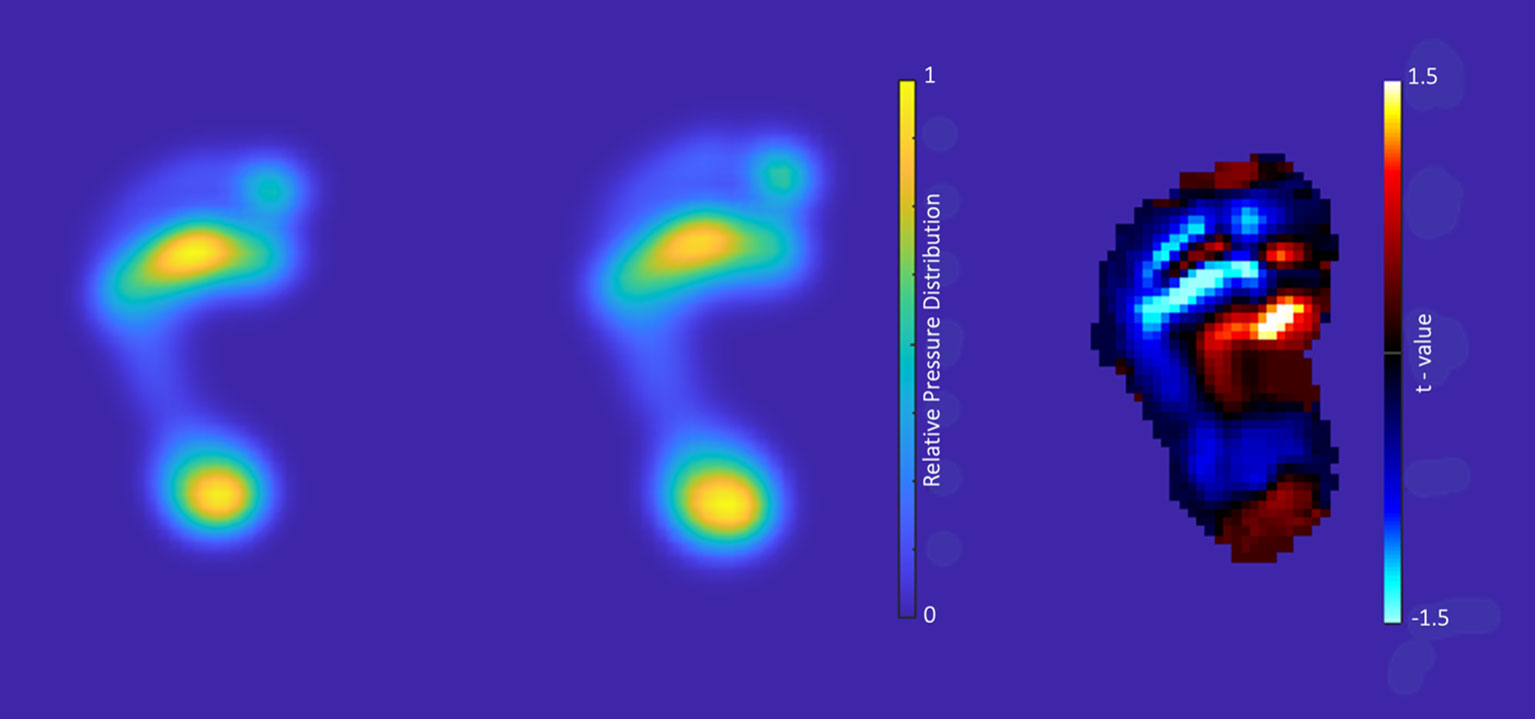
Figure 3 Comparison of mean peak pressures for Intervention subjects (shod n = 28; barefoot n = 38) prior to the intervention period. Left to right: barefoot, shod in bespoke footwear, and raw t values of statistical inference where cool colors (blue) represent higher pressure in the barefoot condition, with warm colors (red) representing higher pressure in the 3D printed minimally shod.
3.2 Center of pressure (CoP)
Longitudinal and medio-lateral CoP trajectories were compared across barefoot Control and Intervention groups at T0, Intervention barefoot and shod conditions at T0 (Figure 4), and both subject groups at T1 compared to T0. The timing of the foot unroll, as described by CoP, showed significant differences in the Intervention group at T0 between the footwear conditions (Figure 4), and at T1 compared to T0 barefoot. No significant differences were identified in the Control group over the intervention period. Significant differences were also identified between T0 Control and Intervention comparisons. The following describes the timing and path of the differences identified.
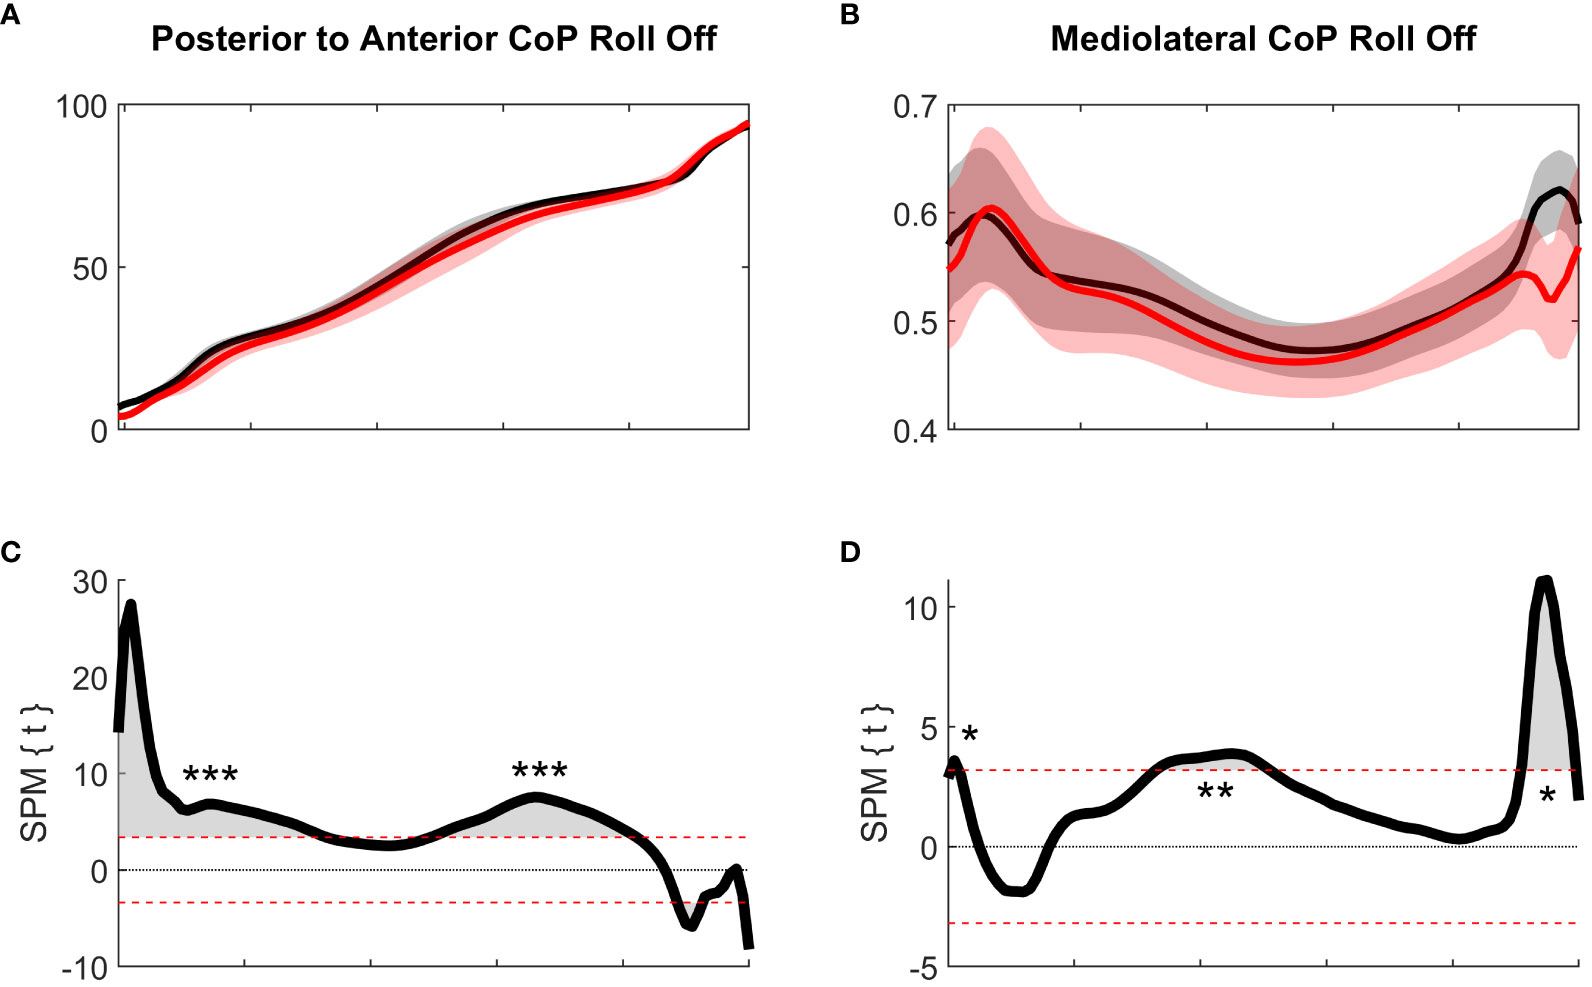
Figure 4 Comparison of the barefoot versus minimally shod conditions in the Intervention group at T0. (Top) Mean Posterior to Anterior (A) and Mediolateral (B) roll-off for barefoot (black) and bespoke 3D printed minimally shod (red) Intervention subjects, pre-intervention. (Lower) 1D-spm 2-sample t-tests (C, D) showing areas of stance with significant differences in timing between the above comparisons. Red dotted lines define tcritical. Horizontal axis is 0–100% of stance phase duration.
At T0, Intervention subjects show a highly significantly (p< 0.001) more anterior center of pressure barefoot, compared to when minimally shod in bespoke 3D printed footwear, throughout most of 0–80% of stance. At 90% of stance there is brief reversal, when the minimally shod condition is more anterior (p = 0.028). This indicates that when barefoot, subjects moved faster through early and mid-phases of stance. In the medio-lateral axis, significantly more lateral placement is seen for the minimally shod condition at heel strike (0–5% stance, p = 0.049), mid-stance (40–50%, p = 0.001) and end of stance (90–100%, p = 0.018), suggestive of a trend toward lateral pressure when utilizing the bespoke 3D-printed minimal footwear.
Comparing barefoot Intervention subjects over the intervention period of 5 months, subjects display a trend toward significantly more anterior CoP in late phase stance (65–95%) at post-intervention testing compared to pre-intervention (p< 0.001). Medio-laterally, the CoP position in the first 50% of stance is highly significantly (p< 0.001) more lateral post intervention (T1) compared to T0.
Pre-Intervention comparisons between the control and intervention groups identified a more anterior CoP at 0–20% of stance (p< 0.001) and more lateral (p< 0.001) in later stance (60–100%) for the control subjects.
3.3 Toe flexion strength (TFS)
At T0, prior to intervention, Control and Intervention groups showed no significant difference (p = 0.25) in TFS. Over the course of the intervention period, no change in TFS was seen in the Control (p = 0.60). However, the Intervention group displayed a highly significant increase (48.5 ± 65.77%, p< 0.001) in foot strength per unit mass at the end of the intervention period compared to the beginning of the study (Figure 5).
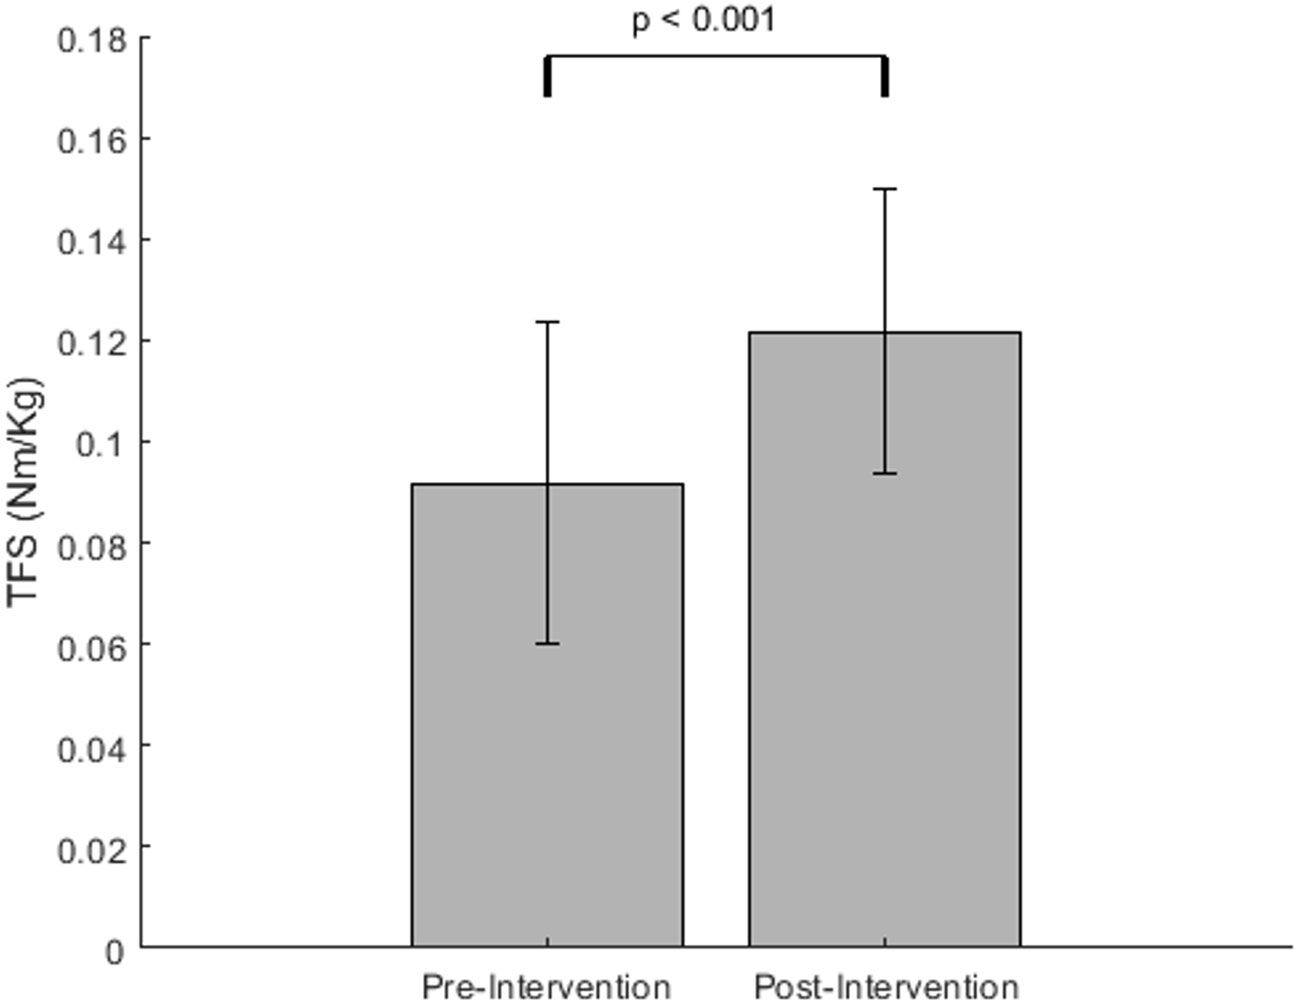
Figure 5 Mean Toe Flexion Strength per unit mass (Nm/Kg) for Intervention subjects, pre-intervention, and post-intervention.
4 Discussion
This study sought to examine the biomechanical effects of bespoke 3D-printed minimal footwear on peak pressure, center of pressure travel, and toe flexor strength, over a longitudinal five-month period. Control and Intervention group peak and temporal foot pressure data was utilized to explore whether the footwear had an immediate or long-term effect on biomechanical factors. We measured foot strength to assess whether the bespoke 3D printed footwear could reproduce the strength increase seen in previous studies with commercially produced minimal footwear (Curtis et al., 2021).
4.1 Peak pressure
Peak plantar pressure analysis yielded no significant differences between any pair-comparisons examined. This indicates that no significant differences existed between the Control and Intervention subject groups at the beginning of the study, indicating they were well-matched populations. Furthermore, no significant differences in peak pressure were identified at the pre-intervention phase for the Intervention group when barefoot and when wearing their newly presented bespoke 3D printed minimal footwear (Figure 3). This is a fundamental finding as it suggests that peak pressure distribution is not affected by the use of the bespoke 3D printed minimal footwear design, and indeed that the footwear allows the foot to behave similarly to natural barefoot conditions in a western population. Previous studies exploring peak pressure between minimal indigenous footwear designs and the barefoot condition for different populations report no significant statistical differences but identify visual variations in relative pressure between the shod and barefoot conditions (Willems et al., 2021). In contrast, this study yielded no obvious differences in relative peak pressures between the bespoke 3D-printed minimal footwear and the barefoot condition from either statistical or visual observation. While very small differences might exist and be hidden by variation, this suggest that the bespoke 3D printed minimal footwear design used in this study optimizes “minimal properties” well, allowing the human foot to behave as though barefoot. Because the footwear introduces no notable change in peak pressure distribution from the first introduction of the shoe, relative to barefoot movement, it is unsurprising that no change is observed over the duration of the study in the Intervention or Control groups either.
4.2 Roll-off timing
Roll-off timing was explored in both the Posterior-Anterior and Mediolateral axes. Interestingly, timing differences were identified in some paired comparisons where peak pressure differences did not exist.
Pre-intervention yielded significant differences in both axes when comparing barefoot Intervention and Control group subjects (Figure 4). However, when mean and standard deviation plots are examined, there is very little discernible variation between groups, particularly in the Posterior-Anterior direction. Data within a participant and/or condition group shows strong congruency, which can lead to high sensitivity in statistical testing. While sensitivity is important to discern statistical differences, it is important to remember that biological processes such as walking are inherently variable. As such, caution should be implemented when determining statistical outputs if no visually difference is observed in the datasets, as in these cases.
Pre-intervention, subjects were found to progress more slowly through most of early- and mid-stance when shod in bespoke 3D printed minimal footwear compared to barefoot, as indicated by the more posterior CoP. Although the footwear provides minimal cushioning, the TPU01 structure does offer a thin layer of protection and thus, it is likely that slowing the foot-unroll and retaining a more posterior position for longer, is more comfortable than when barefoot, with no cushioning and protection besides the natural provision of the corpus adiposum (heel fat pad). However, individuals walking habitually barefoot have been found to have thicker and harder calluses compared to those habitually shod (Holowka et al., 2019). In our study, the barefoot data collection represents a habitually shod population who are unlikely to have developed thicker sole calluses; it is possible that the minimal protection offered by the bespoke 3D-printed minimal footwear mimics the natural circumstance. The brief anterior peak for the 3D printed minimal footwear condition in late stance, typically indicative of a quicker progression, is explained by the anatomical difference of the human foot compared to the shoe, during toe-off; the footwear, by nature of encasing the foot, is slightly longer and broader, with more defined edges at the toe, than the unshod foot. This artificially increases relative time spent anteriorly during late push-off. In the case of the shod condition, the pressure represents that between the sole of the shoe and the pressure plate and is not necessarily reflective of the pressure experienced by the foot within the shoe (Nyska et al., 1995; Chevalier et al., 2010).
A previous study (Willems et al., 2021) compared CoP in barefoot, indigenous minimal footwear and conventional footwear across different populations and determined that minimal footwear offered a middle ground between conventional and barefoot conditions (also observed in running; McCallion et al., 2014). General trends reflect this study, with regards to moderately more posterior pressure in minimal footwear compared to barefoot. While Willems et al. (2020) found no difference between their minimally shod and barefoot conditions in the mediolateral axis, here a significantly more lateral placement is identified at T0 when wearing bespoke 3D printed minimal footwear, at heel strike, midstance and toe-off. This is further reflected in the Intervention group, with a significantly more lateral placement throughout the first 50% of stance when shod in the 3D printed minimal footwear at T1 compared to barefoot. Furthermore, the adaptation over time to a more lateral pressure distribution during the first 50% of stance may reflect developing strength of the foot muscles (see TFS results below) during the intervention period. Since the foot arches are in part supported by muscle, a stronger foot might result in a more developed medial arch, which (all else being equal) may induce a more lateral pressure distribution.
This immediate mediolateral footwear effect on temporal un-roll at first provision of bespoke 3D printed minimal footwear appears to be mimicked in barefoot roll-off timings post-intervention, when compared to pre-intervention; at the end of the intervention period barefoot subjects display a trend toward more lateral placement during early- and mid-stance than prior to the intervention use of bespoke 3D printed minimal footwear. This indicates the possibility of a longitudinal training effect of footwear, sufficient over a 5-month period of use that it is retained even when walking barefoot. However, this outcome would benefit from further exploration, particularly with consideration to the intensity of footwear use and activity levels, and over a longer intervention period. The wider biomechanical and health implications of this possible footwear training effect on temporal un-roll cannot be determined from the current study and pose important future questions for investigation. Over the intervention period, statistical differences are identified in late stance in the antero-posterior axis. However, close observation of plots (Figure 4) reveals little variation in the mean and in fact, very little standard deviation too; as previously discussed for other comparisons, this statistical outcome should thus be treated with caution and considered a factor of high testing sensitivity in connection with highly congruent data.
4.3 Toe flexion strength
Pre-intervention, Control and Intervention subjects displayed no significant differences in TFS produced. Over the Intervention period, Intervention subjects increased TFS by approximately 48.5%. The Control group did not yield any significant change in TFS throughout the same period; thus, it is reasonable to conclude that the increase in strength identified in the Intervention subjects is a result of the bespoke 3D printed minimal footwear use. Curtis et al. (2021) identified a 57.4% increase in TFS over a similar, longer six-month intervention with the use of commercial minimal footwear for daily activity – the slightly higher increase compared to the current study might be explained factors including the longer intervention period, differences in footwear and differences in study population. The increased TFS identified in both studies is likely a result of the reduced arch support and increased sole flexibility compared to conventional shoes, which should encourage the foot muscles to engage during activity, developing strength over time. This is particularly true of the intrinsic foot muscles involved in supporting the MTP joint toward the end of stance phase. Kelly et al. (2014) identified that under static loading, flexor digitorum brevis and abductor hallucis actively contract, increasing foot stiffness. During dynamic walking, plantar intrinsic muscles have been found to significantly contribute to foot stiffness during late-stance, while the foot is acting as a rigid lever to push-off the ground (Farris et al., 2019). This stiffening around the MTP joint is biomechanically similar to the requirement of the dynamometer task utilized to assess strength in this study. While this report does not include examination of foot morphology, other authors have identified larger muscle mass of the abductor hallucis and abductor digiti minimi in habitually minimally shod populations compared to conventionally shod (Holowka et al., 2018), indicating further impact of minimal footwear on maximizing foot muscle development.
While the mean 48.5% increase over the intervention period for bespoke 3D printed minimal footwear users is large, it should be noted that there is a high degree of individual variability connected to this improvement, as represented by a large standard deviation of 65.8. When examined on a case-by-case basis, some individuals experienced much more moderate TFS increase throughout the intervention, while others experienced enormous increases; for example, five individuals expressed TFS post-intervention that was more than double their pre-intervention measures. It is likely that individual improvements in strength are connected to the pre-intervention baseline from which individuals entered the study; those with a lower TFS pre-intervention generally displayed more improvement post-intervention. Those that had a better baseline pre-intervention showed smaller, more moderate increases. This indicates that the footwear can actively contribute toward the significant strengthening of weaker foot muscles while supporting maintenance of stronger musculature that is not in need of major further development to meet the needs of day-to-day activity. Further exploration of this finding in relation to habitual footwear type prior to study, and active time spent in bespoke 3D printed minimal shoes during the intervention period, may yield greater insight into who might benefit most from active intervention of bespoke minimal footwear.
The study has raised questions for further exploration and project development, particularly in respect to a more lateral profile in temporal foot unroll when wearing, or with regular use of, the footwear. It would also be interesting to study a range of speeds intra-individually to assess if and how the increased forces and pressures, especially when switching to a running gait, affect the results and possible exacerbate the relatively subtle effects we saw at self-selected walking speed.
We can conclude that bespoke 3D printed minimal footwear, when designed as the shoes in this study, offer no detectable interference with natural barefoot peak pressure responses and that over time, the shoes offer individuals an opportunity to increase foot strength through natural development during everyday activities. Future work should extend toward more diverse study populations e.g., in terms of age, ethnicity, and medical background (including lower extremity risk factors) to make individual footwear recommendations.
Data availability statement
The raw data supporting the conclusions of this article will be made available by the authors upon reasonable request. Requests to access the datasets should be directed to catherine.willems@hogent.be.
Ethics statement
The studies involving humans were approved by University of Antwerp Ethics Committee. The studies were conducted in accordance with the local legislation and institutional requirements. The participants provided their written informed consent to participate in this study.
Author contributions
AA: Formal Analysis, Investigation, Writing – original draft, Writing – review & editing. MP: Investigation, Methodology, Writing – original draft, Writing – review & editing. RS: Investigation, Methodology, Writing – review & editing. KD: Formal Analysis, Writing – original draft, Writing – review & editing. CW: Conceptualization, Data curation, Funding acquisition, Investigation, Methodology, Supervision, Writing – original draft, Writing – review & editing.
Funding
The author(s) declare financial support was received for the research, authorship, and/or publication of this article. This study was funded by the IOF (Industrial Research Fund) grant 3D2WALK (project #F2019 IOF STARTT 266), Association Ghent University, Belgium and with support from BASF Forward AM for the 3D printing.
Acknowledgments
We would like to thank all participants, and all reviewers for their constructive comments.
Conflict of interest
The authors declare that the research was conducted in the absence of any commercial or financial relationships that could be construed as a potential conflict of interest.
The Future Footwear Foundation www.futurefootwearfoundation.com, directed by CW, has previously received financial support from Vivobarefoot ltd. London. Vivobarefoot ltd. was not involved in the study design, data collection, analysis, or interpretation of the results.
Publisher’s note
All claims expressed in this article are solely those of the authors and do not necessarily represent those of their affiliated organizations, or those of the publisher, the editors and the reviewers. Any product that may be evaluated in this article, or claim that may be made by its manufacturer, is not guaranteed or endorsed by the publisher.
References
Barisch-Fritz B., Plank C., Grau S. (2016). Evaluation of the rule-of-thumb: calculation of the toe allowance for developing feet. Footwear Sci. 8, 119–127. doi: 10.1080/19424280.2016.1144654
Barisch-Fritz B., Schmeltzpfenning T., Plank C., Grau S. (2014). Foot deformation during walking: differences between static and dynamic 3D foot morphology in developing feet. Ergonomics 57, 921–933. doi: 10.1080/00140139.2014.899629
Chevalier T. L., Hodgins H., Chockalingam N. (2010). Plantar pressure measurements using an in-shoe system and a pressure platform: A comparison. Gait Post 31, 397–399. doi: 10.1016/j.gaitpost.2009.11.016
Curtis R., Willems C., Paoletti P., D’Août K. (2021). Daily activity in minimal footwear increases foot strength. Sci. Rep. 11, 18648. doi: 10.1038/s41598-021-98070-0
Davis I. S., Hollander K., Lieberman D. E., Ridge S. T., Sacco I. C. N., Wearing S. C. (2021). Stepping back to minimal footwear: applications across the lifespan. Exerc. Sport Sci. Rev. 49, 228–243. doi: 10.1249/JES.0000000000000263
Esculier J.-F., Dubois B., Dionne C. E., Leblond J., Roy J.-S. (2015). A consensus definition and rating scale for minimalist shoes. J. Foot Ankle Res. 8, 42. doi: 10.1186/s13047-015-0094-5
Farris D. J., Kelly L. A., Cresswell A. G., Lichtwark G. A. (2019). The functional importance of human foot muscles for bipedal locomotion. Proc. Natl. Acad. Sci. 116, 1645–1650. doi: 10.1073/pnas.1812820116
Frey C., Thompson F., Smith J., Sanders M., Horstman H. (1993). American Orthopaedic Foot and Ankle Society women's shoe survey. Foot Ankle 14, 78–81. doi: 10.1177/107110079301400204
Grau S., Barisch-Fritz B. (2018). Improvement of safety shoe fit-evaluation of dynamic foot structure. Footwear Sci. 10, 179–187. doi: 10.1080/19424280.2018.1529062
Helm C. W., Lockley M. G., Cawthra H. C., De Vynck J. C., Dixon M. G., Rust R., et al. (2023). Possible shod-hominin tracks on South Africa’s Cape coast. Ichnos, 1–19. doi: 10.1080/10420940.2023.2249585
Hoffmann P. (1905). Conclusions drawn from a comparative study of the feet of barefooted and shoe-wearing peoples. J. Bone Joint Surg. (American) 2, 105–136.
Hollander K., Heidt C., van der Zwaard B. C., Braumann K.-M., Zech A. (2017). Long-term effects of habitual barefoot running and walking: a systematic review. Med. Sci. Sports Exerc 49, 752–762. doi: 10.1249/MSS.0000000000001141
Holowka N. B., Wallace I. J., Lieberman D. E. (2018). Foot strength and stiffness are related to footwear use in a comparison of minimally-vs. conventionally-shod populations. Sci. Rep. 8, 1–12. doi: 10.1038/s41598-018-21916-7
Holowka N. B., Wynands B., Drechsel T. J., Yegian A. K., Tobolsky V. A., Okutoyi P., et al. (2019). Foot callus thickness does not trade off protection for tactile sensitivity during walking. Nature 571, 261–264. doi: 10.1038/s41586-019-1345-6
Kelly L. A., Cresswell A. G., Racinais S., Whiteley R., Lichtwark G. (2014). Intrinsic foot muscles have the capacity to control deformation of the longitudinal arch. J. Roy. Soc. Interface 11(93), 20131188. doi: 10.1098/rsif.2013.1188
Jurca A., Žabkar J., Džeroski S. (2019). Analysis of 1.2 million foot scans from North America, Europe and Asia. Sci. Rep. 9, 19155. doi: 10.1038/s41598-019-55432-z
Kuttruff J. T., DeHart S. G., O'Brien M. J. (1998). 7500 years of prehistoric footwear from Arnold Research Cave, Missouri. Science 281, 72–75. doi: 10.1126/science.281.5373.72
Laštovička O., Cuberek R., Janura M., Klein T. (2022). Evaluation of the usability of the Tiger full-foot three-dimensional scanner for the measurements of basic foot dimensions in clinical practice. J. Am. Podiatr. Med. Assoc 112(2), 20–019. doi: 10.7547/20-019
Mafart B. (2007). Hallux valgus in a historical French population: Paleopathological study of 605 first metatarsal bones. Joint Bone Spine 74, 166–170. doi: 10.1016/j.jbspin.2006.03.011
Martínez-Sevilla F., Herrero-Otal M., Martín-Seijo M., Santana J., Lozano Rodríguez J. A., Maicas Ramos R., et al. (2023). The earliest basketry in southern Europe: Hunter-gatherer and farmer plant-based technology in Cueva de los Murciélagos (Albuñol). Sci. Adv. 9, eadi3055. doi: 10.1126/sciadv.adi3055
McCallion C., Donne B., Fleming N., Blanksby B. (2014). Acute differences in foot strike and spatiotemporal variables for shod, barefoot or minimalist male runners. J. Sports Sci. Med. 13, 280–286.
Nyska M., McCabe C., Linge K., Laing P., Klenerman L. (1995). Effect of the shoe on plantar foot pressures. Acta Orthop. Scand. 66, 53–56. doi: 10.3109/17453679508994640
Pataky T. C., Caravaggi P., Savage R., Parker D., Goulermas J. Y., Sellers W. I., et al. (2008). New insights into the plantar pressure correlates of walking speed using pedobarographic statistical parametric mapping (pSPM). J. Biomech 41, 1987–1994. doi: 10.1016/j.jbiomech.2008.03.034
Pataky T. C., Goulermas J. Y. (2008). Pedobarographic statistical parametric mapping (pSPM): A pixel-level approach to foot pressure image analysis. J. Biomech 41, 2136–2143. doi: 10.1016/j.jbiomech.2008.04.034
Pataky T. C., Robinson M. A., Vanrenterghem J. (2013). Vector field statistical analysis of kinematic and force trajectories. J. Biomech 46, 2394–2401. doi: 10.1016/j.jbiomech.2013.07.031
Rickard S. C., White M. P. (2021). Barefoot walking, nature connectedness and psychological restoration: the importance of stimulating the sense of touch for feeling closer to the natural world. Landscape Res. 46, 975–991. doi: 10.1080/01426397.2021.1928034
Shulman S. B. (1949). Survey in China and India of feet that have never worn shoes. J. Natl. Assoc. Chiropodists 49, 26–30.
Sim-Fook L., Hodgson A. (1958). A comparison of foot forms among the non-shoe and shoe-wearing Chinese population. J. Bone Joint Surg. 40, 1058–1062.
Thompson A. L. T., Zipfel B., Eagleton S. (2011). “Three-dimensional foot imaging: axial alignment theory in footwear design, fit, and function,” in Human Factors and Ergonomics in Consumer Product Design (Boca Raton (FL), USA:CRC Press), 333–364.
Wallace I. J., Koch E., Holowka N. B., Lieberman D. E. (2018). Heel impact forces during barefoot versus minimally shod walking among Tarahumara subsistence farmers and urban Americans. R. Soc. Open Sci. 5, 180044. doi: 10.1098/rsos.180044
Willems C. (2013). 100% Bag tanned: action research generating new insights on design processes. Crit. Arts: South-North Cultural Media Stud. 27, 474–489.
Willems C. (2015). Future footwear: the birth of feet, the re-birth of footwear . PhD thesis. Ghent University, Faculty of Arts and Philosophy.Available at: https://hdl.handle.net/1854/LU-7169855.
Willems C. (2018). “Feet and how to shoe them,” in Do you want your feet back? Barefoot cobblers. Eds. Roelandt E., Willems C. (Ghent: Future Footwear Foundation).
Willems C., Curtis R., Pataky T., D'Août K. (2020). Plantar pressures in three types of indigenous footwear, commercial minimal shoes, and conventional Western shoes, compared to barefoot walking. Footwear Sci 13, 1–17. doi: 10.1080/19424280.2020.1825535
Willems C., Curtis R., Pataky T., D’Août K. (2021). Plantar pressures in three types of indigenous footwear, commercial minimal shoes, and conventional Western shoes, compared to barefoot walking. Footwear Sci. 13, 1–17. doi: 10.1080/19424280.2020.1825535
Willems C., Stassijns G., Cornelis W., D'Août K. (2017). Biomechanical implications of walking with indigenous footwear. Am. J. Phys. Anthropol 162, 782–793. doi: 10.1002/ajpa.23169
Keywords: barefoot, minimal footwear, footwear design, 3D printing, gait biomechanics, anthropology, plantar pressure, foot strength
Citation: Allen A, Pinheiro M, Schoenmaekers R, D’Août K and Willems C (2023) Walking with individualized 3D-printed minimal footwear increases foot strength and produces subtle changes in unroll pattern. Front. Ecol. Evol. 11:1270253. doi: 10.3389/fevo.2023.1270253
Received: 11 August 2023; Accepted: 23 October 2023;
Published: 03 November 2023.
Edited by:
Kristian Carlson, University of Southern California, United StatesReviewed by:
David Armstrong, University of Southern California, United StatesBernhard Zipfel, University of the Witwatersrand, South Africa
Kevin Hatala, Chatham University, United States
Copyright © 2023 Allen, Pinheiro, Schoenmaekers, D’Août and Willems. This is an open-access article distributed under the terms of the Creative Commons Attribution License (CC BY). The use, distribution or reproduction in other forums is permitted, provided the original author(s) and the copyright owner(s) are credited and that the original publication in this journal is cited, in accordance with accepted academic practice. No use, distribution or reproduction is permitted which does not comply with these terms.
*Correspondence: Kristiaan D’Août, kristiaan.daout@liverpool.ac.uk