Detection and classification of Brandt’s vole burrow clusters utilizing GF-2 satellite imagery and faster R-CNN model
 Changqing Sun1,2,3
  Yulong Bao1,4*
  Yuhai Bao1,4
  Battsengel Vandansambuu2,3,5
  Sainbuyan Bayarsaikhan2,3 Byambakhuu Gantumur2,3 Narantsetseg Chantsal2,3
  Quansheng Hai2,6 Xiangguo Bai1,2 Gesi Tang1 Bu He1 Kai Wu7
- 1College of Geographical Science, Inner Mongolia Normal University, Hohhot, China
- 2Department of Geography, School of Arts and Sciences, National University of Mongolia, Ulaanbaatar, Mongolia
- 3Laboratory of Geoinformatics (GEO-iLAB), Graduate School, National University of Mongolia, Ulaanbaatar, Mongolia
- 4Inner Mongolia Key Laboratory of Remote Sensing & Geography Information System, Hohhot, China
- 5Research Institute of Urban and Regional Development, National University of Mongolia, Ulaanbaatar, Mongolia
- 6Baotou Normal College, Inner Mongolia University of Science & Technology, Baotou, China
- 7Inner Mongolia Autonomous Region Military-Civilian Integration Development Research Center, Hohhot, China
Most small rodent populations worldwide exhibit fascinating population dynamics, capturing the attention of numerous scholars due to their multiyear cyclic fluctuations in population size and the astonishing amplitude of these fluctuations. Hulunbuir steppe stands as a crucial global hub for livestock production, yet in recent decades, the area has faced recurring challenges from steppes rodent invasions, with Brandt’s vole (Lasiopodomys brandtii, BV) being particularly rampant among them. They not only exhibit seasonal reproduction but also strong social behavior, and are generally considered pests, especially during population outbreak years. Prior studies suggest that BV population outbreaks tend to occur across a wider geographic area, and a strong indicator for identifying rodent outbreaks is recognizing their burrow clusters (burrow systems). Hence, this paper conducts target object detection of BV burrow clusters in the typical steppes of Hulunbuir using two GF-2 satellite images from 2021 (the year of the BV outbreak). This task is accomplished by incorporating the Faster R-CNN model in combination with three detection approaches: object-based image classification (OBIC), based on vegetation index classification (BVIC), and based on texture classification (BTC). The results indicate that OBIC demonstrated the highest robustness in BV burrow cluster detection, achieving an average AP of 63.80% and an F1 score of 0.722 across the two images. BTC exhibited the second-highest level of accuracy, achieving an average AP of 55.95% and an F1 score of 0.6660. Moreover, this approach displayed a strong performance in BV burrow clusters localization. In contrast, BVIC achieved the lowest level of accuracy among the three methods, with an average AP of only 29.45% and an F1 score of 0.4370. Overall, this study demonstrates the crucial role of utilizing high-resolution satellite imagery combined with DL-based object detection techniques in effectively monitoring and managing the potential outbreaks of steppe rodent pests across larger spatial extents.
1 Introduction
Steppes cover approximately 50 million km² or 37% of the Earth’s total land area, making them a vital component of the global ecosystem (O'mara, 2012; Cao et al., 2019). They serve not only as a crucial repository of global biodiversity but also as a vital provider of both tangible and intangible resources essential to humanity (Rojas-Briales, 2015). These resources encompass a wide range of ecosystem services and cultural services, for instance, food production, climate regulation, water and carbon cycles, and the preservation of ethnic cultural heritage (Zhao et al., 2020; Bardgett et al., 2021). Moreover, steppes represent the largest terrestrial ecosystem in China and are the most common ecosystem type in arid and semiarid regions (Han et al., 2018). The steppes of Inner Mongolia in northern China, as an indispensable and integral part of the Eurasian Steppe, play a crucial role in sustaining local agriculture, livestock farming, and ecosystem functionality (Wang et al., 2020; Zhang et al., 2020). However, due to the interference of climate change and human activities, almost all of Inner Mongolia’s natural steppes have undergone varying degrees of degradation, a fact that has been well documented in previous studies (Hua and Squires, 2015; Hu et al., 2015; Shang and Wu, 2022; Xu et al., 2022). The Hulunbuir steppe, in the northeastern part of Inner Mongolia, is one of the world’s four major steppes (Liu et al., 2021), but its ecosystem faces numerous challenges, case few point like desertification (Na et al., 2019), water pollution (Chen et al., 2021), and heavy metal pollution (Ma et al., 2022) etc. Surprisingly, until the current juncture, there has been a paucity of studies delving into the repercussions of steppe rodent disturbances on the ecological landscape and public health security in this specific region. This is especially pronounced regarding broader-scale detection and management of rodent damage.
While developing countries have established relatively comprehensive theoretical knowledge regarding rodent agricultural pest management, rodents still pose a significant problem for global food security (Meerburg et al., 2009).From an economic standpoint, when we contrast the damage caused by rodents worldwide prior to harvest and following harvest, the annual toll stands at 10-15% (Meerburg et al., 2009; Belmain et al., 2015). Rodent population’s outbreaks and spread not only threaten the lives and property of local populations (Addink et al., 2010; Sage et al., 2017; Ocampo-Chavira et al., 2020) but also cause certain degrees of damage to steppe ecosystems (Du et al., 2022). Brandt’s vole (Lasiopodomys brandtii, BV) is widely distributed in the Russian Federation, central and eastern regions of Mongolia, and northeastern areas of China (Avirmed et al., 2016). They are commonly considered pests (especially in population outbreak years) as well as the dominant species causing rodent infestations in the Hulunbuir steppe (Yin et al., 2017). They breed seasonally and are highly social and gregarious; the population typically initiates its increase phase in early spring (April) each year, reaching its peak in early autumn (August). However, by late autumn, the BV’s population experiences a sharp decline, entering a period of crash, and stabilizes as it enters the early winter, marking its low phase (Shi et al., 2002; Andreassen et al., 2021). Driven by intrinsic and extrinsic factors, the periodicity of population outbreaks of this species is approximately every 3-14 years, also varying by region (Avirmed et al., 2016). A case in point is the Hulunbuir area, where there has been an outbreak every 3-5 years (Zhang et al., 2003). Therefore, it is one of several rodents species that need to be managed on Chinese steppes (Shi et al., 2002). In population outbreak years, the burrow number can reach 561600/km² (Zhong et al., 1999), which may expose approximately 870 m3/km² of underground soil directly to the surface and cause wind and water erosion, thereby further degrading and decertifying the pasture ecosystem (Zhong et al., 1999; Shi et al., 2002). During that same year, the population of BV was approximately 130,000/km². Each vole can consume up to 40 g of fresh grass daily, and a single BV population potentially consumes 15-44% of the total grass production (Zhong et al., 1999). Moreover, because their diet is similar to that of livestock, it further reduces agricultural economic benefits (Guiming et al., 1992). Furthermore, BV plays a crucial role as a significant repository and means of spreading Yersinia pestis, the pathogen responsible for the plague (Khan and Young, 2001; Addink et al., 2010; Tian, 2018). The most renowned plague is the Black Death, a cataclysmic epidemic that inflicted unparalleled destruction during the mid-14th century (Addink et al., 2010). Although certain regions of the world are no longer under threat from plague, it remains a significant and serious public health problem in Asia (Addink et al., 2010). In November 2019, in the typical steppe of Xilingol, Inner Mongolia, four cases of plague transmission caused by rodents were discovered (Li et al., 2021), leading to a certain degree of panic. Prior research has unequivocally indicated that rodent population outbreaks not only have significant impacts on the economy, ecology, and society but may also influence the political landscape (Singleton et al., 2010), and their population outbreaks tend to occur over extensive areas (Zhang et al., 2003; Bai et al., 2022). Therefore, it is necessary to identify efficient and accurate methods for monitoring the quantity and spatial distribution of BV to better understand its coupled stressors on the typical steppe ecosystem in Hulunbuir.
Traditional methods for detecting steppe rodent infestations, such as field surveys and marking techniques, are time-consuming, labor-intensive, and inefficient (Li et al., 2016; Wang et al., 2019a). Remote sensing has been considered an effective means to study potential information sources related to rodent infestations (Beck et al., 2000; Lu et al., 2022). In recent years, unmanned aerial vehicle (UAV) remote sensing technology in diverse domains of steppe ecosystems has advanced remarkably (Shi et al., 2021). The interpretation of UAV images has evolved from initial manual visual interpretation to human-computer interaction (including object-based classification and support vector machines) (Ma et al., 2017). While these advancements have shown certain improvements, they still face notable constraints in terms of efficiency and accuracy when compared to deep convolutional neural networks (Janiesch et al., 2021). Deep learning (DL), a subfield of machine learning (ML), has demonstrated impressive capabilities in identifying and extracting target objects from remote sensing images due to its automated deep convolutional feature extraction (Lecun et al., 2015; Jean et al., 2016; Li et al., 2019; Yeh et al., 2020). When integrated with UAV imagery, DL algorithms have shown great effectiveness in extracting small rodent burrows. For example, the detection of Levant vole (Microtus guentheri) burrows in alfalfa (Medicago sativa) fields was achieved with high reliability using You Only Look Once (YOLO)v3, showcasing its accuracy (Ezzy et al., 2021). Another study conducted in the steppe of Xilingol League, Inner Mongolia, China, utilized UAV imagery and DL methods to extract BV burrows, and Faster R-CNN and YOLOv4 yielded the most accurate results (Du et al., 2022). Despite the advantages of UAV remote sensing, such as its flexibility and high spatial resolution (Lyu et al., 2022), it still falls short of meeting the requirements of large-scale pest detection or is too costly for extensive pest monitoring. With advancements in satellite remote sensing technology, high-resolution satellite (HRS) imagery, which provides abundant information about land cover, spectral characteristics, and textures, has found widespread applications across various fields (Cheng and Han, 2016; Fu et al., 2017). In the field of pest detection, the application of two QuickBird imagery and the object-oriented analysis method enabled the automatic classification of great gerbil (Rhombomys opimus) burrow systems (burrow clusters) with user and producer accuracies reaching 60% and 86%, respectively (Addink et al., 2010). This pioneering research laid the groundwork for automating the mapping of rodent burrow clusters using HRS imagery. However, there is a lack of research that employs HRS imagery alongside advanced DL object detection techniques to identify burrow clusters of common steppe diminutive rodents such as BV or similar species. Therefore, to address the current research gap in the identification of pests and their burrow clusters on typical steppes, we employ two GF-2 satellite images and the Faster R-CNN model to perform object detection and comparative analysis of BV burrow clusters in the typical steppe of Hulunbuir, utilizing three distinct approaches: object-based image classification (OBIC), based on vegetation index classification (BVIC), and based on texture classification (BTC). Furthermore, this research has long-term advantages for promoting the sustainable development of typical steppe ecosystems and monitoring plague outbreaks.
2 Materials
2.1 Study area
The Hulunbuir steppe is situated in the northeastern part of Inner Mongolia, China, with geographic coordinates ranging from 115°31’ to 126°04’ east longitude and 47°05’ to 53°02’ north latitude. It shares borders with Mongolia and Russia and features an east-to-west sloping terrain, with elevations ranging from 650 to 700 m. The region exhibits a temperate continental climate and is classified as a semiarid area. It is influenced by dry and cold air masses from higher latitudes during winter and warm and humid air masses from lower latitudes during summer. This unique combination not only gives rise to distinct monsoonal climate characteristics but also renders the climate environment highly responsive to changes (Bao et al., 2012). The area experiences frequent droughts, mainly in the spring and summer seasons. The annual precipitation ranges from approximately 250 to 350 mm, with summer rainfall contributing to approximately 60-70% of the total precipitation throughout the year, and average annual temperature is approximately 2°C (Liu et al., 2021). Based on data from the MODIS MCD12Q1 product, the steppe area in the region covers approximately 101,288 km². Steppe coverage represents approximately 80% of the entire region (Figure 1). Consequently, the land in the Hulunbuir steppe is primarily used for grazing (Na et al., 2019). This research was primarily conducted in the southeastern region of New Barag Right Banner in Hulunbuir, an area that experienced a severe BV outbreak in 2021 (Table 1), making it one of the most heavily impacted areas.
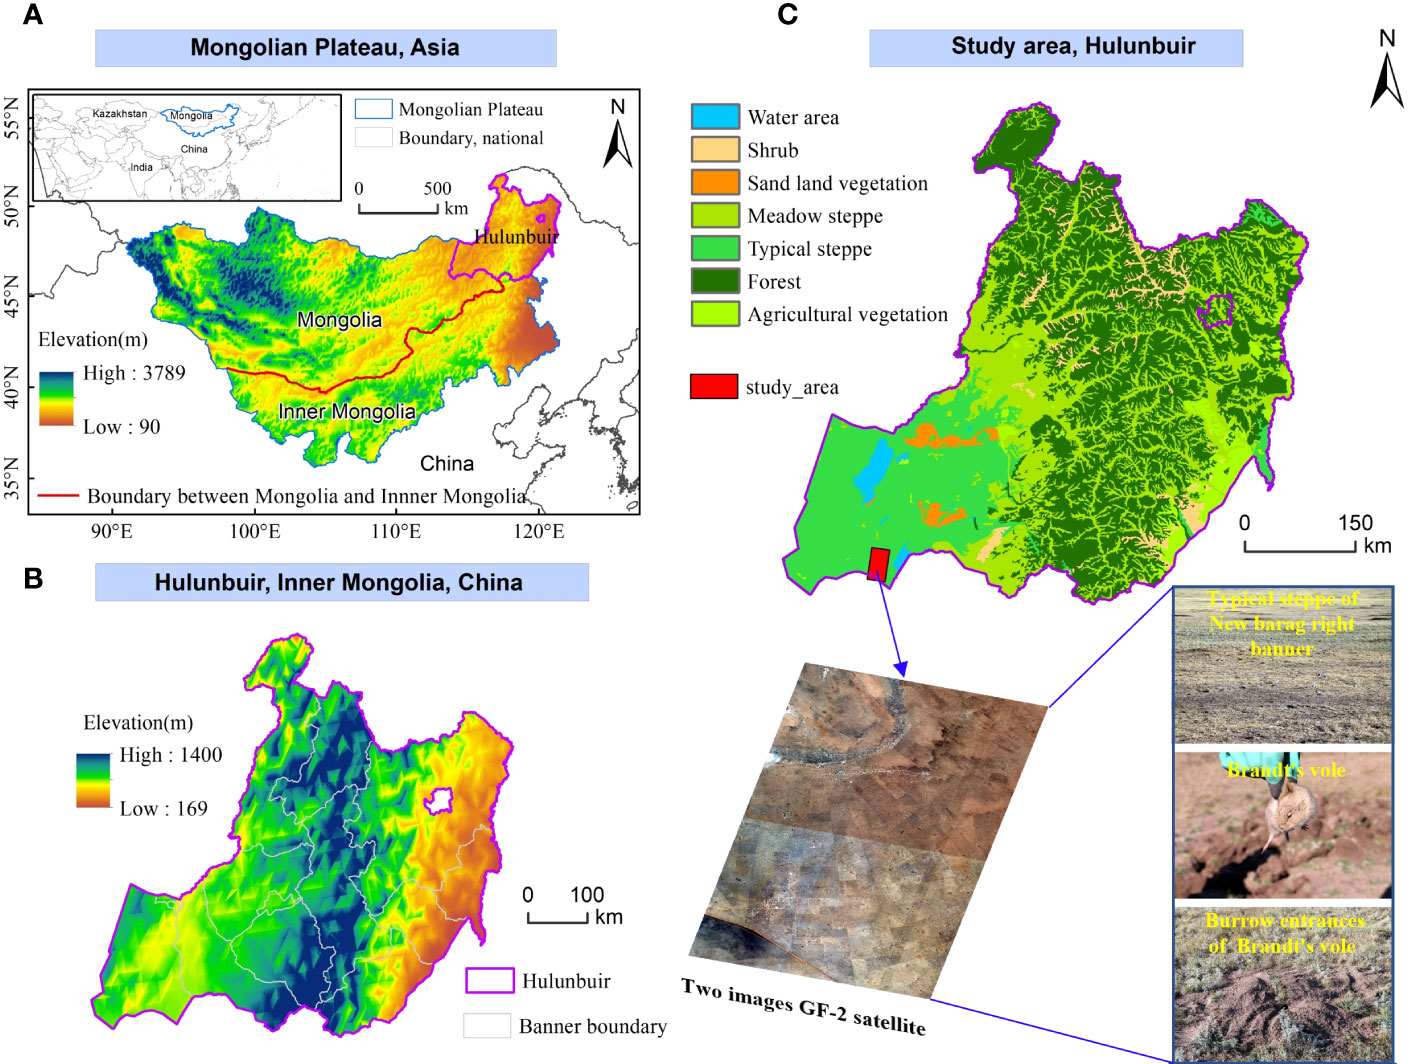
Figure 1 Location of the study area. (A) Location of the Mongolian Plateau and Hulunbuir, (B) Elevation of Hulunbuir, (C) Vegetation type map of Hulunbuir.
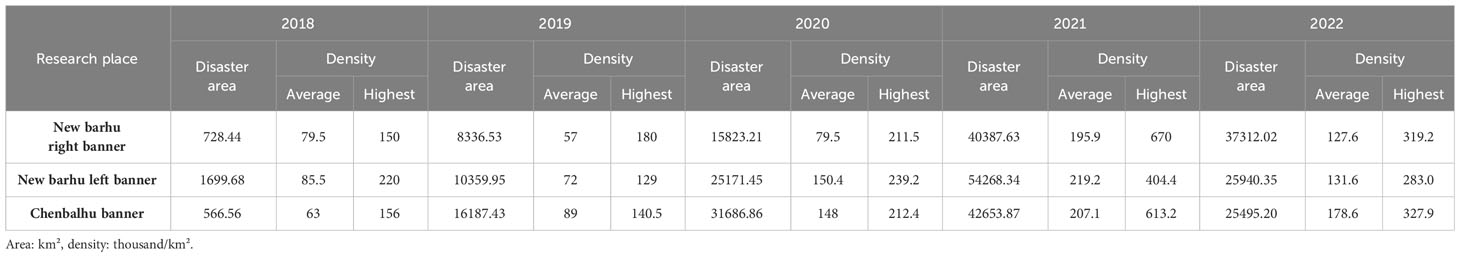
Table 1 Hulunbuir typical steppe Brandt’s vole disaster situation in the past five years.
2.2 Data
The two sets of GF-2 satellite image data were purchased from the Inner Mongolia autonomous region military-civilian integration development research center (http://219.159.12.25/cxxt/portalIndex, accessed on December 2022). The GF-2 satellite is China’s first civilian satellite with a ground sample distance below 1 m. It is equipped with PAN/MS cameras, where the former captures imagery at a spatial resolution of 0.8 m, and the latter collects four bands (R, G, B, and NIR) with a spatial resolution of 3.2 m each (Huang et al., 2018; Ren et al., 2020). To ensure consistent geographic and image conditions for identifying BV burrow clusters, two adjacent images from the same date were selected. These images were used to create Dataset 1 and Dataset 2 (Table 2). Furthermore, according to the China Rodent Information Network (http://www.chinarodent.com/, accessed on August 15, 2023) reports, over the past five years, the typical steppes of Hulunbuir have experienced cyclical population peaks in the BV population, with 2021 undeniably marking the year of the most severe population outbreak (Table 1, Figure 2). Additionally, according to research by Davis (Davis et al., 2008), the threshold for triggering plague outbreaks in rodent populations is determined by the density of occupied burrow clusters, which is the product of the occupancy rate (subject to temporal variations) and the density of burrow clusters (constant over time). This suggests that fluctuations in rodent burrow clusters density may explain the spatial variations in historical plague activity. Therefore, it is more reasonable to detect relatively stable BV burrow clusters by integrating HRS imagery with BV population characteristics (Addink et al., 2010). The choice of spring season holds significant ecological implications for predicting the BV population size in the current and upcoming years (Du et al., 2022).
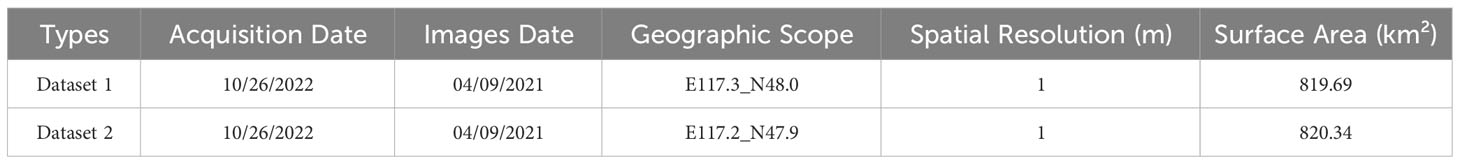
Table 2 Details of two GF-2 images.
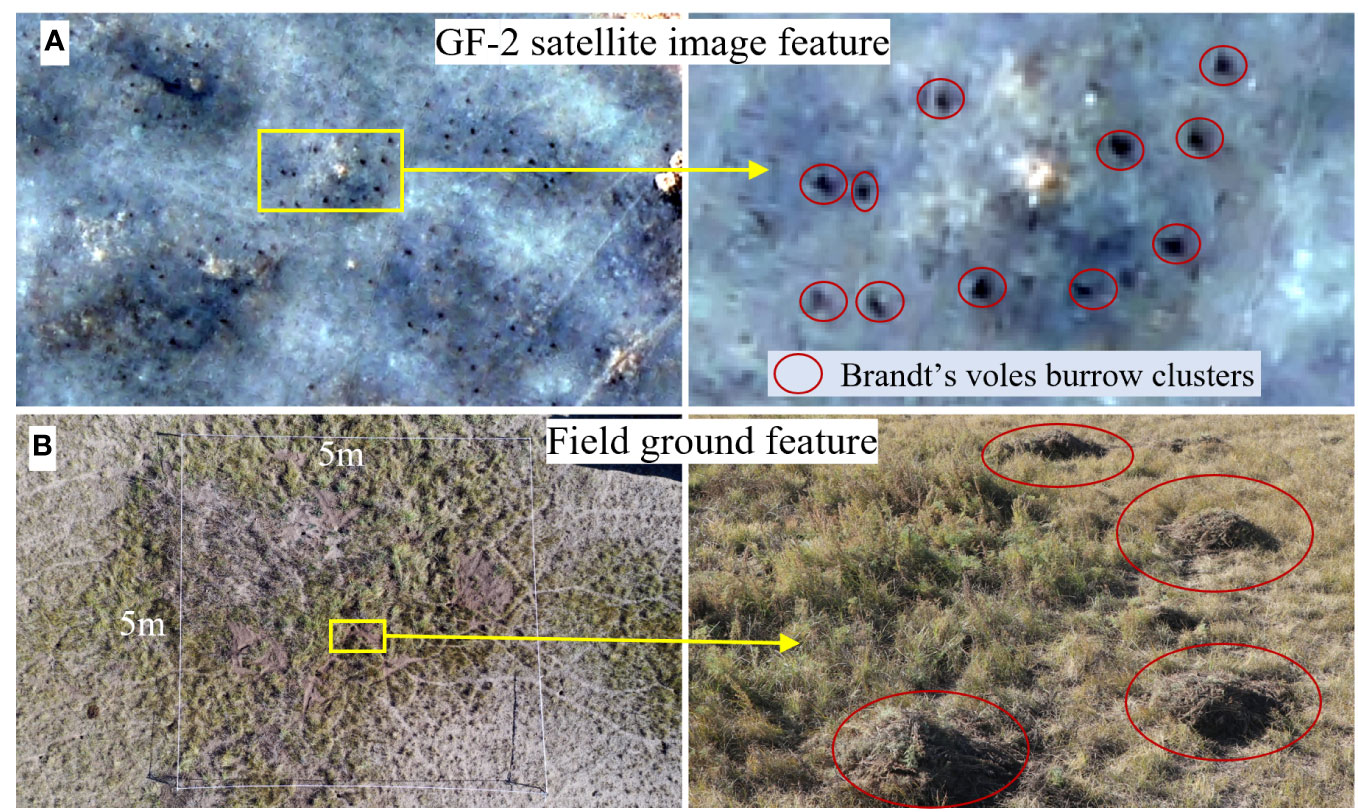
Figure 2 Characteristics of Brandt’s vole burrow clusters; (A) is the GF-2 satellite image feature, and (B) is the field ground feature of Brandt’s vole.
3 Methodology
The primary methodology employed in this study is supervised classification based on DL object detection. To efficiently and accurately detect BV burrow clusters, we trained the Faster R-CNN model, which is one of the most representative two-stage object detectors. Finally, we evaluated the accuracy and performance of this detector.
3.1 Data processing
To extract more abundant and accurate image information of BV burrow clusters from GF-2 satellite images, we employed the NNDiffuse fusion method to merge the panchromatic and multispectral bands of the two datasets. This fusion method demonstrated superior results in the comprehensive fusion of visible light bands compared to other approaches (PC, Gram−Schmidt, and HSV sharpening) (Zhang et al., 2018) (Figure 3). To enable the object detection detector and its backbone network to efficiently extract ground features of BV burrow clusters, we selected BV burrow clusters with higher clarity and distinct characteristics as ground truth boxes (GTBs). Dataset 1 and Dataset 2 were annotated with 25,000 and 26,520 GTBs, respectively. To determine the optimal classification method for identifying BV burrow clusters in the typical steppe of Hulunbuir, we adopted three different approaches. First, the object-based image classification (OBIC) method was used to detect BV burrow clusters directly from the preprocessed images. Second, the based on vegetation index classification (BVIC) method was employed to differentiate whether BV burrow clusters exhibited significant differences from the surrounding vegetation. For this purpose, the normalized difference vegetation index (NDVI) was calculated using the formula (Equation 1).
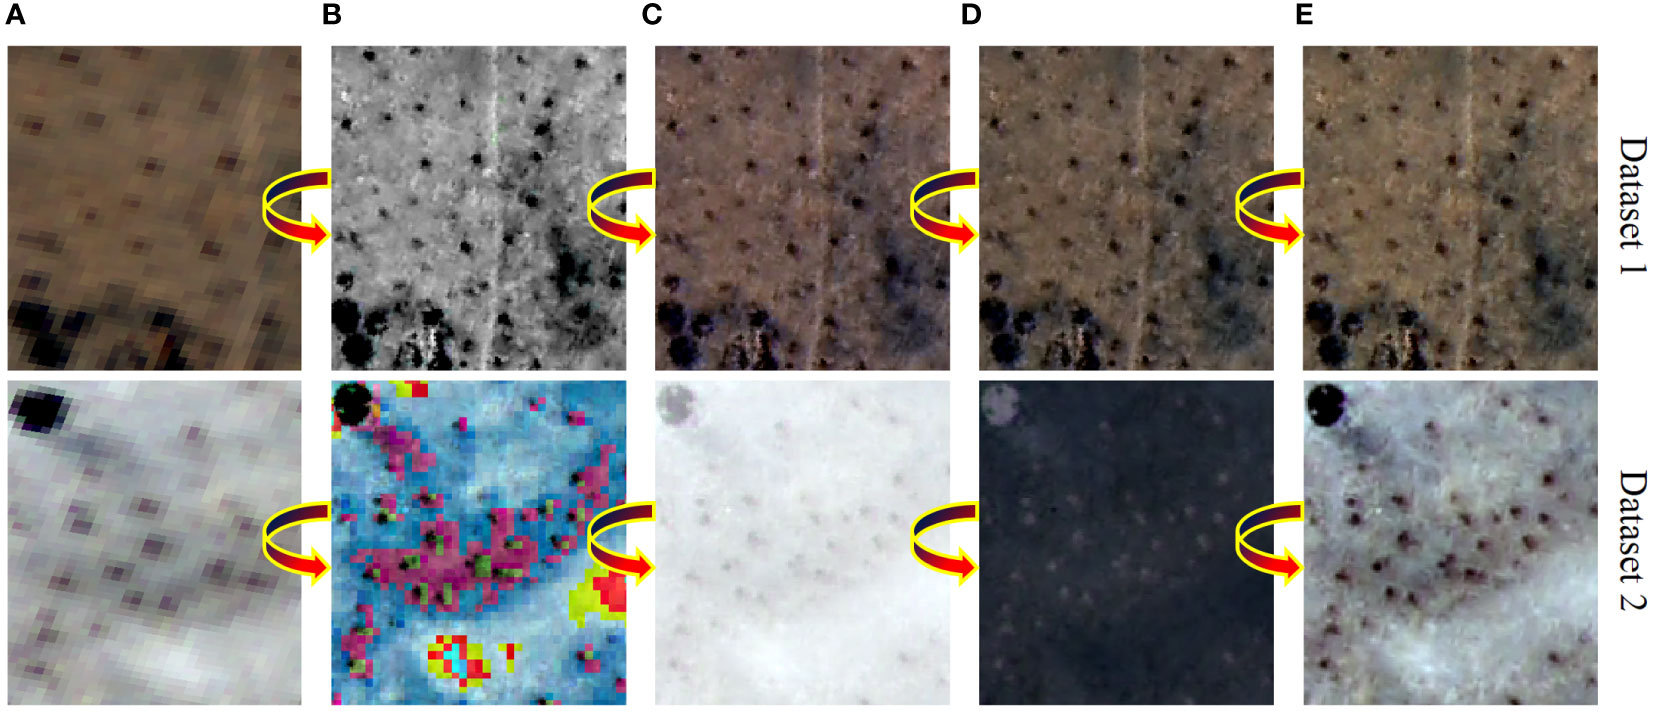
Figure 3 Effect comparison of different fusion methods for GF-2 satellite imagery; (A) GF-2 multispectral imagery (RGB), (B) HSV sharpening, (C) Gram−Schmidt pan sharpening, (D) PC spectral sharpening, (E) NNDiffuse pan sharpening.
where (near infrared) = band 4 and = band 3;
In the based on texture classification (BTC) method, texture information plays a crucial role in image analysis (Huang et al., 2014; Castelo-Cabay et al., 2022). Among statistical methods, gray-level co-occurrence matrices (GLCMs) serve as powerful texture descriptors in image analysis (Siqueira et al., 2013). We applied this method to compute the texture values of the two sets of images and conducted object detection.
3.2 Deep learning model
At present, one-stage and two-stage object detection networks are widely used. Although one-stage methods are significantly faster in terms of detection speed compared to two-stage methods, they often perform worse than the latter in terms of localization accuracy (Lin et al., 2017). The primary reason for this difference lies in the training process of the one-stage approach, where an imbalanced distribution between foreground (object) and background classes (e.g., 1:1000) hampers the model’s accuracy. On the other hand, two-stage approaches utilize a proposal-driven mechanism in the first stage to filter out a substantial number of negative samples (background), allowing for relatively accurate classification of each candidate box in the second stage (Lin et al., 2017). Considering these factors, to achieve precise and efficient identification of BV burrow clusters, we opted to abandon the one-stage object detection approach and focused our efforts on training the Faster R-CNN model, which will be detailed in the following sections.
3.2.1 Faster R-CNN network framework
Faster R-CNN is a well-known two-stage object detection method (Jiao et al., 2019). It is an improvement over the original R-CNN and Fast R-CNN approaches. R-CNN is a region-based CNN object detector that employs selective search to identify regions of interest (RoIs) and bounding boxes in each image. These regions are then refined and fed into a CNN network for feature extraction. Classification is performed using linear support vector machines (SVMs) specific to each class (Girshick et al., 2014).
Fast R-CNN (Girshick, 2015) is a faster variant of R-CNN, and it introduces several enhancements. First, the network extract features from the entire image and employs RoI pooling to obtain fixed-size features for subsequent fully connected layers. This approach saves time compared to R-CNN, which processes each region proposal separately. Second, Fast R-CNN combines classification and bounding box regression, enabling end-to-end training in a single stage. This contrasts with R-CNN, which involves multiple stages of training, fine-tuning, SVM classification, and bounding box regression. Softmax classification is used instead of multiple SVM classifiers and bounding box regressors as in R-CNN.
Faster R-CNN (Ren et al., 2015) represents an advancement over Fast R-CNN by introducing a region proposal network (RPN) in its first stage, which employs a fully convolutional network instead of the selective search method. The RPN efficiently predicts region proposals with varying scales and aspect ratios, significantly expediting the region proposal generation process by sharing full-image convolutional features and convolutional layers with the detection network. Moreover, Faster R-CNN introduces the concept of multiscale anchors to detect objects of different sizes, streamlining the region proposal generation without requiring multiscale images and features as input. In the output feature layer of the last shared convolutional layer, a fixed-size sliding window (3×3) is applied, where the center of the window corresponds to a point in the original input image. The anchor boxes are defined in the original paper with three different scales and three different aspect ratios, resulting in a total of nine anchor boxes. For a W×H convolutional feature map, the anchor box set is of size W×H×k, comprising positive (foreground) and negative (background) samples. However, this leads to the notorious issue of positive and negative samples being extremely unbalanced, which can overwhelm the model accuracy. To address this problem, the RPN network randomly selects positive and negative samples according to a 1:1 ratio to create a mini-batch. The region proposals are then generated by comparing these samples against the GTBs for each object. The bounding box classification layer (cls) of the RPN produces 2×k scores, evaluating the probability of each proposal being an object (foreground) or background. A regression layer predicts 4×k coordinates for the k boxes (center point, width, and height). The loss function for this network is as follows (Equation 2):
where is the index of an anchor in a mini-batch and represents the probability of anchor being an object. is the ground truth label, where indicates a positive anchor and 0 indicates otherwise. denotes the logarithmic loss for object and nonobject categories. To calculate the regression loss, we employ the function , where refers to the S smooth L1 function. The regression loss, , is exclusively applied to positive samples for bounding box regression. Here, represents the vector that represents the predicted bounding box, while corresponds to the ground truth bounding box associated with the positive anchor. and denote the mini-batch size and the number of anchor locations, respectively. The parameter is utilized to balance the different terms within the loss function.
In the second stage of the Faster R-CNN network, ROI pooling is applied, followed by softmax-based classification, which is consistent with the approach used in Fast R-CNN. The accurate localization and precise classification of objects heavily rely on the efficient extraction of target features from the input image. To effectively extract the features of BV burrow clusters, this study employs the feature pyramid network (FPN) based on the ResNet architecture (Figure 4) as the feature extraction network in the Faster R-CNN framework. The FPN improves upon the VGG network mentioned in the original paper by enhancing the top-down pathway and lateral connections in the convolutional network. Additionally, FPN enables the construction of a rich, multiscale feature pyramid using a single-resolution input image (Lin et al., 2017). With a deeper network and easier-to-optimize depth residual modules compared to VGG, FPN has demonstrated excellent performance on the ImageNet classification dataset while maintaining a lower complexity (He et al., 2016). Finally, the nonmaximum suppression (NMS) algorithm is added at the end of the model to effectively eliminate redundant detections of objects in overlapping regions (Neubeck and Van Gool, 2006).
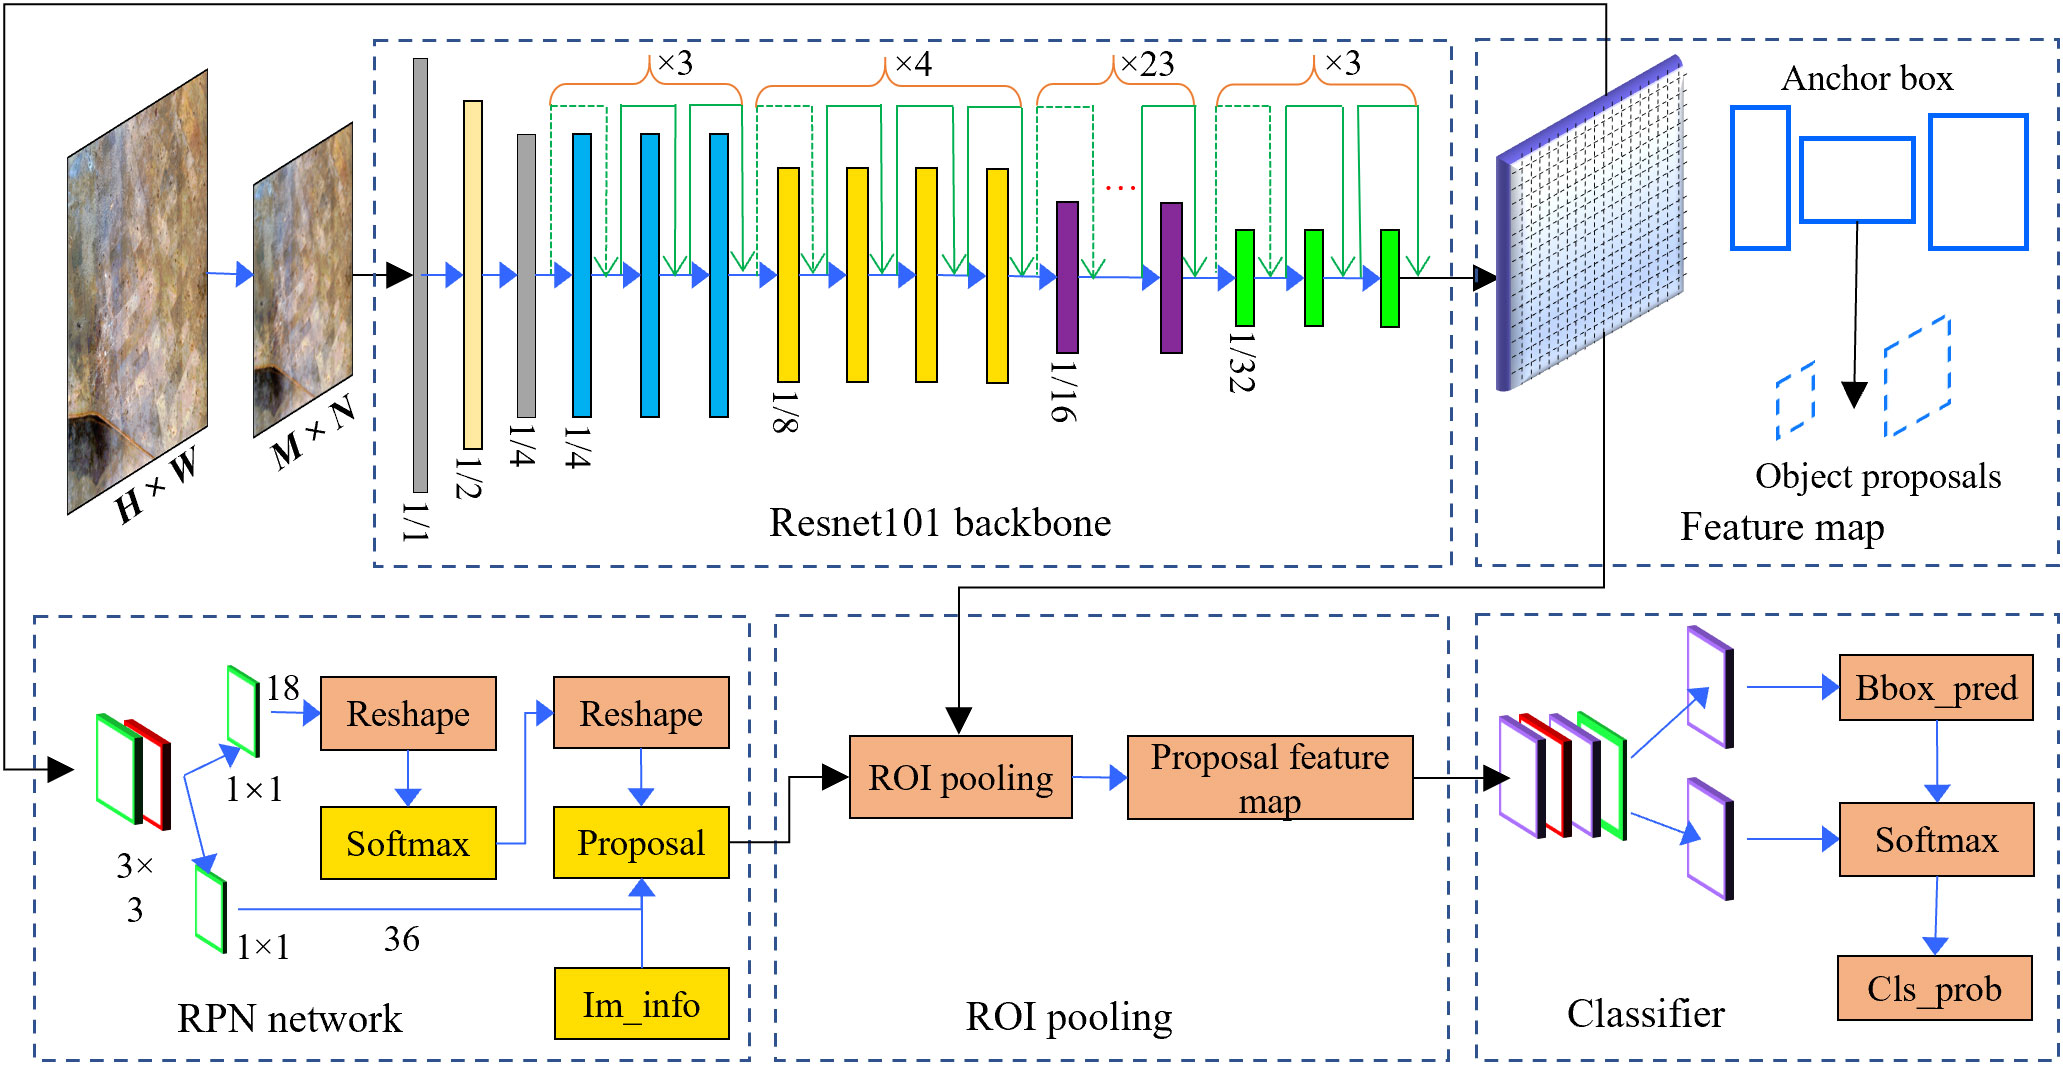
Figure 4 Faster R-CNN architecture using ResNet101 as the backbone network.
3.3 Parameter settings
During the training process of the Faster R-CNN network, the hyperparameters including batch size, learning rate, and number of epochs, were fine-tuned to optimize the network’s performance. The stochastic gradient descent (SGD) algorithm was utilized to expedite the network’s convergence. The optimal values for these hyperparameters can be found in Table 3. For both sets of datasets, the images were resized to 256×256 to train the network, with 90% of the data allocated for training and the remaining 10% allocated for validation. Additionally, data augmentation techniques such as horizontal rotation were applied to enhance the training dataset. This study was implemented on the PyTorch platform using an Intel(R) Core (TM) i7-8700 CPU processor, 16 GB of RAM, and an NVIDIA GeForce RTX2060 GPU.
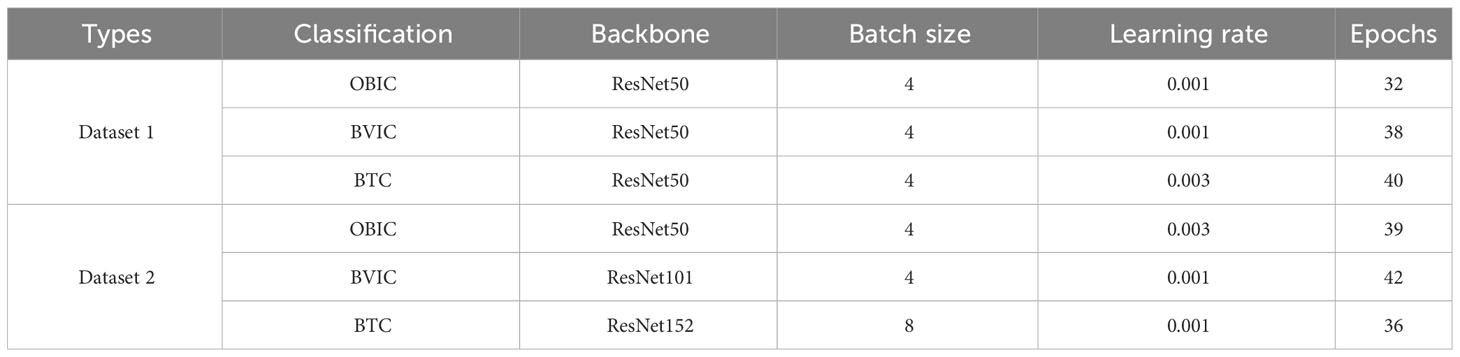
Table 3 Faster R-CNN model hyperparameter settings.
3.4 Model validation
The two most commonly used performance metrics in object detection tasks are average precision (AP) and F1 score (Alganci et al., 2020). True positive (TP) refers to the number of correctly detected objects, false positive (FP) refers to the number of missed objects, and false negative (FN) refers to the number of falsely detected objects. During the training process, the detector compares the detected objects (predicted bounding boxes) with the GTBs using the intersection over union (IoU) at each iteration and updates its parameters accordingly. It is widely accepted that an IoU >= 0.5 indicates that a predicted bounding box overlaps with the GTBs by at least 50% and is considered a correct prediction (Alganci et al., 2020). In this study, the threshold value for IoU was set to 0.5 for both datasets. Precision represents the proportion of correctly matched objects among all objects detected as matches (Equation 3), while recall represents the ratio of correctly detected objects to the total number of ground truth samples (Equation 4):
While precision and recall are valuable metrics, they individually do not provide a comprehensive assessment of a detector’s performance (Alganci et al., 2020). However, their harmonic mean, known as the F1 score, offers a more robust measure of the detector’s effectiveness. The F1 score is computed using the formula depicted in Equation (5):
The average precision (AP) represents the area under the precision-recall curve, offering a visual assessment of the network’s accuracy in detecting individual objects. It is calculated as in Equation (6):
4 Results
4.1 Model accuracy evaluation
In this study, we employed the Faster R-CNN model and ResNet backbone network with different convolutional layers, which are representative models of two-stage object detectors, to detect BV burrow clusters in the typical steppe of Hulunbuir using GF-2 imagery. As this study focused solely on identifying BV burrow clusters as the target object, we only calculated precision, recall, F1 score, and AP at the IoU = 0.5 threshold for both sets of datasets. Table 4; Figure 5 show that both Dataset 1 and Dataset 2 achieved the highest precision, recall, F1 scores, and AP values when the OBIC method was applied. Regarding texture filtering, eight values, including mean, variance, homogeneity, correlation, dissimilarity, entropy, second, and correlation, were computed for each dataset, and BV burrow cluster identification was performed individually. It was found that the mean feature offered the highest recognition accuracy, resulting in an AP value of 55.5% for Dataset 1 and 56.4% for Dataset 2. The precision, recall, and F1 scores also provided the second-highest values. On the other hand, the BVIC method yielded the poorest recognition results, with AP of only 30.2% for Dataset 1 and 28.7% for Dataset 2. Notably, the recall value was particularly low, indicating that the Faster R-CNN model failed to detect the increased signs of the target object in BVIC recognition.
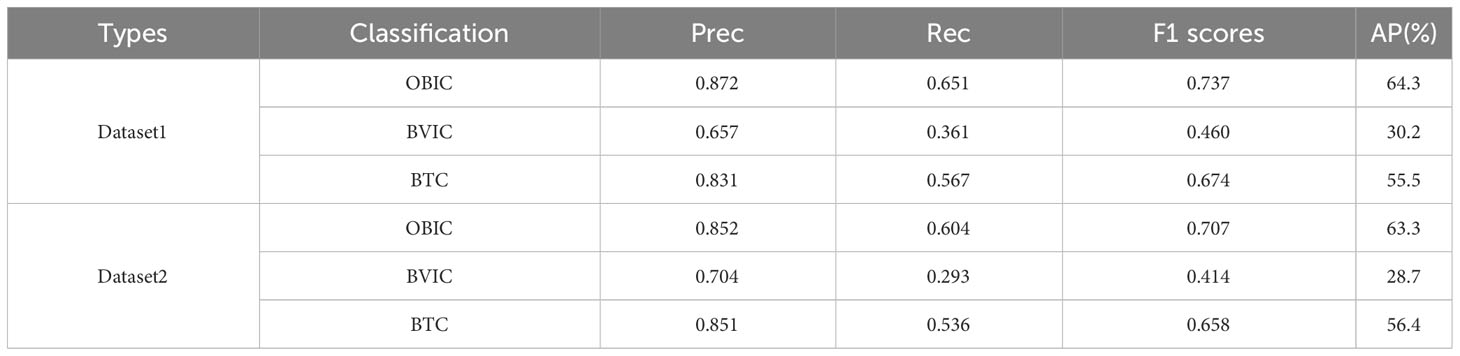
Table 4 Precision, recall, F1 scores and average precision score of all datasets.
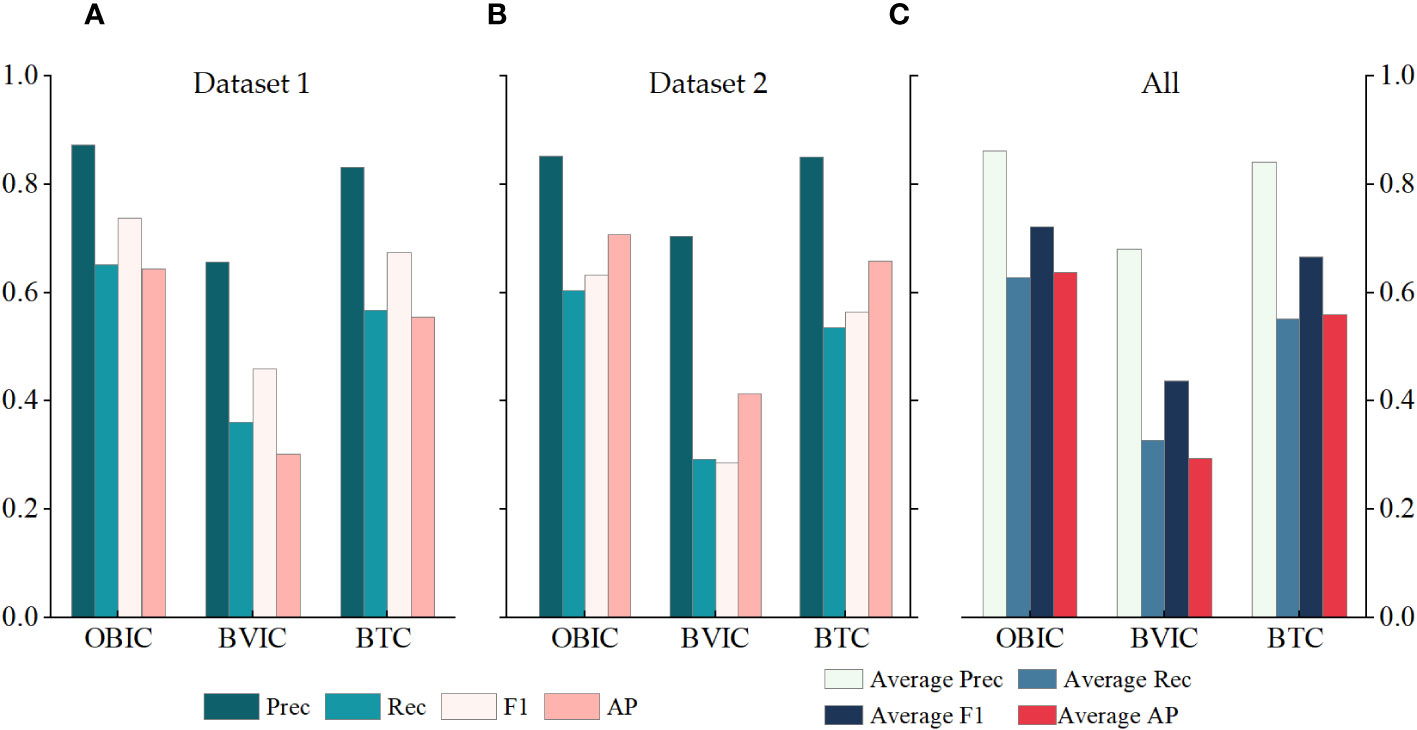
Figure 5 Graphical representation of the precision, recall, F1 scores, and AP.
To conclude, the research conducted on BV burrow cluster detection using the Faster R-CNN model and three classification methods on two datasets showed that the OBIC method achieved the highest average AP value (63.80%). The BTC method obtained the second-highest average AP value (55.95%), while the BVIC method yielded the lowest average AP value (29.45%) in this study. These findings indicate that the OBIC approach outperforms the BTC and BVIC methods in recognizing BV burrow clusters using the Faster R-CNN model on the two datasets.
4.2 Visual evaluation
To provide a more intuitive assessment of the Faster R-CNN algorithm’s performance, a visual inspection was conducted on the detection results of Dataset 1 and Dataset 2. Based on the partial results shown in Figures 6, 7, both datasets achieved relatively high recognition accuracy in OBIC detection. Upon analyzing the visual effects, the Faster R-CNN model successfully detected and recognized BV burrow clusters with clear image features, with only few burrow clusters with less distinct features being missed. In BTC detection, the Faster R-CNN model also performed well in detecting BV burrow clusters with obvious image features. However, compared to the OBIC method, the Faster R-CNN model not only missed more clusters with less distinct image features but also misclassified some livestock enclosures in residential areas as BV burrow clusters (Figure 7). In contrast, BVIC recognition yielded the poorest detection results in this study. From a visual standpoint, the BV burrow clusters exhibited significant variations in size, illumination, and background complexity, which posed challenges for the Faster R-CNN model and its backbone network in effectively extracting the distinctive features of BV burrow clusters.
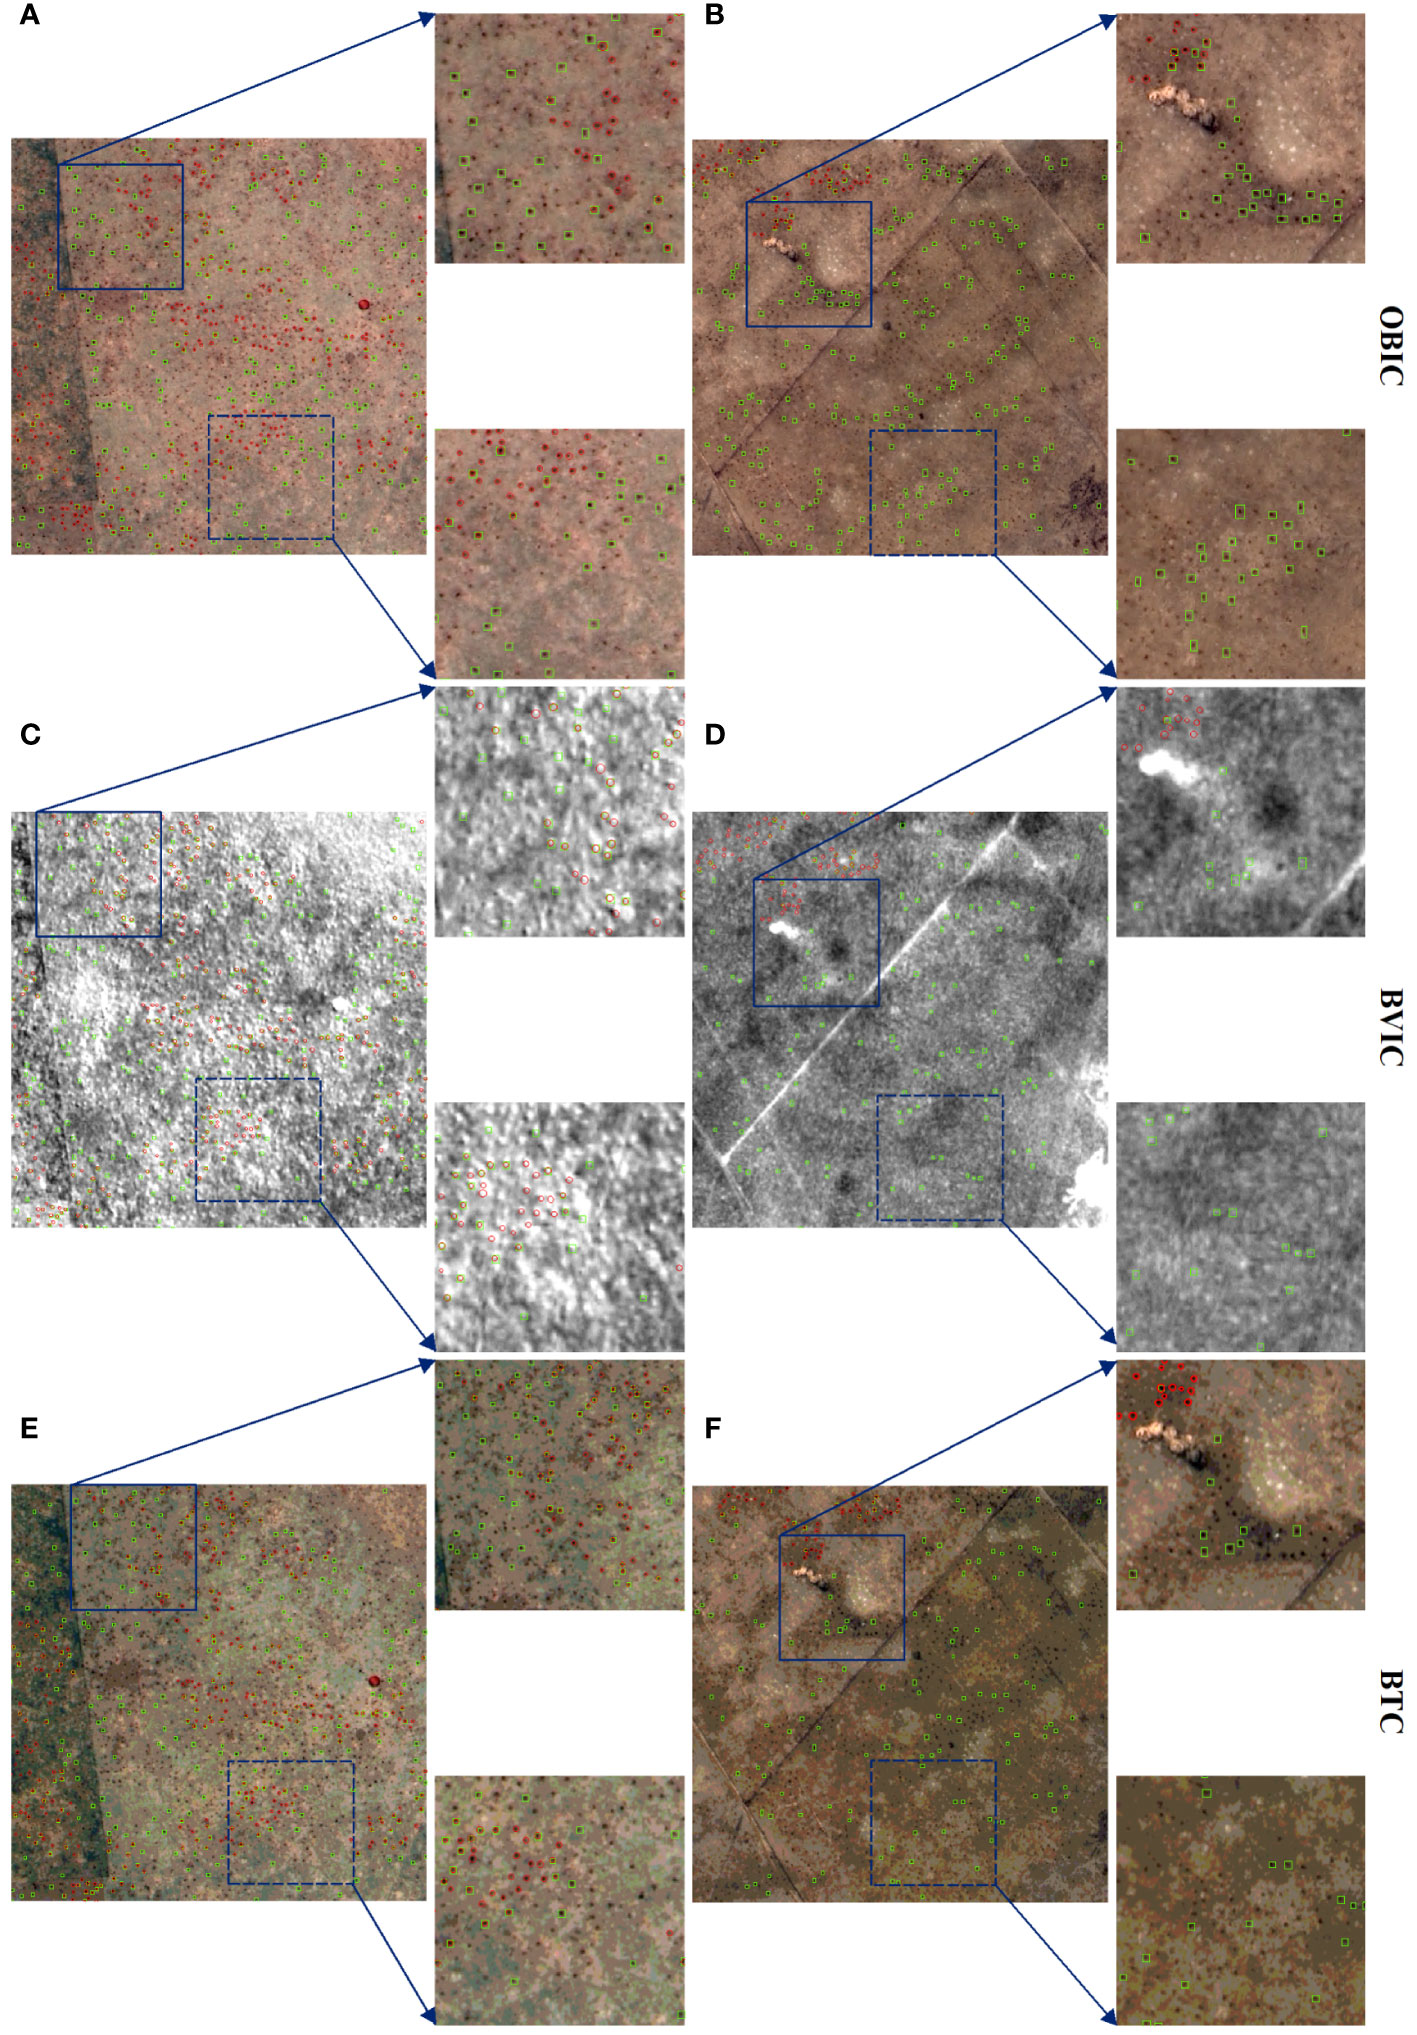
Figure 6 Comparative analysis of Brandt’s vole burrow cluster detection results using different classification methods in Dataset 1. (A, B) OBIC; (C, D) BVIC; (E, F) BTC visual effect maps. Note: Red indicates GTBs, while green represents prediction boxes, consistent with Figure 7.
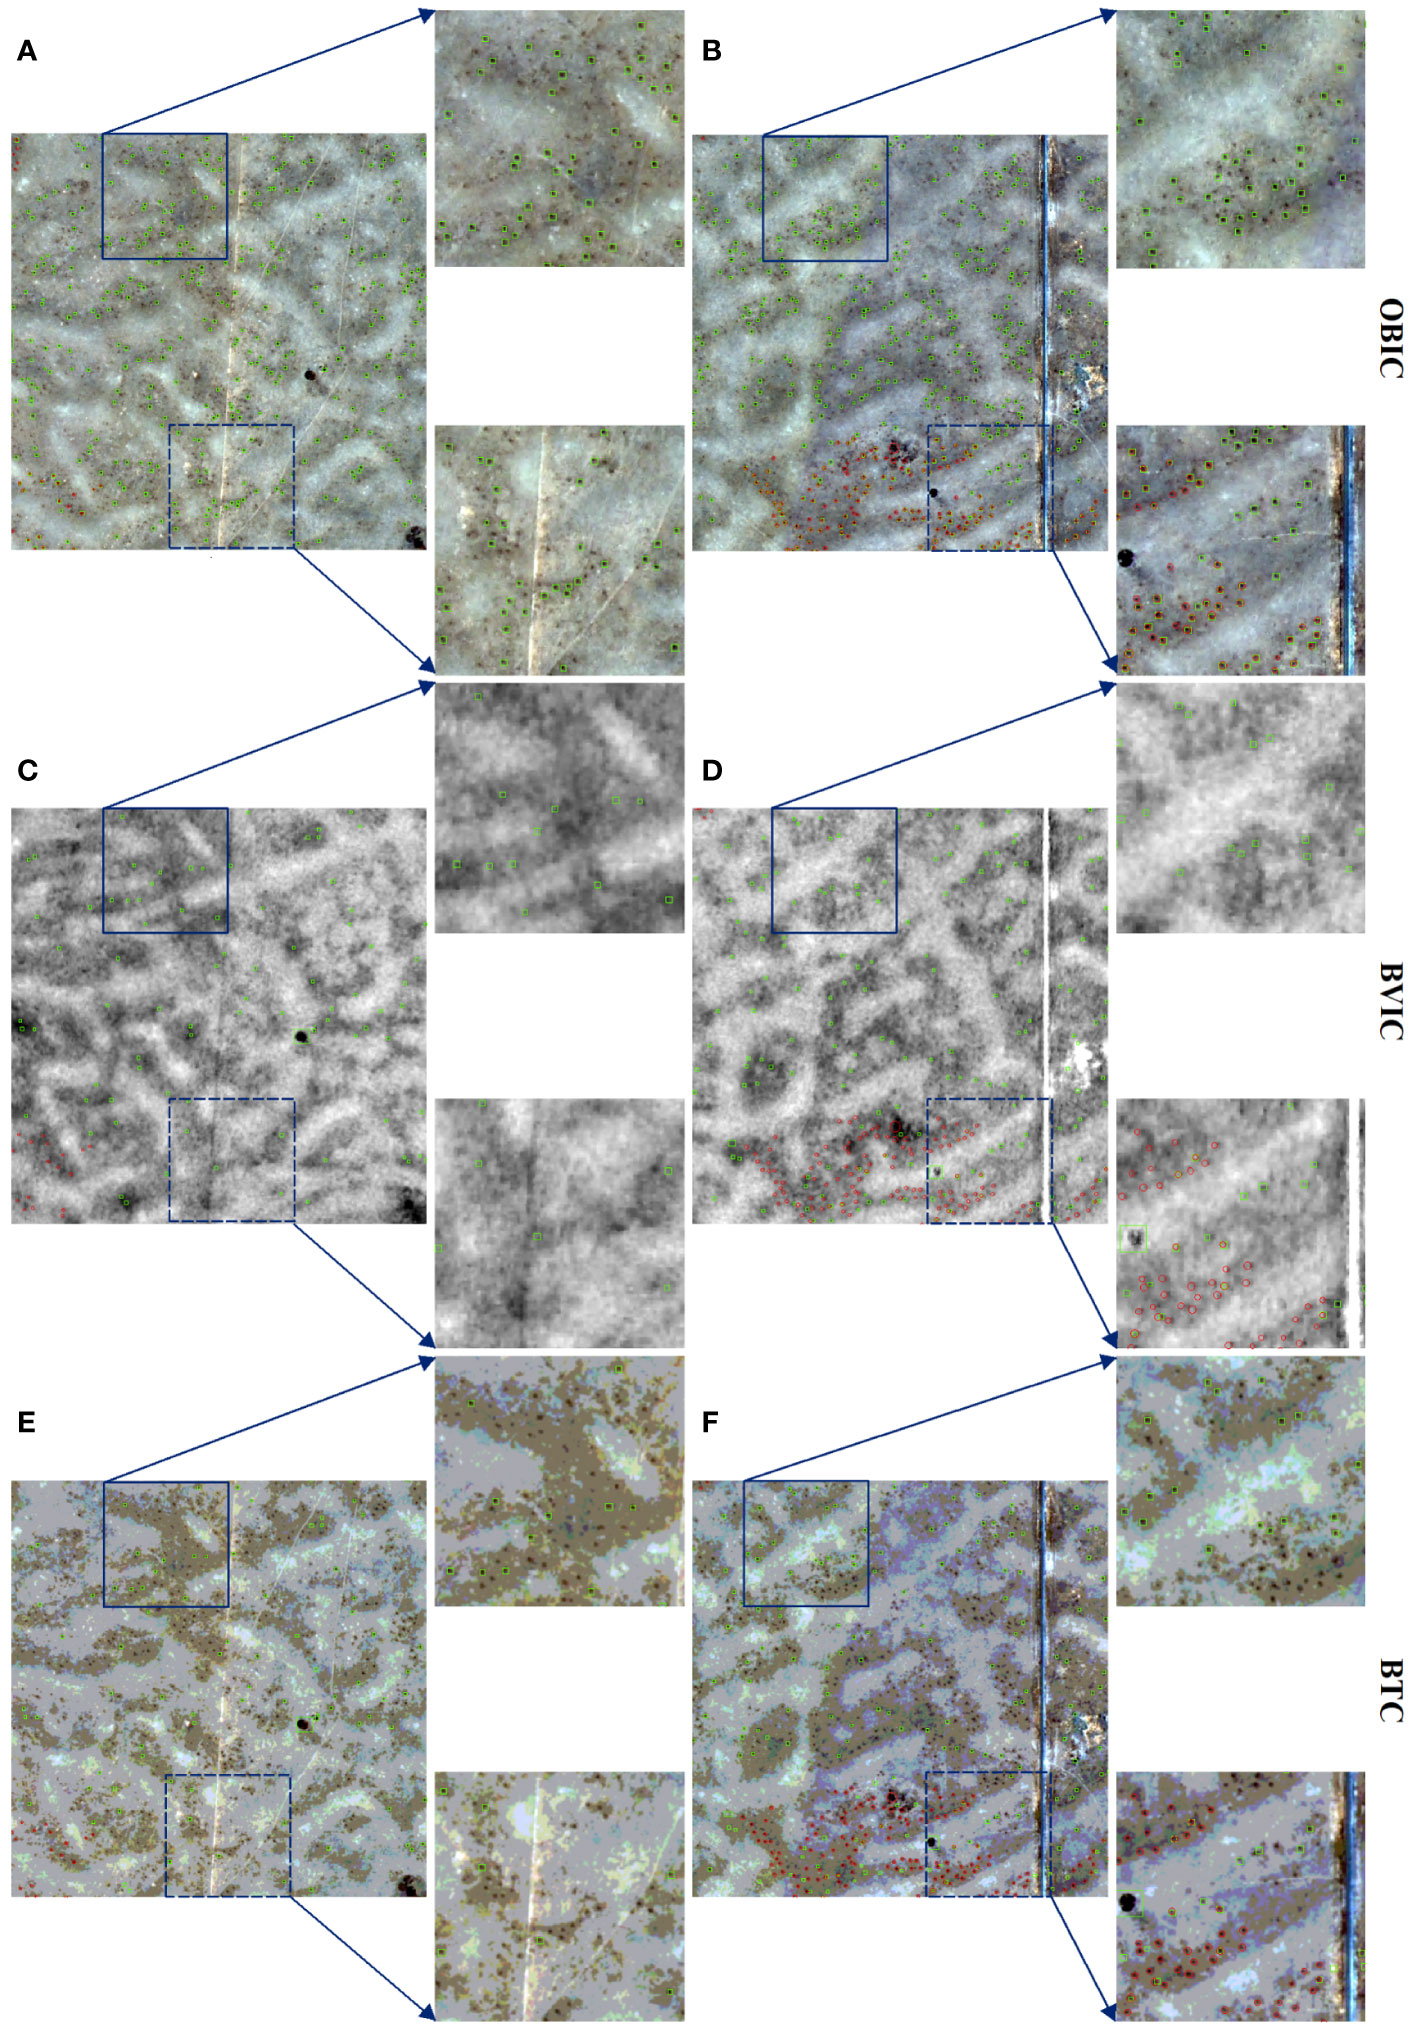
Figure 7 Comparative analysis of Brandt’s vole burrow cluster detection results using different classification methods in Dataset 2. (A, B) OBIC; (C, D) BVIC; (E, F) BTC visual effect maps.
In summary, the visual inspection of the detection results highlights that the Faster R-CNN algorithm achieved higher recognition accuracy when employing the OBIC detection method on both Dataset 1 and Dataset 2. While BTC detection also showed positive outcomes, it had certain limitations compared to the OBIC approach. On the other hand, BVIC detection performed poorly due to the diverse and challenging characteristics of BV burrow clusters, impeding the model’s ability to accurately identify them.
5 Discussion
Rodents pose a significant threat not only to global food security but also endanger human lives around the world (Stenseth et al., 2003). In the Asian region alone, approximately 200 million people lose their food supply annually due to rodent invasions (Singleton and Brown, 2003). During occasional years of rodent outbreaks, the impact on food security becomes even more pronounced (Singleton et al., 2010). In the typical steppe areas of Hulunbuir, outbreaks of BV can result in approximately 15-44% total grass yield loss during affected years (Zhong et al., 1999). Based on data from the China Rodent Information Network, the average BV population density in Hulunbuir steppe (Table 1) showed a significant rise from 150,000/km² in 2018 to 670,000/km² by late 2021, followed by a decline to 127,600/km² in 2022. In the same year (2021), the Inner Mongolia government allocated approximately 1 million USD to restore ecological damage to the Hulunbuir steppe caused by BV, sand rats (Rhombomys opimus), and zokor(Myospalax fontanieri Milne)(source: http://grassland.china.com.cn/).Therefore, 2021 was the most severe year of BV population outbreak in the Hulunbuir steppe in the past five years. From the disaster areas and several previous studies have further corroborated that BV populations tend to erupt over broader spatial extents (Shi et al., 2002; Zhang et al., 2003; Andreassen et al., 2021). Consequently, HRS remote sensing imagery, as opposed to UAV imagery, is evidently better suited for detecting BV burrow clusters, which was the primary motivation behind this research. To our knowledge, this is the first study to detect BV burrow clusters in a land area exceeding 1000 km² using three different classification methods (OBIC, BVIC, and BTC) in conjunction with the Faster R-CNN model in a typical steppe. From the results, it is evident that OBIC delivers the highest precision, with average AP and F1 scores of 63.80% and 0.722, respectively, across the two datasets (Figure 5). In this classification method, the Faster R-CNN model comprehensively detected areas with more prominent BV burrow cluster features (Figures 6, 7), omitting only BV burrow clusters where image features were less distinct. The second-highest accuracy was provided by BTC, with average AP and F1 scores of 55.95% and 0.666, respectively, across the two datasets (Figure 5). In this method, the CLCM algorithm was used to apply a mean filter to the two datasets to reduce noise and enhance image smoothness. Although this approach successfully mitigated the issue of abrupt image transitions, it inadvertently blurred the edges of burrow clusters (Ryherd and Woodcock, 1996), making it challenging for the Faster R-CNN model and the ResNet backbone network to extract the target object features and filter out some BV burrow clusters with less distinctive image features. This is probably the underlying cause of BTC’s inferior detection accuracy when compared to OBIC. Nonetheless, within this classification approach, the Faster R-CNN network achieved precise localization of BV burrow clusters. This is attributed to BTC retaining BV burrow clusters with prominent feature influence. Conversely, the BVIC method exhibited the lowest precision; across the two datasets, it only reached an average AP of 29.45% and an F1 score of 0.437. The main factor behind this outcome is that during the early spring each year, the vegetation in Hulunbuir Grassland has not yet turned green (Wang et al., 2019b). Consequently, there were no significant feature differences in the NDVI values of the two datasets and the bare soil surrounding BV burrow clusters in the satellite imagery. This posed challenges for the detection network’s generalization and learning processes, resulting in the observed outcome. The BVs in the typical steppe of Hulunbuir start their increase period each year in the spring. Therefore, the population size of BV in April serves as the foundational population size for the year and is also the preferred time for managing this species (Du et al., 2022). Consequently, detecting the density of BV burrow clusters in spring is of utmost importance. However, this precisely resulted in the lowest detection accuracy of BVIC. In the summertime, even though the visual distinctions between the vegetation and the bare soil surrounding BV burrow clusters become more evident, the population of this species reaches its peak phase (Du et al., 2022). As autumn approaches, a crash phase ensues, leading to considerable fluctuations in population density that pose challenges to the accurate assessment of the BV population. Up to late autumn, the population of this species starts to stabilize (low hase), and the BV individuals who survive are termed overwintering voles, serving as the foundation for the population’s growth in the following year(Xinrong et al., 2006). Therefore, it is possible to consider image data from autumn when vegetation has not yet turned yellow. This may enhance the detection accuracy of BVIC for BV burrow clusters. Concerning BV population outbreaks, the frequency of BV population fluctuations differs due to a combination of internal and external factors (Bai et al., 2022). Internal factors usually pertain to the underlying mechanisms that regulate the BV population, resulting in cyclic outbreaks approximately every 3-5 years (Shi et al., 2002; Avirmed et al., 2016). External factors primarily involve how BV population numbers and spatial distribution respond to climate change and human activities (Zhang et al., 2003; Bai et al., 2022). As indicated in the research conducted by Zhong, W et al (Zhong et al., 1999), it was revealed that the excessive grazing of livestock resulted in the population outbreak of BV. The research conducted by Zhang, Z et al. explicitly highlights that the population outbreaks of BV take place over a wide geographical range, potentially as a result of climate changes on a broader regional level (Zhang et al., 2003). Moreover, the research conducted by Bai, D et al. (Bai et al., 2022) also presented a substantiation of alterations in the distribution range of BV populations due to the impact of climate change and human intervention pressures. Although previous research by scholars has to some degree offered substantial insights into the factors driving BV population outbreaks and alterations in spatial distribution, there remains a gap in our understanding regarding the impact of diverse administrative units (Mongolia and China) and cultural contexts on BV population fluctuation cycles and spatial distribution changes within the same climatic conditions. Addressing this gap will be the primary objective of the author’s future work.
The Faster R-CNN model is a representative example of a two-stage object detector (Ren et al., 2015). It is built upon the RPN, which effectively predicts region proposals with a wide range of scales and aspect ratios (Jiao et al., 2019). While it offers a 10-fold improvement in detection speed compared to its previous version Fast R-CNN (Girshick, 2015), it is still slower than single-stage object detection methods, particularly when dealing with large datasets. In our study, the three classification methods needed over 10 hours from model training to target object detection, and the average detection speed of the network was only approximately 5 frames per second (fps). Considering this, we trained several models using representative single-stage object detectors, such as SSD (Liu et al., 2016), YOLOv3 (Redmon and Farhadi, 2018), and RetinaNet (Lin et al., 2017). Although these single-stage object detection models addressed the speed issue, the detection accuracy in both datasets fell below acceptable levels. As a result, the author chose to prioritize enhanced detection accuracy over time constraints and implemented the Faster R-CNN network. Regarding the backbone network, various convolutional layers of the ResNet network were utilized as feature extractors. This network introduced the identity shortcut to bypass residual blocks and obtain features. While this step effectively improved the efficiency and accuracy when deepening the network, it may limit the network’s expressive power (Zagoruyko and Komodakis, 2016). DenseNet can mitigate this problem by utilizing multilayer feature connections, but it requires more GPU memory and a longer training time (Zhang et al., 2021). However, DSNet combines the advantages of the aforementioned backbone networks, making it a potential option for future research (Zhang et al., 2021).
This study focuses on the detection of BV burrow clusters in the typical steppe of Hulunbuir using HRS imagery in combination with the Faster R-CNN model. While the results have shown satisfactory recognition accuracy, various factors contribute to uncertainties in the detection process. First, in the natural steppe environment, several challenging factors can lead to misclassification by the detector. These include the presence of livestock enclosures, variations in the sizes of BV burrow clusters, the occurrence of shadows, and the nonuniformity of the imagery with areas of varying brightness and darkness. Consequently, developing a segmentation algorithm capable of accurately handling these environmental factors and optimizing the parameters for different scenarios is a crucial future trend in geographic object-based image analysis (GEOBIA) (Cheng and Han, 2016). Moreover, the current pixel units predominantly have a square shape, which presents a challenge when trying to match them with circular entities found in the natural world. In contrast, hexagonal pixels are more effective in representing surface entities on Earth (Sahr et al., 2013). For example, a study conducted on WorldView-2 satellite imagery revealed that a hexagonal pixel-based multiresolution segmentation (MSR) approach outperformed the traditional square pixel-based MSR in segmenting a football field and yielded superior results (Hofmann and Tiede, 2014). Although the adoption of hexagonal pixels in current satellite sensors is limited, recognizing their potential as a future trend could lead to more accurate and efficient detection and recognition of objects in remote sensing imagery. Finally, while DL techniques have shown great promise in identifying and detecting target objects efficiently and accurately, they typically require a significant number of labeled samples for training. In this study, 51,520 GTB annotations were manually labeled in the two datasets. This process was time-consuming and labor-intensive and demanded a certain level of expertise. To address this limitation, future research directions could focus on the development of techniques for extracting useful information from remote sensing images with limited labeled samples. Additionally, exploring semisupervised or unsupervised classification methods could allow for more cost-effective and scalable approaches to object extraction in remote sensing imagery (Lecun et al., 2015).
6 Conclusions
In this study, we conducted a BV burrow cluster object detection method for a typical steppe of Hulunbuir using two sets of GF-2 satellite images. The Faster R-CNN model was employed, and three different methods were explored: OBIC, BVIC, and BTC.
From an overall perspective, the Faster R-CNN model demonstrated the best robustness in detecting BV burrow clusters using the OBIC method, achieving an average AP of 63.80% and an F1 score of 0.722. Visual analysis confirmed that the Faster R-CNN model successfully detected and predicted BV burrow clusters with prominent features in both datasets, with only a few instances where targets with features less distinguishable from the background were missed. Therefore, with optimized parameters, Faster R-CNN excels in convergence capability when applied to the OBIC method. The BTC method provided the second-highest accuracy, with average AP and F1 scores reaching 55.95% and 0.666, respectively. Visual analysis revealed that the Faster R-CNN model comprehensively detected and recognized BV burrow clusters with distinct features from the background in this classification method, yet it missed several targets with less distinguishable features and misclassified some livestock enclosures. The detection network in this method may be affected by object size and diversity imbalance, but it performed well in target localization. The poorest results were observed in the BVIC method, with average AP and F1 scores only reaching 29.45% and 0.437, respectively. This outcome can be attributed to the fact that the steppe of Hulunbuir studied here not only has a high latitude but is also a semiarid region. In early spring (April), the surface vegetation in this area has not fully regrown, and the bare soil features of BV burrow clusters could not be clearly distinguished from the surrounding vegetation in the imagery. This made the model’s generalization and learning processes challenging, resulting in an average recall rate of only 0.3270 (Figure 5).
Typically, conventional poison-baiting methods have been utilized to manage BV populations in Hulunbuir’s typical steppes. While this approach effectively reduces BV population density, it often results in secondary poisoning of BV predators and chemical contamination of the ecosystem (Zhong et al., 1999). Additionally, small rodent population outbreaks often occur over large spatial extents (Zhang et al., 2003), necessitating an urgent need for accurate detection and identification methods that can cover extensive areas of their burrow clusters. Consequently, we believe that the integration of HRS imagery and DL for object detection will assume a pivotal role in addressing steppe rodent infestations. This not only holds long-term benefits for the sustainability of the local ecological environment but also directly contributes to the monitoring and control of plague, thereby providing public health benefits.
Data availability statement
The raw data supporting the conclusions of this article will be made available by the authors, without undue reservation.
Author contributions
CS: Conceptualization, Data curation, Funding acquisition, Software, Validation, Writing – review & editing. YLB: Data curation, Investigation, Methodology, Visualization, Writing – original draft. YB: Project administration, Writing – review & editing. BV: Project administration, Writing – review & editing. SB: Data curation, Investigation, Methodology, Writing – review & editing. BG: Data curation, Investigation, Methodology, Writing – review & editing. NC: Data curation, Investigation, Methodology, Writing – review & editing. QH: Data curation, Investigation, Methodology, Writing – review & editing. XB: Data curation, Investigation, Methodology, Writing – review & editing. GT: Data curation, Investigation, Methodology, Writing – review & editing. BH: Data curation, Investigation, Methodology, Writing – review & editing. KW: Data curation, Writing – review & editing.
Funding
The author(s) declare that financial support was received for the research, authorship, and/or publication of this article. This article has received support from the National Natural Science Foundation of China Regional Project (42261019), the Inner Mongolia Autonomous Region Philosophy and Social Sciences Planning Project (2022NDA225), the Inner Mongolia Autonomous Region Major Science and Technology Special Project (2021ZD004503), the Inner Mongolia Natural Science Foundation General Project (2021MS04016), the Inner Mongolia Autonomous Region Key R&D and Funded by the Achievement Transformation Plan Project (2022YFSH0070) and the Fundamental Research Funds of Inner Mongolia Normal University (2022JBTD011).
Acknowledgments
The authors would also like to express their sincere gratitude to the Inner Mongolia Autonomous Region Military-Civilian Integration Development Research Center for their valuable data assistance.
Conflict of interest
The authors declare that the research was conducted in the absence of any commercial or financial relationships that could be construed as a potential conflict of interest.
Publisher’s note
All claims expressed in this article are solely those of the authors and do not necessarily represent those of their affiliated organizations, or those of the publisher, the editors and the reviewers. Any product that may be evaluated in this article, or claim that may be made by its manufacturer, is not guaranteed or endorsed by the publisher.
References
Addink E. A., De Jong S. M., Davis S. A., Dubyanskiy V., Burdelov L. A., Leirs H. (2010). The use of high-resolution remote sensing for plague surveillance in Kazakhstan. Remote Sens. Environ. 114, 674–681. doi: 10.1016/j.rse.2009.11.015
Alganci U., Soydas M., Sertel E. (2020). Comparative research on deep learning approaches for airplane detection from very high-resolution satellite images. Remote Sens. 12, 13. doi: 10.3390/rs12030458
Andreassen H. P., Sundell J., Ecke F., Halle S., Haapakoski M., Henttonen H., et al. (2021). Population cycles and outbreaks of small rodents: ten essential questions we still need to solve. Oecologia 195, 601–622. doi: 10.1007/s00442-020-04810-w
Avirmed D., Batsaikhan N., Tinnin D. (2016). Lasiopodomys brandtii. IUCN Red List Threatened Species. 10, 2016–2013. T11340A115101423.
Bai D., Wan X., Li G., Wan X., Guo Y., Shi D., et al. (2022). Factors influencing range contraction of a rodent herbivore in a steppe grassland over the past decades. Ecol. Evol. 12, e8546. doi: 10.1002/ece3.8546
Bao G., Liu Y., Linderholm H. W. (2012). April–September mean maximum temperature inferred from Hailar pine (Pinus sylvestris var. mongolica) tree rings in the Hulunbuir region, Inner Mongolia, back to 1868 AD. Palaeogeography Palaeoclimatology Palaeoecol. 313, 162–172. doi: 10.1016/j.palaeo.2011.10.017
Bardgett R. D., Bullock J. M., Lavorel S., Manning P., Schaffner U., Ostle N., et al. (2021). Combatting global grassland degradation. Nat. Rev. Earth Environ. 2, 720–735. doi: 10.1038/s43017-021-00207-2
Beck L. R., Lobitz B. M., Wood B. L. (2000). Remote sensing and human health: new sensors and new opportunities. Emerging Infect. Dis. 6, 217. doi: 10.3201/eid0603.000301
Belmain S. R., Htwe N. M., Kamal N. Q., Singleton G. R. (2015). Estimating rodent losses to stored rice as a means to assess efficacy of rodent management. Wildlife Res. 42, 132–142. doi: 10.1071/WR14189
Cao X., Liu Y., Cui X., Chen J., Chen X. (2019). Mechanisms, monitoring and modeling of shrub encroachment into grassland: a review. Int. J. Digital Earth 12, 625–641. doi: 10.1080/17538947.2018.1478004
Castelo-Cabay M., Piedra-Fernandez J. A., Ayala R. (2022). Deep learning for land use and land cover classification from the Ecuadorian Paramo. Int. J. Digital Earth 15, 1001–1017. doi: 10.1080/17538947.2022.2088872
Chen J., Wang J., Wang Q., Lv J., Liu X., Chen J., et al. (2021). Common fate of sister lakes in Hulunbuir Grassland: Long-term harmful algal bloom crisis from multi-source remote sensing insights. J. Hydrology 594, 125970. doi: 10.1016/j.jhydrol.2021.125970
Cheng G., Han J. (2016). A survey on object detection in optical remote sensing images. ISPRS J. photogrammetry Remote Sens. 117, 11–28. doi: 10.1016/j.isprsjprs.2016.03.014
Davis S., Trapman P., Leirs H., Begon M., Heesterbeek J. (2008). The abundance threshold for plague as a critical percolation phenomenon. Nature 454, 634–637. doi: 10.1038/nature07053
Du M., Wang D., Liu S., Lv C., Zhu Y. (2022). Rodent hole detection in a typical steppe ecosystem using UAS and deep learning. Front. Plant Sci. 13, 992789. doi: 10.3389/fpls.2022.992789
Ezzy H., Charter M., Bonfante A., Brook A. (2021). How the small object detection via machine learning and UAS-based remote-sensing imagery can support the achievement of SDG2: A case study of vole burrows. Remote Sens. 13, 3191. doi: 10.3390/rs13163191
Fu G., Liu C., Zhou R., Sun T., Zhang Q. (2017). Classification for high resolution remote sensing imagery using a fully convolutional network. Remote Sens. 9, 498. doi: 10.3390/rs9050498
Girshick R. (2015). “Fast r-cnn,” in Proceedings of the IEEE international conference on computer vision.
Girshick R., Donahue J., Darrell T., Malik J. (2014). “Rich feature hierarchies for accurate object detection and semantic segmentation,” in Proceedings of the IEEE conference on computer vision and pattern recognition.
Guiming W., Qingqiang Z., Wenqin Z., Guanghe W. (1992). FOOD HABITS OF BRANDT'S VOLE (Microtus brandti). Acta Theriologica Sin. 12, 57–64. https://www.mammal.cn/EN/Y1992/V12/I1/57
Han D., Wang G., Xue B., Liu T., Yinglan A., Xu X. (2018). Evaluation of semiarid grassland degradation in North China from multiple perspectives. Ecol. Eng. 112, 41–50. doi: 10.1016/j.ecoleng.2017.12.011
He K., Zhang X., Ren S., Sun J. (2016). “Deep residual learning for image recognition,” in Proceedings of the IEEE conference on computer vision and pattern recognition.
Hofmann P., Tiede D. (2014). Image segmentation based on hexagonal sampling grids. South-Eastern Eur. J. Earth Observation Geomatics 3, 173–177.
Hu Q., Pan F., Pan X., Zhang D., Li Q., Pan Z., et al. (2015). Spatial analysis of climate change in Inner Mongolia during 1961–2012, China. Appl. Geogr. 60, 254–260. doi: 10.1016/j.apgeog.2014.10.009
Hua L., Squires V. R. (2015). Managing China's pastoral lands: Current problems and future prospects. Land Use Policy 43, 129–137. doi: 10.1016/j.landusepol.2014.11.004
Huang W., Sun S., Jiang H., Gao C., Zong X. (2018). GF-2 satellite 1m/4m camera design and in-orbit commissioning. Chin. J. Electron. 27, 1316–1321. doi: 10.1049/cje.2018.09.018
Huang X., Liu X., Zhang L. (2014). A multichannel gray level co-occurrence matrix for multi/hyperspectral image texture representation. Remote Sens. 6, 8424–8445. doi: 10.3390/rs6098424
Janiesch C., Zschech P., Heinrich K. (2021). Machine learning and deep learning. Electronic Markets 31, 685–695. doi: 10.1007/s12525-021-00475-2
Jean N., Burke M., Xie M., Davis W. M., Lobell D. B., Ermon S. (2016). Combining satellite imagery and machine learning to predict poverty. Science 353, 790–794. doi: 10.1126/science.aaf7894
Jiao L., Zhang F., Liu F., Yang S., Li L., Feng Z., et al. (2019). A survey of deep learning-based object detection. IEEE Access 7, 128837–128868. doi: 10.1109/ACCESS.2019.2939201
Khan A. S., Young J. C. (2001). Hantavirus pulmonary syndrome: at the crossroads. Curr. Opin. Infect. Dis. 14, 205–209. doi: 10.1097/00001432-200104000-00016
Li G., Hou X., Wan X., Zhang Z. (2016). Sheep grazing causes shift in sex ratio and cohort structure of Brandt's vole: Implication of their adaptation to food shortage. Integr. Zool 11, 76–84. doi: 10.1111/1749-4877.12163
Li Z., Shen H., Cheng Q., Liu Y., You S., He Z. (2019). Deep learning based cloud detection for medium and high resolution remote sensing images of different sensors. ISPRS J. Photogrammetry Remote Sens. 150, 197–212. doi: 10.1016/j.isprsjprs.2019.02.017
Li J., Wang Y., Liu F., Shen X., Wang Y., Fan M., et al. (2021). Genetic source tracking of human plague cases in Inner Mongolia-Beijin. PloS Negl. Trop. Dis. 15, e0009558. doi: 10.1371/journal.pntd.0009558
Lin T.-Y., Goyal P., Girshick R., He K., Dollár P. (2017). “Focal loss for dense object detection,” in Proceedings of the IEEE international conference on computer vision.
Liu W., Anguelov D., Erhan D., Szegedy C., Reed S., Fu C.-Y., et al. (2016). “Ssd: Single shot multibox detector,” in Proceedings of the Computer Vision–ECCV 2016: 14th European Conference; October 11–14. Amsterdam, Netherlands: Springer.
Liu Y., Dang C., Yue H., Lyu C., Dang X. (2021). Enhanced drought detection and monitoring using sun-induced chlorophyll fluorescence over Hulun Buir Grassland, China. Sci. Total Environ. 770, 145271. doi: 10.1016/j.scitotenv.2021.145271
Lu L., Sun Z., Qimuge E., Ye H., Huang W., Nie C., et al. (2022). Using remote sensing data and species–environmental matching model to predict the potential distribution of grassland rodents in the northern China. Remote Sens. 14. doi: 10.3390/rs14092168
Lyu X., Li X., Dang D., Dou H., Wang K., Lou A. (2022). Unmanned aerial vehicle (UAV) remote sensing in grassland ecosystem monitoring: A systematic review. Remote Sens. 14, 1. doi: 10.3390/rs14051096
Ma J., Hao Z., Sun Y., Liu B., Jing W., Du J., et al. (2022). Heavy metal concentrations differ along wetland-to-grassland soils: a case study in an ecological transition zone in Hulunbuir, Inner Mongolia. J. Soils Sediments 22, 1176–1187. doi: 10.1007/s11368-021-03132-5
Ma L., Li M., Ma X., Cheng L., Du P., Liu Y. (2017). A review of supervised object-based land-cover image classification. ISPRS J. Photogrammetry Remote Sens. 130, 277–293. doi: 10.1016/j.isprsjprs.2017.06.001
Meerburg B. G., Singleton G. R., Leirs H. (2009). The year of the rat ends—time to fight hunger! Pest Manage. Science: formerly Pesticide Sci. 65, 351–352. doi: 10.1002/ps.1718
Na R., Du H., Na L., Shan Y., He H. S., Wu Z., et al. (2019). Spatiotemporal changes in the Aeolian desertification of Hulunbuir Grassland and its driving factors in China during 1980–2015. Catena 182, 1. doi: 10.1016/j.catena.2019.104123
Neubeck A., Van Gool L. (2006). “Efficient non-maximum suppression,” in Proceedings of the 18th international conference on pattern recognition (ICPR'06). (IEEE).
O'mara F. P. (2012). The role of grasslands in food security and climate change. Ann. Bot. 110, 1263–1270. doi: 10.1093/aob/mcs209
Ocampo-Chavira P., Eaton-Gonzalez R., Riquelme M. (2020). Of mice and fungi: coccidioides spp. Distribution models. J. Fungi (Basel) 6, 1. doi: 10.3390/jof6040320
Redmon J., Farhadi A. (2018). Yolov3: An incremental improvement. arXiv [Preprint] arXiv:1804.02767. doi: 10.48550/arXiv.1804.02767
Ren S., He K., Girshick R., Sun J. (2015). Faster r-cnn: Towards real-time object detection with region proposal networks. Adv. Neural Inf. Process. Syst. 28, 15. doi: 10.1109/TPAMI.2016.2577031
Ren K., Sun W., Meng X., Yang G., Du Q. (2020). Fusing China gf-5 hyperspectral data with gf-1, gf-2 and sentinel-2a multispectral data: Which methods should be used? Remote Sens. 12, 882. doi: 10.3390/rs12050882
Rojas-Briales E. (2015). Sparing grasslands: FAO's active role. Science 347, 1211–1211. doi: 10.1126/science.347.6227.1211
Ryherd S., Woodcock C. (1996). Combining spectral and texture data in the segmentation of remotely sensed images. Photogrammetric Eng. Remote Sens. 62, 181–194. doi: 10.1144/petgeo.2.1.83
Sage K. M., Johnson T. L., Teglas M. B., Nieto N. C., Schwan T. G. (2017). Ecological niche modeling and distribution of Ornithodoros hermsi associated with tick-borne relapsing fever in western North America. PloS Negl. Trop. Dis. 11, e0006047. doi: 10.1371/journal.pntd.0006047
Sahr K., White D., Kimerling A. J. (2013). Geodesic discrete global grid systems - cartography and geographic information science. Cartography Geographic Inf. Sci. 30 (2), 121–134. doi: 10.1559/152304003100011090
Shang C., Wu J. (2022). A legendary landscape in peril: Land use and land cover change and environmental impacts in the Wulagai River Basin, Inner Mongolia. J. Environ. Manage. 301, 113816. doi: 10.1016/j.jenvman.2021.113816
Shi H., Pan Q., Luo G., Hellwich O., Chen C., Voorde T. V. D., et al. (2021). Analysis of the impacts of environmental factors on rat hole density in the Northern Slope of the Tienshan Mountains with satellite remote sensing data. Remote Sens. 13, 4709. doi: 10.3390/rs13224709
Shi D., Wan X., Davis S. A., Pech R. P., Zhang Z. (2002). Simulation of lethal control and fertility control in a demographic model for Brandt’s vole Microtus brandti. J. Appl. Ecol. 39, 337–348. doi: 10.1046/j.1365-2664.2002.00716.x
Singleton G. R., Belmain S., Brown P. R., Aplin K., Htwe N. M. (2010). Impacts of rodent outbreaks on food security in Asia. Wildlife Res. 37, 355–359. doi:10.1071/WR10084
Singleton G. R., Brown P. R. (2003). Comparison of different sizes of physical barriers for controlling the impact of the rice field rat, Rattus argentiventer, in rice crops in Indonesia. Crop Prot. 22, 7–13. doi: 10.1016/S0261-2194(02)00060-1
Siqueira F., Schwartz W. R., Pedrini H. (2013). Multi-scale gray level co-occurrence matrices for texture description. Neurocomputing 120, 336–345. doi: 10.1016/j.neucom.2012.09.042
Stenseth N. C., Leirs H., Skonhoft A., Davis S. A., Pech R. P., Andreassen H. P., et al. (2003). Mice, rats, and people: the bio-economics of agricultural rodent pests. Front. Ecol. Environ. 1, 367–375. doi: 10.1890/1540-9295(2003)001[0367:MRAPTB]2.0.CO;2
Tian L. (2018). Relationship between environmental factors and the spatial distribution of Spermophilus dauricus during 2000–2015 in China. Int. J. biometeorology 62, 1781–1789. doi: 10.1007/s00484-018-1580-9
Wang G., Huang Y., Wei Y., Zhang W., Li T., Zhang Q. (2019b). Inner Mongolian grassland plant phenological changes and their climatic drivers. Sci. Total Environ. 683, 1–8. doi: 10.1016/j.scitotenv.2019.05.125
Wang D., Li N., Tian L., Ren F., Li Z., Chen Y., et al. (2019a). Dynamic expressions of hypothalamic genes regulate seasonal breeding in a natural rodent population. Mol. Ecol. 28, 3508–3522. doi: 10.1111/mec.15161
Wang Y., Niu X., Zhao L., Liang C., Miao B., Zhang Q., et al. (2020). Biotic stability mechanisms in Inner Mongolian grassland. Proc. R. Soc. B 287, 20200675. doi: 10.1098/rspb.2020.0675
Xinrong W., Wei L., Guanghe W., Mengjun W., Wenqin Z. (2006). Seasonal changes of the activity patterns of Brandt, s vole (Lasiopodomys brandtii) in the typical steppe in Inner Mongolia. Acta Theriologica Sin. 26, 226. doi: 10.3969/j.issn.1000-1050.2006.03.003
Xu F., Li J., Wu L., Su J., Wang Y., Chen D., et al. (2022). Linking leaf traits to the temporal stability of above-and belowground productivity under global change and land use scenarios in a semi-arid grassland of Inner Mongolia. Sci. total Environ. 818, 151858. doi: 10.1016/j.scitotenv.2021.151858
Yeh C., Perez A., Driscoll A., Azzari G., Tang Z., Lobell D., et al. (2020). Using publicly available satellite imagery and deep learning to understand economic well-being in Africa. Nat. Commun. 11, 2583. doi: 10.1038/s41467-020-16185-w
Yin B., Li G., Wan X., Shang G., Wei W., Zhang Z. (2017). Large manipulative experiments reveal complex effects of food supplementation on population dynamics of Brandt’s voles. Sci. China Life Sci. 60, 911–920. doi: 10.1007/s11427-017-9114-9
Zagoruyko S., Komodakis N. (2016). Wide residual networks. arXiv [Preprint] (Cornell University) arXiv:1605.07146.
Zhang C., Benz P., Argaw D. M., Lee S., Kim J., Rameau F., et al. (2021). "Resnet or densenet? introducing dense shortcuts to resnet," in Proceedings of the IEEE/CVF winter conference on applications of computer vision.
Zhang Q., Buyantuev A., Fang X., Han P., Li A., Li F. Y., et al. (2020). Ecology and sustainability of the Inner Mongolian Grassland: Looking back and moving forward. Landscape Ecol. 35, 2413–2432. doi: 10.1007/s10980-020-01083-9
Zhang Z., Pech R., Davis S., Shi D., Wan X., Zhong W. (2003). Extrinsic and intrinsic factors determine the eruptive dynamics of Brandt's voles Microtus brandti in Inner Mongolia, China. Oikos 100, 299–310. doi: 10.1034/j.1600-0706.2003.11810.x
Zhang D.-D., Xie F., Zhang L. (2018). "Preprocessing and fusion analysis of GF-2 satellite Remote-sensed spatial data," in Proceedings of the 2018 International Conference on Information Systems and Computer Aided Education (ICISCAE). (IEEE).
Zhao Y., Liu Z., Wu J. (2020). Grassland ecosystem services: a systematic review of research advances and future directions. Landscape Ecol. 35, 793–814. doi: 10.1007/s10980-020-00980-3
Keywords: object detection, faster R-CNN, Brandt’s vole, burrow clusters, GF-2, Hulunbuir
Citation: Sun C, Bao Y, Bao Y, Vandansambuu B, Bayarsaikhan S, Gantumur B, Chantsal N, Hai Q, Bai X, Tang G, He B and Wu K (2024) Detection and classification of Brandt’s vole burrow clusters utilizing GF-2 satellite imagery and faster R-CNN model. Front. Ecol. Evol. 12:1310046. doi: 10.3389/fevo.2024.1310046
Received: 11 October 2023; Accepted: 22 January 2024;
Published: 08 March 2024.
Edited by:
Guiming Wang, Mississippi State University, United StatesReviewed by:
Kunpeng Yi, Chinese Academy of Sciences (CAS), ChinaZhongyi Sun, Hainan University, China
Copyright © 2024 Sun, Bao, Bao, Vandansambuu, Bayarsaikhan, Gantumur, Chantsal, Hai, Bai, Tang, He and Wu. This is an open-access article distributed under the terms of the Creative Commons Attribution License (CC BY). The use, distribution or reproduction in other forums is permitted, provided the original author(s) and the copyright owner(s) are credited and that the original publication in this journal is cited, in accordance with accepted academic practice. No use, distribution or reproduction is permitted which does not comply with these terms.
*Correspondence: Yulong Bao, baoyulong@imnu.edu.cn