Vegetation cover change and its response to human activities in the southwestern karst region of China
 Zhaopu Liu
  Yushan Zhang*
- College of Resources and Environment, Southwest University, Chongqing, China
Vegetation to some extent can reflect the overall state of the ecological environment, and increasing vegetation cover can improve the quality of the ecological environment. The southwest karst region of China is a typical ecologically fragile area and an important ecological barrier. Against the backdrop of intensified human activities, the vegetation dynamics in the karst region have attracted widespread attention. Analyzing vegetation cover changes and their responses to human activities is important for regional ecological development. This study is based on SPOT-VGT NDVI data from 1998 to 2020 and employs trend analysis, “baseline” determination, multiple regression, residual analysis, and principal component analysis to investigate the characteristics of vegetation cover changes in the southwest karst region of China. Additionally, it quantifies the specific impacts of various human activities on these changes. The research findings indicate that (1) over the past 23 years, the interannual variability and seasonal differences in the NDVI of the southwest karst region have been significant, exhibiting an overall increasing trend. Spatially, the vegetation in this region demonstrates a decreasing trend from south to north and southwest to northeast. (2) Over time, the areas where vegetation has improved gradually expand, and the effectiveness of vegetation restoration increases with time. (3) Overall, human activities influence vegetation growth in the southwest karst landscape region of China. (4) The socioeconomic factors affecting vegetation cover changes in the southwest karst region of China primarily include economic development level, population and labor migration, urbanization development, and vegetation construction. These results provide a scientific basis for formulating reasonable ecological environment protection strategies by humans.
1 Introduction
Vegetation, a vital component of terrestrial ecosystems, plays a crucial role in soil retention, atmospheric regulation, and ecosystem stability (Guo et al., 2018). Moreover, it serves as an indicator of spatiotemporal changes in the ecological environment (Wang et al., 2015). Increasing land surface vegetation cover can effectively mitigate soil erosion, control the expansion of rocky desertification, and enhance regional ecological environment quality (Macias-Fauria, 2018; Tong et al., 2018; Cheng et al., 2023). Due to the intensification of human activities and the emergence of extreme climatic events, the global ecological environment has recently faced severe threats (Abera et al., 2020). Particularly in the 21st century, the intensity and scope of human activities have expanded progressively. Factors including population growth, urbanization, adjustments in energy consumption structure, afforestation and reforestation efforts, cropland conversion to grassland, and shifts in agricultural practices have significantly impacted regional vegetation cover. Therefore, investigating the patterns of regional vegetation cover changes and analyzing the influence of human activities on these changes can effectively facilitate vegetation restoration and elevate the quality of the ecological environment.
The Normalized Difference Vegetation Index (NDVI) effectively characterizes surface vegetation cover; as such, it has widespread application in studies concerning vegetation cover changes. Numerous scholars have employed NDVI to reveal vegetation changes in various global regions. Wu et al. (2014) conducted a study on global vegetation changes over the past 30 years, indicating a significant increasing trend in vegetation cover across most continental areas during the study period. Researchers like Myneni et al. (1997) and Tucker et al. (2001) observed that long-term sequences of vegetation cover exhibited a rising trend, particularly in mid-latitude regions of the Northern Hemisphere. Park and Sohn (2010) investigated long-term vegetation cover changes across the entire Eurasian continent, revealing an increasing trend in vegetation. Studies regarding vegetation changes in China have predominantly focused on ecologically significant areas, such as the Qinghai-Tibet Plateau (Zhang et al., 2018) and Yangtze River Basin (Shanshan et al., 2021), and densely populated regions like the Northeast (Mao et al., 2012) and North China (Bai et al., 2022). However, existing research largely relies on vegetation indices to analyze vegetation changes, with relatively fewer studies assessing the effectiveness of vegetation restoration based on changes in vegetation cover.
Research findings have demonstrated an increasing influence of human activities on vegetation cover changes (Zhao et al., 2018; Zhu et al., 2020), encompassing positive and negative impacts. Urban expansion has helped convert vast agricultural and forested lands into developed areas, significantly reducing vegetation cover (Obiefuna et al., 2013). Jin et al. (2018) indicated that urbanization development has encroached upon substantial farmland and forested areas for construction, leading to a noticeable decrease in vegetation cover. Luo et al. (2018) contended that the construction of the Qinghai-Tibet Railway in recent years, coupled with the influx of residents and tourists, has contributed to vegetation degradation. In contrast, economic growth and urbanization development have spurred labor migration, resulting in marginal land abandonment and a shift in energy consumption, thus promoting forest transition and vegetation restoration (Aide and Grau, 2004). Furthermore, reforestation and grassland restoration projects are direct factors leading to increased vegetation cover (Li et al., 2012). Currently, the most common research methods for studying the impact of human activities on vegetation cover involve multiple regression analysis and residual analysis. Evans and Geerken (2004) employed residual analysis to quantitatively analyze the influence of human activities on vegetation cover changes in Syrian grasslands. Li et al. (2012) utilized residual analysis to find that primarily grazing-related human activities were the main driving factors behind vegetation changes in Inner Mongolia. Cao et al. (2006) used regression and residual analysis to study the impact of human activities on vegetation cover in the Xilingol region. However, previous studies have only roughly quantified the positive and negative effects of human activities on vegetation cover changes without specifically delineating the impacts of different human activity factors on vegetation cover.
The complex terrain and ecological fragility of the southwestern karst region of China, combined with the dual pressures of population and land resources, have led to varying degrees of ecological degradation due to unsustainable land use practices. This region faces challenges such as severe water and soil erosion, land desertification, and acid rain issues (Wang et al., 2004; Jiang et al., 2014). However, the karst region plays a crucial role in ecological functions, such as water conservation and soil retention. Therefore, the vegetation cover in the karst region affects the local ecological environment and agricultural production and holds significant implications for the ecological security and economic development of China and Asia. Monitoring and analyzing vegetation changes in the southwestern karst region has become essential to global change research; this helps to determine regional ecological environmental changes and provides a scientific basis for formulating rational strategies for ecological environment protection.
Based on the SPOT-VGT NDVI data from 1998 to 2020, this study employs Theil-Sen Median trend analysis and Mann-Kendall significance testing to conduct an analysis of vegetation cover changes and spatial patterns in the southwest karst region of China over the past 23 years. Additionally, it utilizes a “baseline” assessment method to evaluate the effectiveness of vegetation restoration. Subsequently, multiple regression, residual analysis, and principal component analysis refine the impact of human activities on vegetation cover, identifying key human activity factors and assessing the relationship between vegetation cover and human activities. The aim is to provide valuable insights for regional vegetation restoration, ecosystem preservation, and the development of ecological civilization.
2 Materials and methods
2.1 Study area
The study area of this paper is located in southwestern China, encompassing three provincial-level administrative regions and one directly administered municipality: Guizhou, Sichuan, Yunnan, and Chongqing. Its geographical coordinates range from 97°31’ to 110°11’ east longitude and 21°8’ to 34°19’ north latitude. The total area covers 1,064,507 square kilometers, accounting for 11.09% of China’s land area. Situated within the tertiary transition zone of China, the study area features complex topography with significant elevation variations, ranging from 55 to 6359 meters above sea level (Figure 1). The southwestern karst region represents a prominent example of karst landforms in China, with Guizhou, Sichuan, Yunnan, and Chongqing accounting for more than 50% of the total karst area in the country. The region falls under the category of ecological vulnerability, facing severe issues of soil erosion and rocky desertification. Among the provinces and municipalities, Guizhou, Sichuan, Yunnan, and Chongqing exhibit the most severe soil erosion, covering 282,267 square kilometers and accounting for 10.48% of the national soil erosion area. The total area affected by rocky desertification in these four regions is 6.265 million hectares, representing 62.21% of the national rocky desertification land. The southwestern karst region is a quintessential example of China’s ecologically fragile areas, yet it holds significant ecological importance, and it is part of the Yangtze River’s key ecological region, incorporating five national key ecological functional zones and constituting an essential component of the ecological barrier in the Sichuan-Yunnan region.
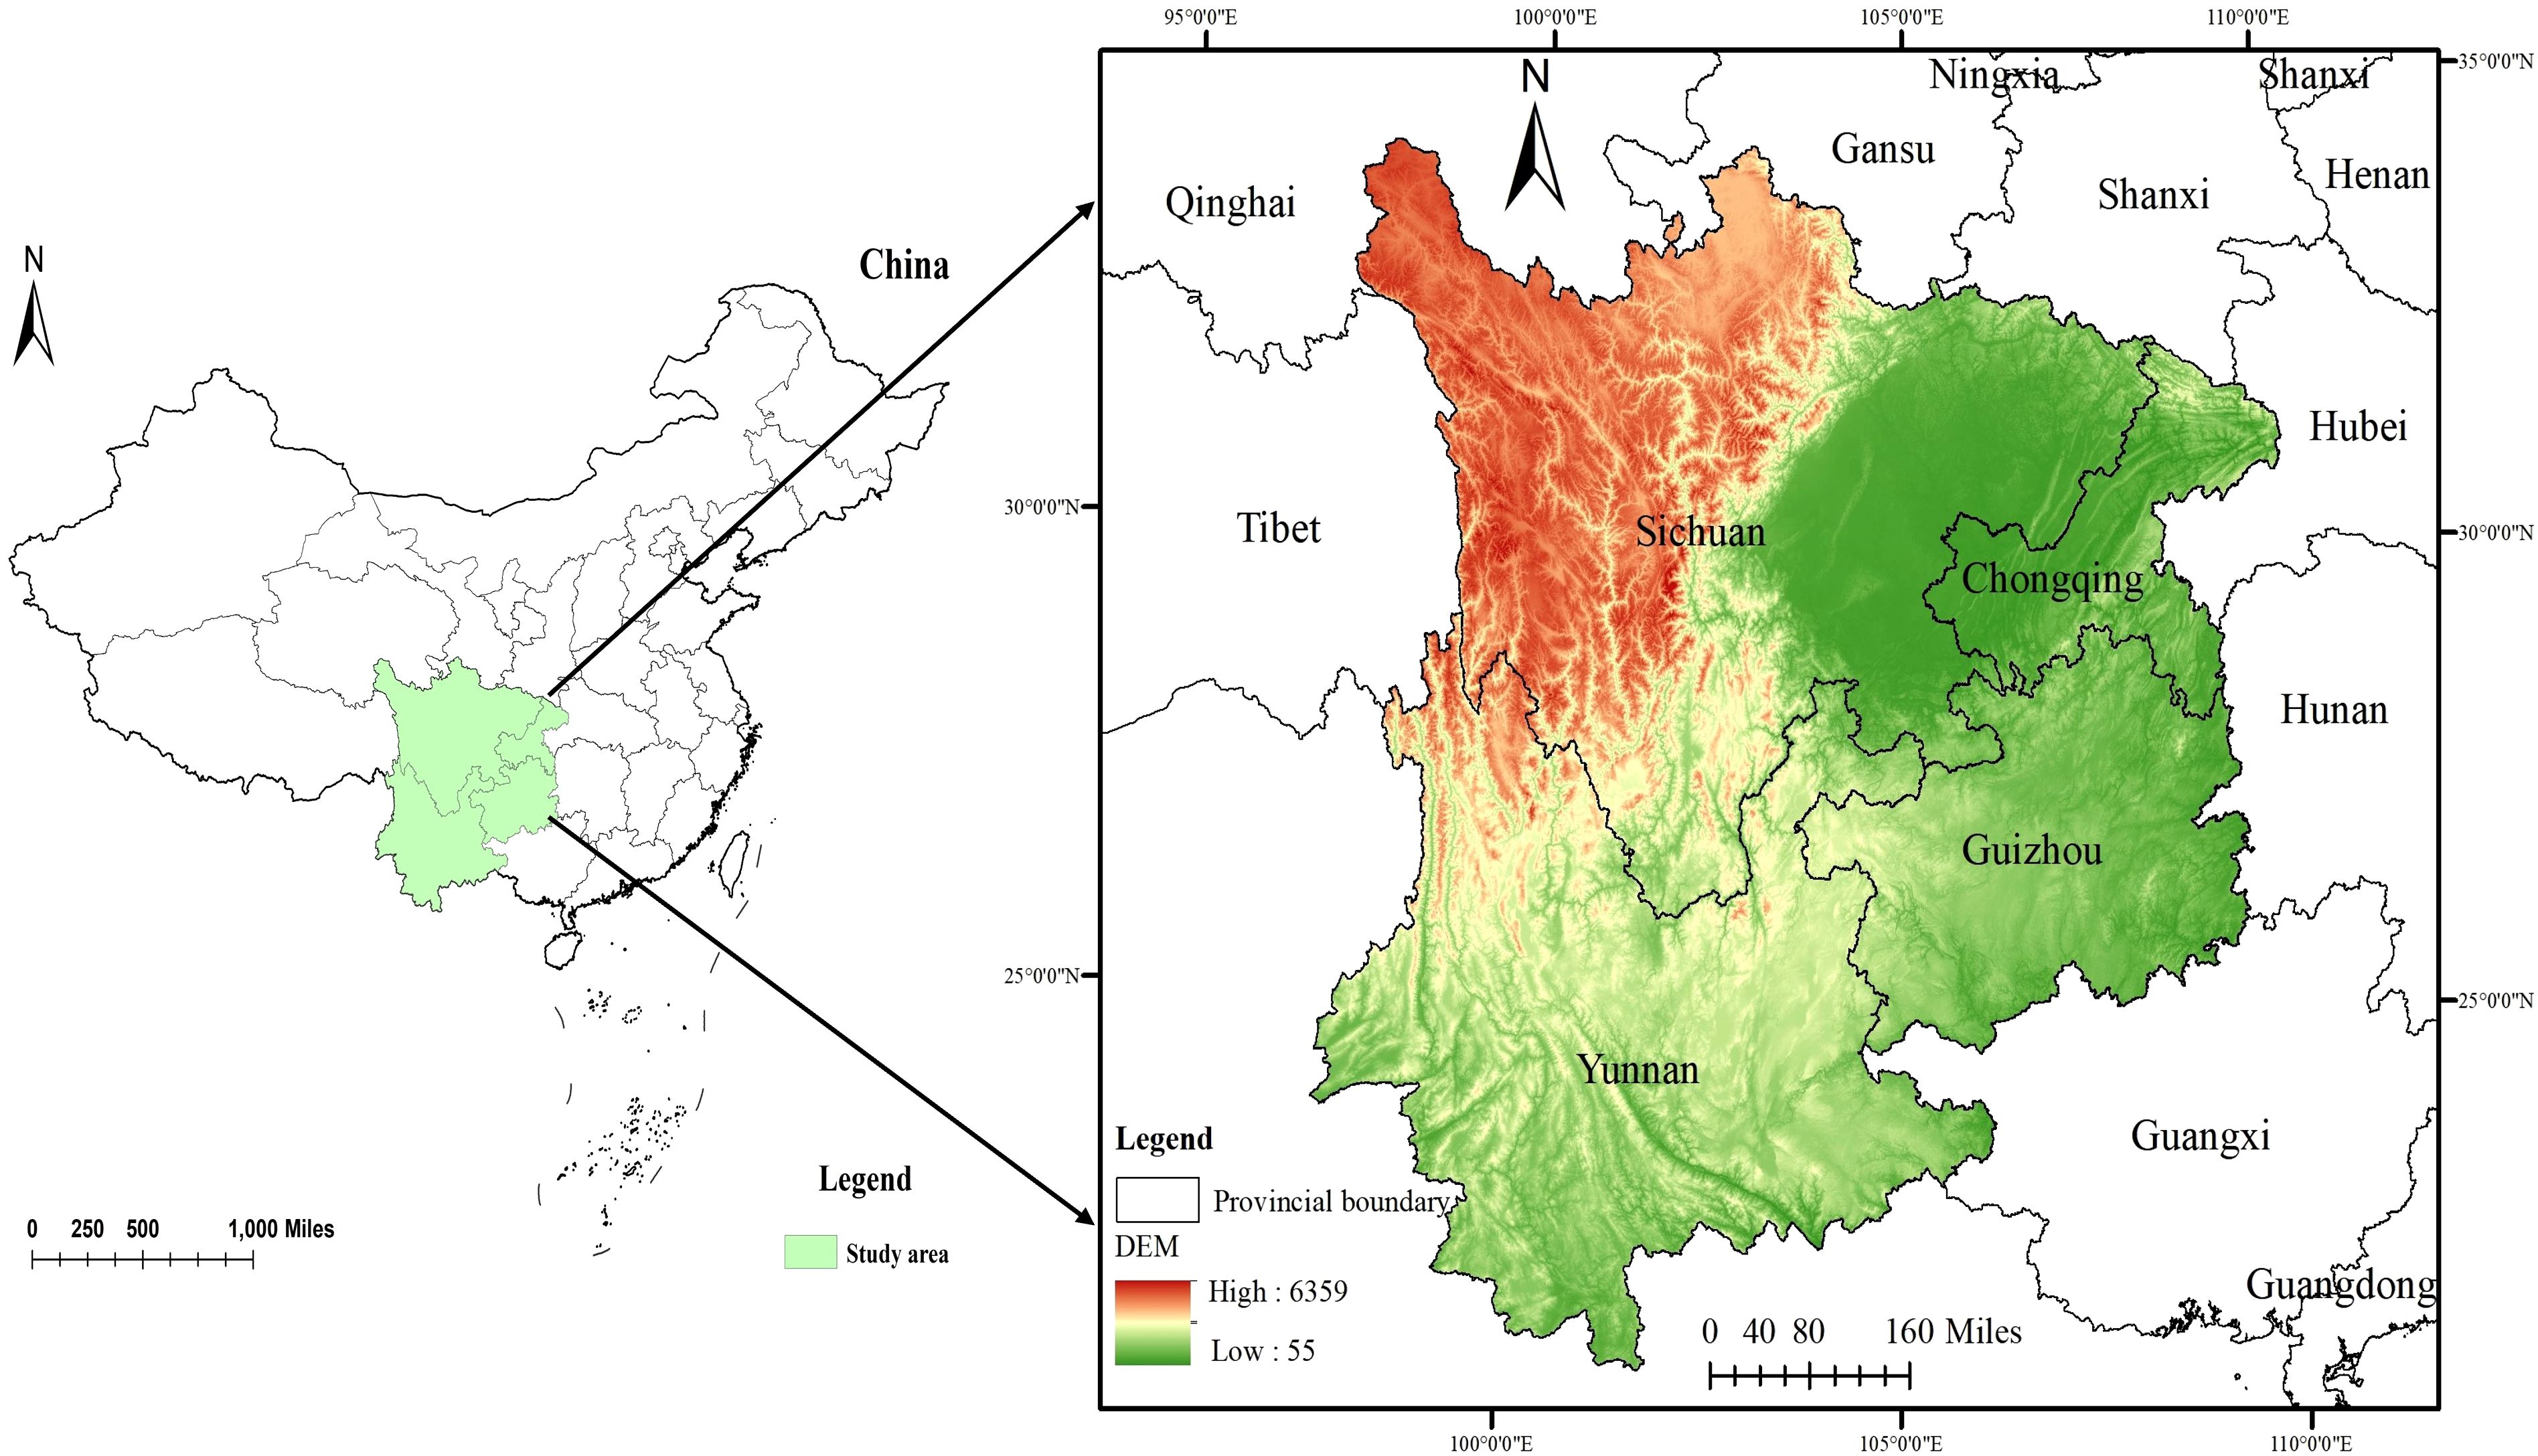
Figure 1 Study area.
2.2 Data sources
2.2.1 NDVI data
The study used NDVI data obtained from the Resource and Environmental Science and Data Center of the Chinese Academy of Sciences (http://www.resdc.cn/). These data covers the period from April 1998 to June 2020, with a spatial resolution of 1 km and a temporal resolution of monthly data. The data were pre-processed, including geometric correction, radiometric correction, atmospheric correction, and other necessary steps.
2.2.2 Temperature and precipitation
Temperature and precipitation data used in this study were sourced from the “National Tibetan Plateau Scientific Data Center” (http://data.tpdc.ac.cn). This dataset provides monthly precipitation and temperature data for China, with a spatial resolution of 0.0083333° (approximately 1 km). The data cover the period from January 1998 to December 2020, with precipitation data in units of 0.1 mm and temperature data in units of 0.1°C.
2.2.3 Population and GDP
Population and GDP data were obtained from the Resource and Environmental Science Data Center of the Chinese Academy of Sciences (https://www.resdc.cn/). Data were selected for three periods: 2000, 2010, and 2019. These datasets represent spatial distribution raster data at a resolution of 1 km.
2.2.4 Socio-economic data
This study utilizes socio-economic datasets encompassing population statistics, regional Gross Domestic Product (GDP), labor force migration, and related parameters. These data were collected from sources such as the “China Statistical Yearbook,” the “China Forestry Statistical Yearbook,” and Supplementary Supplementary Information from provincial statistical yearbooks or bulletins.
Considering that the nominal GDP obtained from statistical yearbooks may exaggerate the impact of economic growth on NDVI, this paper calculates the real GDP for analysis, referencing the study by Huang et al. (2024), using the Consumer Price Index (CPI). Taking the GDP of 1997 as the base, the 1997 CPI is set to 100, and Equation 1 is applied to calculate the real GDP from 1998 to 2020.
Where GDPi is real GDP in the i-th year, the nominal GDPi and CPIi both are collected from the statistical yearbooks in the i-th year. The CPI1997 is the CPI in 1997 and equals 100.
2.3 Research methods
This research incorporates a comprehensive suite of data processing and analytical methodologies to investigate the impact of human activities on vegetation cover. By leveraging NDVI datasets, seasonal and interannual fluctuations were quantified using the Maximum Value Composite method. Subsequent application of trend analysis and significance testing, in conjunction with baseline establishment, facilitated the identification of vegetation cover change trends. Additionally, temperature and precipitation datasets underwent residual analysis to examine the impact of human activities on vegetation cover. In parallel, the analysis of socio-economic datasets through correlation and principal component methods elucidated the relationship between vegetation changes and economic growth. Through the amalgamation of these diverse techniques, the study delineates both the direct and indirect influences of human activities on vegetation cover.
2.3.1 Maximum value composites
The Maximum Value Composites (MVC) algorithm was employed to generate annual NDVI data for the study area (du Plessis, 1999). This technique aims to reduce the impact of factors such as weather conditions and solar angles. The formula is as follows:
In Equation 2, i represents the year; j represents the month; s denotes the season, specifically spring (March-May), summer (June-August), autumn (September-November), winter (December-February of the following year), and the growing season (April-October). NDVIj indicates the monthly NDVI value; NDVIi represents the annual NDVI value; NDVIs denotes the NDVI value for different seasons. In order to better elucidate the characteristics of ecological restoration in the study area, the NDVI has been categorized into five levels as follows: high cover (NDVI ≥ 0.75), moderately high cover (0.75 > NDVI ≥ 0.6), moderate cover (0.6 > NDVI ≥ 0.45), moderately low cover (0.45 > NDVI ≥ 0.3), and low cover (NDVI< 0.3), denoted as Level I, Level II, Level III, Level IV, and Level V, respectively.
2.3.2 Trend analysis and significance testing
2.3.2.1 Theil-Sen Median trend analysis
The Theil-Sen Median trend analysis method, also known as slope estimation, is a robust non-parametric statistical approach used for trend calculation (Qi et al., 2023). This method is particularly resistant to measurement errors and outliers, making it suitable for analyzing trends in long time series data. In this study, we employed the Theil-Sen Median trend analysis method to simulate the changing trends for each grid pixel. This approach primarily aims to capture the spatial variation characteristics of NDVI over different time periods (Equation 3).
2.3.2.2 Mann-Kendall significance testing
The Mann-Kendall (MK) test method was employed in this study to assess the significance level of the NDVI time series trends (Hussien et al., 2023). The Mann-Kendall non-parametric statistical test offers numerous benefits, including its lack of assumption regarding the normal distribution of data, its tolerance for non-linear trends, and its robustness in the presence of missing values and outliers. These attributes have rendered it extensively applicable in the analysis of trend significance within long-term time series datasets (Equations 4–7).
Calculate the statistic S:
The sign function sgn:
When n≥8, the statistic S approximately follows a normal distribution with a variance of:
The standardized statistic Z is calculated using the following formula:
Where NDVIi and NDVIj represent the NDVI values corresponding to the i-th year and j-th year, respectively. “sgn” denotes the sign function, and n symbolizes the duration of the period under consideration for vegetation dynamics. Based on the significance testing results, the degree of NDVI change trends is categorized into non-significant change, significant change, and highly significant change. For a significance level α, when |Z| > Z1-α/2, it indicates significant change in the time series at the α level; otherwise, it is considered non-significant change. In this study, we consider |Z| > 1.96 as passing the 95% significance test and |Z| > 2.58 as passing the 99% significance test. According to trend analysis and significance testing, change trends are categorized into seven levels: highly significant decrease (β< 0, |Z| > 2.58), significant decrease (β< 0, 1.96< |Z|< 2.58), slight decrease (β< 0, |Z|< 1.96), no change (β = 0), slight increase (β > 0, |Z|< 1.96), significant increase (β > 0, 1.96< |Z|< 2.58), and highly significant increase (β > 0, |Z| > 2.58).
2.3.3 The establishment of the “baseline”
The ecological restoration quality index Eij established in this study is based on the “baseline” setting method (Martin et al., 2014), which quantifies the ecological restoration effects at different time scales using the characteristics of average vegetation cover change at the provincial and municipal levels. The “net change” (eij) in vegetation, calculated as the difference between the areas with significant improvement and severe degradation as indicated by the trend analysis of annual average NDVI data, serves as the vegetation indicator. This approach quantitatively analyzes the ecological restoration effectiveness across various time scales in the study area.
In Equation (8), i represents different assessment units, and j represents different time scales, namely, 1998-2005, 1998-2010, and 1998-2020. INij stands for the proportion of the area within assessment unit i where annual average NDVI significantly improved during time scale j, while DEij represents the proportion of the area within assessment unit i where annual average NDVI experienced severe degradation during time scale j.
The reference value for evaluation, denoted as the “baseline” (e), is determined as the difference between the area with significant improvement in vegetation and the area with severe degradation in vegetation for the period 1998–2005 (Equation 9).
When Eij ≤ 0, it indicates that the ecological condition of the area has regressed during that time period, failing to achieve ecological restoration. When 0< Eij ≤ 1, it signifies that, although the effectiveness index is positive, the area has not surpassed the “baseline” level as represented by the 1998-2005 average. When Eij > 1, it signifies that the area has achieved significant ecological restoration during that time frame, and the greater the extent by which it surpasses the “baseline”, the more pronounced the restoration effectiveness.
2.3.4 Multiple linear regression and residual analysis method
Climate change and human activities have been widely recognized as the primary drivers of vegetation cover changes in a multitude of studies. However, identifying which areas are affected by climate change and which are influenced by human activities during the analysis of vegetation cover changes has historically lacked a reasonable quantitative analysis method. Currently, the predominant methodology in investigating the causative factors of changes in vegetation cover entails an initial assessment of the correlation between time series NDVI data and climatic variables, followed by the development of predictive models. By isolating the impact of climatic factors on NDVI, the extent of human activities’ influence is assessed, a process known as residual analysis (Dagnachew et al., 2020). The principle of residual analysis involves constructing a linear regression model between climatic factors and NDVI over an extended time series. This model uses climatic factors as variables to simulate the NDVI values under the control of climatic conditions alone. The simulated NDVI values are then compared with the actual NDVI values, by subtracting the simulated NDVI from the actual NDVI measurements. This process isolates the portion of vegetation cover influenced by climatic conditions, with the resulting NDVI residuals representing the impact of human activities on vegetation cover changes. Previous studies have shown that temperature and precipitation are indicators of climate change and the most crucial climatic conditions affecting vegetation growth (Piao et al., 2003). Therefore, residual analysis typically considers these two climatic factors: temperature and precipitation (Jin et al., 2020; Liu et al. 2024).
Initially, a multiple linear regression model is formulated utilizing NDVI values and time series data for temperature and precipitation. The parameters of this model are determined, yielding a series of predicted NDVI values. These predicted values represent the impact of natural factors on NDVI. Subsequently, the disparity between the observed NDVI values and the predicted NDVI values is computed to obtain the NDVI residuals. These residuals are interpreted as manifestations of the influence of human activities on NDVI (Equations 10, 11).
In the formula, “a,” “b,” and “c” represent the model parameters. “T” and “P” respectively denote the annual average temperature and cumulative precipitation, measured in degrees Celsius (°C) and millimeters (mm). “NDVIreal” represents the observed NDVI value, “NDVIpre” is the predicted NDVI value, and “NDVIϵ” stands for the residual value of NDVI. When “NDVIϵ” > 0, it indicates that human activities have a positive impact on vegetation growth. When “NDVIϵ” = 0, it suggests that human activities have a weak impact on vegetation cover or no impact. When “NDVIϵ”< 0, it implies that human activities have a negative impact on vegetation growth.
2.3.5 Correlation analysis
The correlation analysis method was employed to calculate the correlation coefficient changes between population, GDP, and NDVI in both temporal and spatial scales within the southwestern karst region.
In Equation 12, i represents the year, and n is the number of years; xi and yj denote the sample values for year i, while and represent the mean values of the samples.
2.3.6 Principal component analysis
The objective of principal component analysis (PCA) is to employ dimensionality reduction techniques to transform a set of multiple indicators into a smaller set of key indicators (ie, principal components). Each principal component can better reflect most of the information of the original variables without repetition. In this study, PCA was used to identify the human activity factors influencing vegetation restoration. The methodology entailed: (1) standardizing the initial dataset; (2) computing the correlation coefficient matrix; (3) calculating the eigenvalues and Eigenvector; (4) identifying principal components with a cumulative contribution rate exceeding 80% based on the contribution rate and cumulative contribution rate; (5) determining the loading factors of the principal components; (6) evaluating the significance of each principal component’s contribution to ecological restoration. Through PCA, this study aimed to elucidate the effects of various socio-economic development factors on vegetation restoration.
3 Results
3.1 Temporal characteristics of vegetation cover change
3.1.1 Seasonal variation characteristics of NDVI
Over the past 23 years, the Southwest Karst region exhibited significant seasonal variability in NDVI, showing an overall increasing trend. The rates of increase for each season were as follows: spring (0.065 per decade), summer (0.055 per decade), autumn (0.051 per decade), winter (0.043 per decade), and the growing season (0.053 per decade). Notably, spring and summer seasons experienced the highest rates of NDVI change, indicating a clear trend of increase (Figure 2). Specifically, during spring, NDVI values were observed to range from 0.49 and 0.63, marking the beginning of the growing season with a higher growth rate. During summer, NDVI reached its highest values among all seasons. In autumn, NDVI showed a fluctuating increase, with values oscillating between 0.62 and 0.76. Winter had the lowest growth rate, with NDVI values ranging from 0.46 to 0.56. During the growing season, NDVI values fluctuated between 0.70 and 0.81, showing a rising trend similar to that of summer NDVI changes.
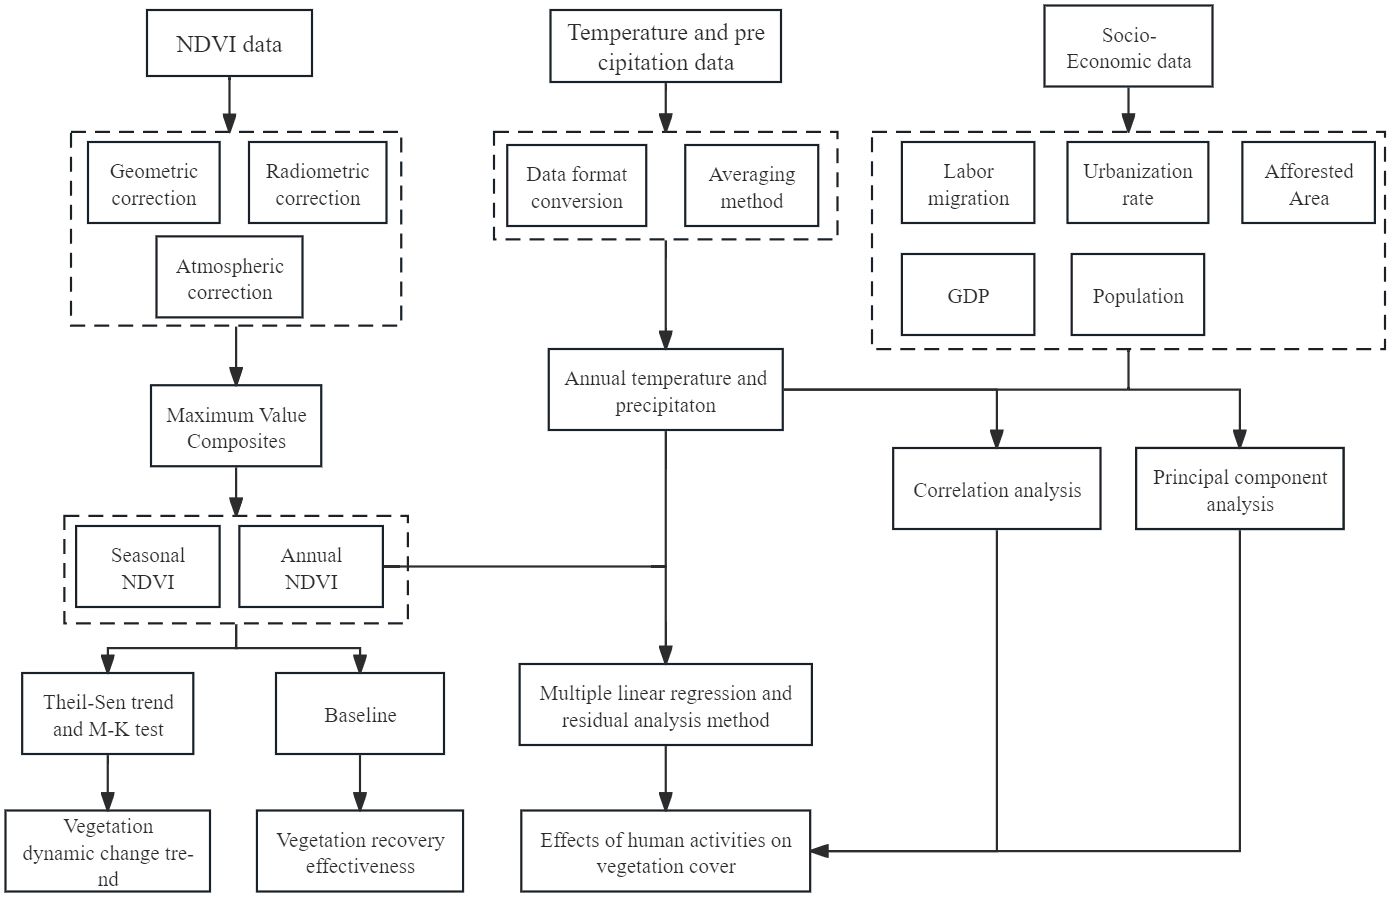
Figure 2 Data processing flowchart.
3.1.2 Annual variation characteristics of NDVI
As shown in Figure 3, the NDVI in the southwest karst region fluctuated between 0.704 and 0.811 from 1998 to 2020, with the lowest value in 1998 and the highest value in 2017. The overall trend for NDVI in the southwest karst region shows a statistically significant fluctuating increase (P< 0.05), with a growth rate of 0.053 per decade. The increase in NDVI is primarily due to a significant increase in high vegetation cover. Figure 4 shows that vegetation cover is predominantly characterized by high vegetation cover resulting from the conversion of vegetation levels II, III, and IV, with level IV conversions being the most prominent. The proportion of high vegetation cover increases from 29.72% in 1998 to 82.35% in 2020. Regions with significant increases in high vegetation cover are mainly found in western Sichuan, central Sichuan, eastern Sichuan, Chongqing, Guizhou, southeastern Yunnan, and southwestern Yunnan (Figure 5). This indicates that the vegetation cover in the southwest karst region has improved significantly, and ecological restoration is evident.
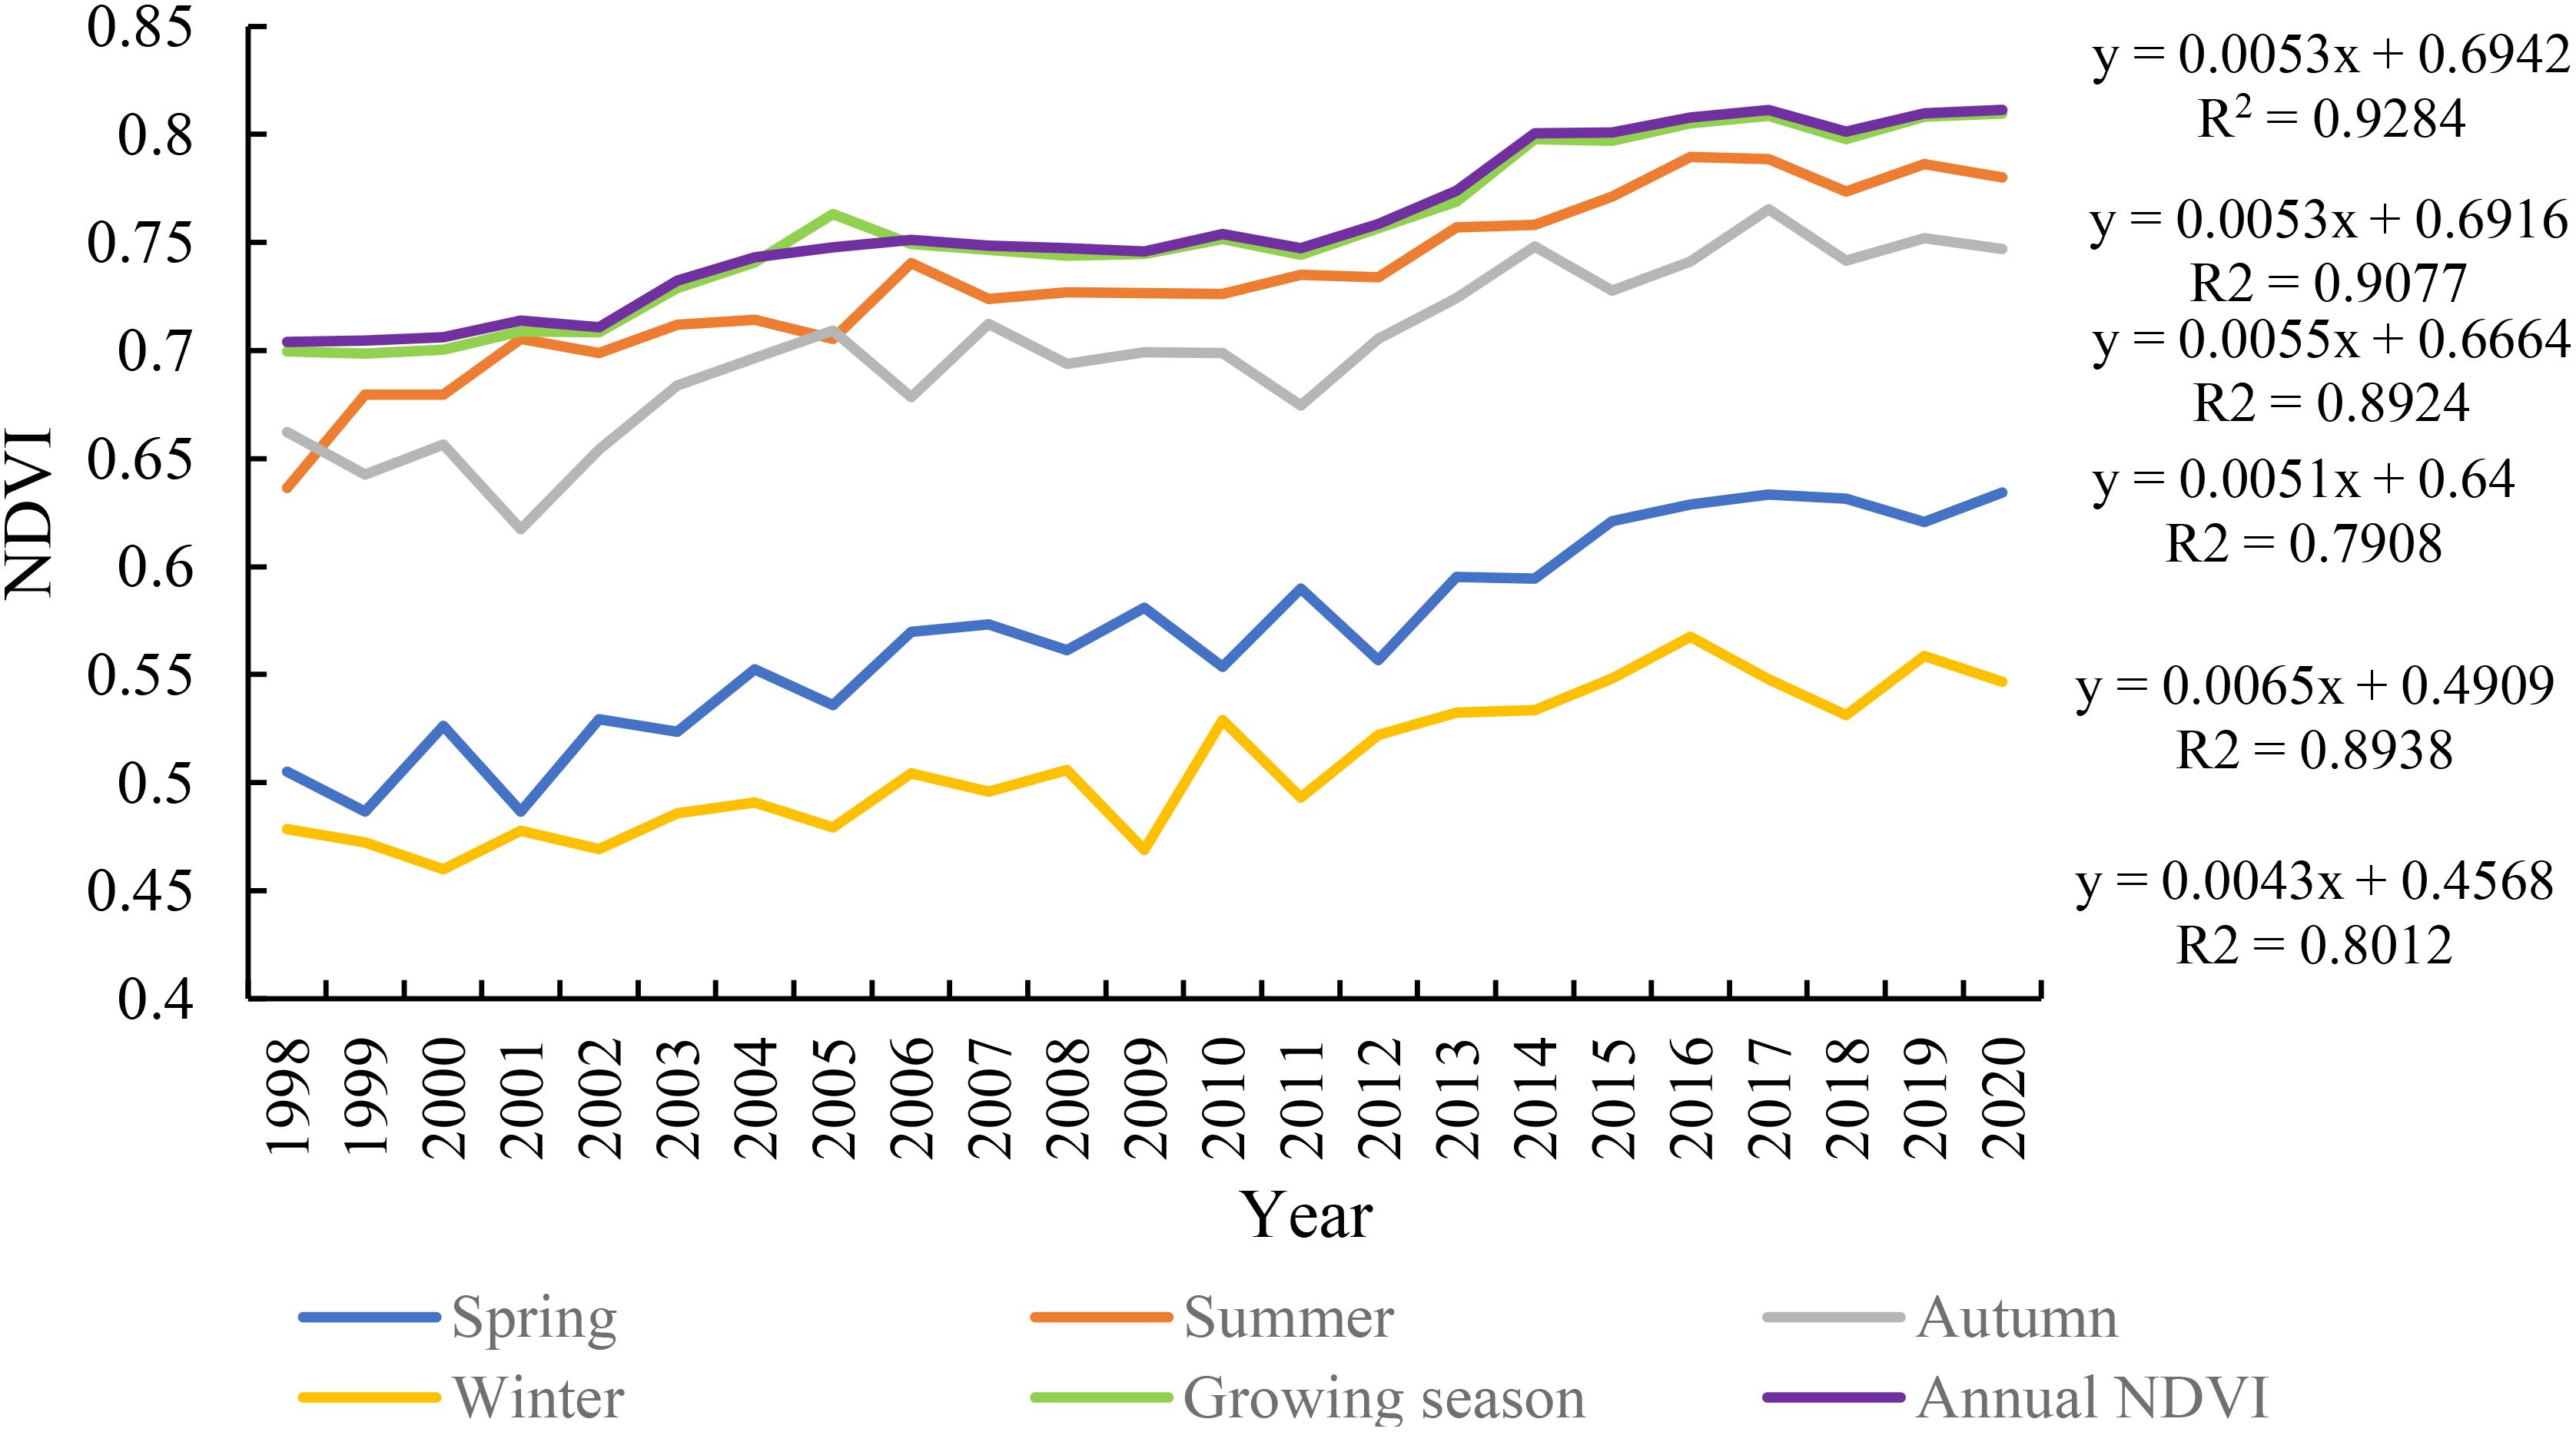
Figure 3 Time variation of NDVI in the southwest karst region.
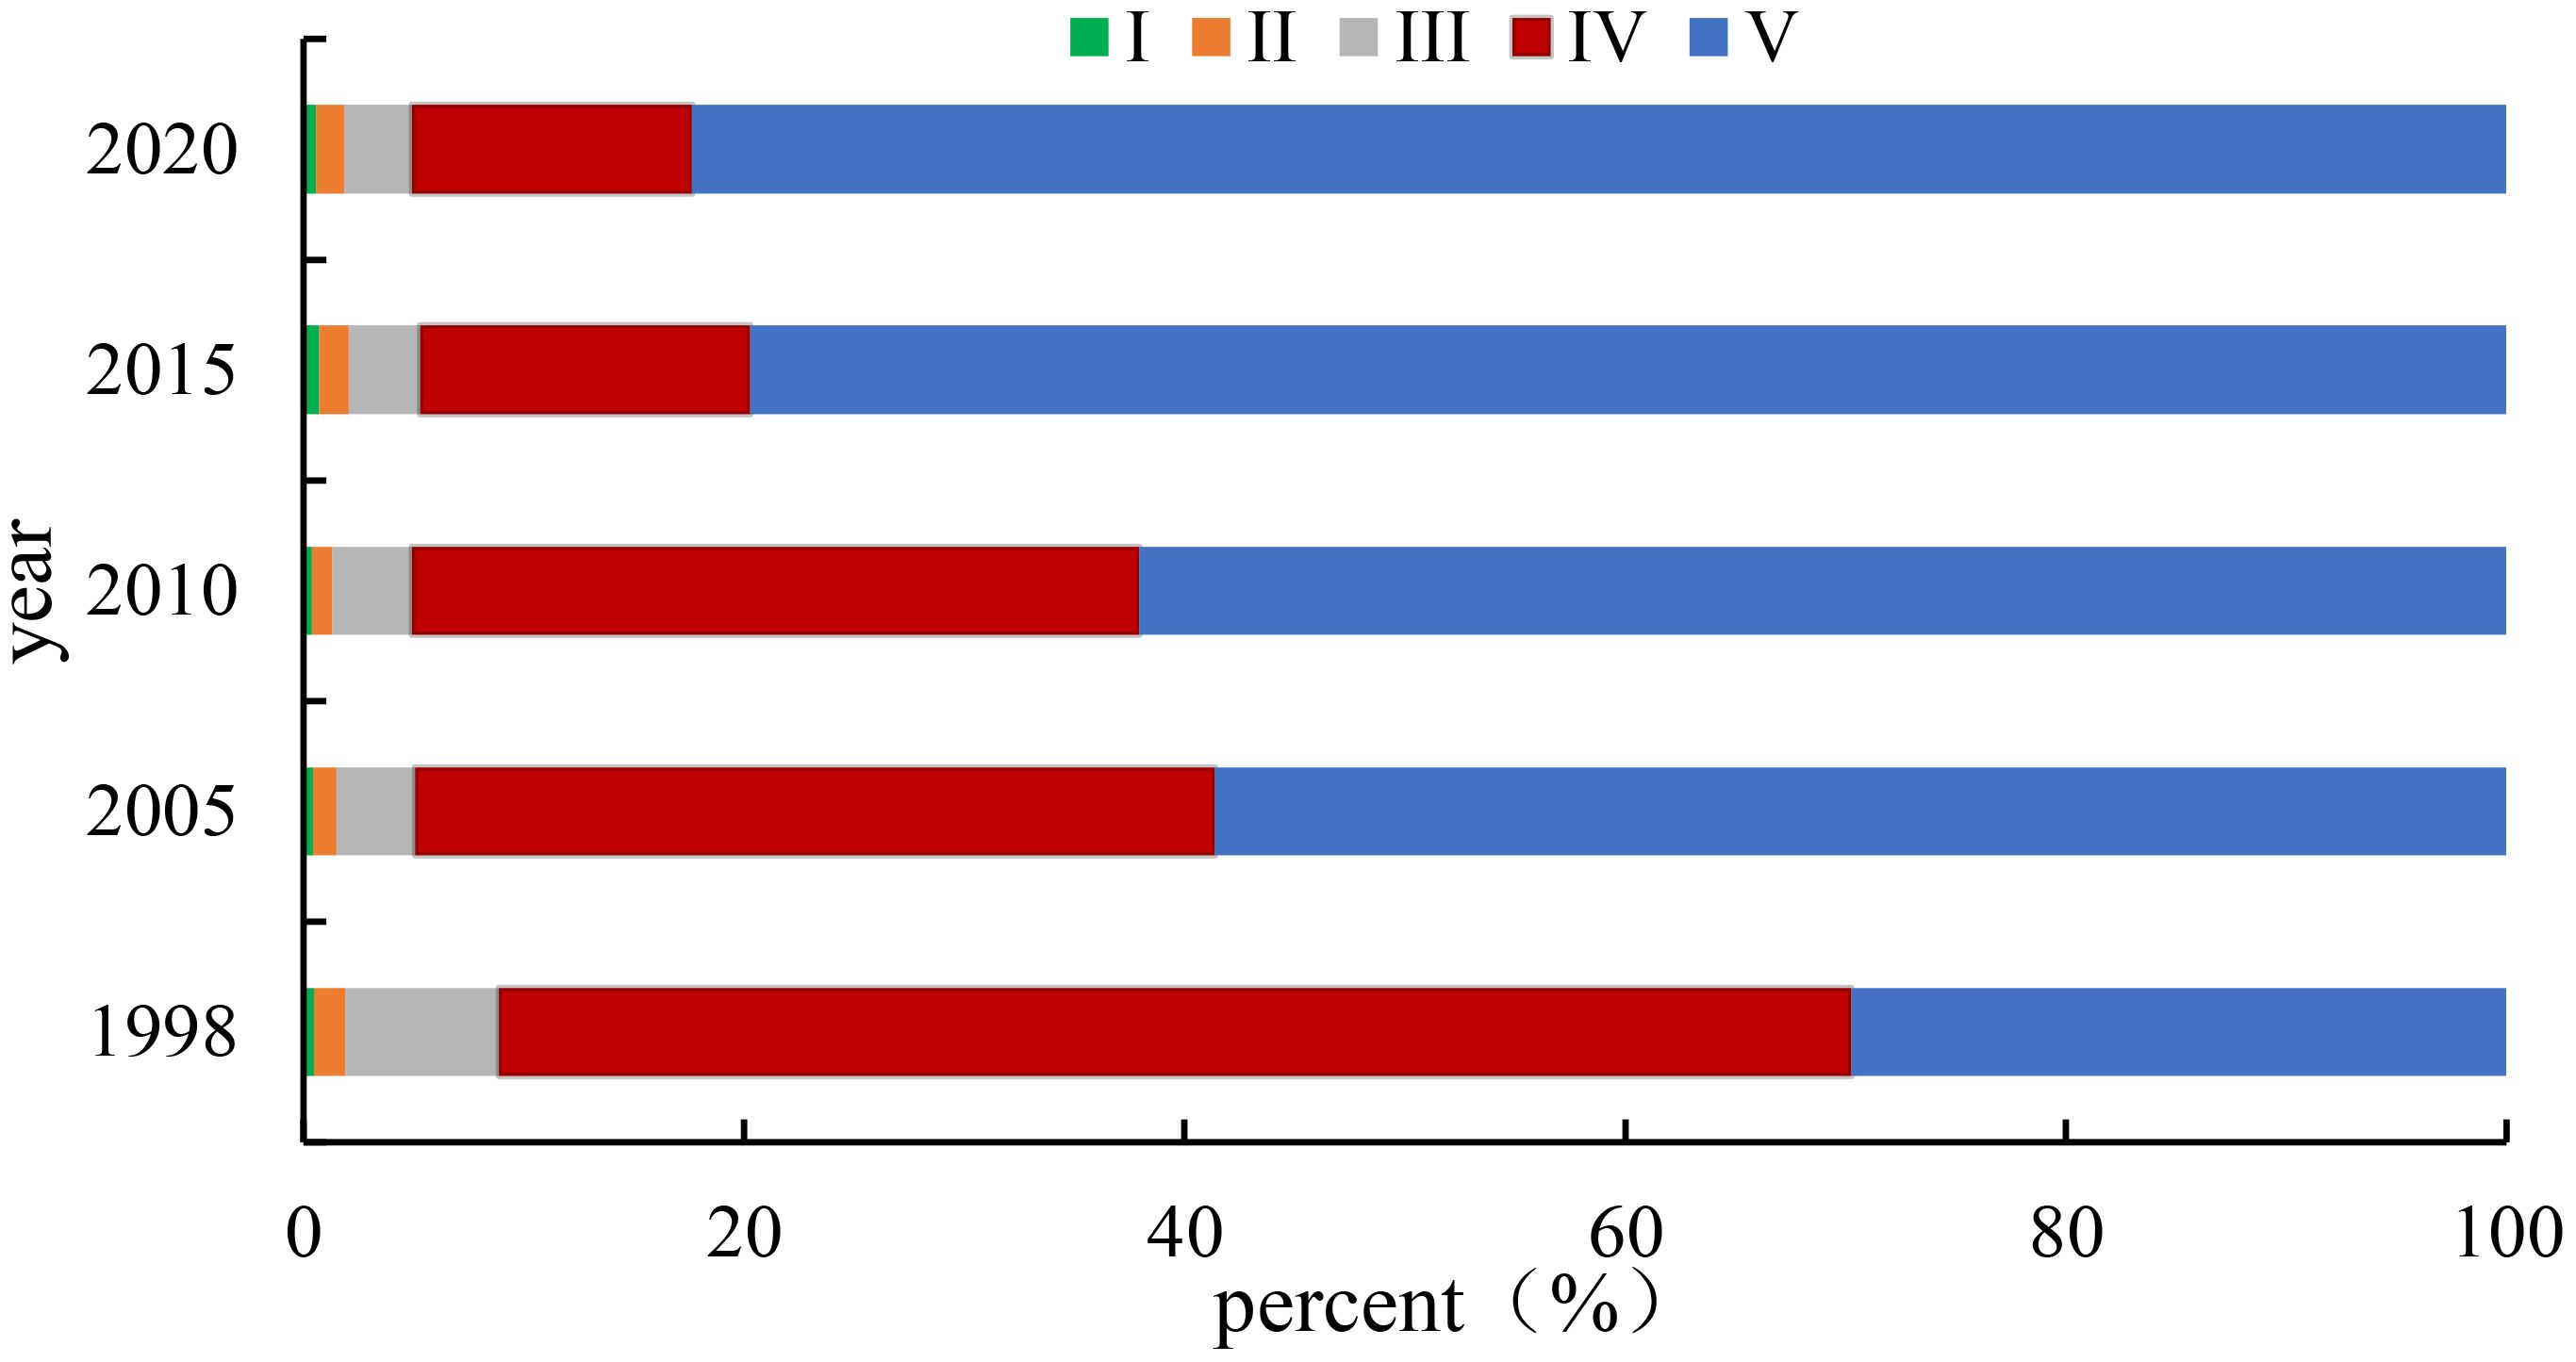
Figure 4 Proportion of different NDVI levels.
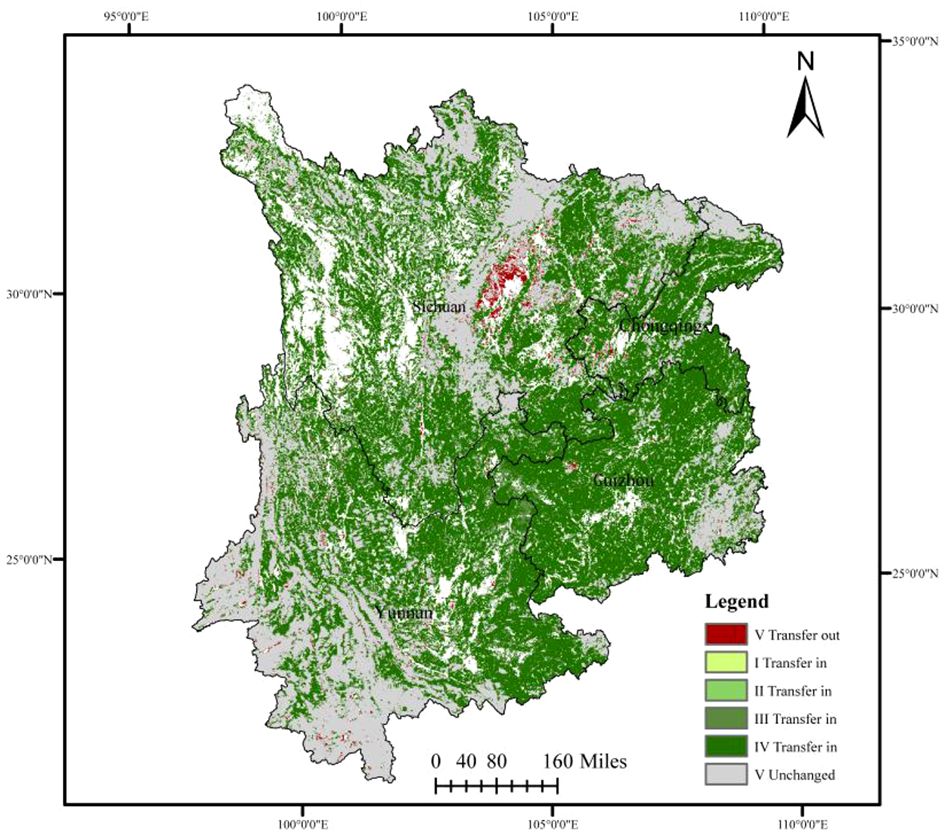
Figure 5 Changes in high vegetation cover (Level IV).
3.2 Spatial trend characteristics of vegetation cover change
To comprehensively understand the spatial trends of vegetation cover in the study area, Theil-Sen median trend analysis was used to calculate the trends for each pixel. When combined with the Mann-Kendall test, the result is the trend map shown in Figure 6, which illustrates the spatial distribution of vegetation trends within the study area. From Figure 6, it can be seen that from 1998 to 2020, the NDVI in the study area shows a decreasing trend from south to north and from southwest to northeast. In particular, the Sichuan Basin and the surrounding areas of the Hengduan Mountains show the most pronounced decrease. Over the 23-year period, the main trend observed in the southwest karst region is an upward trend, covering 87.37% of the area. This is greater than the area with a decreasing trend (6.75%) and regions with no significant change (5.87%). Among these, the area with highly significant increase accounts for 79.87% of the total area, indicating that the entire southwest karst region experienced vegetation restoration during the study period. The areas with vegetation restoration are mainly distributed in Sichuan and Yunnan, with proportions of 35.49% and 31.17%, respectively. This is closely related to the implementation of afforestation and reforestation efforts in these regions. Conversely, the areas with ecological degradation are mainly concentrated around urban areas and the periphery of the Hengduan Mountains. Urban areas, characterized by high population density, rapid economic development, and frequent industrial activities, have an impact on vegetation growth. The Hengduan Mountains and adjacent areas, although sparsely populated, suffer from complex terrain, high altitude, and variable climate, resulting in low vegetation cover and significant ecological degradation.
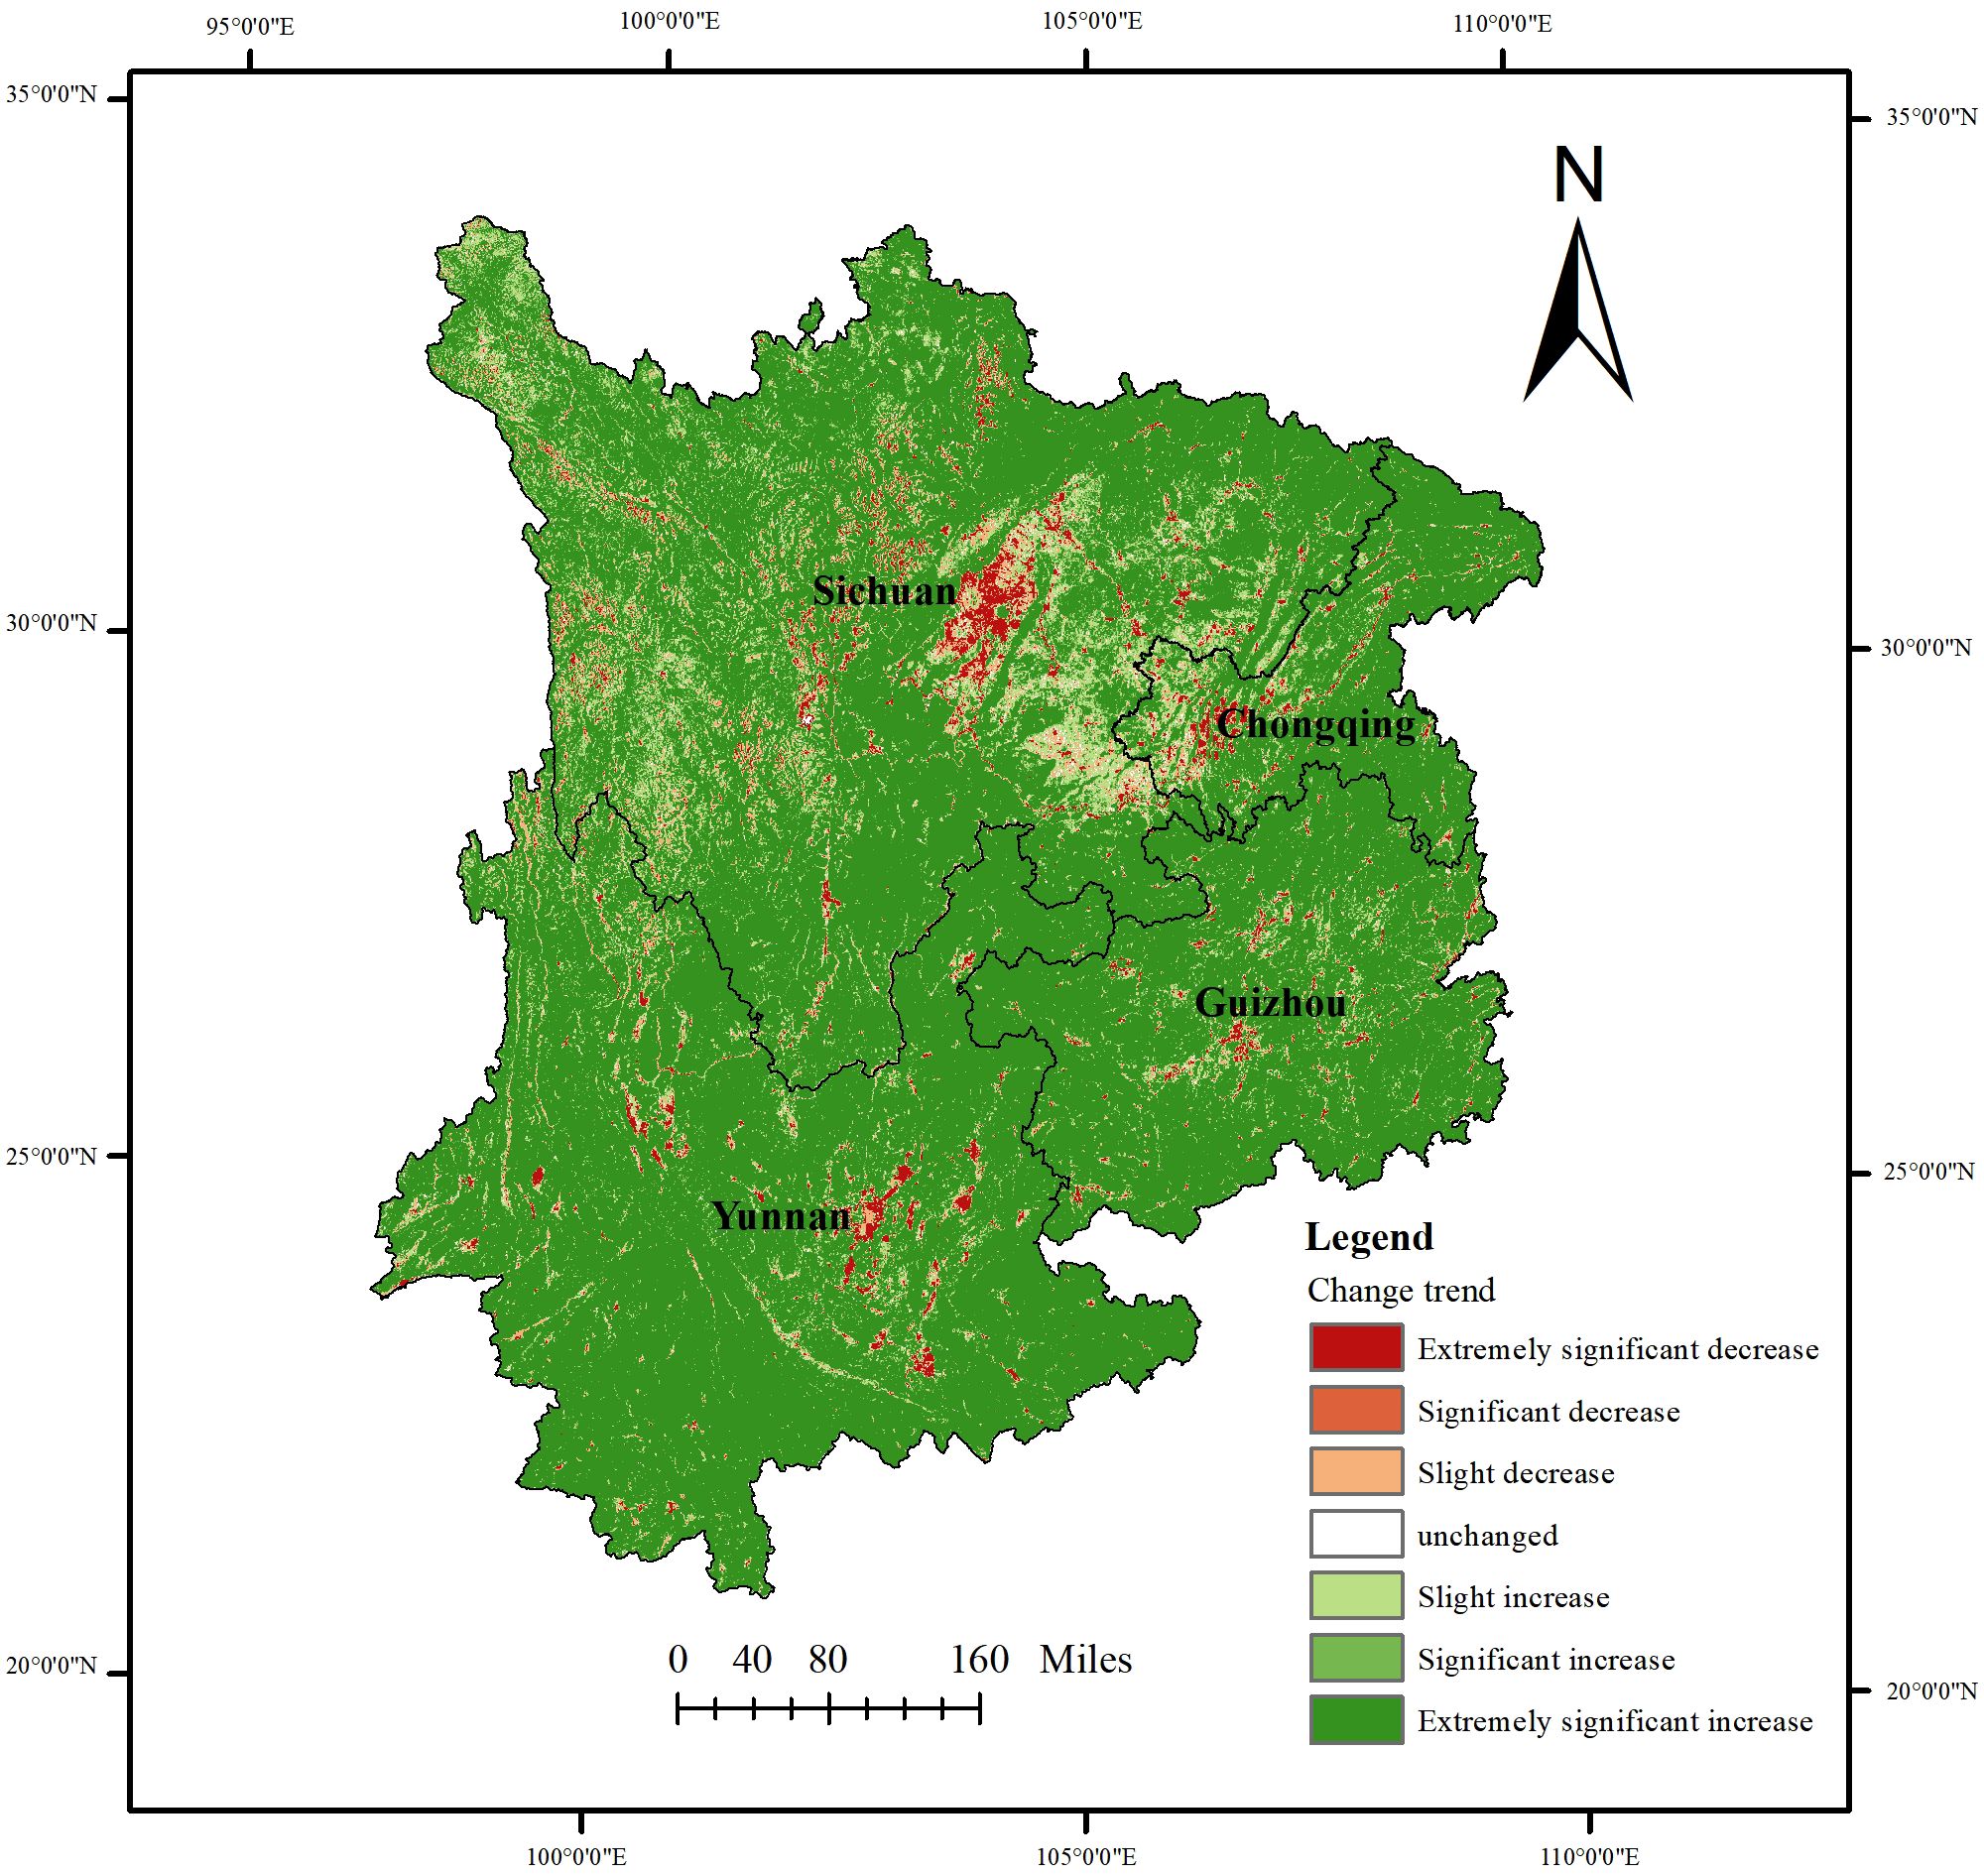
Figure 6 Spatial distribution of NDVI trends in the southwest karst region.
3.3 Dynamic changes in vegetation restoration efficiency
The ecological restoration quality in the study area varies significantly at different time scales (Table 1). During the early stages of 1998-2005, when afforestation and reforestation initiatives were initiated in the southwest region, the vegetation in Guizhou and Chongqing improved significantly, by 32.01% and 25.45%, respectively. This resulted in effective vegetation restoration and an improvement in ecological quality. Conversely, during this period, Yunnan and Sichuan did not show significant restoration trends (0< Eij ≤ 1) during this period. When the time scale was extended to 1998-2010, all four provinces and municipalities showed an increase in areas with significant vegetation improvement. Guizhou, Yunnan, and Chongqing all had over more than 50% of their areas displaying significant improvement, achieving effective vegetation restoration. Notably, Guizhou’s Eij value exceeded three during this period. From 1998 to 2020, all four provinces and municipalities saw significant improvement in vegetation, with over 70% improvement, particularly in Guizhou and Yunnan, where it exceeded 90%. This long-term perspective demonstrates that effective ecological restoration has been achieved, with Eij values exceeding three. The results indicate that as time progresses, the areas with vegetation improvement significantly expand, and the effectiveness of ecological restoration increases with time.
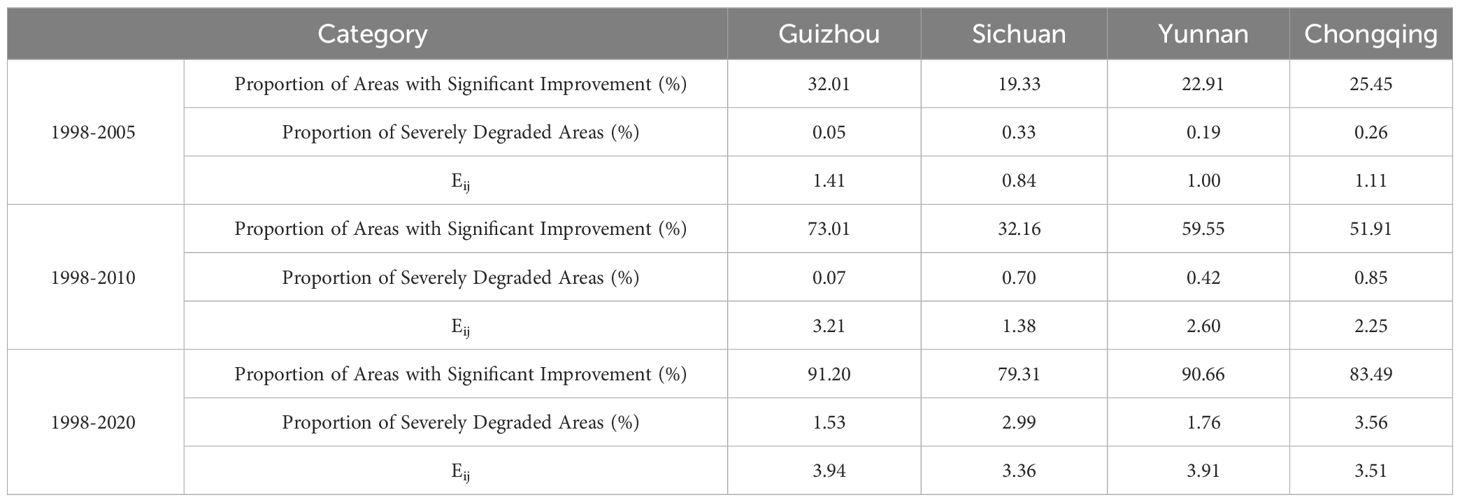
Table 1 Ecological restoration quality at different time scales.
3.4 Human activities and their impact on vegetation cover
3.4.1 Quantitative analysis of the impact of human activities on vegetation cover
This study conducted residual analysis was conducted at the pixel level to calculate the residual NDVI values for the years 1998 to 2020. Positive residuals indicate a positive impact of human activities on vegetation cover, while negative residuals indicate a negative impact. The change trend of residual NDVI was calculated through trend analysis and significance testing, revealing the spatial evolution pattern of the impact of human activities on vegetation cover (Figure 7).
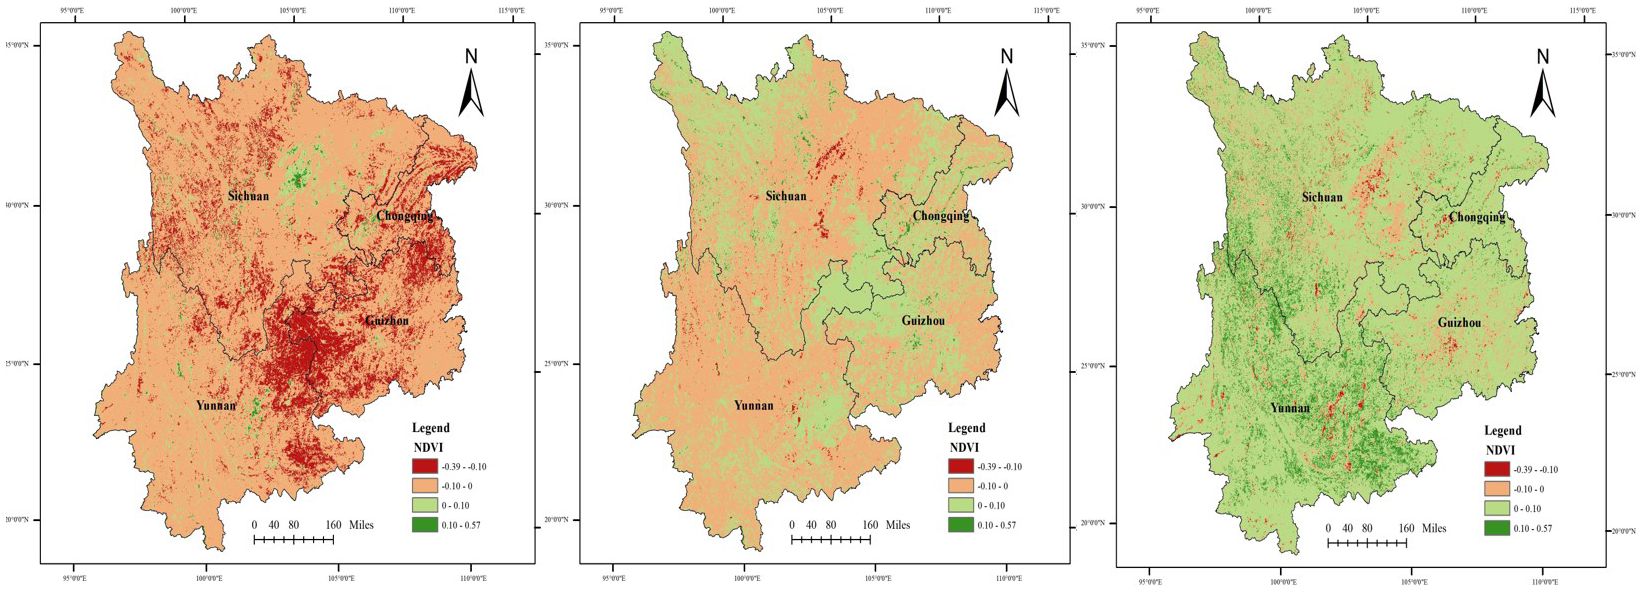
Figure 7 Spatial distribution of NDVI residual changes in the southwest karst region.
Figure 8 illustrates the impact of human activity on the residual NDVI sequence. It identifies five distinct impact characteristics of human activity: strong negative interference, negative interference, no interference, positive interference, and strong positive interference. Between 1998 and 2020, human activities had a significant spatially heterogeneous influence on vegetation restoration, with high impact in the southwest and low impact in the northeast.
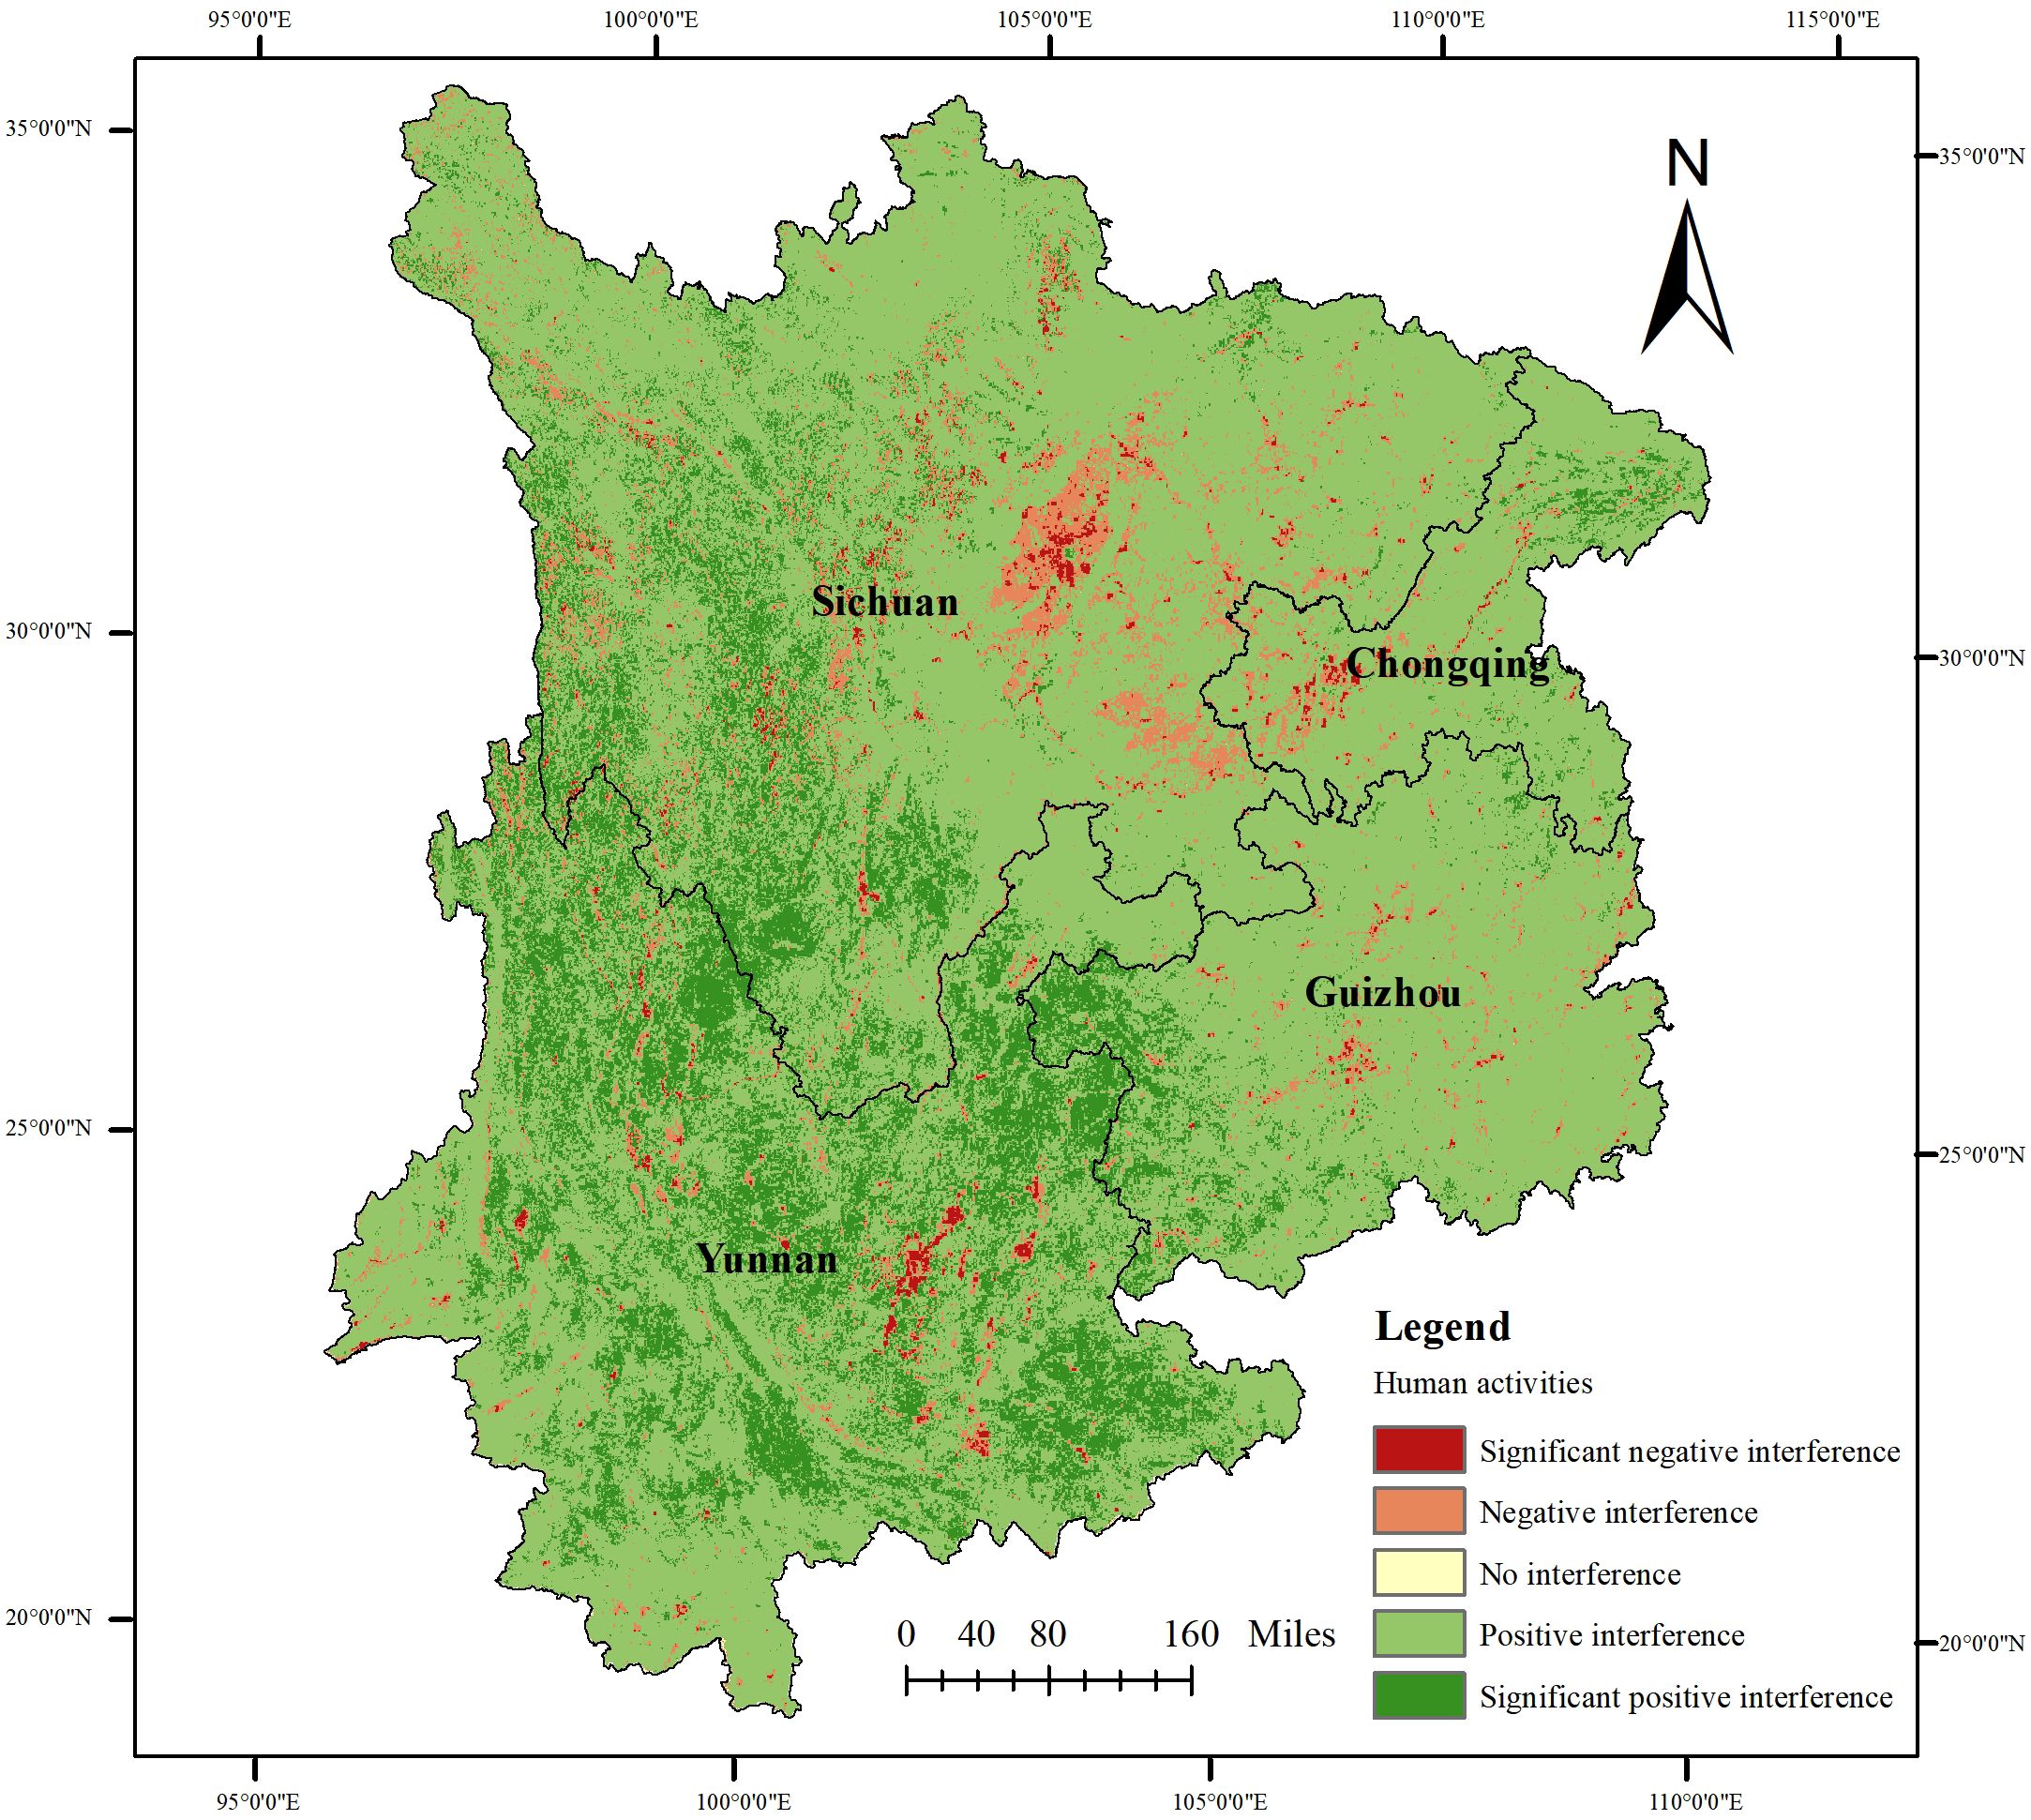
Figure 8 Impact of human activities on ecological restoration in southwest karst region.
Overall, human activities have a predominantly positive impact on vegetation cover, with 83.83% of areas exhibiting positive interference compared to only 6.09% with negative interference. This suggests that vegetation is experiencing restoration as a result of human influence. The areas where human activities positively interfere with vegetation cover are mainly located around the Hengduan Mountains, as well as in the central and southwestern areas of the Yungui Plateau. These regions are typical karst terrain areas with complex topography, severe soil erosion, and desertification. They have fragile ecosystems and have been focal points for ecological projects since 2002. Due to human activities, these areas have experienced significant increases in vegetation cover and clear ecological restoration. However, human activities have had a negative impact on vegetation in certain regions, such as central Guizhou, southeastern Yunnan, eastern Sichuan, and southeastern Sichuan. These areas are primarily located in urban zones, where the expansion of urban development and population growth have resulted in increased land use for construction.
Human activities have a dual impact on vegetation cover. In urban and surrounding areas, vegetation growth is negatively affected, leading to limited or degraded vegetation restoration. However, in areas with complex terrain and fragile ecosystems, human activities promote an increase in vegetation cover, fostering ecological restoration. In general, human activities have a dominant role in promoting vegetation growth and ecological restoration in karst terrain regions.
3.4.2 Analysis of human activities as drivers of vegetation cover changes
The residual model analyzes the impact and intensity of human activities on vegetation cover in the Southwest Karst Region. However, due to the generality of theoretical assumptions, there are inherent uncertainties. Therefore, it is necessary to refine human activity factors further to analyze their influence on vegetation cover. Previous research has shown that factors such as labor migration and increased economic levels can impact changes in vegetation cover (Chen et al., 2022; Fan et al., 2022). In this research, we identified five socio-economic determinants to represent human activities and incorporated temperature and precipitation data to account for natural influences. The variables corresponding to each indicator are detailed in Table 2.
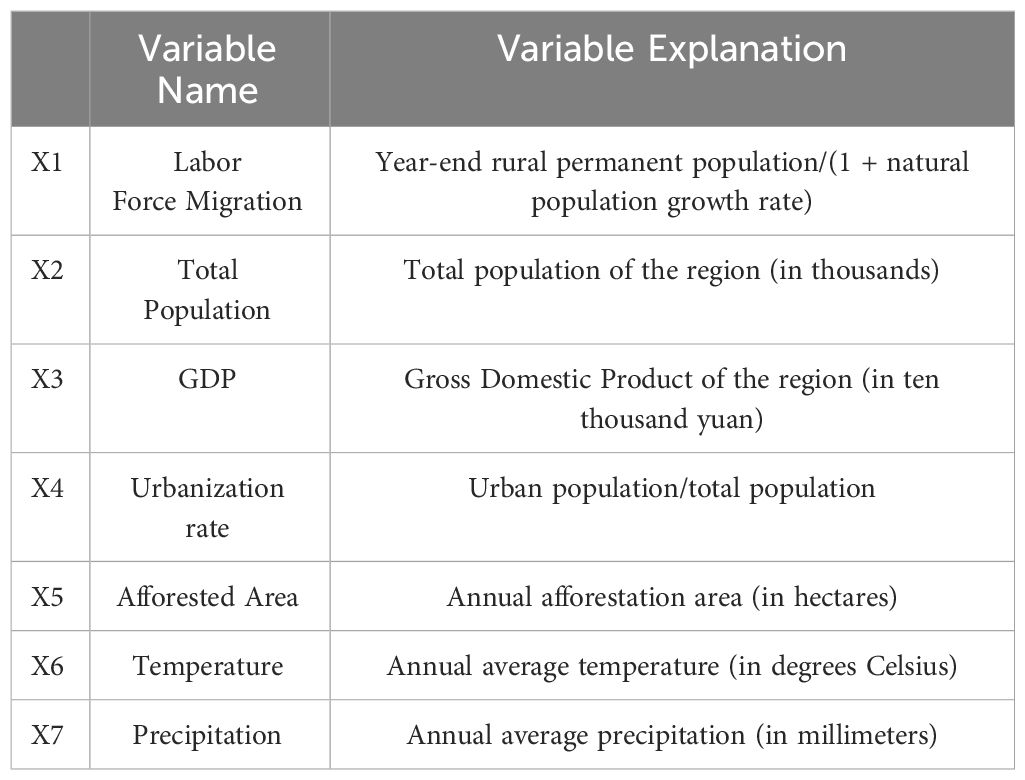
Table 2 Variable selection.
The data were standardized and analyzed using PCA in SPSS software. The analysis involved the following basic steps: Analyze → Descriptive Statistics → Descriptives → Dimension Reduction → Factor Analysis. The first step was to obtain eigenvalues using the Maximum Variance Method, which display the inherent correlation among variables (Table 3). This step is crucial to demonstrate the rationale behind conducting PCA. Subsequently, verification was performed using the Kaiser-Meyer-Olkin (KMO) measure and Bartlett’s Test of Sphericity. Table 4 shows that the final KMO output value exceeded 0.5, and the significance value of Bartlett’s Sphericity Test was less than 0.05. These results suggest that the selected variables are appropriate for factor analysis.
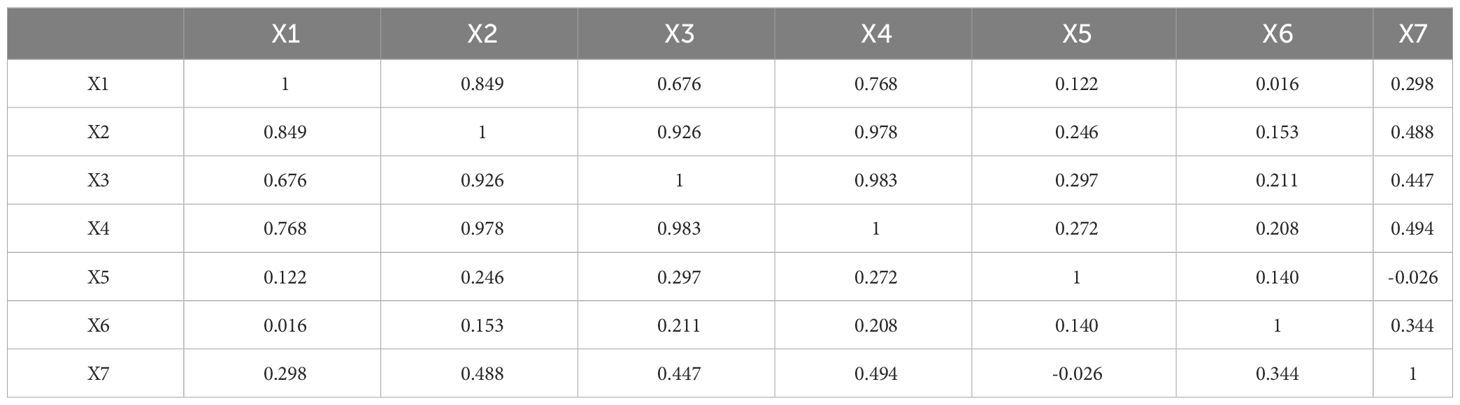
Table 3 Correlation matrix.
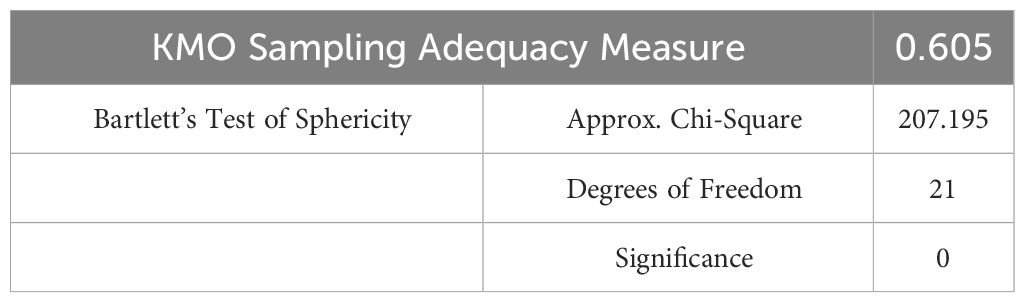
Table 4 KMO and Bartlett’s Test.
When addressing practical problems, it is common to select components with eigenvalues greater than 1 and a cumulative variance contribution rate exceeding 80%. This replaces the original individual variables with principal components for analysis, achieving data dimension reduction. Table 5 shows that the eigenvalues of the first three components are greater than 1 and the cumulative contribution rate has reached 87.865%.This indicates that the selected 7 factors’ variations are essentially captured, meeting the requirements of PCA. Therefore, we obtained the principal component loading matrix (Table 6). The first principal component shows significant loadings for labor transfer, total population, GDP, and urbanization rate, with respective loadings of 0.817, 0.980, 0.947, and 0.984. The second principal component has a significant loading for temperature, with a loading of 0.862. The third principal component shows a significant loading for afforestation area, with a loading of 0.913. To summarize, the socioeconomic factors that affect vegetation cover in the southwest karst region can be grouped into four categories: economic level, population and labor migration, urbanization development, and ecological construction.
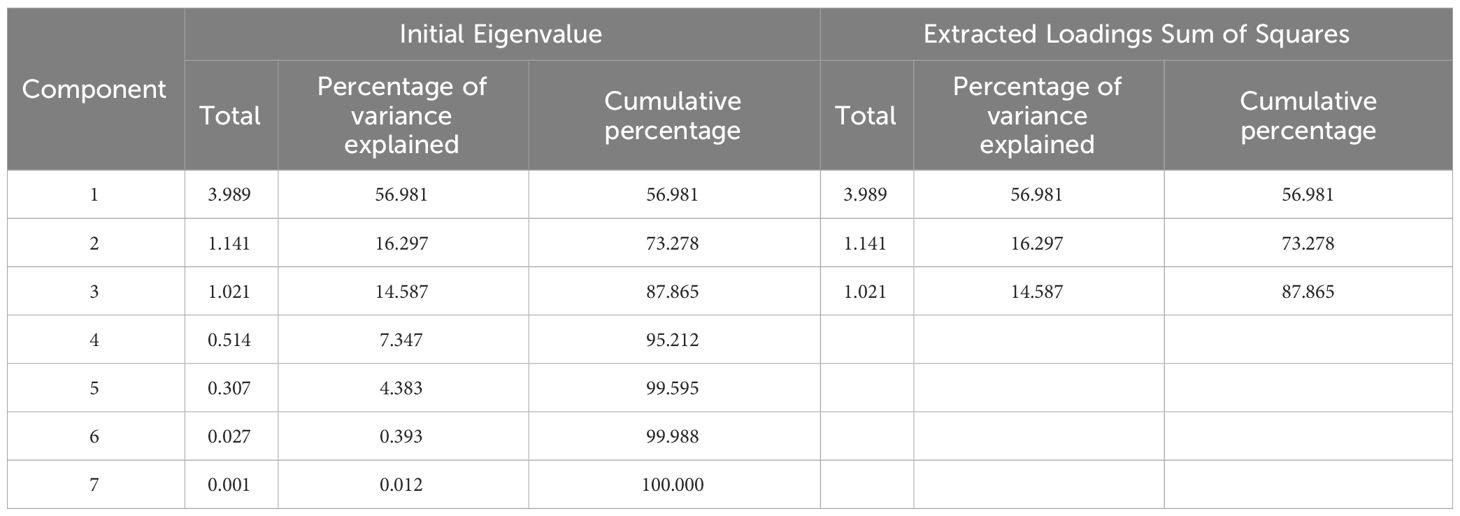
Table 5 Eigenvalues and cumulative contribution ratios.
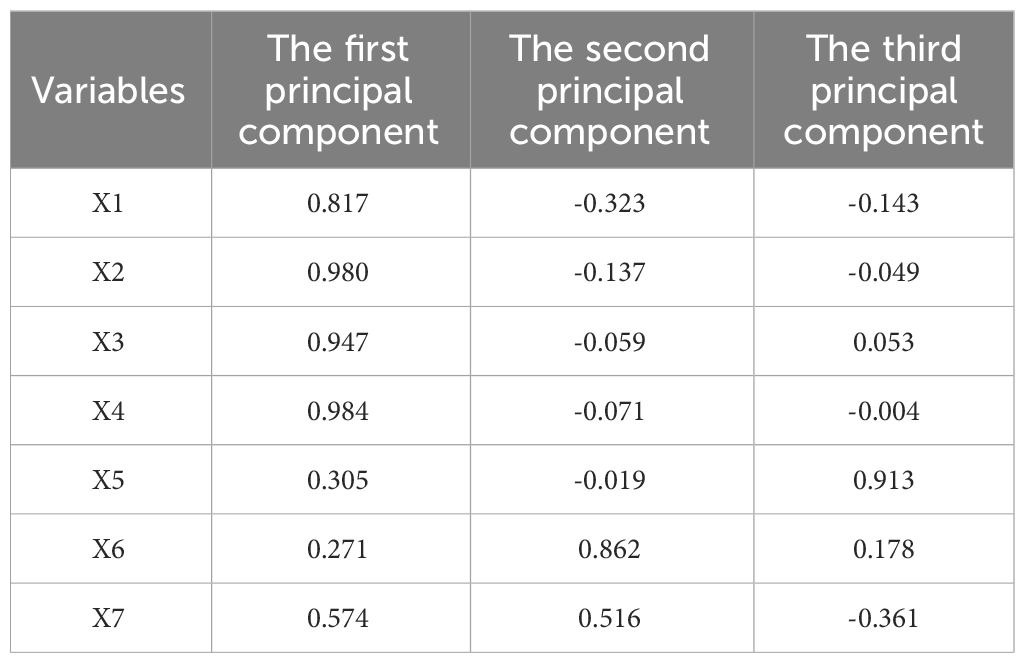
Table 6 Principal component loadings matrix.
3.4.2.1 Socio-economic development level
Gross Domestic Product (GDP) is a crucial indicator for socioeconomic development, regional planning, and environmental protection. It serves as a significant metric for reflecting economic and social progress. The GDP of the Southwest Karst region increased from 20.038 billion yuan to 22.510 billion yuan between 1998 and 2020, representing a growth of 12.34%. From 1998 to 2020, there is a significant positive correlation between GDP and vegetation cover in the southwest karst region (Supplementary Figure S1A), indicating that economic growth leads to an increase in vegetation cover. Spatially (Supplementary Figure S1B), in most areas, the increase in GDP has facilitated vegetation restoration (R > 0.6) in most areas. However, where urban expansion is rapid, a negative correlation between GDP and vegetation cover is observed. Intensified urban expansion and construction efforts have led to increased consumption of natural resources, which in turn restricts vegetation growth.
3.4.2.2 Population and labor force migration
Between1998 and 2020, the population of the southwest karst region increased from 190.55 million to 218.36 million, representing a growth of 14.59%. Population density also increased from 167 to 192 people per square kilometer, an increase of 14.97%. Supplementary Figure S2A shows a clear negative correlation between population changes and vegetation cover in the southwest karst region. In the western and southwestern parts of Sichuan, the southwestern and southeastern parts of Yunnan, and the northwestern part of Guizhou, population changes have a promoting effect on vegetation restoration, as shown in Supplementary Figure S2B. Conversely, areas with rapidly developing economies, such as urban clusters, experience a suppressive effect of population changes on ecological restoration.
Additionally, Supplementary Figure S3 illustrates the relationship between labor migration and NDVI. From 1998 to 2020, rural labor migration exhibited a fluctuating trend, initially increasing and then decreasing, while NDVI showed an overall increasing trend. The relationship between labor migration and vegetation cover showed a clear positive correlation, as represented by the equation (YNDVI=0.3054Xlabor-0.1887). This indicates that labor migration has contributed to an increase in vegetation cover, which is beneficial for ecological restoration (Supplementary Figure S4).
3.4.2.3 Urbanization development
Supplementary Figure S5 depicts a significant positive correlation between urbanization and vegetation, indicating that vegetation growth tends to increase with urban expansion. The urban population in the southwest karst region increased from 48.48 million to 122.97 million between 1998 and 2020, with a growth rate of 163.65%. The development of urbanization attracted rural populations to cities, leading to the marginalization of low-quality arable land in rural areas. The land gradually returned to forest, promoting vegetation restoration. The impact of urbanization on vegetation cover was least in Guizhou, followed by Sichuan, Yunnan, and Chongqing (Supplementary Figure S6). Guizhou’s complex topography and challenging infrastructure construction, along with Sichuan’s vast territory and significant economic disparities across different areas, as well as the harsh climate in western Sichuan, have resulted in relatively underdeveloped urbanization. Yunnan’s tourism and non-ferrous metal smelting industries have contributed to urbanization. Chongqing, as the economic center of the upper Yangtze River, has experienced rapid development in the tertiary sector and swift urbanization. However, the varying levels of urbanization across different regions have led to diverse impacts on vegetation cover.
3.4.2.4 Ecological construction
The government has implemented a series of ecological conservation projects under the goal of ecological civilization. These projects have been the most direct factors driving vegetation improvement and ecological restoration in the southwest karst region (Cai et al., 2015; Zhang et al., 2017). Therefore, this study selected the afforested area indicator to measure the impact of afforestation on vegetation cover in southwest karst region. Supplementary Figure S7 illustrates the changes in afforested area and ecological restoration. The graph shows significant fluctuations in the afforestation area within the study region, yet it generally exhibits an upward trend. Similarly, the NDVI exhibits an annual increasing trend. There is a clear positive correlation between the afforestation area and NDVI, as shown in Supplementary Figure S8. This suggests that as the area of afforestation area expands, vegetation cover increases and the ecology gradually recovers. The afforested area experienced a significant increase starting from 2002, reaching its peak in 2003. The NDVI values peaked in 2004, 2005, and 2006, which was 1-3 years after the peak afforested area by 1-3 years, as is commonly observed worldwide. Although the afforested area increased from 2008 onward, adverse weather conditions and the Wenchuan earthquake in the southwestern region during this period did not result in a noticeable increase in NDVI. From 2011 onwards, despite a reduction in afforested area, the region’s forestry and ecological projects entered a mature phase, consolidating the achievements of ecological construction. As a result, NDVI gradually increased. Starting in 2014, a new round of land reforestation and grassland restoration projects was initiated, resulting in a significant increase in afforested area and a corresponding rise in NDVI.
In summary, over the course of 23 years, the afforested area and NDVI in the southwest karst region both exhibited fluctuating trends. However, the general upward trajectory of both afforested area and NDVI suggests a coherent relationship. Specifically, NDVI consistently increased 1-3 years after afforested area expansion, reflecting the implementation of ecological projects such as land reforestation. This trend indicates that vegetation cover is gradually increasing, contributing to ecological restoration in the southwest karst region.
4 Discussion
4.1 Effects of climate change on vegetation cover
In the southwestern karst region of China, climate change is a significant factor influencing vegetation cover, exerting crucial impacts on the local ecosystems and vegetation distribution (Zhang et al., 2022). Multiple studies have demonstrated the notable effects of temperature and precipitation on vegetation cover, especially over long-term scales (Xu et al., 2019). Firstly, temperature is a key factor influencing plant growth and distribution. High temperatures accelerate soil moisture evaporation, increasing the water demand for vegetation growth, while low temperatures may constrain plant growth and development (Lu et al., 2023). Therefore, suitable temperatures facilitate plant growth, promoting vegetation cover and ecosystem stability. Secondly, precipitation is equally vital for vegetation cover in the southwestern karst region. Increased precipitation provides ample water resources, promoting plant growth, especially crucial for vegetation survival and restoration during dry seasons. Additionally, temperature and precipitation also play a role in vegetation restoration, albeit their contribution is relatively minor; however, this contribution cannot be overlooked (Xu et al., 2019; Chen et al., 2021).
Although this paper primarily focuses on the impact of human activities on vegetation cover, the influence of climate change cannot be overlooked. With global climate change, many regions, including the southwest karst region, are facing challenges such as rising temperatures and changes in precipitation patterns. These changes will have profound effects on vegetation growth and distribution (Peng et al., 2021). Therefore, considering the dual effects of human activities and climate change will contribute to a better understanding of the mechanisms driving changes in vegetation cover, as well as the formulation of more effective strategies for ecological protection and restoration.
4.2 Effects of human activities on vegetation cover
Vegetation is a crucial element of terrestrial ecosystems and an important indicator of ecological changes. Human activities have a significant impact on vegetation dynamics (Mueller et al., 2014). In the 21st century, human activities have expanded in intensity and scope, exerting a substantial influence on regional vegetation cover (Hua et al., 2017; Piao et al., 2019).
Our study indicates that human activities have a predominantly positive impact on vegetation cover. This is due to the combined effects of economic growth, population dynamics, and ecological construction. As economic status improves, governments are able to allocate more resources and funds to ecological projects. Additionally, the development of eco-tourism and forestry industries contributes to forest preservation and an increase in vegetation cover. Population changes are a consequence of economic growth. Population dynamics significantly influence the evolution of regional vegetation cover (Jacob, 2003; Li et al., 2013). Therefore, a reduction in population could potentially alleviate pressures on the local ecological environment, particularly in ecologically fragile karst areas. This relief may facilitate improvements in land cover conditions. As economic development progresses, rural-to-urban labor migration becomes a significant human activity. Between 1998 and 2020, China’s rural permanent population decreased by 38.68%. The impact of labor migration on vegetation cover is mainly achieved through changes in land use. Labor migration affects land use, which, in turn, reflects the intensity of human activities. Land use changes are closely linked to the implementation of national ecological projects, which can have an impact on vegetation restoration (Huang et al., 2020). Labor migration facilitates shifts between land use types, leading to a substantial increase in forest area and promoting forest transformation and vegetation restoration (Deshingkar, 2012; Li et al., 2016). Additionally, labor migration alters land use patterns. The loss of labor force may lead to a decline in land use intensity, resulting in marginalization and extensive use of low-quality land, and even eventual land abandonment or fallowing (Zakkak et al., 2018). In karst regions with complex terrain, converting sloping farmland to forestland or fallow can effectively stimulate vegetation restoration and curb soil erosion (Aide and Grau, 2004).
From the perspective of relevant national policies, human activities have a significant impact on vegetation cover, with ecological construction being the most direct influencing factor. Research conducted by Zhao et al. (2018) and others showed a significant positive correlation between cumulative afforestation area and NDVI in Yulin and Yan’an cities in Shaanxi Province from 1998 to 2013. This demonstrates the effectiveness of afforestation projects in promoting vegetation restoration. Qu et al. (2020) conducted a study on the Yangtze River Basin and found that afforestation and reforestation efforts, which benefited from ecological protection policies such as the Grain for Green Program, significantly improved vegetation. Our study also confirms the positive impact of ecological projects on vegetation cover. The restoration of vegetation in karst regions is attributed to the restoration of urban ecosystems and the construction of ecological barriers in mountainous areas. Initiatives such as urban green spaces and mine reclamation projects have increased vegetation cover in urbanized regions during the process of urban development. In karst mountainous areas, a series of ecological reforestation projects have significantly contributed to vegetation restoration (Huang et al., 2023). The construction of ecological conservation zones in the Three Gorges Reservoir Area and the establishment of ecological barriers primarily in the Wuling Mountains, Daba Mountains, and Dalou Mountains have positively influenced water and soil conservation in Chongqing. Long-term reforestation efforts and policies have enhanced ecological functions in the region, such as water source conservation, flood regulation, and soil preservation in the region (Qun and Hanying, 2007; Liao et al., 2020).
Certainly, human activities have had some negative impacts on vegetation cover, especially in urbanized areas. The rapid process of urbanization has led to the expansion of cities, resulting in the conversion of ecological areas into construction land. In addition, the increase in population pressure has contributed to the reduction of vegetation cover in the region (Sun et al., 2015; Jin et al., 2018).
4.3 Strategies for enhancing vegetation cover
The southwest karst region is characterized by its hilly and mountainous terrain, complex topography, and fragile ecological environment, where vegetation plays an important role in both ecological restoration and economic development.
First, managing rural-urban labor migration can help alleviate ecological pressure in the areas of origin. After labor migration, the marginalization of agricultural land in mountainous regions can be addressed by implementing measures such as afforestation and slope management to increase vegetation cover.
Second, during urbanization, controlling land expansion to preserve ecological spaces is crucial. The conversion of ecological land into construction land directly leads to a reduction in vegetation cover. Rationalization and optimization of land use in urbanization areas can minimize the conversion of ecological land, such as forests, grasslands and farmlands, into urban land, thereby increasing vegetation cover in urbanized regions.
Finally, continued efforts are needed to implement key forestry projects, including the Six Major Forestry Projects, to maintain the synergy of economic, ecological, and social benefits in forestry. Emphasis should be placed not only on expanding forest area, but also on improving forest quality. Developing ecotourism, optimizing the structure of the forest industry, focusing on the ecological and environmental protection functions of forestry, and maintaining or increasing the forest cover can improve the quality of forest areas and contribute to the improvement of vegetation cover.
4.4 Study limitations
This research enhances our understanding of regional ecological environments and offers insights for formulating rational ecological protection measures. However, this study has certain limitations. Firstly, the correlation analysis between various influencing factors and NDVI does not imply causation between them, likely due to the availability of data and factors, such as population, GDP, and policies, without considering the impact of agricultural production. Future research will consider factors related to agricultural production and other aspects and delve deeper into their influence on vegetation cover.
5 Conclusion
The southwest karst region in China is a typical ecologically fragile area where vegetation cover is significantly influenced by human activities. The vegetation cover in karst regions affects the local ecological environment and is significant for the ecological security and economic development of China and Asia. This study is based on SPOT-VGT NDVI data from 1998 to 2020 and employs various methods, including trend analysis, “baseline” assessment, multiple linear regression, residual analysis, and principal component analysis, to investigate vegetation cover and its response to human activities in the southwestern karst region.
The research findings indicate that over the past 23 years, the Southwest Karst region has exhibited significant interannual variability and seasonal differences in NDVI for vegetation, with an upward trend. The increase rates are as follows: interannual change at 0.053 per decade, spring at 0.065 per decade, summer at 0.055 per decade, autumn at 0.051 per decade, winter at 0.043 per decade, and the growing season at 0.053 per decade. Spatial analysis reveals that 87.37% of the total area shows an increasing trend in NDVI, suggesting a widespread vegetation restoration across the entire region. However, decreasing trends are observable from the south to the north and the southwest to the northeast. Additionally, over time, the areas with improved vegetation across the four provinces and municipalities have expanded, with increasing effectiveness in vegetation restoration observed. From 1998 to 2020, the NDVI residual values have progressively increased, shifting from negative to positive, indicating that human activities have predominantly promoted vegetation growth in karst landscapes. Lastly, based on principal component analysis, the socioeconomic factors influencing vegetation cover change in the region can be categorized into four main groups: the level of economic development, population and labor force migration, urbanization, and vegetation management.
Data availability statement
The original contributions presented in the study are included in the article/Supplementary Material. Further inquiries can be directed to the corresponding author.
Author contributions
ZL: Conceptualization, Data curation, Formal analysis, Funding acquisition, Investigation, Methodology, Project administration, Resources, Software, Supervision, Validation, Visualization, Writing – original draft, Writing – review & editing. YZ: Conceptualization, Data curation, Formal analysis, Funding acquisition, Investigation, Methodology, Project administration, Resources, Software, Supervision, Validation, Visualization, Writing – original draft, Writing – review & editing.
Funding
The author(s) declare financial support was received for the research, authorship, and/or publication of this article. This study was supported by the Fund Project of State Key Laboratory of Remote Sensing Information and Image Analysis Technology: Research on Hyperspectral Inversion Model for Surface Radon Gas Information (Grant number: 6142A01210406).
Conflict of interest
The authors declare that the research was conducted in the absence of any commercial or financial relationships that could be construed as a potential conflict of interest.
Publisher’s note
All claims expressed in this article are solely those of the authors and do not necessarily represent those of their affiliated organizations, or those of the publisher, the editors and the reviewers. Any product that may be evaluated in this article, or claim that may be made by its manufacturer, is not guaranteed or endorsed by the publisher.
Supplementary material
The Supplementary Material for this article can be found online at: https://www.frontiersin.org/articles/10.3389/fevo.2024.1326601/full#supplementary-material
References
Abera A., Yirgu T., Uncha A. (2020). Correction to: Impact of resettlement scheme on vegetation cover and its implications on conservation in Chewaka district of Ethiopia. Environ. Syst. Res. 9, 5. doi: 10.1186/s40068-020-00166-5
Aide T. M., Grau H. R. (2004). Ecology. Globalization, migration, and Latin American ecosystems. Science 305, 1915–1916. doi: 10.1126/science.1103179
Bai H., Gong Z., Sun G., Li L. (2022). Data-driven artificial intelligence model of meteorological elements influence on vegetation coverage in north China. Remote Sens. 14 (6), 1307. doi: 10.3390/rs14061307
Cai H., Yang X., Xu X. (2015). Human-induced grassland degradation/restoration in the central Tibetan Plateau: The effects of ecological protection and restoration projects. Ecol. Eng. 83, 112–119. doi: 10.1016/j.ecoleng.2015.06.031
Cao X., Gu Z., Chen J., Liu J., Shi P. J. (2006). Analysis of human_induced steppe degradation based on remote sensing in xilin gole, inner mongolia, china. Chin. J. Plant Ecol. 30, 268–277. doi: 10.17521/cjpe.2006.0036
Chen S., Zhu Z., Liu X., Yang L. (2022). Variation in vegetation and its driving force in the pearl river delta region of China. Int. J. Environ. Res. Public Health 19 (16), 10343. doi: 10.3390/ijerph191610343
Chen W., Bai S., Zhao H., Han X., Li L. (2021). Spatiotemporal analysis and potential impact factors of vegetation variation in the karst region of Southwest China. Environ. Sci. AND pollut. Res. 28, 61258–61273. doi: 10.1007/s11356-021-14988-y
Cheng J., Huang C., Gan X., Peng C., Deng L. (2023). Can forest carbon sequestration offset industrial CO2 emissions? A case study of Hubei Province, China. J. Clean. Product. 426, 139147. doi: 10.1016/j.jclepro.2023.139147
Dagnachew M., Kebede A., Moges A., Abebe A. (2020). Effects of climate variability on normalized difference vegetation index (NDVI) in the gojeb river catchment, omo-gibe basin, Ethiopia. Adv. Meteorol. 2020, 8263246. doi: 10.1155/2020/8263246
Deshingkar P. (2012). Environmental risk, resilience and migration: implications for natural resource management and agriculture. Environ. Res. Lett. 7 (1), 015603. doi: 10.1088/1748-9326/7/1/015603
du Plessis W. P. (1999). Linear regression relationships between NDVI, vegetation and rainfall in Etosha National Park, Namibia. J. Arid Environ. 42, 235–260. doi: 10.1006/jare.1999.0505
Evans J., Geerken R. (2004). Discrimination between climate and human induced dryland degradation. J. Arid Environ. 57, 535–554. doi: 10.1016/S0140-1963(03)00121-6
Fan Z., Bai X., Zhao N. (2022). Explicating the responses of NDVI and GDP to the poverty alleviation policy in poverty areas of China in the 21st century. PloS One 17, e0271983. doi: 10.1371/journal.pone.0271983
Guo K., Liu C.-C., Xie Z.-Q., Li F. Y., Franklin S. B., Lu Z.-J., et al. (2018). China Vegetation Classification: concept, approach and applications. PHYTOCOENOLOGIA 48, 113–120. doi: 10.1127/phyto/2017/0166
Hua W., Chen H., Zhou L., Xie Z., Qin M., Li X., et al. (2017). Observational quantification of climatic and human influences on vegetation greening in China. Remote Sens 9 (5), 425. doi: 10.3390/rs9050425
Huang C., Gan X., Wan Y., Jin L., Teng J., Li Z. (2024). China contributed to low-carbon development: carbon emission increased but carbon intensity decreased. Front. Ecol. Evol. 12. doi: 10.3389/fevo.2024.1338742
Huang C., Zhao D., Liao Q., Xiao M. (2023). Linking landscape dynamics to the relationship between water purification and soil retention. Ecosys. Serv. 59, 101498. doi: 10.1016/j.ecoser.2022.101498
Huang C., Zhou Z., Teng M., Wu C., Wang P. (2020). Effects of climate, land use and land cover changes on soil loss in the Three Gorges Reservoir area, China. Geogr. Sustain. 1, 200–208. doi: 10.1016/j.geosus.2020.08.001
Hussien K., Kebede A., Mekuriaw A., Beza S. A., Erena S. H. (2023). Spatiotemporal trends of NDVI and its response to climate variability in the Abbay River Basin, Ethiopia. Heliyon 9, e14113. doi: 10.1016/j.heliyon.2023.e14113
Jacob J. (2003). Short-term effects of farming practices on populations of common voles. Agric. Ecosyst. Environ. 95, 321–325. doi: 10.1016/S0167-8809(02)00084-1
Jiang Z., Lian Y., Qin X. (2014). Rocky desertification in Southwest China: Impacts, causes, and restoration. Earth-Science Rev. 132, 1–12. doi: 10.1016/j.earscirev.2014.01.005
Jin K., Wang F., Li P. (2018). Responses of vegetation cover to environmental change in large cities of China. Sustainability 10 (1), 270. doi: 10.3390/su10010270
Jin K., Wang F., Han J., Shi S., Ding W. (2020). Contribution of climatic change and human activities to vegetation NDVI change over China during 1982-2015. Acta Geographica Sinica (2020) 75 (5), 961–974. doi: 10.11821/dlxb202005006
Li A., Huang J., Wu J. (2012). Distinguishing between human-induced and climate-driven vegetation changes: A critical application of RESTREND in inner Mongolia. Landscape Ecol. 27, 969–982. doi: 10.1007/s10980-012-9751-2
Li C., Kuang Y., Huang N., Zhang C. (2013). The long-term relationship between population growth and vegetation cover: an empirical analysis based on the panel data of 21 cities in guangdong province, China. Int. J. Environ. Res. Public Health 10, 660–677. doi: 10.3390/ijerph10020660
Li S., Sun Z., Tan M., Li X. (2016). Effects of rural-urban migration on vegetation greenness in fragile areas: A case study of Inner Mongolia in China. J. Geograph. Sci. 26, 313–324. doi: 10.1007/s11442-016-1270-7
Liao Q., Wang Z., Huang C. (2020). Green infrastructure offset the negative ecological effects of urbanization and storing water in the three gorges reservoir area, China. Int. J. Environ. Res. Public Health 17 (21), 8077. doi: 10.3390/ijerph17218077
Liu Y., Wang L., Li X. (2024). Analysis on Spatio-Temporal Variability of Fractional Vegetation Cover and Influencing Factors from 2000 to 2020 in Southwestern China. Plateau Meteorology 43 (1), 264–276. doi: 10.7522/j.issn.1000-0534.2023.00052
Lu X.-j., Li Z.-b., Yan H.-b., Liang Y.-j. (2023). Spatiotemporal variations of drought and driving factors based on multiple remote sensing drought indices: A case study in karst areas of southwest China. J. OF MOUNTAIN Sci. 20, 3215–3232. doi: 10.1007/s11629-023-7927-7
Luo L., Wei M., Zhuang Y., Zhang Y., Yi S., Xu J., et al. (2018). The impacts of climate change and human activities on alpine vegetation and permafrost in the Qinghai-Tibet Engineering Corridor. Ecol. Indic. 93, 24–35. doi: 10.1016/j.ecolind.2018.04.067
Macias-Fauria M. (2018). Satellite images show China going green. Nature 553, 411–413. doi: 10.1038/d41586-018-00996-5
Mao D., Wang Z., Luo L., Ren C. (2012). Integrating AVHRR and MODIS data to monitor NDVI changes and their: Relationships with climatic parameters in Northeast China. Int. J. Appl. Earth Observ. Geoinform - Int. J. Appl. Earth OBS GEOINF. 18, 528-536. doi: 10.1016/j.jag.2011.10.007
Martin A., Gross-Camp N., Kebede B., McGuire S. (2014). Measuring effectiveness, efficiency and equity in an experimental Payments for Ecosystem Services trial. Global Environ. Change 28, 216–226. doi: 10.1016/j.gloenvcha.2014.07.003
Mueller T., Dressler G., Tucker C. J., Pinzon J. E., Leimgruber P., Dubayah R. O., et al. (2014). Human land-use practices lead to global long-term increases in photosynthetic capacity. Remote Sens. 6 (6), 5717–5731. doi: 10.3390/rs6065717
Myneni R. B., Keeling C. D., Tucker C. J., Asrar G., Nemani R. R. (1997). Increased plant growth in the northern high latitudes from 1981 to 1991. Nature 386, 698–702. doi: 10.1038/386698a0
Obiefuna J., Nwilo P., Atagbaza A., Okolie C. (2013). Land cover dynamics associated with the spatial changes in the wetlands of lagos/lekki lagoon system of lagos, Nigeria. J. Coast. Res. 29, 671–679. doi: 10.2112/JCOASTRES-D-12-00038.1
Park H.-S., Sohn B. (2010). Recent trends in changes of vegetation over East Asia coupled with temperature and rainfall variations. J. Geophys. Res. 115, D14101. doi: 10.1029/2009JD012752
Peng J., Jiang H., Liu Q., Green S. M., Quine T. A., Liu H., et al. (2021). Human activity vs. climate change: Distinguishing dominant drivers on LAI dynamics in karst region of southwest China. Sci. of the total Environ. 769, 144297. doi: 10.1016/j.scitotenv.2020.144297
Piao S., Fang J., Zhou L., Guo Q., Henderson M., Ji W., et al. (2003). Interannual variations of monthly and seasonal normalized difference vegetation index (NDVI) in China from 1982 to 1999. J. Geophys. Res.: Atmos. 108, 4401. doi: 10.1029/2002JD002848
Piao S., Wang X., Park T., Chen C., Lian X., He Y., et al. (2019). Characteristics, drivers and feedbacks of global greening. Nat. Rev. Earth Environ. 1, 1–14. doi: 10.1038/s43017-019-0001-x
Qi J., Zhang Y., Zhang J., Wu C., Chen Y., Cheng Z. (2023). Study on the restoration of ecological environments in mining area based on GIS technology. Sustainability 15 (7), 6128. doi: 10.3390/su15076128
Qu S., Lin A., Yu D., Yuan M., Li C.a. (2020). Distinguishing the impacts of climate change and anthropogenic factors on vegetation dynamics in the Yangtze River Basin, China. Ecol. Indic. 108, 105724. doi: 10.1016/j.ecolind.2019.105724
Qun G., Hanying M. (2007). Ecological restoration, social-economic changes and sustainable development in the Three Gorges Reservoir area: A case study in Yunyang, Chongqing Municipality. Int. J. Sustain. Dev. World Ecol. 14, 174–181. doi: 10.1080/13504500709469717
Shanshan C., Zhaofei W., Zhang S., Huang P., Ma M., Zhou X., et al. (2021). Effects of long-term and large-scale ecology projects on forest dynamics in Yangtze River Basin, China. For. Ecol. Manage. 496, 119463. doi: 10.1016/j.foreco.2021.119463
Sun W., Song X., Mu X., Peng G., Wang F., Zhao G. (2015). Spatiotemporal vegetation cover variations associated with climate change and ecological restoration in the Loess Plateau. Agric. For. Meteorol. 209–210, 87-99. doi: 10.1016/j.agrformet.2015.05.002
Tong X., Brandt M., Yue Y., Horion S., Wang K.-L., Keersmaecker W., et al. (2018). Increased vegetation growth and carbon stock in China karst via ecological engineering. Nat. Sustain. 1, 44–50. doi: 10.1038/s41893-017-0004-x
Tucker C. J., Slayback D. A., Pinzon J. E., Los S. O., Myneni R. B., Taylor M. G. (2001). Higher northern latitude normalized difference vegetation index and growing season trends from 1982 to 1999. Int. J. Biometeorol. 45, 184–190. doi: 10.1007/s00484-001-0109-8
Wang S. J., Liu M., Zhang D. F. (2004). Karst rocky desertification in southwestern China: geomorphology, landuse, impact and rehabilitation. Land Degrad. Dev. 15, 115–121. doi: 10.1002/ldr.592
Wang K.-L., Zhang M.-Y., Zhang C. (2015). Impacts of climate change and human activities on vegetation cover in hilly southern China. Ecol. Eng. 81, 451–461. doi: 10.1016/j.ecoleng.2015.04.022
Wu D., Wu H., Zhao X., Zhou T., Tang B., Zhao W., et al. (2014). Evaluation of spatiotemporal variations of global fractional vegetation cover based on GIMMS NDVI data from 1982 to 2011. Remote Sens. 6, 4217–4239. doi: 10.3390/rs6054217
Xu X., Liu H., Lin Z., Jiao F., Gong H. (2019). Relationship of abrupt vegetation change to climate change and ecological engineering with multi-timescale analysis in the karst region, southwest China. Remote Sens. 11 (13), 1564. doi: 10.3390/rs11131564
Zakkak S., Radovic A., Panitsa M., Vassilev K., Shuka L., Kuttner M., et al. (2018). Vegetation patterns along agricultural land abandonment in the Balkans. J. OF VEGET. Sci. 29, 877–886. doi: 10.1111/jvs.12670
Zhang Z., Chang J., Xu C.-Y., Zhou Y., Wu Y., Chen X., et al. (2018). The response of lake area and vegetation cover variations to climate change over the Qinghai-Tibetan Plateau during the past 30 years. Sci. OF THE TOTAL Environ. 635, 443–451. doi: 10.1016/j.scitotenv.2018.04.113
Zhang M., Deng Z., Yue Y., Wang K., Liu H., Zhang C., et al. (2022). Nonlinear characteristics of the vegetation change and its response to climate change in the karst region of southwest China. Prog. IN Phys. GEOGRAPHY-EARTH AND Environ. 46, 497–514. doi: 10.1177/03091333211066252
Zhang S., Ye Z., Yaning C., Xu Y. (2017). Vegetation responses to an ecological water conveyance project in the lower reaches of the Heihe River Basin. Ecohydrology 10, e1866. doi: 10.1002/eco.1866
Zhao A., Zhang A., Liu X., Cao S. (2018). Spatiotemporal changes of normalized difference vegetation index (NDVI) and response to climate extremes and ecological restoration in the Loess Plateau, China. Theor. Appl. Climatol. 132, 555–567. doi: 10.1007/s00704-017-2107-8
Keywords: vegetation cover change, vegetation restoration, human activities, principal component analysis, southwestern karst region of China
Citation: Liu Z and Zhang Y (2024) Vegetation cover change and its response to human activities in the southwestern karst region of China. Front. Ecol. Evol. 12:1326601. doi: 10.3389/fevo.2024.1326601
Received: 15 November 2023; Accepted: 12 March 2024;
Published: 26 March 2024.
Edited by:
Chunbo Huang, China University of Geosciences Wuhan, ChinaReviewed by:
Faustin Katchele Ogou, Chinese Academy of Sciences (CAS), ChinaTertsea Igbawua, Federal University of Agriculture Makurdi (FUAM), Nigeria
Copyright © 2024 Liu and Zhang. This is an open-access article distributed under the terms of the Creative Commons Attribution License (CC BY). The use, distribution or reproduction in other forums is permitted, provided the original author(s) and the copyright owner(s) are credited and that the original publication in this journal is cited, in accordance with accepted academic practice. No use, distribution or reproduction is permitted which does not comply with these terms.
*Correspondence: Yushan Zhang, zys332400@163.com