Milkweed and floral resource availability for monarch butterflies (Danaus plexippus) in the United States
 Laura Lukens
 Jennifer Thieme
 Wayne E. Thogmartin
- 1Monarch Joint Venture, Saint Paul, MN, United States
- 2Department of Forest & Rangeland Stewardship, Colorado State University, Fort Collins, CO, United States
- 3United States Geological Survey, Upper Midwest Environmental Sciences Center, La Crosse, WI, United States
The global decline of pollinators, particularly insects, underscores the importance of enhanced monitoring of their populations and habitats. However, monitoring some pollinator habitat is challenging due to widespread species distributions and shifts in habitat requirements through seasons and life stages. The monarch butterfly (Danaus plexippus), a migratory insect pollinator that breeds widely throughout North America, presents a unique case study for testing a sampling framework to overcome these challenges. Monarchs exhibit discrete resource needs across life stages (e.g., larval requirement for milkweed, adult requirement for floral nectar), utilizing many land use types across their extensive geographic range during breeding and migration seasons. The Integrated Monarch Monitoring Program (IMMP) uses a standardized protocol with a generalized random tessellation stratified (GRTS) sampling design to gather spatially balanced and ecologically representative information on monarch habitats within the United States. The IMMP is applicable to various land use types and habitats used by breeding monarchs and may be extended to sites outside of the GRTS design to collect data on non-random sites of interest, such as legacy or conservation sites. Additionally, the IMMP’s modular design and publicly available training allows for broad participation, including involvement from community scientists. Here, we summarize habitat metrics (milkweed and floral resources) across 1,233 sites covering much of the monarch’s breeding range. We examine variation in milkweed density and floral resource availability on probabilistic (random) and non-probabilistic (convenience) samples and among land use types (site types). Additionally, we assess resource availability within core geographies for monarch breeding and migration, specifically within the U.S. Fish and Wildlife Service’s Monarch Conservation Units (western, northern, and southern United States). Milkweed density, floral frequency, and floral richness were higher on non-random sites and in the North region. Among site types, milkweed density was highest on Rights-of-Way and Unclassified Grassland, while floral frequency was lowest on Rights-of-Way. The IMMP represents the first field-based habitat monitoring program of this scale for monarchs, yielding a robust dataset on monarchs and their habitats across their breeding range and offering a framework for surveying the habitat of insect species with diverse habitat requirements or widespread distributions.
1 Introduction
The precipitous decline and continued risk of extinction facing the North American migratory monarch butterfly (Danaus plexippus) population could be better understood by improved monitoring of their breeding populations and habitats. Given that the monarch’s decline has been linked to loss of breeding habitat (Pleasants and Oberhauser, 2013; Flockhart et al., 2015; Pelton et al., 2019) and, more recently, shifting climatic conditions (Zylstra et al., 2021, 2022), increasing the quantity and quality of breeding habitat has become a widely recommended strategy to compensate for historical habitat losses and create a more resilient landscape for their breeding and migration (Pleasants, 2017; Thogmartin et al., 2017). Additionally, sizable knowledge gaps persist with regard to the monarch’s spatiotemporal distribution, status and trends, and sensitivity to environmental change in certain geographies and land uses. Expanding our knowledge of monarch habitat throughout its breeding range would not only enable the conservation community to more effectively prioritize conservation strategies, identify and mitigate threats, and adapt habitat management techniques, but also help meet regional and national initiatives to map and quantify changes in habitat.
Although many options to inventory and monitor pollinators at large scales have been explored or proposed (Williams et al., 2001; Lebuhn et al., 2013; Woodard et al., 2020), no pollinator habitat monitoring programs have been successfully implemented broadly across the North American monarch’s breeding range, and none include both key components of productive monarch breeding habitat: floral resources and milkweed host plants. While many methods to inventory and monitor monarch habitat have been utilized at local scales (e.g., Hartzler and Buhler, 2000; Zaya et al., 2017; Dinsmore et al., 2019; Kaul and Wilsey, 2019; Svancara et al., 2019; Waterbury et al., 2019; Lukens et al., 2020; Spaeth et al., 2022), few have been implemented at large scales (Cariveau et al., 2019a, b) and have been met with limited success (e.g., Garfinkel et al., 2023). As such, existing assessments of milkweed host plant and nectar availability, along with monarch population viability, have largely been derived from small, localized datasets and expert opinion (Koh et al., 2016; Semmens et al., 2016; Cariveau et al., 2019a). Recognizing this data gap, a collaboration of scientists piloted the Integrated Monarch Monitoring Program (IMMP)1 to assess key metrics of monarch and pollinator habitat, reproduction, adult resource use, larval survival, and parasitism, and to track trends in these metrics through time (Cariveau et al., 2019b).
The IMMP’s vegetation monitoring protocol quantifies metrics specific to monarch habitat requirements (e.g., milkweed density) as well as data more broadly applicable to grassland pollinators (e.g., floral resource availability). In addition to accommodating conservation lands typically monitored for wildlife, the IMMP prioritizes a suite of randomly selected sites to gather a spatially and ecologically representative assessment of pollinator habitat across the United States. The protocol was tested by researchers and federal agencies in 2016 and by conservation professionals and community scientists in 2017, after which methods were modified slightly to improve efficiency of data collection procedures.
Here, we summarize the status of monarch and pollinator habitat through the lens of the IMMP, comparing milkweed and floral resources across geographical regions, land use types, and other site characteristics. These metrics can aid in refining our understanding of resource availability across the U.S. landscape and in turn, updating current habitat and population targets to guide conservation action.
2 Materials and methods
2.1 Study area
The Integrated Monarch Monitoring Program (IMMP) incorporates sampling on both random and non-random sites across the contiguous United States. Random sites are distributed such that they depict an unbiased representation, or background level, of milkweed and floral resources on the landscape. Random sites were generated via a generalized random tessellation stratified (GRTS) process, which ensures spatial balance and unbiased representation through stratified randomization. This method can represent multiple strata, reducing parameter estimate variability (Loeb et al., 2015). The IMMP GRTS process resulted in a spatially balanced set of locations within 10 × 10-km grid cells across the contiguous United States (Weiser and Thogmartin, 2018; Cariveau et al., 2019b). In areas east of the Rocky Mountains, random site locations are distributed among five land use types (hereafter ‘site types’; Table 1). Participants verify site type during their first survey and rectify any geographic information system errors to ensure alignment with the categories defined in Table 1. Due to the patchiness of milkweed occurrence in the western United States, random sites are distributed among three estimated levels of milkweed habitat suitability (low, medium, high) (Dilts et al., 2019). Upon the first visit to a site, observers assign one of the site types defined in Table 1 for consistency with areas east of the Rocky Mountains. Non-random sites are selected by participants and must align with one of the site types described in Table 1.
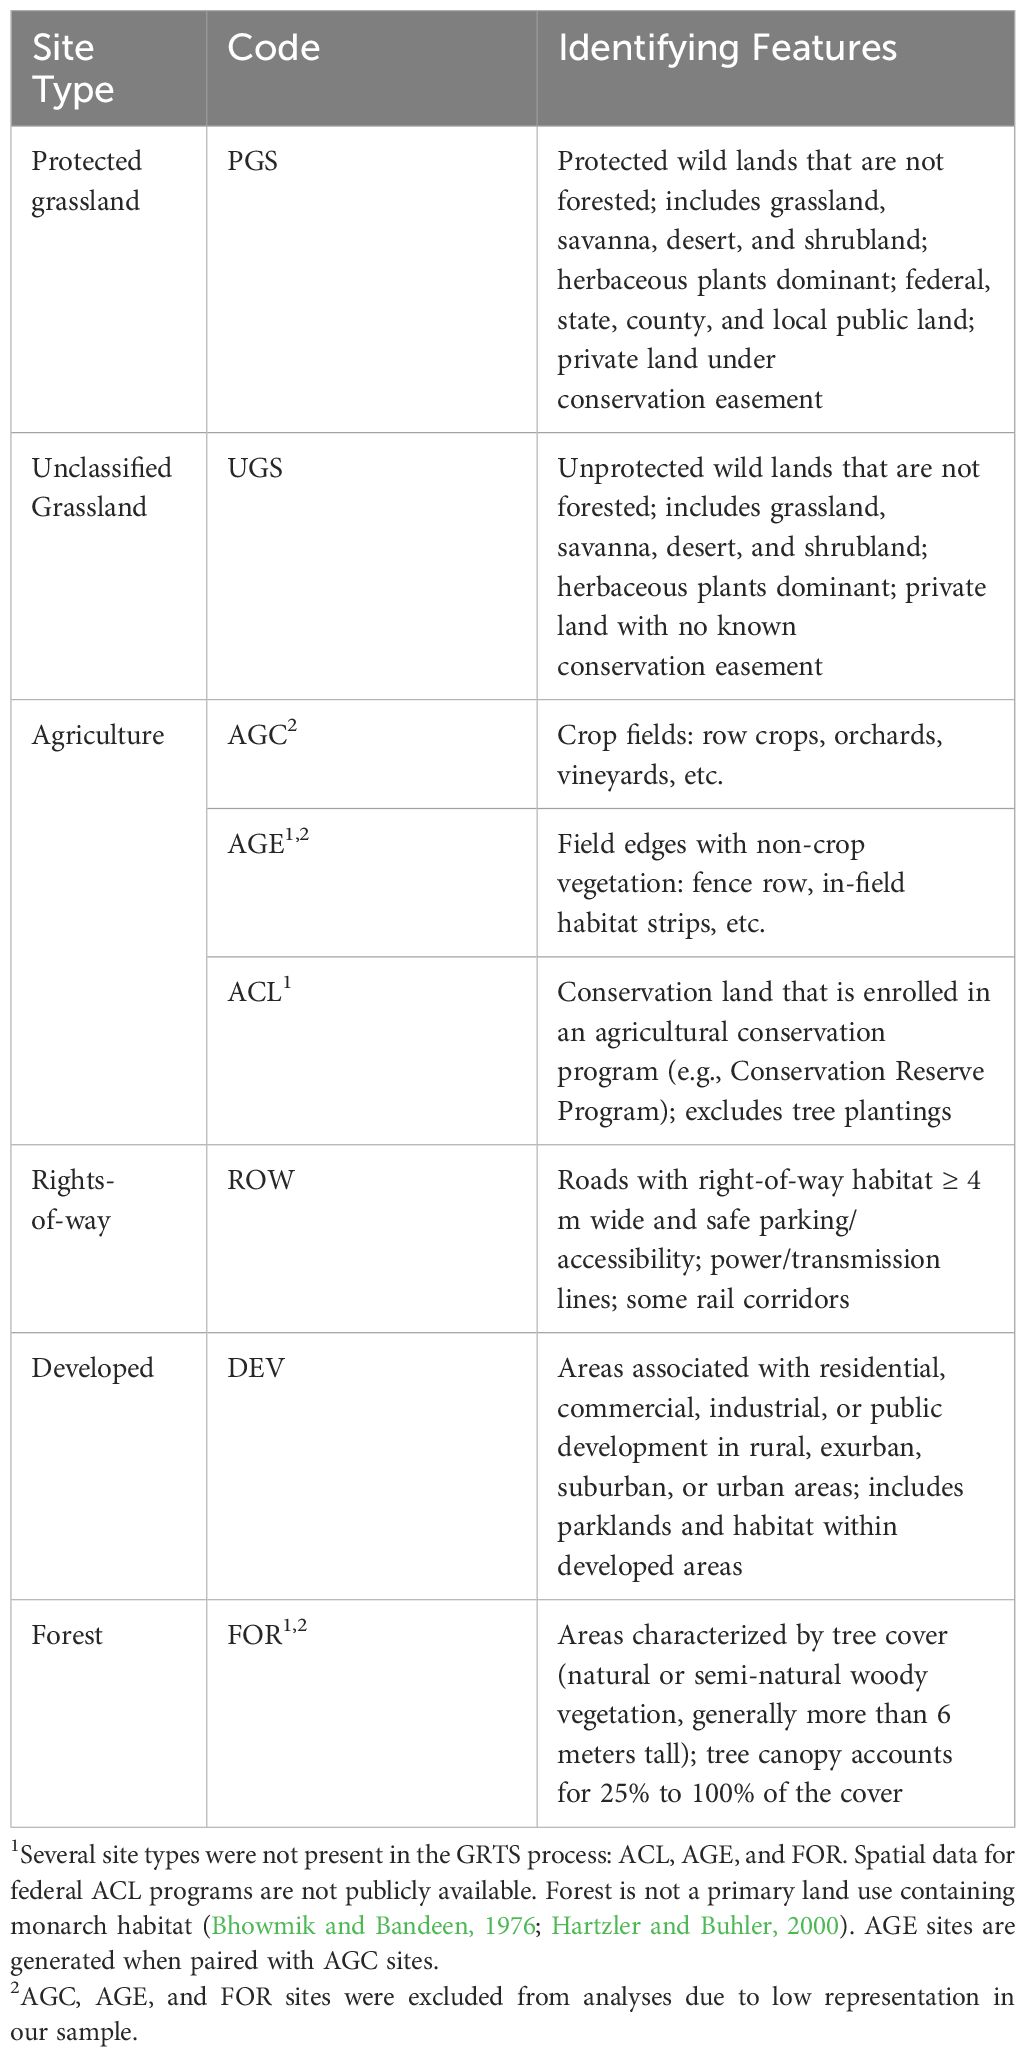
Table 1 Integrated Monarch Monitoring Program site types (land use), codes, and identifying features.
Three site types are not represented in the GRTS draw but are included as a site type in the IMMP: Agricultural Conservation Land, Agricultural Edge, and Forest. Random Agricultural Conservation Land sites could not be pre-determined because spatial data for federal conservation programs (e.g., Conservation Reserve Program) are not publicly available. Instead, they may be selected by participants or identified when monitoring a random site that is found to be enrolled in a conservation program. Agricultural Edge sites are generated when paired with Agricultural Cropland surveys. Although monarchs are primarily associated with open habitats, we added the type Forest for cases in which observers selected a forested site containing monarch habitat (milkweed).
2.2 Field survey methods
The IMMP instructs observers to begin monthly surveys when vegetation emerges in the spring until senescence in the fall for northern latitudes. In southern latitudes (below approximately 38 degrees N), spring and fall surveys are recommended to assess habitat condition and use by monarch butterflies during the time periods in which monarchs are present. Although the IMMP provides recommendations for survey frequency and timing, data recorded at any interval are accepted.
The IMMP is modular and consists of four protocols or “activities,” designed to quantify metrics associated with (1) monarch habitat, (2) monarch eggs and larvae, (3) adult monarch butterflies, and (4) monarch parasitism. Habitat surveys followed the IMMP’s Activity 1: Milkweed & Blooming Plant Survey protocol, in which observers select a ≥0.4 hectare area, hereafter “plot,” (typically a 1-ha square or rectangle) within the site of interest to conduct monitoring (Cariveau et al., 2019b; Monarch Joint Venture, 2021). When monitoring large sites (>5 hectares), surveyors may have placed multiple 1-ha plots within the site area to characterize the habitat more fully. In those cases, we averaged metrics from the plots to avoid pseudo replication. Plot location within non-random sites is either randomly determined or selected by the observer to represent a particular area; at random sites, plots are oriented from the latitude and longitude of the random point in the IMMP GRTS draw.
The IMMP’s standard Activity 1 contains three options, of which the observer may conduct one to three: a milkweed survey, a blooming plant survey, and a meander survey (Figure 1). To conduct a milkweed survey, observers surveyed 100 1-m2 subplots (0.5 m × 2.0 m) at 5-m increments along 500 m of parallel transects. In 2016 and 2017 as the IMMP was piloted, parallel transects were spaced across the entire site following methods outlined in Lukens et al. (2020). Within each subplot, observers recorded the number of milkweed plants and stems by species. Milkweed stems separated by soil were recorded as distinct plants, regardless of whether they were clonal or genetic individuals (following Kasten et al., 2016; Lukens et al., 2020).
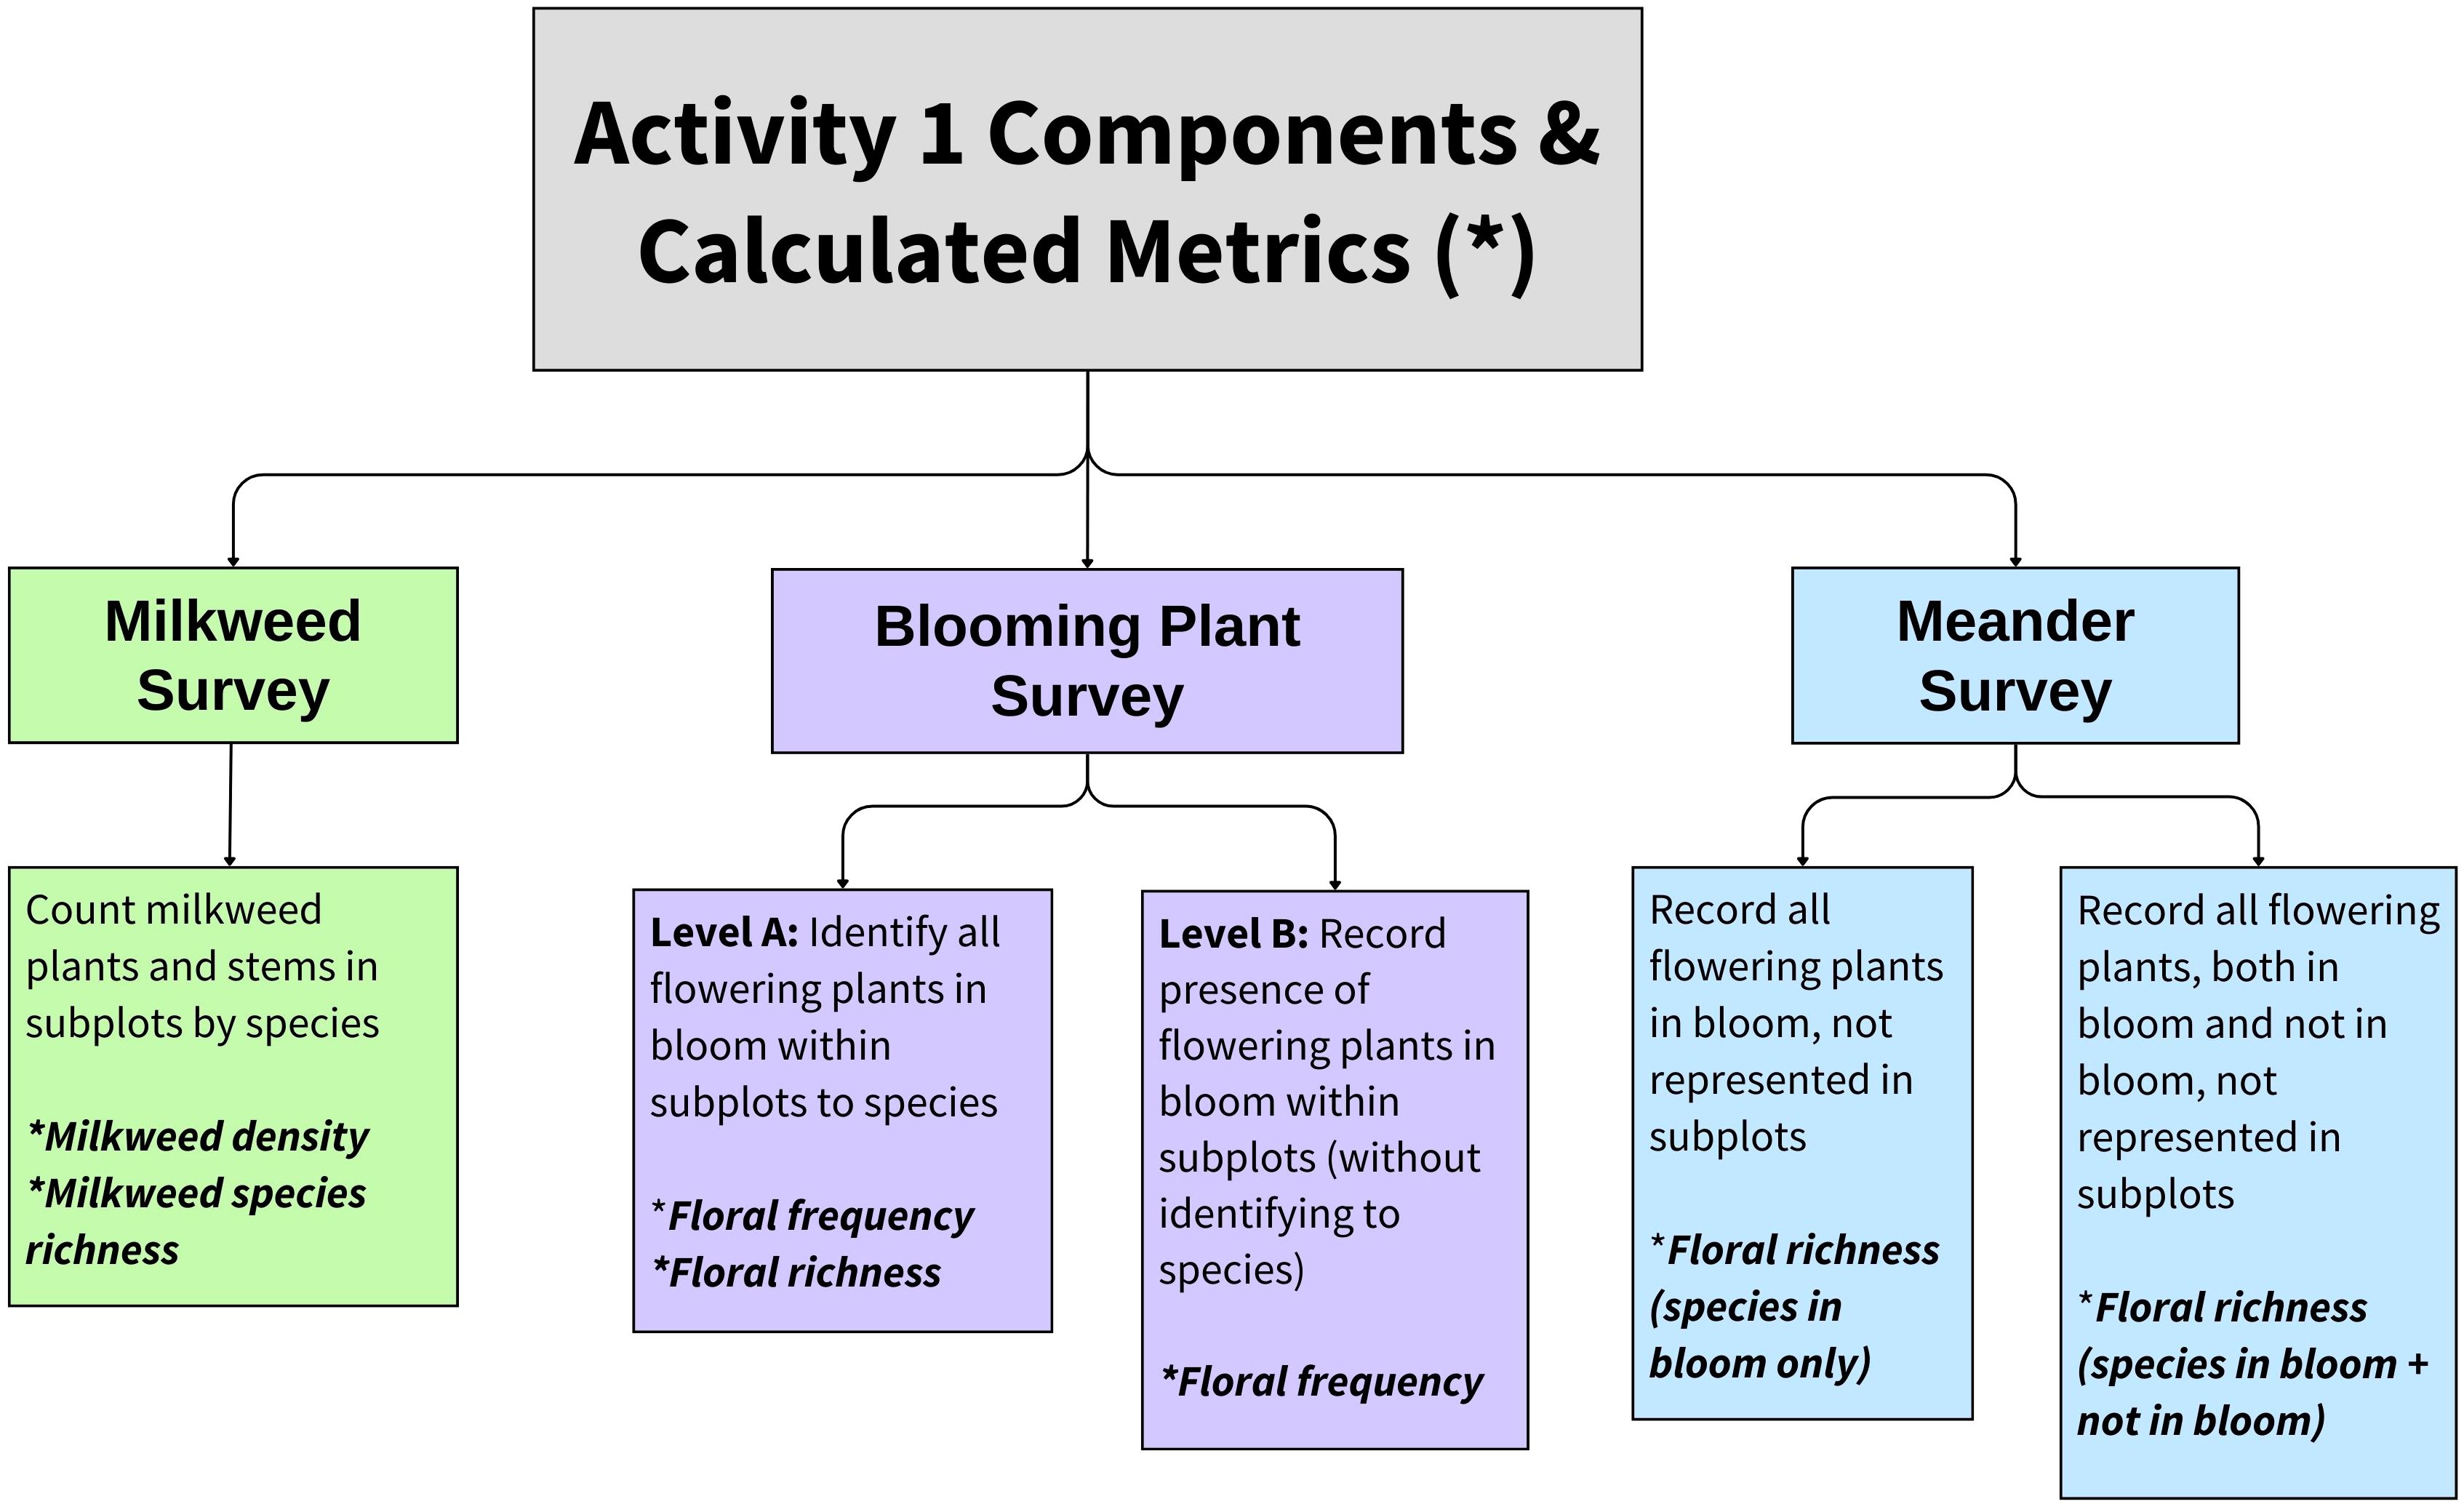
Figure 1 Choices given to surveyors conducting the Integrated Monarch Monitoring Program Activity 1: Milkweed and Blooming Plant Survey protocol and associated metrics. Most surveyors conducted the milkweed survey, blooming plant survey, and meander survey concurrently, but any combination of these activities was acceptable. Flowering plants are defined as non-grass flowering species. For this study, we restricted floral analyses to species observed in subplots given that the meander was optional and not conducted at all sites.
To conduct a blooming plant survey, observers surveyed subplots along transects as described above for milkweed. They recorded the presence of non-grass flowering plants in bloom (hereafter, flowering plants) within the subplot frame to measure floral frequency. Observers either (a) identified each flowering plant to species (Level A), or (b) recorded the presence/absence of any flowering plants, without identifying the species (Level B).
For the meander survey, observers walked throughout the plot and recorded milkweed and flowering plant species. In addition to flowering plant species, observers could optionally record non-grass flowering species that were not currently in bloom and denote them as such. If a milkweed survey or blooming plant survey was conducted on the same date, only novel species were recorded in the meander survey.
Although sites ≥0.4 ha are encouraged in order to accommodate standard survey methods, any size site may be sampled using a modified ‘census’ Activity 1 survey. Instead of sampling via subplots, observers counted all milkweed plants present within the plot by species and/or recorded all flowering plant species present. Thus, floral frequency is not available for these surveys.
2.3 Participant training
Participants received training through either in-person workshops or through self-guided online modules. In-person training workshops were conducted by Monarch Joint Venture staff (MJV) over the course of 1–2 days. Training included both classroom instruction as well as field protocol and plant identification practice, typically involving identifying several examples of milkweed and flowering plant species. Online training modules contain a written guidebook and instructional videos, covering all aspects of the program including field protocols, plant identification, navigation, and data entry.
2.4 Data validation
Data were either entered directly into an online database during field surveys or transferred to the database from paper records. To minimize errors, the database was preloaded with plant lists sourced from the USDA Plant Database (United States Department of Agriculture (USDA) and Natural Resources Conservation Science (NRCS), 2022), restricting users to select and enter only species previously recorded within a given state. In cases where a species was found on a survey but unavailable in the database, the species was manually submitted to the database manager. The manager then verified with participants that the species was accurately identified to the best of their knowledge, not a similar species in the region, before adding it to the database list for that state. Additionally, the database allowed users to record flowering plant species by genus, used in cases where species identification was uncertain. Data managers cross-referenced electronic records with paper datasheets, when provided, and rectified any discrepancies.
2.5 Statistical analysis
2.5.1 Overview
We performed statistical tests in the R statistical programming language (version 4.2.2; R Core Team, 2021). We used mixed-effects logistic regression and zero-inflated negative binomial regression to examine whether site type (land use), region, and site selection type (random versus non-random) predicted milkweed density, floral richness, and floral frequency, as described in the respective sections below. Three site types were excluded from analyses due to low representation in our sample: Forest (n = 1), Agricultural Crop Field (n = 15), and Agricultural Edge (n = 83). Sites were grouped into three broad regions of North, South, and West based on U.S. Fish & Wildlife Service (USFWS) Monarch Conservation Units (Figure 2). We included two additional covariates in the models to account for sampling differences among plots: transect layout (to account for differences in transect placement in the early (2016–2017) and later stages (2018–2022) of the program), and survey type (standard versus census surveys). Because plant phenology changes over the annual cycle, we included a covariate for day of year (day 1 = 1 January). To account for variable search area in the flowering plant surveys, we considered an additional covariate, the area sampled (100m2 for standard surveys, variable for census and irregular surveys).
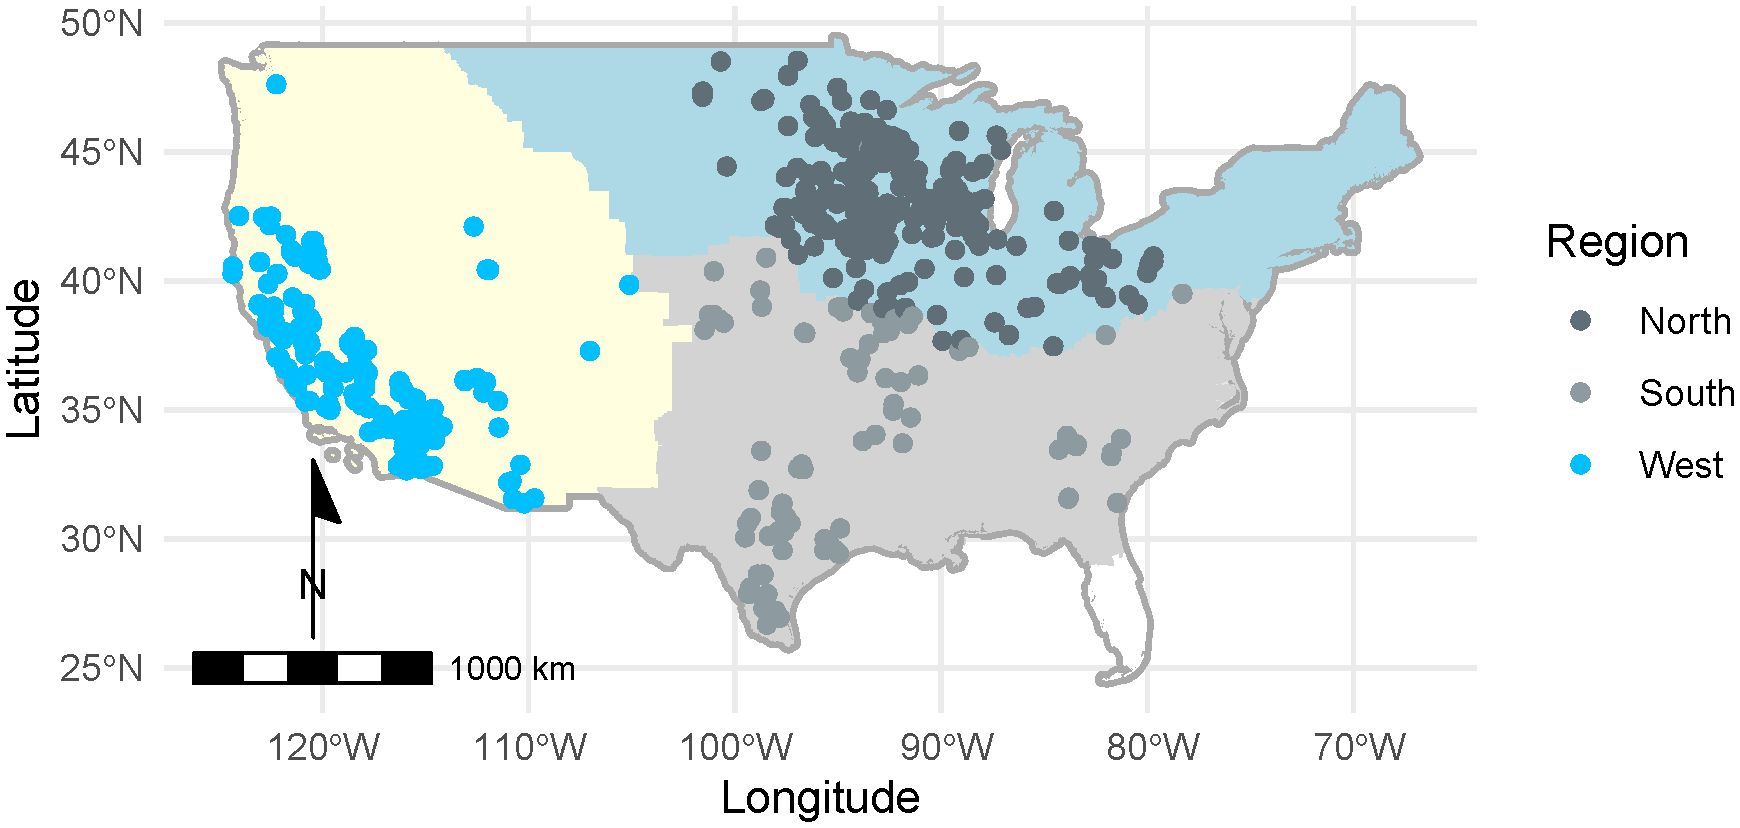
Figure 2 Distribution of surveys among Monarch Butterfly Conservation Units (North, South, West; U.S. Fish & Wildlife Service, 2018) conducted by the Integrated Monarch Monitoring Program, 2016–2022. In total, 2,742 blooming plant surveys and 2,707 milkweed surveys were conducted across 26 states.
We used a two-step process to (a) select spatial and temporal random effects to include in null models for each response variable, and (b) compare models containing the modified null model and additional combinations of fixed effects. We considered plot identity as a random effect in the null model to account for expected but unmodeled spatial heterogeneity at the site level as well as repeated measures. We also controlled for temporal variation by considering year and month-nested-in-year as random effects.
For each response type, a global model comprising all fixed and random effects was evaluated for appropriate goodness of fit. For the floral frequency and richness models, a global model failed goodness of fit assessments, so reduced models balancing parsimony, goodness of fit, inferential interests, and data support were evaluated; parsimony in the milkweed models was sought as well. We evaluated alternative models based on the difference between the given model’s second-order Akaike’s Information Criterion (AICc) and the AICc of the best model (i.e., Δ AICc), and used an information-theoretic approach when selecting the best set of models for deriving inference. Where models were equally competitive (i.e., Δ AIC ≤2) in step (b), we selected the model with the lower AICc for inference.
2.5.2 Milkweed metrics
Milkweed density represents the number of plants observed per hectare. Because milkweed stems were not counted in the first year of the program, we used plant counts for our analysis. Although both species are known to support breeding monarchs (Greenstein et al., 2022), we excluded Asclepias verticillata (whorled milkweed) and A. subverticillata (horsetail milkweed) densities from statistical analyses because their biomass and growth patterns differ greatly from the other species observed and were not included in other landmark research on milkweed densities (Thogmartin et al., 2017) (although we report site occurrence and densities for these species in Supplementary Table S1).
During initial inspection of the data, we found that 42.7% of milkweed density values were 0. To address this preponderance of zeroes, we used a zero-inflated negative binomial model, with a binary logit and count component, jointly estimating separate coefficients for the prediction of zero-versus-non-zero probabilities and for count densities above zero. This modeling approach provided a way to distinguish structural zeros (species not present at a site) from sampling zeros (species present at a site but not sampled) (Halstead et al., 1991). A set of fixed and random effect covariates were evaluated in both the zero process and count process. We fit zero-inflated negative binomial models with the glmmTMB package (Brooks et al., 2017).
2.5.3 Blooming plant metrics
Floral frequency refers to the proportion of subplots containing at least one non-grass flower. Floral richness refers to the number of non-grass flowering species observed in bloom on the blooming plant survey subplots. We restricted analysis to species observed in subplots, given that the meander was optional. To summarize commonly occurring floral species across sites (Table 2), we collapsed all records by IMMP plot; that is, we generated a list of all floral species observed on each plot across all surveys.
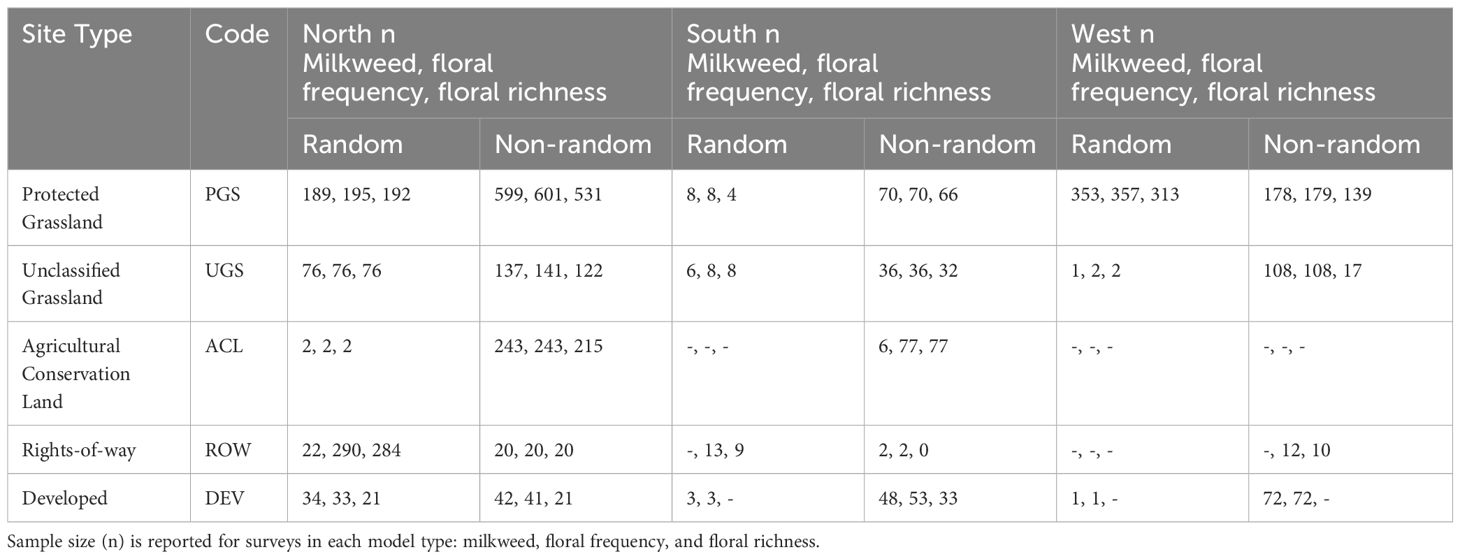
Table 2 Number of Integrated Monarch Monitoring Program surveys (n) included in models by site type (land use), site selection type (random, non-random), and region (North, South, and West Monarch Butterfly Conservation Units).
Nine percent of sites were absent of blooming flowers but varied substantially by region. We modeled floral frequency as a mixed-effects logistic regression and floral richness as a zero-inflated negative binomial mixed-effect regression (glmmTMB package) (Bates et al., 2015).
2.5.4 Model evaluation
All models of each response type were tested for overdispersion, zero inflation, and other model diagnostics with the DHARMa package (Hartig, 2022), the check_model command in the performance package (Lüdecke et al., 2021), and diagnose in the glmmTMB package (Brooks et al., 2017).
3 Results
3.1 Milkweed surveys
A total of 2,707 milkweed surveys were conducted on 1,227 unique sites during 2016–2022. Sampling frequency varied intra- and inter-annually, with some sites being sampled only once while others were sampled multiple times within and among years. On average, sites were surveyed twice per year (range = 1–21). Timing of surveys varied among sites, regions, and years, spanning from February to December within a season. Surveys occurred in 26 states, with 1,630 in the North (on n = 551 unique sites), 250 in the South (n = 112 sites), and 728 in the West (n = 564 sites) USFWS Monarch Conservation Units (Figure 2). Of 2,707 surveys, 975 (37%) occurred at randomly selected sites (n = 505). The remaining 1,732 surveys occurred at sites selected non-randomly (n = 722). A total of 330 surveys (years 2016 and 2017) used transect methodology following Lukens et al. (2020), 275 surveys followed the IMMP’s modified census protocol, and 2,003 surveys used standard IMMP protocols for plot setup. After excluding sites in Forest (n = 1), Agricultural Crop Field (n = 15), and Agricultural Edge (n = 83), 2,608 surveys remained for model development (Table 2).
Milkweed was present on 57 percent of surveys (1,113 of 2,608). We observed 32 Asclepias species across sites and regions, along with two non-Asclepias species, Cynanchum laeve and Matelea biflora (Supplementary Table S1). For sites in which milkweed was present, two species were observed on average (median = 1, range = 1–7). A greater number of species were observed in the western region (17) compared to the North and South (North = 13, South = 13). In the North, Asclepias syriaca, A. verticillata, and A. incarnata were the most ubiquitous species observed across sites, with A. syriaca growing at highest mean densities on random sites and A. verticillata highest on non-random sites. Asclepias syriaca, A. viridis, and A. asperula were most commonly observed across sites in the South, and similar to the North, A. syriaca grew at highest mean densities on random sites. Asclepias linearis grew at highest mean densities on non-random southern sites. In the West, the top-three most ubiquitous species were Asclepias fascicularis, A. eriocarpa, and A. speciosa, with A. speciosa growing at high mean densities on random sites and A. subverticillata highest on non-random sites.
The best model describing variation in milkweed density excluded transect layout (p’s for both the conditional and zero-inflation components >0.38) from the global model (Table 3). The best model explained 78.8% of the variation, with most variation explained by the random effects (R2marginal = 0.136, R2conditional = 0.788), especially plot identity. Milkweed density was greater in the North region compared to the West region. Mean density appeared lower in the South but was imprecisely estimated (Figure 3). Predicted milkweed densities were 40% higher in randomly selected Protected Grassland in the North (estimated marginal mean = 841.0 plants per hectare, 95% confidence interval (CI) = 618.4–1141.6) compared to the West (602.8 [370.9–978.5]) and 23% higher than the South (686.4 [394.4–1193.5]) (Table 4). Milkweed density was lower for randomly collected samples (approximately one-third lower) as well as those collected using census protocols (three-quarters lower). Over all regions and site types (land use), milkweed density peaked during mid-July (day of year = 200). Rights-of-Way and Unclassified Grassland had the highest mean density of milkweed, whereas Agricultural Conservation Land had the lowest (Table 4).
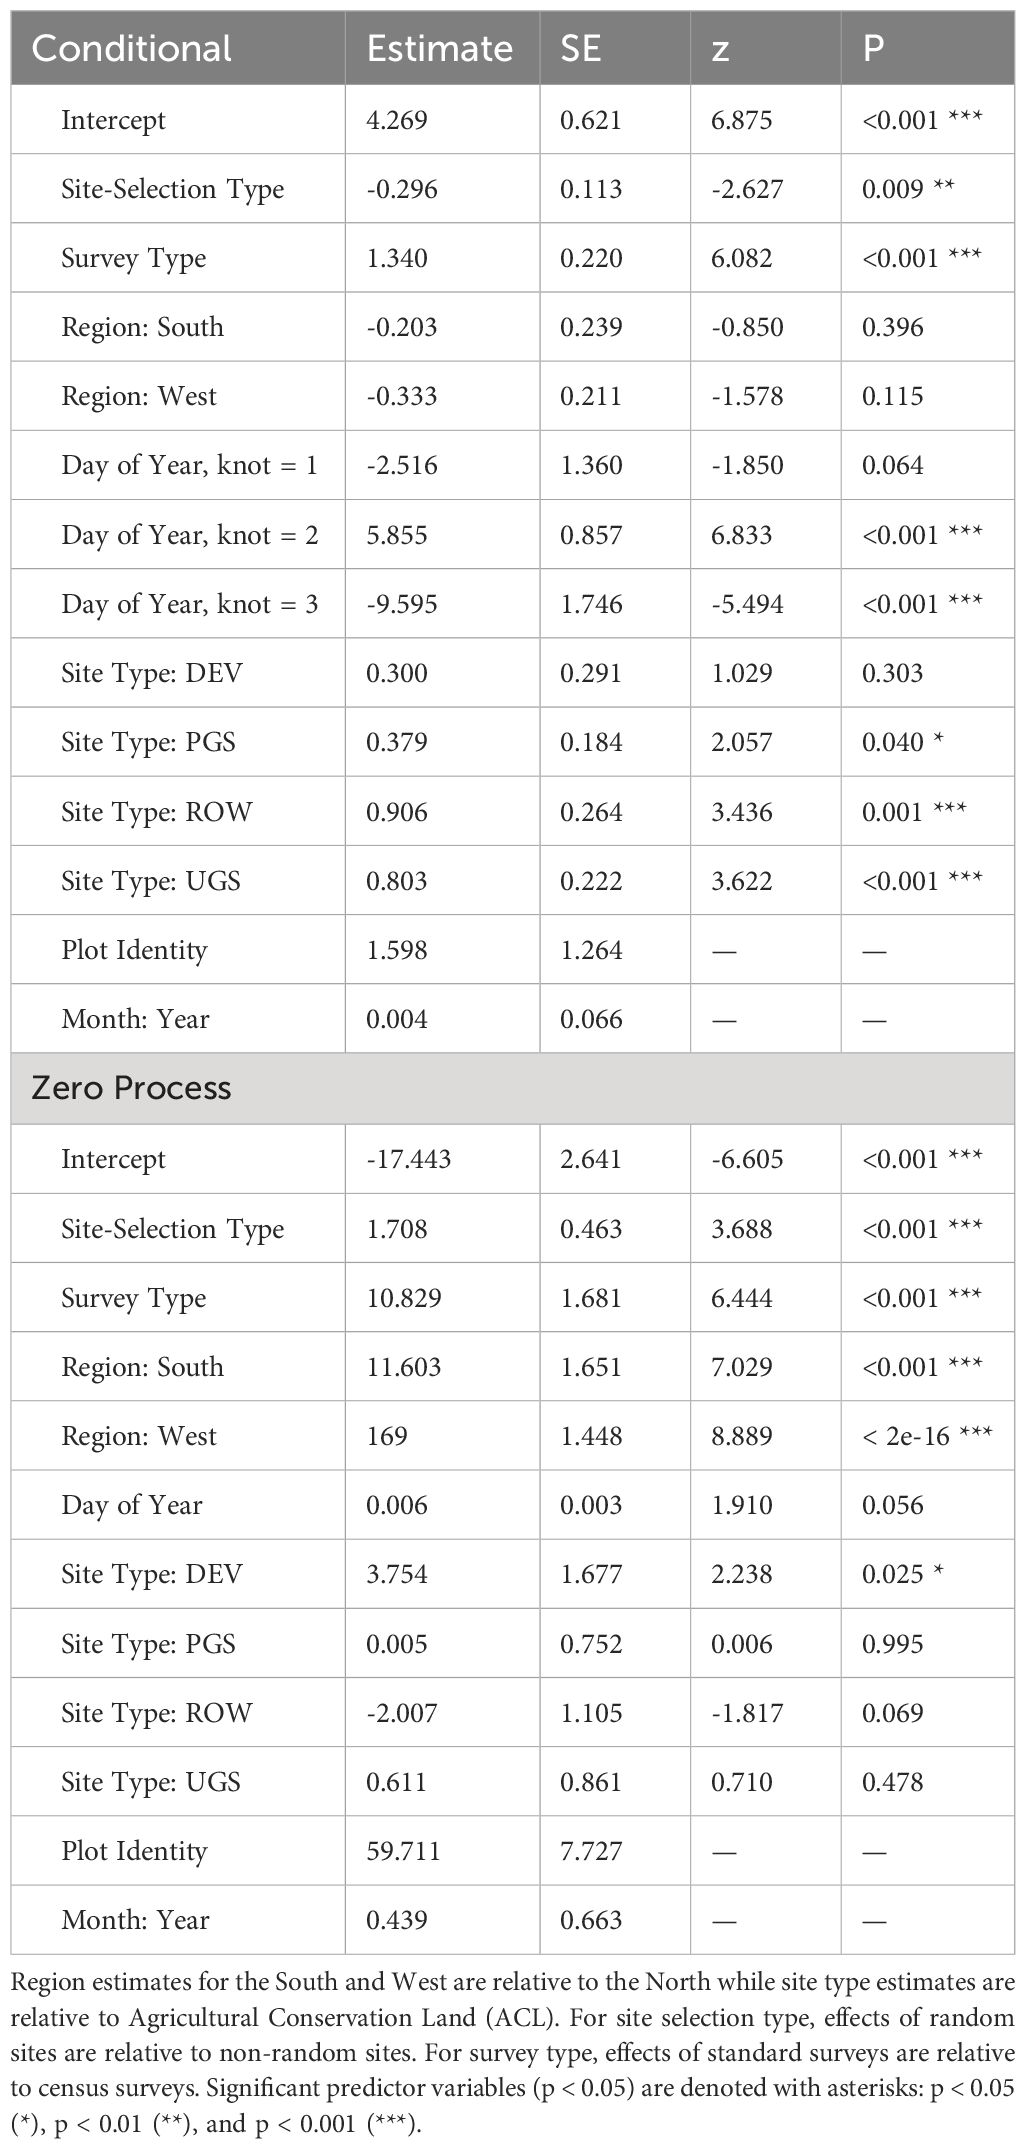
Table 3 Parameter estimates and standard errors (SE) for the best zero-inflated negative binomial regression describing milkweed density (plants per hectare, excluding Asclepias verticillata and A. subverticillata) collected by the Integrated Monarch Monitoring Program, 2016–2022.
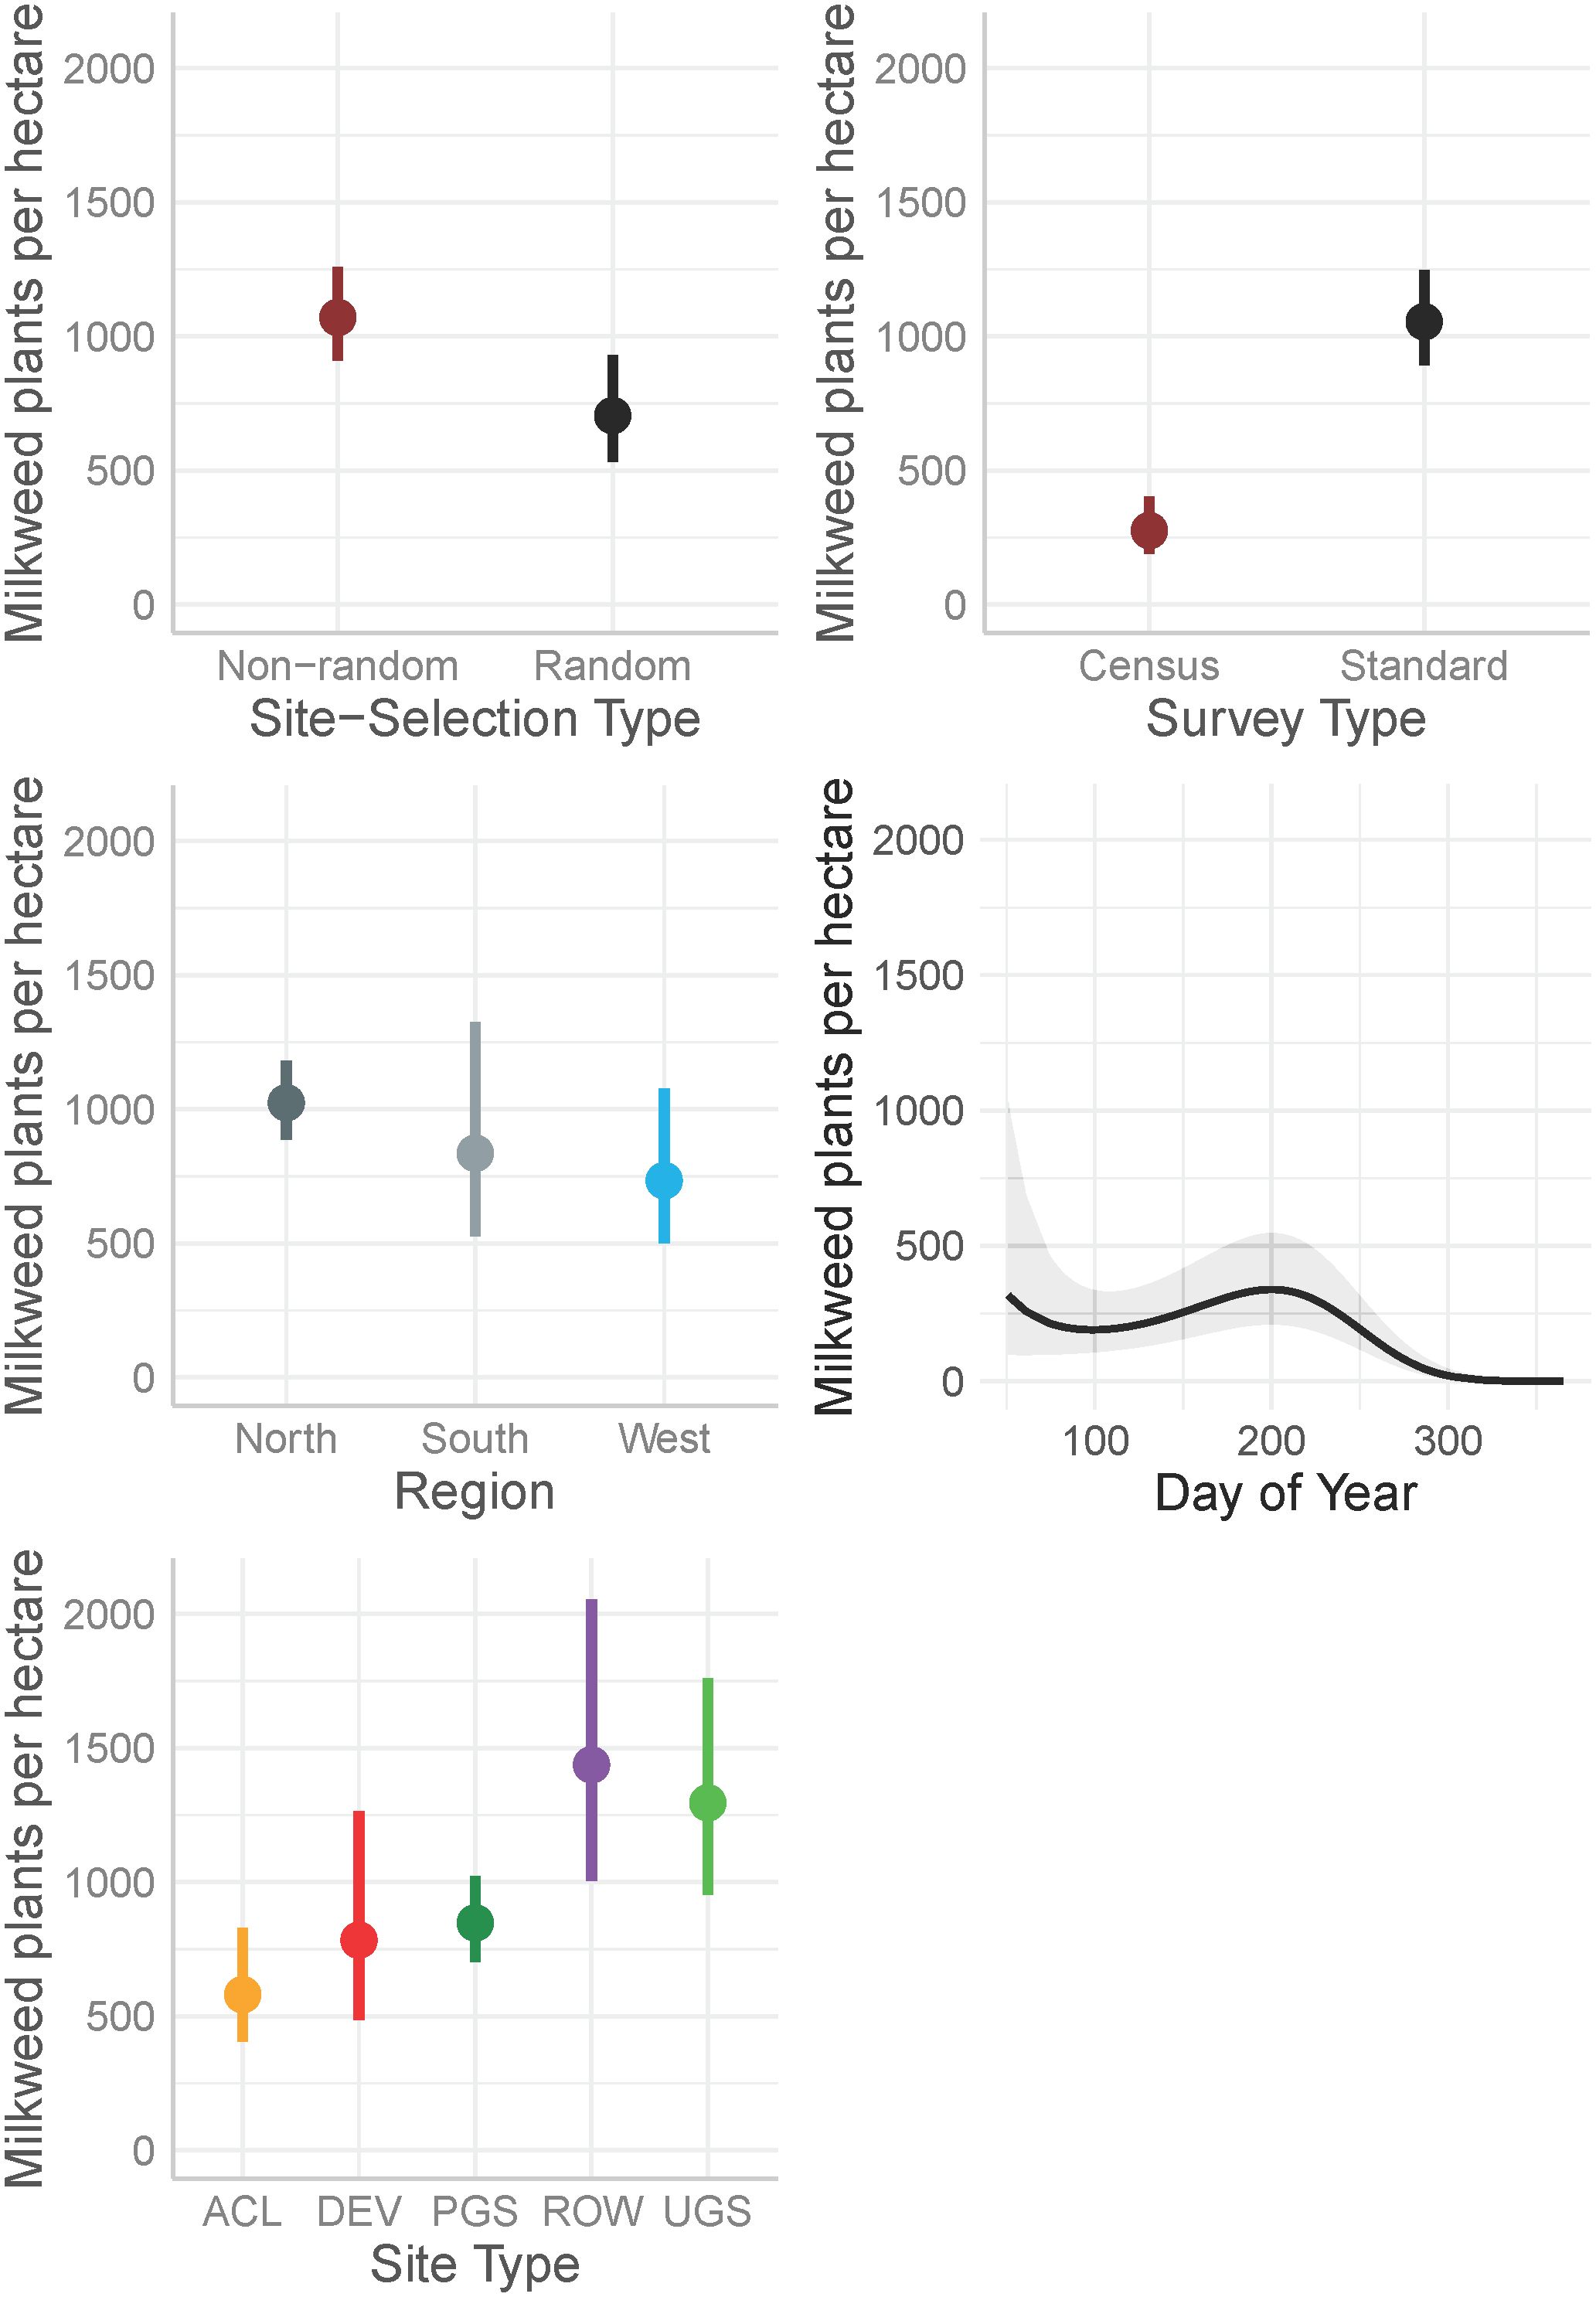
Figure 3 Marginal effects on mean milkweed density (plants per hectare, excluding Asclepias verticillata and A. subverticillata) estimated from a zero-inflated negative binomial model from data collected by the Integrated Monarch Monitoring Program, 2016–2022. Day of year effect is depicted for the North region where data were most abundant. Error bars and gray ribbon represent 95% confidence intervals. ACL, Agricultural Conservation Land; DEV, Developed; PGS, Protected Grassland; ROW, Rights-of-way; UGS, Unclassified Grassland.
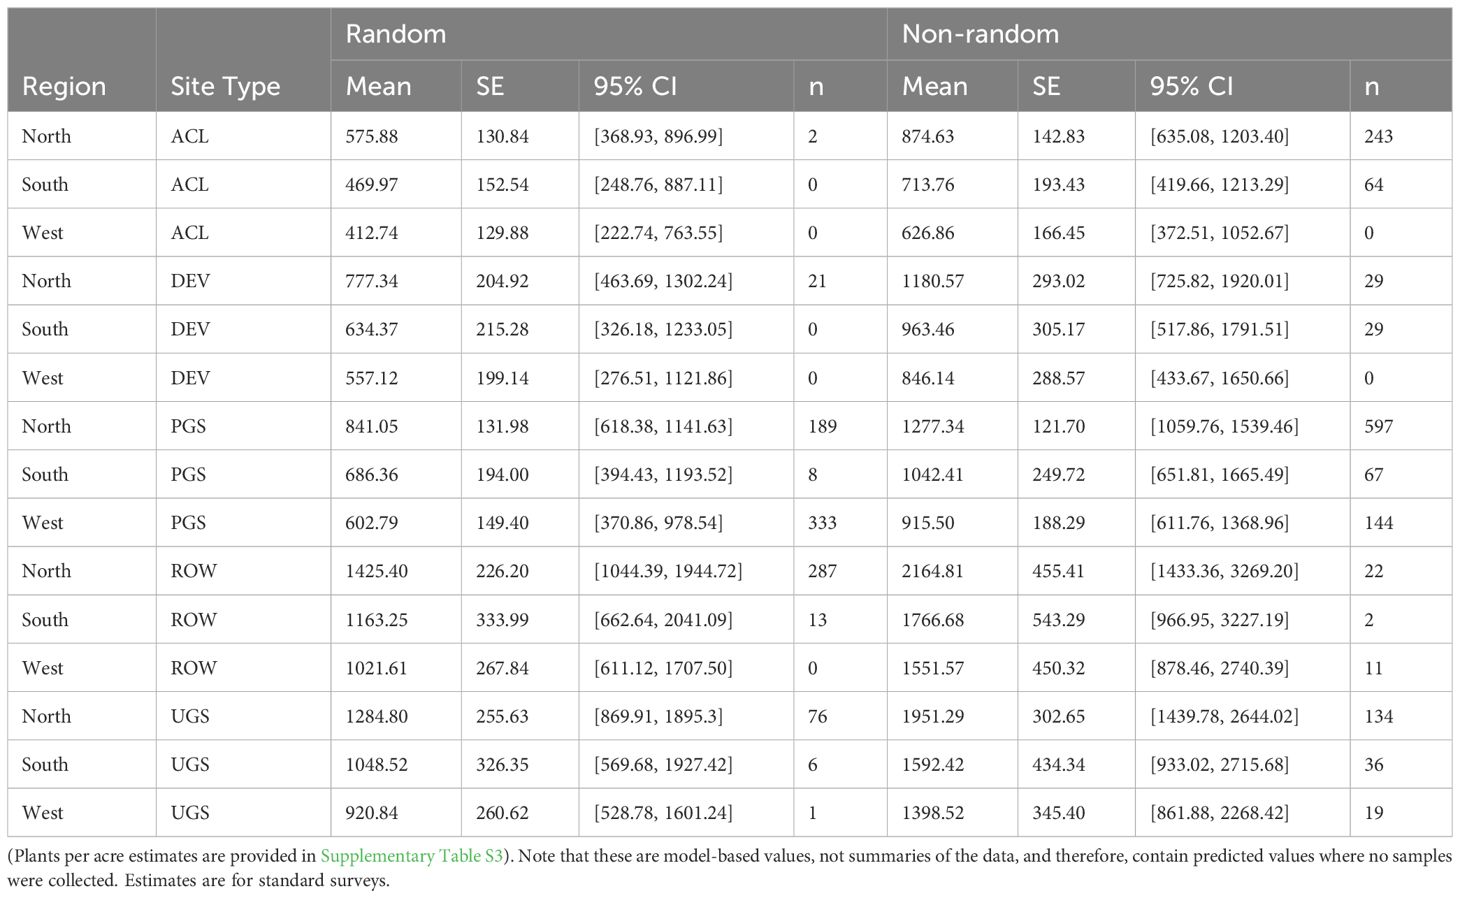
Table 4 Model-based marginal mean estimates (with standard errors (SE) and 95% confidence intervals (CI)) of milkweed plants per hectare (excluding Asclepias verticillata and A. subverticillata) from a zero-inflated negative binomial regression of sampled Integrated Monarch Monitoring Program surveys collected 2016–2022.
3.2 Blooming plant surveys
A total of 2,742 blooming plant surveys were conducted on 1,225 unique sites from 2016–2022. Of these, 1,661 surveys occurred in the North, 809 in the West, and 272 in the South USFWS Monarch Conservation Units; this includes repeat visits to sites within and among years. Observers used Lukens et al. (2020) transect methodology on 330 site visits (in 2016 and 2017), standard IMMP surveys on 2,050, and modified census survey on 362 site visits. Within standard survey types, Level A surveys (where flowering plants were identified to species) occurred on 2,316 visits, and Level B (presence of any flowering plants were recorded without identifying the species) on 64. Fewer than 100 subplots were surveyed on 97 site visits, typically due to poor weather or small site size. The mean number of visits each site received within a year ranged from 1.40 (2020) to 3.80 (2016), ranging from one to 12 visits within a year. Sites were distributed across the North (n = 548), South (n= 113), and West (n = 564), with 505 (41%) selected via the IMMP randomized GRTS sites, and 720 selected non-randomly by the observer.
A total of 2,200 species were recorded across all sites (1,658 native and 378 non-native). The most frequently observed native species were Rudbeckia hirta (n = 322), Achilea millefolium (n = 293), Monarda fistulosa (n = 220), Erigeron strigosus (n = 200) and Erigeron annuus (n = 198). The most frequently observed non-native species included Trifolium pratense (n = 305), Cirsium arvense (n = 245), Trifolium repens (n = 235), Medicago lupulina (n = 234) and Melilotus officinalis (n = 225). Frequently observed species varied by region, with only Achillea millefolium represented in the top 10 across all regions (Table 5).
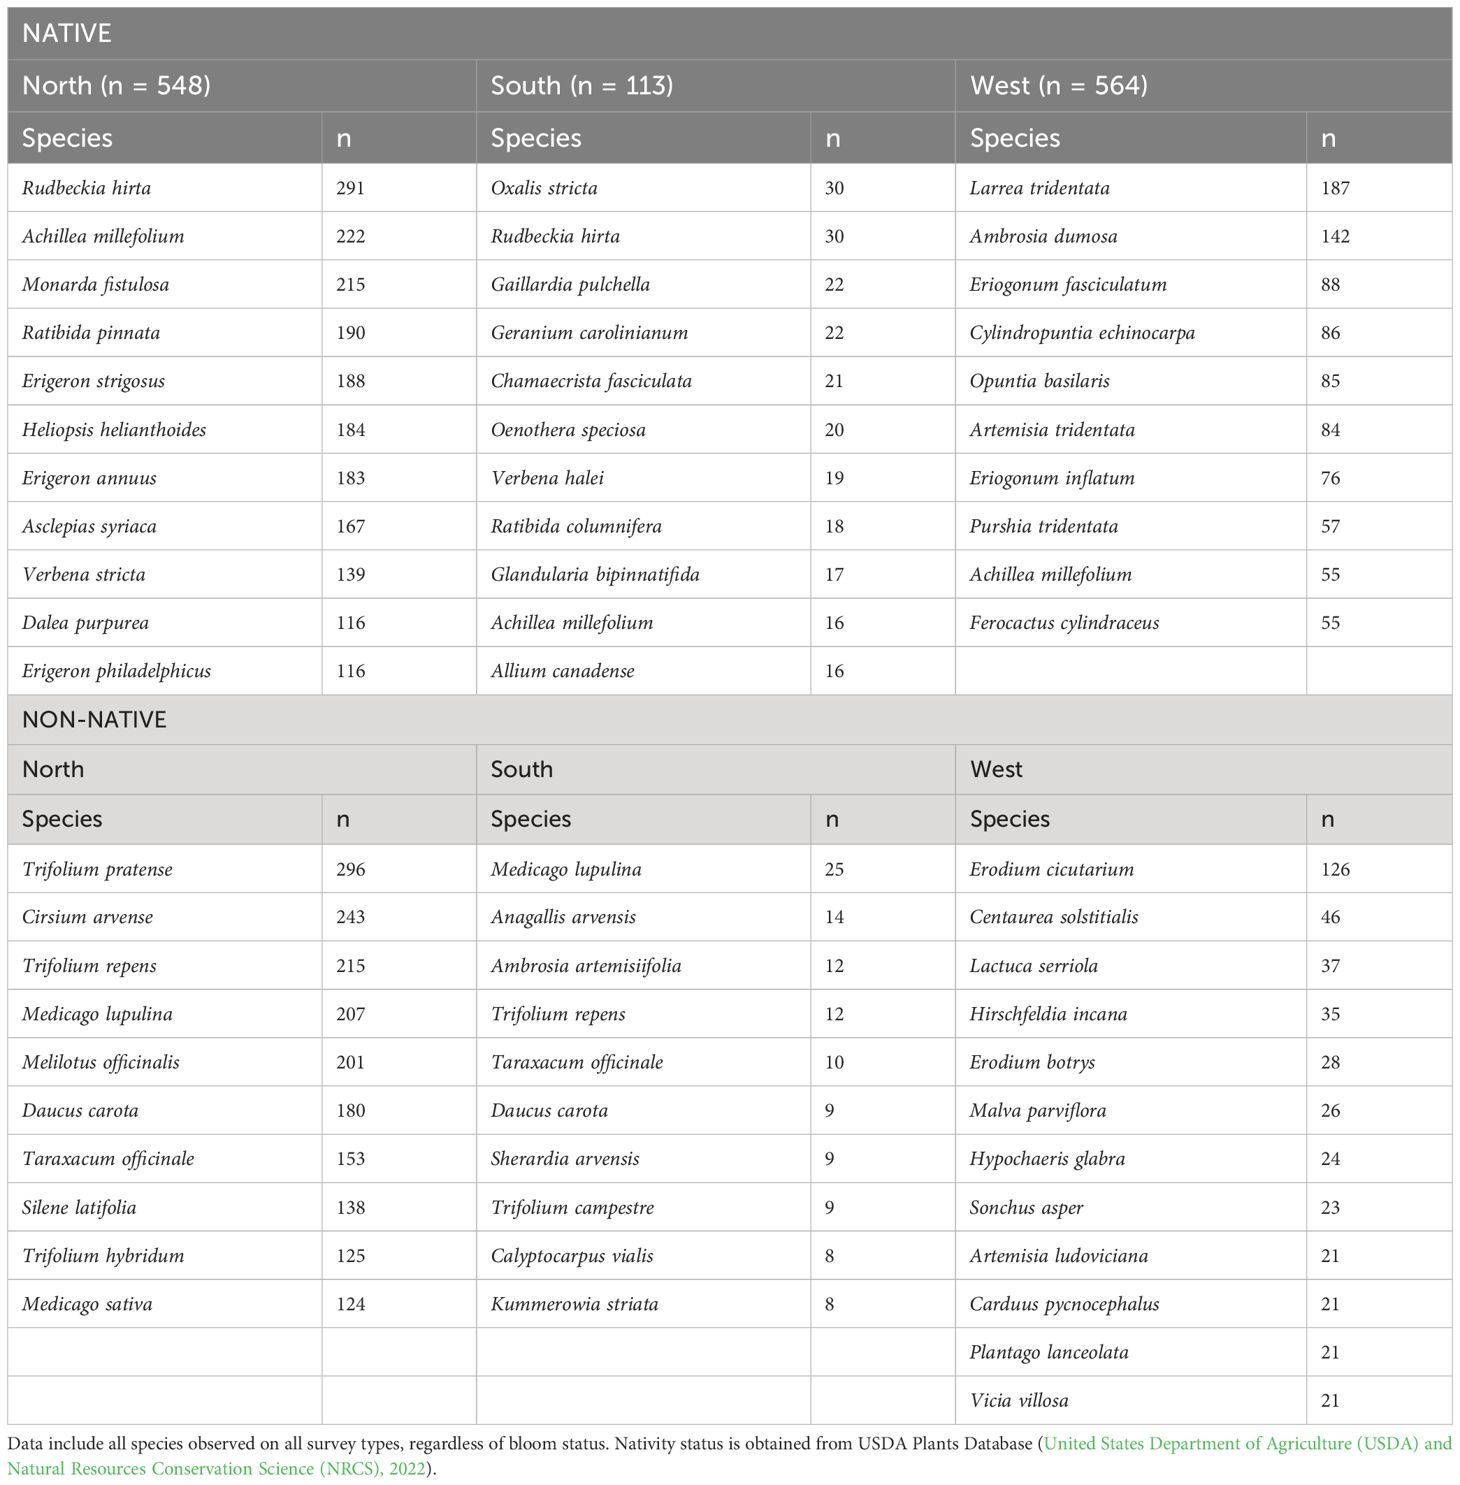
Table 5 Most frequently encountered blooming plant species on plots by nativity and region (North, South, and West Monarch Butterfly Conservation Units).
On sites where subplots were surveyed, floral frequency ranged from 0 to 1 (mean = 0.39, median = 0.33, standard deviation = 0.31). At least one flower was detected in subplots on 91% surveys overall (n = 2,164), 97% in the North (n = 1,572), 92% in the South (n = 227), and 71% in the West (n = 365).
Neither global model for floral frequency or floral richness could be fit with plot identity as a random effect so subsequent model development omitted it. Post-hoc exploration of the best models, adding in the plot random effect, yielded similar parameter estimates and addressed the regional differences in zeros compared to the models without it. The model of floral richness (with plot identity as a random effect), however, appeared overfitted and is not considered here any further.
The best model of floral frequency, with plot identity added post-hoc as a random effect, explained 31% of the variation (R2marginal = 0.183, R2conditional = 0.312, n = 2254 surveys), consisted of five fixed effects and random effects for month nested in year as well as plot identity (Table 6; Figure 4). Floral frequency was more than 25% lower in the South and West compared to the North; for example, the marginal mean frequency in random Protected Grassland sites was 0.15 (95% CI = 0.09–0.24) in the South and 0.18 (0.13–0.27) in the West versus 0.24 (0.18–0.32) in the North (Table 7). The mean marginal predicted floral frequency was significantly lower on Rights-of-Way (0.43, 95% CI = 0.32–0.54) than Agricultural Conservation Land (0.58 [0.48–0.67]), Developed (0.58 [0.42–0.72]), and Unclassified Grassland (0.57 [0.48–0.66]) but not statistically different (p = 0.12) from Protected Grassland (0.50 [0.42– 0.57]). Random sites had nearly half the floral frequency of non-random sites (0.24 [0.18–0.32] versus 0.50 [0.42–0.57], respectively).
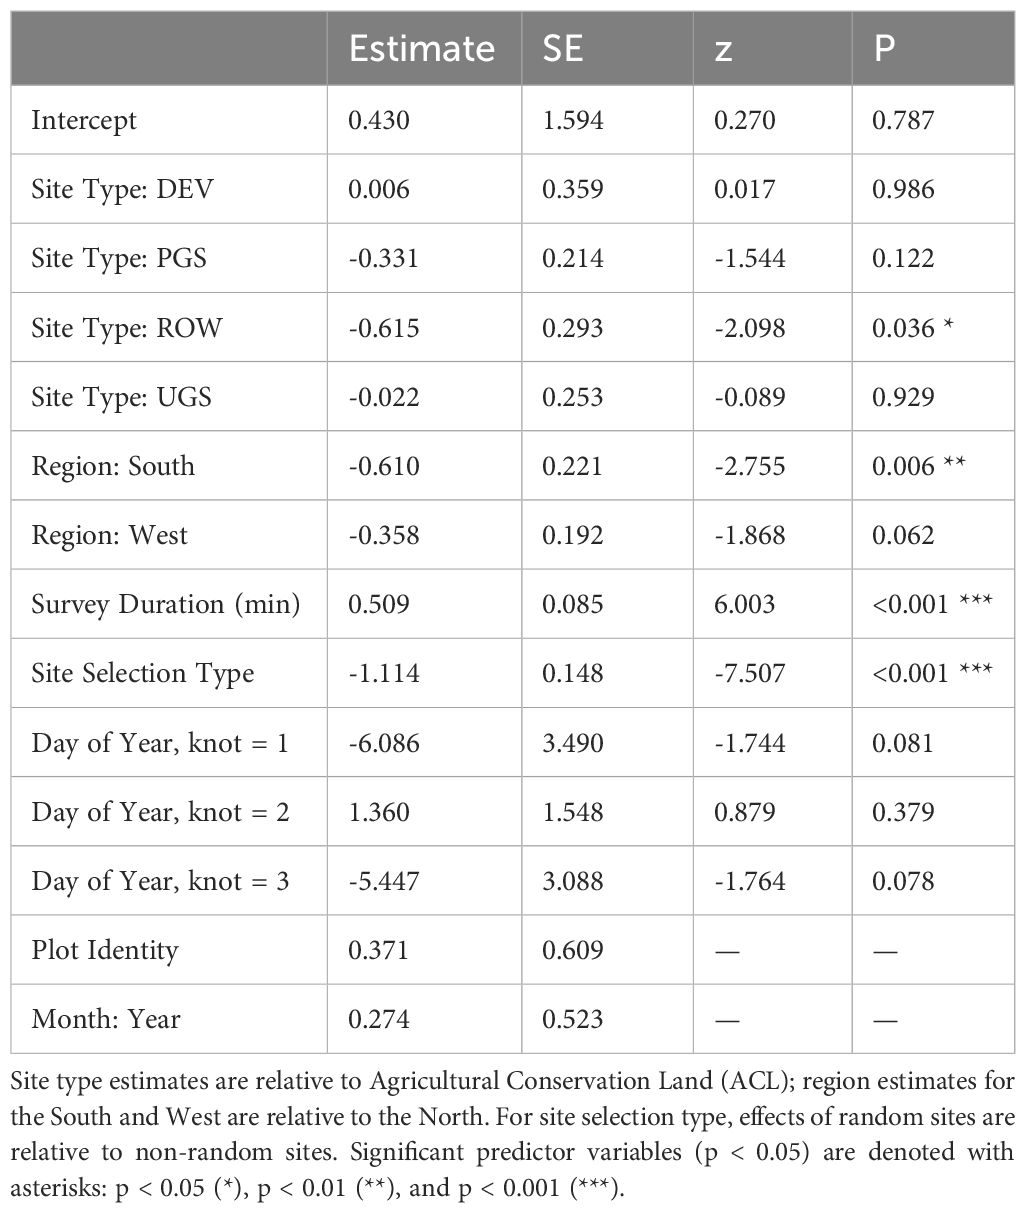
Table 6 Parameter estimates and standard errors (SE) from the best model explaining floral frequency from Integrated Monarch Monitoring Program surveys conducted 2016–2022.
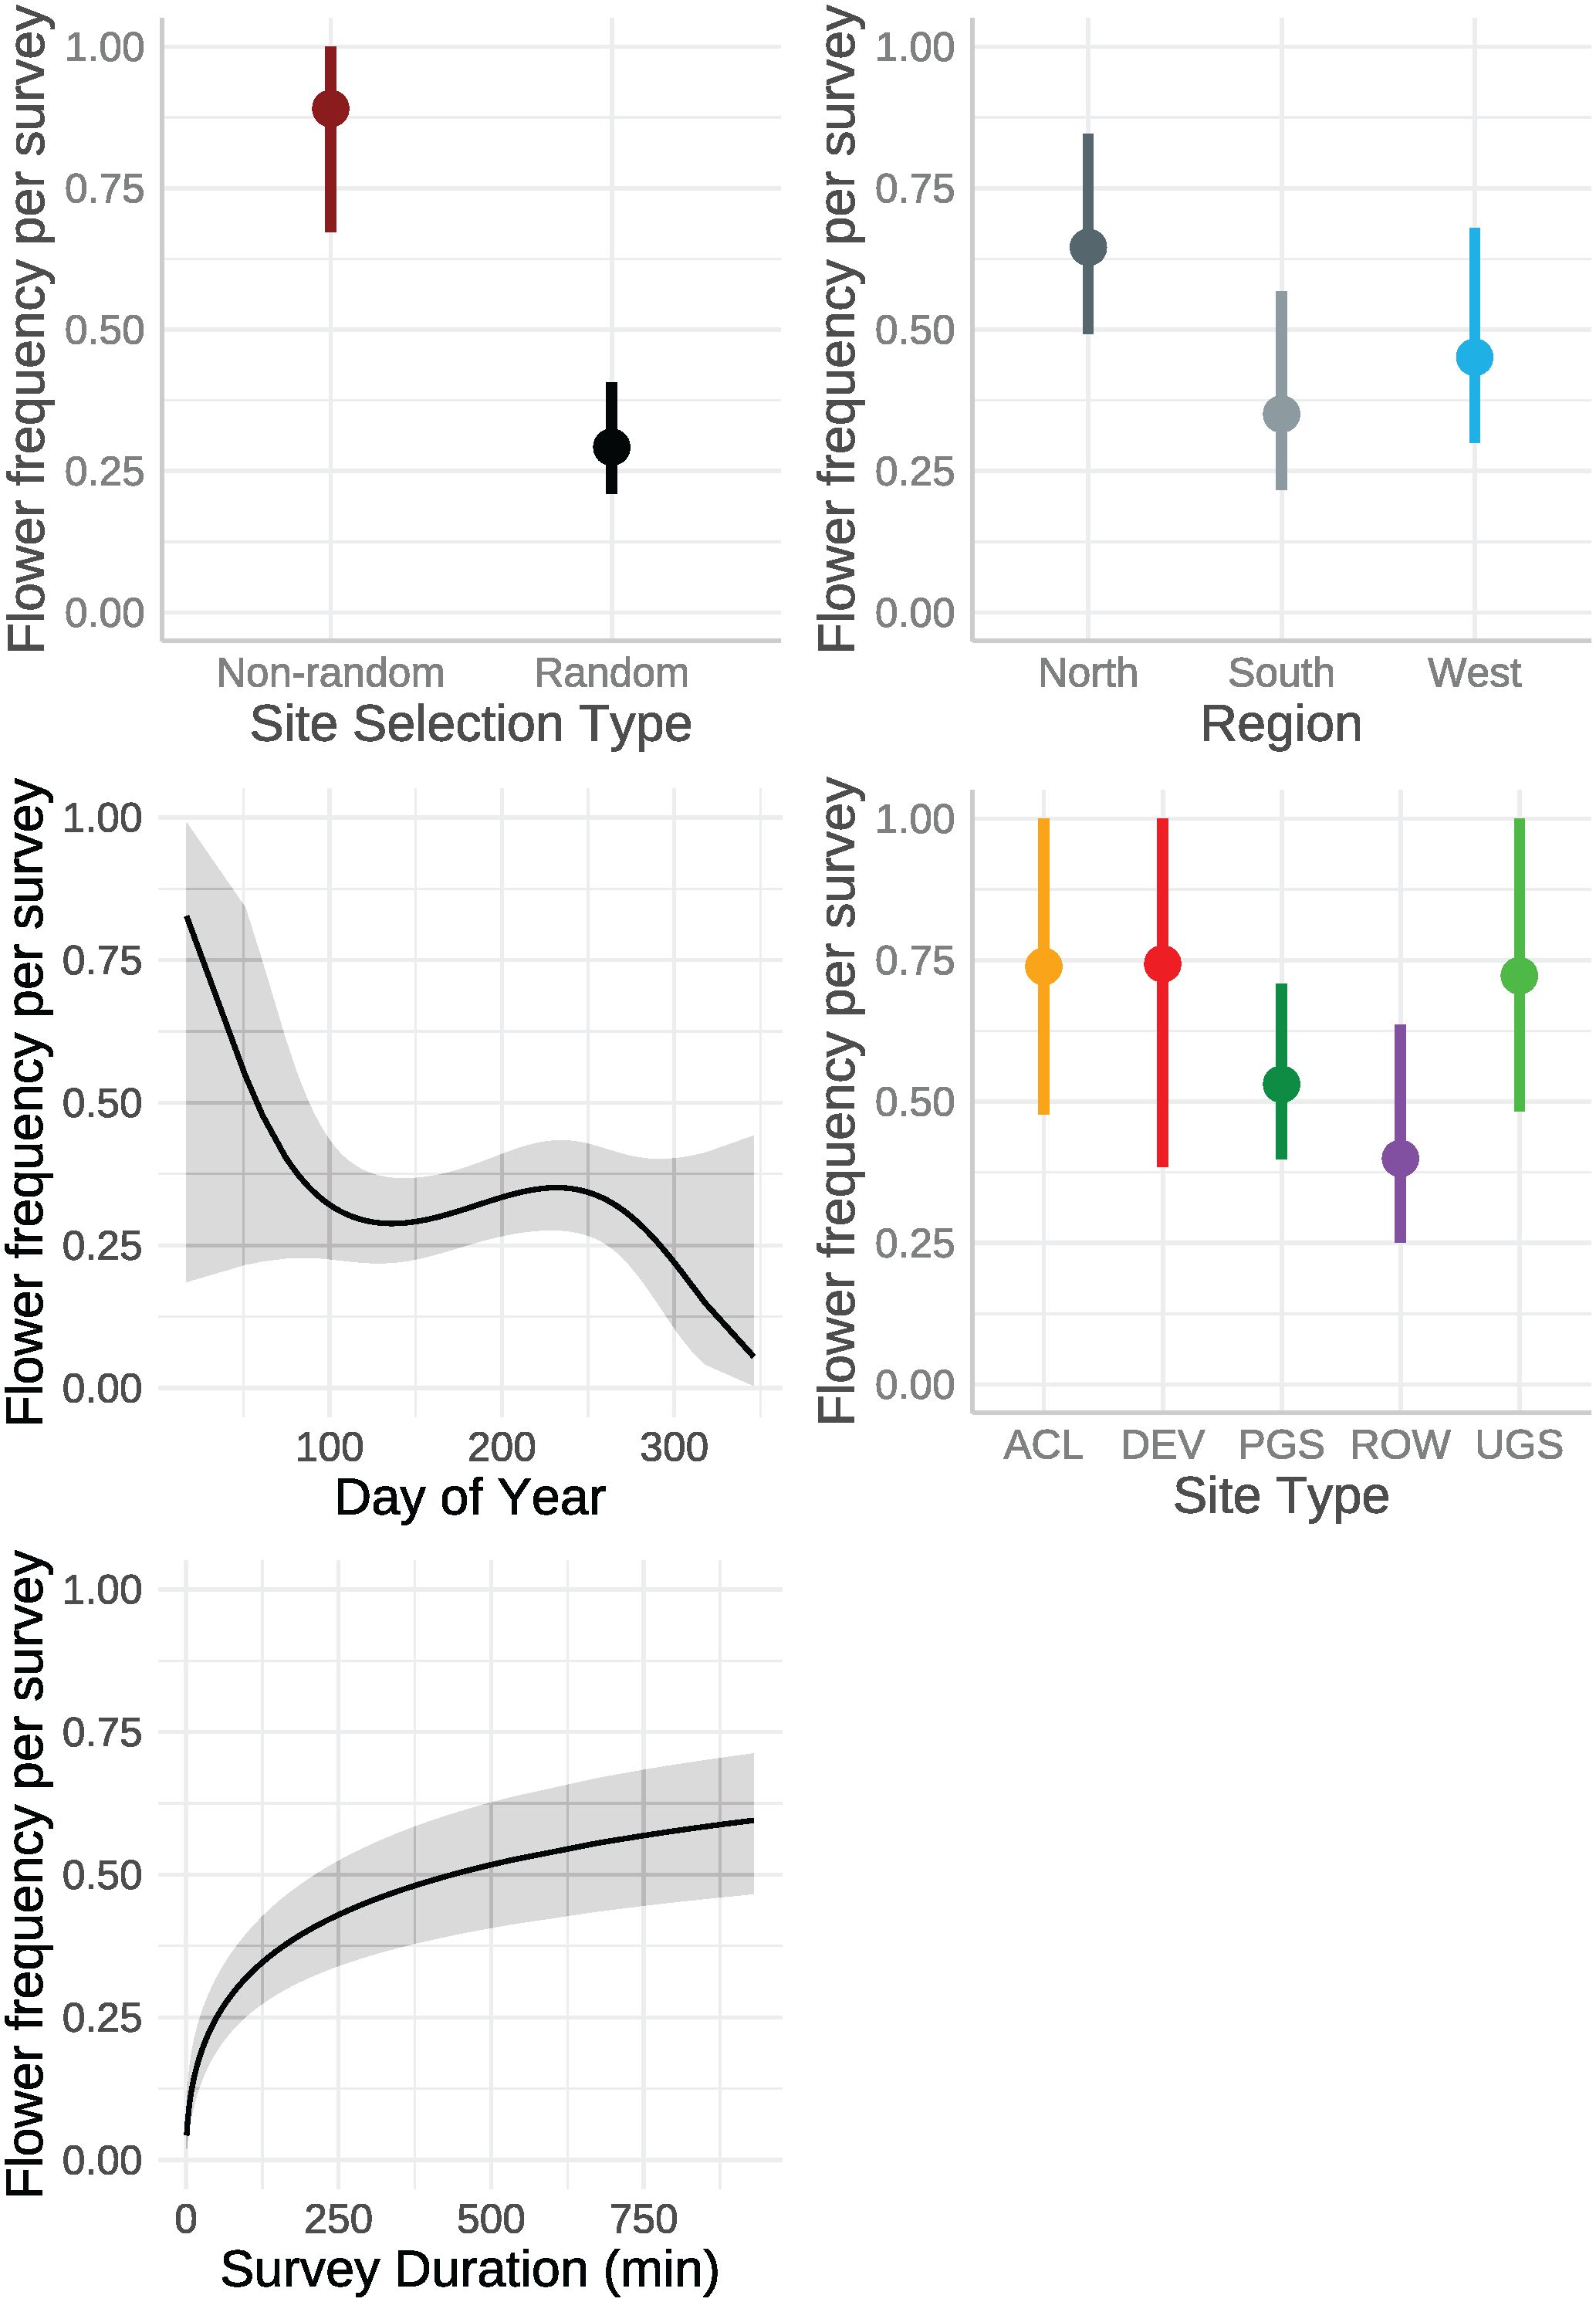
Figure 4 Marginal effects on mean floral frequency estimated from a mixed-effects logistic regression from data collected by the Integrated Monarch Monitoring Program, 2016–2022. Error bars and gray ribbons represent 95% confidence intervals. ACL, Agricultural Conservation Land; DEV, Developed; PGS, Protected Grassland; ROW, Rights-of-way; UGS, Unclassified Grassland.
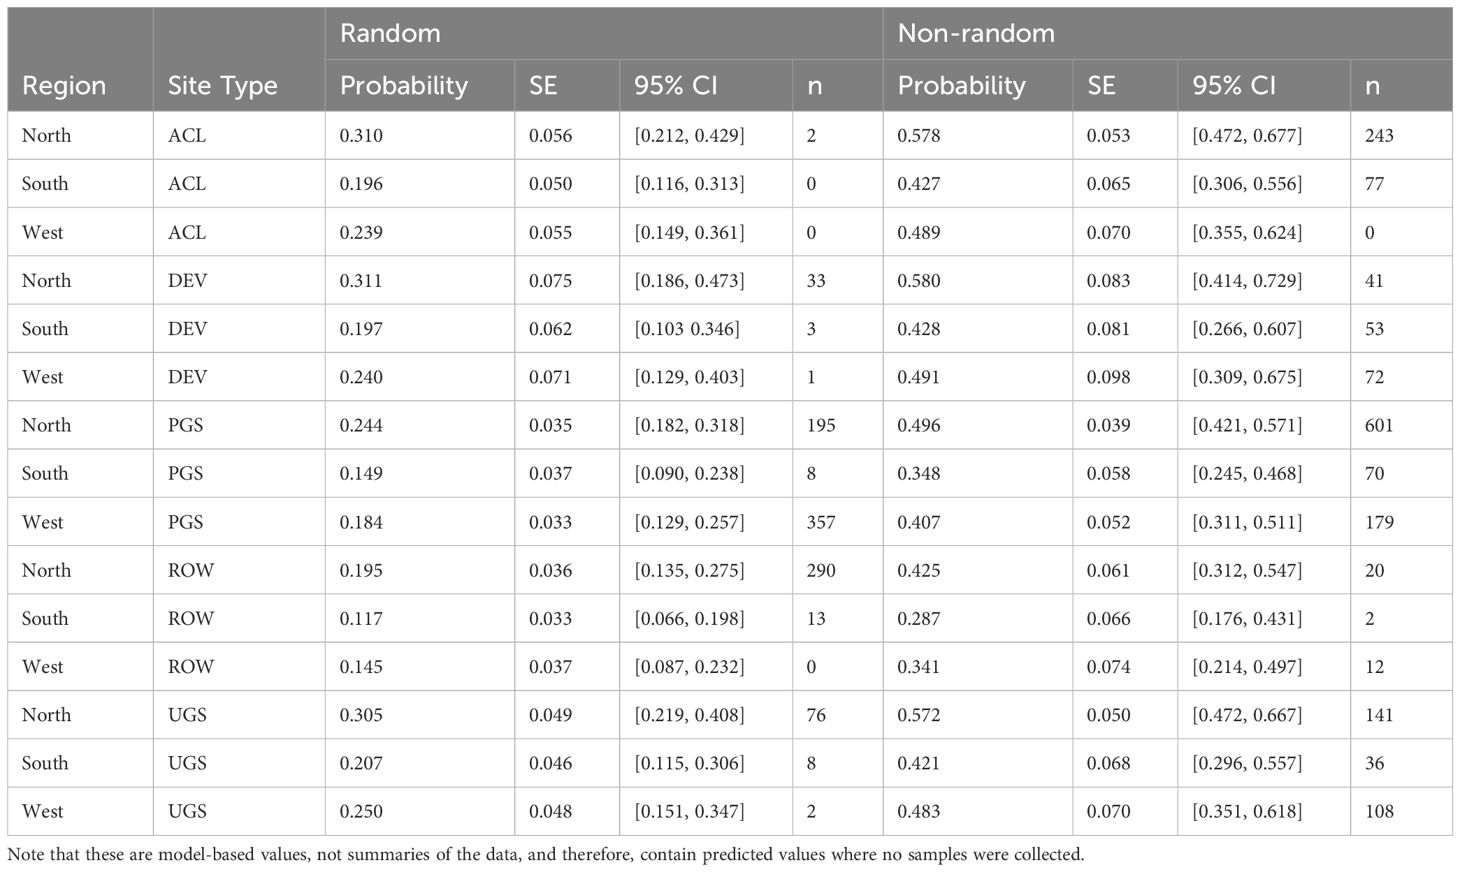
Table 7 Model-based marginal mean estimates with standard errors (SE) and 95% confidence intervals (CI) of floral frequency from a mixed-effects logistic regression of sampled Integrated Monarch Monitoring Program surveys collected 2016–2022.
The best model of floral richness, explaining 28% of the variation (R2marginal = 0.167, R2conditional = 0.278, n = 2194 surveys), consisted of the effects of region, site type, whether the site was randomly sampled, and the day of year (Table 8; Figure 5). As with floral frequency, floral richness was approximately 25% lower in the South (e.g., Agricultural Conservation Land = 8.25 species [7.09–9.84 species]) and West (7.31 [6.09–8.78]) compared to the North (10.80 [9.36–12.46]) (Table 9). Similar to floral frequency, floral richness was one-quarter lower on Rights-of-Way sites (5.74 species) compared to each of the other land use types (>7.94 species).
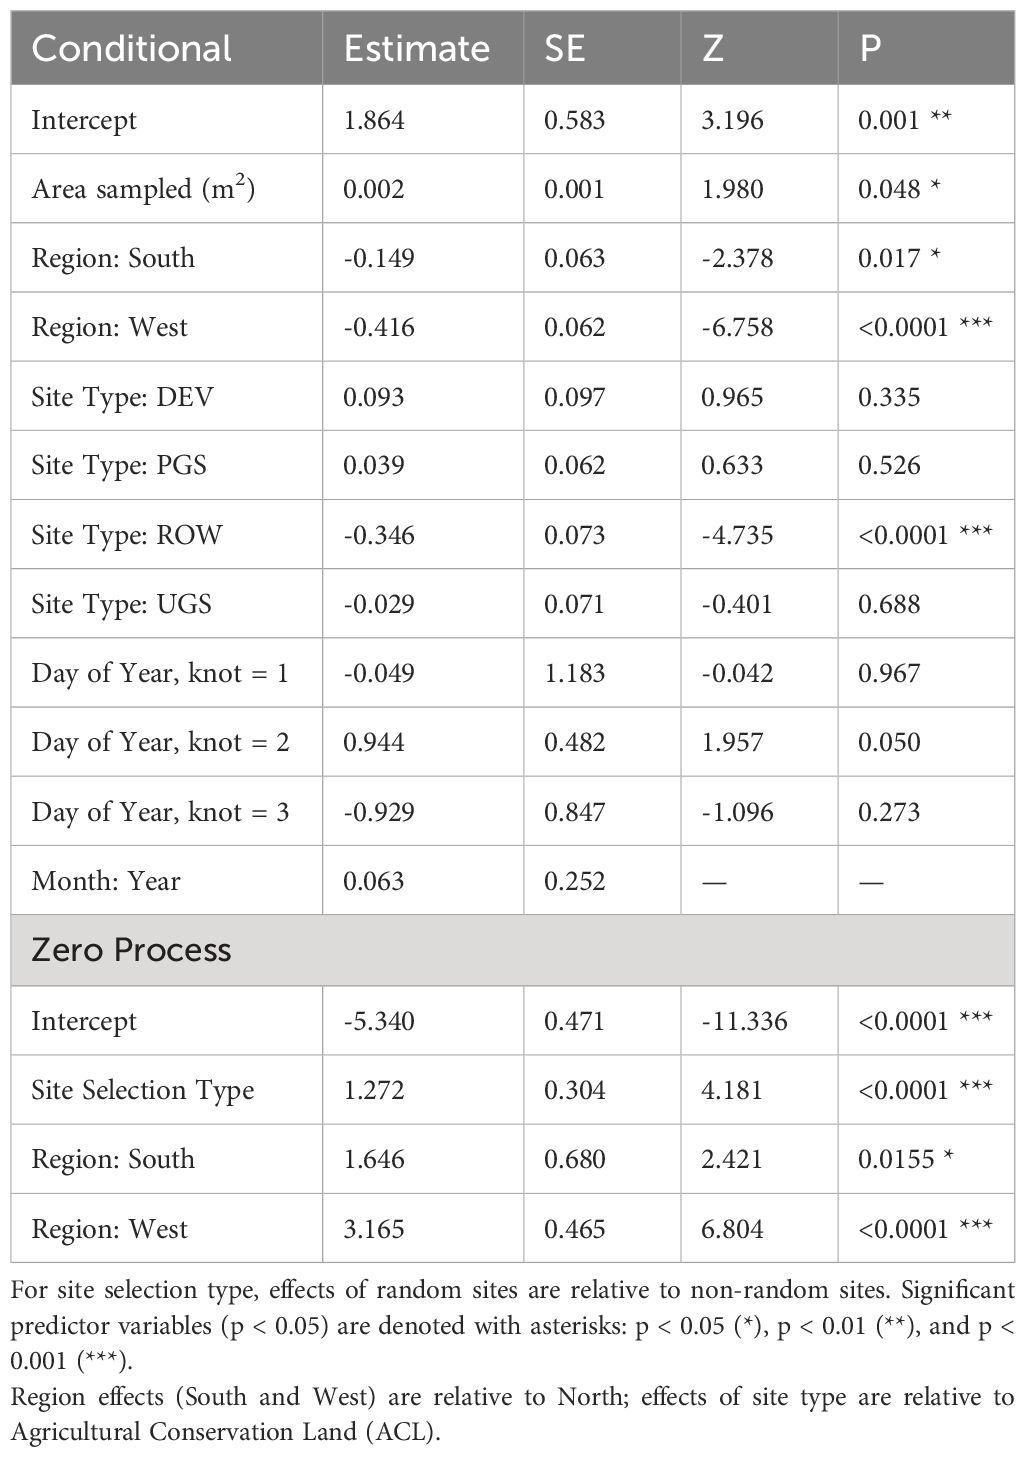
Table 8 Parameter estimates and standard errors (SE) from the best model describing variation in floral richness, derived from a zero-inflated negative binomial regression of Integrated Monarch Monitoring Program surveys collected 2016–2022.
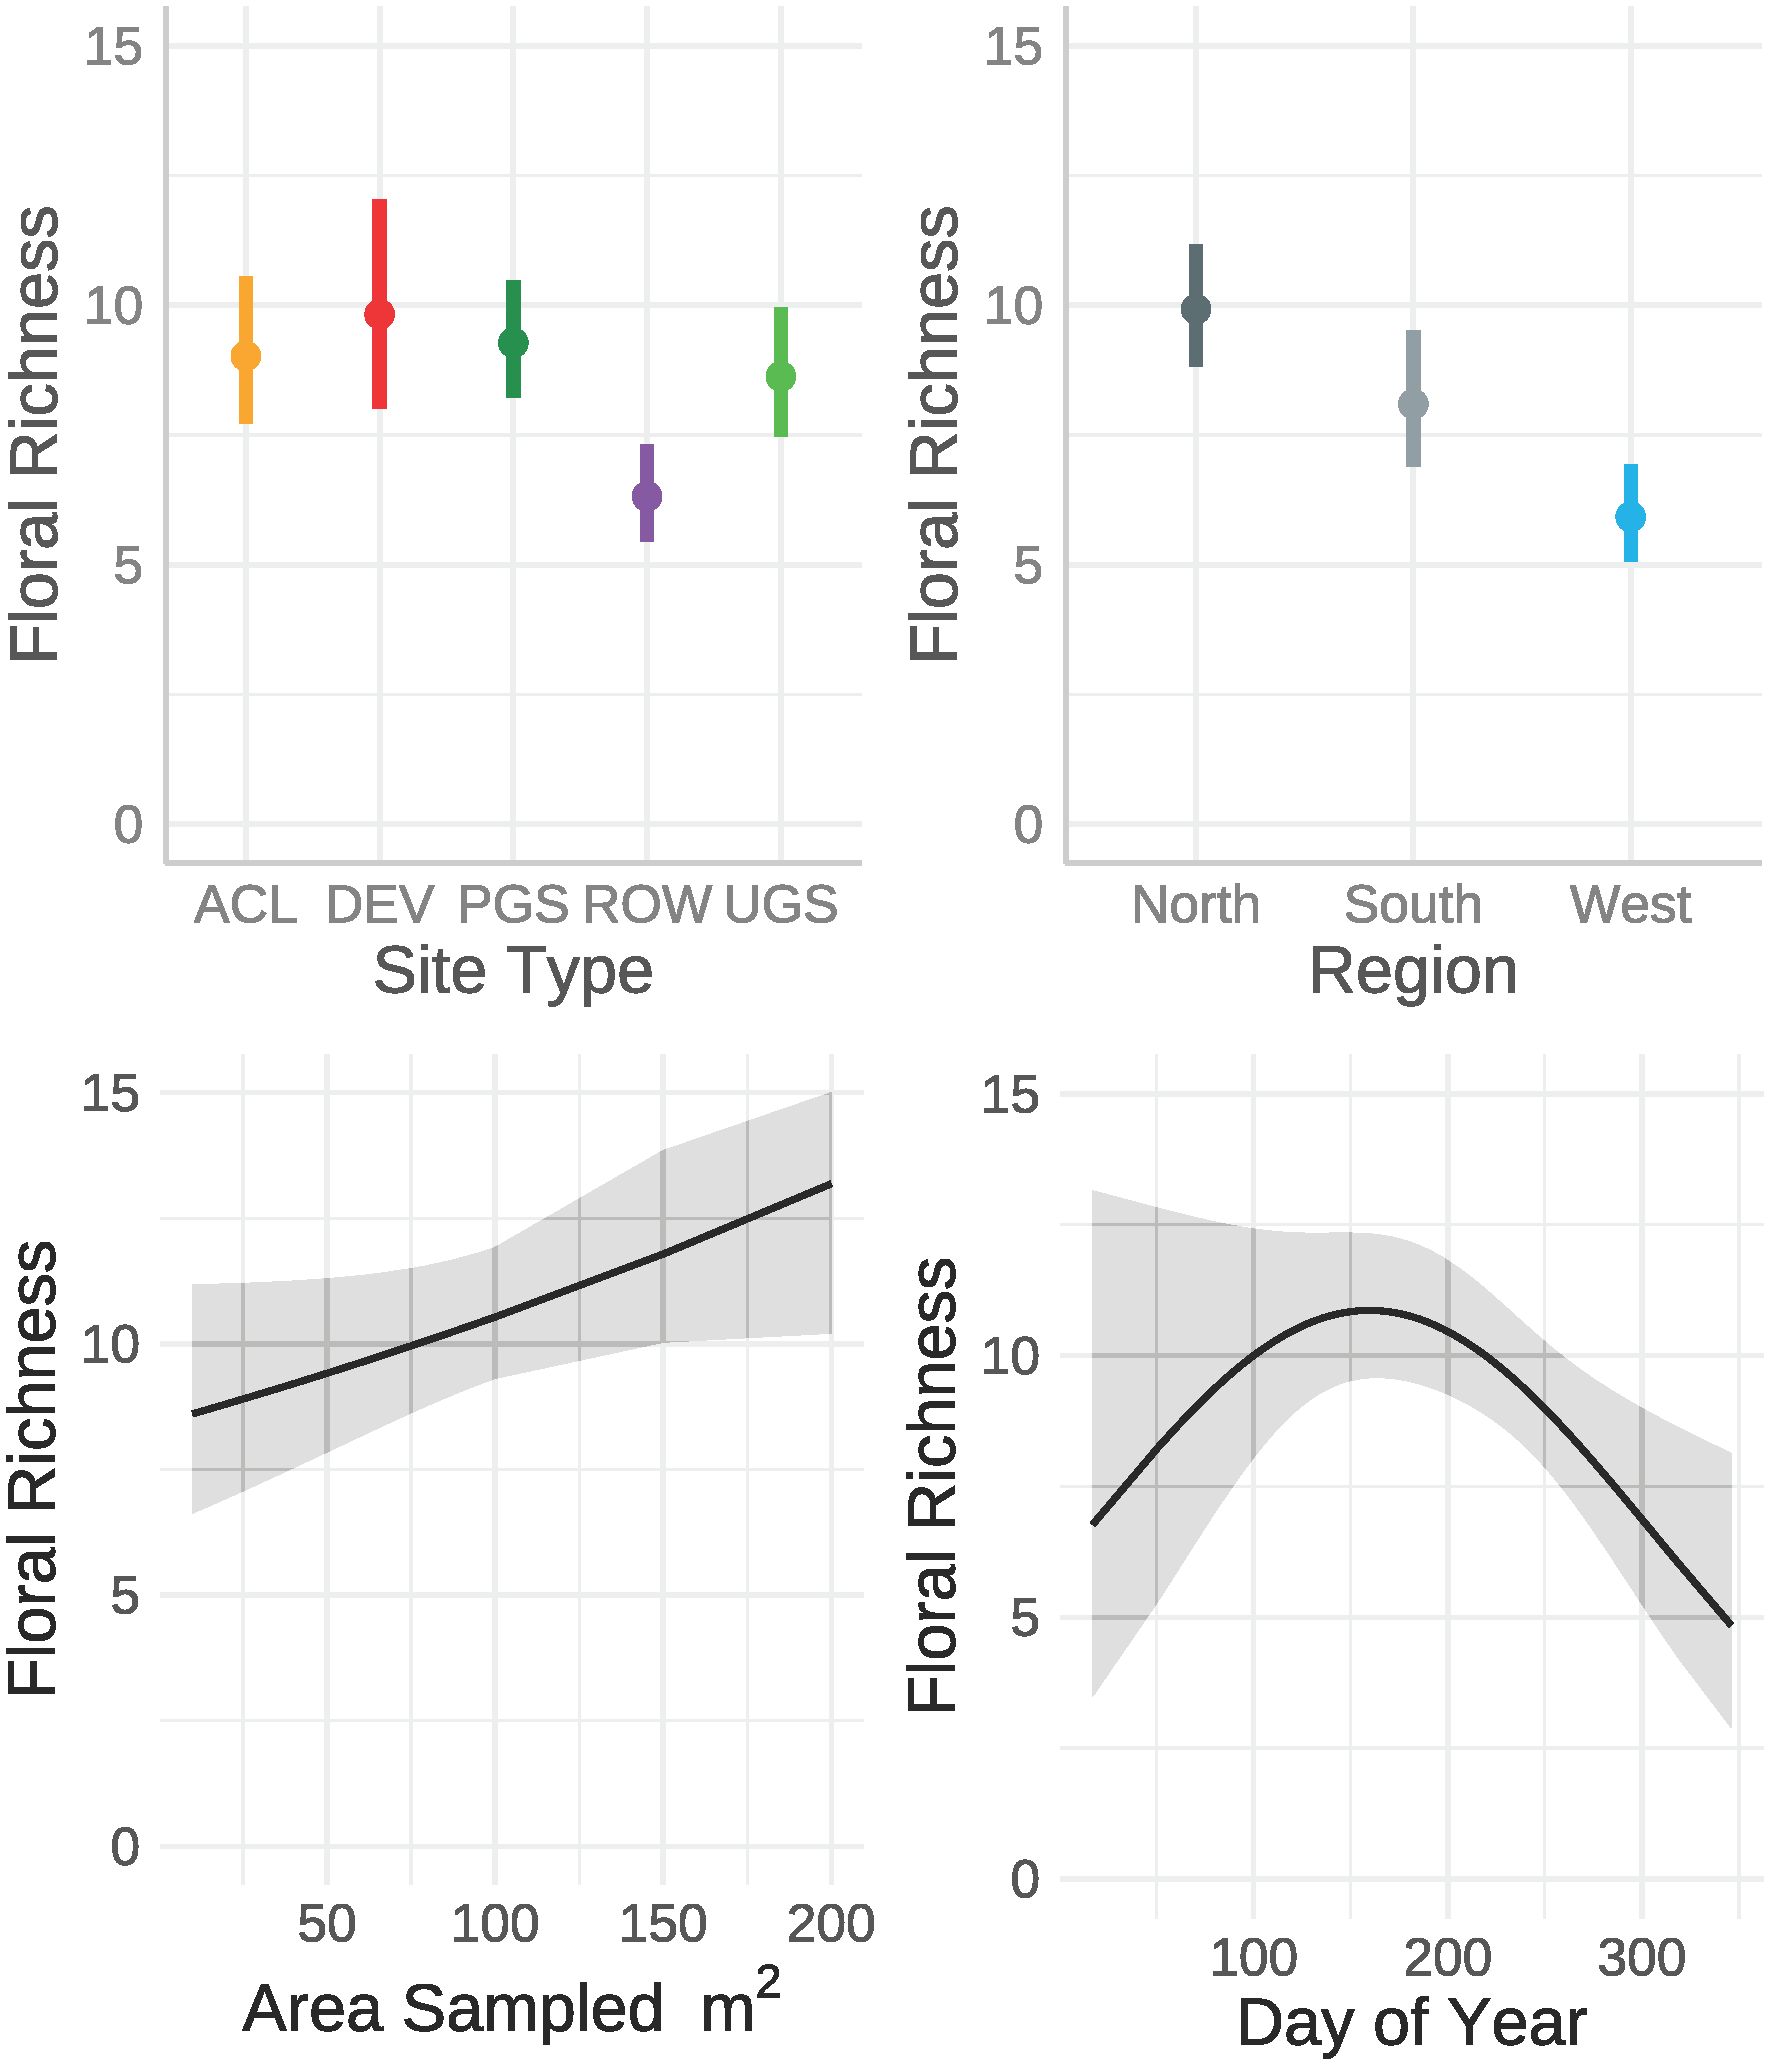
Figure 5 Marginal effects on floral richness estimated from a zero-inflated negative binomial regression from data collected by the Integrated Monarch Monitoring Program, 2016–2022. Error bars and gray ribbons represent 95% confidence intervals. ACL, Agricultural Conservation Land; DEV, Developed; PGS, Protected Grassland; ROW, Rights-of-way; UGS, Unclassified Grassland.
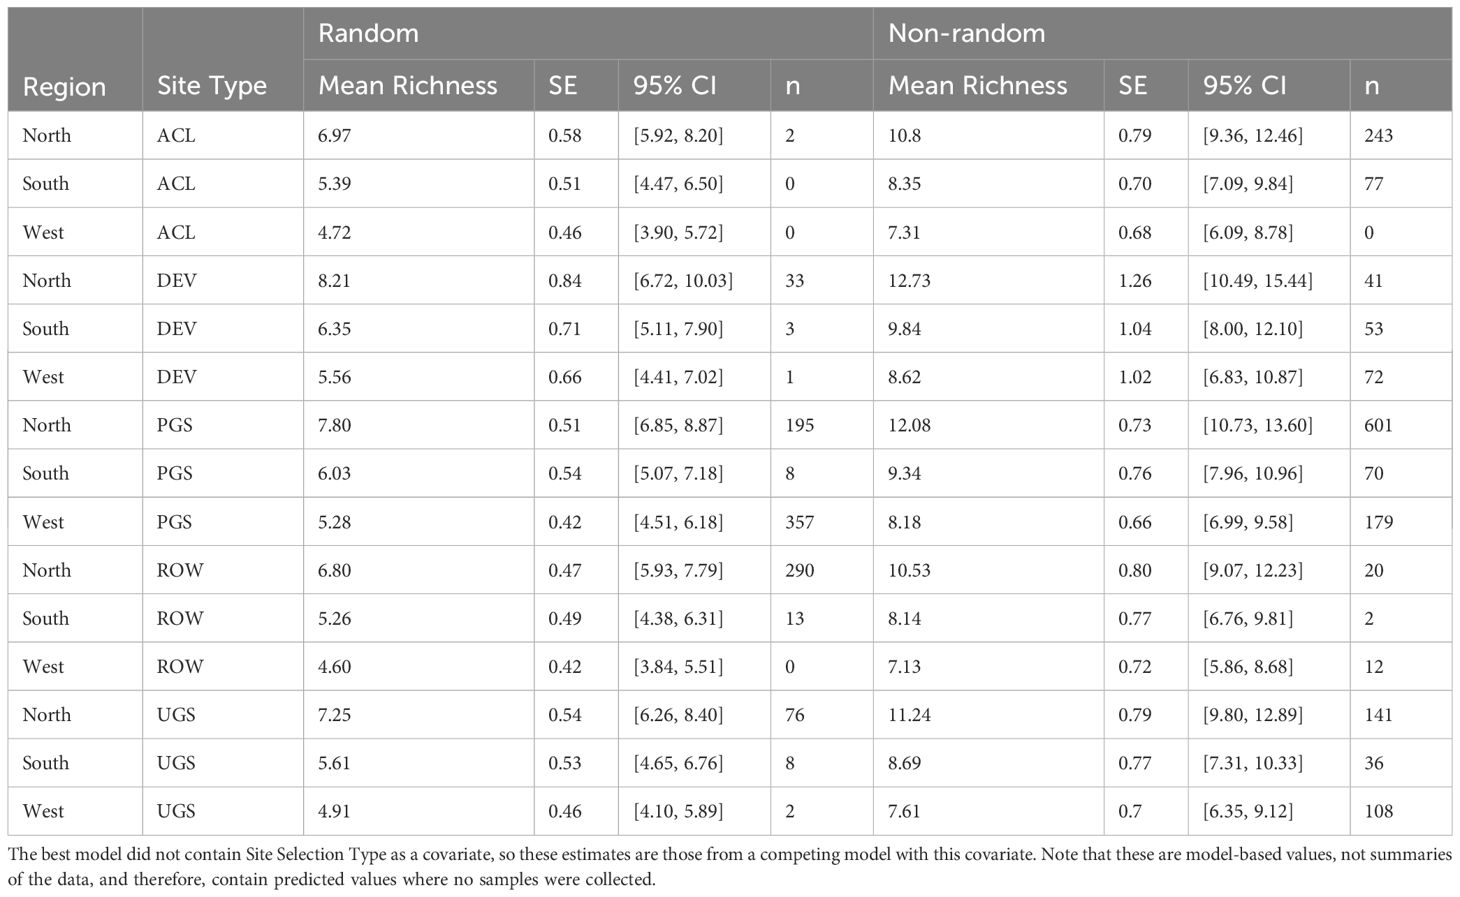
Table 9 Model-based marginal mean estimates, standard errors (SE), and 95% confidence intervals (CI) of floral richness from a zero-inflated negative binomial mixed-effects regression of sampled Integrated Monarch Monitoring Program surveys (n) collected 2016–2022.
As evident in the temporal random effects, flower presence varied annually and, when present, varied over months nested within years. The month-year patterns for blooming flower frequency and floral richness were highly correlated (r = 0.844 [95% CI: 0.736–0.910], t46 = 10.66, p = <0.001) and apparent auto-correlation in the random effect of month nested in year (r’s ≥ 0.295 at lag 1) indicated the possibility of an unmodeled climate signal.
3.3 Association of milkweeds with floral resources
Collectively, milkweed density data showed weak positive associations with floral frequency (r = 0.066 [95% CI: 0.026–0.107], t2319 = 3.202, p = 0.001) and floral richness data (r = 0.064 [95% CI: 0.022–0.105], t2260 = 3.029, p = 0.002). However, the parameter estimates for site type from the best models for floral frequency and floral richness were negatively correlated with milkweed density (r = -0.44 and -0.97, respectively). In other words, site types with high milkweed densities tended to have lower floral resources. For example, Rights-of-Way offered higher milkweed density but lower floral resources whereas Developed sites demonstrated the opposite pattern.
4 Discussion
This study provides the first nationwide, field-based depiction of milkweed and floral resources across the monarch’s North American breeding range. The program gathered data in novel combinations of geographies and site types (land uses), identifying substantial variation in milkweed and floral resources among regions, site types, and site selection types (random versus non-random). We demonstrate the IMMP’s potential to overcome the limitations in scope, geography, and frequency of sampling associated with other field-based methods for assessing pollinator habitat (Hines and Hendrix, 2005; Williams et al., 2012; Smart et al., 2021), as well as the bias associated with non-random sampling (Kinkead et al., 2019; Weiser et al., 2020). For example, we evaluated milkweed or floral resources on 564 sites in the western United States, a geography previously lacking a comprehensive evaluation of pollinator habitat on such a large scale. Although not all site type and geography combinations are thoroughly sampled, program growth can enhance our ability to characterize habitat across these spaces and at finer scales. Moreover, we emphasize that key to this assessment was the broad participation from multiple stakeholders, including community scientists, which was facilitated by major governmental and nonprofit active engagement in the IMMP.
4.1 Site selection type
Unique to large-scale community science programs, the IMMP is building an ecologically representative picture of baseline pollinator habitat via its inclusion of randomly selected sites. Our findings indicate that non-random sites, those selected by observers, do not offer an accurate portrayal of monarch habitat resources across broad landscapes. Milkweed density, floral species richness, and floral frequency exhibited distinct patterns on random versus non-random sites. Milkweed was more likely to be absent from random sites and occurred at lower densities than on non-random sites. A random site was also much more likely to be absent of flowering species; however, where they were present, richness was equivalent to that of a non-random site. Floral frequency, on the other hand, was lower on random sites, but these sites were not any less likely than non-random sites to have flowers present. These results are consistent with other studies demonstrating higher abundance of focal species on non-random sites (Kinkead et al., 2019; Weiser et al., 2020), emphasizing the importance of considering these factors when utilizing datasets reliant on user-selected sites (Pleasants et al., 2017, Pleasants et al.,2023). Despite this limitation, non-random sites offer valuable insights into the potential for various site types to contribute to pollinator habitat goals.
One potential confounding factor not explored in this study is the management of study sites; 59% of the non-random sites in this study were classified as being managed for conservation. The higher milkweed density, floral frequency, and species richness on non-random sites are likely a reflection of targeted conservation management. As a result, we recommend leveraging data from spatially balanced random sampling designs to estimate resources at scale (Cariveau et al., 2019b). Further, we advise against using non-spatially balanced data to extrapolate resource availability across large scales (Pleasants et al., 2017; Pleasants et al.,2023).
4.2 Site type
Our study presents a nuanced perspective on the potential for various land use types to serve as habitats for monarch butterflies. We detected several differences in measures of monarch breeding and foraging habitat (milkweed density, floral species richness, floral frequency) among site types. On Developed sites, we observed a higher likelihood of milkweed occurrence than on Agricultural Conservation Land, but when present, the densities were not statistically different. Our model estimates for milkweed densities on random Developed sites was notably higher than those reported by Johnston et al. (2019), who estimated baseline milkweed density in four U.S. metropolitan areas: Minneapolis-Saint Paul, Minnesota (North), Chicago, Illinois (North), Kansas City, Missouri (South), and Austin, Texas (South). Johnson et al.'s (2019) mean baseline density, averaged across their site types, was 26 stems per hectare in the North and 18 stems per hectare in the South, equivalent to approximately 9 and 6 plants per hectare (respectively) when applying a three stems per plant conversion factor as per the methods of (Thogmartin et al., 2017). Both densities are substantially lower than our model estimates of 190 plants per hectare for random sites in the North and 186 in the South. On the other hand, our model estimate for Developed non-random sites in the North (267 plants/hectare) closely resembled their two highest land use type means for enhanced sites in Chicago. Johnston et al. (2019) report 483 and 880 stems per hectare for developed open space (conservation and non-conservation), equivalent to approximately 161–293 plants per hectare.
We found similar floral frequency and richness in Developed areas and natural spaces (Unclassified Grassland, Protected Grassland, Agricultural Conservation Land), unlike other studies (Lynch et al., 2021). Although plant species richness often peaks at moderate or high levels at urban densities (Pyšek, 1993; Knapp et al., 2008; McKinney, 2008), our site types lack this thematic resolution. The broad categorization of IMMP Developed sites, coupled with differences in sampling design, may explain disparities between our model’s estimation of milkweed and floral resources and those of other studies. For example, the IMMP’s Developed site classification is determined by the extent of impervious surface in the surrounding landscape, amalgamating parks, open spaces, and gardens. In contrast, Johnston et al. (2019) included high-density areas, and other studies on floral resources further refine site types into more specific categories (e.g., McKinney, 2008; Lynch et al., 2021). Despite these differences, our findings indicate that certain developed spaces can contribute to achieving monarch conservation targets by offering milkweed and floral resources comparable to other grassland landscapes.
Our data indicate that Rights-of-Way are dense with milkweed but comparatively impoverished of floral resources, exhibiting lower flower frequency and richness compared to other site types. This aligns with previous research highlighting the prevalence of milkweed in roadside environments (Hartzler and Buhler, 2000; Hartzler, 2010; Kasten et al., 2016; Dee & Baum, 2019; Cariveau et al., 2019a). Model predictions of densities on northern random and non-random Rights-of-Way ranged from 569–795 plants per hectare (respectively), similar to 508 plants per hectare reported for Asclepias syriaca on Minnesota roadsides (Kasten et al., 2016). Although Kasten et al. (2016) presented mean densities for this species alone (whereas we combined all species except for A. verticillata and A. subverticillata), A. syriaca was the most common species encountered in the North and grew at highest densities on random sites. Kaul and Wilsey (2019) reported a greater mean density on Iowa roadsides (1,274 plants/hectare), but this difference may be attributed to their inclusion of Asclepias verticillata in density calculations, which, as our data indicate (Supplementary Table S1), tends to grow in very high densities. In the South, Rights-of-Way density estimates (1,163–1,767 plants/hectare) were approximately 30 percent lower than those reported by Baum and Mueller (2015), who estimate 1,600–2,400 plants per hectare on Oklahoma roadsides.
The observed low floral frequency on Rights-of-Way indicates untapped potential to offer high-quality breeding resources for monarchs through targeted efforts to enhance floral resources. For example, conservation management such as integrated vegetation management (IVM) is designed to promote desirable (typically native) low-growing plant communities through ecologically sound practices (Nowak and Ballard, 2005; Yahner and Hutnik, 2004). IVM techniques, such as selective herbicide application and fall mowing, have been shown to increase floral resource abundance (Russell et al., 2018; Kuder, 2019), with some exceptions (Mahan et al., 2020), highlighting the opportunity to implement focused improvements in areas where floral resources are low and milkweed densities are already high.
Agricultural Conservation Lands depicted the opposite pattern of Rights-of-Way, with relatively low densities of milkweed but relatively higher floral frequency and richness. Unexpectedly, milkweed densities on Agricultural Conservation Land were lower than both Protected and Unclassified Grassland, contradicting predictions by Thogmartin et al. (2017), which assumed that Agricultural Conservation Land had the highest potential for milkweed density. This finding highlights an opportunity to improve practices in northern agricultural conservation programs to better align with densities found on other grassland types. Novel practices targeting pollinators, such as the Conservation Reserve Program’s CP-42 Pollinator Habitat program, could facilitate this improvement. The IMMP dataset also contains information on conservation program and site management, which could be used to more specifically evaluate program management and outcomes, considering the variability in resources provided by different conservation practices (Smart et al., 2021).
Observed milkweed densities for Agricultural Conservation Land (287–390 plants/hectare) and Protected Grassland (399–543 plants/hectare) in the North were lower than Lukens et al. (2020) reported densities on restored conservation grasslands in Minnesota, Wisconsin, and Iowa. Notably, Lukens et al.’s dataset is a subset of the overall IMMP dataset, representing 276 of 2,707 surveys. Model estimates for Unclassified Grassland (303–1,285) closely resembled Lukens et al.’s reported mean density of 1,390 plants per hectare. Although all grassland types had higher densities than Kaul and Wilsey (2019) estimated mean for Iowa conservation plantings (approximately 71 plants/hectare using a 3 stem/plant conversion factor), they were lower than their mean for remnant prairies (approximately 2,902 plants/hectare). In the South, milkweed densities for Protected Grassland and Unclassified Grassland were both lower than Baum and Mueller (2015) estimate for managed prairie in Oklahoma. Their range of 2,400–2,700 plants per hectare is approximately 3.5 times higher than observed in Protected Grassland (686 plants/hectare) and 2 to 2.5 times higher than observed in Unclassified Grassland (1,049 plants/hectare).
Our findings align with Smart et al. (2021), demonstrating similar floral resource availability among upper Midwest grassland types. Unclassified Grassland, Protected Grassland, and Agricultural Conservation Land site types exhibited relatively comparable floral frequency and richness levels. Although fewer floral resources were observed on Rights-of-Way compared to Agricultural Conservation Land overall, this difference did not reach statistical significance when considering only random (i.e., background) site selection types in the North (odds ratio = 1.85, p = 0.11). Among surveyed grassland types, Unclassified Grassland—primarily privately owned grassland—had the highest milkweed densities, underscoring its importance as monarch breeding habitat. We lacked sufficient samples of Agricultural Edge habitats, which have been shown to provide high levels of floral resources (Lynch et al., 2021), and Agricultural Crop Fields, which may also provide pulses of floral availability (Williams et al., 2012; Mallinger et al., 2016; Hemberger and Gratton, 2023). Additional surveys and inclusion of these site types in future analyses could provide a more comprehensive understanding of the complex resource availability among grassland types at large scales.
4.3 Region
We found that both milkweed and floral resources varied significantly by region, emphasizing the importance of applying regionally appropriate goals and standards for restoring or managing pollinator habitat. Milkweed was more likely to occur on sites in the North than the South or West, but when present, the density was similar across regions. Despite the lack of statistical significance, the general patterns in density we observed among regions are similar to those documented by Spaeth et al. (2022). Spaeth Jr et al. assessed milkweed on western U.S. rangelands (largely equivalent to Unclassified Grassland in the West and western portions of the North and South), finding that milkweed densities are highest in mid-latitude areas of the North, lowest in the South, and greatest in the easterly areas of their study area and lowest farther West (differences in methodology make absolute comparisons of densities difficult). Similarly, we found that flowers were more likely to be present in the North, with both floral richness and frequency notably higher in this region compared to the West or South.
One limitation of our study and possible influence on regional estimates is the lack of sampling within Agricultural Crop Fields (and therefore exclusion from our analysis). The northern United States, in particular, is characterized by extensive agricultural activity and since the widespread adoption of herbicide-tolerant corn and soybeans, milkweed has largely disappeared from these fields (Hartzler, 2010; Pleasants and Oberhauser, 2013). Lacking samples from these areas could lead to an underrepresentation of sites in which milkweed does not occur in the North region. Nevertheless, our data indicate that increasing the quantity of milkweed in the South and West may be best accomplished by increasing its distribution across the landscape, rather than focusing on increasing densities where it is already present. Furthermore, estimates of milkweed density generated from primarily northern datasets (Hartzler and Buhler, 2000; Hartzler, 2010; Pleasants and Oberhauser, 2013; Zaya et al., 2017) may best represent only the North, and are unlikely to be suitable for nationwide application. This finding supports the approach taken by Koh et al. (2016) to consider ecoregional differences when developing nationwide models of pollinator resource availability.
4.4 Survey timing and methodology
Milkweed densities and floral resources responded differently to survey timing and methodology. Although varying by region, milkweed density overall was highest during mid-July, consistent with peak timing recorded by other studies (Lukens et al., 2020). Although we detected fluctuations in floral resource metrics throughout the year, our sample did not yield statistically significant insights into the timing of floral availability. The IMMP provides, but does not enforce, recommendations for the timing and frequency of surveys; therefore, some surveys may have occurred outside of optimal time periods, affecting measured values. Additional samples would strengthen our ability to detect phenological patterns in floral resource availability within and among years. Regarding methodology, milkweed was more likely to be present and occur at higher densities on sites with standard survey methods compared to modified census surveys. Floral richness increased with greater sample area, and floral frequency increased with survey duration. We suspect, however, that these differences are a product of (a) participants selecting census surveys intentionally where resources are low, as a rapid way to assess the few resources present, and (b) larger, more diverse sites inherently taking longer to survey.
Our models explained three-quarters of the variation in milkweed density and one-quarter of the variation in floral resource availability. Variables not included here such as soil type, annual weather variation, elevation, distance to water, land use and disturbance history, and management are known to influence milkweed and floral dynamics and may account for the unexplained variability in our models (Dee and Baum, 2019; Kaul and Wilsey, 2019; Svancara et al., 2019; Tracy et al., 2019; Waterbury et al., 2019; Spaeth et al., 2022). Weather, in particular, may have affected this dataset and the regional variation we observed in milkweed and floral metrics. During 2000–2019, the southern United States experienced a high number of drought events while western states experienced substantial periods of severe drought conditions (Leeper et al., 2022). Furthermore, while plot identity, representing site-level variation, emerged as a significant predictor of milkweed presence and density and floral frequency, it did not integrate effectively into floral richness models and was consequently excluded. With expanded sampling efforts, this variable, along with climate metrics, may provide crucial insight into the heterogeneity of milkweed and floral resource availability among sites and regions (Weiser et al., 2019b).
4.5 Association of milkweeds with floral resources
Our study revealed a negative correlation between milkweed and floral availability across study areas. Sites with high-quality breeding habitat (milkweed) tended to exhibit lower levels of foraging resources (floral richness and frequency). Previous research on monarch use of habitat found elevated adult monarch abundance and oviposition at sites characterized by both milkweed and high plant species diversity (Kral-O’Brien et al., 2020), which indicates that although not all flowering species in the current study may offer foraging value, they may affect behavior. These results underscore the importance of managing landscapes to support both milkweed and floral resources to provide quality resources for all life stages.
4.6 Future directions
Despite the vast geographic range and sample size in this project, targeted sampling could enhance inferences about pollinator habitat in specific spaces and time periods. Certain combinations of site types and geographic regions were absent from our sample (e.g., Agricultural Conservation Land in the South and West), limiting inferences about habitat availability in those areas. Because recent studies demonstrate the importance of the agricultural sector in contributing to monarch habitat and population targets (Pleasants and Oberhauser, 2013; Thogmartin et al., 2017; Grant et al., 2022; Dilts et al., 2023), future IMMP sampling within this site type would be beneficial. Furthermore, large data gaps remain in the southeastern United States, Great Plains region, and Pacific Northwest (Figure 2). Additional samples from these geographies would enhance our understanding of regional resource availability and at finer scales than we were able to achieve with this analysis.
Conservation practitioners would also benefit from an improved understanding of how monarchs and pollinators interact with habitats of varying quality. We recognize that the sites surveyed and flowering species documented may not offer equal value to monarchs (Nail et al., 2015; Grant et al., 2020; Antonsen et al., 2021; Bruce et al., 2022; Scott et al., 2023). The IMMP’s surveys of adult and immature monarchs offer opportunities to explore such relationships. These additional metrics can be leveraged to investigate monarch response to habitat suitability, variation in monarch survival and reproductive success among site types, habitat characteristics, and regions, and adult foraging preferences at regional scales.
Finally, these data are applicable beyond monarchs, and can elucidate patterns in the spatiotemporal availability of floral resources for other pollinators. National-scale assessments of floral resource availability are currently estimated through a combination of expert opinion and models based on 30 m resolution satellite imagery (Koh et al., 2016). The IMMP’s field-based, species-level resolution offers opportunities for improved mapping of breeding habitat for specialist species, identifying temporal gaps in resource availability, and investigating patterns of non-native and invasive forb coverage.
4.7 Conclusion
This study demonstrates the potential of the IMMP’s monitoring framework to robustly characterize pollinator habitat across multiple regions and site types. Because prior work has demonstrated strong positive associations between pollinators, particularly bees, and floral resource availability, these data may lend insight into pollinator health more broadly (Lane et al., 2020, 2022; Rotondi et al., 2023; Ammann et al., 2024). Furthermore, given that 1,233 unique plots were sampled within seven years, 41% of which were randomly selected, the IMMP is on track to achieve sample sizes necessary to detect robust trends in milkweed densities through time (Weiser et al., 2019a; Weiser et al.,2020). As sample sizes increase, so does our ability to evaluate trends at finer scales, particularly within specific land use types, regions, and time periods.
This research provides land managers, conservation practitioners, and policy makers with an understanding of the role that various land use classes play in supporting pollinators and their habitat. This information warrants consideration when creating or revising goals within monarch conservation strategies (e.g., Mid-American Monarch Conservation Strategy, Western Monarch Butterfly Conservation Plan). The IMMP provides robust metrics to enhance population and habitat modeling processes that have largely relied on expert opinion and limited datasets. Reassessing targets derived from these models can help refine our understanding of habitat needs and, in turn, allow managers to direct conservation efforts more effectively. Furthermore, a keen understanding of both current and potential habitat conditions can help in prioritization of on-the-ground conservation actions.
The IMMP offers a robust dataset and standardized methodology that can be adopted by researchers seeking to answer a multitude of questions about monarch ecology and pollinator habitat suitability (Monarch Joint Venture, 2021)1. Future monitoring efforts could adopt elements of the IMMP’s sampling framework where relevant to enrich data on milkweed and floral resource availability across the country. To make substantial advancements in evaluating and tracking change in pollinator habitat, monitoring would be beneficial in geographies and land uses where data gaps currently exist.
Data availability statement
The raw data supporting the conclusions of this article will be made available by the authors, without undue reservation.
Author contributions
LL: Conceptualization, Data curation, Investigation, Methodology, Writing – original draft, Writing – review & editing, Supervision, Project administration. JT: Conceptualization, Data curation, Investigation, Methodology, Writing – original draft, Writing – review & editing, Supervision, Project administration. WT: Conceptualization, Formal Analysis, Funding acquisition, Investigation, Methodology, Visualization, Writing – review & editing, Writing – original draft.
Funding
The author(s) declare financial support was received for the research, authorship, and/or publication of this article. This work was supported by the Bureau of Land Management, Monarch Joint Venture, National Fish & Wildlife Foundation, U.S. Fish & Wildlife Service, and U.S. Forest Service (grant number 20-CA-11132762-177).
Acknowledgments
We thank the hundreds of community scientists, conservation practitioners, and researchers who volunteered their time to collect data for the Integrated Monarch Monitoring Program, the IMMP Advisory Committee for supporting program implementation, the private landowners for permitting access to their landholdings, and Wendy Caldwell and Misty Boos for their helpful feedback during the writing process. Any use of trade, firm, or product names is for descriptive purposes only and does not imply endorsement by the U.S. Government.
Conflict of interest
The authors declare that the research was conducted in the absence of any commercial or financial relationships that could be construed as a potential conflict of interest.
The reviewer JP declared a past co-authorship with the author WT to the handling editor.
Publisher’s note
All claims expressed in this article are solely those of the authors and do not necessarily represent those of their affiliated organizations, or those of the publisher, the editors and the reviewers. Any product that may be evaluated in this article, or claim that may be made by its manufacturer, is not guaranteed or endorsed by the publisher.
Supplementary material
The Supplementary Material for this article can be found online at: https://www.frontiersin.org/articles/10.3389/fevo.2024.1330583/full#supplementary-material
Footnotes
References
Ammann L., Bosem-Baillod A., Herzog F., Frey D., Entling M. H., Albrecht M. (2024). Spatio-temporal complementarity of floral resources sustains wild bee pollinators in agricultural landscapes. Agric. Ecosyst. Environ. 359, 108754. doi: 10.1016/j.agee.2023.108754
Antonsen A. K., Kral-O’Brien K. C., Hovick T. J., Limb R. F., Geaumont B. A., Harmon J. P. (2021). Intra-annual spatiotemporal dynamics of the monarch butterfly (Lepidoptera: Danaidae), regal fritillary (Lepidoptera: Heliconiinae), and their floral resources in North Dakota, United States. Ann. Entomol. Soc Am. 114, 727–737. doi: 10.1093/aesa/saab013
Bates D., Maechler M., Bolker B., Walker S. (2015). Fitting linear mixed-effects models using lme4. J. Stat. Software 67, 1–48. doi: 10.18637/jss.v067.i01
Baum K. A., Mueller E. K. (2015). “The effects of grassland and roadside management practices on the abundance of milkweed and the implications for monarch butterflies,” in Monarchs in a changing world: biology and conservation of an iconic butterfly. Eds. Oberhauser K. S., Nail K. R., Altizer S. (Cornell University Press, Ithaca, New York), 197–202.
Bhowmik P. C., Bandeen J. D. (1976). The biology of Canadian weeds: 19. Asclepias Syriaca L. Can. J. Plant Sci. 56, 579–589. doi: 10.4141/cjps76-094
Brooks M. E., Kristensen K., van Benthem K. J., Magnusson A., Berg C. W., Nielsen A., et al. (2017). glmmTMB balances speed and flexibility among packages for zero-inflated generalized linear mixed modeling. R J. 9, 378–400. doi: 10.32614/RJ-2017-066
Bruce A. S., Thogmartin W. E., Trosen C., Oberhauser K., Gratton C. (2022). Landscape- and local-level variables affect monarchs in Midwest grasslands. Landsc. Ecol. 37, 93–108. doi: 10.1007/s10980-021-01341-4
Cariveau A. B., Anderson E., Baum K. A., Hopwood J., Lonsdorf E., Nootenboom C., et al. (2019a). Rapid assessment of roadsides as potential habitat for monarchs and other pollinators. Front. Ecol. Evol. 7. doi: 10.3389/fevo.2019.00386
Cariveau A. B., Holt H. L., Ward J. P., Lukens L., Kasten K., Thieme J., et al. (2019b). The Integrated Monarch Monitoring Program: From design to implementation. Front. Ecol. Evol. 7. doi: 10.3389/fevo.2019.00167
Dee J. R., Baum K. A. (2019). Mowing frequency influences number of flowering stems but not population age structure of Asclepias viridis, an important monarch host plant. Am. Midl. Nat. 182, 27–35. doi: 10.1674/0003-0031-182.1.27
Dilts T. E., Black S. H., Hoyle S. M., Jepsen S. J., May E. A., Forister M. L. (2023). Agricultural margins could enhance landscape connectivity for pollinating insects across the Central Valley of California, U.S.A. PloS One 18, e0267263. doi: 10.1371/journal.pone.0267263
Dilts T. E., Steele M. O., Engler J. D., Pelton E. M., Jepsen S. J., McKnight S. J., et al. (2019). Host plants and climate structure habitat associations of the western monarch butterfly. Front. Ecol. Evol. 7. doi: 10.3389/fevo.2019.00188
Dinsmore S. J., Vanausdall R. A., Murphy K. T., Kinkead K. E., Frese P. W. (2019). Patterns of monarch site occupancy and dynamics in iowa. Front. Ecol. Evol. 7. doi: 10.3389/fevo.2019.00169
Flockhart D. T. T., Pichancourt J. B., Norris D. R., Martin T. G. (2015). Unravelling the annual cycle in a migratory animal: breeding-season habitat loss drives population declines of monarch butterflies. J. Anim. Ecol. 84, 155–165. doi: 10.1111/1365-2656.12253
Garfinkel M., Yakandawala K., Hosler S., Roberts M., Whelan C., Minor E. (2023). Testing the accuracy of a Rights-of-Way pollinator habitat scoring system. Ecol. Indic. 148, 110062. doi: 10.1016/j.ecolind.2023.110062
Grant T. J., Fisher K. E., Krishnan N., Mullins A. N., Hellmich R. L., Sappington T. W., et al. (2022). Monarch butterfly ecology, behavior, and vulnerabilities in north central United States agricultural landscapes. BioScience 72, 1176–1203. doi: 10.1093/biosci/biac094
Grant T. J., Flockhart D. T. T., Blader T. R., Hellmich R. L., Pitman G. M., Tyner S., et al. (2020). Estimating arthropod survival probability from field counts: a case study with monarch butterflies. Ecosphere 11, e03082. doi: 10.1002/ecs2.3082
Greenstein L., Steele C., Taylor C. M. (2022). Host plant specificity of the monarch butterfly Danaus plexippus: A systematic review and meta-analysis. PloS One 17, e0269701. doi: 10.1371/journal.pone.0269701
Halstead J. M., Lindsay B. E., Brown C. M. (1991). Use of the tobit model in contingent valuation: Experimental evidence from the Pemigewasset Wilderness Area. J. Environ. Manage. 33, 79–89. doi: 10.1016/S0301-4797(05)80049-0
Hartig F. (2022) DHARMa: Residual Diagnostics for Hierarchical (Multi-Level/Mixed) Regression Models. R package version 0.4.3. Available online at: https://CRAN.R-project.org/package=DHARMa.
Hartzler R. G. (2010). Reduction in common milkweed (Asclepias Syriaca) occurrence in Iowa cropland from 1999 to 2009. Crop Prot. 29, 1542–1544. doi: 10.1016/j.cropro.2010.07.018
Hartzler R. G., Buhler D. D. (2000). Occurrence of common milkweed (Asclepias Syriaca) in cropland and adjacent areas. Crop Prot. 19, 363–366. doi: 10.1016/S0261-2194(00)00024-7
Hemberger J., Gratton C. (2023). Floral resource discontinuity contributes to spatial mismatch between pollinator supply and pollination demand in a pollinator-dependent agricultural landscapes. Landsc. Ecol. 38, 4439–4450. doi: 10.1007/s10980-023-01707-w
Hines H. M., Hendrix S. D. (2005). Bumble bee (Hymenoptera: Apidae) diversity and abundance in tallgrass prairie patches: effects of local and landscape floral resources. Environ. Entomol. 34, 1477–1484. doi: 10.1603/0046-225X-34.6.1477
Johnston M. K., Hasle E. M., Klinger K. R., Lambruschi M. P., Derby Lewis A., Stotz D. F., et al. (2019). Estimating milkweed abundance in metropolitan areas under existing and user-defined scenarios. Front. Ecol. Evol. 7. doi: 10.3389/fevo.2019.00210
Kasten K., Stenoien C., Caldwell W., Oberhauser K. S. (2016). Can roadside habitat lead monarchs on a route to recovery? J. Insect Conserv. 20, 1047–1057. doi: 10.1007/s10841-016-9938-y
Kaul A. D., Wilsey B. J. (2019). Monarch butterfly host plant (milkweed Asclepias spp.) abundance varies by habitat type across 98 prairies. Restor. Ecol. 27, 1274–1281. doi: 10.1111/rec.12993
Kinkead K. E., Harms T. M., Dinsmore S. J., Frese P. W., Murphy K. T. (2019). Design implications for surveys to monitor monarch butterfly population trends. Front. Ecol. Evol. 7. doi: 10.3389/fevo.2019.00195
Knapp S., Kühn I., Mosbrugger V., Klotz S. (2008). Do protected areas in urban and rural landscapes differ in species diversity? Biodivers. Conserv. 17, 1595–1612. doi: 10.1007/s10531–008-9369–5
Koh I., Lonsdorf E. V., Williams N. M., Brittain C., Isaacs R., Gibbs J., et al. (2016). Modeling the status, trends, and impacts of wild bee abundance in the United States. Proc. Natl. Acad. Sci. 113, 140–145. doi: 10.1073/pnas.1517685113
Kral-O’Brien K. C., Hovick T. J., Limb R. F., Harmon J. P., Gillam E. H. (2020). Incorporating field behaviors into monarch surveys to promote informed conservation actions. J. Nat. Conserv. 53, 125761. doi: 10.1016/j.jnc.2019.125761
Kuder L. (2019). Evaluating integrated roadside vegetation management (irvm) techniques to improve pollinator habitat (report no. md-19-sha/um/4-38). Maryland Department of Transportation State Highway Administration.
Lane I. G., Herron-Sweet C. R., Portman Z. M., Cariveau D. P. (2020). Floral resource diversity drives bee community diversity in prairie restorations along an agricultural landscape gradient. J. Appl. Ecol. 57, 2010–2018. doi: 10.1111/1365-2664.13694
Lane I. G., Portman Z. M., Herron-Sweet C. H., Pardee G. L., Cariveau D. P. (2022). Differences in bee community composition between restored and remnant prairies are more strongly linked to forb community differences than landscape differences. J. Appl. Ecol. 59, 129–140. doi: 10.1111/1365-2664.14035
Lebuhn G., Droege S., Connor E. F., Gemmill-Herren B., Potts S. G., Minckley R. L., et al. (2013). Detecting insect pollinator declines on regional and global scales. Conserv. Biol. J. Soc Conserv. Biol. 27, 113–120. doi: 10.1111/j.1523-1739.2012.01962.x
Leeper R. D., Bilotta R., Petersen B., Stiles C. J., Heim R., Fuchs B., et al. (2022). Characterizing U.S. drought over the past 20 years using the U.S. drought monitor. Int. J. Climatol. 42, 6616–6630. doi: 10.1002/joc.7653
Loeb S. C., Rodhouse T. J., Ellison L. E., Lausen C. L., Reichard J. D., Irvine K. M., et al. (2015). A plan for the north american bat monitoring program (NABat). Gen. Tech. Rep. SRS-208 (U.S. Asheville, NC: U.S. Department of Agriculture, Forest Service, Southern Research Station). doi: 10.2737/SRS-GTR-208
Lüdecke D., Ben-Shachar M. S., Patil I., Waggoner P., Makowski D. (2021). performance: An R Package for assessment, comparison and testing of statistical models. J. Open Source Software 6, 3139. doi: 10.21105/joss.03139
Lukens L., Kasten K., Stenoien C., Cariveau A., Caldwell W., Oberhauser K. (2020). Monarch habitat in conservation grasslands. Front. Ecol. Evol. 8. doi: 10.3389/fevo.2020.00013
Lynch L., Kangas M., Ballut N., Doucet A., Schoenecker K., Johnson P., et al. (2021). Changes in land use and land cover along an urban-rural gradient influence floral resource availability. Curr. Landsc. Ecol. Rep. 6, 46–70. doi: 10.1007/s40823-021-00064-1
Mahan C., Ross B., Yahner R. (2020). The effects of integrated vegetation management on richness of native compatible flowering plants and abundance of noncompatible tree species on a right-of-way in central Pennsylvania, USA. Arboriculture Urban Forestry 46, 395–401. doi: 10.48044/jauf.2020.029
Mallinger R. E., Gibbs J., Gratton C. (2016). Diverse landscapes have a higher abundance and species richness of spring wild bees by providing complementary floral resources over bees’ foraging periods. Landsc. Ecol. 31, 1523–1535. doi: 10.1007/s10980-015-0332-z
McKinney M. L. (2008). Effects of urbanization on species richness: A review of plants and animals. Urban Ecosyst. 11, 161–176. doi: 10.1007/s11252-007-0045-4
Monarch Joint Venture (2021). Integrated monarch monitoring program. Version 2.0. Available at: https://monarchjointventure.org/mjvprograms/science/integrated-monarch-monitoring-program.
Nail K. R., Stenoien C., Oberhauser K. S. (2015). Immature monarch survival: effects of site characteristics, density, and time. Ann. Entomol. Soc Am. 108, 680–690. doi: 10.1093/aesa/sav047
Nowak C. A., Ballard B. D. (2005). A framework for applying integrated vegetation management on rights-of-way. J. Arboric. 31, 28–37. doi: 10.48044/jauf.2005.004
Pelton E. M., Schultz C. B., Jepsen S. J., Black S. H., Crone E. E. (2019). Western monarch population plummets: status, probable causes, and recommended conservation actions. Front. Ecol. Evol. 7. doi: 10.3389/fevo.2019.00258
Pleasants J. (2017). Milkweed restoration in the Midwest for monarch butterfly recovery: estimates of milkweeds lost, milkweeds remaining and milkweeds that must be added to increase the monarch population. Insect Conserv. Divers. 10, 42–53. doi: 10.1111/icad.12198
Pleasants J. M., Oberhauser K. S. (2013). Milkweed loss in agricultural fields because of herbicide use: effect on the monarch butterfly population. Insect Conserv. Divers. 6, 135–144. doi: 10.1111/j.1752-4598.2012.00196.x
Pleasants J., Thogmartin W. E., Oberhauser K. S., Taylor O. R., Stenoien C. (2023). A comparison of summer, fall and winter estimates of monarch population size before and after milkweed eradication from crop fields in North America. Insect Conserv. Divers. 17 (1), 51–64. doi: 10.1111/icad.12687
Pleasants J. M., Zalucki M. P., Oberhauser K. S., Brower L. P., Taylor O. R., Thogmartin W. E. (2017). Interpreting surveys to estimate the size of the monarch butterfly population: Pitfalls and prospects. PloS One 12, e0181245. doi: 10.1371/journal.pone.0181245
Pyšek P. (1993). Factors affecting the diversity of flora and vegetation in central European settlements. Vegetatio 106, 89–100. doi: 10.1007/BF00044860
R Core Team (2021). R: A language and environment for statistical computing (Vienna: R Foundation for Statistical Computing).
Rotondi B. A. R., Casanelles-Abella J., Fontana S., Moretti M., Videla M., Fenoglio M. S. (2023). Floral species evenness is the major driver of wild bee communities in urban gardens. Urban Ecosyst. 27, 159–171. doi: 10.1007/s11252-023-01440-x
Russell K. N., Russell G. J., Kaplan K. L., Mian S., Kornbluth S. (2018). Increasing the conservation value of powerline corridors for wild bees through vegetation management: an experimental approach. Biodivers. Conserv. 27, 2541–2565. doi: 10.1007/s10531-018-1552-8
Scott A., Contreras K., Stevenson M., Hudman K. L., Kopachena J. G. (2023). Survival of eggs to third instar of late-summer and fall-breeding monarch butterflies (Danaus plexippus) and queen butterflies (Danaus gilippus) in north Texas. J. Insect Conserv. 27, 233–248. doi: 10.21203/rs.3.rs-1739437/v1
Semmens B. X., Semmens D. J., Thogmartin W. E., Wiederholt R., López-Hoffman L., Diffendorfer J. E., et al. (2016). Quasi-extinction risk and population targets for the Eastern, migratory population of monarch butterflies (Danaus plexippus). Sci. Rep. 6, 23265. doi: 10.1038/srep23265
Smart A. H., Otto C. R. V., Gallant A. L., Simanonok M. P. (2021). Landscape characterization of floral resources for pollinators in the Prairie Pothole Region of the United States. Biodivers. Conserv. 30, 1991–2015. doi: 10.1007/s10531-021-02177-9
Spaeth K. E. Jr., Barbour P. J., Moranz R., Dinsmore S. J., Williams C. J. (2022). Asclepias dynamics on US rangelands: implications for conservation of monarch butterflies and other insects. Ecosphere 13, e03816. doi: 10.1002/ecs2.3816
Svancara L. K., Abatzoglou J. T., Waterbury B. (2019). Modeling current and future potential distributions of milkweeds and the monarch butterfly in Idaho. Front. Ecol. Evol. 7. doi: 10.3389/fevo.2019.00168
Thogmartin W. E., López-Hoffman L., Rohweder J., Diffendorfer J., Drum R., Semmens D., et al. (2017). Restoring monarch butterfly habitat in the Midwestern US: A’ll hands on deck.’ Environ. Res. Lett. 12, 074005. doi: 10.1088/1748-9326/aa7637
Tracy J. L., Kantola T., Baum K. A., Coulson R. N. (2019). Modeling fall migration pathways and spatially identifying potential migratory hazards for the eastern monarch butterfly. Landsc. Ecol. 34, 443–458. doi: 10.1007/s10980-019-00776-0
United States Department of Agriculture (USDA), Natural Resources Conservation Science (NRCS) (2022). The PLANTS database (Greensboro, NC: National Plant Data Team). Available at: http://plants.usda.gov.
Waterbury B., Potter A., Svancara L. K. (2019). Monarch butterfly distribution and breeding ecology in Idaho and Washington. Front. Ecol. Evol. 7. doi: 10.3389/fevo.2019.00172
Weiser E. L., Diffendorfer J. E., Grundel R., López-Hoffman L., Pecoraro S., Semmens D., et al. (2019a). Balancing sampling intensity against spatial coverage for a community science monitoring programme. J. Appl. Ecol. 56, 2252–2263. doi: 10.1111/1365-2664.13491
Weiser E. L., Diffendorfer J. E., Lopez-Hoffman L., Semmens D. J., Thogmartin W. E. (2019b). Consequences of ignoring spatial variation in population trend when conducting a power analysis. Ecography 42, 836–844. doi: 10.1111/ecog.04093
Weiser E. L., Diffendorfer J. E., Lopez-Hoffman L., Semmens D., Thogmartin W. E. (2020). Challenges for leveraging citizen science to support statistically robust monitoring programs. Biol. Conserv. 242, 108411. doi: 10.1016/j.biocon.2020.108411
Weiser E. L., Thogmartin W. E. (2018). Priority sampling locations in the U.S., Canada, and Mexico for the Integrated Monarch Monitoring Program. U.S. Geological Survey data release. doi: 10.5066/P9EMA1YI
Williams N., Minckley R., Silveira F. (2001). Variation in native bee faunas and its implications for detecting community changes. Conserv. Ecol. 5 (1), 7. doi: 10.5751/ES-00259-050107
Williams N. M., Regetz J., Kremen C. (2012). Landscape-scale resources promote colony growth but not reproductive performance of bumble bees. Ecology 93, 1049–1058. doi: 10.1890/11-1006.1
Woodard S. H., Federman S., James R. R., Danforth B. N., Griswold T. L., Inouye D., et al. (2020). Towards a U.S. national program for monitoring native bees. Biol. Conserv. 252, 108821. doi: 10.1016/j.biocon.2020.108821
Yahner R. H., Hutnik R. J. (2004). Integrated vegetation management on an electric transmission right-of-way in southeastern Pennsylvania, U.S. J. Arboric. 31, 263–268. doi: 10.48044/jauf.2004.036
Zaya D. N., Pearse I. S., Spyreas G. (2017). Long-term trends in midwestern milkweed abundances and their relevance to monarch butterfly declines. BioScience 67, 343–356. doi: 10.1093/biosci/biw186
Zylstra E. R., Neupane N., Zipkin E. F. (2022). Multi-season climate projections forecast declines in migratory monarch butterflies. Glob. Change Biol. 28, 6135–6151. doi: 10.1111/gcb.16349
Keywords: monarch butterfly, milkweed, Asclepias, floral resources, habitat assessment, monitoring, community science, pollinator
Citation: Lukens L, Thieme J and Thogmartin WE (2024) Milkweed and floral resource availability for monarch butterflies (Danaus plexippus) in the United States. Front. Ecol. Evol. 12:1330583. doi: 10.3389/fevo.2024.1330583
Received: 31 October 2023; Accepted: 08 May 2024;
Published: 24 May 2024.
Edited by:
Milton de Souza Mendonça, Federal University of Rio Grande do Sul, BrazilReviewed by:
Elizabeth G Pringle, University of Nevada, United StatesJohn Pleasants, Iowa State University, United States
Copyright © 2024 Lukens, Thieme and Thogmartin. This is an open-access article distributed under the terms of the Creative Commons Attribution License (CC BY). The use, distribution or reproduction in other forums is permitted, provided the original author(s) and the copyright owner(s) are credited and that the original publication in this journal is cited, in accordance with accepted academic practice. No use, distribution or reproduction is permitted which does not comply with these terms.
*Correspondence: Laura Lukens, llukens@colostate.edu; Jennifer Thieme, jthieme@monarchjointventure.org
†These authors have contributed equally to this work share first authorship