Over the hills and far away: phylogeography and demographic migration history of a dispersal-restricted primrose (Primula vulgaris)
 Ludwig Triest
 Fabienne Van Rossum
 Gábor Sramkó
 Tim Sierens
 Polina Volkova
- 1Systems Ecology and Resource Management Research Unit (SERM), Department of Organism Biology (DBO), Faculty of Sciences, Université Libre de Bruxelles (ULB), Brussels, Belgium
- 2Biology Department, Vrije Universiteit Brussel (VUB), Brussels, Belgium
- 3Meise Botanic Garden, Meise, Belgium
- 4Service général de l’Enseignement supérieur et de la Recherche scientifique, Fédération Wallonie-Bruxelles, Brussels, Belgium
- 5Department of Botany, University of Debrecen, Debrecen, Hungary
- 6HUN-REN-UD Conservation Biology Research Group, Debrecen, Hungary
- 7Papanin Institute for Biology of Inland Waters, Russian Academy of Sciences (RAS), Borok, Russia
Introduction: Quaternary glaciations, in particular the last glacial maximum (LGM), have shaped the contemporary distribution of many species. In Europe, survival of temperate species during range contractions was mainly associated with refugia in Mediterranean peninsulas, allowing south to north recolonization. Additionally, the Ponto-Caspian refugium provided an east to west migration route.
Methods: Here, we investigated genetic diversity and structure of the dispersal-restricted Primula vulgaris Huds., a temperate herb of supposed Caucasian origin, using 12 highly polymorphic nuclear microsatellite loci to trace the colonization of this species in three European regions. We studied 38 populations, namely an eastern mountainous region (Caucasus), a central region (Carpathian Mountains and Dinaric Alps) and a western lowland region (North European Plain). The role of an eastern refugium of the species was tested by performing Approximate Bayesian computation analyses to elucidate its demographic and phylogeographic history, detecting bottleneck and expansion events, and estimating effective (ancestral and current) population sizes and time of divergence.
Results and discussion: We found the eastern and central regions featuring the highest allelic richness and genetic differentiation being strong between and within regions. Stepwise-like mutation processes (RST > FST), together with isolation-by-distance patterns, contributed to genetic differentiation. Demographic event models showed that P. vulgaris experienced bottlenecks as well as expansions across its range during the Quaternary glacial cycles, with the last expansion about 6,000, 4,000, and 2,000 generations ago for eastern, central, and western populations, respectively. The best supported origin model pointed to the Caucasus population being closest to an ancestral situation, and from where central and western populations diverged subsequently. Divergence time of the Caucasus populations from an ancestral lineage referred to the Upper Pleistocene (Middle Weichselian). Divergence of Carpathian populations, including a Lower Danube valley corridor, was estimated during and across the LGM (Late Weichselian), confirming central populations as potential secondary cryptic refugium. Western populations recently diverged during the Holocene, most probably in the Atlanticum phase (7,000–3,900 years ago). Within regions, genetic structure was also shaped by latitude, longitude, or altitudinal migration, and for western lowlands, by recent bottleneck and genetic drift processes.
Introduction
During the cold periods of Quaternary climatic fluctuations (800,000–11,700 years before present, BP), many temperate species repeatedly underwent severe range shifts. At their contracting stage, survival was associated with climatically more favourable regions, so-called glacial refugia, from which subsequent range expansions took place, thereby altering species distribution range (Hewitt, 1999; Hewitt, 2000). In Europe, survival of temperate species during range contractions was mainly associated with refugia in the Mediterranean peninsulas (i.e., Iberian, Italian, and Balkan Peninsulas), allowing south-to-north post-glacial migration routes (Petit et al., 2003; Hewitt, 2004). Although these peninsulas played an important role, the Ponto-Caspian refugium region may have provided an additional, east-to-west recolonization route (Triantafyllidis et al, 2002; Culling et al., 2006; Grimm and Denk, 2014; Bartha et al., 2015; Volkova et al., 2016). Palaeobotanical and genetic data indicated that forest trees such as beech survived the last glacial period in multiple, separate, central European and Mediterranean refuge areas (Magri et al., 2006). Past climatic events have contributed to shape current genetic structure of plant species across their distribution range, reflecting their lineages of origin (Svenning and Skov, 2007).
Another factor strongly influencing genetic structure is the dispersal capacities of the species (Levin et al., 2003). Plants with a great dispersal potential, such as wind-pollinated or wind- and bird-seed dispersed species, usually have poorly genetically differentiated populations across distribution area because of ample spread and subsequent contacts between populations (Cheddadi et al., 2006). Species with restricted dispersal capacity need more time, thus, also more generations, to cover remote distances during their stepwise migration that incurs more founder events. Therefore, well-differentiated populations, and even evolutionary significant units across a large geographic regions, can be expected (Cain et al., 1998; Pearson, 2006; Strong, 2023; Willner et al., 2023). Short-distance insect pollination in combination with short-distance seed dispersal allows founders to move and gene flow to occur only over small areas at a time or a single generation (Feurdean et al., 2013). As a consequence of limited dispersal distances, many forest species, in particular understory herbs but also some trees such as Alnus and Acer species, may have featured cryptic northward refugia (e.g., western and eastern Carpathian microrefugia) during the last glacial maximum (LGM, 24,000–18,000 years BP; Mix et al., 2001) for the initiation of their recolonization, rather than being directly associated with remote refugia in Mediterranean peninsulas (Kramp et al., 2009; Douda et al., 2014; Mitka et al., 2014; Wahlsteen et al., 2023; Willner et al., 2023).
Evolutionary history of the dispersal-restricted plant genus Primula L. has been well studied (Hu, 1994; Mast et al., 2001; Schmidt-Lebuhn et al., 2012; Yan et al., 2015; Rose et al., 2018; Larson et al., 2023). For some European Primula species, the Ponto-Caspian region, more precisely the Caucasus Mountains, was shown to be the ancestral territory (Stubbs et al., 2023). Those species display high diversity in their chloroplast haplotypes (Schmidt-Lebuhn et al., 2012), with pronounced phylogeographic structure and genetic lineages referring to multiple refugia (Volkova et al., 2020). The phylogeography of Primula species was particularly studied on the Eurasian continent, often in a context of scattered occurrence across a complex topography of mountain ridges and valleys (Khan et al., 2021; Stubbs et al., 2023). The effect of Quaternary climatic oscillations, in particular of the last glacial maximum (LGM) on Primula species demography and contemporary distribution were shown to vary across Asia and Europe. For instance, an early genetic divergence during Pleistocene climatic oscillations was hypothesized for Primula ovalifolia Franch. (Xie et al., 2012). The expansion of Primula obconica Hance during cold periods of the Pleistocene was shown to have enhanced genetic differentiation in a heterogenic environment of a complex topography in subtropical China (Yan et al., 2012).
A typical methodological approach in mountainous regions, especially for species spanning an entire elevation range, usually includes the comparison of foothill populations with those at higher elevations. For instance, in Primula elatior (L.) Hill the highest genetic differentiation was found between high-altitude populations of distinct valleys, whereas populations at different altitudes within a valley did not show a loss of genetic diversity as measured by nuclear microsatellites (Konecna et al., 2019). Such a scenario of lineages with a putative origin at foothills for P. elatior suggests secondary ‘cryptic’ glacial refugia in mountain areas or in northern regions (Jurickova et al., 2018; Kempf et al., 2020), though also cases of historic introgressive hybrid situations (e.g., Primula pedemontana E. Thomas ex Gaudin introgressed into Primula hirsuta All.) were identified in the Alp mountains (Voisin et al., 2023).
Complex evolutionary historical scenarios can be discerned by effective analytical approaches like the use of Species Distribution Models (SDM) and Approximate Bayesian Computation (ABC), preferably in combination (Migliore et al., 2018). ABC is a computational method rooted in Bayesian statistics that can be used with genetic data to estimate the posterior distributions of model parameters, by making assumptions and approximations, namely in the model selection, choice of prior distribution and parameter ranges (Beaumont, 2010). A combination of methods (SDM, molecular-based classical phylogeography using RADseq and ABC analyses) showed that distinct lineages of Primula tibetica G. Watt diverged during or across the Quaternary glacial cycles, and subsequently underwent both expansions and bottlenecks (Ren et al., 2017). Likewise, ABC analyses of nuclear microsatellites additionally supported latitudinal migration with a unidirectional secondary contact from Primula hidakana Miyabe & Kudô to Primula takedana Tatew., whereas paleodistribution modeling and genetic data merely supported their divergence (Yamamoto et al., 2020). Phylogeographic analyses based on co-dominant markers and ABC have thus proved to be very effective in untangling complex evolutionary histories.
A phylogeographic analysis of the European mesophilous Primula vulgaris Huds., considering the entire distribution range, pointed at a southeastern Ponto-Caspian refugium, namely the Colchis region, which contained the earliest branching lineages of nuclear (nrITS) ribotypes and plastid (trnL–trnF and rpl32–trnL) haplotypes (Volkova et al., 2020). The presence of an ancestral ribotype restricted to Carpathian and Caucasus regions allowed to hypothesize that P. vulgaris initially spread from a Colchis refugium towards southeastern and central Europe, where founders could survive in cryptic refugia during the last glacial period. The Carpathian basin could thus serve as a secondary centre of diversity, from which subsequently all further populations in Western Europe originated (Volkova et al., 2020). Together with corroborating genomic results (Stubbs et al., 2023), the Eastern refugium in the Colchis region for P. vulgaris was shown to be more important than potential refugia of the Mediterranean peninsulas, which makes P. vulgaris an appropriate dispersal-restricted species for testing ‘slow’ latitudinal migration history from eastern to western regions. The species features a short-distance (entomophilous) pollination as well as a very limited seed dispersal potential by myrmecochory (Valverde and Silvertown, 1995), and therefore experiences limited gene flow at different geographical scales even between western European lowland populations (Van Rossum and Triest, 2003; Van Rossum et al., 2004; Van Geert et al., 2010). However, a case-study on Caucasus P. vulgaris populations of different valleys and elevations using AFLP fingerprinting only revealed low levels of genetic differentiation though with an expressed isolation-by-distance pattern (Volkova et al., 2021), showing the importance of old and recent historical processes on the current genetic structure. Volkova et al. (2020) demonstrated eastern to western genetic divergence among P. vulgaris populations across the Caucasus.
In the present study, populations of P. vulgaris along a pre-defined longitudinal gradient are considered, from three well-represented regions: (1) a mountainous region of the ancestral origin in eastern Europe (i.e., the Caucasus Mountains), (2) a region with a potential cryptic refugium in central Europe (i.e., the Carpathians and the adjacent Dinaric Alps), and (3) a lowland region in Western Europe, with the overall aim to elucidate their demographic and phylogeographic history using nuclear microsatellites as a co-dominant molecular marker system. The availability of highly polymorphic microsatellite markers for P. vulgaris (Van Geert et al., 2006; Triest et al., 2015) allows for profound genetic analyses based on allele frequencies as well as on differences in allele size, so that a phylogeographic signal based on stepwise mutation processes can be detected (Hardy et al., 2003). In particular, we will (1) estimate genetic diversity and differentiation of P. vulgaris among the three regions and among populations within regions to identify genetically differentiated lineages; and (2) detect bottleneck and expansion events and estimate effective (ancestral and current) population sizes, time of divergence between various lineages and the number of generations since lineage divergence. In particular, we will use ABC demography and origin models to test the hypothesis for (1) an east-to-west migration route, (2) the Caucasus region as indicative region of origin, and (3) secondary refugia in central Europe. The approach should allow to explain current patterns of diversity, potentially reflecting migration patterns along latitudinal, longitudinal or altitudinal gradients.
Materials and methods
Study species
Primula vulgaris Huds. (Primulaceae) is a diploid, long-lived perennial rosette-forming herbaceous species showing an Atlantic-(Sub)Mediterranean distribution from the British Isles and Algeria to the Caucasus (Meusel et al., 1978). It is largely distributed in Atlantic Europe, from sea level to mountainous regions up to 2,500 m above sea level (a.s.l.), where it usually occurs in deciduous forest habitats and alpine meadows (Hegi, 1975; Jacquemyn et al., 2009). The species has a self-incompatible breeding system characterized by heterostyly, and so can be considered as an obligate outcrosser (Richards, 1997). Flowers open in early spring and are insect-pollinated, mainly by Hymenoptera, in particular bumblebee queens (Jacquemyn et al., 2009; Van Geert et al., 2010). Pollen dispersal shows a typical leptokurtic shape, with most dispersal events occurring at less than 90 m, and some long-distance events up to 1,100 m (Van Geert et al., 2010, Van Geert et al., 2014). Seeds are dispersed by ants (myrmecochory), and also by small rodents, usually up to a few meters distance (Valverde and Silvertown, 1995; Campagne et al., 2009). The seed bank in the soil is only transient. Plants can live for several decades, and clonally propagate on short distances by rhizomes still attached to the mother plant. The mean age of first flowering is 20 months and seeds ripen 8–10 weeks after fertilization. Seed dispersal happens in early summer, and germination in autumn of the same year or in next spring (Jacquemyn et al., 2009). Therefore, generation time between germination and setting seeds for a plant is about 1.5 to 2 years. Plants older than 2 years can flower and set seeds yearly, thereby giving a series of cumulative overlapping generations during nearly the full life-time period of each individual.
Study area and sample collection
Data were collected from 846 individual samples in 38 European populations along a longitudinal gradient: 13 populations (374 individuals) were located in the western lowland region (northern France, Belgium and The Netherlands), 13 populations (238 individuals) in the central region (West and East Carpathian in Slovakia, Ukraine and Romania; Dinaric Alps in Slovenia, its foothills in Hungary and Croatia), and 12 populations (234 individuals) in the eastern region (Caucasus area) along the Black sea coast (Figure 1; Table 1). The eastern populations were located in distinct valleys assigned to northern (Tuapse), central (Sochi) and southern (Gagra) areas (Figure 1B). The central European populations were located along an eastern (i.e., Carpathian) and western (i.e., Dinaric Alps and the Alps) mountainous area (Volkova et al., 2020). Ro-E4 population was located in the narrow Lower Danube gorge defiled across the Carpathian Mountains, potentially a historical corridor for dispersal of eastern or southeastern taxa (Magyari et al., 2010). The sampled populations represented various natural forest environments and alpine meadows, and also fragmented ‘left-over’ habitats. Indeed, in the western region, the species has been declining and its distribution is fragmented in an intensively used agricultural landscape. Four western populations were situated in forest habitats and nine populations in remnant forest edges alongside pastures or arable land (Van Rossum and Triest, 2003; Van Geert et al., 2015). Maximum geographic distance (Euclidean) between populations was 2,966 km between regions and 393 km, 738 km and 170 km within western, central and eastern regions, respectively. Altitude ranged from sea level to 1,100 m a.s.l. Altitude differences were minor in the western region, though with several forested habitats situated at 12–24 m a.s.l., whereas ‘polder’ agriculture areas were just above sea level (3–4 m). In the central European region, altitudes ranged from 156–533 m a.s.l. and in the eastern European populations from 5–550 m, 200–720 m, and 35–1,050 m a.s.l., depending on the valley (Table 1).
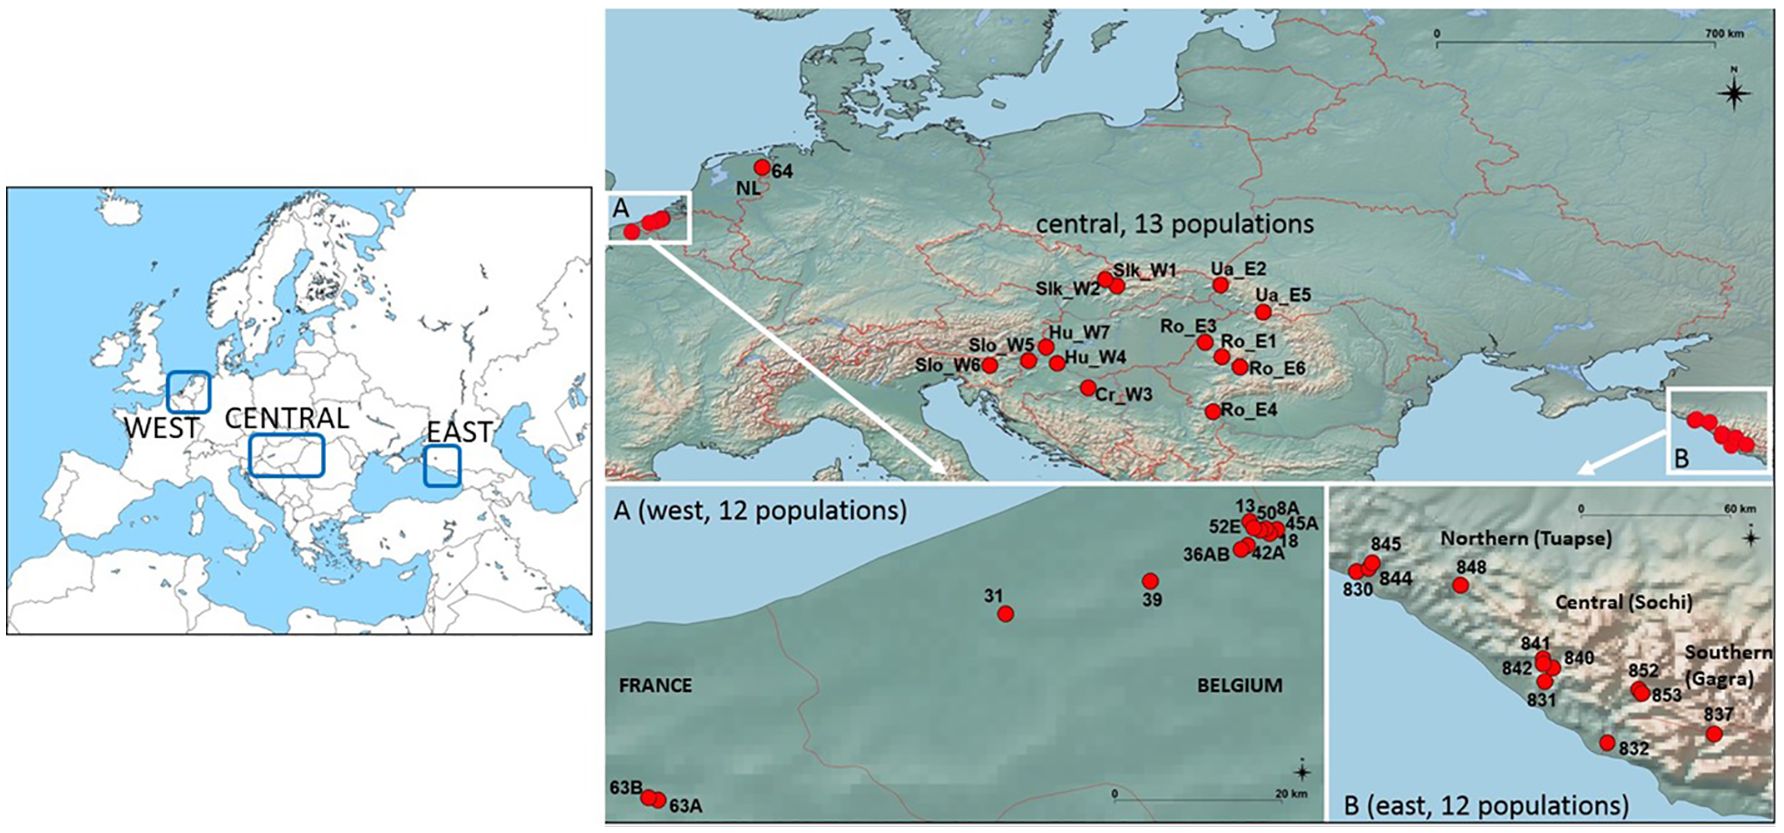
Figure 1 Map of Primula vulgaris populations from three European regions: west (A: detailed map of 12 western lowland populations); central (13 populations of the Carpathian Basin); east (B: detailed map of 12 Caucasus Mts. populations).
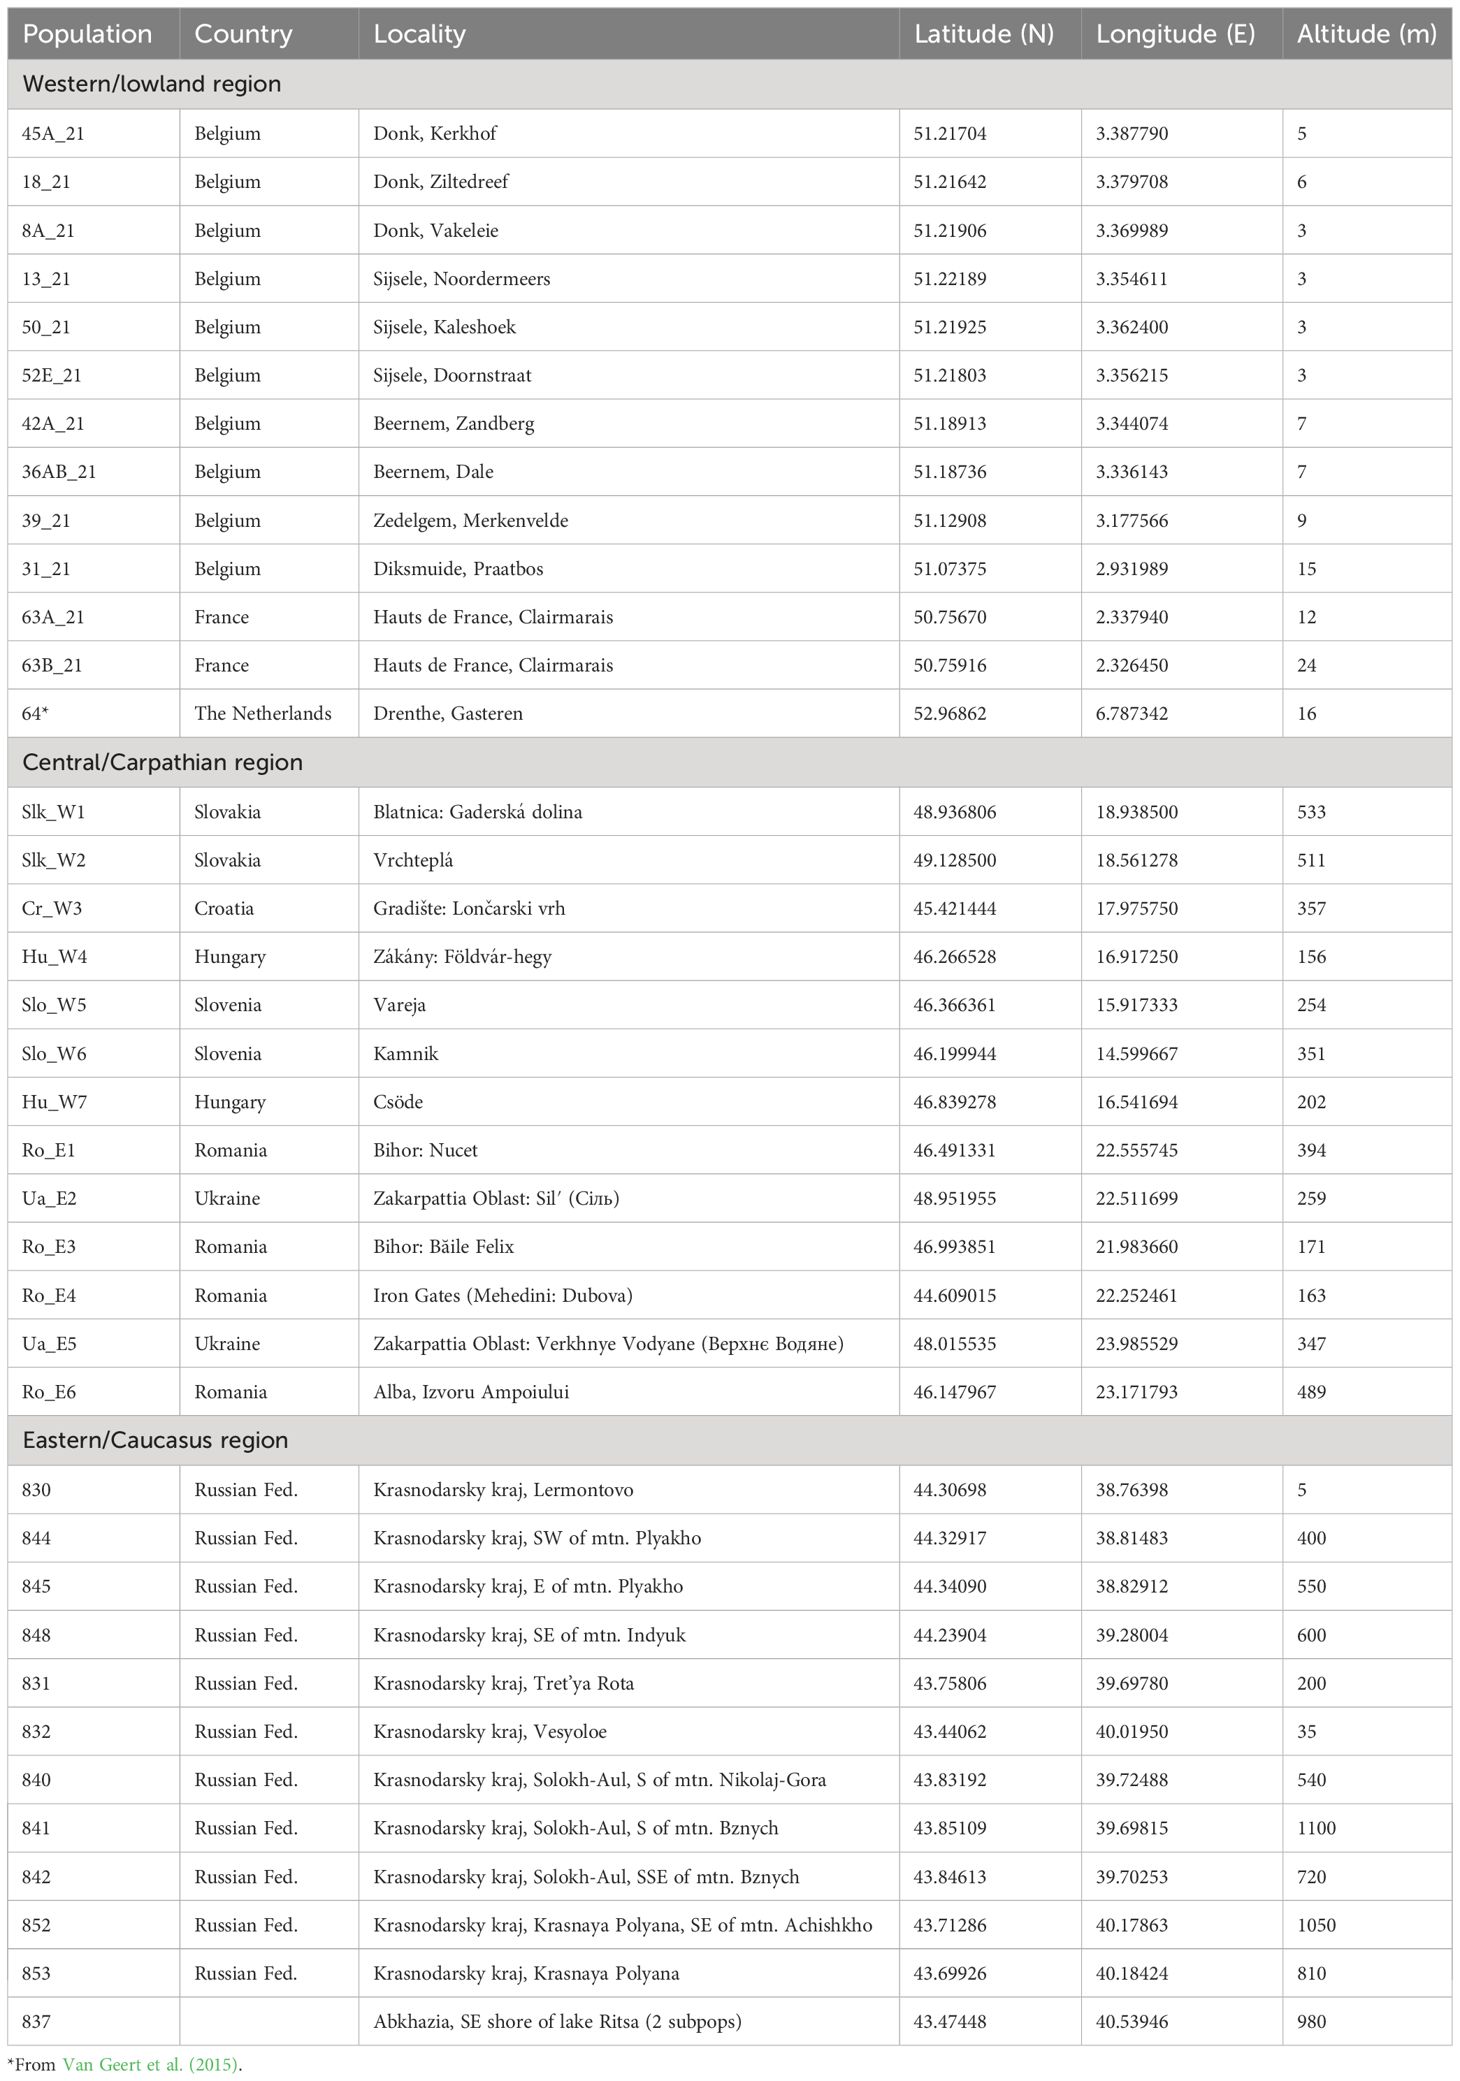
Table 1 Location details of the 38 Primula vulgaris populations in three European regions.
DNA extraction and microsatellite primers
Genomic DNA was extracted from approximately 20 mg of dried leaf tissue using the E.Z.N.A. SP plant DNA Mini kit (Omega bio-tek, Norcross, GA, USA). Multiplexed polymerase chain reactions (PCR), consisting of 15 microsatellite markers (Van Geert et al., 2006; Triest et al., 2015) were conducted, of which 12 showing polymorphism were retained (PRIV4, PRIV7, PRIVB13, PRIVB15, PRIVB17, PRIVB19, PRIV27, PRIVB29, PRIVB34, PRIVB35, PRIVB36, and PRIVB39). The three remaining markers (PRIV6, PRIV21 and PRIV26) showed no amplification for some central populations and for all eastern populations; hence, these three loci were excluded from further analysis.
Primers were fluorescence-labelled with four different dye-labels (6FAM, VIC, NED, and PET). DNA concentration was 20–50 µg/ml. A primer mix was made by mixing 0.2 µM of each primer together. Multiplex PCRs consisted of 6.25 µl master mix (Qiagen Multiplex PCR kit), 1.25 µl primer mix, 2.5 µl H2O and 2.5 µl of genomic DNA. PCR was performed in a thermal cycler (Bio-Rad MyCycler, Hercules, California, USA) with the following conditions: an initial denaturation of 95°C for 15 minutes (as indicated in protocol of Qiagen multiplex PCR kit manual) followed by 35 cycles of: 30 seconds denaturation at 95°C, 90 seconds annealing at 57°C and 80 seconds elongation at 72°C, followed by a final extension of 30 minutes at 60°C. PCR products were separated on an ABI3730XL sequencer (Applied Biosystems (Waltham, Massachusetts, USA), runs were carried out by Macrogen (Seoul, Korea), and allele sizes were determined with GeneMarker v.2.60 (SoftGenetics LLC, State College, USA).
Genetic diversity and structure analyses
Prior to population genetic data analyses we tested for genotypic disequilibrium, presence of potential null alleles and overall resolution of the 12 microsatellite markers. A linkage test between all pairs of loci (1,000 permutations) using FSTAT v.2.9.3 (Goudet, 2001), considering all 38 populations, gave no genotypic disequilibrium at the p<0.05 significance level. The probability of identity (PI), namely whether two individuals could share an identical multilocus genotype by chance, estimated using GenAlEx v.6.5 (Peakall and Smouse, 2012), gave a cumulative probability of identity for all polymorphic loci in each of the 38 populations ranging from 1.1×10⁻¹³ to 4×10⁻³, thereby providing ample resolution. Detection of null alleles and estimation of their frequency per locus for adjustment of population differentiation (pairwise FST values) was done using FreeNA (Chapuis and Estoup, 2007). INEST 2.2 was used to adjust the FIS values for potential null alleles. The neutrality of the microsatellite markers was checked with the Ewans-Watterson test of selective neutrality using ARLEQUIN v.3.5.2.2 (Excoffier et al., 2005).
The following basic population genetic variables were calculated separately for each population and region using FSTAT and GenAlEx: total number of alleles (AT), mean number of alleles (AM), effective number of alleles (AE), allelic richness (AR) for a fixed sample size k = 14, observed heterozygosity (HO), unbiased expected heterozygosity (uHE), and inbreeding coefficient (FIS) with 1,000 randomization tests over all loci to test for deviation from Hardy-Weinberg expectations. Additional analysis of populations pooled into three regions was done for detection of private alleles and their mean frequency (^q) in western, central and eastern populations. Analysis of each region separately allowed to estimate the abovementioned genetic diversity variables (AT, AM, AE, AR, HO, uHE, and FIS) and population assignment test (leave-one-out option in GenAlex) at region level.
Global (overall) genetic structure among populations (FST), inbreeding within populations (FIS), overall inbreeding (FIT) as well as a pairwise genotypic differentiation (between-population FST values) matrix were calculated for each region and for the total area via AMOVA-FST at 999 random permutations using GenAlEx. Principal Coordinates Analysis (PCoA) based on genetic distances was performed for the total (at individual level) and for each region separately (at population level), using GenAlEx. A comparison of the three regions (two-sided test, 1,000 permutations) and pairwise comparisons to test for differences between each region (one-sided test, 1,000 permutations) were performed for AR, HO, HS (expected heterozygosity of subpopulations), FIS, and FST values using FSTAT.
To identify the relative contributions of altitude and geographic location (longitude, latitude) on genetic differentiation patterns within each region, we performed variation partitioning in redundancy analysis (RDA) in R (R Core Team, 2023) using the varpart function in vegan R package v.2.6-4 (Oksanen et al., 2022). For the genetic datasets, we used the previously calculated PCoA components which showed positive eigenvalues (i.e. 11, 12 and 11 PcoA axes for western, central and eastern regions, respectively). The geographic distance matrices were transformed into principal coordinates of neighbourhood matrix (PCNM) components using pcnm function in vegan (Borcard and Legendre, 2002; Borcard et al., 2011). The PCNM components showing positive eigenvalues (i.e. 3, 8 and 7 for western, central and eastern regions, respectively) were kept for the RDA analyses. The variation partitioning results were visualized by Venn’s diagrams in vegan.
A K-means clustering analysis at individual level for the 38 P. vulgaris populations as a whole and separately for western, central and eastern region was carried out in STRUCTURE version 2.3.4 (Pritchard et al., 2000), using an admixture model with correlated allele frequencies. The model ran 10 iterations for each K value from 1 to 15, the latter exceeding the number of populations (12–13) within each region; the burn-in period was 50,000 with 500,000 Markov chain Monte Carlo (MCMC) repeats. Analyses were computed after downloading the data on Galaxy web platform, using the public server at UseGalaxy.be (The Galaxy Community, 2022). The optimal K clusters was inferred with the ΔK and LnP(K) statistics (Evanno et al., 2005) using Structure Harvester (Earl and vonHoldt, 2012) and with the MedK estimator (Puechmaille, 2016) using StructureSelector (Li and Liu, 2018). In addition, barplots were built for each K using CLUMPAK option in StructureSelector, and the highest values for the ‘divisions of run by mode’ provided by CLUMPAK was considered together with visual inspection of gene pools and Q values of assignments, as suggested by Stankiewicz et al. (2022).
Phylogeographic signal and isolation by distance
To test for a phylogeographic signal (long-term isolation and accumulation of stepwise mutations contributing to genetic differentiation) among populations within and between regions, we calculated genetic differentiation statistics based on allele identity in state (FST) and on microsatellite allele size (RST) and performed an allele size permutation test (1,000 permutations randomly reassigning allele sizes among allelic states) in SPAGeDi v.1.5d (Hardy and Vekemans, 2002). For FST, the mutation model (infinite-allele model, K-allele model) assumes that mutation occurs at random, towards one of possible K allelic states, so that genetic differentiation results from a balance between drift and gene flow; its calculation is based on allelic frequencies, only considering allele identity in state. For RST, the stepwise mutation model assumes that allele size just changed by one unit, so that distinct alleles will be more related between nearby populations than between distant populations, informing on the time of divergence; RST calculation takes allele size differences into account, giving insights on mutation contribution to genetic divergence among populations (Hardy et al., 2003, and references cited therein). A phylogeographic signal could be assumed when RST > FST, with significance of the allele size permutation test (Hardy et al., 2003). Significance of FST and RST values was tested by 1,000 permutation tests of individuals among populations (Hardy and Vekemans, 2002). To test for isolation by distance (IBD) between populations, a piecewise linear regression analysis was performed, between pairwise FST/(1- FST) or RST/(1- RST) and pairwise geographic distances (ln-transformed over the longest distances) using SPAGeDi (significance of the b-slope tested by one-sided 1,000 permutation tests). To define the number of spatial distance classes to obtain a similar number of pairwise comparisons of populations in each class, ten spatial distance classes were first defined, and an ANOVA approach (1-sided test, 1,000 randomizations) was used for testing pairwise FST or RST over the full geographical range (Hardy and Vekemans, 2002). Based on the ANOVA outcomes, we finally retained five distance classes (10, 50, 100, 250, and 500 km) for analyses at regional level, adding a full range class (2,966 km) for analyses at European level, thereby allowing to test for a phylogeographic signal specifically within each distance class.
Approximate Bayesian computation analyses
The demographic history of genetic divergence between populations of western, central and eastern regions was investigated using the Approximate Bayesian computation (ABC) approach implemented in DIYABC Random Forest v.1.0 (Collin et al., 2021). This software combines the simulation under custom evolutionary scenarios of microsatellite data with Random Forest treatments and a training set. The latter treatment gives a classification vote for each scenario and allows for posterior distribution and parameter estimations of the best supported scenario. It provides estimations of the posterior mean, variance, median (i.e., 50% quantile) as well as 5% and 95% quantiles (and hence 90% credibility interval) of each parameter of interest. We narrowed down the ABC scenario, by testing (1) with subsequent demographic models at species level for a European pooled population (ABC1) in order to determine the overall demographic history of the species; and then (2) with origin models to test for phylogeographic hypotheses by using three groups (allowing seven scenarios of potential origin), this at European level (ABC2a) and region level (ABC2b), within each of the three considered regions (ABC3 to ABC5) and between regions (ABC6 and ABC7) (Supplementary Figure 1: information on ABC).
At first, we tested demographic event models (ABC1 = demographic model) in order to identify the main demographic process of the species in Europe and of the species within each region separately. Four scenarios were considered: (1) constant population size, (2) population decline, (3) population expansion, and (4) population bottleneck followed by an expansion, hereafter simply referred to as ‘population bottleneck’. We used all 38 populations considered as three regions to conduct these conceptualized scenarios of demographic history. Summary statistics of 12 variables, including five noise variables as default, were considered. For ABC1 model, we used a training set of 40,000 runs and broad time priors t1 (10–25,000 generations following a demographic event), db (10–50,000 generations as demographic bottleneck) and effective size priors on Ne (historical population) and N1 (current population) (10–100,000), though restricted sizes for the bottleneck population Ne1 (10–10,000). The best supported ABC1 scenario (bottleneck; see results section) was then used for construction of the various origin models to be tested.
Second, analyses of origin models across three European regions (ABC2), comprising seven origin scenarios (ABC2a) and subsequently all seven bottleneck scenarios (ABC2b based on the outcome of ABC2a), which considered either one bottlenecked region or a combination of two or three bottlenecked regions (Supplementary Figure 1: information on ABC2). They were carried out with the aim to unravel the phylogenetic outcome (RST phylogeographic signal) and the K clustering of gene pools (from STRUCTURE analysis), namely about (1) an ancestral origin of the eastern populations from the Caucasus region (‘out of Colchis’ hypothesis); (2) the origin and age of central (East and West Carpathian/Dinaric Alp) populations; and (3) the putative recent origin of western lowland populations. For the seven ABC2 scenarios of bottlenecked western, central, and eastern regions, we used a training set of 70,000 runs and broad time priors t1 (10–25,000 generations), t2 (10–50,000 generations) and time of divergence td (10–100,000 generations) of the ancestral population [stipulating t1<t2 and t2<td], bottleneck periods db1 (10–25,000 generations), db2 (10–50,000 generations), and db3 (10–100,000 generations) [stipulating db1<t1, db2<t2, and db3<td], and effective size priors on the ancestral population NeA (10–100,000) and current populations Ne1, Ne2, and Ne3 (10–50,000, 10–100,000 and 10–100,000, respectively) though smaller effective size priors on bottlenecked populations Ne1b, Ne2b and Ne3b (10–10,000).
Finally, to answer main phylogeographic questions within a region or between two regions, analyses of a series of origin models were performed, each considering all possible seven scenarios: (1) an expansion scenario with simultaneous divergence of groups (scenario 1); and (2) a phylogeographic scenario, with successive divergence of the groups (scenarios 2 to 7, depending on the order of group divergence) (Supplementary Figure 1: information on ABC3–ABC7). For each origin model considering three geographical areas within a region, i.e. within the Caucasus region (ABC3 = northern/Tuapse, central/Sochi and southern/Gagra areas), within the central region (ABC4 = Transylvanian Carpathian corridor, western Carpathian basin corridor and the ‘Lower Danube corridor’, the latter represented by population Ro-4), and within western lowlands (ABC5 = northern France, Belgium and The Netherlands), we used a training set of 70,000 runs and time priors t1 (10–25,000) and td (10–100,000), and effective size priors on the ancestral population NeA (10–50,000) and current populations Ne1, Ne2, and Ne3 (10–10,000, 10–50,000 and 10–100,000, respectively). Similar priors were used to estimate whether the ‘corridor’ Carpathian population along the Lower Danube (Ro-E4 population) could represent either a remnant origin from southeastern populations (Caucasus) or from the main Carpathian region itself (ABC6). Similar priors were used to estimate the origin and divergence time of western lowland populations with regard to either Carpathian (i.e., the eastern corridor) or Dinaric Alps (i.e., the western corridor) of the central region (ABC7).
The timing of inferred demographic events could be then estimated from the computed posterior distribution of time parameters from the best model choice (% votes and probability out of 500 runs). In all scenarios, t# represented the time scale measured in number of generations (the largest numbers refer to the oldest events) and Ne# represented the effective size of the corresponding populations during the indicated time period. We used default prior values for all parameters. The following summary statistics of 50 variables including five noise variables were considered for each current population (i.e., a group of populations within a region considered as Ne1, Ne2 and Ne3) or for pairwise comparison of these three groups: (1) one-sample summary statistics, i.e. genetic diversities, and (2) two-sample summary statistics, i.e. FST and Nei’s distances, all considering the proportion of zero values; (3) mean of non-zero values; (4) variance of non-zero values; and (5) mean of complete distribution. The most-likely scenario was obtained from a comparative assessment of their posterior probabilities. The goodness-of-fit was checked through principal component analysis (PCA) using the ‘out of bag’ error method. The posterior distribution of parameters (N# and t#) was estimated for each of the most likely supported scenarios.
Results
Allele and genetic diversity
For the 38 P. vulgaris populations, we genotyped a total of 265 alleles, considering all loci and individuals. Overall, the mean number of alleles (AM) was 4.9 and ranged between 1.6–7.1 per population. The effective number of alleles (AE) was 2.9 and ranged between 1.4–1.7, whereas allelic richness (k=14) reached 3.7 and 1.6–5.4 at population level on average (Table 2). Populations from western lowlands revealed a total of 83 alleles, among which six were private alleles (^q = 0.003), with AM = 3.3 (from 1.6 to 4.3) and AE = 2.1 (from 1.4 to 2.5) on average, whereas allelic richness (k=14) reached 3.4 (Table 2). Populations from central Europe revealed a total of 186 alleles among which 52 were private alleles (^q = 0.032), with AM = 5.7 (from 2.9 to 7.6) and AE = 3.3 (from 1.7 to 4.4) as a mean, whereas allelic richness reached 5.8 (k=14) (Table 2). Populations from eastern Europe revealed 195 alleles of which 69 appeared private alleles (^q = 0.034), with AM = 5.7 (from 3.8 to 7.1) and AE = 3.5 (from 2.0 to 4.7) on average, whereas allelic richness reached 6.3 (k=14) (Table 2). No null alleles were detected in western lowlands, but null alleles were found in central Europe for locus PRIV27 (frequency range: 0.000–0.149), PRIVB35 (0.000–0.255) and PRIVB39 (0.000–0.433), and in eastern Europe for locus PRIV13 (0.184–0.794), PRIV19 (0.000–0.241), PRIV27 (0.000–0.221) and PRIV29 (0.009–0.253). Microsatellite markers showed selective neutrality within populations (Ewans-Watterson tests not significant at p > 0.05).
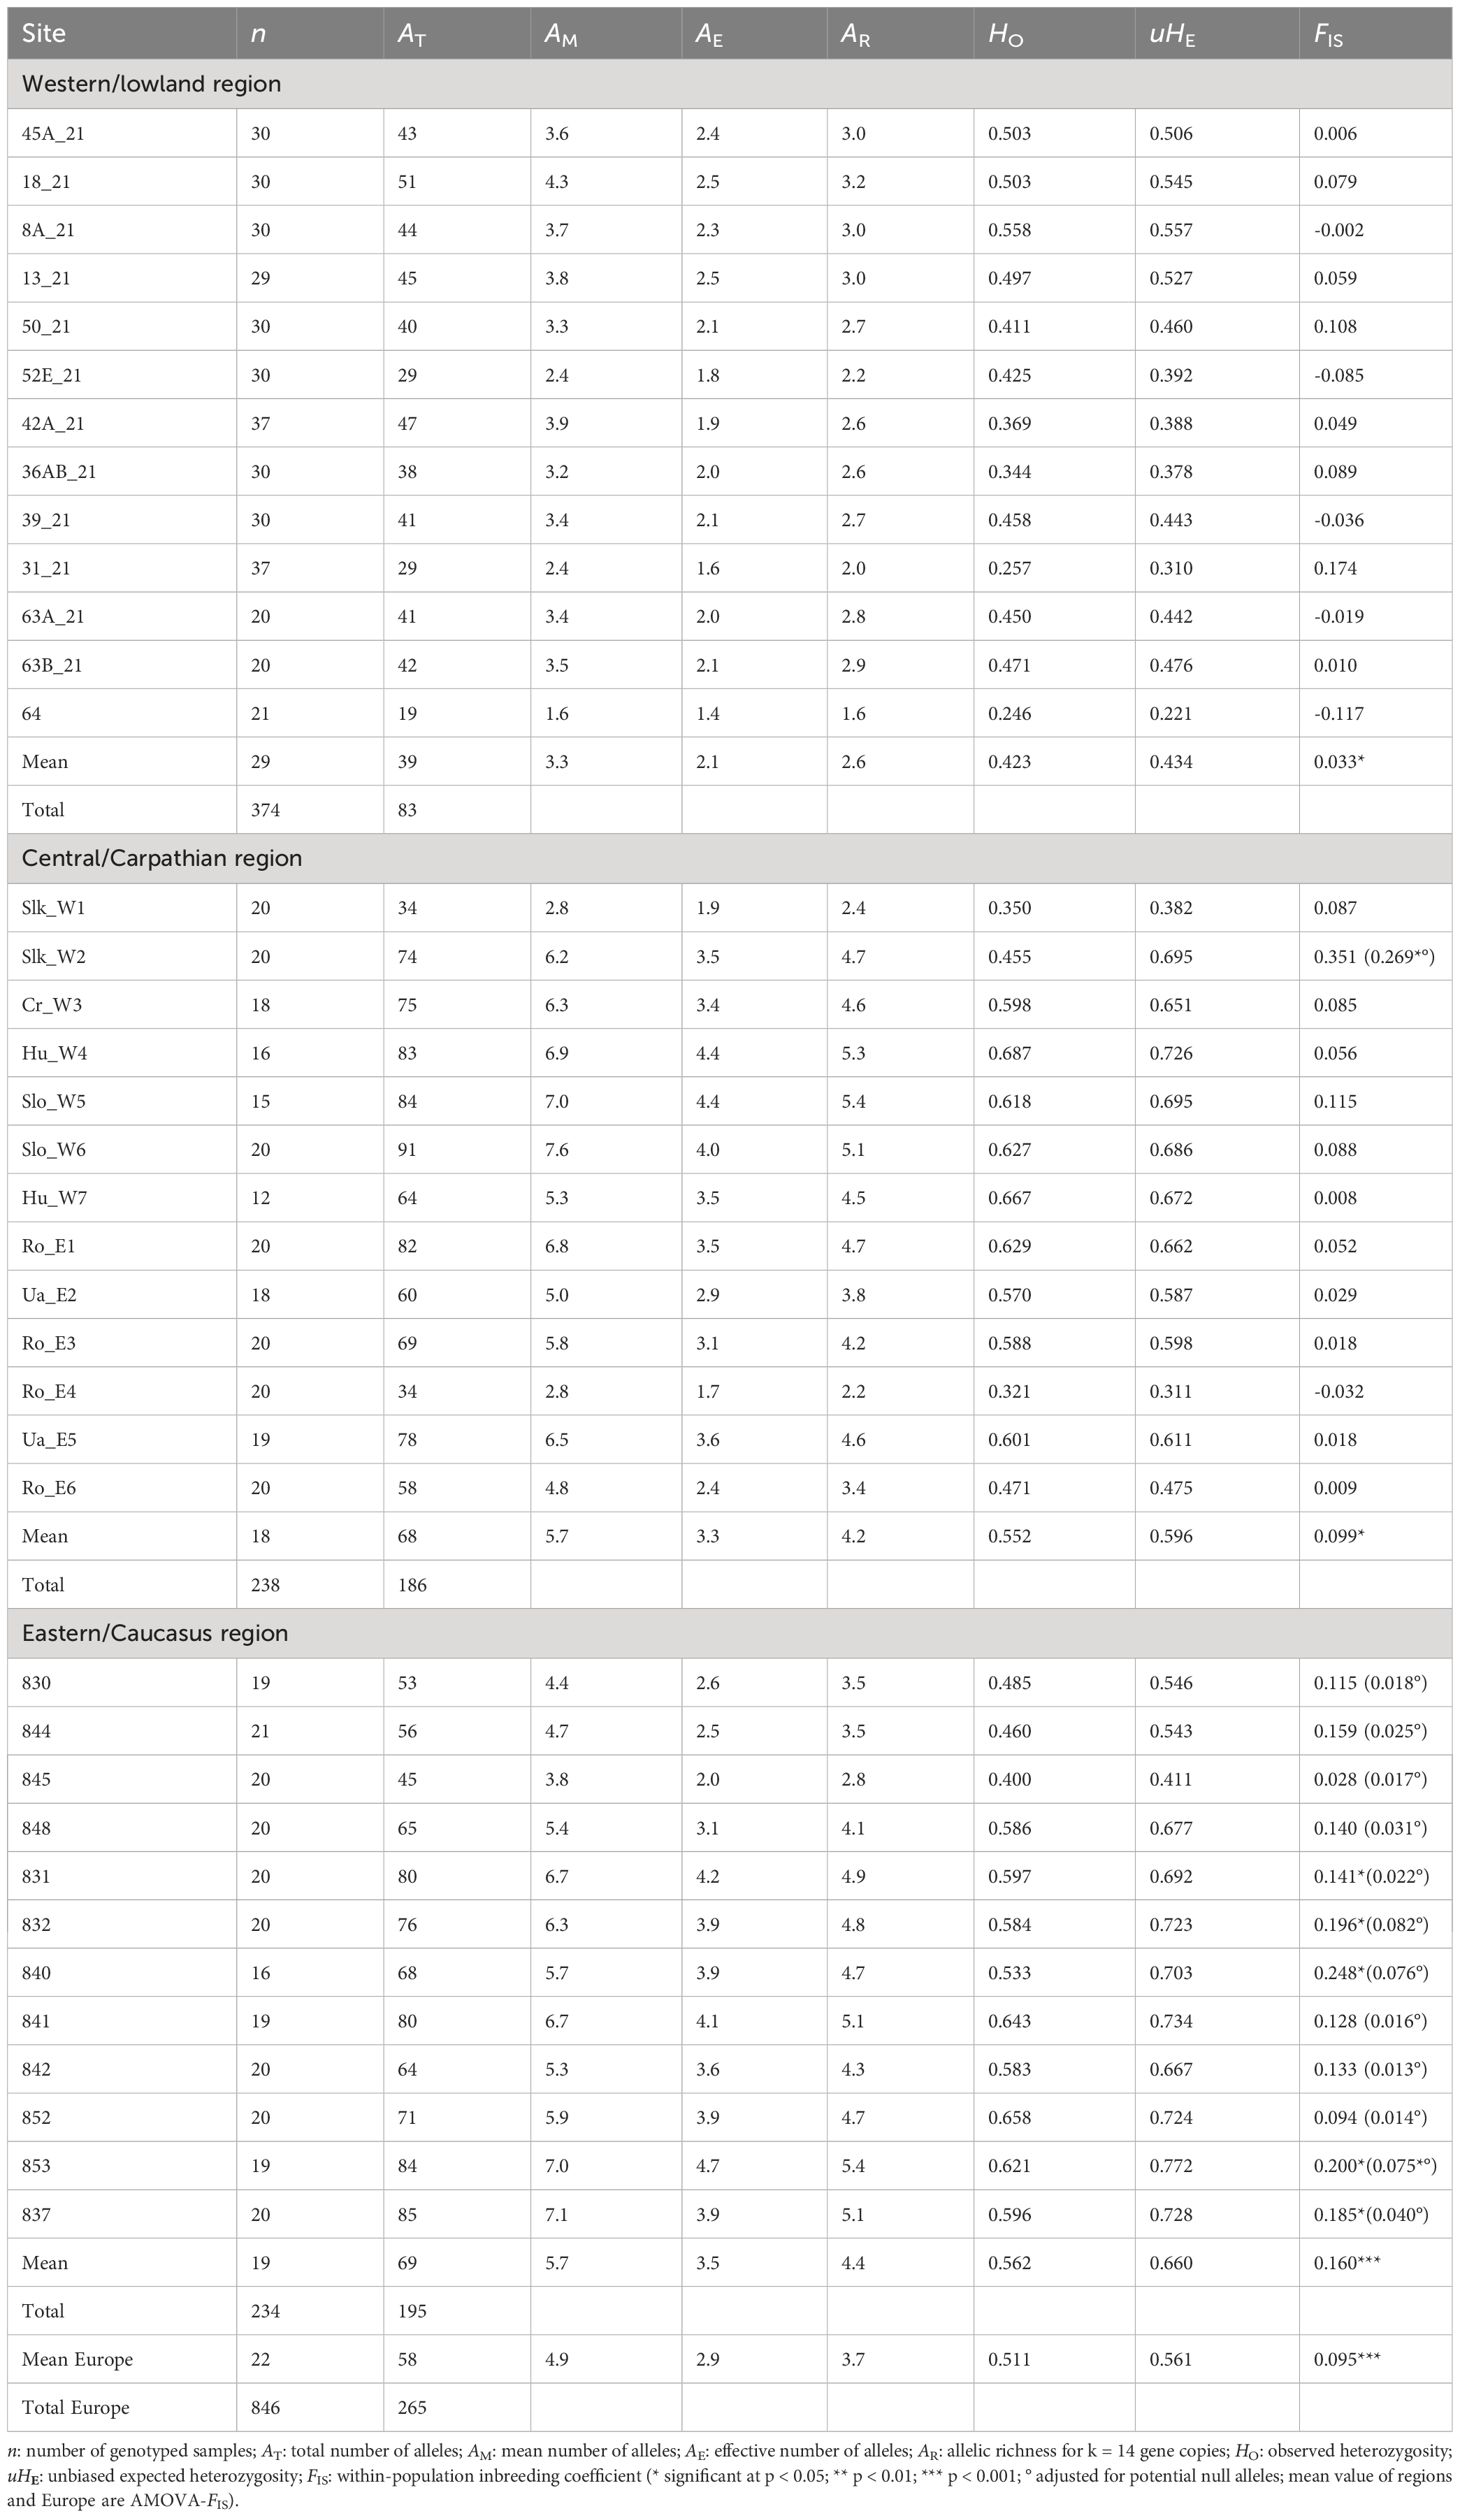
Table 2 Population genetic variables of Primula vulgaris populations in three European regions (Western/lowland, Central/Carpathian and Eastern/Caucasus).
Overall observed heterozygosity (HO) was 0.511; for western, central and eastern regions, HO = 0.423, 0.552 and 0.562, respectively. Overall unbiased expected heterozygosity (uHE) was 0.561; for western, central and eastern regions, uHE = 0.434, 0.596 and 0.660, respectively. One-sided comparison tests between regions indicated significantly higher AR, HO and uHE values for central and eastern populations than for western lowland populations (p values ranging from 0.001 to 0.008), although without a significant (p > 0.05) difference between central and eastern populations. The mean within-population inbreeding coefficient (AMOVA-FIS) value was significantly positive for each region, reaching 0.033 (p < 0.01), 0.099 (p < 0.001) and 0.160 (p < 0.001) for western, central and eastern regions, respectively (mean FIS value over all populations = 0.095; p < 0.001). None of the western lowland populations showed significant FIS values, and only one population of central Europe (Slk-W2) and six eastern populations (from Sochi and Gagra areas) showed a deficit in heterozygotes (Table 2). More importantly, the estimated unbiased FIS values, when adjusted for null alleles, were much lower and indicated only Slk-W2 (central region) and 853 (eastern region) as an inbred population (Table 2).
Genetic structure among populations
The AMOVA at global level revealed that 32% of the genetic variation was explained among European populations, 6% among individuals and 62% within individuals, giving an estimate of FST = 0.319, FIS = 0.095 and FIT = 0.384 (Table 3). At regional scale, the highest FST value (0.236) was found for western lowlands and the highest FIS value (0.160) for the Caucasus region (Table 3). Pairwise FST values were significant for all population pairs, except for western populations occurring within a same forest area, namely 63A-63B (Supplementary Table 1). The highest pairwise FST values reached 0.469, 0.548 and 0.362 in western, central and eastern populations, respectively (Supplementary Table 1), and ranged from 0.135 to 0.653 between these regions. FST values adjusted for null allele frequencies for central and eastern populations were slightly lower than non-adjusted values (overall FST values = 0.190 vs. 0.185 or 0.182 when considering null allele presence, respectively), but it did not affect the genetic differentiation patterns among populations (Supplementary Table 2). One-sided tests did not reveal an overall significant difference in FST between any of the regions (i.e., FST values are high everywhere, also within regions).
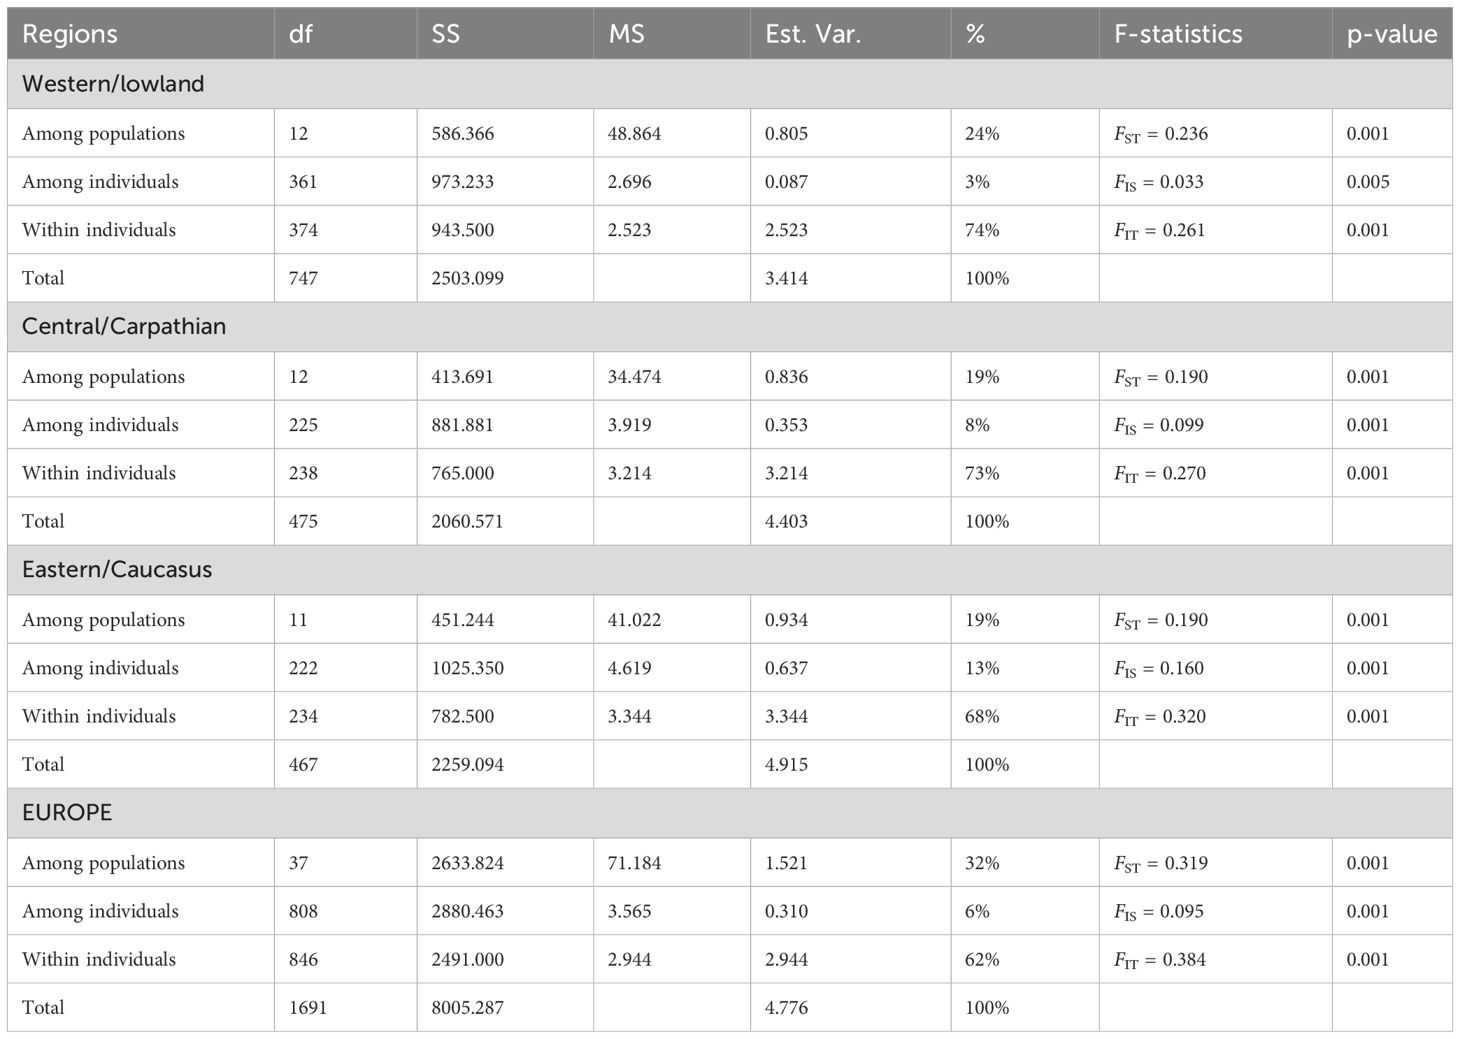
Table 3 Summary of AMOVA and F-statistics in western/lowland, central/Carpathian and eastern/Caucasus regions and for the total area, with df, degrees of freedom; SS, sum of squares; MS, mean of squares; Est.Var., estimated variance; %: percentage of the total variance.
At the European scale, the PCoA at individual level (cumulative 25% explained for two axes) clearly separated western lowlands from the two other regions, and only revealed a marginal overlap between central and eastern regions (Supplementary Figure 2). The population assignment test (leave-one-out option) at European level considering individuals pooled under three regions, indicated that 100% of the individuals were assigned to their own region. Population assignment tests (leave-one-out option) at region level indicated that respectively 82% (western), 92% (central) and 93% (eastern) of the individuals were assigned to their own population. The PCoA of individuals within each region revealed trends in the clustering according to their geographical position (Figure 2). In the western lowland region, forest populations of Clairmarais (northern France) and Praetbos (Belgium) and northern Drenthe population (The Netherlands), all located at somewhat higher elevations in the landscape (12–24 m), were separated along the first axis from polder Belgian populations located at 3–9 m altitude in a strongly fragmented agricultural landscape (Figure 2A). In the central region, individuals of Ro-E4 population, located in the narrow Danube River corridor across the Carpathian mountains, were separated from the other populations along the first axis (Figure 2B). The second axis separated two Slovakian populations (Slk-W1 and Slk-W2) from the other Carpathian populations, due to their low and high level of allele richness, respectively. A check of the raw data confirmed that population Slk-W1 possessed 11 private alleles (q^=0.116, with q=0.025–0.650) in four loci, of which only locus PRIVB29 (more precisely allele length 220 at q=0.3) indicated potential introgression from Primula elatior, which do co-occur with P. vulgaris. For this purpose, cross-amplification, allele sizes and unique alleles at species level were ‘a posteriori’ checked for P. elatior samples of Belgium (origin: Geraardsbergen, Raspaille forest). Ro-E4 contained no private alleles though differed strongly in allele frequencies for various loci. A gradient along both axes could be noted for individuals from the Transylvanian Carpathian versus the western Carpathian basin (and Dinaric Alps) populations (Figure 2B). An additional analysis omitting Slk-W1 and Slk-W2 did not enhance the separation of the remaining populations from the west and east Carpathian basin along both axes (results not shown). Individuals from the eastern region in the Caucasus area clustered according to the distinct valley areas, i.e. the northern (Tuapse) area clearly separated along the first axis whereas central (Sochi) and southern (Gagra) areas showed a gradient along the second axis (Figure 2C), however with exception of population 832 of Gagra area, which contained individuals more closely related to those of the Sochi area.
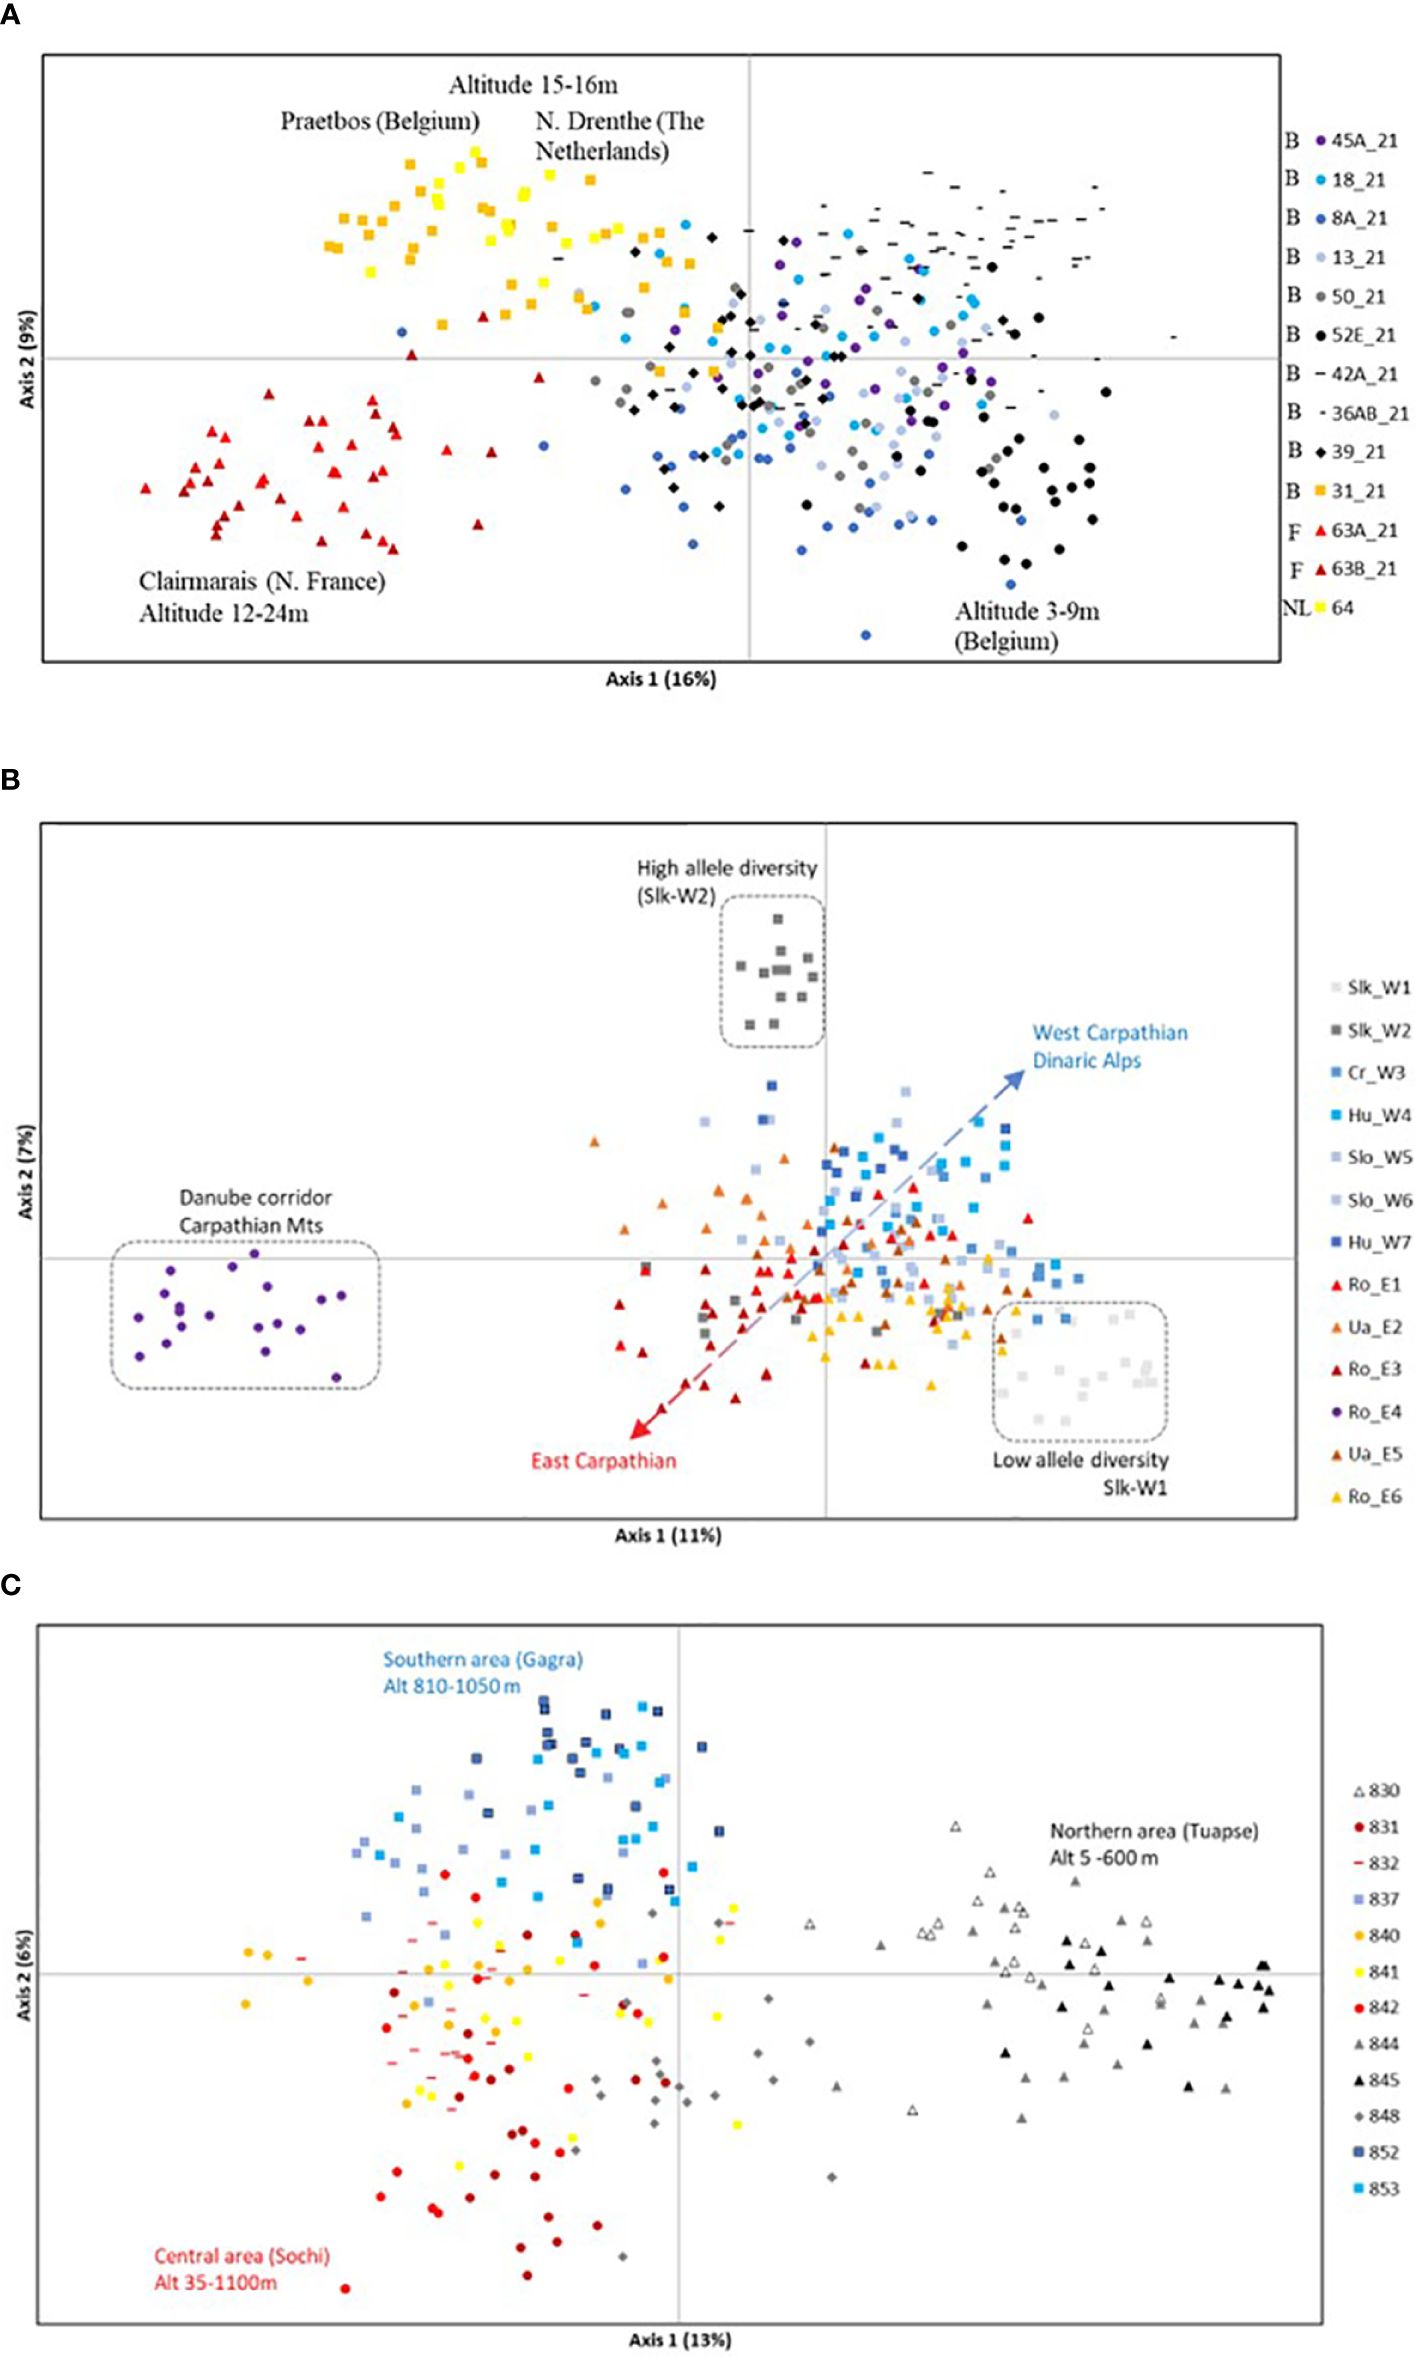
Figure 2 PCoA of Primula vulgaris individuals from 38 populations of three European regions. (A): western lowland region (B, Belgium; NL, The Netherlands; F, France); (B): central region of Carpathian Mts and Dinaric Alps (Slk, Slovakia; Cr, Croatia; Hu, Hungary; Slo, Slovenia; Ro, Romania; Ua, Ukraine); (C): eastern region of Caucasus Mts.
Venn’s diagrams (Supplementary Figure 3) obtained by variation partitioning showed a clear geographic pattern shaping the genetic differentiation patterns (explaining 11% to 46% of the variance), while the results contrasted for altitude: altitude alone explained 1% of the variance, and covaried with geographic location for 22% of the variance in the western region, but only contributed to the genetic differentiation pattern for 4% of the variance in the central region. In the eastern region, altitude explained 15% of the variance independently of the geographic location of the populations.
The STRUCTURE Bayesian clustering analysis allowed for distinguishing among the western, central and eastern regions, with the highest ΔK values at K=2, separating first the western populations from the others, and then at K=3, resulting in a complete separation of gene pools among the three regions (Figure 3; Supplementary Figure 4). LnP(K) also indicated high likelihoods for additional clusters, and the ‘divisions of runs by mode’ gave maximum support at K=9 (Supplementary Figure 4), showing additional clustering of populations within regions. The MedK estimator revealed no conclusive number of clusters, with K estimation continuing to increase until K=15 (Supplementary Figure 4). In the western region, an additional cluster separated ‘forest’ populations of Clairmarais and Praetbos together with Drenthe (those at slightly higher altitudes) from the other populations at K=4. The northern area of the Caucasus region (Tuapse) clustered as a separate gene pool at K=5, whereas the southern area of the Caucasus (Gagra, with exception of population 832) was distinguished at K=7 and K=8. When considering the central region, Ro-E4 population clustered separately at K=6, and at K=9 the Transylvanian Carpathians and the western Carpathian basin (incl. the Dinaric Alps) showed a slightly different gene pool featured by admixed (with lowered Q membership, thus not fully assigned) individuals (Figure 3A). The K-means clustering of individuals within each region confirmed all abovementioned gene pools with ΔK = 2 in the western region, ΔK = 4 in the Carpathian region and ΔK = 3 in the Caucasus region (Figures 3B–D).
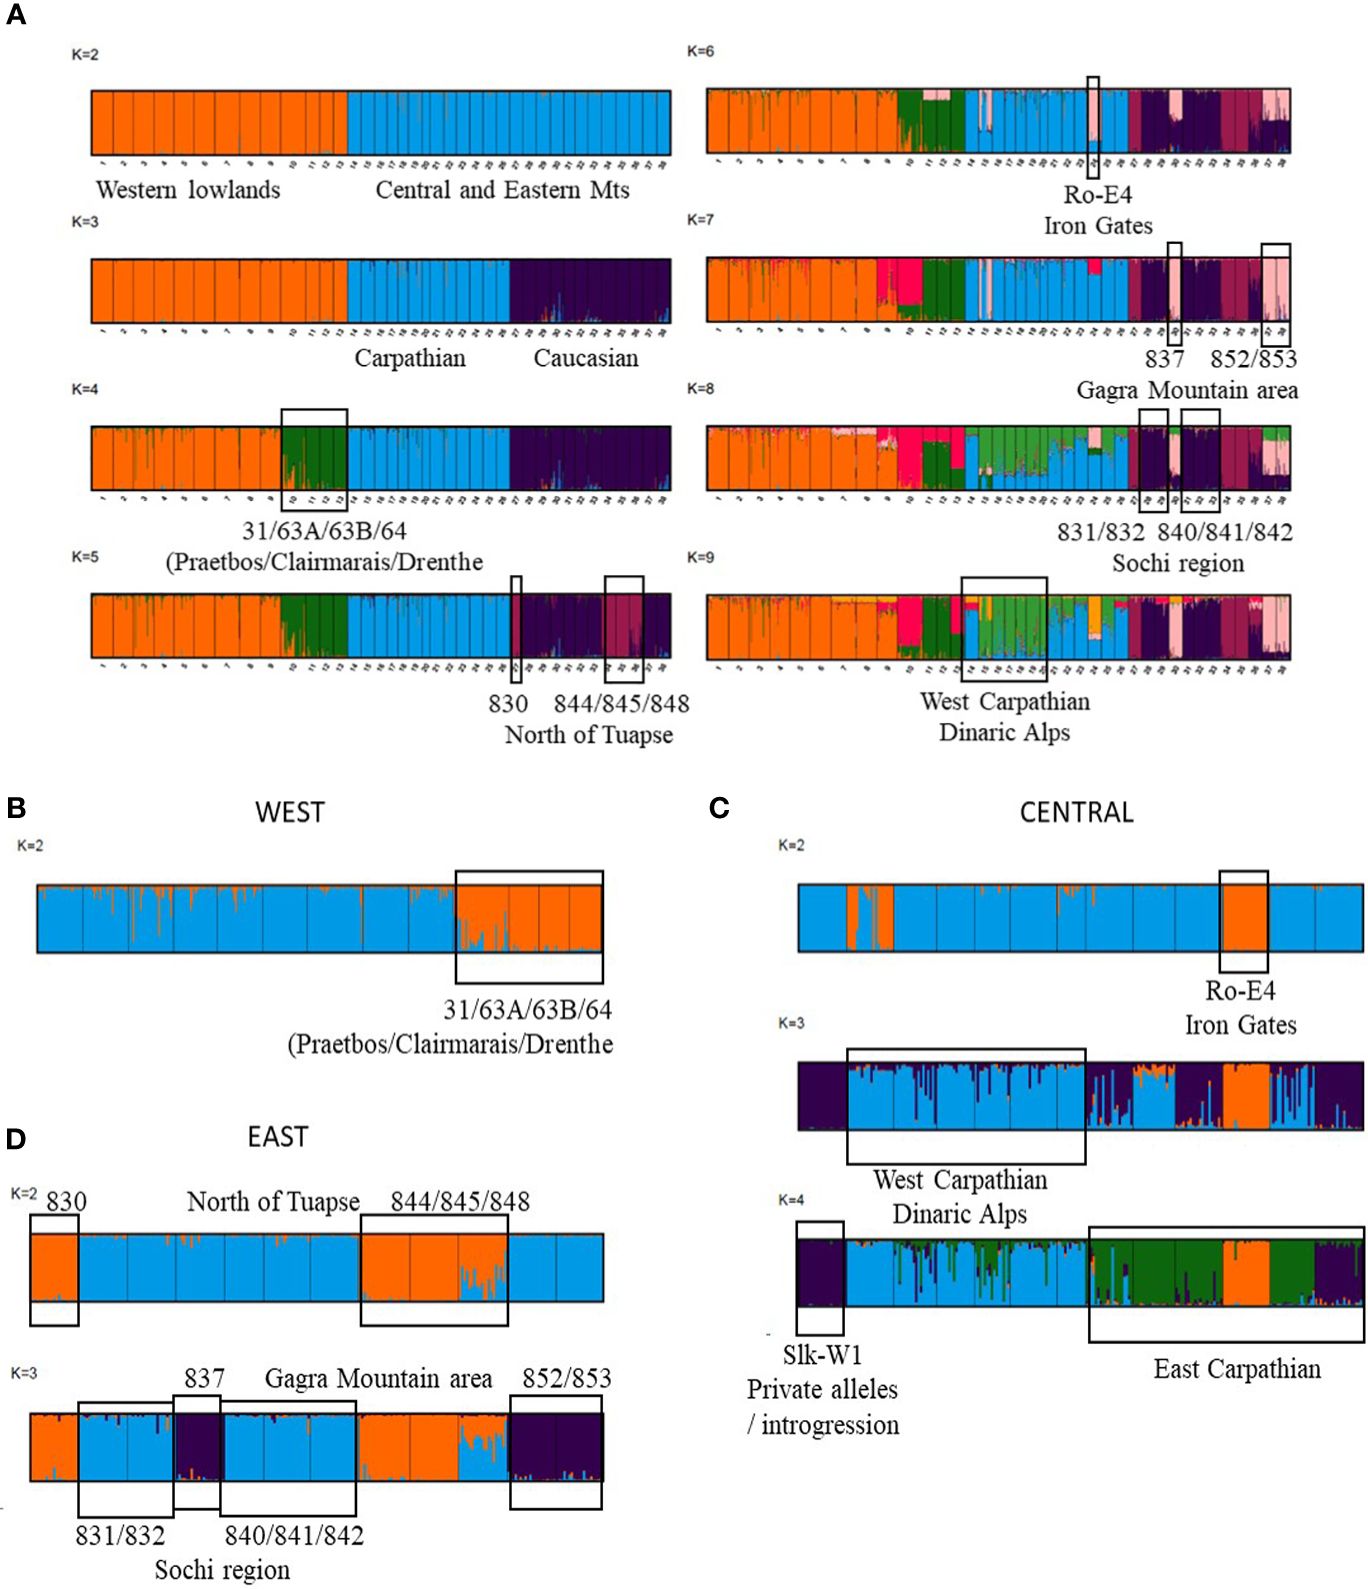
Figure 3 Structure results (A) for 38 European populations (1–13: western lowland region; 14–26: central region of Carpathian Mts and Dinaric Alps; 27–38: eastern region of Caucasus Mts) for K=2 to K=9, with indication of subsequent gene pool clustering and concerned geographic areas; (B–D) for individuals within each region confirming gene pools with ΔK = 2 in the western region (B), ΔK = 4 in the Carpathian region (C) and ΔK = 3 in the Caucasus region (D).
Phylogeographic signal and isolation-by-distance patterns
Global multilocus RST value (0.398) was significantly (one-tailed allele size permutation test, p<0.05) higher than global multilocus FST value (0.321), and the allele size permutation test at single locus was significantly higher value for five loci (p < 0.05), indicating a potential phylogeographic signal. When considering distance classes, both multilocus FST and RST measures showed a significantly higher value than on average for distances above 500 km and up to 2,966 km, hence between the three regions (Table 4A). There was a clear IBD pattern at European level as pairwise genetic differentiation (expressed as FST/(1 − FST) or RST/(1 − RST)) increased with geographic distance (significantly positive slopes of the regression) and was significantly higher than on average for the distance class above 500 km (i.e., population pairs between the three regions) (Table 4A). Overall, a phylogeographic signal was obtained with a significant allele size permutation test at multilocus level and at single locus level for the large distance class, potentially within a region (Table 4A). When thus considering each region separately, pairwise genetic differentiation, expressed as FST/(1 − FST) or RST/(1 − RST), increased with geographic distance though not with a similar strength (Table 4B; Figure 4). The slope of the regression on FST/(1 − FST) was only significant for the western and eastern regions, whereas for RST/(1 − RST) it was significant for the three regions (Table 4B; Figure 4). The among-population permutation test showed a significantly higher RST/(1 − RST) value only for the largest distance class in the western region (89.1–392.6 km) and eastern region (88.2–169.8 km). There was no IBD within the central region, but an on average high genetic differentiation was found – for geographical distances that were mostly above 190.8 km (Table 4B; Figure 4). A phylogeographic signal was found within regions, with the allele size permutation test being significant: for the largest distance class in the western region at multilocus level (however, only marginally significant as p = 0.05) and at single locus level for PRIVB39 (p = 0.013); for the largest distance class in the eastern region at multilocus level (p = 0.025) and for locus PRIV27 (p = 0.033); for most distance classes (beyond 190.8 km) in the central region at multilocus level (p ranging from <0.001 to 0.012) and for locus PRIVB39 (p ranging from <0.001 to 0.007) (Table 4B).
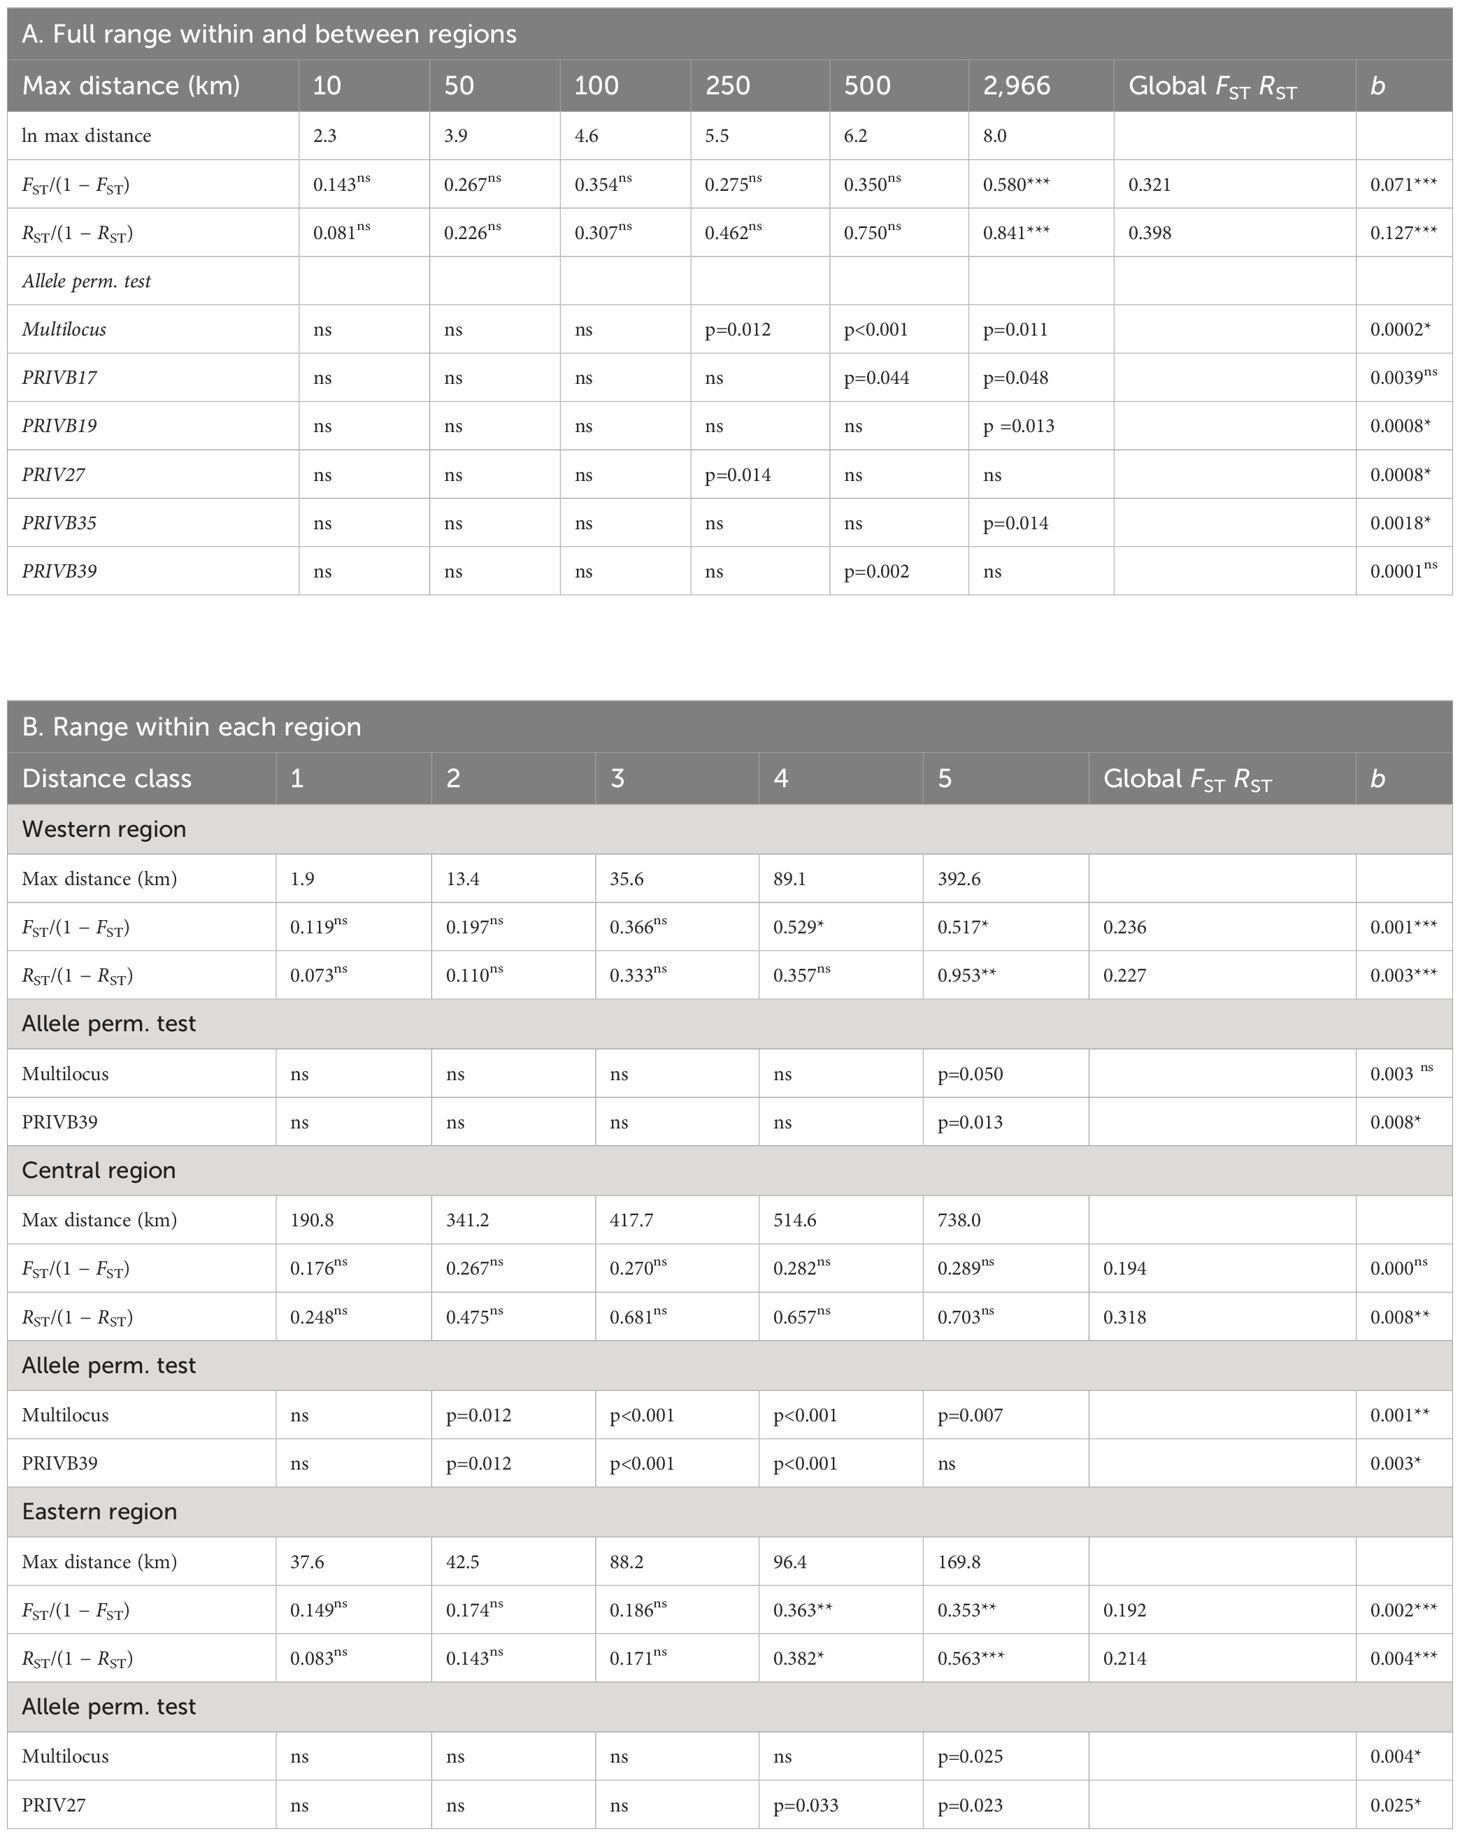
Table 4 Results of the regression analysis testing for isolation by distance (among-population permutation test: 1-sided test, H1: obs>exp) and of the allele size permutation test (1-sided test, H1: obs>exp; at multilocus and single locus level when significant) for 38 Primula vulgaris populations from three European regions (western/lowland, central/Carpathian and eastern/Caucasian) using pairwise genetic differentiation based on allele identity (FST) and on allele size (RST), considered as FST/(1 − FST) and RST/(1 − RST) over geographic distance (mean values per distance class), with A: six defined spatial distance classes covering the full study range; B: five spatial distance classes within each region considering equal number of population pairs per class (* at p < 0.05; ** at p < 0.01; *** at p < 0.001 significance level; ns non-significant). b, slope of the regression.
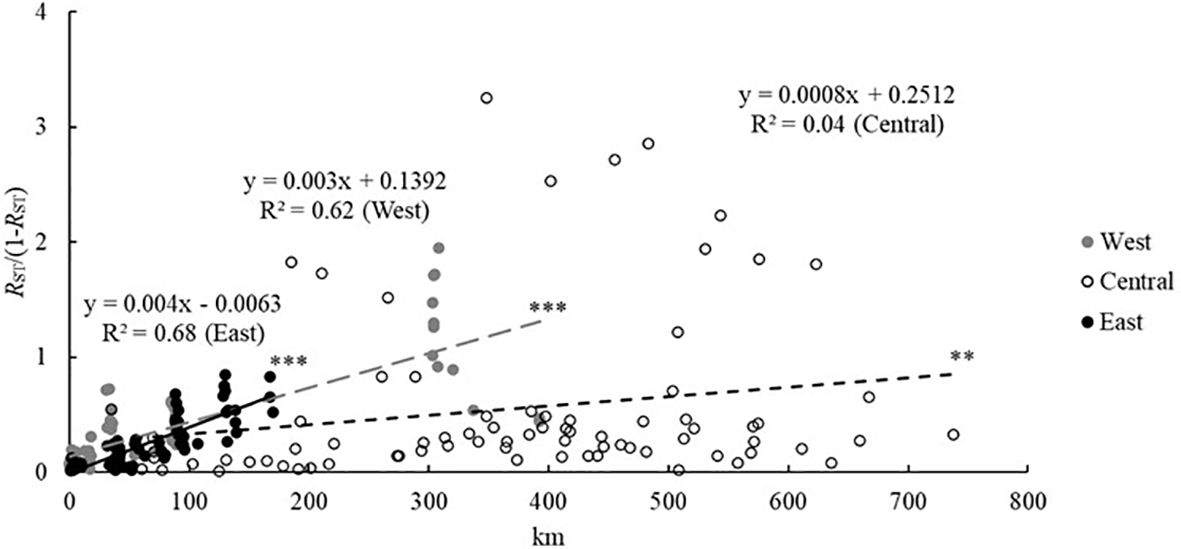
Figure 4 Isolation by distance of Primula vulgaris populations from three European regions considering RST/(1 − RST) as measure of genetic differentiation, with regression results (** at p < 0.01; *** at p < 0.001 significance level).
Demographic history based on ABC-Random Forest analyses
The demographic analysis (ABC1; Supplementary Figure 1: information on ABC1) at European level (38 populations) showed a support (64% votes; posterior probability 0.71) for scenario 4, referring to an overall bottlenecked history of the species (Figure 5). The median bottleneck was estimated at t1-db = 27,558 generations, though it was not very conclusive because of the large and bimodal variance (5% quantile 7,562; 95% quantile 47,280) and peaks around 20,000 and 40,000 generations, partly referring to the Weichselian (Würm) cold period, that started about 70,000 BP until the LGM. The expansion at t1 was estimated at a median generation time of 2,612 (5% and 95% quantiles: 298–20,341), with a clear single peak referring to the Holocene period (since 11,700 years BP), when considering a generation time of up to two years. Posterior distribution of effective sizes were: ancestral size Ne = 51,882, bottlenecked size Ne1 = 3,992 and current effective size Ne1 = 55,769 (Supplementary Figure 1: information on ABC1). The demographic analysis (ABC1; Supplementary Figure 1: information on ABC1) within each region showed a marginal support for scenario 3 referring to an expansion history in the western lowlands (52% votes; posterior probability 0.36) and in the eastern region (51% votes; posterior probability 0.61), and for scenario 4, referring to a bottlenecked history in central European populations (57% votes; posterior probability 0.65).
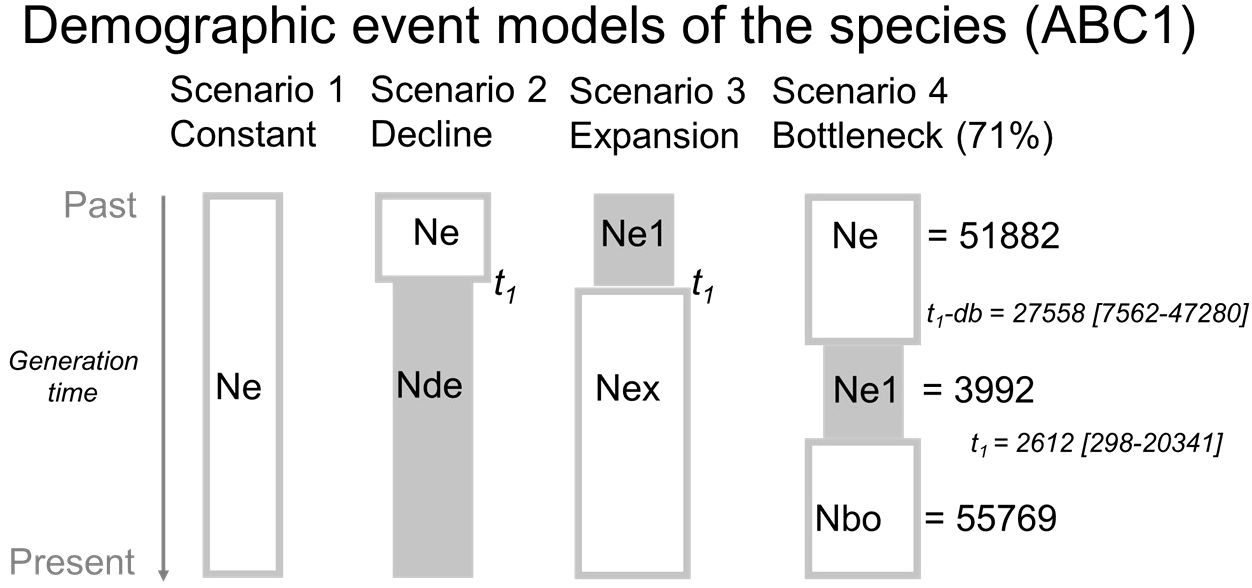
Figure 5 The four demographic event models considered in Approximate Bayesian Computation analysis of European Primula vulgaris populations. Effective sizes and generation times are given for the most supported (bottleneck) scenario (scenario 4). Ne and Ne1= effective population size; Nde = size of declined population; Nex = size of expanded population; Nbo = size of bottleneck population; t1 = time of divergence in number of generations; db = duration of bottleneck period.
For the three regions (western, central, eastern), from the seven scenarios implemented in the origin model (Supplementary Figure 1: information on ABC2), scenario one, with all three regions bottlenecked, was the best supported (47% votes, posterior probability = 0.50). The outcome suggested the oldest origin for ‘eastern’ populations (median td = 54,734 generations; 95% credibility interval 13,850–96,710), with a split of the ‘central’ populations estimated at t2 (median) = 16,641 generations (95% credibility interval 5,049–40,892), and a much more recent split of ‘western’ populations estimated at a generation time t1 (median) = 6,623 (95% credibility interval 1,460–22,510), with posterior distribution of effective sizes of ancestral NeA = 56,957 and current effective sizes of Ne1 (western) = 5,045, Ne2 (central) = 27,317 and Ne3 (eastern) = 35,220 with bottleneck periods of effective sizes Neb ranging between 3,296 and 6,870 (Figure 6; Supplementary Figure 1: information on ABC2).
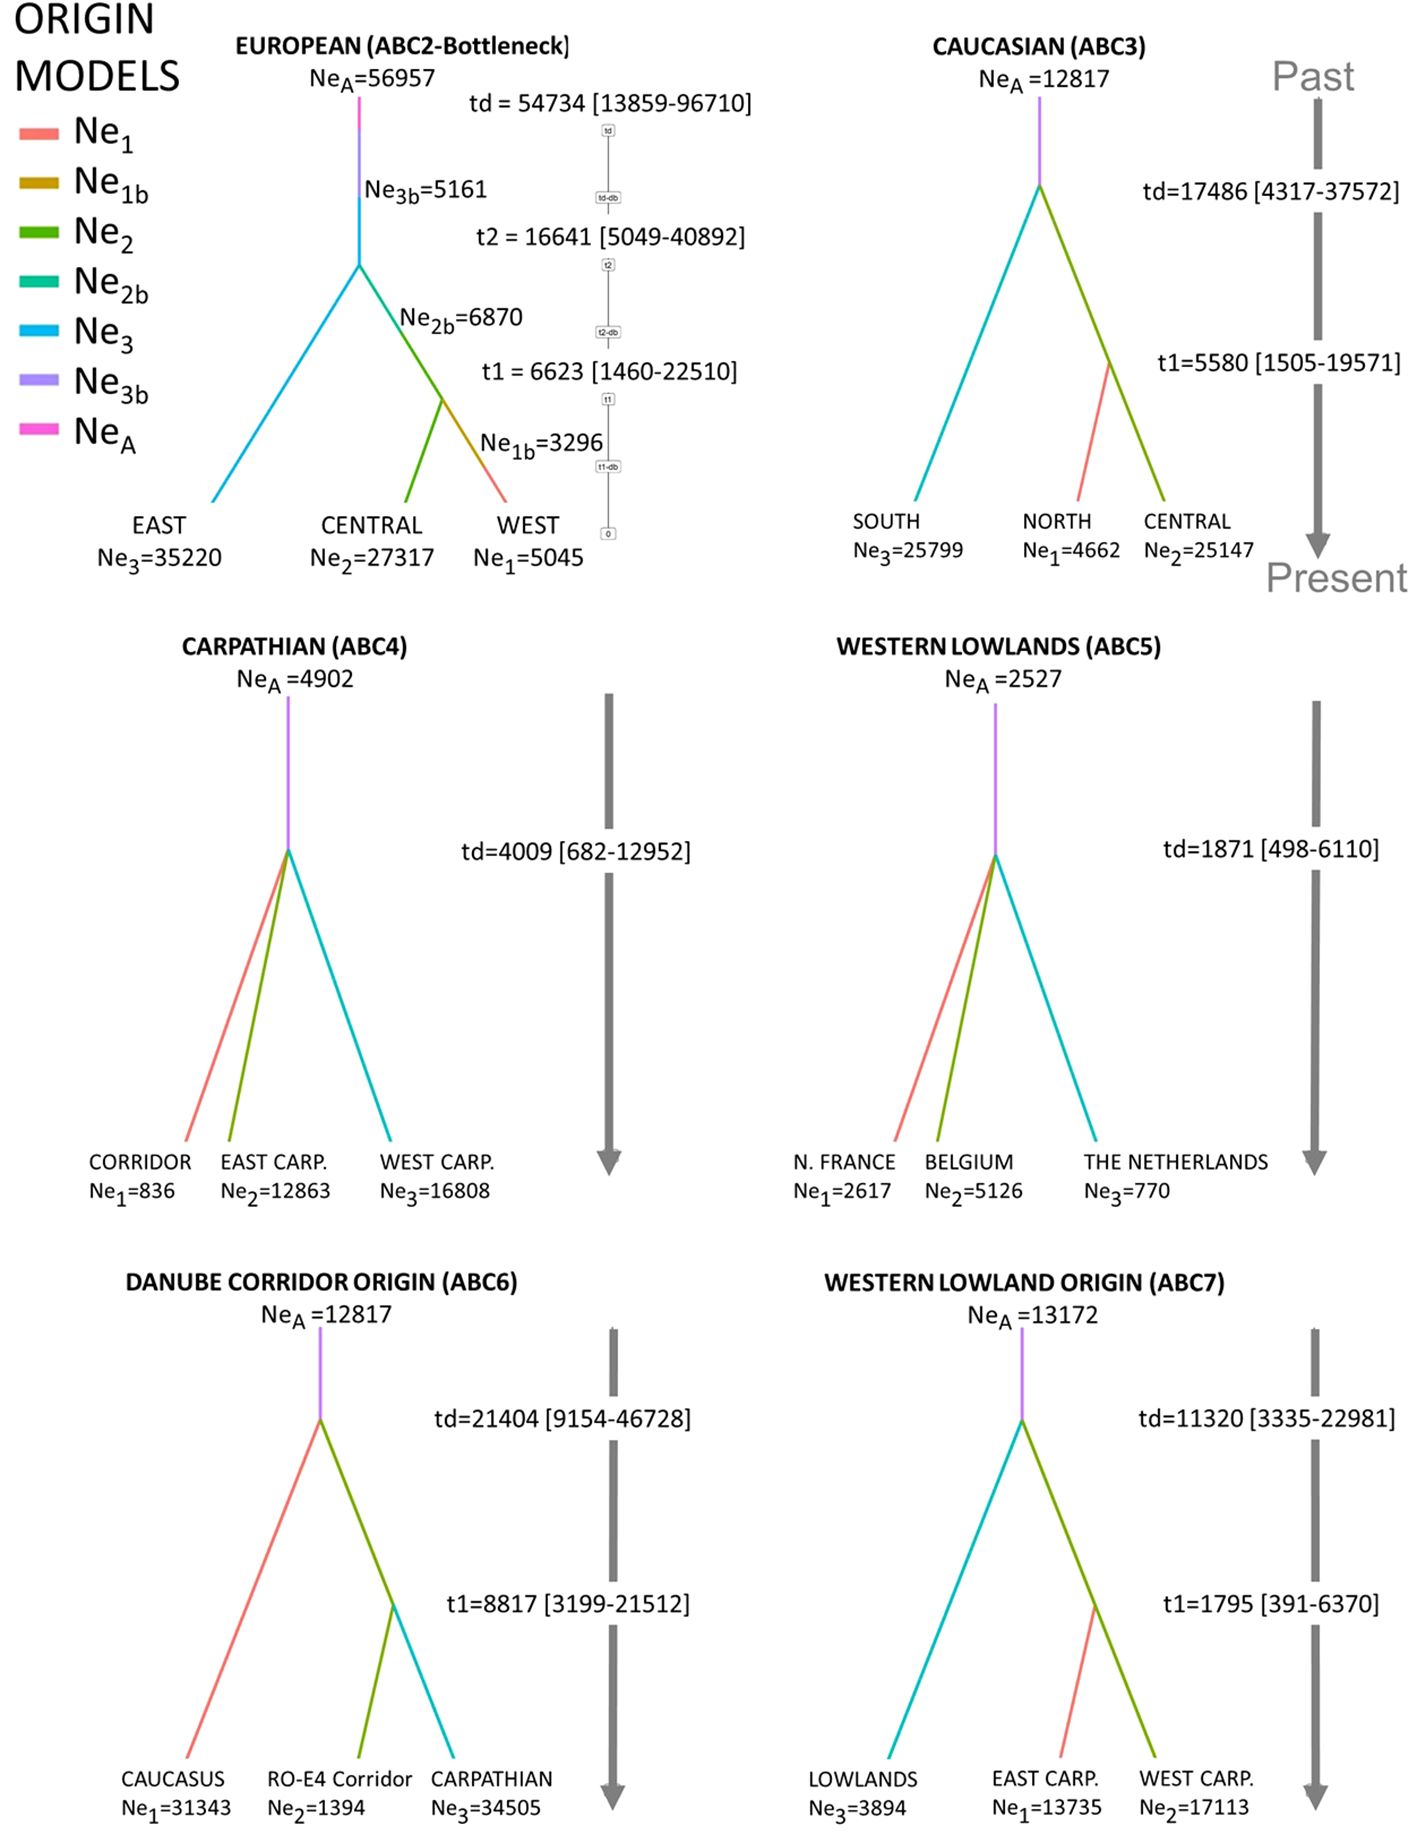
Figure 6 Estimation of divergence time (in generations) and effective population sizes of Primula vulgaris in three European regions for six series of origin models (ABC2–ABC7) based on the best supported scenario (out of seven using DIYABC-Random Forests). See methods section and supplementary materials for the description of origin models. Ne1, Ne2 and Ne3 = effective size of current region or population; NeA = ancestral population size; Ne1b, Ne2b, Ne3b = effective size of historical bottleneck population; t1, t2 and td = time of divergence in numbers of generations.
When zooming in at the demographic evolution within each region, using a set of seven possible scenarios implemented in the origin model (Supplementary Figure 1: information on ABC3–ABC7), a phylogeographic scenario (scenario 4) was the best supported for the eastern (Caucasus) region (ABC3). For the latter, the southernmost populations (Gagra, with estimated Ne = 25,799) have diverged from an ancestral population (NA = 12,817) in the past at median td = 17,486, whereas the northernmost ones (Tuapse, Ne = 4,662) have diverged more recently from centrally situated populations (Sochi, Ne = 25,147), at median t1 = 5,580 (Figure 6; Supplementary Figure: information on ABC3).
The expansion scenario (scenario 1) was the best supported for central (Carpathian; ABC4) and western lowland (ABC5) regions. The central population groups (putative Transylvanian Carpathians, western Carpathian basin (incl. Dinaric Alps) and Lower Danube corridor), were estimated splitting at td (median) = 4,009 generations from an ancestral population of size NeA = 4,902 (Figure 6; Supplementary Figure 1: information on ABC4). The western lowland populations were estimated to have diverged far more recently, at td (median) = 1,871, from a much smaller ancestral population of size NeA = 2,527 (Figure 6; Supplementary Figure 1: information on ABC5).
The simulation investigating Ro-E4 population origin, considering the Caucasus and the Carpathian populations (ABC6), allowed estimating an origin at td (median) = 21,404 from an ancestral population of NeA = 12,448 (Figure 6; Supplementary Figure 1: information on ABC6, scenario 2). The Ro-E4 population appeared to have derived from the Caucasus region rather than from the other Carpathian populations (t1 = 8,817), thereby suggesting its history as potential stepping stone of the species in central Europe during the Holocene (11,700 years BP–present) or during the LGM, when considering a generation time of two years. The simulation investigating western lowland origin, as a single group next to the central (Transylvanian Carpathian and western Carpathian basin) populations, allowed estimating western lowland population origin at td (median) = 11,320, from an ancestral population of NeA = 13,172 (Figure 6; Supplementary Figure 1: information on ABC7, scenario 6), suggesting a secondary (cryptic) glacial refugium of the species in the western Carpathian basin during or towards the end of the LGM, when considering a generation time of two years.
Discussion
The present study of Primula vulgaris populations across three European regions, based on highly polymorphic nuclear microsatellites, provided substantial new knowledge about allele diversity, genetic differentiation, divergence times, bottlenecks, and effective population sizes, which together led to verify specific hypotheses in addition to a refinement of previous findings on species evolutionary history. Indeed, AMOVA, PCoA and STRUCTURE analyses demonstrated a strong genetic differentiation between the three regions. A phylogeographic signal (RST > FST) indicated that stepwise-like mutation processes, together with isolation-by-distance patterns, contributed to population genetic differentiation. The eastern and central regions featured the highest allelic richness. Besides, a refined demographic ABC scenario supported a Pleistocene legacy, with most ancestral lineages originating from the Caucasus region, and historical bottleneck occurrence in each region, thus apparently across the whole distribution range. All three regions underwent an expansion during Holocene, although their lineages diverged at different eras, gradually younger from eastern to western regions and with large differences in effective population sizes, being much smaller in western lowlands. The posterior distribution of supported ABC scenarios was unimodal and well supported for recent generations, although it was less clear or multimodal for ancient generations, but nevertheless allowed for distinguishing younger (at t1) from older (at t2 and td) periods. ABC performed poorly and gave multimodal NA and Ne estimates, most likely explained by the strong genetic substructure of P. vulgaris within regions. The bottleneck population sizes however were unimodal. An alternative explanation could be that most available methods for estimating Ne assume a population with discrete, non-overlapping generations (Luikart et al., 2010). However, this assumption is violated in many long-lived plant species in which individuals can reproduce multiple times during their lifetime, with different cohorts coexisting and interbreeding. For P. vulgaris we may assume a generation time of two years, but it might be an underestimation.
Pleistocene legacy and bottleneck periods of species distribution
Previous genetic studies (based on nuclear ITS and plastid DNA markers) of P. vulgaris populations showed that the highest genetic diversity was located in the Ponto-Caspian region, with a refugium in the Colchis region (Caucasus). It was hypothesized that P. vulgaris originated from the Caucasus, more precisely along the northern coast of the Black Sea, and migrated westwards (Volkova et al., 2013). This scenario was later clearly supported by genomic data (Stubbs et al., 2023). The evolutionary history was further elaborated by Volkova et al. (2020) who concluded, based on shared ancestral ITS ribotypes between the Caucasus and the Carpathians, that the westward spread of the species to central Europe could harbour ‘cryptic’ LGM refugia in the Carpathian region, from which post-glacial migration to western Europe could take place. Demographic event models tested for P. vulgaris in the present study provided solid support for this hypothesis. The demographic models for populations within a single region marginally indicated a history either of bottleneck (central) or of expansion following a bottleneck (western, eastern). When considering all possible combinations with and without bottlenecks in origin models, the scenario of a bottleneck history only in central populations was not supported, while a bottleneck scenario was supported for all three regions. Narrowing down various ABC models has subsequently indicated that P. vulgaris experienced bottlenecks during its stepwise range expansion over a long distance, from east across central to western Europe, occurring during the Quaternary glacial cycles. The best supported origin model indicated the Caucasus region as the closest to an ancestral situation, and from which the central and western populations subsequently diverged. Divergence time of the Caucasus populations from an ancestral lineage pointed to the Upper Pleistocene (the Middle Weichselian, 129,000–29,000 years BP). The outcome of generation times of origin models clearly suggests the oldest origin for the southernmost Caucasus populations considered in this study (i.e., the Gagra mountain area). The divergence of Carpathian populations, including the Danube valley as potential corridor, was estimated during the Upper Pleistocene LGM (most likely the Late Weichselian, including the LGM, thus 29,000–14,000 years BP), confirming a role of central populations as secondary cryptic refugia. Western lowland populations diverged more recently, during the Holocene (most likely the warmest Atlanticum period, 7,000–3,900 years BP), possibly from West Carpathian/Dinaric Alp populations. The classic ‘rear edge–leading edge’ genetic structure of the distribution area (Hampe and Petit, 2005) should be here interpreted along an east-to-west gradient.
Primula vulgaris populations in eastern and central Europe had similarly high levels of allelic richness, although they only shared a small proportion of alleles. This, together with the ABC model clearly demonstrates that the central European populations underwent westwards migration from the Caucasus region (that is, along the Black Sea coastlines, as reported in Volkova et al., 2013), with changes in allele size by stepwise-like mutation significantly contributing to genetic differentiation – as demonstrated by RST values higher than FST values (Hardy et al., 2003) – during a quite large number of generations and clearly prior to the Holocene. The geographical positioning of central populations and their role as ‘cryptic’ refugium allowed for further westwards expansion of the species, with marked bottlenecks for western lowland populations during the Holocene. Nevertheless, strong support for a bottleneck scenario in each of the three European regions clearly suggests that it is an all-time feature of the species and that demographic bottlenecks have occurred throughout the range during the Pleistocene, the LGM and the Holocene, followed by regional range expansion.
Regional range expansion and genetic differentiation
Primula vulgaris experienced both bottlenecks and expansions in each of the three European regions. Nevertheless, within each region, a regional and progressive postglacial expansion was roughly estimated to have occurred 6,000 (Caucasus populations in the Sochi and Tuapse area), 4,000 (Carpathians) and 2,000 (western lowlands) generations ago. Short-distance insect pollination in combination with short-distance seed dispersal allowed founders to move within a single generation over only very small areas (Feurdean et al., 2013). The phenomenon of demographic ‘expansions’ of this species should be regarded as a low-intensity incremental movement – very different from good dispersers or invasive species – although these few thousands of generations have formed and structured P. vulgaris populations at different spatial scales. The currently observed genetic structure of P. vulgaris is believed to have evolved within a regional context-dependent predominance of either latitudinal, longitudinal, or altitudinal migration over different time scales.
In the Caucasus region, populations ranged from the sea level (i.e., the Black Sea shore) to 1,100 m. Populations located downhill and uphill in the same valley area can be assumed to have originated from a same source population. Although the sampling design was not optimal because the small number of populations did not span an entire elevation range, comparison of populations at the base of the hills with those at higher altitudes supported the hypothesis of ‘parallel colonization events’. Indeed, we revealed separate gene pools for the Tuapse populations (5–600 m a.s.l.) and Sochi area (200–1,100 m a.s.l.), suggesting either a migration of multiple foothill gene pools or alternatively a long-term survival with differentiation within a particular valley. Variation partitioning confirmed distinct effects of altitude and geographical position on the genetic differentiation pattern detected along the first PCoA component. In general, we found that P. vulgaris populations in the Caucasus region were genetically structured according to geographical position of valleys and to elevation. Such result was also found for the related Primula elatior, where elevational differences within a valley enabled migration in central European mountains even without loss of genetic (nuclear microsatellite) diversity (Konecna et al., 2019). Lineages with a putative foothill origin supported the concept of potential cryptic glacial refugia in mountain or northern regions for P. elatior (Jurickova et al., 2018; Kempf et al., 2020).
Primula vulgaris populations of the western Carpathian basin (incl. the Dinaric Alps) and Transylvanian Carpathian mountains, which featured similar altitudinal ranges (156–533 m and 163–489 m a.s.l., respectively), were grouped according to their geographic position, most likely due to overall high levels of genetic differentiation and large geographical distances than to altitudinal gradients. Previous studies based on local biogeographic inferences and distribution patterns hypothesized an ‘illiryan–dacian pincer migration’ history in the area, i.e. separate western (‘illiric–noric’) and eastern (‘dacic’) colonization routes from the south to the north along the mountains bordering the Carpathian basin (i.e., the Dinaric-Alps and Alps on the west, and the Transylvanian Carpathians on the east), with a clear demarcation between western (‘illiric–noric’ origin) and eastern (‘dacic’ origin) Slovakian populations (Hendrych, 1996; Varga, 2002; Sramkó, 2004). Thus, the northern Carpathian populations have different colonization histories: the western populations originate from the Dinaric Alps, and the eastern ones from the Transylvanian Carpathians. The genetic structure of P. vulgaris in the central region clearly supports this phylogeographic theory: the PCoA and Structure analysis separated both geographic groups along the first axis, and the un-admixed western Slovakian population (Slk-W1) is markedly separated from the eastern populations.
Genetic differentiation related to IBD and stepwise mutation process was not only found over the entire 3,000 km trajectory, but also regionally, within a few hundred km. Low to moderate genetic differentiation with a significant isolation-by-distance pattern was previously reported for western lowland populations (Van Rossum et al., 2004) and Caucasus mountain populations (Volkova et al., 2021), based on nuclear isozymes and AFLP fingerprinting, respectively. Similarly, we detected short-range genetic differentiation related to allele frequency differences between many populations in all three regions – regardless of the topography. These findings are coherent with the restricted dispersal ability of P. vulgaris. Indeed, forest understory herbs with limited dispersal capacity can contain well-differentiated populations across a continent when they experience stepwise migration (Cain et al., 1998). Many generations are required to spread over great spatial distances, with the occurrence of frequent bottlenecks and of stochastic independent founder events (Willner et al., 2023). Primula vulgaris, like other forest understory herbs with limited dispersal distances (Kramp et al., 2009; Bartha et al., 2015; Urbaniak et al., 2018; Laczkó and Sramkó, 2020), and some tree species (Douda et al., 2014; Mitka et al., 2023; Wahlsteen et al., 2023) may have known several cryptic northwards refugia, giving an opportunity to start their recolonization from less remote areas than southern Mediterranean refugia during the LGM (Willner et al., 2023). Regional populations that bottlenecked in refugia during LGM and thereafter expanded over a greater elevation may leave detectable traces of connectivity. In this regard, the Black Sea coastal region might have acted as a passageway across valley foothills. Indeed, population 832 (at 35 m elevation a.s.l.) shared the same gene pool as populations from the uphill area northwards of Sochi, despite that this population is located further south in another valley (Mzympta River) and nearer to the Black Sea (Figure 1).
Recent demographic and genetic drift processes
The current effective population size (Ne) of P. vulgaris in the Caucasus region was estimated to be nearly 1.3 times larger (Ne = 35,220) than the Carpathian region (Ne = 27,317), and about seven times larger than the western lowland region (Ne = 5,045). This lower Ne suggests that western lowland populations are in a current bottlenecked situation or in the state of recent expansion after founder populations establishment. However, such admittedly large number of several thousand in western lowlands is in a same order of magnitude than the estimated historical bottleneck sizes of western, central and eastern populations (Neb = 3,296, 6,870 and 5,161, respectively). With regard to the species level, we hypothesize that P. vulgaris western populations are currently in a bottlenecked situation, which can be explained by their low allelic richness, and by insufficient time for generating additional alleles through mutations and for renewing input through migration.
Genetic diversity distribution of P. vulgaris across Europe does not consist in a smoothly gradually decreasing longitudinal gradient over 3,000 km from east to west, but in fact strongly declines in the western part of its range. The ‘loss’ of more than half of the allele diversity within the western lowlands compared to the other regions should be regarded as a substantial decline. This could be due to historical founder events during westwards postglacial migration, though it might be also the result from recent bottlenecks, deviating morph ratios and occurrence of remnant populations in small landscape elements within a farmland matrix, thereby limiting seed set and hampering pollen dispersal (Van Rossum and Triest, 2003; Jacquemyn et al., 2009; Van Geert et al., 2010, Van Geert et al., 2014; Barmentlo et al., 2018). Low levels of genetic variation (based on allozymes) in western lowland populations have been previously explained by genetic drift being the main cause of genetic erosion (Van Rossum and Triest, 2003).
In western lowlands, elevation ranged from approximately 3 m to only 24 m a.s.l., but their populations appeared genetically differentiated. These small differences in topography may be ascribed to different ages of landscape appearance, with somewhat higher elevations representing stabilized former dune hills, which can be considered as older forested habitats than the lower elevations corresponding to more recent polder landscape. We may hypothesize from the genetic differentiation patterns revealed by PCoA, variation partitioning and STRUCTURE analysis, that multiple postglacial colonization of lowlands has occurred, during different recent Holocene periods or from different sources. Such an explanation would clearly be in line with the recent arrival of the species, and the high levels of genetic differentiation between the populations predicted at the leading edge (Hampe and Petit, 2005).
Conclusion
Despite limited dispersal ability, P. vulgaris ultimately spread over long distances across European landscapes, either over mountains, hills or lowlands. Species expansion left traces of a combination of several migration events from the Pleistocene and the Holocene. Compared to nuclear ITS or plastid markers, our study using nuclear microsatellites allowed for detecting patterns of fairly recent history in population dynamics. The prevailing current regional patterns of genetic diversity and differentiation in all three European regions refer to the species’ regional expansion during the Holocene following a history of demographic bottlenecks. The young (in terms of species geographic history) western lowland populations still present traces of such bottlenecks, albeit also incurring strong disturbance of contemporary habitat fragmentation causing population decline, whereas central and eastern European populations appear to be much older and have undergone a sufficiently long evolutionary time for accumulation of allele diversification prior to and during the LGM. At regional level, we can highlight the different histories and differentiation processes populations underwent. Large differentiation in western lowlands can be largely attributed to genetic drift and potential multiple colonization, whereas in the central region allele mutations rather than drift explain the geographical structure. In the eastern region, mutational processes of alleles have shaped genetic structure according to both altitude and geographical distance.
Data availability statement
The original contributions presented in the study are included in the article/Supplementary Files, further inquiries can be directed to the corresponding author/s.
Author contributions
LT: Writing – review & editing, Writing – original draft, Visualization, Validation, Supervision, Software, Resources, Project administration, Methodology, Investigation, Funding acquisition, Formal analysis, Data curation, Conceptualization. FV: Writing – review & editing, Writing – original draft, Software, Resources, Methodology, Investigation, Formal analysis, Conceptualization. GS: Writing – review & editing, Visualization, Resources, Methodology, Investigation, Funding acquisition, Conceptualization. TS: Writing – review & editing, Methodology, Investigation. PV: Writing – review & editing, Resources, Methodology, Investigation, Funding acquisition, Conceptualization.
Funding
The author(s) declare financial support was received for the research, authorship, and/or publication of this article. This work was supported by the Vrije Universiteit Brussel (VUB; grant number BAS42). The work of PV was held within the state assignment of IBIW RAS (theme 121051100099-5).
Acknowledgments
The authors sincerely thank Anja Van Geert, Renaat Corthouts, Sofie Fortuin, Tomas Noé and Fiona Pancken, for help during fieldwork in western lowlands; Thierry Cornier (Conservatoire botanique national de Bailleul), the Office National des Forêts (France) and the Ministère de la transition écologique (France) for authorization to collect plant material in Clairmarais (northern France); Jeroen Nachtergaele for authorization (ANB/BL-FF/V21-00098) to collect plant material in Flanders (Belgium); L. Abramova and L. Laczkó for help during fieldwork in the Caucasus and the Carpathian region, respectively and N. Tiunov for providing samples from Abkhazia; and two reviewers for constructive comments on the manuscript.
Conflict of interest
The authors declare that the research was conducted in the absence of any commercial or financial relationships that could be construed as a potential conflict of interest.
Publisher’s note
All claims expressed in this article are solely those of the authors and do not necessarily represent those of their affiliated organizations, or those of the publisher, the editors and the reviewers. Any product that may be evaluated in this article, or claim that may be made by its manufacturer, is not guaranteed or endorsed by the publisher.
Supplementary material
The Supplementary Material for this article can be found online at: https://www.frontiersin.org/articles/10.3389/fevo.2024.1333726/full#supplementary-material
References
Barmentlo S. H., Meirmans P. G., Luijten S. H., Triest L., Oostermeijer J. G. B. (2018). Outbreeding depression and breeding system evolution in small, remnant populations of Primula vulgaris: consequences for genetic rescue. Conserv. Genet. 19, 545–554. doi: 10.1007/s10592-017-1031-x
Bartha L., Sramkó G., Volkova P. A., Surina B., Ivanov A. L., Banciu H. L. (2015). Patterns of plastid DNA differentiation in Erythronium (Liliaceae) are consistent with allopatric lineage divergence in Europe across longitude and latitude. Plant Systematics Evol. 301, 1747–1758. doi: 10.1007/s00606-014-1190-x
Beaumont M. A. (2010). Approximate bayesian computation in evolution and ecology. Annu. Rev. Ecology Evolution Systematics 41, 379–406. doi: 10.1146/annurev-ecolsys-102209-144621
Borcard D., Gillet F., Legendre P. (2011). Numerical ecology with R (New York: Springer), 668. doi: 10.1007/978-1-4419-7976-6
Borcard D., Legendre P. (2002). All-scale spatial analysis of ecological data by means of principal coordinates of neighbour matrices. Ecol. Modeling 153, 51–68. doi: 10.1016/S0304-3800(01)00501-4
Cain M. L., Damman H., Muir A. (1998). Seed dispersal and the Holocene migration of woodland herbs. Ecol. Monogr. 68, 325–347. doi: 10.1890/0012-9615(1998)068[0325:SDATHM]2.0.CO;2
Campagne P., Affre L., Baumel A., Roche P., Tatoni T. (2009). Fine-scale response to landscape structure in Primula vulgaris Huds.: does hedgerow network connectedness ensure connectivity through gene flow? Population Ecol. 51, 209–219. doi: 10.1007/s10144-008-0124-2
Chapuis M. P., Estoup A. (2007). Microsatellite null alleles and estimation of population differentiation. Mol. Biol. Evol. 24, 621–631. doi: 10.1093/molbev/msl191
Cheddadi R., Vendramin G. G., Litt T., François L., Kageyama M., Lorentz S., et al. (2006). Imprints of glacial refugia in the modern genetic diversity of Pinus sylvestris. Global Ecol. Biogeography 15, 271–282. doi: 10.1111/j.1466-822X.2006.00226.x
Collin F.-D., Durif G., Raynal L., Gautier M., Vitalis R., Lombaert E., et al. (2021). Extending Approximate Bayesian Computation with Supervised Machine Learning to infer demographic history from genetic polymorphisms using DIYABC Random Forest. Mol. Ecol. Resour. 21, 2598–2613. doi: 10.1111/1755-0998.13413
Culling M. A., Janko K., Boron A., Vasil’ev V. P., Cote I. M., Hewitt G. M. (2006). European colonization by the spined loach (Cobitis taenia) from Ponto-Caspian refugia based on mitochondrial DNA variation. Mol. Ecol. 15, 173–190. doi: 10.1111/j.1365-294X.2005.02790.x
Douda J., Doudova J., Drasnaarova A., Kunes P., Hadincova V., Krak K., et al. (2014). Migration patterns of subgenus Alnus in Europe since the Last Glacial Maximum: a systematic review. PlosOne 9, e88709. doi: 10.1371/journal.pone.0088709
Earl D. M., vonHoldt B. M. (2012). STRUCTURE HARVESTER: a website and program for visualizing STRUCTURE output and implementing the Evanno method. Conserv. Genet. Resour. 4, 359–361. doi: 10.1007/s12686-011-9548-7
Evanno G., Regnaut S., Goudet J. (2005). Detecting the number of clusters of individuals using the software STRUCTURE: a simulation study. Mol. Ecol. 14, 2611–2620. doi: 10.1111/j.1365-294X.2005.02553.x
Excoffier L., Laval G., Schneider S. (2005). Arlequin ver. 3.0: An integrated software package for population genetics data analysis. Evolutionary Bioinf. Online 1, 47–50. doi: 10.1177/117693430500100003
Feurdean A., Bhagwat S. A., Willis K. J., Birks H. J. B., Lischke H., Hickler T. (2013). Tree migration-rates: narrowing the gap between inferred post-glacial rates and projected rates. PlosOne 8, e71797. doi: 10.1371/journal.pone.0071797
Goudet J. (2001). FSTAT version 2.9.3: a program to estimate and test gene diversities and fixation indices (update from version 1.2, Goudet 1995): a computer program to calculate F-statistic. J. Heredity 86, 485–486. doi: 10.1093/oxfordjournals.jhered.a111627
Grimm G. W., Denk T. (2014). The Colchic region as refuge for relict tree lineages: cryptic speciation in field maples. Turkish J. Bot. 38, 3. doi: 10.3906/bot-1403-87
Hampe A., Petit R. J. (2005). Conserving biodiversity under climate change: the rear edge matters. Ecol. Lett. 8, 461–467. doi: 10.1111/j.1461-0248.2005.00739.x
Hardy O. J., Charbonnel N., Fréville H., Heuertz M. (2003). Microsatellite allele sizes: A simple test to assess their significance on genetic differentiation. Genetics 163, 1467–1482. doi: 10.1093/genetics/163.4.1467
Hardy O. J., Vekemans X. (2002). SPAGeDi: a versatile computer program to analyse spatial genetic structure at the individual or population levels. Mol. Ecol. Notes 2, 618–620. doi: 10.1046/j.1471-8286.2002.00305.x
Hegi G. (1975). Illustrierte Flora von Mitteleuropa. 5 Band, 3 Teil: Dicotyledons (Pirolaceae-Verbenaceae), 2nd edn. (Berlin: P Parey).
Hendrych R. (1996). Primula vulgaris in der Slowakei und in den umliegenden Gebieten. Preslia 68, 135–156.
Hewitt G. M. (1999). Post-glacial re-colonization of European biota. Biol. J. Linn. Soc. 68, 87–112. doi: 10.1111/bij.1999.68.issue-1-2
Hewitt G. (2000). The genetic legacy of the Quaternary ice ages. Nature 405, 907–913. doi: 10.1038/35016000
Hewitt G. M. (2004). The structure of biodiversity – insights from molecular phylogeography. Front. Zoology 1, 4. doi: 10.1186/1742-9994-1-4
Hu Q. (1994). On the geographical distribution of the Primulaceae. J. Trop. Subtropical Bot. 2, 1–14.
Jacquemyn H., Endels P., Brys R., Hermy M., Woodell S. R. J. (2009). Biological Flora of the British Isles: Primula vulgaris Huds. (P. acaulis (L.) Hill). J. Ecol. 97, 812–833. doi: 10.1111/j.1365-2745.2009.01513.x
Jurickova L., Pokorny P., Hosek J., Horackova J., Kveton J., Zahajska P., et al. (2018). Early postglacial recolonisation, refugial dynamics and the origin of a major biodiversity hotspot. A case study from the Mala Fatra mountains, Western Carpathians, Slovakia. Holocene 28, 583–594. doi: 10.1177/0959683617735592
Kempf M., Zarek M., Paluch J. (2020). The pattern of genetic variation, survival and growth in the Abies alba Mill. population within the introgression zone of two refugial lineages in the Carpathians. Forests 11, 849. doi: 10.3390/f11080849
Khan S., Shaheen H., Aziz S., Nasar S. (2021). Diversity and distribution of Genus Primula in Kashmir region: an indicator genus of the western Himalayan mountain wetlands and glacial forelands. Biodiversity Conserv. 30, 1673–1688. doi: 10.1007/s10531-021-02163-1
Konecna V., Nowak M. D., Kolar F. (2019). Parallel colonization of subalpine habitats in the central European mountains by Primula elatior. Sci. Rep. 9. doi: 10.1038/s41598-019-39669-2
Kramp K., Huck S., Niketic M., Tomovic G., Schmitt T. (2009). Multiple glacial refugia and complex postglacial range shifts of the obligatory woodland plant Polygonatum verticillatum (Convallariaceae). Plant Biol. 11, 392–404. doi: 10.1111/j.1438-8677.2008.00130.x
Laczkó L., Sramkó G. (2020). Hepatica transsilvanica Fuss (Ranunculaceae) is an allotetraploid relict of the Tertiary Flora in Europe – molecular phylogenetic evidence. Acta Societatis Botanicae Poloniae 89, e8934. doi: 10.5586/asbp.8934
Larson D. A., Chanderbali A. S., Maurin O., Gonçalves D. J. P., Dick C. W., Soltis D. E., et al. (2023). The phylogeny and global biogeography of Primulaceae based on high-throughput DNA sequence data. Mol. Phylogenet. Evol. 182, 107702. doi: 10.1016/j.ympev.2023.107702
Levin S. A., Muller-Landau H. C., Nathan R., Chave J. (2003). The ecology and evolution of seed dispersal: A theoretical perspective. Annu. Rev. Ecol. Evol. Systematics 34, 575–604. doi: 10.1146/annurev.ecolsys.34.011802.132428
Li Y. L., Liu J. X. (2018). StructureSelector: A web based software to select and visualize the optimal number of clusters using multiple methods. Mol. Ecol. Resour. 18, 176–177. doi: 10.1111/1755-0998.12719
Luikart G., Ryman N., Tallmon D. A., Schwartz M. K., Allendorf F. W. (2010). Estimation of census and effective population sizes: the increasing usefulness of DNA-based approaches. Conserv. Genet. 11, 355–373. doi: 10.1007/s10592-010-0050-7
Magri D., Vendramin G. G., Comps B., Dupanloup I., Geburek T., Gömöry D., et al. (2006). A new scenario for the Quaternary history of European beech populations: palaeobotanical evidence and genetic consequences. New Phytol. 171, 199–221. doi: 10.1111/j.1469-8137.2006.01740.x
Magyari E. K., Chapman J. C., Passmore D. G., Allen J. R. M., Huntley J. P., Huntley B. (2010). Holocene persistence of wooded steppe in the Great Hungarian Plain. J. Biogeography 37, 915–935. doi: 10.1111/j.1365-2699.2009.02261.x
Mast A. R., Kelso S., Richards A. J., Lang J., Feller M. S., Conti E. (2001). Phylogenetic relationships in Primula L. and related genera (Primulaceae) based on noncoding chloroplast DNA. Int. J. Plant Sci. 162, 1381–1400. doi: 10.1086/323444
Meusel H., Jäger E., Rauschert S., Weinert E. (1978). Vergleichende chorologie der zentraleuropäischen flora (Jena: Gustav Fischer Verlag).
Migliore J., Baumel A., Leriche A., Juin M., Medail F. (2018). Surviving glaciations in the Mediterranean region: an alternative to the long-term refugia hypothesis. Botanical J. Linn. Soc. 187, 537–549. doi: 10.1093/botlinnean/boy032
Mitka J., Bąba W., Szczepanek K. (2014). Putative forest glacial refugia in the Western and Eastern Carpathians. Modern Phytomorphology 5, 85–92. doi: 10.5281/zenodo.161009
Mitka J., Wróblewska A., Boroń P., Kucharzyk S., Stachurska-Swakoń A. (2023). Perhaps there were northern refugia in LGM? The phylogeographic structure of the thermophilic tree Carpinus betulus in the Carpathian region. Sci. Total Environ. 905, 167214. doi: 10.1016/j.scitotenv.2023.167214
Mix A. C., Bard E., Schneider R. (2001). Environmental processes of the ice age: land, oceans, glaciers (EPILOG). Quaternary Sci. Rev. 20, 627e657. doi: 10.1016/S0277-3791(00)00145-1
Oksanen J., Simpson G. L., Blanchet F. G., Kindt R., Legendre P., Minchin P. R., et al. (2022) Vegan: Community Ecology Package. R package version 2.6-4. Available online at: https://CRAN.R-project.org/package=vegan.
Peakall R., Smouse P. E. (2012). GenAlEx 6.5: genetic analysis in Excel. Population genetic software for teaching and research – an update. Bioinformatics 28, 2537–2539. doi: 10.1093/bioinformatics/bts460
Pearson R. G. (2006). Climate change and the migration capacity of species. Trends Ecol. Evol. 21, 111–113. doi: 10.1016/j.tree.2005.11.022
Petit R. J., Aguinagalde I., de Beaulieu J. L., Bittkau C., Brewer S., Cheddadi [. R., et al. (2003). Glacial refugia: hotspots but not melting pots of genetic diversity. Science 300, 1563–1565. doi: 10.1126/science.1083264
Pritchard J. K., Stephens M., Donelly P. S. (2000). Inference of population structure using multilocus genotype data. Genetics 155, 945–959. doi: 10.1093/genetics/155.2.945
Puechmaille S. J. (2016). The program structure does not reliably recover the correct population structure when sampling is uneven: subsampling and new estimators alleviate the problem. Mol. Ecol. Resour. 16, 608–627. doi: 10.1111/1755-0998.12512
Core Team R. (2023). R: A language and environment for statistical computing. (Vienna, Austria: R Foundation for Statistical Computing). Available at: https://www.R-project.org/.
Ren G. P., Mateo R. G., Liu J. Q., Suchan T., Alvarez N., Guisan A., et al. (2017). Genetic consequences of Quaternary climatic oscillations in the Himalayas: Primula tibetica as a case study based on restriction site-associated DNA sequencing. New Phytol. 213, 1500–1512. doi: 10.1111/nph.14221
Rose J. P., Kleist T. J., Löfstrand S. D., Drew B. T., Schönenberger J., Sytsma K. J. (2018). Phylogeny, historical biogeography, and diversification of angiosperm order Ericales suggest ancient Neotropical and East Asian connections. Mol. Phylogenet. Evol. 122, 59–79. doi: 10.1016/j.ympev.2018.01.014
Schmidt-Lebuhn A. N., de Vos J. M., Keller B., Conti E. (2012). Phylogenetic analysis of Primula section Primula reveals rampant non-monophyly among morphologically distinct species. Mol. Phylogenet. Evol. 65, 23–34. doi: 10.1016/j.ympev.2012.05.015
Sramkó G. (2004). “Dunántúli” közép-dunai flóraválasztós fajok a Matricum flórájában [“Transdanubian” species in the Matricum flora district (N-Hungary)]. Kitaibelia 9, 31–56.
Stankiewicz K. H., Vasquez Kuntz K. L., Group C. M., Baums I. B. (2022). The impact of estimator choice: Disagreement in clustering solutions across K estimators for Bayesian analysis of population genetic structure across a wide range of empirical data sets. Mol. Ecol. Resour. 22, 1135–1148. doi: 10.1111/1755-0998.13522
Strong W. L. (2023). Potential late glacial maximum refugial areas of Alaska-Yukon postglacial migrant plants. Vegetation History Archaeobotany 32, 35–48. doi: 10.1007/s00334-022-00874-1
Stubbs R. L., Theodoridis S., Mora-Carrera E., Keller B., Yousefi N., et al. (2023). Whole-genome analyses disentangle reticulate evolution of primroses in a biodiversity hotspot. New Phytol. 237, 656–671. doi: 10.1111/nph.18525
Svenning J. C., Skov F. (2007). Could the tree diversity pattern in Europe be generated by postglacial dispersal limitation? Ecol. Lett. 10, 453–460. doi: 10.1111/j.1461-0248.2007.01038.x
The Galaxy Community (2022). The Galaxy platform for accessible, reproducible and collaborative biomedical analyses: 2022 update. Nucleic Acids Res. 50, W345–W351. doi: 10.1093/nar/gkac247
Triantafyllidis A., Krieg F., Cottin C., Abatzopoulos T. J., Triantaphyllidis C., Guyomard R. (2002). Genetic structure and phylogeography of European catfish (Silurus glanis) populations. Mol. Ecol. 11, 1039–1055. doi: 10.1046/j.1365-294X.2002.01501.x
Triest L., Sierens T., Van Rossum F. (2015). Multiplexing 15 microsatellite loci for European primrose (Primula vulgaris). Conserv. Genet. Resour. 7, 279–281. doi: 10.1007/s12686-014-0357-7
Urbaniak J., Kwiatkowski P., Ronikier M. (2018). Postglacial history and current population genetic diversity of a central-European forest plant Hacquetia epipactis. Preslia 90, 39–57. doi: 10.23855/preslia.2018.039
Valverde T., Silvertown J. (1995). Spatial variation in the seed ecology of a woodland herb (Primula vulgaris) in relation to light environment. Funct. Ecol. 9, 942–950. doi: 10.2307/2389993
Van Geert A., Triest L., Van Rossum F. (2014). Does the surrounding matrix influence corridor effectiveness for pollen dispersal in farmland? Perspect. Plant Ecology Evol. Systematics 16, 180–189. doi: 10.1016/j.ppees.2014.05.004
Van Geert A., Van Rossum F., Stiers I., Sierens T., Barker J., Triest L. (2006). Isolation and characterization of microsatellite loci in primrose (Primula vulgaris). Belgian J. Bot. 139, 261–264. Available at: https://www.jstor.org/stable/20794614.
Van Geert A., Van Rossum F., Triest L. (2010). Do linear landscape elements in farmland act as biological corridors for pollen dispersal? J. Ecol. 98, 178–187. doi: 10.1111/j.1365-2745.2009.01600.x
Van Geert A., Van Rossum F., Triest L. (2015). Perspectives for genetic rescue of the extremely fragmented Primula vulgaris populations in The Netherlands: reflecting the future of Belgian populations? Plant Ecol. Evol. 148, 329–334. doi: 10.5091/plecevo.2015.1101
Van Rossum F., Campos de Sousa S., Triest L. (2004). Genetic consequences of habitat fragmentation in an agricultural landscape on the common Primula veris, and comparison with its rare congener, P. vulgaris. Conserv. Genet. 5, 231–245. doi: 10.1023/B:COGE.0000030007.85492.70
Van Rossum F., Triest L. (2003). Spatial genetic structure and reproductive success in fragmented and continuous populations of Primula vulgaris. Folia Geobotanica 38, 239–254. doi: 10.1007/BF02803196
Varga Z. (2002). Biodiversity and phylogeography – general and regional aspects. Acta Biologica Debrecina 24, 5–38.
Voisin C., Dentant C., Rioux D., Boucher F. C. (2023). Introgression of an isolated Primula lineage suggests the existence of a glacial refugium in the Écrins range (Southwestern French Alps). Alpine Bot. 133, 21–33. doi: 10.1007/s00035-022-00288-9
Volkova P. A., Bog M., Zablocka B., Oberprieler C. (2021). Elevation does not matter? Genome screening using AFLP fails to reveal selection along elevational transects: a case study of Caucasus Primula vulgaris Huds. (Primulaceae). Flora 274, 151726. doi: 10.1016/j.flora.2020.151726
Volkova P. A., Laczkó L., Demina O., Schanzer I., Sramkó G. (2020). Out of Colchis: the colonization of Europe by Primula vulgaris Huds. (Primulaceae). Acta Societatis Botanicorum Poloniae 89, 89313. doi: 10.5586/asbp.89313
Volkova P. A., Schanzer I. A., Meschersky I. V. (2013). Colour polymorphism in common primrose (Primula vulgaris Huds.): many colours-many species? Plant Systematics Evol. 299, 1075–1087. doi: 10.1007/s00606-013-0780-3
Volkova P. A., Schanzer I. A., Soubani E., Meschersky I. G., Widén B. (2016). Phylogeography of the European rock rose Helianthemum nummularium s.l. (Cistaceae): western richness and eastern poverty. Plant Systematics Evol. 302, 781–794. doi: 10.1007/s00606-016-1299-1
Wahlsteen E., Avramidou E. V., Bozic G., Mediouni R. M., Schuldt B., Sobolewska H. (2023). Continental-wide population genetics and post-Pleistocene range expansion in field maple (Acer campestre L.), a subdominant temperate broadleaved tree species. Tree Genet. Genomes 19, 15. doi: 10.1007/s11295-023-01590-1
Willner W., Wessely J., Gattringer A., Moser D., Zaveska E., Dullinger S., et al. (2023). Post-glacial range formation of temperate forest understorey herbs - Insights from a spatio-temporally explicit modelling approach. Global Ecol. Biogeography 32, 1046–1058. doi: 10.1111/geb.13677
Xie X.-F., Yan H.-F., Wang F.-Y., Ge X.-J., Hu C.-M., Hao G. (2012). Chloroplast DNA phylogeography of Primula ovalifolia in central and adjacent southwestern China: Past gradual expansion and geographical isolation. J. Syst. Evol. 50, 284–294. doi: 10.1111/j.1759-6831.2012.00204.x
Yamamoto M., Takahashi D., Horita K., Setoguchi H. (2020). Speciation and subsequent secondary contact in two edaphic endemic primroses driven by Pleistocene climatic oscillation. Heredity 124, 93–107. doi: 10.1038/s41437-019-0245-8
Yan H.-F., Liu Y.-J., Xie X.-F., Zhang C.-Y., Hu C.-M., Hao G., et al. (2015). DNA barcoding evaluation and its taxonomic implications in the species-rich genus Primula L. in China. PloS One 10, e0122903. doi: 10.1371/journal.pone.0122903
Keywords: phylogeography, microsatellites, genetic structure, cryptic glacial refugia, approximate bayesian computation, bottleneck
Citation: Triest L, Van Rossum F, Sramkó G, Sierens T and Volkova P (2024) Over the hills and far away: phylogeography and demographic migration history of a dispersal-restricted primrose (Primula vulgaris). Front. Ecol. Evol. 12:1333726. doi: 10.3389/fevo.2024.1333726
Received: 05 November 2023; Accepted: 29 March 2024;
Published: 17 April 2024.
Edited by:
Rosane Garcia Collevatti, Universidade Federal de Goiás, BrazilReviewed by:
Daniele De Luca, Anton Dohrn Zoological Station Naples, ItalyJun-Wei Ye, Chinese Academy of Sciences (CAS), China
Copyright © 2024 Triest, Van Rossum, Sramkó, Sierens and Volkova. This is an open-access article distributed under the terms of the Creative Commons Attribution License (CC BY). The use, distribution or reproduction in other forums is permitted, provided the original author(s) and the copyright owner(s) are credited and that the original publication in this journal is cited, in accordance with accepted academic practice. No use, distribution or reproduction is permitted which does not comply with these terms.
*Correspondence: Ludwig Triest, ltriest@vub.be;ludwig.triest@ulb.be