Sonotope patterns within a mountain beech forest of Northern Italy: a methodological and empirical approach
 Almo Farina
 Timothy C. Mullet
- 1Department of Pure and Applied Sciences, Urbino University, Urbino, Italy
- 2Kenai Fjords National Park, U.S. National Park Service, Seward, AK, United States
According to the Sonotope Hypothesis, the heterogenous nature of the acoustically sensed, but not yet interpreted, environmental sounds (i.e., sonoscape) is created by the spatial and temporal conformation of sonic patches (sonotopes) as recently been described in a Mediterranean rural landscape. We investigated the Sonotope Hypothesis in a mountain beech forest of the Northern Apennines, Italy that is notoriously poor in soniferous species. Our aim was to test whether sonotopes were temporally distinct over seasonal and astronomical timeframes and spatially configured in relation to vegetation variables. We used the Acoustic Complexity Index (ACItf) to analyze the heterogeneity of sonic information gathered from an array of 11 sound recorders deployed within a lattice of eleven 4-ha hexagonal sample sites distributed throughout a 48-ha managed beech forest. We visualized and described the temporal patterns of ACItf between seasons (May–June and July–August 2021), across six astronomical periods (Night I, Morning Twilight, Morning, Afternoon, Evening Twilight, and Night II), and according to two aggregated frequency classes (≤2000 and >2000 Hz). We introduced Spectral Sonic Signature (SSS) calculated from the sequence of ACItf values along frequency bins as a descriptor of the dynamic production of sounds across spatial and temporal scales. We calculated Mean Spectral Dissimilarity to compare SSS values across temporal periods and between sample sites. We identified sonotopes by grouping similar SSS for each sample site generated from cluster analyses and visualized their spatial arrangements. Frequencies ≤2000 Hz (mainly geophonies from wind and rain) were more prevalent than frequencies >2000 Hz (mainly biophonies from songbirds). Despite there being no strong relationship to vegetation variables and minimal biophony and anthropophony, distinct sonotopes still emerged for every astronomical and seasonal period. This suggests that the sonoscape expresses distinct spatial and temporal sonotope configurations associated with the temporal and spatial patterns of geophysical events that generate geophonies with minimal animal or anthropogenic occurrences. A new strategy based on the reintroduction of indigenous trees and shrubs in managed clearings should be considered for enhancing local biodiversity conservation along with ecoacoustic monitoring based on the Sonotope Hypothesis.
1 Introduction
Vibrations generated from geophysical, biological, and/or anthropogenic activities that occur within a distinct location are inherently ambiguous without a receiver. The spatial and temporal domain of these ambiguous vibrations can be referred to as the vibroscape, derived from the Latin word “vibratio” (meaning trembling motion) and the Middle Dutch word “scap”(or ship, meaning condition or quality) (https://www.etymonline.com/). A receiver, such as an organism or microphone, possess specialized organs or mechanisms that can sense or detect these vibrations as sound waves. In this way a vibroscape becomes an acoustically sensed sonic field or sonoscape, referencing the Latin word “sonus” (meaning sound). Through neurological (or computer) processes, the sonoscape is decoded and interpreted into categories of sounds where the emergence of meaning is formed (Farina and Villa, 2023). The interpreted sonoscape is unique to every individual organism based on their unique sensitivity, mechanisms, abilities, and experiences to detect and interpret sound. In this way, the physical vibrations of a male European robin (Erithacus rubecula) syrinx can be sensed by the hearing organs of another robin and is subsequently interpreted as a distinct song that possesses meaning to regarding health, territory, etc. These emergent properties and their terminology are explained further by Farina and Li (2022), p. 12.
Following the Ecoacoustics Theory (Farina and Gage, 2017), a sonoscape can be partitioned into sonotopes (Hedfors, 2004; Farina, 2014; Matsinos and Tsaligopoulos, 2018; Farina et al., 2023) as spatially distinct sonic patches much like the patchwork of geobotanical geophysical features of a landscape possesses ecotopes (Zonneveld, 1972; Whittaker et al., 1975). Recently, we published the first empirical evidence supporting the Sonotope Hypothesis (Farina et al., 2023). The significance of this work was not simply the revelation of sonotopes through the scientific process, but also the discovery that sonotopes exhibit dynamic compositions and spatial arrangements depending on a daily astronomical period and seasonal time of year (Farina et al., 2023).
Although we had identified acoustic communities (Farina and James, 2016) as an important contributor to the temporal and spatial shifts displayed by sonotopes, we did not find a measurably relevant relationship between sonotope patterns and the landcover types. In that landscape, the distribution of vegetation cannot be distinguished into patches and matrices (Farina et al., 2023), a configuration, commonly found in rural landscapes across the Mediterranean (Vos, 1993), and defined by Addicott et al. (1987) as “undivided heterogeneity”.
It is not surprising given that soniferous species composition can exhibit differential responses to landscape heterogeneity making a direct link to landcover type unclear (Herrando et al., 2003). Soniferous species that occupy landscapes with heterogeneous land uses are often those adapted to utilizing an assorted mosaic of landcover types (Morgan and Gates, 1982; Berg and Pärt, 1994; Berg, 2002). However, it is often the case that vegetation structure is a more important characteristic of the landscape for species richness and acoustic diversity than any particular landcover type (Moskát, 1988; Pekin et al., 2012; Schall et al., 2018; Basile et al., 2021). More than likely, the complex vegetation structure of the rural terraced systems we had studied (Farina et al., 2023) was the important land feature contributing to the heterogeneous arrangements of the sonotopes.
Building on the Sonoscape Hypothesis, we propose that the relationship between the sonic environment and vegetation may be scalable. For instance, we know that the three components of decoded sonoscape: geophony, biophony, and technophony, have been linked to specific landcover types at large spatial scales (Joo et al., 2011; Mullet et al., 2016; Quinn et al., 2022). Moreover, the structure of vegetation plays an important role in the sonic and spatial patterns of acoustic communities (Farina et al., 2015; Do Nascimento et al., 2020; Dröge et al., 2021) that in turn influence the temporal patterns and spatial configuration of sonotopes (Farina et al., 2023). Therefore, it is reasonable to assume that the emergent properties of sonotopes may behave similarly to the way species with small home ranges are largely influenced by local-scale habitat structure and species with large home ranges are affected by broader landscape patterns (Forsman et al., 1984; Rolstad, 1991; Andren, 1994). This deduction could explain how vegetation and acoustic communities influence the expression of sonotopes.
However, we must also take into consideration the close relationship sonotopes have with seasons and with daily astronomical periods (Farina et al., 2023). Specifically, we have documented, in the Mediterranean region, that sonotope dynamics are closely associated with shifts in acoustic community species composition between seasons (e.g., spring: bird choruses, late summer and fall: insect stridulations) and differences in activity patterns during astronomical periods (e.g., diurnal bird choruses, crepuscular, and nocturnal insect stridulations) (Farina et al., 2023). Consequently, it is important for the temporal characteristics of sonotopes to be measured along with vegetation to understand the relationships of these dynamic sonic phenomena.
To reveal a patchwork of sonic heterogeneity, Farina et al. (2023) purposefully selected their study area to have a heterogenous landcover with diverse acoustic communities. We set out to continue this work with the intention to investigate if Sonotope Hypothesis could be applied in a study area with homogeneous landcover and low acoustic community diversity. If so, we would expect sonotopes to be associated spatially with the local vegetation structure and temporally by the sounds from the geophysical environment (e.g., wind, rain) between seasons and astronomical periods. Results from testing these conditions would empirically contribute to a better understanding of the Sonotope Hypothesis and provide some explanatory evidence of why sonotopes display dynamic spatial and temporal patterns, opening an unexplored field in ecoacoustics research (Figure 1).
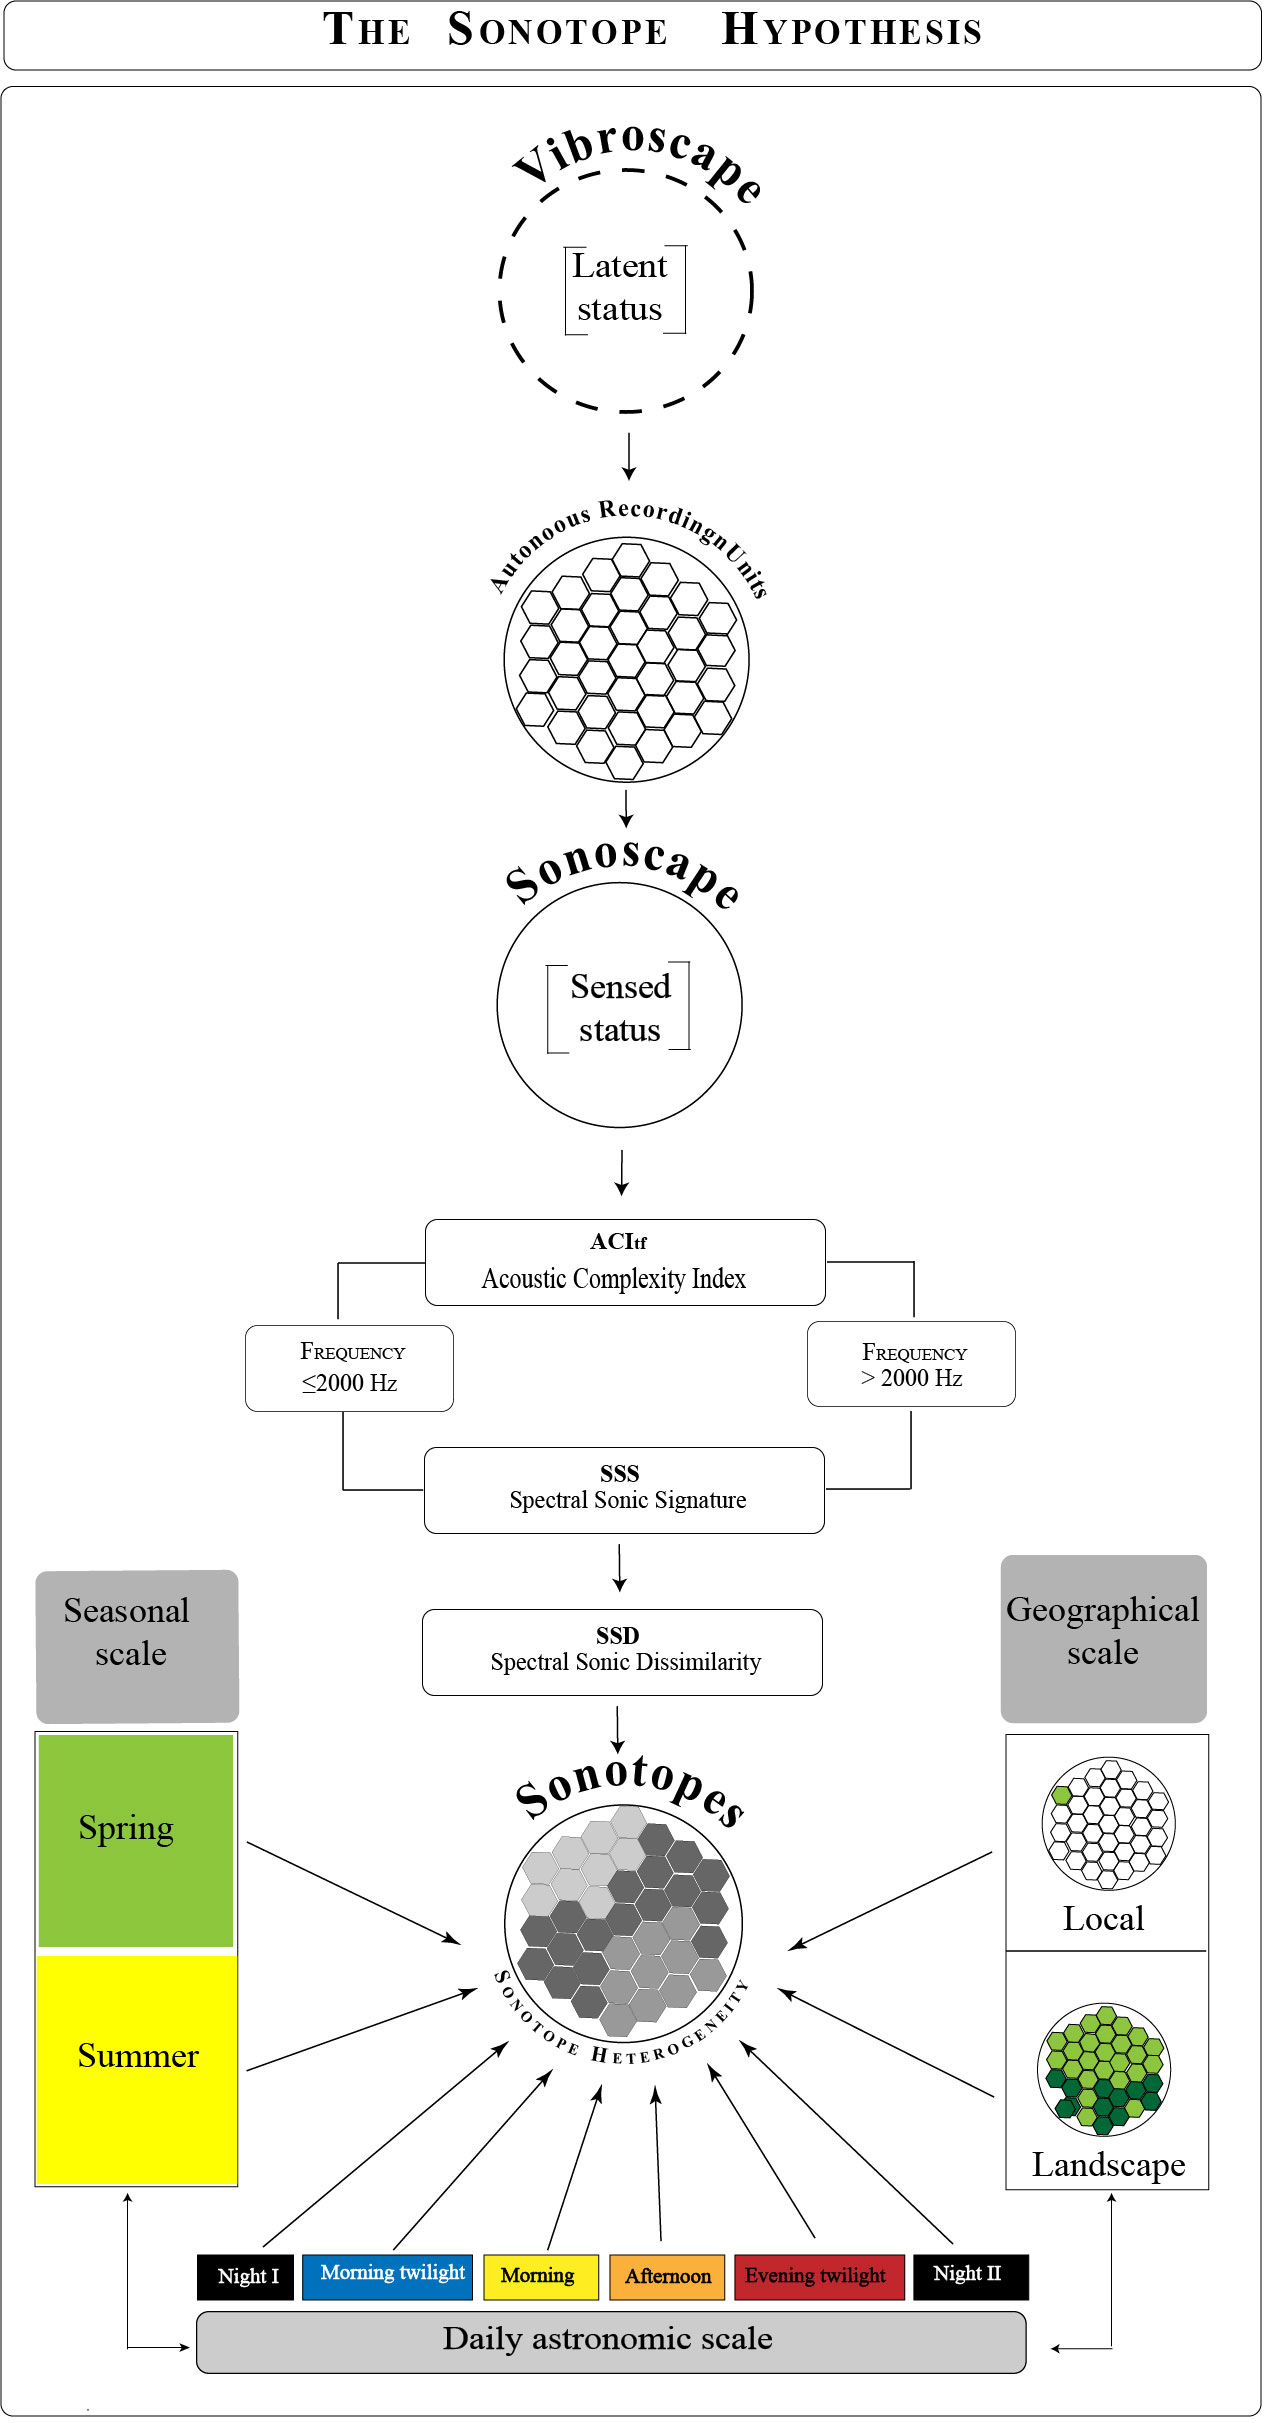
Figure 1 Conceptual framework of the “Sonotope hypothesis”. The vibroscape in its latent status is sampled with a spatial arrangement of Autonomous Recording Units that detect sonic information, transforming it into a sensed status or Sonoscape. The computation of the Acoustic Complexity Index as the Spectral Sonic Signature and the derivative Spectral Sonic Dissimilarity, partitioned into two frequency classes (≤2000, >2000 Hz), are analyzed temporally at seasonal and daily astronomic scales and spatially at local and landscape scales.
2 Materials and methods
2.1 Study area
We conducted our study in a forest of European beech (Fagus sylvatica L.) located in the Tosco-Emiliano Apennines National Park of the Ventasso municipality, Northern Tuscany, Italy (44°18’12” North; 10°13’10” East) (average elevation: 1300 m above sea level) (Figure 2). This beech forest grows along the slopes of the Northern Apennines range on a moraine system of coarse-grained sandstone of the “Macigno” formation dating back to the late Oligocene and early Miocene (Baroni et al., 2018) and deposited during the last glaciation. Geologic characteristics also include an upper Triassic chalk formation (Madonia and Forti, 2003; Puccinelli et al., 2015) that exhibits karstic depressions or “dolines”, occupied by ephemeral bogs and lakes like the Pranda Lake (Federici per. com., Carminati et al., 2013) at the border of the study area. In contrast to the heterogeneous patchwork of rural vegetation that occurs at lower elevations, the beech forest of the Northern Apennines is homogenous and extensive along a mountain belt from 1200 to 1825 m above sea level (Pezzi et al., 2007; Pezzi et al., 2008).
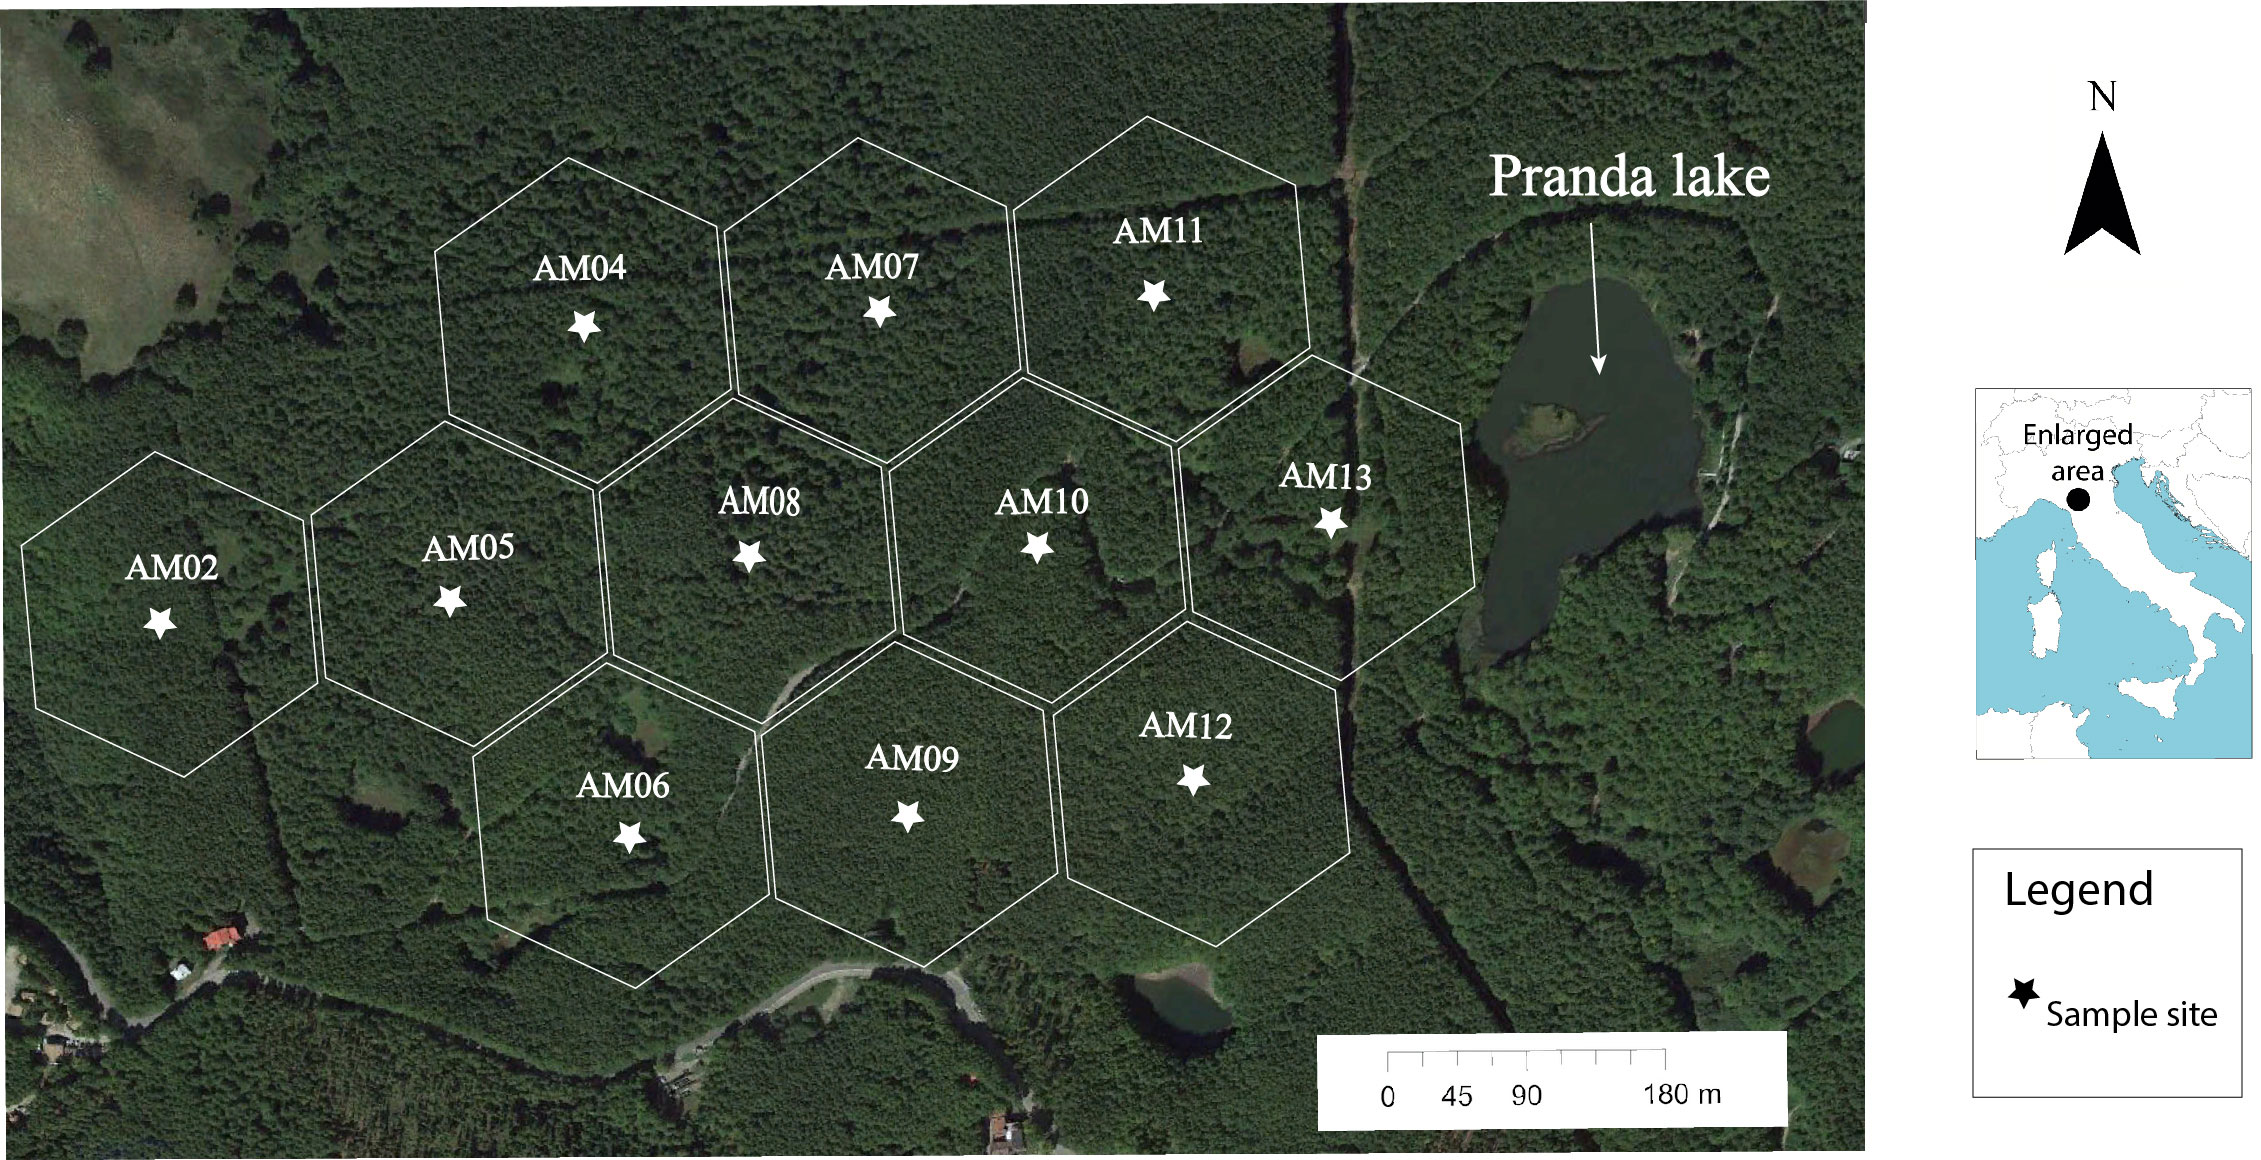
Figure 2 Spatial distribution of eleven 4-ha sample cells and placement of sound recording sample sites.
Although in the recent past Fagus sylvatica stands were intensively used to charcoal production, the forest management policy of Tosco-Emiliano Apennines National Park today focuses on the retention of the oldest trees for the eventual conversion of stands into old-growth (Coppini and Hermanin, 2007; Nocentini, 2009). Fagus sylvatica is the dominant tree species due to the selective cutting in the past of species that are less adapt to charcoal production like Acer pseudoplatanus L., Sorbus aucuparia L., Laburnum alpinum Mill. and Abies alba Mill (Nocentini, 2009; Benatti et al., 2018).
The forest is characterized by a dense, uniform canopy approximately 15–20 m above the forest floor that prevents the growth of herbs and forbs, creating a blanket understory of leaf litter. However, because selective cutting is not spatially or temporally uniform, some parts of the forest exhibit stands of even-aged trees nearly devoid of understory vegetation while other areas have been left fallow, resulting in a recruitment of Fagus sylvatica shrubs and stands of uneven-aged trees.
Temperatures in the region range from 1.7–7.3°C ( = 12.36°C, = 5.36; May–June) and 7.5–27.9°C ( = 17.05°C, = 4.70; July–August). There are more days of precipitation in May ( = 11.52 days, = 17.95) than July ( = 1.68 days, = 4.03) and August ( = 2.45 days, = 5.65), with June having the fewest days of precipitation ( = 0.57 days, = 1.86).
2.2 Site selection and sound sampling
We selected the study site specifically to test the hypothesis that sonotopes that are present in a homogeneous landcover type with low acoustic community diversity will be spatially associated with local vegetation structure and temporally with variable sonic events of the geophysical environment (e.g., wind, rain) between seasons and astronomical periods. Therefore, we selected a study site that had the homogenous landcover type of beech forest but also possessed differential vegetation structures and known low songbird diversity (Farina, pers. com). Following methods applied by Farina et al. (2023) and Farina and Li (2022), pp 22–25, using satellite imagery from GoogleEarth™ (Google LLC, Mountain View, California, USA), we opted for a 48-ha rectangular area west of Pranda Lake. We then overlaid eleven 4-ha hexagonal cells as a framework for ensuring spatial independence of sample sites (Figure 2). The hexagon geometry is extensively used in modeling the neighborhoods in a raster grid (Holland et al., 2007). We placed a point in the center of each hexagon, spaced 180 m apart, and located these points with a GPS in the field.
We deployed 11 AudioMoth recorders (AM) (version 1.2.0) (Hill et al., 2019) within 10 m of pre-assigned coordinates, depending on the location of suitable sites, and mounted at 1.2 m above the ground on the trunks of trees. We programmed recorders to sample the ambient sonic environment, at a sample rate of 32,000 Hz with medium-low microphone gain (28.7 db) (Hill et al., 2019). We scheduled recorders to run for 5 minutes, pausing for 60 seconds between recordings, over a 24-h period, totaling 240 files a day saved in WAV audio format. We sampled over the seasonal periods of spring to summer (01 May–30 June) and late summer (01 July–27 August) of 2021.
2.3 Vegetation sampling
We sampled vegetation on June 2021 when trees and shrubs had full leaf development. Vegetation characteristics were collected along four transects (50 m x 3.40 m each) that extended linearly in the North, South, East, West direction from each recording station following a standard sampling procedure (Mueller-Dombois and Ellenberg, 1974). We counted the number of all living and dead trees that had a diameter at breast height (dbh) ≥3 cm along each transect. We measured the dbh for all counted trees (Supplementary Table 1). We estimated the percent canopy cover every 5 m using Canopy Cover Free App (Easlon and Bloom, 2014) and percent ground cover every 10 m using the Canopeo App (Oklahoma State University) (Patrignani and Ochsner, 2015; Shepherd et al., 2018). We measured the height of 10 randomly selected trees located within a 50-m radius from each recording device using the Alboreal Tree App (www.arboreal.se) (Team, 2022). A detailed description of vegetation parameters is illustrated in Supplementary Tables 1, 2. Figure 3A shows panoramic images of each recording station.
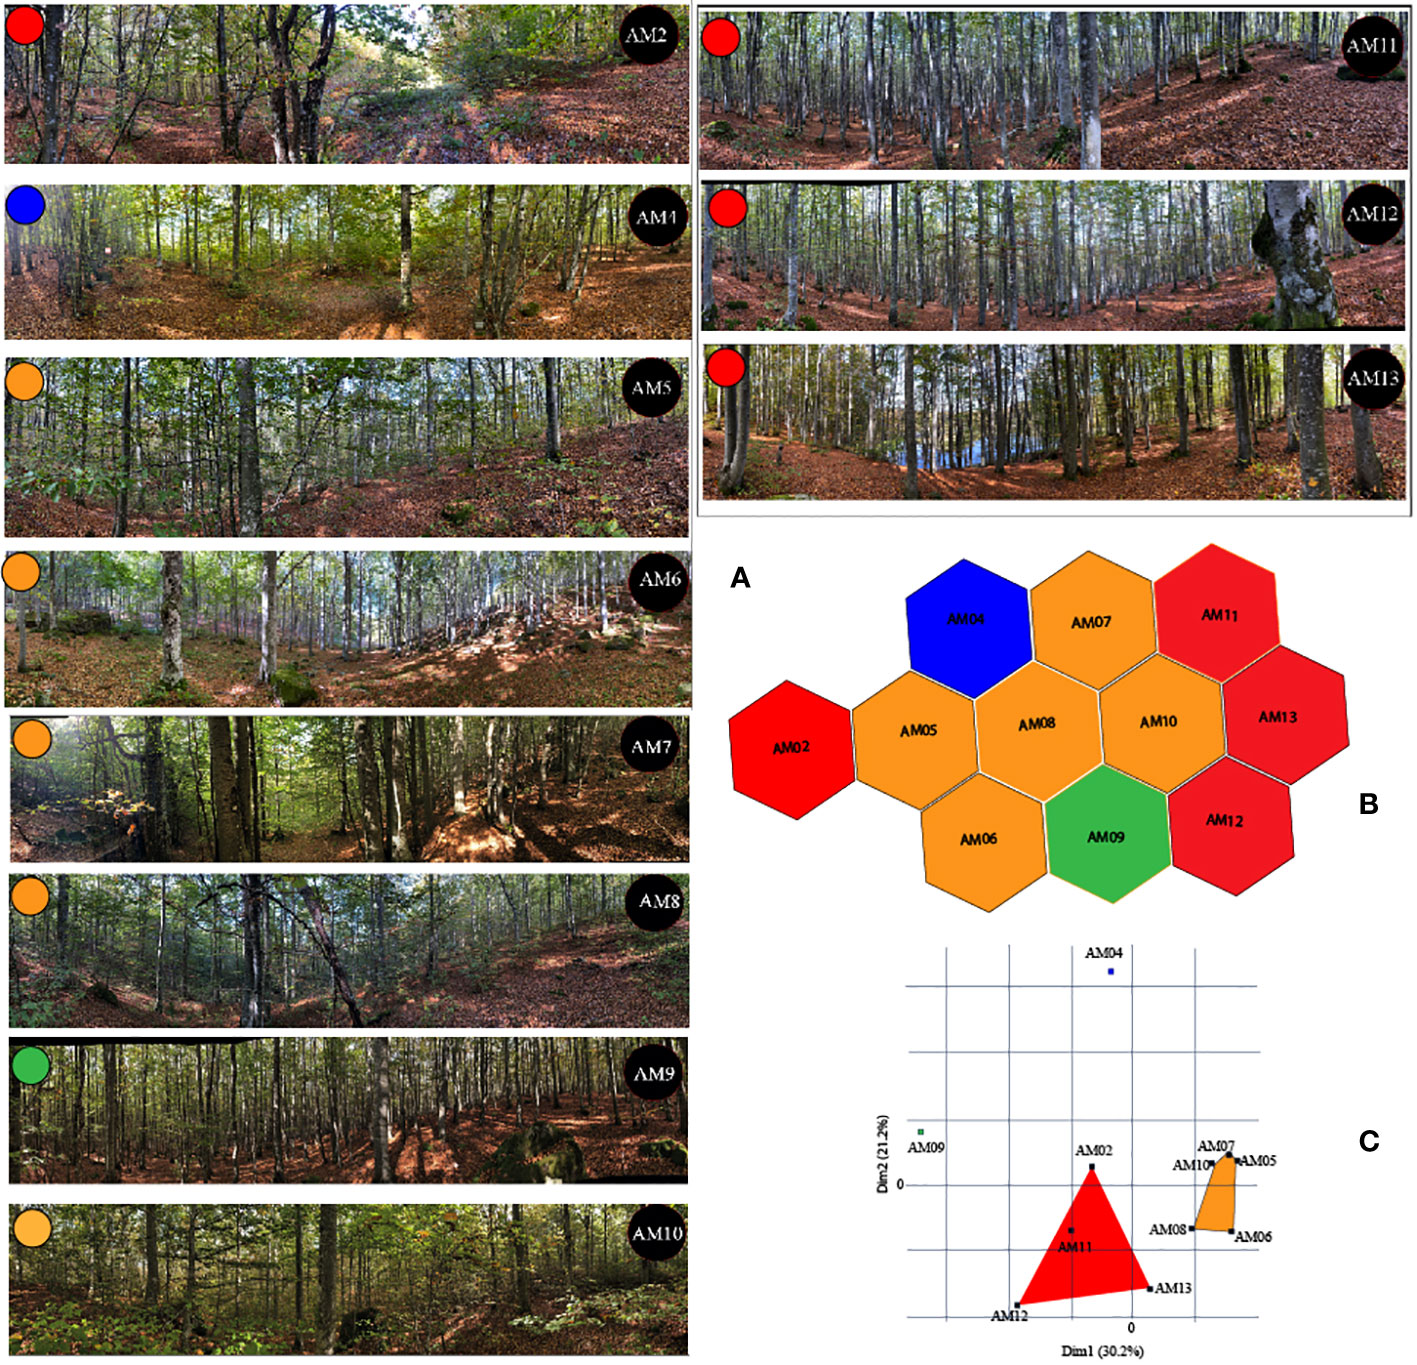
Figure 3 Groupings of 11 sample sites within a mountain beech forest of Tosco-Emiliano Apennines National Park, Northern Tuscany, Italy based on vegetation characteristics: (A) Panoramic pictures of vegetation around the sample sites; (B) their level of similarity according to 56 vegetation variables calculated using Hierarchical K-means clustering; and (C) Extracted as the first and the second dimension of a PCA applied to the K-means classification.
2.4 Data analysis
2.4.1 Vegetation analysis
To determine the spatial heterogeneity of living and dead trees within each site, we calculated a dissimilarity index of tree diameter between the four sampling transects using the Manhattan distance index (Legendre and Legendre, 1998). We then determined the diversity of living tree diameters using the Shannon H’ index (Shannon and Weaver, 1948).
We classified our sample plots using a hierarchical K-means clustering (Ghwanmeh, 2007; Qi et al., 2017) according to 56 measured vegetation variables (Tables 1S, 2S) using the res.hk function in R (Kassambara, 2017a; R Core Team, 2023). This function computes a hierarchical cluster analysis and cuts the trees into k-clusters, then computes the center of each cluster and then finally computes K-means by using the cluster center as the initial cluster. K-means improves the initial partitioning made by hierarchical clustering. The importance of each vegetation variable in the characterization of each sampling plot was obtained by a Principal Component Analysis (PCA) in R (Kassambara, 2017b). A hierarchical cluster method was used to compare vegetation dendrograms with sonic dendrograms using the ward linkage (JMP®, Version 16, SAS Institute Inc., Cary, NC, 1989–2023).
2.4.2 Temporal analysis of the sonoscape
Farina et al. (2023) found that the sonic expressions of sonotopes are closely linked to astronomical periods in a 24-h day and between seasons. Based on this evidence, we grouped our sonic data into distinct temporal periods over a 24-h period and seasonally. Subsequently, we analyzed our data according to two seasonal periods: spring to summer (May–June) and late summer (July–August). We divided our daily data according to six astronomical periods. We categorized these as (1) Night I (00:00 to morning twilight when the sun’s disk is at 18° below the horizon), (2) Morning twilight (morning twilight to sunrise), (3) Morning (sunrise to noon), (4) Afternoon (noon to sunset), (5) Evening twilight (sunset to evening twilight when the sun’s disk is at 18° below the horizon), and (6) Night II (evening twilight to 23:59) (Figure 4). We acquired astronomical data for every day of sampling using the http://wave.surfreport.it/ online ephemeris application and https://gml.noaa.gov/grad/solcalc/ for calculating noon. We synchronized each recording with their respective astronomical period and categorized them accordingly with a value between 1 and 6 based on the aforementioned numeric categories.
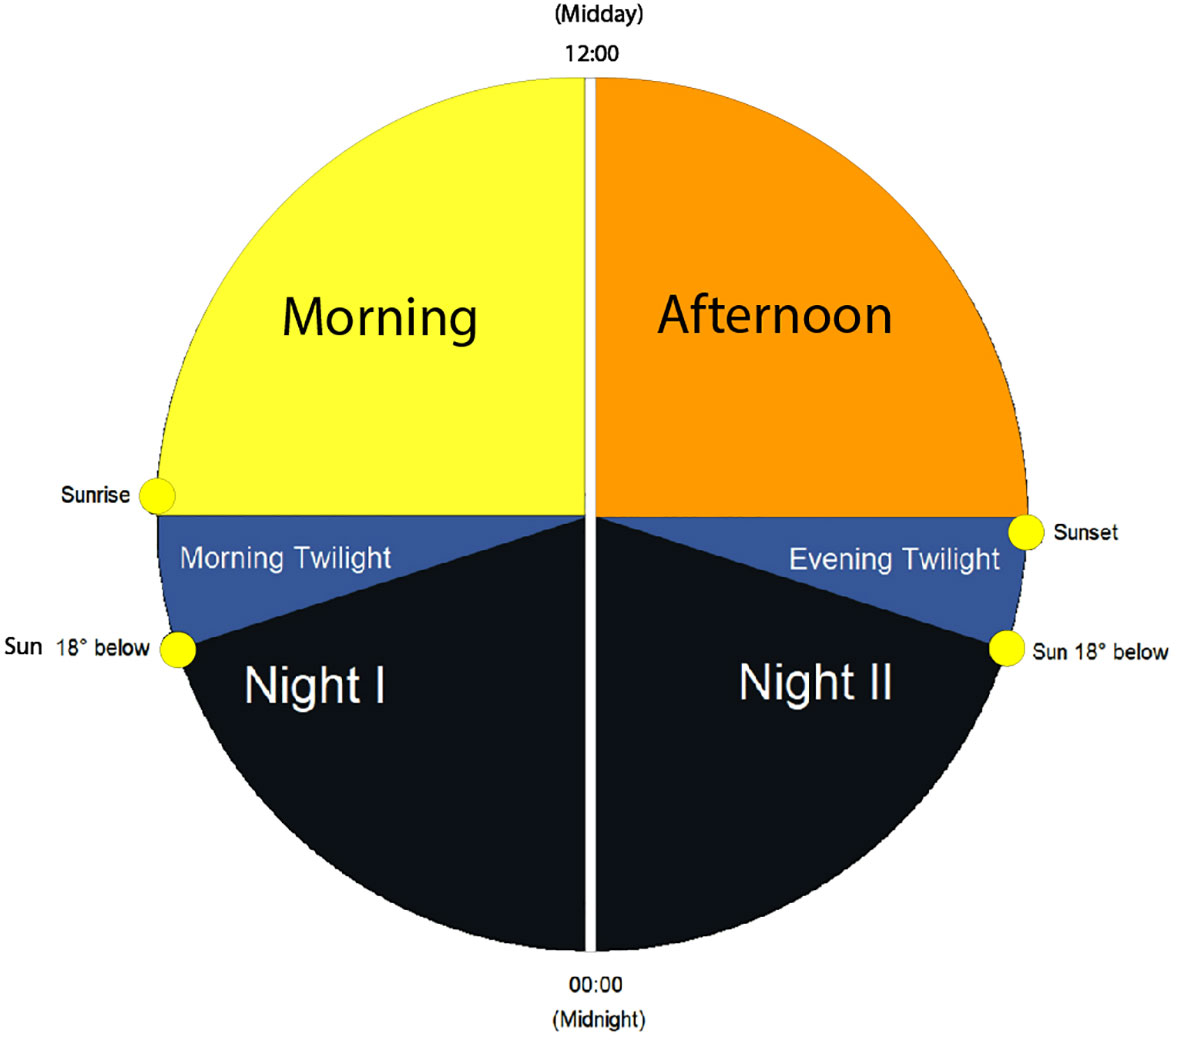
Figure 4 Illustration of the six astronomical temporal periods of a 24-h day: Night I, Morning Twilight, Morning, Afternoon, Evening Twilight, and Night II.
2.4.3 Frequency analysis of sonoscape
In order to better understanding the role of geophonies and of biophononies in the composition and dynamics of sonotopes, we have adopted a threshold of 2000 Hz to discriminate geophonies (≤2000 Hz) from biophonies (>2000) (Gage and Axel, 2014; Mullet et al., 2016; Mullet, 2020).
2.4.4 Data processing and acoustic indices
We calculated the Acoustic Complexity Index (ACItf), as described by Farina et al. (2016), for each 5-minute sound file within the frequency range 0–16,000 Hz at 1-second intervals across 508 frequency bins separated at 31.25 Hz frequency intervals, using SonoScape™ (Farina and Li, 2022). We omitted the first four frequency bins and we applied an intensity filter to the Fast Fourier Transform matrix to exclude index values <0.01 to avoid confusing our analyses by low-frequency vibrations generated by recording devices.
We have used a Spectral Sonic Signatures (SSS) vector to represent the distribution of ACItf along frequency bins. Every element of such vector was obtained as sum of ACItf values inside each frequency bin along a time interval.
The difference between SSS was measured with the Mean Signature Dissimilarity index (MSD), calculated by averaging the values of the standardized Manhattan distance (Legendre and Legendre, 1998, see also Sueur et al., 2008; Lellouch et al., 2014), known also as Camberra metric (Lance and Williams, 1966):
where j is the number of frequency bin (j=1 to 60 for ≤2000 Hz class, j=1 to 448 for >2000 Hz class), i is the number of comparisons in the matrix, q = n x p is total number of MSD values obtained.
The MSD was used to comparing Spectral Sonic Signatures belonging to seasons (two elements (May–June, July–August): 1 comparison), astronomical periods (six elements (Night I, Morning twilight, Morning, Afternoon, Evening twilight, Night II): 15 comparisons), frequency categories (two elements (≤2000, >2000 Hz): 1 comparison), recording stations (eleven elements (AM2, AM4….AM13): 55 comparisons).
The standardization of ACItf values is required to avoid bias caused by the differential size in ACItf that occur between the frequency bins of each frequency interval. In this way, MSD of each comparison may vary from 0 when both elements have the same value, to 1 when one of the two elements is equal to 0.
2.4.4 Spatio-temporal sonotope analysis
We identified the spatial relationship of sonotopes with time using a hierarchical cluster analysis of total ACItf for each recording station according to astronomical period and season using the ward linkage (JMP®, Version 16, SAS Institute Inc., Cary, NC, 1989–2023), and using a clustering resolution of four trees. We assumed the cluster analysis would reveal sonotopes with a spatial composition of small patches, large patches, and spatially-disjunct patches or a sonically homogenous sonoscape where sonic patches are not distinguished. Figure 5 shows different models of how sonotopes may be aggregated inside a sonoscape.
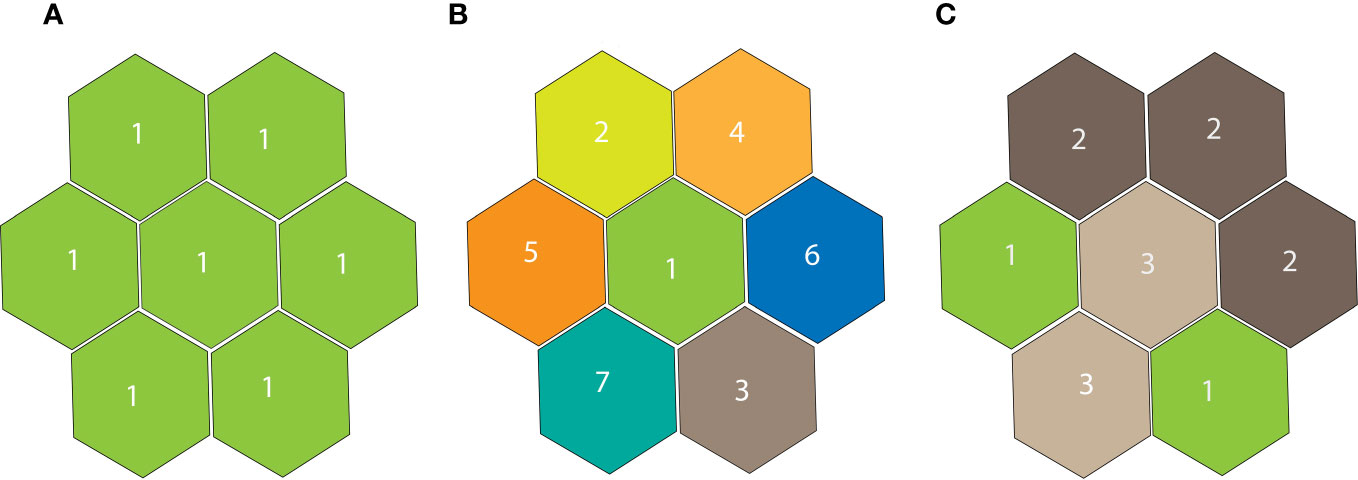
Figure 5 Three models of sonotope geographical repartition inside a sonoscape. (A) Uniform (one unique sonotope coincident with the sonoscape. (B) Fully heterogenous sonoscape where each sonic patch of geographical sonic competence represents a distinct sonotope. (C) Patchy sonoscape where sonotopes resulting from clumped and disjunct AMs. A sonic patch is defined as the spatial competence of a recording station.
In order to express the heterogeneity of how sonotopes are distributed in the landscape, we propose the inverse of the Gini-Simpson concentration index (Gini, 1912; Simpson, 1949; Greenberg, 1956; Berger and Parker, 1970):
where i is the number of sonic patches obtained from contiguous stations belonging to the same sonotope, pi=Sp/N, Sp=number of contiguous stations belonging to the same sonotope, N=number of recording stations in a study area, in our case N=11. This index is 0 when the sonoscape is only composed of one typology of sonotope, and tends asymptotically to 1 with the increase of sampling units, when all the recording stations belong to different sonotopes.
The Sonotope Heterogeneity operates in a spatially explicit condition where non-contiguous sample stations (i.e., hexagons) that exhibit similar sonic activity in a given season and astronomic period are considered as separate entities. Hexagons that do not share at least one side in common (one-neighbor rule) are classified as a single sonotope. In Figure 5A, the seven sample stations represented are all geographically contiguous and the spatial membership is coincident with the sonotope classification. In Figure 5B, every station belongs to a different sonotope whose spatial membership is coincident with sonotope classification. In Figure 5C, the sample stations are classified into three different types of sonotopes. Two sample stations belong to Type 1, three to Type 2, and two to Type 3. However, while the Types 2 and 3 are contiguous, the two Type 1s are not, so they are considered distinct sonotopes. In this case the sonoscape is composed of four separate sonic patches. According to the formula above, this example returns a value of Sonotope Heterogeneity of A=0, B=0.85, C=0.69.
2.4.5 Sonotope-vegetation relationship
In order to evaluate the effects of vegetation on the spatial aggregation of AMs in distinct sonotopes, we compared the dendrograms obtained from the classification of the AMs according to the Spectral Sonic Signature for each astronomical and seasonal partitioning in accordance to (1) the dendrogram generated from clustering AMs based on 56 vegetation parameters and (2) 56 dendrograms created by aggregating AMs according to each single vegetational parameter.
The level of similarity between the vegetation dendrograms and the SSS dendrograms were tested using the Goodman-Kruskal gamma coefficient (γ) (Baker, 1974) which was obtained using the dendextend and cor.dendlist functions (Kassambara, 2017a) in R. This approach made it possible to determine whether sonic patterns were associated with vegetation structure (i.e., γ near 1 or −1). With γ near 0 it means that SSS dendrograms are not statistically similar to the dendrograms obtained from the vegetational variables.
3 Results
3.1 Vegetation patterns
Sample sites were grouped into four distinct clusters based on their vegetation characteristics (Figures 3B, C). The height of vegetation (17.33 was similar across all plots, and weakly correlated to the tree diameter (Pearson 0.32, p<0.0003), confirming the presence of a uniform canopy cover across the area independently from the age of the stand. Competition for light and limited resources from soil have favored homogeneous vertical development of trees.
Recording stations AM04 and AM09 possessed vegetation characteristics notably distinct from one another and all other stations (Figure 3A). This may be partially due to these stations’ spatial orientation to others. AM04 was located at the northwestern edge of the study area while AM09 was located on the south central, outer edge of the study area (Figure 3B). AM04 is characterized by trees with the largest diameter and by a high number of young trees possessing diameters of 3, 6, and 9 cm, respectively. This station had characteristics indicating a conversion into old growth. AM09 is characterized by the lowest density of ground cover and highest density of trees with diameters between 6 to 18 cm. In this station there were no recent conversion practices, and the stand reflects the past use of charcoal production with trees of the same age.
Conversely, two separate vegetation groups emerged. The first was composed of AM05, AM06, AM07, AM08, and AM10, and the second group of AM02, AM11, AM12, and AM13 (Figures 3B, C).
The first group is characterized by a higher density of ground vegetation cover, the highest density of trees with a diameter of 3 cm, and a high heterogeneity in the distribution of ground cover between the four transects. The second group was characterized by a higher density of dead trees and living trees with a diameter between 12 to 18 cm. Although AM02, AM11, AM12, and AM13 were grouped based on similar vegetation characteristics, AM11, AM12, and AM13 were spatially clustered on the eastern side of the study area while AM02 was located on the far western side of the study area (Figure 3B). Sample sites AM05, AM06, AM07, AM08, and AM10 all shared hexagonal boundaries and were spatially grouped more centrally in the study area (Figure 3B). The contribution of the 56 vegetation variables to the characterization of the sampling stations is shown in Supplementary Figure 1 for the first 5 components after the application of a Principal Component Analysis. In Supplementary Tables 1, 2, the vegetation variables are described and summarized.
3.2 Sonic patterns
3.2.1 ACItf patterns
ACItf was notably higher in May–June compared with July–August over all the astronomical periods (Wilcoxon Matched Pairs Test (N=6, T=0.00, Z=2.20, p=0.0277) (Figure 6).
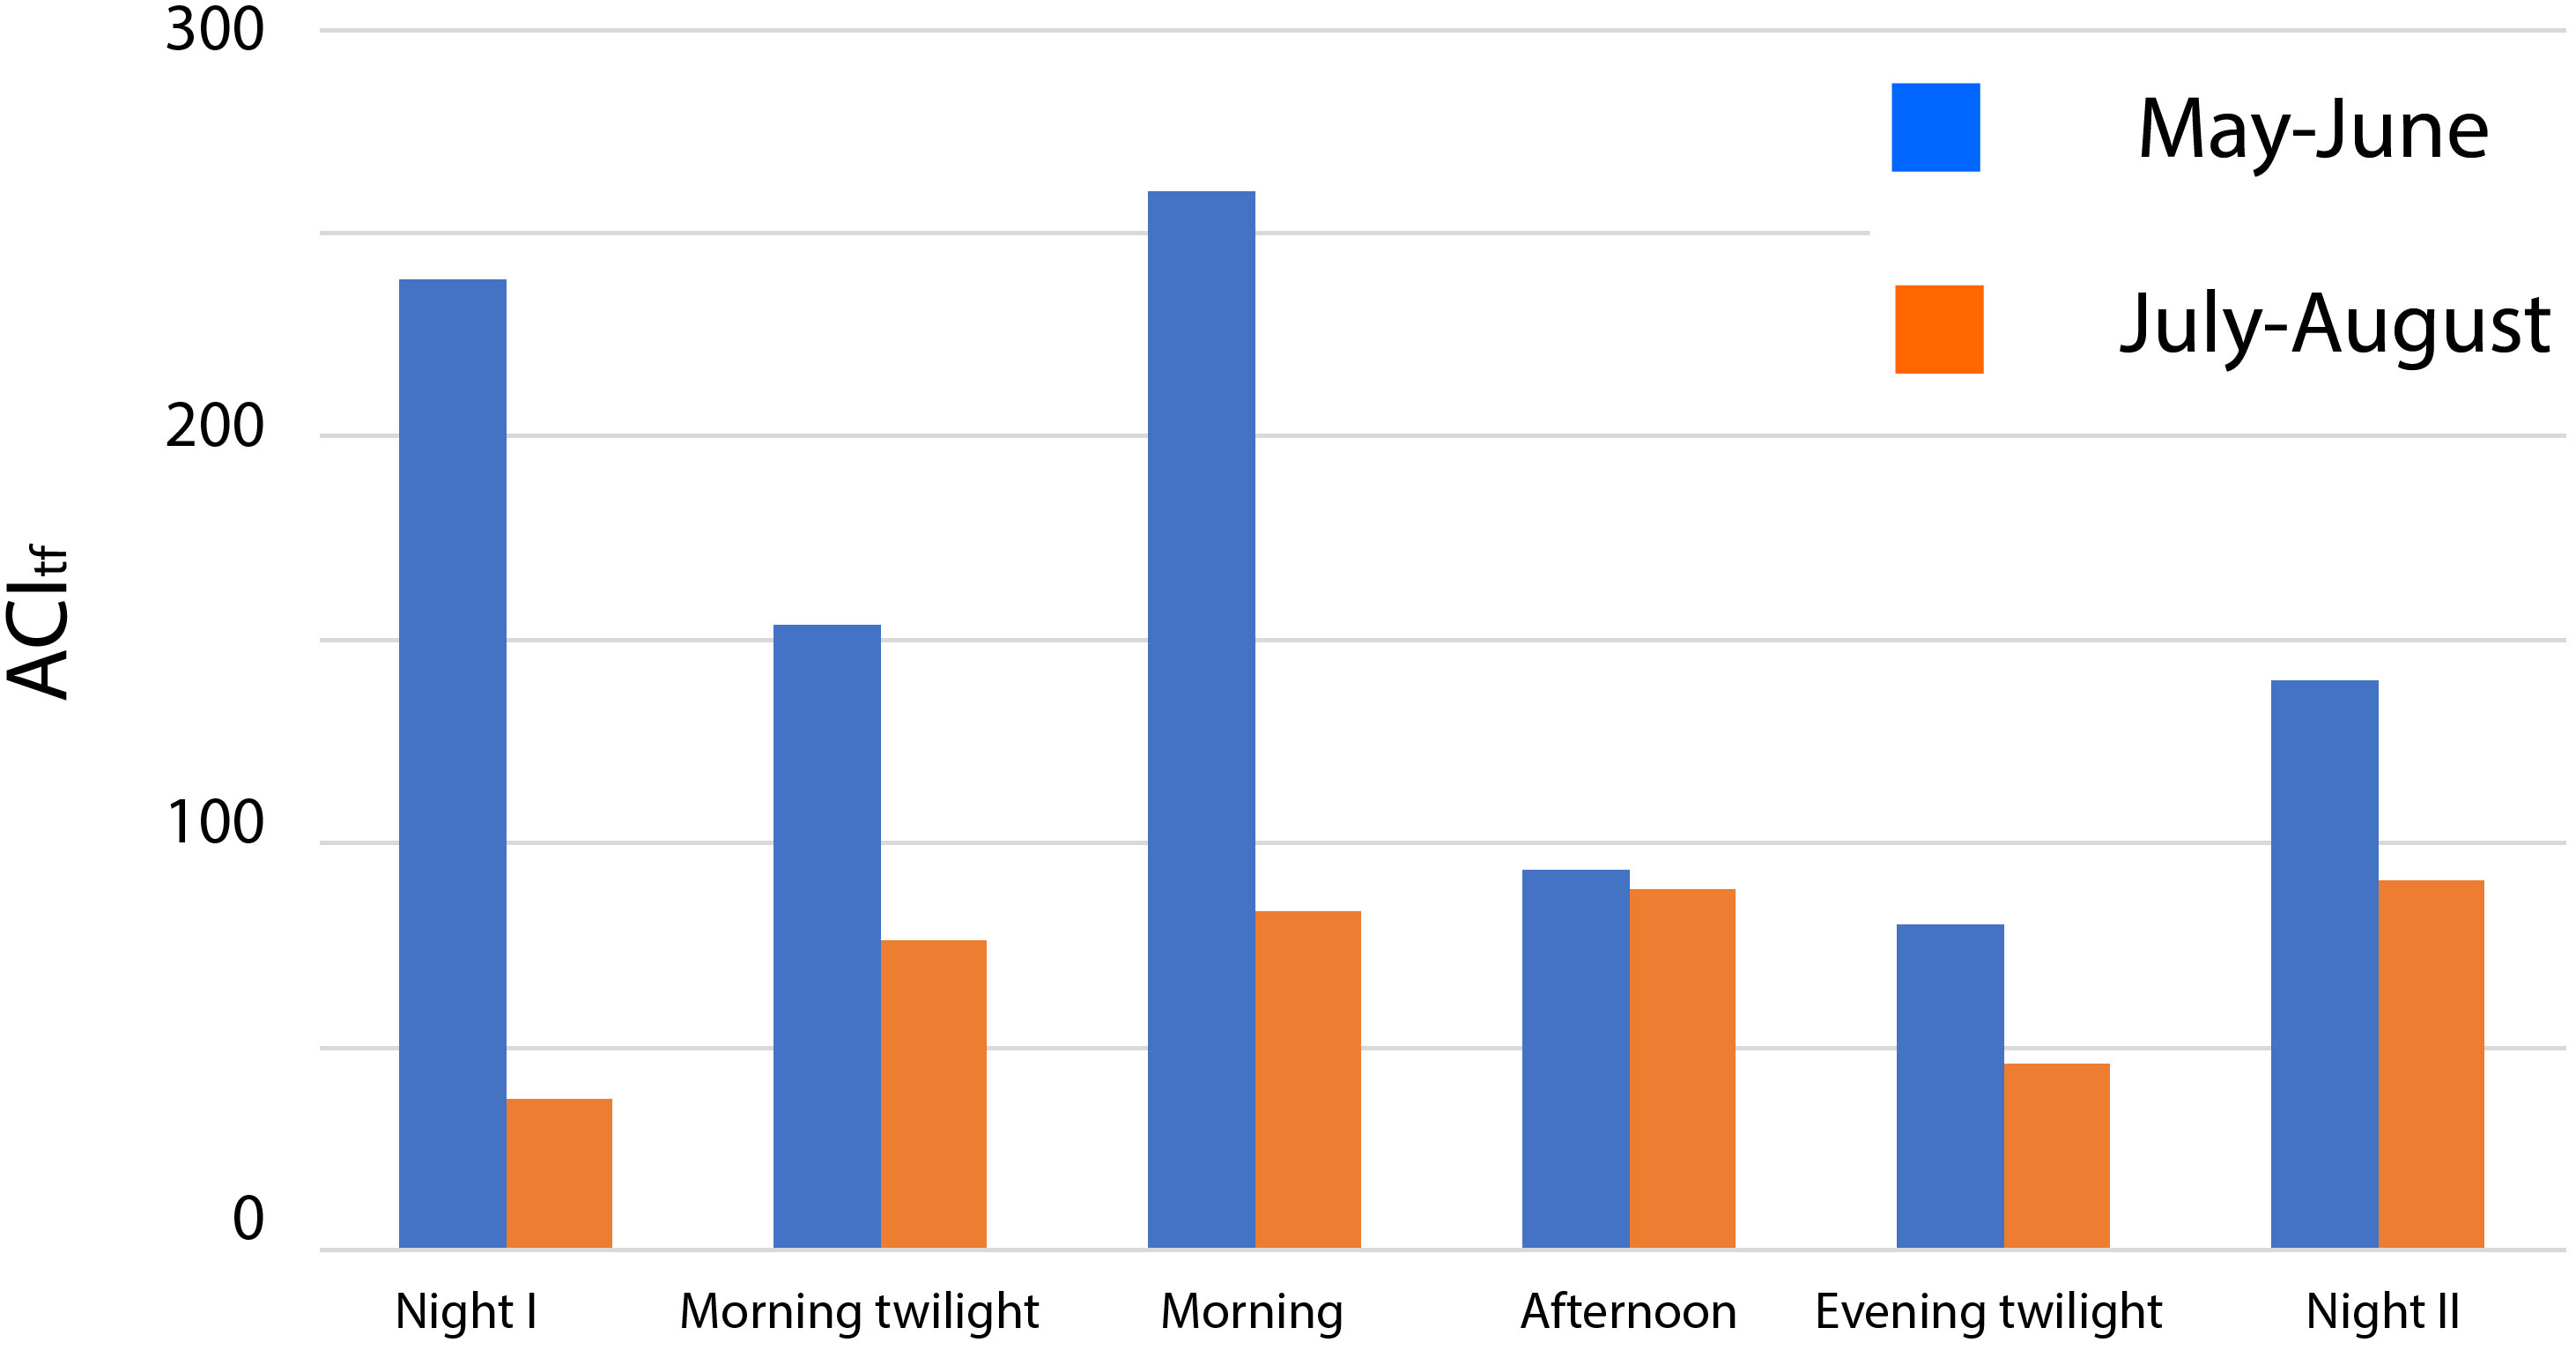
Figure 6 Distribution of ACItf (reduced by 10000) (all AM aggregated) in the two seasons and for each astronomical period.
Spectral Sonic Signature over the six astronomical periods exhibited distinct differences between May–June and July–August (Figures 7A–D).
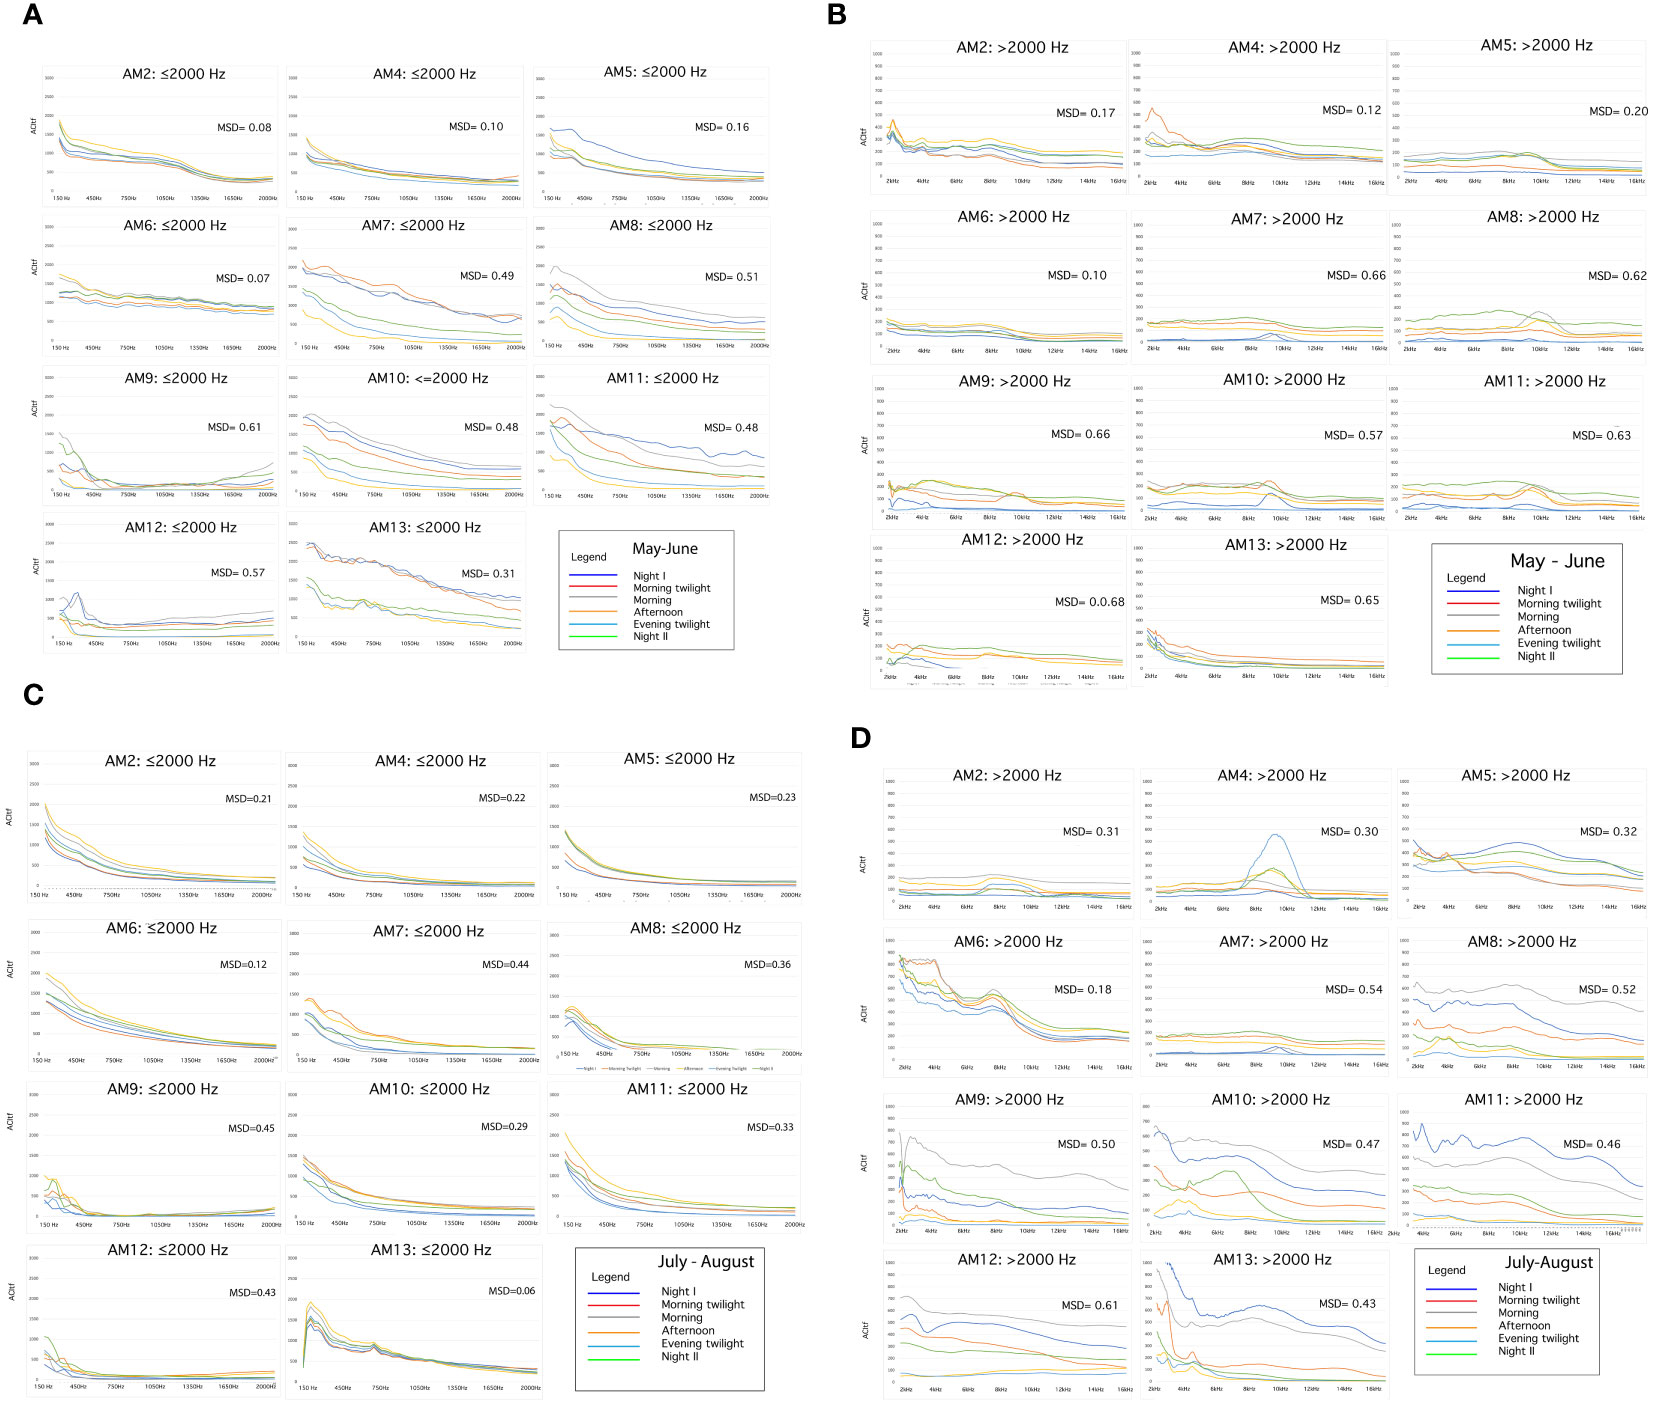
Figure 7 (A–D) Spectral Sonic Signatures belonging to the AMs and distinct according to two frequencies: ≤ 2000 Hz and >2000 Hz and two seasons (May–June, July–August). It is also reported the Mean Spectral Dissimilarity (MSD) obtained by a full comparison of the Spectral Sonic Signatures of the different astronomical periods. The two categories of frequencies are represented at a different ACItf scale to assure resolution at frequencies >2000.
Spectral Sonic Signature expressed higher values of ACItf in the ≤2000 Hz class than in the >2000 Hz class. The frequencies >2000 Hz have lower ACItf values in May–June than in July–August. The frequencies ≤2000 have a well-differentiated SSS between astronomical periods with the exception of AM6 and AM2, in May–June.
In July–August, frequencies >2000 have a well-differentiated SSS between all the astronomical periods excluding AM6 and AM2 (Figure 7D).
3.2.2 Mean spectral dissimilarity
Mean Spectral Dissimilarity among astronomical periods for our entire study area was higher in May–June than in July–August (Wilcoxon Matched Pairs Test (N 6, T 1.00, Z 1.99, p<0.027) with a slight increase from Morning Twilight to Night II (Table 1). Similarly, when frequency intervals of ≤2000 Hz and >2000 Hz were compared, Mean Spectral Dissimilarity among astronomical periods was higher in May–June than in July–August for both frequency classes (≤2000 Hz: Wilcoxon Matched Pairs Test = N 6, T 0.00, Z 2.2013, p<0.027; >2000 Hz: Wilcoxon Matched Pairs Test = N 6, T 1.00, Z 1.9917, p<0.046) (Table 1).
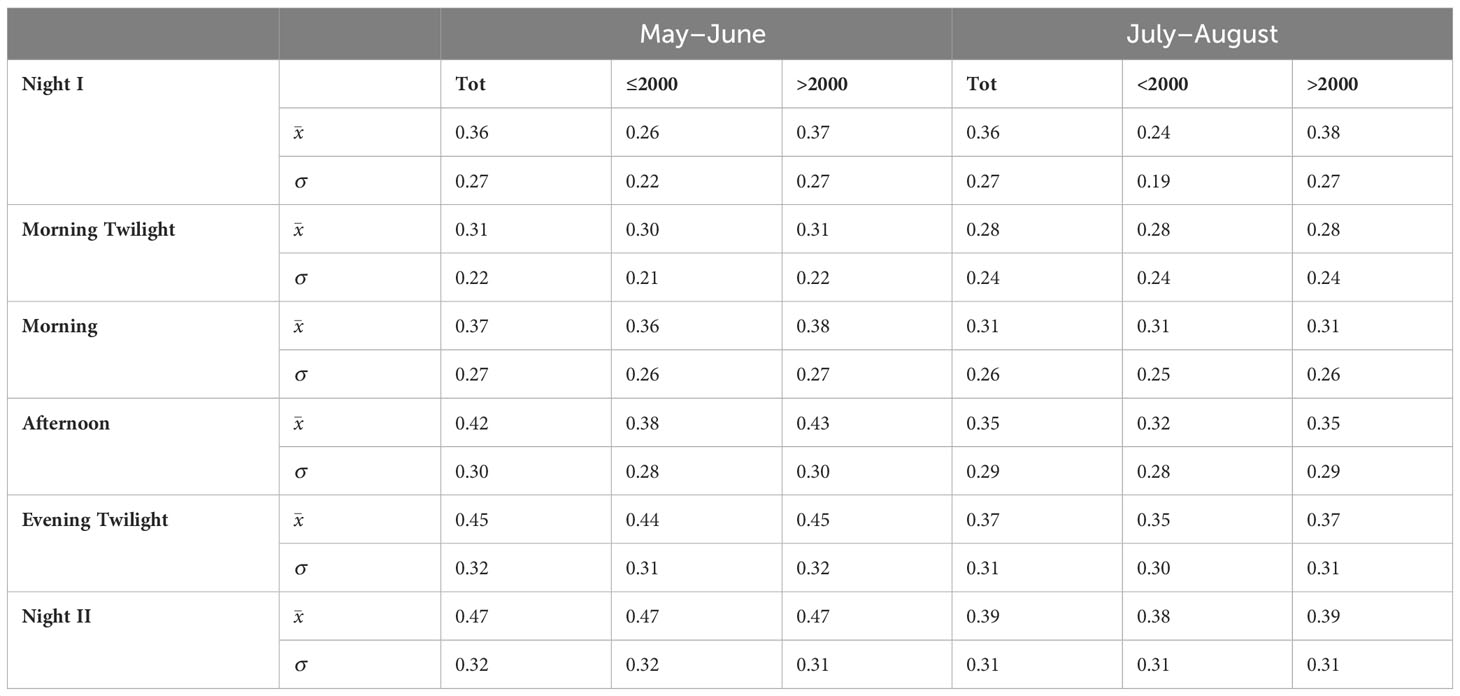
Table 1 Values on Mean Spectral Dissimilarity between AMs obtained from the distribution of Spectral Sonic Signature among astronomical periods, seasons, and between frequency classes.
There was no significant difference in MSD among recording stations between May–June and July–August (Wilcoxon Matched Pairs Test: N=11, T=24, Z=0.80, p<0.42). This was also the case when MSD was compared among recording stations between the two seasons, but separated by frequency class ≤2000 Hz (Wilcoxon Matched Pairs Test: N=11, T=13.5, Z=1.73, p<0.08) and >2000 Hz (Wilcoxon-matched pairs test: N=11, T=24.5, Z=0.75, p<0.44) (Table 2).
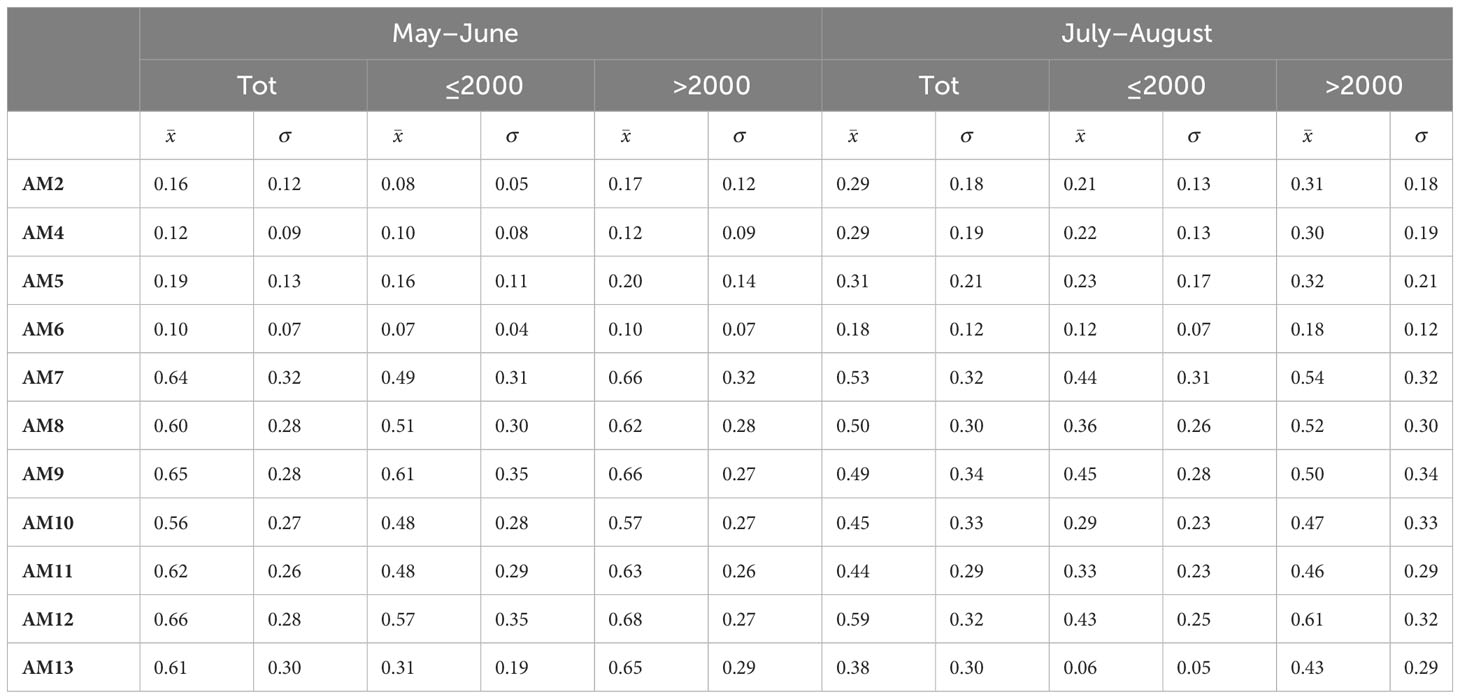
Table 2 Mean Spectral Dissimilarity of recording stations (AMs) obtained from the distribution of Spectral Sonic Signature over astronomical periods (Tot), seasons (May–June, July–August), and frequencies classes (≤2000 and >2000).
3.2.3 Sonotope patterns
Cluster analysis of ACItf revealed sound sample sites could be distinguished differentially as sonotopes across six astronomical periods during both seasonal periods (May–June and July–August) (Figure 8). While there was no significant difference in how sonotope configurations differed among astronomical periods when compared between seasons (Wilcoxon Matched Pairs Test: N=15, T=40, Z=1.139, p=0.25), there were distinct configurations among astronomical periods within each season. Specifically, the configuration of sonotopes in May–June was more similar across all astronomical periods from Morning Twilight to Night II, while sonotope configuration of Night I was more unique than other astronomical periods except Morning (Table 3). During July–August, sonotope configurations expressed more unique patterns between astronomical periods, with Night I exhibiting the most unique arrangement when compared to all other astronomical periods (Table 3). Notably, there was no difference in sonotope configuration between Evening Twilight and Night II during both seasons (Table 3).
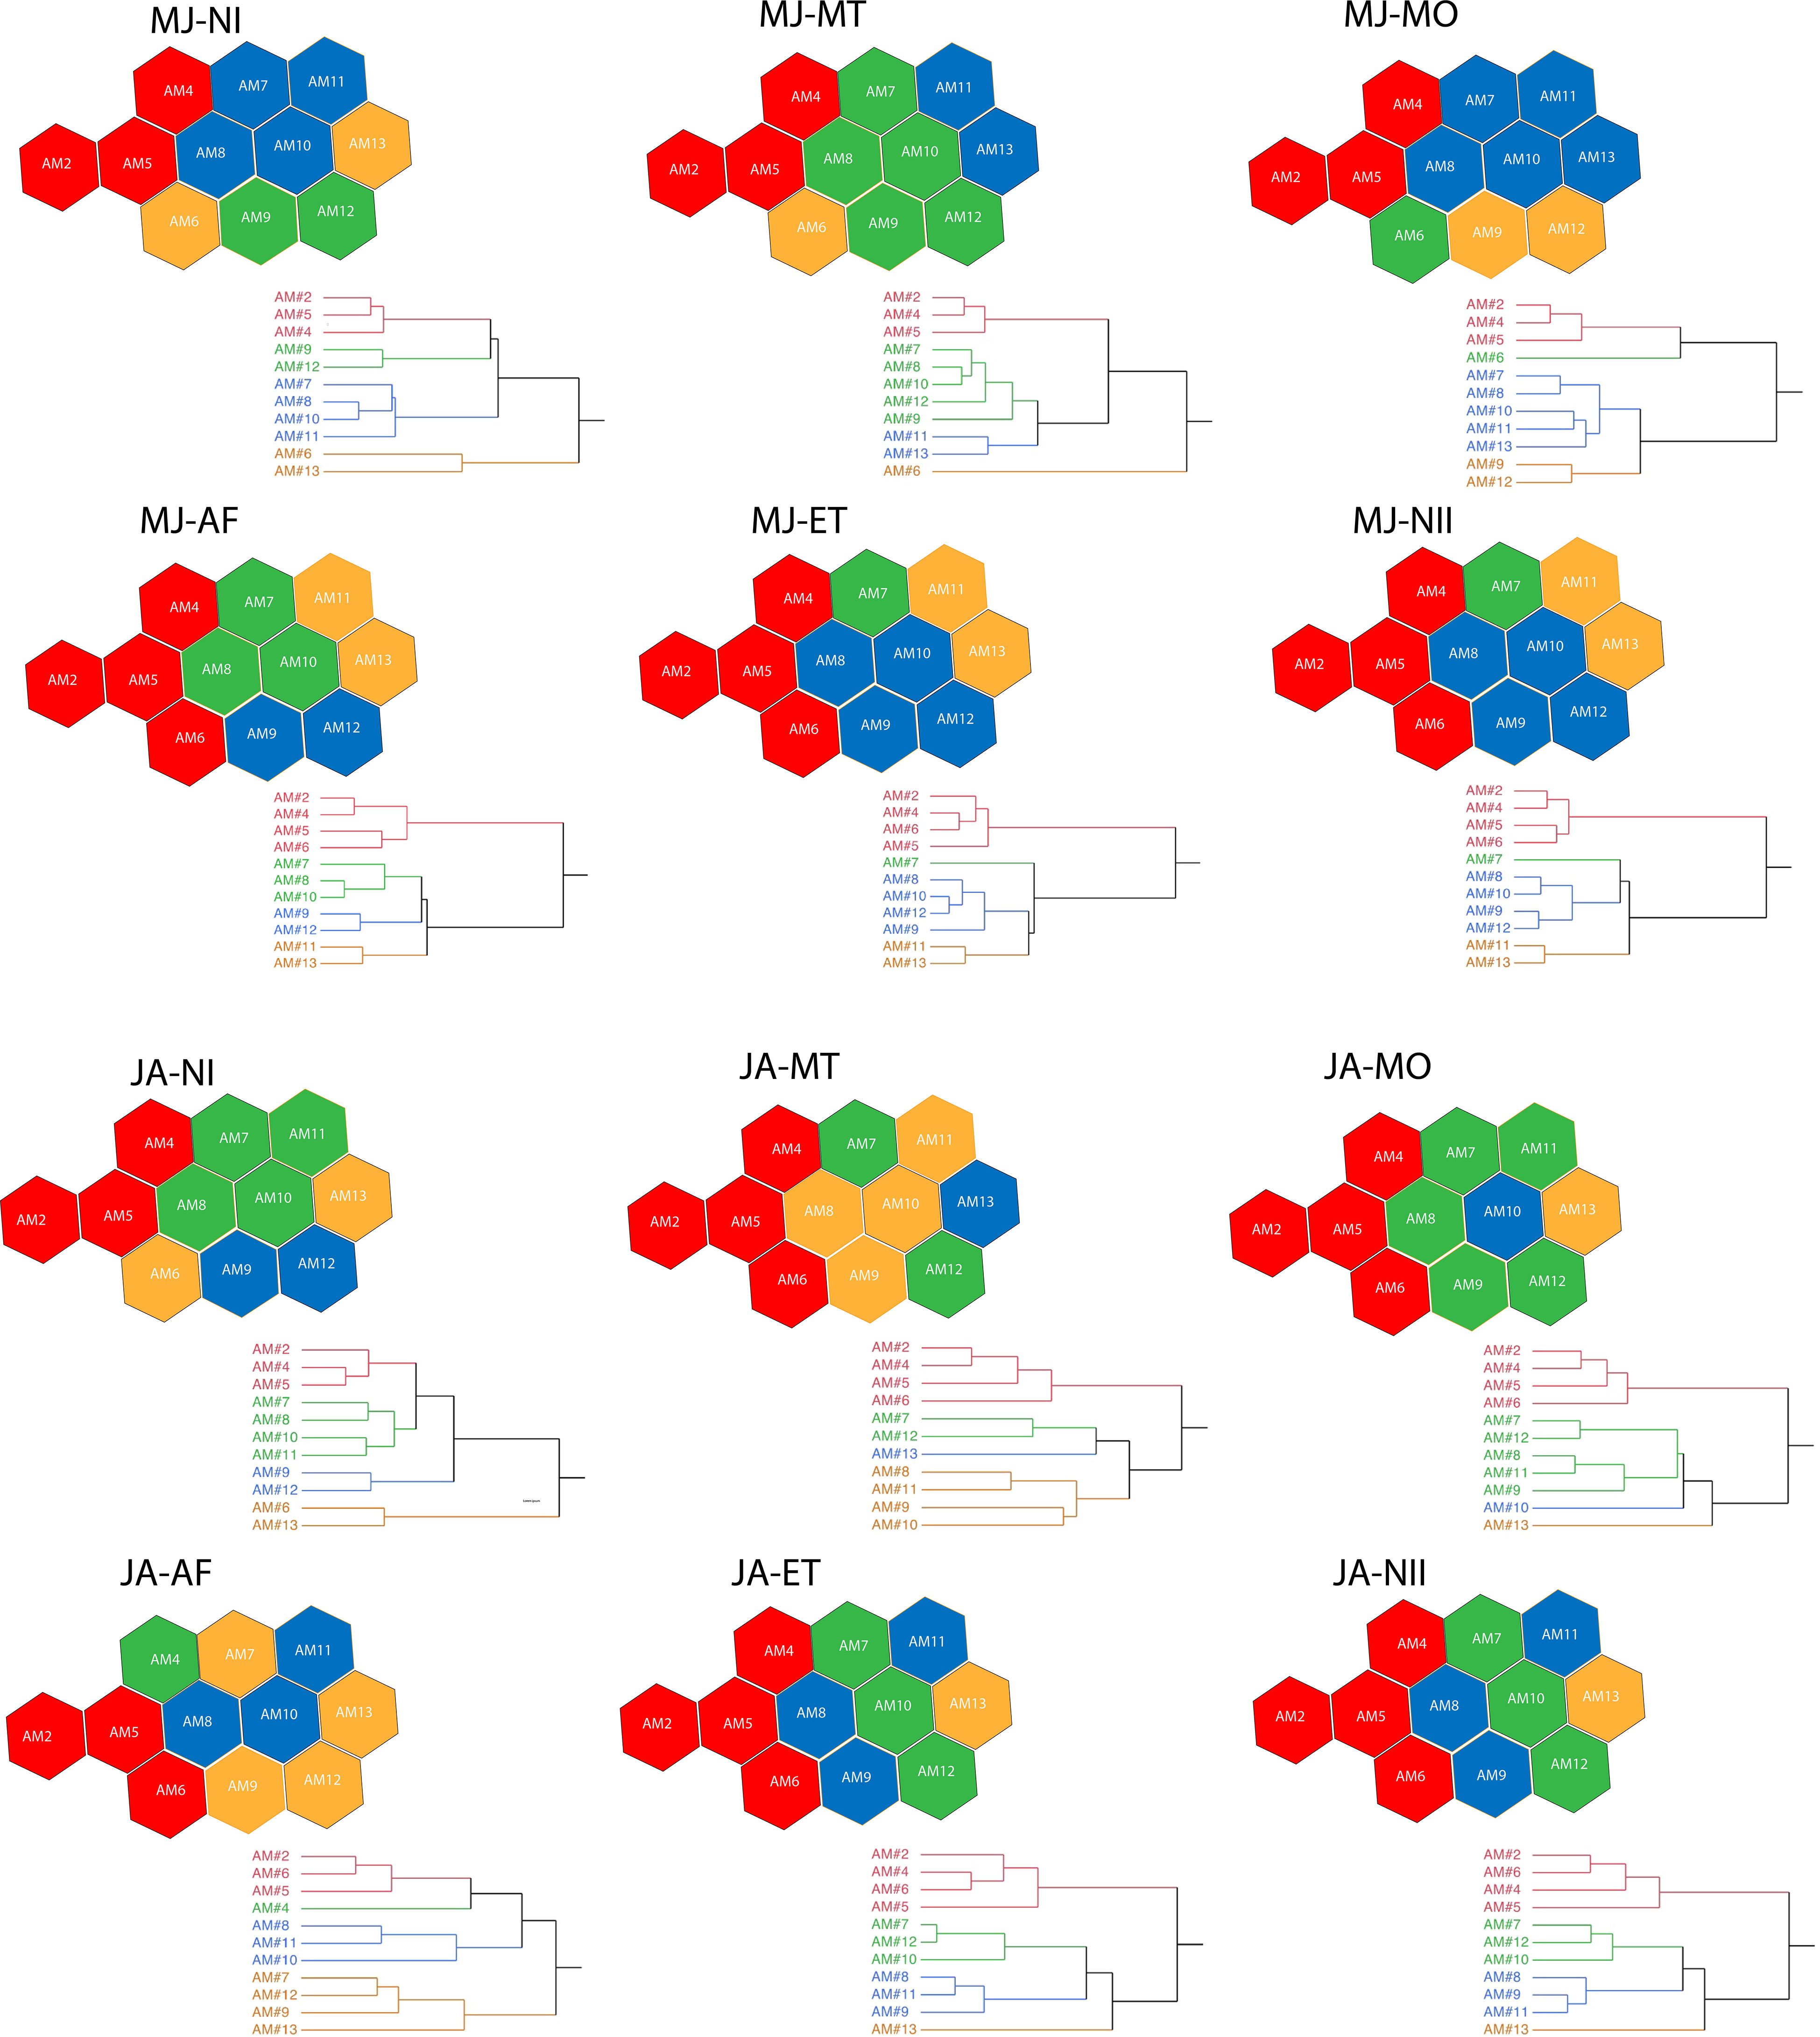
Figure 8 Dendrograms obtained clustering the AMs according their Spectral Sonic Signatures in different astronomic periods (NI=Night I, MT=Morning Twilight, MO=Morning, AF=Afternoon, ET=Evening Twilight, NII=Night II and at two seasons MJ=May–June; JA=July–August. The AMs are also represented with hexagons of different colors according the position in dendrogram tree. AMs with the same color represent distinct sonotopes that change in space and time. The colors in each dendrogram are independent from the others along the astronomic periods.
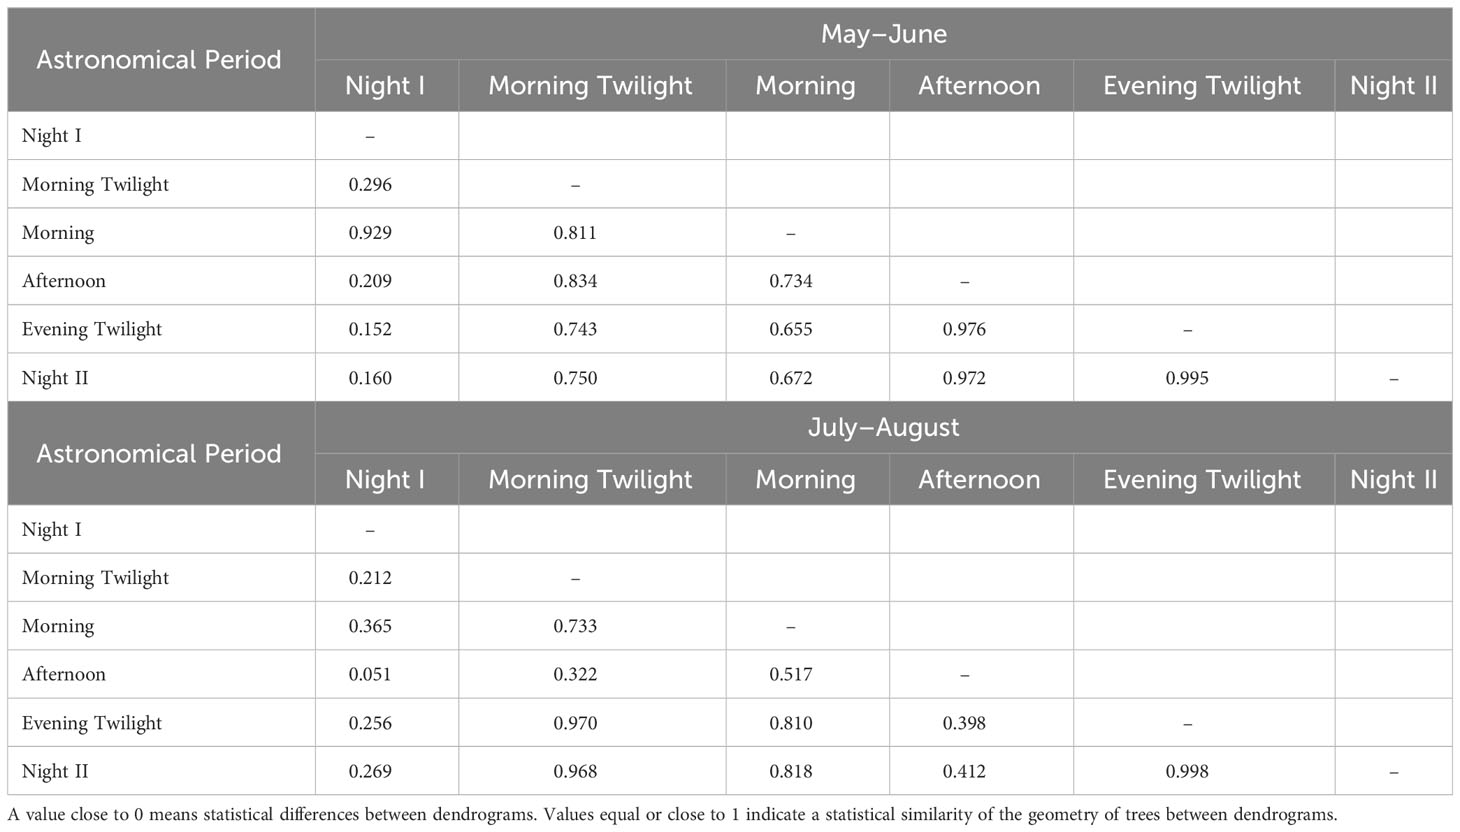
Table 3 A Matrix obtained applying the Goodman-Kruskal’s gamma index to the dendrograms of each astronomic period during the two seasons.
Sonotope Heterogeneity was not significantly different among astronomical periods when compared between seasons (Wilcoxon Matched Pairs Test: N=6, T=2, Z=1.4832, p=0.13) (Table 4). However, May–June expressed higher Sonotope Heterogeneity values during Night I and Afternoon than other astronomical periods while sonotopes all had similarly high heterogeneity for all astronomical periods except Morning in July–August (Table 4). Recurrent patterns of sonotopes were apparent for the sonotope aggregate of AM02, AM05, AM04 (100% of temporal episodes). Recurrent aggregations were also evident between AM11 and AM13 (83.3% of temporal episodes), between AM09 and AM12 (100% of temporal episodes), and between AM08 and AM10 (75% of temporal episodes) (Figure 8).
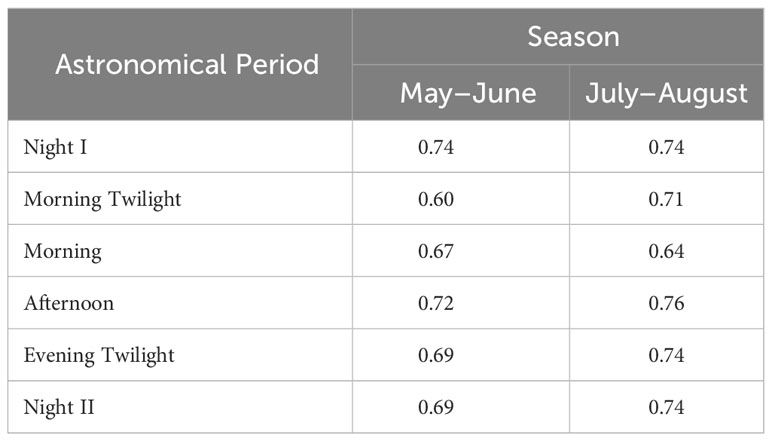
Table 4 Sonotope Heterogeneity in the different astronomical periods. Values close to 1.00 indicate highest heterogeneity.
3.2.4 Correlation between vegetation variables and sonotopes
There was no correspondence with any astronomical sonotope configuration and the spatial distribution of vegetation within this beech forest. The spatial configuration of sonotopes for May–June (γ=0.0465, =0.033) and July–August (γ=0.011, =0.007) were not significant in comparison to vegetation configuration by sample site (Wilcoxon Matched Pairs Test: N=6, T=2, Z=1.78, p=0.074). However, we found that sonotopes and vegetation dendrograms of the 56 separate vegetation parameters had a higher γ values in May–June than July–August (Wilcoxon Matched Pairs Test: N=56, T=503.0, Z=2.4063, p=0.016144) (Supplementary Figure 2).
4 Discussion
Our investigation of sonotopes within this homogeneous beech forest expands on the findings of Farina et al. (2023) to build further evidence of the Sonotope Hypothesis. Our study area was characterized as a homogenous landcover class because it possessed virtually no ground cover vegetation and consisted of a uniformly dense canopy of trees dominated by one species, European beech (Fagus sylvatica L.) (Pezzi et al., 2007; Pezzi et al., 2008). However, we found that the dimension and density of beech trees at localized sample sites demonstrated quite different structural characteristics creating an evident mosaic of tree trunk diameters with some areas intermixed with various stages of young trees. Consequently, our study area had a relatively heterogeneous vegetation structure that was placed into four statistically distinct groups despite its homogeneous landcover classification. While this finer-scaled heterogeneity is likely due to the spatially and temporally inconsistent methods of selective cutting, it provided an acceptable experimental setting to test whether sonotopes are expressed in a homogenous landcover class and, if so, are they linked to localized vegetation structure? We tested these relationships within the temporal context of seasons and astronomical periods, and the spatial context of 11 sample plots.
The overall sonoscape was characterized by a predominance of low-frequency sounds ≤2000 Hz over both seasonal and astronomical periods. The sources of low-frequency sonic events are commonly attributed to geophony produced by wind when in rural and remote areas (Mullet et al., 2016; Farina et al., 2021b). Although mid- to high-frequency sounds >2000 Hz, associated with biophony (Gage and Axel, 2014; Farina and James, 2016), were more subtle than low-frequency geophonies, biophony throughout our study area was more prevalent in July–August, when the breeding season of birds was at the end, than in May–June. Concurrently, sonic events were more dissimilar among astronomical periods in May–June than July–August which may be explained by the fact that this region commonly experiences more wind in May and early June with daily wind events throughout a 24-h period than it does in July and August (https://beach-weather.com/Southern-Europe/Italy/Tuscany/averages/#windinfo).
Despite this being a managed and recovering Mediterranean forest, the type of geophonically dominated soundscape is more commonly documented in subarctic environments and winter (Mullet et al., 2016; Mullet, 2020) and is not suggestive of a healthy forest for songbirds and stridulating insects. Perhaps what is also unusual is that breeding birds in this region are more sonically active between May and June, not July and August (Farina, 1997). It is not clear to us why we documented higher biophonic activity that did not concur with known songbird breeding phenology.
Recovering beech forests like our study area have been known to host a higher species diversity when there is more complex vegetation structure and a high number of standing dead trees (Laiolo et al., 2004). While we do report a relative measure of vegetation structural complexity and some biological activity, this beech forest appears to be more like a “green desert” commonly seen in monoculture plantations (Horák et al., 2019), and probably the result of the continued impact of intensive charcoal production (Benatti et al., 2018). Although the forest appears to be suitable habitat, the dominance of geophony and low occurrence of biophony is evidence the current management of this forest is not yet suitable for songbirds and stridulating insects, indicators sometimes used to measure forest health (Canterbury et al., 2000; Moir and Brennan, 2007). Sonic activity has proven to be a prime clear indicator of similar long-term effects of human-caused forest degradation practices in the United States’ national forests (Krause et al., 2011).
We confirmed sonotopes were differentially expressed within the homogenous landscape of our study area using the improved ACItf and novel Mean Spectral Dissimilarity and Sonotope Heterogeneity in conjunction with cluster analysis and Goodman-Kruskal gamma coefficient. While sonotope arrangements were mostly static over astronomical periods in May–June and relatively more dynamic in July–August, their configurations were similar when compared between seasons. This suggests that sonic activities do change throughout a 24-h day, depending on the season, but the way they are arranged in space remained consistent between the seasons of May–June and July–August. This could be explained by the ecological relationship we found between the configuration of sonotopes and vegetation structure. Specifically, the explicit way sonotopes were spatially configured were directly linked to the arrangements of vegetation structure and these relationships was stronger in May–June than in July–August.
The predominance of geophonies and the ecological link between sonotope configuration and vegetation structure could explain why sonotopes were mostly static across astronomical periods in May–June and had a stronger relationship than in July–August. For instance, with relatively few biophonic activity, May–June experienced more wind than July–August, such geophysical event would generate very specific geophonic phenomena consistent with the structure of vegetation at localized areas (Miller, 1978). This can be considered with the fact that wind can behave temporally in a way that creates long periods of ephemeral geophony, generating very consistent and mundane periods of sonic production (Mullet et al., 2016; Farina et al., 2023). Yet, Night I stood out as the most dissimilar astronomical period of both seasons. This was likely an indicator that Night I was a period when more sonically energetic geophonies, biophonies, and anthropophonies are absent, creating a unique period when only a low-frequency background sound of geophonic ambience is present in a way humans describe as natural quiet (Mullet et al., 2017a; Farina et al., 2023). While natural quiet is seen as a quality of some landscapes (Mace et al., 2004; Mullet et al., 2017b), it can also be an indicator of sonic extinctions where the Spectral Sonic Signature of an ecosystem is destroyed to such an extent, the sonic environment never recovers to its original state (Monacchi, 2013). We know that the old-growth European beech forests of Sasso Fratino Integral Reserve (Central Apennines, Italy), untouched by human intervention for 500 years, possesses a rich diversity of biophony (Farina et al., 2021a). Our results paint a stark contrast.
5 Conclusion and recommendations
The ecological and evolutionary role sonotopes play within the environment is not fully understood and requires further study (Carothers and Jaksić, 1984; Kronfeld-Schor and Dayan, 2003; Bennie et al., 2014). However, we lay one more block of knowledge to building the foundation of the Sonotope Hypothesis proposed by Farina (2014). Here, we have revealed that sonotopes are also evident within a homogenous landscape and their ecological relationship to the physical environment is closely linked to localized arrangements of vegetation structure. We obtained evidence that sonotopes are influenced by physical-biological factors operating at a local scale.
The Mean Spectral Dissimilarity, a good companion of the Spectral Sonic Signature, when applied to the overall collection of autonomous recording units, represents a robust proxy of the internal sonic heterogeneity, and an important index for an inter-regional ecoacoustic comparison. The six astronomical delimitations that we have used could be in the future refined adding further partitioning based on the vocal habits of focal species.
The strict relationship between time and space is demonstrated by the emergence of separate sonotopes summarized in the Sonotope Heterogeneity Index.
The analysis of the sonoscape and of the sonotopes requires new methodological implementations that we can summarize in the following points:
1. Utilization of an adequate grid of audio recorders according to a scaled geometry to improve the representation of the variability in the geophony, biophony and technophony of the area. For instance, the number of recording stations should be more consistent to grasp the environmental variability at a larger scale and to carry out a multiscale comparison. In the same studied area, a tentative simulation, has demonstrated that 30 recording stations could cover the variability of the entire landscape, paving the way for new ecological evaluations.
2. Collection of detailed vegetational variables selected according not only to an alleged relationship with animal traits but also to a relationship with geophonic agents like wind and rain.
3. Detailed description of weather conditions like direction and wind speed, solar radiation, humidity and temperature at every recording site, that for the effects on sound transmission, become functional to a geophonic evaluation.
4. Tuning the astronomical repartition of the daily time according to different biogeographic regions, and selecting appropriate seasonal partitioning capable of detecting the variability of the acoustic communities.
5. Implementation of the cluster analysis and its statistical validation in the identification of the sonotopes.
6. Implementation of the Mean Spectral Dissimilarity algorithm to improve the better interpretation of the Spectral Sonic Signature that guides the process of sonotope identification.
7. Improving the graphical representation of sonotopes adopting spatial explicit representation of their distinctiveness and spatial diversity.
The presence in this forest of only one species of tree (Fagus sylvatica) is probably the main cause of the biophonic poverty. The eradication of spontaneous trees like Sorbus aucuparia, Laburnum alpinus, Juniperus communis, or Abies alba, and of dead trees and logs during decades of charcoal utilization, has dramatically reduced the habitat suitability (scarcity of breeding places and food resources), with a negative impact on biodiversity that still persists. Despite the fact that is not the main goal of this paper to discuss the management policy of this forest, we encourage an ecological restoration oriented not only to improve the spatial complexity of the existing stands, but also devoted to increase the variety of trees and shrubs that actually is very low. Contemporarily it would be desirable to increase the spatial and structural heterogeneity of the stands creating clearings that could favor the ecological succession. The ecoacoustics monitoring applying the Sonotope Hypothesis procedure could be an efficient methods at local and at landscape scale, to track future desirable successes of the suggested strategies.
Data availability statement
The raw data supporting the conclusions of this article will be made available by the authors, without undue reservation.
Author contributions
AF: Writing – original draft. TM: Writing – review & editing.
Funding
The author(s) declare that no financial support was received for the research, authorship, and/or publication of this article.
Conflict of interest
The authors declare that the research was conducted in the absence of any commercial or financial relationships that could be construed as a potential conflict of interest.
Publisher’s note
All claims expressed in this article are solely those of the authors and do not necessarily represent those of their affiliated organizations, or those of the publisher, the editors and the reviewers. Any product that may be evaluated in this article, or claim that may be made by its manufacturer, is not guaranteed or endorsed by the publisher.
Supplementary material
The Supplementary Material for this article can be found online at: https://www.frontiersin.org/articles/10.3389/fevo.2024.1341760/full#supplementary-material
References
Addicott J. F., Aho J. M., Antolin M. F., Padilla D. K., Richardson J. S., Soluk D. A. (1987). Ecological neighborhoods: scaling environmental patterns. Oikos 49, 340–346. doi: 10.2307/3565770
Andren H. (1994). Effects of habitat fragmentation on birds and mammals in landscapes with different proportions of suitable habitat: a review. Oikos 71, 355–366. doi: 10.2307/3545823
Baker F. B. (1974). Stability of two hierarchical grouping techniques case I: sensitivity to data errors. J. Am. Stat. Assoc. 69, 440–445. doi: 10.1080/1621459.1974.10482971
Baroni C., Guidobaldi G., Salvatore M. C., Christl M., Ivy-Ochs S. (2018). Last glacial maximum glaciers in the Northern Apennines reflect primarily the influence of southerly storm-tracks in the western Mediterranean. Quaternary Sci. Rev. 197, 352–367. doi: 10.1016/j.quascirev.2018.07.003
Basile M., Storch I., Mikusiński G. (2021). Abundance, species richness and diversity of forest bird assemblages–The relative importance of habitat structures and landscape context. Ecol. Indic. 133, 108402. doi: 10.1016/j.ecolind.2021.108402
Benatti A., Marie B., Bosi G., Dallai D., Mercuri A. M. (2018). Charcoal kilns in the Northern Apennines (Italy): Forest exploitation by past societies in mountain areas. Interdisciplinaria Archaeologica 9, 83–92.
Bennie J. J., Duffy J. P., Inger R., Gaston K. J. (2014). Biogeography of time partitioning in mammals. Proc. Natl. Acad. Sci. 111, 13727–13732. doi: 10.1073/pnas.1216063110
Berg Å. (2002). Composition and diversity of bird communities in Swedish farmland–forest mosaic landscapes. Bird study 49, 153–165. doi: 10.1080/00063650209461260
Berg Å., Pärt T. (1994). Abundance of breeding farmland birds on arable and set-aside fields at forest edges. Ecography 17, 147–152. doi: 10.1111/j.1600-0587.1994.tb00087.x
Berger W. H., Parker F. L. (1970). Diversity of planktonic foraminifera in deep-sea sediments. Science 168, 1345–1347. doi: 10.1126/science.168.3937.1345
Canterbury G. E., Martin T. E., Petit D. R., Petit L. J., Bradford D. F. (2000). Bird communities and habitat as ecological indicators of forest condition in regional monitoring. Conserv. Biol. 14, 544–558. doi: 10.1046/j.1523-1739.2000.98235.x
Carminati E., Corda L., Mariotti G., Scifoni A., Trippetta F. (2013). Mesozoic syn-and post rifting evolution of the central Apennines, Italy: The role of triassic evaporites. J. Geology 121, 327–354. doi: 10.1086/670730
Carothers J. H., Jaksić F. M. (1984). Time as a niche difference: The role of interference competition. Oikos 42, 403–406. doi: 10.2307/3544413
Coppini M., Hermanin L. (2007). Restoration of selective beech coppices: A case study in the Apennines (Italy). For. Ecol. Manage. 249, 18–27. doi: 10.1016/j.foreco.2007.04.035
Do Nascimento L. A., Campos-Cerqueira M., Beard K. H. (2020). Acoustic metrics predict habitat type and vegetation structure in the Amazon. Ecol. Indic. 117, 106679. doi: 10.1016/j.ecolind.2020.106679
Dröge S., Martin D. A., Andriafanomezantsoa R., Burivalova Z., Fulgence T. R., Osen K., et al. (2021). Listening to a changing landscape: Acoustic indices reflect bird species richness and plot-scale vegetation structure across different land-use types in north-eastern Madagascar. Ecol. Indic. 120, 106929. doi: 10.1016/j.ecolind.2020.106929
Easlon H. M., Bloom A. J. (2014). Easy Leaf Area: Automated digital image analysis for rapid and accurate measurement of leaf area. Appl. Plant Sci. 2, 1400033. doi: 10.3732/apps.1400033
Farina A. (1997). Landscape structure and breeding bird distribution in a sub-Mediterranean agro-ecosystem. Landscape Ecol. 12, 365–378. doi: 10.1023/A:1007934518160
Farina A. (2014). Soundscape Ecology: Principles, Patterns, Methods And Applications (Dordrecht: Springer Science & Business Media).
Farina A., Ceraulo M., Bobryk C., Pieretti N., Quinci E., Lattanzi E. (2015). Spatial and temporal variation of bird dawn chorus and successive acoustic morning activity in a Mediterranean landscape. Bioacoustics 24, 269–288. doi: 10.1080/09524622.2015.1070282
Farina A., Gage S. H. (2017). “Ecoacoustics: A new science,” in Ecoacoustics: The ecological role of sounds. Eds. Farina A., Gage S. H. (Oxford: John Wiley & Sons).
Farina A., James P. (2016). The acoustic communities: Definition, description and ecological role. Biosystems 147, 11–20. doi: 10.1016/j.biosystems.2016.05.011
Farina A., Li P. (2022). Methods in ecoacoustics. The acoustic complexity index (Nature, Switzerland: Springer).
Farina A., Mullet T. C., Bazarbayeva T. A., Tazhibayeva T., Bulatova D., Li P. (2021b). Perspectives on the ecological role of geophysical sounds. Front. Ecol. Evol. 9, 748398. doi: 10.3389/fevo.2021.748398
Farina A., Mullet T. C., Bazarbayeva T. A., Tazhibayeva T., Polyakova S., Li P. (2023). Sonotopes reveal dynamic spatio-temporal patterns in a rural landscape of northern Italy. Front. Ecol. Evol. 11, 1205272. doi: 10.3389/fevo.2023.1205272
Farina A., Pieretti N., Salutari P., Tognari E., Lombardi A. (2016). The application of the acoustic complexity indices (ACI) to ecoacoustic event detection and identification (EEDI) modeling. Biosemiotics 9, 227–246. doi: 10.1007/s12304-016-9266-3
Farina A., Righini R., Fuller S., Li P., Pavan G. (2021a). Acoustic complexity indices reveal the acoustic communities of the old-growth Mediterranean forest of Sasso Fratino Integral Natural Reserve (Central Italy). Ecol. Indic. 120, 106927. doi: 10.1016/j.ecolind.2020.106927
Farina A., Villa A. E. (2023). On the semantics of ecoacoustic codes. Biosystems 232, 105002. doi: 10.1016/j.biosystems.2023.105002
Forsman E. D., Meslow E. C., Wight H. M. (1984). Distribution and biology of the spotted owl in Oregon. Wildlife Monogr. 87, 3–64.
Gage S. H., Axel A. C. (2014). Visualization of temporal change in soundscape power of a Michigan lake habitat over a 4year period. Ecol. Inf. 21, 100–109. doi: 10.1016/j.ecoinf.2013.11.004
Ghwanmeh S. H. (2007). Applying clustering of hierarchical K-means-like algorithm on arabic language. Int. J. Comput. Inf. Eng. 1, 2396–2400.
Gini C. (1912). Variabilità e mutabilità: contributo allo studio delle distribuzioni e delle relazioni statistiche.[Fasc. I.] (Bologna: Tipogr. di P. Cuppini).
Greenberg J. H. (1956). The measurement of linguistic diversity. Language 32, 109–115. doi: 10.2307/410659
Hedfors P. (2004). Considering the authenticity of the garden soundscape: Preliminary research based on interviews. Garden History 32, 281–284. doi: 10.2307/4150388
Herrando S., Brotons L., Llacuna S. (2003). Does fire increase the spatial heterogeneity of bird communities in Mediterranean landscapes? Ibis 145, 307–317. doi: 10.1046/j.1474-919X.2003.00155.x
Hill A. P., Prince P., Snaddon J. L., Doncaster C. P., Rogers A. (2019). AudioMoth: A low-cost acoustic device for monitoring biodiversity and the environment. HardwareX 6, e00073. doi: 10.1016/j.ohx.2019.e00073
Holland E. P., Aegerter J. N., Dytham C., Smith G. C. (2007). Landscape as a model: the importance of geometry. PLoS Comput. Biol. 3, e200. doi: 10.1371/journal.pcbi.0030200
Horák J., Brestovanská T., Mladenović S., Kout J., Bogusch P., Halda J. P., et al. (2019). Green desert?: Biodiversity patterns in forest plantations. For. Ecol. Manage. 433, pp.343–pp.348. doi: 10.1016/j.foreco.2018.11.019
Joo W., Gage S. H., Kasten E. P. (2011). Analysis and interpretation of variability in soundscapes along an urban–rural gradient. Landscape Urban Plann. 103, 259–276. doi: 10.1016/j.landurbplan.2011.08.001
Kassambara A. (2017a). Practical guide to cluster analysis in R: Unsupervised machine learning Vol. 1 (Sthda). Available at: http://www.sthda.com.
Kassambara A. (2017b). Practical guide to principal component methods in R: PCA, M (CA), FAMD, MFA, HCPC, factoextra Vol. 2 (Sthda). Available at: http://www.sthda.com.
Krause B., Gage S. H., Joo W. (2011). Measuring and interpreting the temporal variability in the soundscape at four places in Sequoia National Park. Landscape Ecol. 26, 1247–1256. doi: 10.1007/s10980-011-9639-6
Kronfeld-Schor N., Dayan T. (2003). Partitioning of time as an ecological resource. Annu. Rev. Ecol. Evol. Syst. 34, 153–181. doi: 10.1146/annurev.ecolsys.34.011802.132435
Laiolo P., Rolando A., Valsania V. (2004). Responses of birds to the natural re-establishment of wilderness in montane beechwoods of North-western Italy. Acta Oecologica 25, 129–136. doi: 10.1016/j.actao.2003.12.003
Lance G. N., Williams W. T. (1966). Computer programs for hierarchical polythetic classification (“similarity analyses”). Comput. J. 9, 60–64. doi: 10.1093/comjnl/9.1.60
Lellouch L., Pavoine S., Jiguet F., Glotin H., Sueur J. (2014). Monitoring temporal change of bird communities with dissimilarity acoustic indices. Methods Ecol. Evol. 5, 495–505. doi: 10.1111/2041-210X.12178
Mace B. L., Bell P. A., Loomis R. J. (2004). Visibility and natural quiet in national parks and wilderness areas: Psychological considerations. Environ. Behav. 36, 5–31. doi: 10.1177/0013916503254747
Madonia G., Forti P. (2003). Le aree gessose d’Italia (Emilia Romagna , a cura di D. Demaria), (Bologna: Memorie dell'Istituto Italiano di Speleologia) Vol. 14, 286 pp.
Matsinos Y. G., Tsaligopoulos A. (2018). Hot spots of ecoacoustics in Greece and the issue of background noise. J. Ecoacoustics 2. doi: 10.22261/jea.u3xbiy
Miller L. N. (1978). Sound levels of rain and of wind in the trees. Noise Control Eng. 11, 101–109. doi: 10.3397/1.2832104
Moir M. L., Brennan K. E. C. (2007). “Using bugs (Hemiptera) as ecological and environmental indicators in forest ecosystems,” in Forest Ecology Research Horizons (Nova, New York), pp.203–pp.238.
Monacchi D. (2013). Fragments of extinction: acoustic biodiversity of primary rainforest ecosystems. Leonardo Music J. 23, 23–25. doi: 10.1162/LMJ_a_00148
Morgan K. A., Gates J. E. (1982). Bird population patterns in forest edge and strip vegetation at Remington Farms, Maryland. J. Wildlife Manage. 46, 933–944. doi: 10.2307/3808226
Moskát C. (1988). Breeding bird community and vegetation structure in a beech forest in the Pilis Mountains, N. Hungary. Aquila 95, 105–112.
Mueller-Dombois D., Ellenberg D. (1974). Aims and methods of vegetation ecology (New York: Wiley), 547.
Mullet T. C. (2020). An ecoacoustic snapshot of a subarctic coastal wilderness: Aialik Bay, Alaska 2019. J. Ecoacoustics 4. doi: 10.35995/jea4010002
Mullet T. C., Farina A., Gage S. H. (2017b). The acoustic habitat hypothesis: An ecoacoustics perspective on species habitat selection. Biosemiotics 10, 319–336. doi: 10.1007/s12304-017-9288-5
Mullet T. C., Gage S. H., Morton J. M., Huettmann F. (2016). Temporal and spatial variation of a winter soundscape in south-central Alaska. Landscape Ecol. 31, 1117–1137. doi: 10.1007/s10980-015-0323-0
Mullet T. C., Morton J. M., Gage S. H., Huettmann F. (2017a). Acoustic footprint of snowmobile noise and natural quiet refugia in an Alaskan wilderness. Natural Areas J. 37, 332–349. doi: 10.3375/043.037.0308
Nocentini S. (2009). Structure and management of beech (Fagus sylvatica L.) forests in Italy. iForest-Biogeosciences Forestry 2, 105. doi: 10.3832/ifor0499-002
Patrignani A., Ochsner T. E. (2015). Canopeo: A powerful new tool for measuring fractional green canopy cover. Agron. J. 107, 2312–2320. doi: 10.2134/agronj15.0150
Pekin B. K., Jung J., Villanueva-Rivera L. J., Pijanowski B. C., Ahumada J. A. (2012). Modeling acoustic diversity using soundscape recordings and LIDAR-derived metrics of vertical forest structure in a neotropical rainforest. Landscape Ecol. 27, 1513–1522. doi: 10.1007/s10980-012-9806-4
Pezzi G., Bitelli G., Ferrari C., Girelli V. A., Gusella L., Masi S., et al. (2007). Pattern temporale del limite altitudinale dei boschi di faggio nell’Appennino settentrionale. Un’analisi di dati fotogrammetrici. Forest@-Journal Silviculture For. Ecol. 4, 79.
Pezzi G., Ferrari C., Corazza M. (2008). The altitudinal limit of beech woods in the Northern Apennines (Italy). Its spatial pattern and some thermal inferences. Folia Geobotanica 43, 447–459. doi: 10.1007/s12224-008-9025-6
Puccinelli A., D’Amato Avanzi G., Perilli N. (2015). Note Illustrative della Carta Geologica d’Italia alla scala 1:50.000 Foglio 2342 Fivizzano e Carta Geologica. (Roma: ISPRA, Servizio Geologico d’Italia). 158 pp.
Qi J., Yu Y., Wang L., Liu J., Wang Y. (2017). An effective and efficient hierarchical K-means clustering algorithm. Int. J. Distributed Sensor Networks 13, 1550147717728627. doi: 10.1177/1550147717728627
Quinn C. A., Burns P., Gill G., Baligar S., Snyder R. L., Salas L., et al. (2022). Soundscape classification with convolutional neural networks reveals temporal and geographic patterns in ecoacoustic data. Ecol. Indic. 138, 108831. doi: 10.1016/j.ecolind.2022.108831
R Core Team (2023). R: A Language and Environment of Statistical Computing (Vienna, Austria: R. Foundation for Statistical Computing). Available at: https://www.R-project.org/.
Rolstad J. (1991). Consequences of forest fragmentation for the dynamics of bird populations: conceptual issues and the evidence. Biol. J. Linn. Soc. 42, 149–163. doi: 10.1111/bij.1991.42.issue-1-2
Schall P., Gossner M. M., Heinrichs S., Fischer M., Boch S., Prati D., et al. (2018). The impact of even-aged and uneven-aged forest management on regional biodiversity of multiple taxa in European beech forests. J. Appl. Ecol. 55, 267–278. doi: 10.1111/1365-2664.12950
Shannon C. W., Weaver W. (1948) The mathematical theory of communication (Urbana and Chicago: University of Illinois Press).
Shepherd M. J., Lindsey L. E., Lindsey A. J. (2018). Soybean canopy cover measured with Canopeo compared with light interception. Agric. Environ. Lett. 3, 180031. doi: 10.2134/ael2018.06.0031
Sueur J., Pavoine S., Hamerlynck O., Duvail S. (2008). Rapid acoustic survey for biodiversity appraisal. PLoS One 3, e4065. doi: 10.1371/journal.pone.0004065
Team F. (2022) 9 Best measure tree height apps for android & iOS. Available online at: https://freeappsforme.com/measure-tree-height-apps/.
Vos W. (1993). Recent landscape transformation in the Tuscan Apennines caused by changing land use. Landsc. Urban Plan. 24, 63–68. doi: 10.1016/0169-2046(93)90084-Q
Whittaker R. H., Levin S. A., Root R. B. (1975). On the reasons for distinguishing" niche, habitat, and ecotope". Am. Nat. 109, 479–482. doi: 10.1086/283018
Keywords: ecoacoustics, landscape, sonoscape, sonotope hypothesis, vegetation structure, spectral sonic signature, mean spectral dissimilarity, sonotope heterogeneity
Citation: Farina A and Mullet TC (2024) Sonotope patterns within a mountain beech forest of Northern Italy: a methodological and empirical approach. Front. Ecol. Evol. 12:1341760. doi: 10.3389/fevo.2024.1341760
Received: 20 November 2023; Accepted: 12 February 2024;
Published: 07 March 2024.
Edited by:
Yixin Zhang, Soochow University, ChinaReviewed by:
Elisa Girola, The University of Queensland, AustraliaKevin Felix Arno Darras, INRA Centre Val de Loire, France
Copyright © 2024 Farina and Mullet. This is an open-access article distributed under the terms of the Creative Commons Attribution License (CC BY). The use, distribution or reproduction in other forums is permitted, provided the original author(s) and the copyright owner(s) are credited and that the original publication in this journal is cited, in accordance with accepted academic practice. No use, distribution or reproduction is permitted which does not comply with these terms.
*Correspondence: Almo Farina, almo.farina@uniurb.it