Home range size of Tengmalm’s owl offspring during the post-fledging dependence period in Central and North Europe
 Simona Stehlíková Sovadinová1*†‡
  Marek Kouba1,2†‡
  Michal Ševčík1,3‡
  Filip Tulis1,3‡
  Tomáš Bušina1†
  Erkki Korpimäki4†
- 1Department of Ethology and Companion Animal Science, Faculty of Agrobiology, Food and Natural Resources, Czech University of Life Sciences Prague, Prague, Czechia
- 2Department of Game Management and Wildlife Biology, Faculty of Forestry and Wood Sciences, Czech University of Life Sciences Prague, Prague, Czechia
- 3Department of Ecology and Environmental Sciences, Faculty of Natural Sciences and Informatics, Constantine the Philosopher University in Nitra, Nitra, Slovakia
- 4Section of Ecology, Department of Biology, University of Turku, Turku, Finland
A greater knowledge of the intrinsic and extrinsic factors of animal home range (HR) formation can help us to understand the fundamental biological issues underlying, for instance, movement patterns, habitat selection and survival. However, very little is known about the HRs of birds of prey fledglings, even though the post-fledging phase is recognised as crucial due to the high mortality of juvenile birds. We radio-tracked 138 Tengmalm’s owl (Aegolius funereus) fledglings from 43 broods to determine their HRs during the post-fledging dependence period and to investigate the factors affecting their sizes. The study was conducted during four breeding seasons in Czechia and two seasons in Finland. The mean fledglings’ HR size calculated according to the 95% IID Kernel Density Estimation method was 63.7 ± 43.9 ha (± SD; n = 71) during nocturnal activity and 52.0 ± 46.1 ha (n = 63) during diurnal roosting. The sizes of both nocturnal activity and diurnal roosting HRs increased with the longer individual duration of the post-fledging dependence period and also the higher rank of hatching within a brood. Diurnal roosting HRs were two times smaller in the Czech site, probably because of the very limited number of dense forest patches suitable for roosting as a legacy of the air pollution calamity in the 1970s, during which most coniferous stands died out. There was no difference in the size of nocturnal activity HR between the two study areas, although they differed markedly in terms of night length, altitude, weather, and forest age, structure and composition. This suggests that environmental factors are not decisive in determining the size of nocturnal activity HRs of Tengmalm’s owl fledglings. Since the diurnal HRs always occurred within the area of the nocturnal HRs, we suggest that conservation of the densest and preferably oldest forest stands within the areas of the study species occurrence may offer straightforward conservation tasks for protecting Tengmalm’s owl fledglings and also other species.
1 Introduction
Many animal species are capable of the cognitive mapping of environments depending on the changing conditions and availability of resources (Peters, 1978). Animals create these cognitive maps within their home range (hereafter HR), a relatively confined area where individuals perform their day-to-day activities (Powell, 2000). HRs are characterized according to size, shape, structure (Kenward, 2001) and particular time intervals (Harris et al., 1990; Powell, 2000; Laver and Kelly, 2008). A knowledge of animal HRs and movement patterns is fundamental for understanding the underlying mechanisms, such as survival, habitat use and dispersion (Delgado et al., 2009).
For any individual to survive and reproduce and thus increase its fitness, it must respond to changes in environmental conditions. These adaptive responses likewise affect animal spatial behaviour (Powell and Mitchell, 2012). Consequently, HR formation in the majority of vertebrates is attributed to different intrinsic and/or extrinsic factors, the most essential of which are food supply, predation pressure and conspecific density (McLoughlin and Ferguson, 2000). For example, HRs usually decrease with increasing food availability in many animal species (Desy et al., 1990; Broughton and Dickman, 1991; Akbar and Gorman, 1993; Kouba et al., 2017).
Burt (1943) argued that HRs do not apply to young adolescents because they are only wandering in search of a home region. Nonetheless, young animals also obviously use areas which are bounded to a lesser or greater extent, and in many studies, authors consider juveniles’ location of occurrence as “home ranges” (e.g., Belthoff et al., 1993; Kouba et al., 2013; Pedersen et al., 2013). However, it is important to stress that while adults choose their living space based on internal and external reasons, the HRs of offspring are, at least at the beginning of their lives, assigned to them by their parents. This fact applies especially to the fledglings of birds of prey that typically stay within the natal area because they depend on parental food provisioning after leaving the nest until they achieve independence and start natal dispersion (Newton, 1979; Kenward et al., 1993).
The phase between leaving the nest and reaching independence (the post-fledging dependence period – hereafter PFDP) is crucial due to the high mortality rate among young birds (Bustamante, 1995; Todd, 2001; Delgado et al., 2009). Given this fact, a broader knowledge regarding the spatial behaviour of birds of prey fledglings could help manage their conservation. Nevertheless, the movement patterns of juveniles have received little academic attention (see, however, Bustamante, 1995; Delgado et al., 2009; Kouba et al., 2013). Previous studies focusing on birds of prey juveniles have described only their HR sizes and/or habitat use (van Riper and van Wagtendonk, 2006; Mrykalo et al., 2007; Pedersen et al., 2013), but this research did not address the variables that determine the size of their HRs. Owl fledglings are known to extend their distance from the nest and occupy larger HRs with increasing age, most probably because of their improved mobility and progressive maturity (Belthoff et al., 1993; Penteriani et al., 2005; Kouba et al., 2013; Pedersen et al., 2013).
Our model species, the Tengmalm’s owl (Aegolius funereus), is a small, nocturnal predatory bird inhabiting the coniferous forests of the Holarctic zone (König and Weick, 2008). The diet of Tengmalm’s owls consists mainly of small rodents, especially voles of the genera Microtus and Myodes (Korpimäki and Hakkarainen, 2012), in addition to alternative prey such as shrews of the genus Sorex and small forest birds (Korpimäki, 1988; Korpimäki and Hakkarainen, 2012). Prey abundance is a crucial factor regarding Tengmalm’s owls’ foraging, spatial behaviour and reproduction. For instance, egg-laying dates are earlier and clutch sizes and overall breeding success are higher in good-food years compared to poor ones (Korpimäki and Hakkarainen, 1991; Hakkarainen et al., 2003; Korpimäki and Hakkarainen, 2012). Chicks hatch asynchronously at two-day intervals, and there are therefore age and size differences between offspring (Korpimäki, 1981; Valkama et al., 2002). Owlets usually fledge at one-day intervals in the same order as they hatched (Kouba et al., 2015).
To date, the only study that has analysed the HRs of Tengmalms’ owl fledglings during the PFDP was conducted in the Ore Mts., Czechia (Kouba et al., 2013), and the data presented in this research (from 2010 and 2011) was also used in the current study. The mean HR size of juveniles during PFDP was considerably smaller during the rich food year than in the poor food year (30.3 vs 57.7 ha); the PFDP lasted 45 and 57 days, respectively, and siblings’ nest boxes were usually located on the border of their HRs (Kouba et al., 2013). The authors further suggested that Tengmalm’s owl males probably participated in forming the HRs of juveniles because they may lead their offspring towards the best hunting area/s to decrease prey delivery distance and energy expended on flying.
Although several studies on the HR sizes of birds of prey fledglings throughout the PFDP testing single variables (e.g., habitat use) have already been published, the current study is unique because, as far as we are aware, no studies to date have tested several different variables in combination or attempted to identify which factors are decisive in determining the size of HRs in owl or diurnal raptor fledglings. Therefore, the main aims of our study were to determine (1) the average HR size of Tengmalm’s owl fledglings during nocturnal activity and diurnal roosting throughout the PFDP. In particular, we aimed to determine which (2) biotic and abiotic factors (e.g., prey abundance, weather conditions, latitude and altitude) as well as (3) individual characteristics (e.g., order of hatching, number of siblings and PFDP duration) can affect their sizes. In addition, we compared (4) our results with those of two study/geographical areas, i.e., in Central and North Europe, regions with both long and short nocturnal activity periods.
We expected to find marked differences in both the nocturnal (i) and diurnal (ii) HR sizes of fledglings between the study sites in Czechia and Finland because of entirely different habitats and environments (e.g., long vs short nights). Furthermore, we predicted that the HR sizes of juveniles will increase with (iii) decreasing prey abundance due to males encouraging fledglings to move farther from the nests in order to shorten prey delivery distance (Hakkarainen et al., 2003; Kouba et al., 2013). In addition, we expected the HRs will also increase in line with (iv) increasing duration of the PFDP because fledglings will generally move further from the nest in this period. Similarly, we predicted that (v) increasing hatching/fledging order within the sibling group will be a relevant factor because the last individuals to fledge are usually also the last to reach independence and will therefore be forced to move furthest from the nest (Kouba et al., 2013).
2 Materials and methods
2.1 Study areas
The study was conducted over six breeding seasons in Czechia in 2010–2012, 2015 and in Finland in 2019 and 2021. The Czech site (50° N, 13° E; 730–960 m a. s. l.; ca. 120 square km) is situated in the Ore Mountains and included ca. 120–170 nest boxes (Kouba et al., 2013, 2015). The study area was severely damaged by historical air pollution events (for more information, see, e.g., Kouba et al., 2013). Currently, the area is mainly forested, predominantly by blue spruce (Picea pungens, covering approximately 28% of the area), Norway spruce (Picea abies, 26%), birch (Betula spp., 11%), European mountain ash (Sorbus aucuparia, 5%), European beech (Fagus sylvatica, 4%) and European larch (Larix decidua, 4%).
The Finnish site is situated in the Kauhava region of western Finland (63° N, 23° E; 50–110 m a. s. l.; ca. 1000 square km) and included ca. 450 nest boxes (Korpimäki and Hakkarainen, 1991, 2012). Approximately 61% of this study area is forested, with the predominant species being Scots pine (Pinus sylvestris, forming ca. 65% of the local forests), Norway spruce (>30%), and a minority of deciduous trees (birches and Eurasian aspen, Populus tremula) (Korpimäki and Hakkarainen, 2012).
The nest boxes in both study areas were of a similar design; they were made of wood, square in section with a base of 18–25 x 18–25 cm, 40–60 cm height, and an 8–10 cm diameter entrance hole.
2.2 Field and laboratory procedures
All nest boxes in both study areas and across all study years were regularly visited from early March to late June to find nests. If nesting was identified, the nests were checked sufficiently often to determine the number of eggs and hatchlings and to determine the exact hatching date (± 1 day). The age of the nestlings was based on the recorded dates of hatching. Fifty μl of blood was collected from each nestling by brachial vein puncture under the wing approximately 14 days after hatching for molecular sexing as has been described in a previously published study by Kouba et al. (2020b). The laboratory sex determination of nestlings was performed according to the method developed by Fridolfsson and Ellegren (1999).
From 25 days after the hatching of the first chick, the nest boxes were checked at one or two-day intervals. All individuals were weighed and the wing length was measured to estimate the appropriate time for tagging (Kouba et al., 2013, 2014). Nestlings were equipped with type PIP4 leg-mount transmitter (Biotrack Ltd., UK) 27 ± 2 (mean ± SD) days after hatching and 5 ± 2 days before fledging. Together with the tail-mount, the leg-mount attachment method was suggested as the best possible as it appears to have the fewest adverse effects (Geen et al., 2019). In accordance with the methods of Kouba et al. (2013), nest boxes were visited at 12-hour-intervals during the night (22:00–04:00 in Czechia; 23:00–03:00 in Finland) and during daylight (10:00–21:00 in the Czech Rep.; 8:00–21:00 in Finland) until all siblings had fledged and the exact date of nest box departure was determined. The transmitter weight within all six seasons was 2.5 ± 0.5 g (± SD) on average (lifespan ± 10 weeks), following welfare recommendations that the transmitters should not exceed 3% of the body mass of the tagged individuals (e.g., Withey et al., 2001).
After fledging, the young were radio-tracked using the “homing-in” method (Kenward, 2001), in which the signal is followed to a particular tree or until the individual is observed, until they became independent, until they are found dead, or until they disappear. Fledglings were located at ca. 24-hour-intervals, i.e., once every night in 2010 and 2011, and once every day in 2015 (Czechia), and at ca. 12-hour-intervals, i.e., once every night and every day in 2012 (Czechia), 2019 and 2021 (Finland). Radio signals were monitored using Yupiteru MVT-9000 receivers (Yupiteru Industries Co. Ltd., Japan) and 3-element Yagi antennas, and fledglings’ positions were recorded using handheld GPS receivers (Garmin GPSmap 60CSx or Astro 230, Garmin Ltd., USA). The PFDP starts with the departure of the owlets from the nest, but the end of PFDP is obviously less precisely demarcated. We defined the end of the PFDP with the first rapid and abrupt movement away from fledglings’ habitual locations, an event previous studies have suggested may correspond with the cessation of begging for food (Kouba et al., 2013, 2014).
Owls in Czechia were trapped, handled, blood sampled and tagged under Permits Nos. 530/758 R/08-Abt/UL, 35016/02-OOP/8751/02 and 173/049/ZPZ/2015/ZD-838 issued by the Ministry of the Environment of the Czech Republic. The birds were ringed under the supervision of the Ringing Centre of the National Museum in Prague, Permit No. 329. Fledglings in Finland were tagged and radio-tracked under the approval of the Centre for Economic Development, Transport and the Environment (Varsinais-Suomen Elinkeino-, Liikenne- ja Ympäristökeskus: Permit No. VARELY/1389/2018), ringed under the ringing licence of the Finish Museum of Natural History (Licence No. 524). Blood samples were taken under the approval of the Animal Experiment Committee of the State Provincial Office (Etelä-Suomen aluehallintovirasto ESAVI; Permit No. ESAVI/3021/04.10.07/2017), and all efforts were made to minimize suffering.
2.3 Prey abundance
As with other birds of prey, fluctuations in the abundance of main prey are a fundamental determining factor of survival and reproduction for Tengmalm’s owls (Southern, 1970; Korpimäki and Lagerström, 1988; Korpimäki and Hakkarainen, 1991; Hakkarainen et al., 2002; Kouba et al., 2020a). The fluctuations of most vole populations are local and seasonal without regular cycles in Central and Western Europe, including the study area of the Ore Mts. (Hansson and Henttonen, 1988). In contrast, population cycles with regular peaks at intervals of three years are usually present in the Kauhava study area and elsewhere in North Europe (Korpimäki, 1986; Hansson and Henttonen, 1988; Korpimäki and Krebs, 1996; Korpimäki et al., 2005). In both study areas, the abundance of potential prey (small terrestrial mammals) was assessed using snap traps set in late spring (early June in the Czech site and early May in the Finnish site). Snap-traps were set up in squares with 10 m spacing and were checked each morning for three consecutive days. For each year of the study, the total trapping effort in the Czech study site was 1089 trap nights (n = 3 locations), with ca. 600 trap nights (n = 8 locations) carried out in the Finnish study site. The number of captured mammals per 100 trap nights was calculated for each trapping site and breeding season (Table 1; Supplementary Table S1).
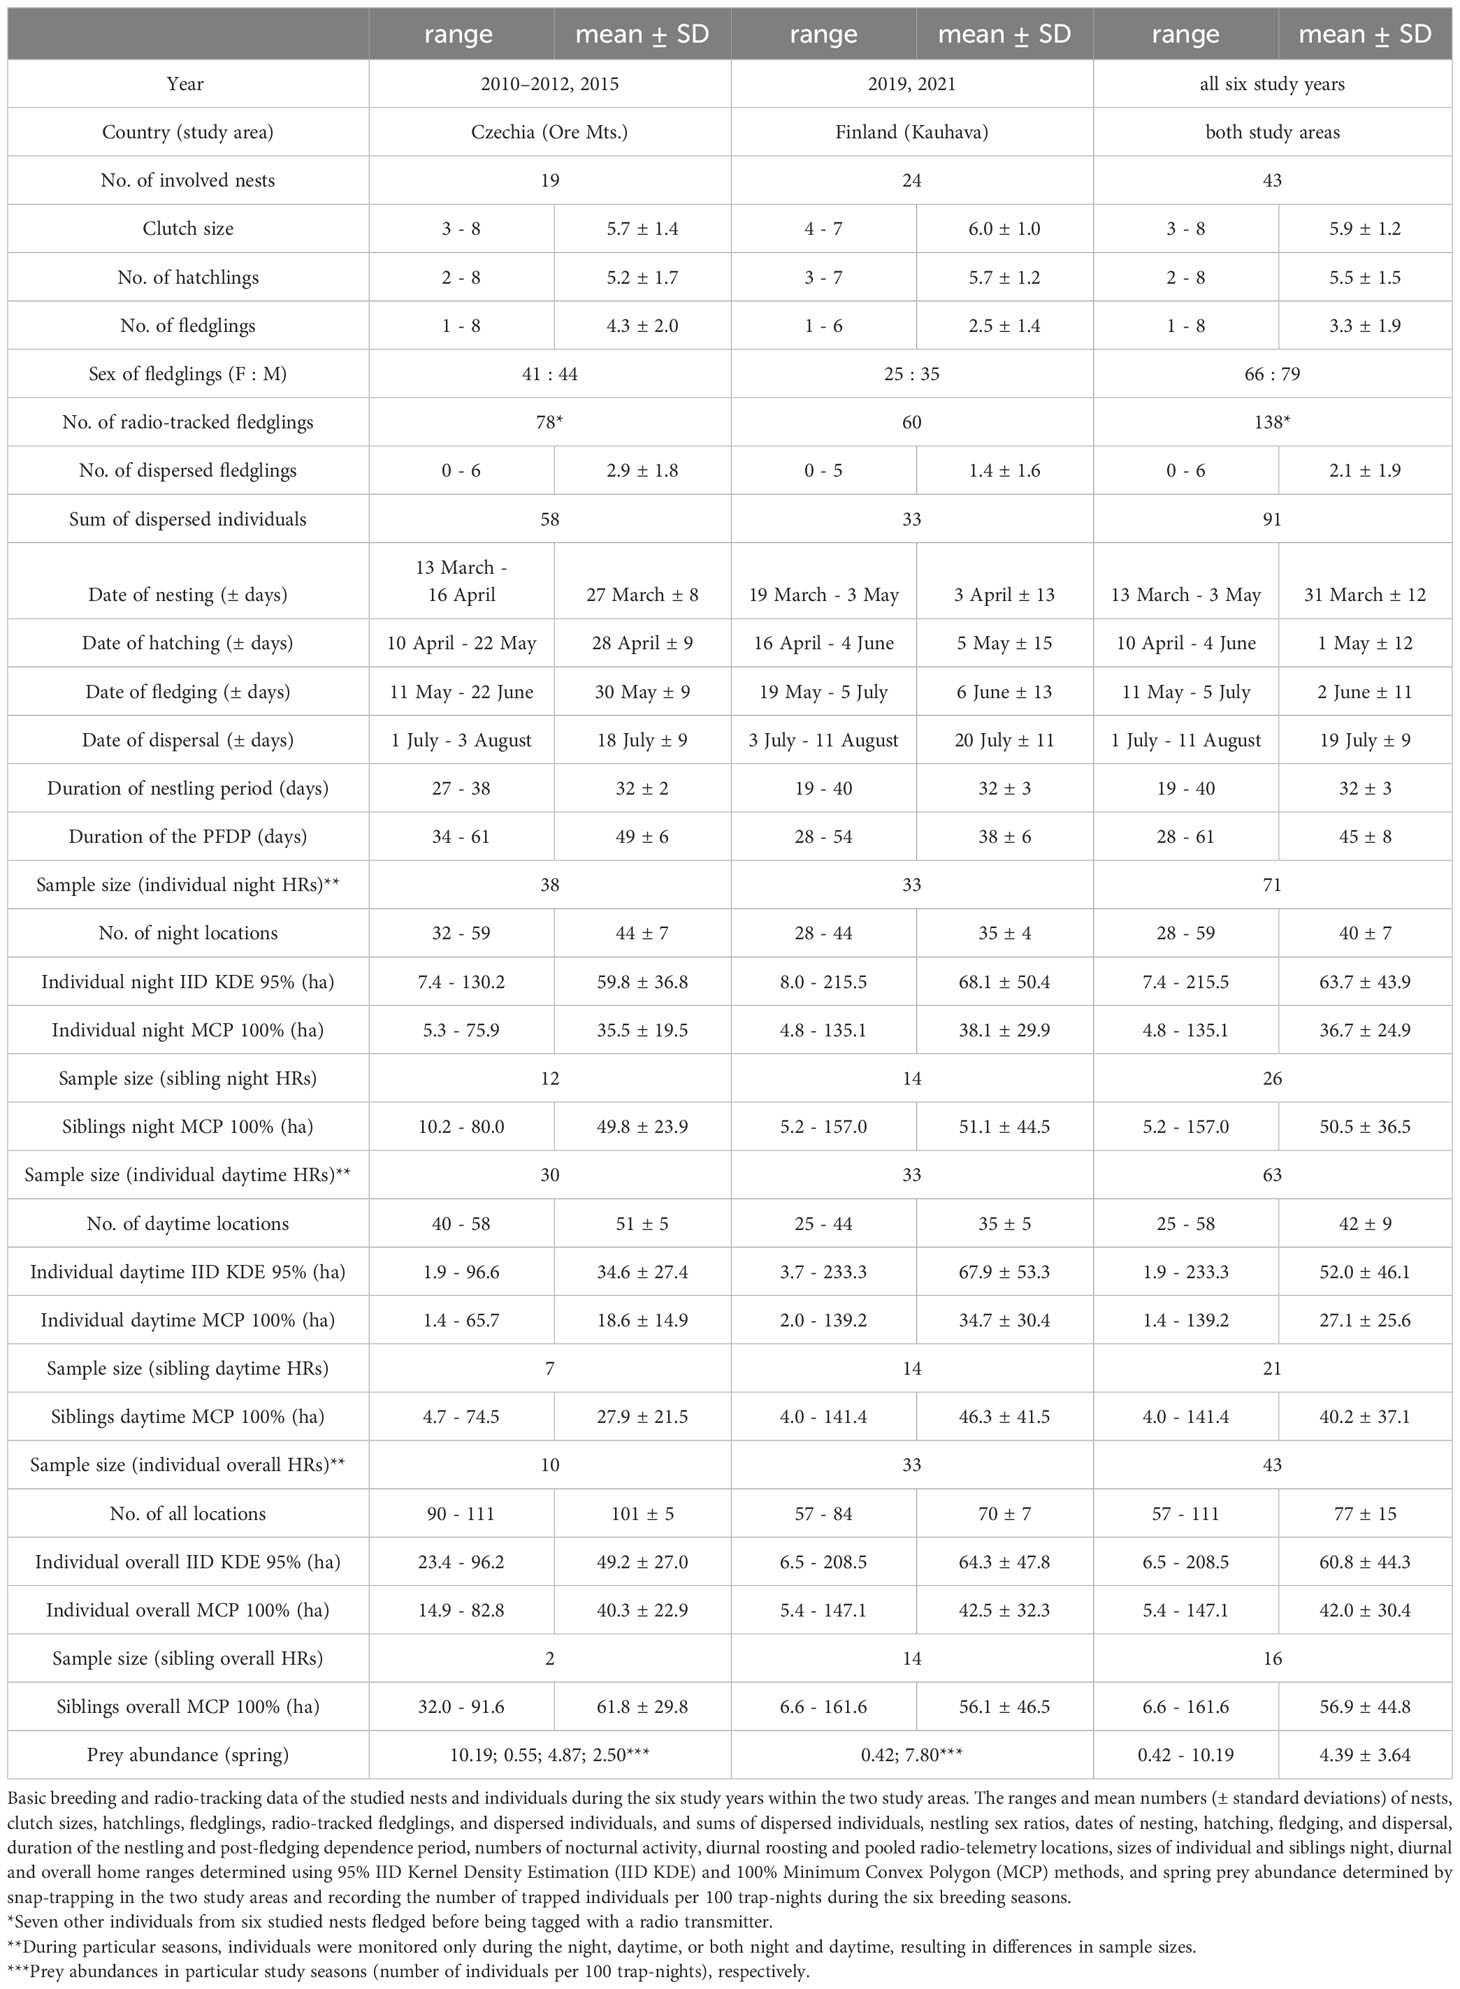
Table 1 Basic breeding and radio-tracking data of monitored nests and individuals.
2.4 Statistical analyses
All statistical analyses, including the home range estimation, were performed using R software version 4.3.1 (R Core Team, 2023) in the following four steps: home range estimation, exploratory data analysis (variable selection and hypothesis formulation), model fitting and model selection. Initially, we applied five different HR size estimation methods and two distinct statistical approaches for data evaluation, but the conclusions obtained were practically identical, and therefore only the two best HR estimation methods and a single statistical approach are described and presented below. For a full description and further details regarding the comparison of HR estimation methods and statistical approaches, see Supplementary Information File.
Firstly, based on the preliminary analysis (S1 File), the nocturnal (a), diurnal (b) and overall (c) HRs of fledglings throughout the PFDP were established using the IID Kernel Density Estimation method (IID KDE; Noonan et al., 2019) and the Minimum Convex Polygon method (MCP; Hayne, 1949). All the HRs were based on all locations collected for each individual during the given period, and no fixes were discarded. The overall HRs were based on pooled nocturnal and diurnal fixes. Each individual’s HR size was thus calculated using the 95% IID KDE and 100% MCP model from the ctmm package. These two methods were ultimately selected because they work differently in assessing the HRs, arse based on different presumptions, and are the most commonly used tools for estimating HRs across different study species and objectives (e.g., Laver and Kelly, 2008).
Secondly, we tested if there were differences in HR sizes between the two localities (Czech vs Finnish site) and individual day phases (daylight vs night-time). Although there were non-significant differences between localities, such as the phases of the day (except for daytime) and their interaction (see the Results section), we decided to split the dataset and run the analysis both for the day and for the night separately due to the strictly separated daylight and night-time circadian activity of the Tengmalm’s owl (Korpimäki, 1981). We also decided to keep the locality as a variable because the preliminary analysis indicated the possibility of relationships between locality and some other independent variables (e.g., individual duration of PFDP and the two meteorological variables used) which could improve the interoperability of the final models.
We followed the recommendations for using independent variables to avoid collinearity in the data set (Dormann et al., 2012). In order to detect intercorrelation and multicollinearity, we used related threshold statistics, such as Tolerance value (<0.2), Variance Inflation factor (>5) and Condition Number (>10), which proved to be useful (Dormann et al., 2012; Kim, 2019). Those with more biological relevance were used in a conflict of two or more variables. In further analyses, no variables found to be intercorrelated were used together in the same model.
As part of our preliminary analysis, we followed the procedures outlined by Kouba et al. (2023) to reduce the number of models tested, and this approach helped to prevent overfitting in the final models. During our exploratory analysis, we omitted variables that did not affect any of the HR estimates; the excluded variables were those of nestling sex, individual date of fledging, wing length of fledglings approximated to the age of 30 days after hatching, mean precipitation and temperature during individual PFDP, and spring prey abundance index.
The final independent variables used to fit the final models (a priori hypotheses, see Supplementary Table S2) were as follows: nest box ID, individual duration of stay on the nest, individual duration of the PFDP, order of hatching within a given brood, number of fledglings in a given brood, and locality (study area).
The six dependent variables tested were as follows: the HR size of the Tengmalm’s owl fledglings recorded throughout the PFDP during (a) nocturnal activity, (b) diurnal roosting, and (c) pooled nocturnal and diurnal activities (overall HRs) calculated using 95% IID KDE (a1, b1, c1) and 100% MCP (a2, b2, c2).
Thirdly, the relationships between the six dependent variables (models a, b, c) and the independent variables were described using a linear mixed model (with nloptwrap optimiser) through the lme4::lmer() function (Bates et al., 2015). The model included the variable nest box ID as a random intercept for the grouping variable to account for the non-independence of observations within each brood. The degrees of freedom of the presented statistics were estimated using the Satterthwaite approximation (Kuznetsova et al., 2017). All dependent variables were square-root transformed to meet the linear mixed model’s assumptions.
Fourthly, model selections based on Information-Theoretic Criteria were used to find the best model/s. We ranked all possible models by their second-order Akaike’s information criterion (AICc – corrected AIC for small-sample) scores using the dredge function in R package MuMIn (Bartoń, 2022). In line with the method described by Burnham and Anderson (2002), only models with ΔAICc values (AICc differences between a model with the smallest AICc and the compared model) of less than 2 were considered as good as the best model and were therefore used to interpret the model. We evaluated the relative importance of each variable included in the global model by examining model weights across all models comprised of the variable (Burnham and Anderson, 2002). All models were fitted using ML (Maximum Likelihood) during model selection, and only the final models were refitted using REML (Restricted ML).
3 Results
A total of 138 nestlings from 43 nests equipped with radio transmitters fledged successfully during the six study years: 78 individuals from 19 broods in the Czech study site and 60 individuals from 24 broods in the Finnish site (Table 1; Supplementary Table S1). Throughout the PFDP until dispersal, 91 fledglings (58 in Czechia and 33 in Finland) were monitored successfully; the remaining 44 individuals died, two were excluded due to transmitter failure and one disappeared. As a result, HRs could only be established for these 91 juveniles. Nocturnal activity HRs were calculated for 71 fledglings, diurnal roosting HRs for 63 fledglings, and overall HRs for 43 individuals. The HRs were based on 5523 locations (2852 nocturnal and 2671 diurnal). The mean size of nocturnal activity HRs during the PFDP for Tengmalm’s owl fledglings (n = 71) calculated using 95% IID KDE was 63.7 ± 43.9 ha (± SD; median = 53.7 ha), and that of diurnal roosting HRs (n = 63) was 52.0 ± 46.1 ha (median = 32.3 ha). The mean size of overall HRs (n = 43) calculated using 95% IID KDE was 60.8 ± 44.3 ha (median = 55.9 ha; Table 1; Supplementary Table S1). The nocturnal activity HRs of siblings (n = 18 nests where two or more brood members were monitored until independence) overlapped by 62 ± 22% (mean ± SD) and the diurnal roosting HRs of siblings (n = 15) overlapped by 49 ± 23% when calculated using 95% IID KDE method. The representation of old-growth forests within 500 m radii around nest boxes of the studied broods was ca. two times higher in Finland (16 ± 7%; mean ± SD) than in Czechia (7 ± 11%) (see details in Table 2).
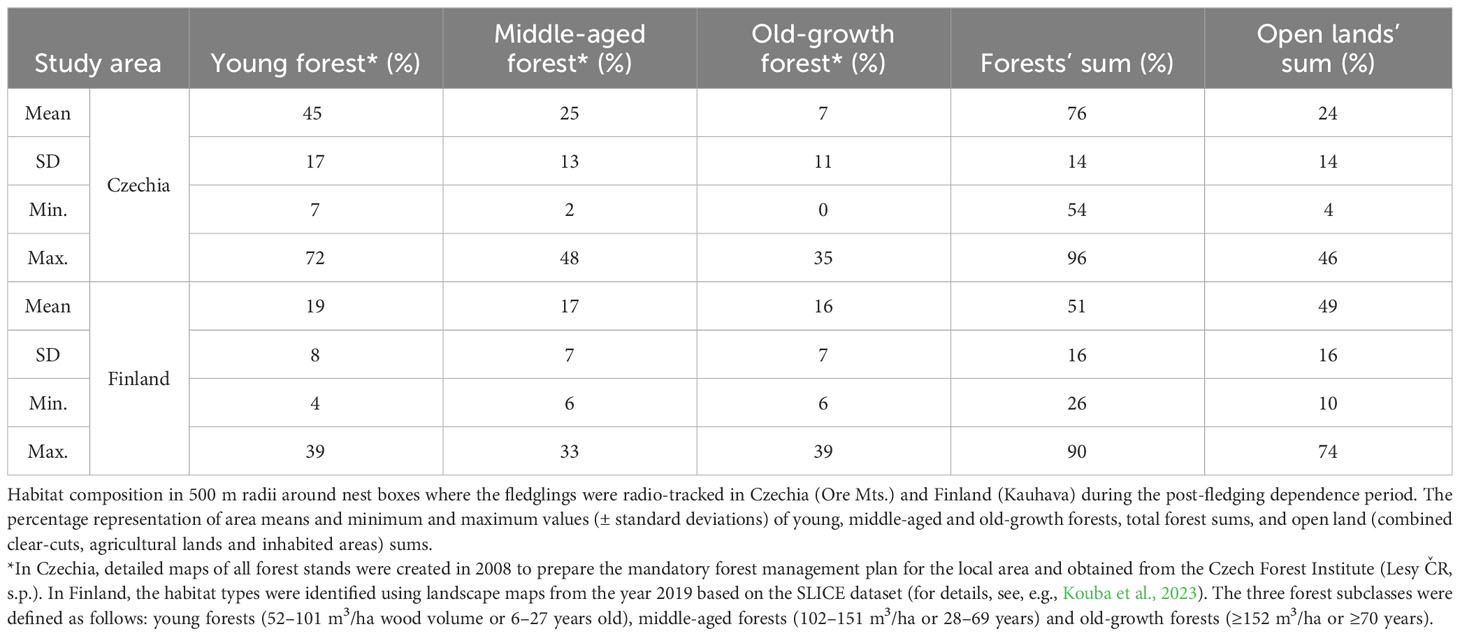
Table 2 Habitat composition around nest boxes of studied broods.
The HR sizes of fledglings with (a) nocturnal activity and those with (c) overall ones based on pooled nocturnal and diurnal data sets throughout the PFDP from Czechia and Finland did not differ from each other when calculated using either IID KDE or MCP methods (nocturnal HRs: IID KDE: t57.7 = 0.78, p = 0.44, MCP: t53.5 = 0.41, p = 0.68; overall HRs: IID KDE: t26.2 = 1.22, p = 0.23, MCP: t20.1 = 0.24, p = 0.81). However, the HR sizes of (b) diurnal roosting were approximately two times smaller in Czechia than in Finland for both methods (diurnal HRs: IID KDE: t48.8 = 3.11, p = 0.003, MCP: t47.6 = 2.66, p = 0.001). The fledglings’ HR sizes of (a) nocturnal activity and (b) diurnal roosting throughout the PFDP did not differ from each other using either IID KDE or MCP calculations when the data sets from both study sites were pooled (IID KDE: t125.2 = -1.91, p = 0.06; MCP: t127 = -2.74, p = 0.07). Therefore, we subsequently pooled data from both study areas for further analysis, but we examined the HRs recorded during nocturnal activity and diurnal roosting separately. Lastly, the fledglings’ HR sizes of (a) nocturnal activity and (b) diurnal roosting established using IID KDE differed significantly from those calculated by the MCP method (t70 = 16.98, p < 0.001), with the HRs calculated by IID KDE being almost two times greater than those established using the MCP method.
However, the fixed effects explaining the square-root transformed HR size of both (a) nocturnal activity and (b) diurnal roosting (models a1 and a2; b1 and b2) calculated using IID KDE and MCP were virtually identical, and therefore only the results of the IID KDE calculations are presented here (Table 3; for the results of the MCP calculations, see Supplementary Table S3). Finally, the results of models c1 and c2 regarding square-root transformed fledglings’ overall HR size established using both IID KDE and MCP were virtually identical to those of models a1 and a2 regarding the nocturnal activity. As a result, both these models (c1 and c2) are presented in Supplementary Table S3 only.
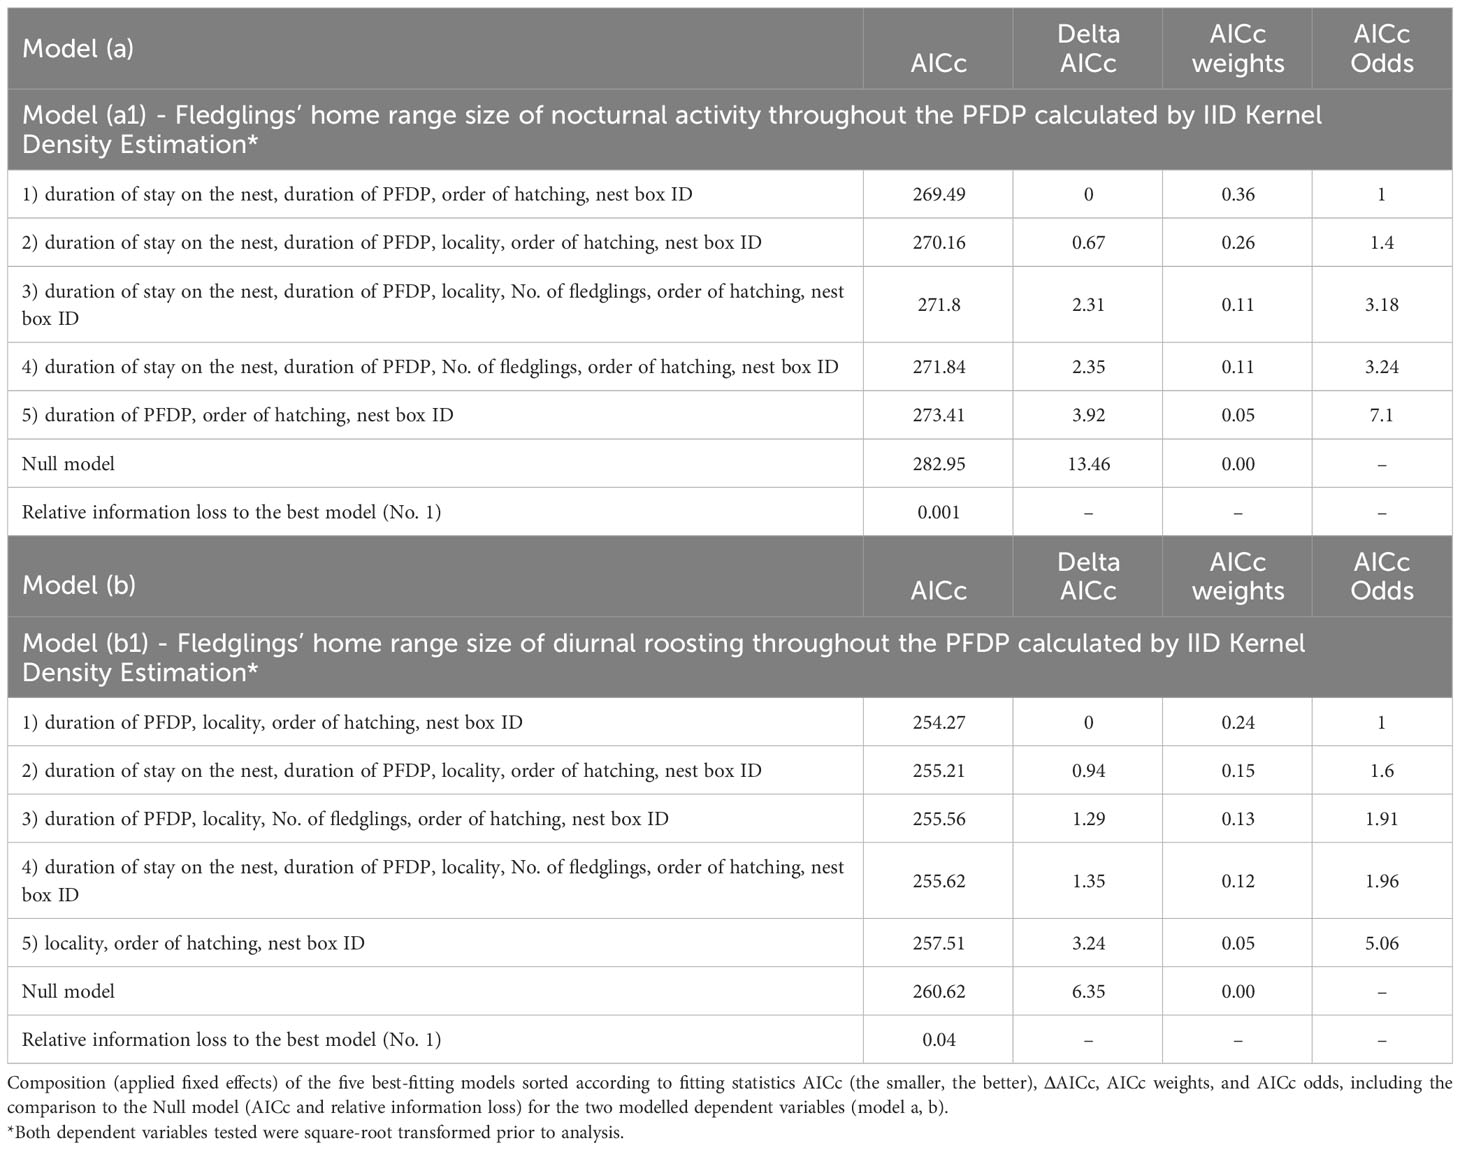
Table 3 Composition of the best models.
Supplementary Table S4 (models a, b, c) shows the best candidate models ranked using the AICc, AIC and HQIC information criteria. All of the information criteria rated the same five GLMM as most suitable, and therefore only the AICc results are presented here. Table 3 and Supplementary Table S3 show the five best candidate models for the three dependent variables (models a, b, c) tested, according to the AICc information criteria, including ΔAICc, Akaike weights and AICc Odds sorted by AICc (from the lowest to the highest value). The information criteria and rankings for the five best candidate models (with the most suitable model first) and Null models are shown in Supplementary Table S4. Uniform rankings across the three information criteria make a convincing argument that the models with cross-level interactions are the five best models. The relative information loss from the comparisons between Null and best models confirms that the best and other top-ranked models are valid (Supplementary Table S4). The estimate, standard error and 95% confidence interval of the fixed effects in the best and equivalent models for the three dependent variables tested are shown in Supplementary Table S5. Finally, evaluations of all fixed effects present in the best and equivalent models according to the variable importance analysis are presented in Supplementary Table S6.
3.1 Home range size of fledglings for nocturnal activity throughout the PFDP (a1)
For the dependent variable, the square-root transformed fledglings’ home range size of nocturnal activity throughout the PFDP calculated by IID KDE, the values of ΔAICc (the other information criteria used, too; see Supplementary Table S7) determined two best-fitting models covering a similar combination of fixed effects (Table 3). According to the AICc results, the probability of being the correct model was ambiguous for the two combinations (36% and 26%), and it was therefore not possible to choose the best model. As a result, we considered both models which included three fixed effects that were considered significant according to both the 95% confidence interval (Supplementary Table S5) and the variable importance analyses (Supplementary Table S6).
The two best models explaining the fledglings’ home range size of nocturnal activity included nest box ID, duration of the PFDP for a given individual, order of hatching within a brood, duration of stay on the nest for a given individual and locality (Table 3). The fledglings’ home range size of nocturnal activity increased with a longer duration of the PFDP (Figure 1A; Model a1, Supplementary Table S5), a higher rank of hatching within a brood (Figure 1B; Model a1, Supplementary Table S5), and a longer duration of stay on the nest (Figure 1C; Model a1, Supplementary Table S5). Finally, the nest box ID explained the largest part of nocturnal activity HR size variability, showing that siblings had very similar HRs.
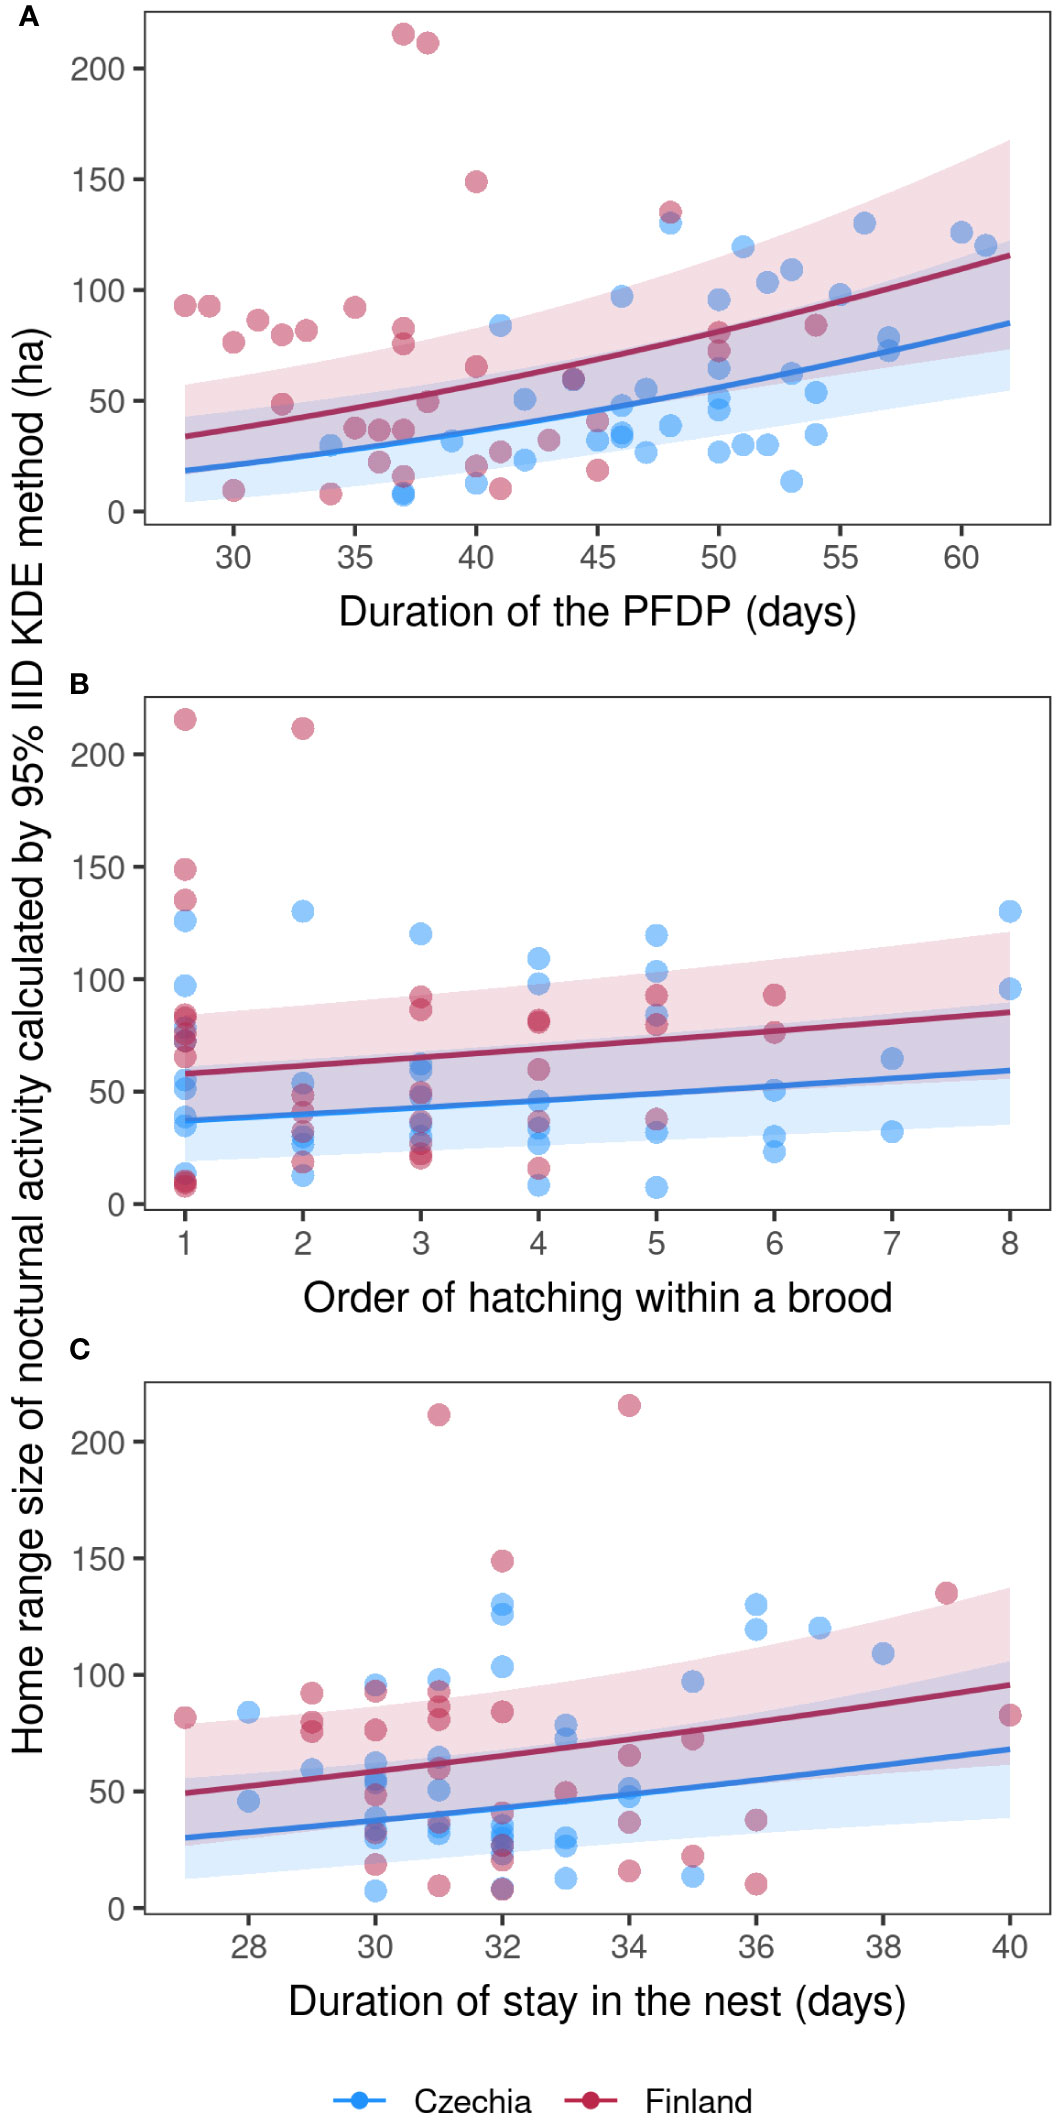
Figure 1 Fledglings’ home range size of nocturnal activity. Marginal effects (with 95% conf. intervals) scatter plots (A–C) of Tengmalm’s owl fledglings’ home range size calculated in hectares using the 95% IID Kernel Density Estimation (KDE) method, recorded during their nocturnal activities throughout the five post-fledging dependence periods (PFDP) in the Ore Mts. (2010–2012) and Kauhava (2019, 2021) study areas, plotted against individual duration of PFDP (A), hatching order within a given brood (B), and duration of individual nestlings’ stays in the nest (C); blue: Ore Mts. in Czechia; red: Kauhava region in Finland.
3.2 Home range size of fledglings for diurnal roosting throughout the PFDP (b1)
For the dependent variable, the square-root transformed fledglings’ home range size of diurnal roosting throughout the PFDP calculated using IID KDE, the values of ΔAICc (the other information criteria used, too; see Supplementary Table S8) determined four best-fitting models covering a similar combination of fixed effects (Table 3). According to the AICc results, the probability of being the correct model was ambiguous for these four combinations (24%, 15%, 13% and 12%), and it was therefore not possible to choose the best model. As a result, we considered all four best models which included three fixed effects that were considered significant according to both the 95% confidence interval (Supplementary Table S5) and the variable importance analyses (Supplementary Table S6).
The four best models explaining the fledglings’ home range size of diurnal roosting included nest box ID, duration of the PFDP for a given individual, order of hatching within a brood, duration of stay on the nest for a given individual, number of fledglings in the brood and locality (Table 3). The fledglings’ home range size of diurnal roosting was approximately two times smaller in Czechia than in Finland (Figure 2A; Model b1, Supplementary Table S5) and increased with a longer duration of the PFDP (Figure 2B; Model b1, Supplementary Table S5) and a higher rank of hatching within a brood (Figure 2C; Model b1, Supplementary Table S5). Finally, the nest box ID explained the largest part of diurnal roosting HR size variability, showing that siblings had very similar HRs.
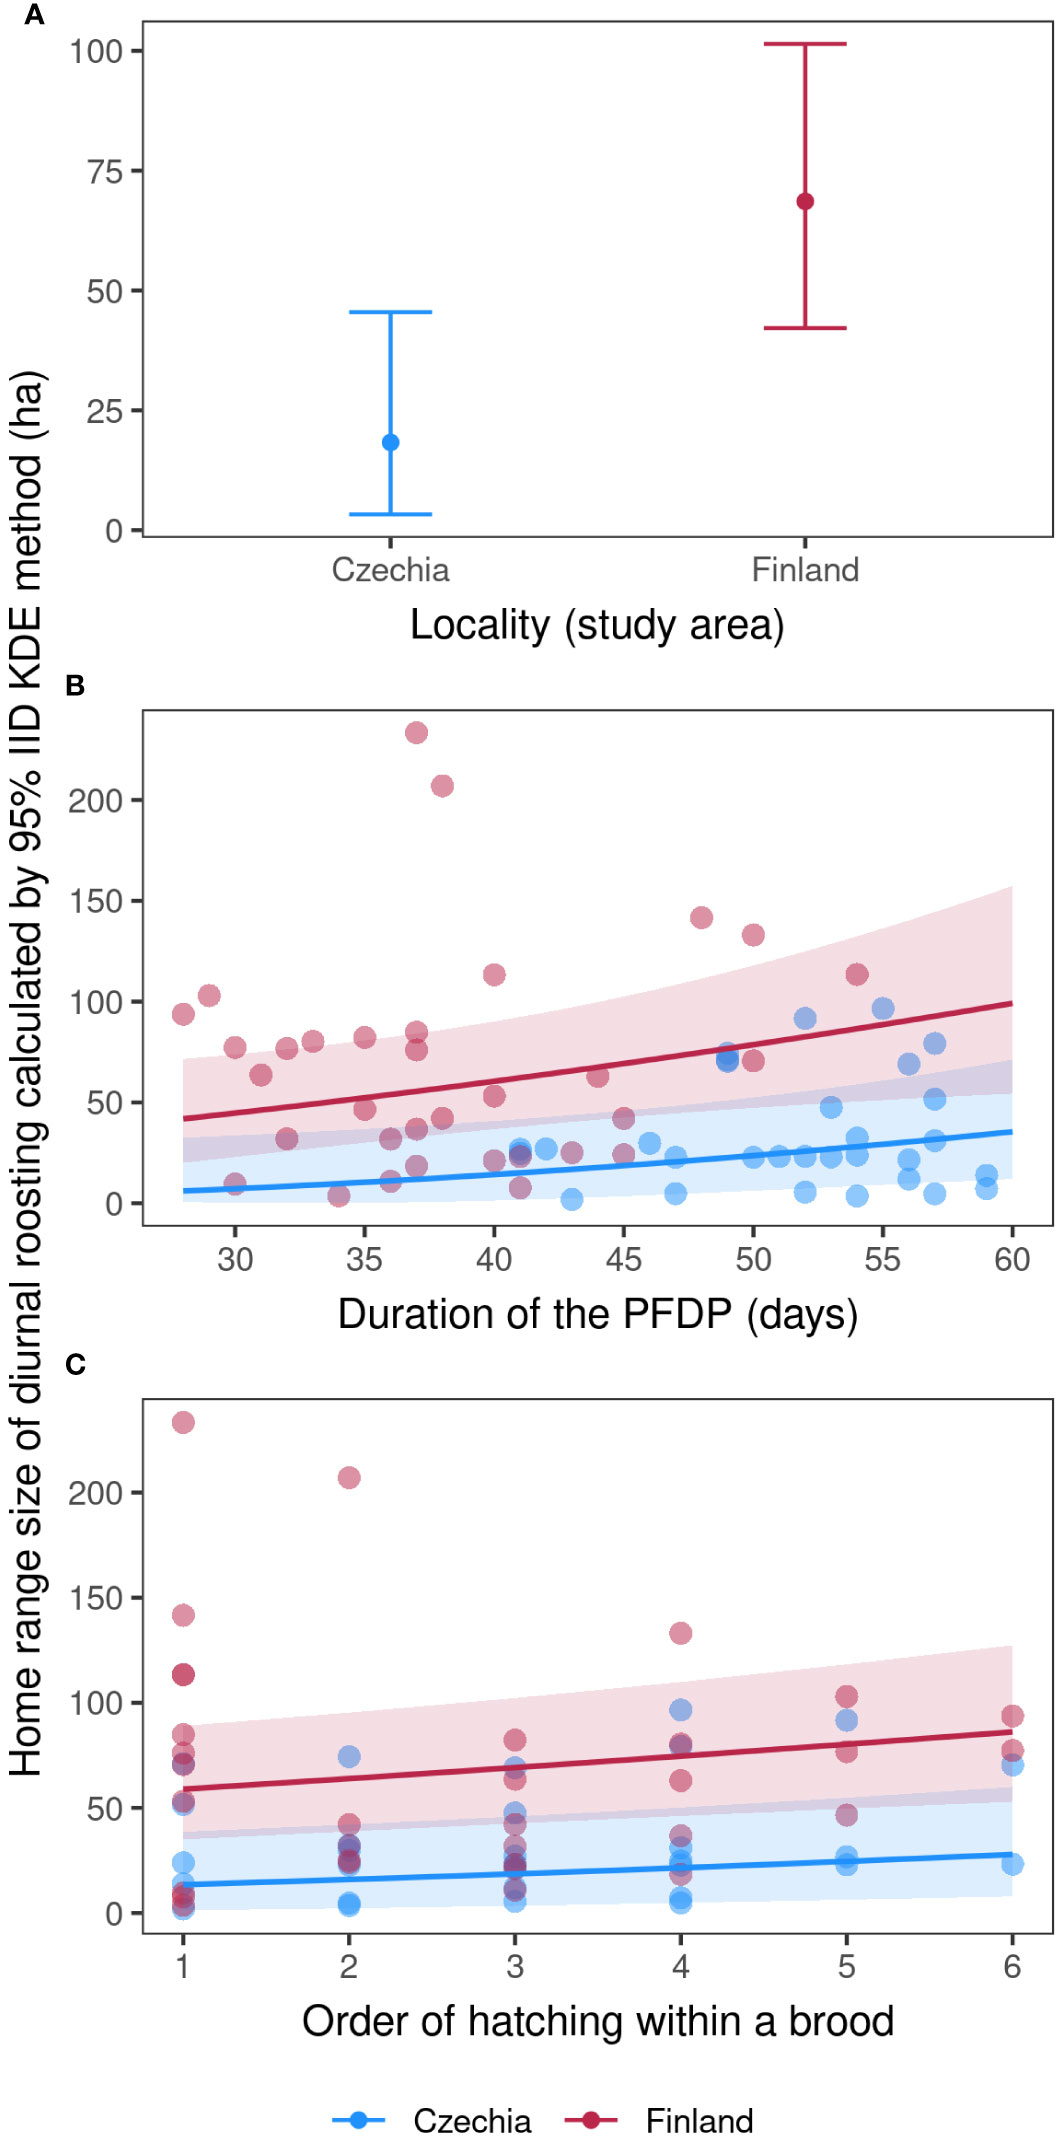
Figure 2 Fledglings’ home range size of diurnal roosting. Marginal effects errorbar plot (A; mean values with ± 95% con. intervals) showing differences between the two study localities and marginal effects (with 95% conf. intervals) scatter plots (B, C) of Tengmalm’s owl fledglings’ home range size calculated in hectares using the 95% IID Kernel Density Estimation (KDE) method, recorded during their diurnal roosting throughout the four post-fledging dependence periods (PFDP) in the Ore Mts. (2012, 2015) and Kauhava (2019, 2021) study areas, plotted against individual duration of the PFDP (B), and hatching order within a given brood (C); blue: Ore Mts. in Czechia; red: Kauhava region in Finland.
4 Discussion
The first major finding of our study is the comparable-sized HRs of fledglings during nocturnal activity found in both study areas, a finding which was in disagreement with prediction i. This result is important because it shows that juvenile Tengmalm’s owls occupied approximately the same HRs in their nocturnal activities throughout the PFDP regardless of the environmental conditions, i.e., geographical location and thus night length, altitude and weather (temperature and precipitation), but also habitat conditions, such as forest stand age, structure and composition. Our two study sites differ considerably in all these conditions. The Central European site is mountainous, and thus higher in altitude; it is also colder and more affluent in precipitation than the North European site. Regarding the habitat conditions, the forests on the Czech site are formed by small stands of relatively old and dense Norway spruce and extensive areas of highly loose stands of non-native young blue spruce. In comparison, the forests of the Finnish site are heavily managed, with dense middle- and old-age forest patches scattered between open clear-cut areas and dense young forests (see Kouba et al., 2013, 2023 for further details). Evidently, environmental factors are not decisive in determining the size of PFDP nocturnal activity HRs in Tengmalm’s owl fledglings. The similar nocturnal activity HR sizes in both study areas might be connected with the species’ life history and could be partly innate along with other behaviours which the fledglings exhibit during the PFDP.
In the case of diurnal roosting HRs, the results confirmed prediction ii, with fledglings in the Czech site having smaller ranges than their counterparts from Finland. Although speculative, we are convinced that this finding was due to the different habitat composition in the Czech site (Ore Mts.) with the juveniles repeatedly returning to small and dense mature Norway spruce forest patches for diurnal roosting. This explanation corresponds exactly to the roosting behaviour of Tengmalm’s owl males during breeding in the Ore Mts. and also in the Jizera Mts. in Czechia (Kouba and Tomášek, 2018; M. Kouba, unpublished data), and percentage representations of different habitat classes around nest boxes of the studied broods. These forest patches are probably ideal for diurnal roosting as they offer suitable hiding places against, for example, predators and mobbing by passerines.
Furthermore, the fact that the size of fledglings’ roosting ranges differed from the nocturnal ranges only in Czechia and not in Finland suggested that the reason for this must be specific to the Czech site. In Finland, we did not record fledglings using the same roost sites repeatedly, and this has not been observed in male Tengmalm’s owls in several other studies (Bondrup-Nielsen, 1978; Palmer, 1986; Jacobsen and Sonerud, 1987; M. Kouba and E. Korpimäki, unpublished data). The facts mentioned above further suggest the influence of the specific mosaic forest stand structure in the Ore Mts. which previously suffered severe damage from air pollution. As a result of this, the Czech study area did not offer a sufficient number of roosting sites, the remaining examples of which are now concentrated in relatively small sections of the oldest and densest forest patches. Similar results have been found for other species when the magnitude of HRs varies among populations of the same species due to variations in the physical structure of habitats (McLoughlin and Ferguson, 2000).
The next important finding of this study is that the sizes of overall fledglings’ HRs throughout the PFDP based on pooled nocturnal and diurnal locations were crucially determined by fixes recorded during nocturnal activity; thus, they were also affected by the same exact fixed effects (Supplementary Table S5). The results further confirm that forest age, structure and composition are not fundamental regarding the overall and nocturnal HR sizes during the PFDP in Tengmalm’s owl fledglings, a finding which is, however, in direct contrast to results regarding juvenile mortality during this period (Kouba et al., 2023). The size of agricultural fields and old-growth forests were found to have adverse effects on the survival of Tengmalm’s owl fledglings (Kouba et al., 2023).
The calculations of overlaps between the HRs of siblings showed a very high ratio of the joint use of areas during both the nocturnal activity and diurnal roosting periods. We further found that the nest box ID explained the largest part of fledglings’ HR size variability, thus showing that siblings of a single brood had similar-sized HRs. Both of these findings clearly show that the Tengmalm’s owl sibling groups did not dissolve before the very end of the PFDP and that there was no brood division throughout the PFDP, a finding which was otherwise apparent during our daily and nightly direct field observations throughout the PFDP. No early family break-up case was observed, in contrast to those recorded by Eldegard and Sonerud, (2010, 2012), and there was no evidence of brood division as has been found in the flammulated owl (Otus flammeolus) (Linkhart and Reynolds, 1987). This finding, however, is unsurprising and probably caused by the fact that the young are cared for throughout the PFDP exclusively or almost exclusively by males (Eldegard and Sonerud, 2010, 2012).
The final main finding shows that prey abundance is not a decisive factor in determining the size of nocturnal activity and the diurnal roosting HRs of Tengmalm’s owl fledglings throughout the PFDP; thus, prediction iii has been rejected. However, a significant difference in fledglings’ HR sizes was already reported between 2010 and 2011 by Kouba et al. (2013), two years which were extremely different regarding prey abundance (18.5 times difference). When all six seasons were analysed together, the effect of prey abundance disappeared. However, HRs increased with the longer duration of PFDP (see below), and its length has a strong negative dependence on prey abundance in both the Czech and Finnish sites (Kouba et al., 2013; M. Kouba and E. Korpimäki, unpublished data). Both these explanatory variables, the PFDP duration and prey abundance, were significantly intercorrelated and were, therefore never used together in the same model. We are therefore convinced that PFDP duration was decisive in this case and that prey abundance did not directly affect the HR sizes of Tengmalm’s owl fledglings during the PFDP. This may also be associated with the fact that owlets do not hunt prey themselves but are supplied by the male parents throughout the post-fledging phase (Eldegard and Sonerud, 2010, 2012).
In line with prediction iv, the nocturnal and diurnal HRs increased with the advancing duration of PFDP. This finding reflects the fact that Tengmalm’s owl fledglings usually gradually moved away from the nest and reached the furthest distance at the end of the PFDP (Kouba et al., 2013; this study). Similar movement patterns and gradual HR increases have also been observed during the PFDP of juveniles of other owl species, for instance, in the eastern screech owl (Megascops asio) by Belthoff et al. (1993), the Eurasian eagle owl (Bubo bubo) by Penteriani et al. (2005) and Delgado et al. (2009), and the little owl (Athene noctua) by Pedersen et al. (2013). It is logical that as the fledglings get older, their flight and cognitive abilities improve and their perceptual range increases as individuals become more accustomed to their natal habitat.
However, a longer distance from the nest and a longer PFDP may not necessarily mean the existence of a larger HR. Several studies found that fledglings of birds of prey moved mainly around a focal point of their HR during PFDP, usually represented by one or more adjacent trees [e.g., tawny owls (Strix aluco) (Petty and Thirgood, 1989)] or the nest box [e.g., eastern screech owls (Belthoff and Ritchison, 1989), bald eagles (Haliaeetus leucocephalus) (Wood et al., 1998), northern goshawks (Accipiter gentilis laingi) (McClaren et al., 2005), and barn owls (Tyto alba) (Almasi et al., 2021; Cain et al., 2023)]. However, this pattern was not observed in Tengmalm’s owl fledglings in the Czech or Finnish study site. Moreover, the nest boxes of fledglings involved in our study were often located at the very edge of their HRs. Thus, as suggested earlier (Kouba et al., 2013), our results show that differences regarding juvenile behaviour and movement patterns throughout the PFDP are connected with life-history strategies in parental care and the body size of a given species. The differences recorded are most probably affected by the degree of territoriality, which is usually stronger in larger species of owls. These species also commonly have permanent territories defended by a long-term couple, and both partners care for their offspring (Mikkola, 1983; Korpimäki, 1992). In contrast, territorial behaviour is low or absent among Tengmalm’s owls (Korpimäki, 1981), at least during the PFDP, and pairs are only formed for individual breeding attempts (Korpimäki, 1989), with the male parent taking care of the young alone in the majority of cases (Hakkarainen and Korpimaki, 1994; Eldegard and Sonerud, 2009, 2012; Korpimäki and Hakkarainen, 2012).
In agreement with prediction v, nocturnal activity and diurnal roosting HRs during the PFDP increased with the increasing hatching order within a sibling group. The fledging sequence within a brood closely follows the hatching order in our study species (Kouba et al., 2015), and the oldest individuals who hatched or fledged first were usually also the first to reach independence (Kouba et al., 2013). Therefore, it is expected that the youngest siblings had the most extensive HRs in accordance with the above-described movement patterns and generally moved further from the nest than their older siblings (Kouba et al., 2013). In contrast, no such pattern has been observed in grassland passerines (Suedkamp Wells et al., 2008), in which hatching/fledging order did not affect their HR sizes, but this difference is probably caused by the occurrence of synchronous hatching in these species (Long et al., 1965; Roseberry and Klimstra, 1970) compared to the asynchronously hatched Tengmalm’s owls (Valkama et al., 2002).
We found fledglings’ nocturnal activity HRs throughout the PFDP to be 64 and 37 ha on average, calculated by IID KDE and MCP, respectively, which is up to five times less compared to the mean hunting HR of Tengmalm’s owl males during breeding (Sonerud et al., 1986; Jacobsen and Sonerud, 1987; Sorbi, 2003; Santangeli et al., 2012; Kouba et al., 2017). The difference could possibly be much greater because the fledglings’ ranges were based on locations collected daily for up to two months, and males’ radio-tracking usually only lasted for several nights. Thus, as a rule, Tengmalm’s owl fledglings spent the whole PFDP in highly restricted areas even though they gradually moved away from the nest in both the Czech and Finnish study sites. For example, we recorded that one group of four siblings spent the whole first month (2/3 of their PFDP) in an isolated old and dense spruce forest patch with an area of only 1 hectare. Several other sibling groups spent the entire PFDP in less than 10 ha HRs.
We suggest that small nightly/overall HRs with low requirements for forest age, structure and composition offer an excellent possibility for conservation management of Tengmalm’s owl fledglings, an essential element of any population viability in the long term (Begon et al., 2006). Although a more detailed analysis of habitat composition and structure of both the nocturnal activity and diurnal roosting HRs will follow on from the current study, we can already speculate about the most critical forest stands that need to be present in an area to ensure the successful PFDP survival of young Tengmalm’s owls. The presence of either young or, much more preferably, older patches of the densest forest appear to be crucial, because only these can offer the necessary protection against avian and mammalian enemies of Tengmalm’s owls (Mikkola, 1983; Hakkarainen and Korpimäki, 1996; Hayward, 1997).
Tengmalm’s owl fledglings occupied similar-sized HRs within their nocturnal activities during PFDP in both the Central and North European study areas regardless of contrasting environmental conditions, such as night length, altitude and weather, and also habitat conditions, such as forest stand age, structure and composition. Therefore, we conclude that these ecological factors are not decisive in determining the nocturnal activity HR sizes of Tengmalm’s owl fledglings. Thus, along with the findings that diurnal HRs always occurred within nocturnal HRs and were two times smaller in the Czech site formerly damaged by the air-pollution calamity, any Tengmalm’s owl conservation programs should be aimed at preserving particularly suitable roosting habitats. A management approach focused on preserving the densest and preferably oldest forest stands within areas of the study species occurrence could fundamentally benefit the population of Tengmalm’s owls and, in the context of umbrella species, also other forest-dwelling species in the Holarctic region.
Data availability statement
The raw data supporting the conclusions of this article will be made available by the authors, without undue reservation.
Ethics statement
The animal study was approved by Owls in Czechia were trapped, handled, blood sampled, and tagged under permits No. 530/758 R/08-Abt/UL, 35016/02-OOP/8751/02, and 173/049/ZPZ/2015/ZD-838 from the Ministry of the Environment of the Czech Republic. They were ringed under the Ringing Centre of the National Museum in Prague, permit No. 329. Fledglings in Finland were tagged and radio-tracked under the approval of the Centre for Economic Development, Transport and the Environment (Varsinais-Suomen Elinkeino-, Liikenne- ja Ympäristökeskus: permit No. VARELY/1389/2018), ringed under the ringing licence of the Finish Museum of Natural History (licence No. 524), and blood sampled under the approval of the Animal Experiment Committee of the State Provincial Office (Etelä-Suomen aluehallintovirasto ESAVI; permit No. ESAVI/3021/04.10.07/2017). All efforts were made to minimize suffering. The study was conducted in accordance with the local legislation and institutional requirements.
Author contributions
SSS: Investigation, Writing – original draft, Writing – review & editing. MK: Conceptualization, Data curation, Formal analysis, Funding acquisition, Investigation, Methodology, Project administration, Resources, Supervision, Validation, Writing – original draft, Writing – review & editing. MŠ: Formal analysis, Methodology, Visualization, Writing – original draft, Writing – review & editing. FT: Investigation, Writing – review & editing. TB: Investigation, Writing – review & editing. EK: Methodology, Supervision, Writing – review & editing.
Funding
The author(s) declare financial support was received for the research, authorship, and/or publication of this article. The research project was financially supported by two grants provided to MK by the Regional Fund of the South Ostrobothnia of the Finnish Cultural Foundation (Business ID 0116947-3 and 10201775).
Acknowledgments
We thank Alena Popelková for her help with nest box controls and tagging the nestlings during 2010–2012, Alessandro Fantoni for his help with tagging the nestlings and radio-tracking in 2015 and Jiří Šindelář for his help with nest box controls in 2015 in Czechia. We also thank Jorma Nurmi, Kari Hongisto and Martin Janouš for their help in the field throughout the study in Finland. We greatly appreciate Lubomír Peške for technical assistance with radio-telemetry and manufacturing Yagi antennas for the whole study. Next, we would like to thank JM and DW for their comments and suggestions to the earlier draft of the manuscript.
Conflict of interest
The authors declare that the research was conducted in the absence of any commercial or financial relationships that could be construed as a potential conflict of interest.
Publisher’s note
All claims expressed in this article are solely those of the authors and do not necessarily represent those of their affiliated organizations, or those of the publisher, the editors and the reviewers. Any product that may be evaluated in this article, or claim that may be made by its manufacturer, is not guaranteed or endorsed by the publisher.
Supplementary material
The Supplementary Material for this article can be found online at: https://www.frontiersin.org/articles/10.3389/fevo.2024.1347916/full#supplementary-material
References
Akbar Z., Gorman M. L. (1993). The effect of supplementary feeding upon the sizes of the home ranges of woodmice Apodemus sylvaticus living on a system of maritime sand-dunes. J. Zoology 231, 233–237. doi: 10.1111/j.1469-7998.1993.tb01914.x
Almasi B., Massa C., Jenni L., Roulin A. (2021). Exogenous corticosterone and melanin-based coloration explain variation in juvenile dispersal behaviour in the barn owl (Tyto alba). PLoS One 16, e0256038. doi: 10.1371/journal.pone.0256038
Bartoń K. (2022). MuMIn: Multi-model inference. R Package version 1.47.1. Available at: https://CRAN.R-project.org/package=MuMIn.
Bates D., Mächler M., Bolker B., Walker S. (2015). Fitting linear mixed-effects models using lme4. J. Stat. Softw. 67 (1), 1–48. doi: 10.18637/jss.v067.i01
Begon M., Townsend C. R., Harper J. L. (2006). Ecology. Individuals, populations and communities. 4th edn (Boston: Blackwell).
Belthoff J. R., Ritchison G. (1989). Natal dispersal of eastern screech-owls. Condor 91, 254–265. doi: 10.2307/1368302
Belthoff J. R., Sparks E. J., Ritchison G. (1993). Home ranges of adult and juvenile eastern screech owls: Size, seasonal variation and extent of overlap. J. Raptor Res. 27, 8–15.
Bondrup-Nielsen S. (1978). Vocalizations, nesting, and habitat preferences of the boreal owl, (Aegolius funereus) (North America. Toronto, Ontario: University of Toronto).
Broughton S. K., Dickman C. R. (1991). The effect of supplementary food on home range of the southern brown bandicoot, Isoodon obesulus (Marsupialia: Peramelidae). Aust. J. Ecol. 16, 71–78. doi: 10.1111/j.1442-9993.1991.tb01482.x
Burnham K., Anderson D. (2002). Model selection and multi-model inference (New York: Springer). doi: 10.1007/b97636
Burt W. H. (1943). Territoriality and home range concepts as applied to mammals. J. Mammalogy 24, 346–352. doi: 10.2307/1374834
Bustamante J. (1995). The duration of the post-fledging dependence period of Ospreys Pandion haliaetus at Loch Garten, Scotland. Bird Study 42, 31–36. doi: 10.1080/00063659509477145
Cain S., Solomon T., Leshem Y., Toledo S., Arnon E., Roulin A., et al. (2023). Movement predictability of individual barn owls facilitates estimation of home range size and survival. Movement Ecol. 11, 10. doi: 10.1186/s40462-022-00366-x
Delgado M. D., Penteriani V., Nams V. O. (2009). How fledglings explore surroundings from fledging to dispersal: A case study with eagle owls Bubo bubo. Ardea 97, 7–15. doi: 10.5253/078.097.0102
Desy E. A., Batzli G. O., Liu J. (1990). Effects of food and predation on behaviour of prairie voles: a field experiment. Oikos 58, 159–168. doi: 10.2307/3545423
Dormann C. F., Elith J., Bacher S., Buchmann C., Carl G., Carré G., et al. (2012). Collinearity: a review of methods to deal with it and a simulation study evaluating their performance. Ecography 36, 27–46. doi: 10.1111/j.1600-0587.2012.07348.x
Eldegard K., Sonerud G. A. (2009). Female offspring desertion and male-only care increase with natural and experimental increase in food abundance. Proc. R. Soc. B-Biological Sci. 276, 1713–1721. doi: 10.1098/rspb.2008.1775
Eldegard K., Sonerud G. A. (2010). Experimental increase in food supply influences the outcome of within-family conflicts in Tengmalm's owl. Behav. Ecol. Sociobiology 64, 815–826. doi: 10.1007/s00265-009-0898-z
Eldegard K., Sonerud G. A. (2012). Sex roles during post-fledging care in birds: Female Tengmalm's owls contribute little to food provisioning. J. Ornithology 153, 385–398. doi: 10.1007/s10336-011-0753-7
Fridolfsson A.-K., Ellegren H. (1999). A simple and universal method for molecular sexing of non-ratite birds. J. Avian Biol. 30, 116–121. doi: 10.2307/3677252
Geen G. R., Robinson R. A., Baillie S. R. (2019). Effects of tracking devices on individual birds – a review of the evidence. J. Avian Biol. 50, e01823. doi: 10.1111/jav.01823
Hakkarainen H., Korpimaki E. (1994). Does feeding effort of Tengmalm's owls reflect offspring survival prospects in cyclic food conditions? Oecologia 97, 209–214. doi: 10.1007/BF00323151
Hakkarainen H., Korpimäki E. (1996). Competitive and predatory interactions among raptors: An observational and experimental study. Ecology 77, 1134–1142. doi: 10.2307/2265582
Hakkarainen H., Korpimäki E., Koivunen V., Ydenberg R. (2002). Survival of male Tengmalm's owls under temporally varying food conditions. Oecologia 131, 83–88. doi: 10.1007/s00442-001-0865-5
Hakkarainen H., Mykra S., Kurki S., Korpimäki E., Nikula A., Koivunen V. (2003). Habitat composition as a determinant of reproductive success of Tengmalm's owls under fluctuating food conditions. Oikos 100, 162–171. doi: 10.1034/j.1600-0706.2003.11906.x
Hansson L., Henttonen H. (1988). Rodent dynamics as community processes. Trends Ecol. Evol. 3, 195–200. doi: 10.1016/0169-5347(88)90006-7
Harris S., Cresswell W. J., Forde P. G., Trewhella W. J., Woollard T., Wray S. (1990). Home-range analysis using radio-tracking data: A review of problems and techniques particularly as applied to the study of mammals. Mammal Rev. 20, 97–123. doi: 10.1111/j.1365-2907.1990.tb00106.x
Hayward G. D. (1997). Forest management and conservation of boreal owls in North America. J. Raptor Res. 31, 114–124.
Jacobsen B. V., Sonerud G. A. (1987). Home range of Tengmalm's owl: A comparison between nocturnal hunting and diurnal roosting. USDA For. Service Gen. Tech. Rep. RM 142, 189–192.
Kenward R. E., Marcström V., Karlbom M. (1993). Post-nestling behavior in goshawks, Accipiter gentilis: 1. The causes of dispersal. Anim. Behav. 46, 365–370. doi: 10.1006/anbe.1993.1198
Kim J. H. (2019). Multicollinearity and misleading statistical results. Korean J. anesthesiology 72, 558–569. doi: 10.4097/kja.19087
König C., Weick F. (2008). Owls of the World. 2nd ed. (New Haven and London: Yale University Press).
Korpimäki E. (1981). On the ecology and biology of Tengmalm's owl (Aegolius funereus) in southern Ostrobothnia and Soumenselkä, western Finland. Acta Univ Oul A 118 Biol. 13, 1–84.
Korpimäki E. (1986). Seasonal changes in the food of the Tengmalm's owl Aegolius funereus in western Finland. Annales Zoologici Fennici 23, 339–344.
Korpimäki E. (1988). Diet of breeding Tengmalm’s owls Aegolius funereus: Long-term changes and year-to-year variation under cyclic food conditions. Ornis Fennica 65, 21–30.
Korpimäki E. (1989). Mating system and mate choice of Tengmalm’s owls Aegolius funereus. Ibis 131, 41–50. doi: 10.1111/j.1474-919X.1989.tb02742.x
Korpimäki E. (1992). “Population dynamics of Fennoscandian owls in relation to wintering conditions and between-year fluctuations of food,” in The ecology and conservation of European owls. Eds. Galbraith C. A., Taylor I. R., Percival S. (Joint Nature Conservation Committee (UK Nature Conservation, No. 5, Peterborough), 1–10.
Korpimäki E., Hakkarainen H. (1991). Fluctuating food supply affects the cluch size of Tengmalm’s owl independent of laying date. Oecologia 85, 543–552. doi: 10.1007/BF00323767
Korpimäki E., Hakkarainen H. (2012). The Boreal Owl: Ecology, Behaviour and Conservation of a Forest-Dwelling Predator. (Cambridge: Cambridge University Press). doi: 10.1017/CBO9780511844164
Korpimäki E., Krebs C. J. (1996). Predation and population cycles of small mammals: a reassessment of the predation hypothesis. Bioscience 46, 754–764. doi: 10.2307/1312851
Korpimäki E., Lagerström M. (1988). Survival and natal dispersal of fledglings of Tengmalm's owl in relation to fluctuating food conditions and hatching date. J. Anim. Ecol. 57, 433–441. doi: 10.2307/4915
Korpimäki E., Norrdahl K., Huitu O., Klemola T. (2005). Predator-induced synchrony in population oscillations of coexisting small mammal species. Proc. R. Soc. B-Biological Sci. 272, 193–202. doi: 10.1098/rspb.2004.2860
Kouba M., Bartoš L., Bartošová J., Hongisto K., Korpimäki E. (2020a). Interactive influences of fluctuations of main food resources and climate change on long-term population decline of Tengmalm’s owls in the boreal forest. Sci. Rep. 10, 20429. doi: 10.1038/s41598-020-77531-y
Kouba M., Bartoš L., Korpimäki E., Zárybnická M. (2015). Factors affecting the duration of nestling period and fledging order in Tengmalm's owl (Aegolius funereus): Effect of wing length and hatching sequence. PLoS One 10, e0121641. doi: 10.1371/journal.pone.0121641
Kouba M., Bartoš L., Šťastný K. (2013). Differential movement patterns of juvenile Tengmalm's owls (Aegolius funereus) during the post-fledging dependence period in two years with contrasting prey abundance. PLoS One 8, e67034. doi: 10.1371/journal.pone.0067034
Kouba M., Bartoš L., Šťastný K. (2014). Factors affecting vocalization in Tengmalm's owl (Aegolius funereus) fledglings during post-fledging dependence period: Scramble competition or honest signalling of need? PLoS One 9, e95594. doi: 10.1371/journal.pone.0095594
Kouba M., Bartoš L., Tomášek V., Popelková A., Šťastný K., Zárybnická M. (2017). Home range size of Tengmalm's owl during breeding in central Europe is determined by prey abundance. PLoS One 12, e0177314. doi: 10.1371/journal.pone.0177314
Kouba M., Bartoš L., Tulis F., Ševčík M., Sovadinová S., Bušina T., et al. (2023). Post-fledging survival of Tengmalm’s owl offspring in boreal forests: Interactive effects of varying dynamics of main prey and habitat composition. Front. Ecol. Evol. 11, 115–1622. doi: 10.3389/fevo.2023.1151622
Kouba M., Dušek A., Bartoš L., Bušina T., Hanel J., Menclová P., et al. (2020b). Low food abundance prior to breeding results in female-biased sex allocation in Tengmalm's owl (Aegolius funerus). J. Ornithology 161, 159–170. doi: 10.1007/s10336-019-01707-1
Kouba M., Tomášek V. (2018). Size of home range of Tengmalm’s owl (Aegolius funereus) males during breeding season assessed by radio-telemetry in the Jizera Mountains, Czechia. Slovak Raptor J. 12, 1–7. doi: 10.2478/srj-2018-0004
Kuznetsova A., Brockhoff P. B., Christensen R. H. B. (2017). lmerTest package: tests in linear mixed effects models. J. Stat. software 82, 1–26. doi: 10.18637/jss.v082.i13
Laver P. N., Kelly M. J. (2008). A critical review of home range studies. J. Wildlife Manage. 72, 290–298. doi: 10.2193/2005-589
Linkhart B. D., Reynolds R. T. (1987). Brood division and postnesting behavior of Flammulated Owls. Wilson Bull. 99, 240–243.
Long C. A., Long C. F., Knops J., Matulionis D. H. (1965). Reproduction in the Dickcissel. The Wilson Bulletin 77, 251–256.
McClaren E. L., Kennedy P. L., Doyle D. D. (2005). Northern goshawk (Accipiter gentilis laingi) post-fledging areas on Vancouver Island, British Columbia. J. Raptor Res. 39, 253–263.
McLoughlin P. D., Ferguson S. H. (2000). A hierarchical pattern of limiting factors helps explain variation in home range size. Ecoscience 7, 123–130. doi: 10.1080/11956860.2000.11682580
Mrykalo R. J., Grigione M. M., Sarno R. J. (2007). Home range and dispersal of juvenile Florida Burrowing Owls. Wilson J. Ornithology 119, 275–279. doi: 10.1676/06-018.1
Noonan M. J., Tucker M. A., Fleming C. H., Akre T. S., Alberts S. C., Ali A. H., et al. (2019). A comprehensive analysis of autocorrelation and bias in home range estimation. Ecol. Monogr. 89, e01344. doi: 10.1002/ecm.1344
Palmer D. A. (1986). Habitat selection, movements and activity of boreal and saw-whet owls (Fort Collins: Colorado State University).
Pedersen D., Thorup K., Sunde P., Jacobsen L. B., Rahbek C. (2013). Post-fledging behaviour of juveniles in the little owl (Athene noctua). Ornis Fennica 90, 117–128. doi: 10.51812/of.133828
Penteriani V., Delgado M. M., Maggio C., Aradis A., Sergio F. (2005). Development of chicks and predispersal behaviour of young in the eagle owl Bubo bubo. Ibis 147, 155–168. doi: 10.1111/j.1474-919x.2004.00381.x
Peters R. (1978). “"Communication, cognitive mapping, and strategy in wolves and hominids,",” in Wolf and man: Evolution in parallel. Eds. Hall R. L., Sharp H. S. (Academic Press, New York), 95–108.
Petty S. J., Thirgood S. J. (1989). A radio tracking study of post-fledging mortality and movements of tawny owls in Argyll. Ringing Migration 10, 75–82. doi: 10.1080/03078698.1989.9673943
Powell R. A. (2000). “Animal home ranges and territories and home range estimators,” in Research techniques in animal ecology: Controversies and consequences. Eds. Boitani L., Fuller T. (Columbia University Press, New York), 65–110.
Powell R. A., Mitchell M. S. (2012). What is a home range? J. Mammalogy 93, 948–958. doi: 10.1644/11-MAMM-S-177.1
R Core Team. (2023). R: A Language and Environment for Statistical Computing (Vienna, Austria: R Foundation for Statistical Computing).
Roseberry J. L., Klimstra W. D. (1970). The nesting ecology and reproductive performance of the Eastern Meadowlark. The Wilson Bulletin 82, 243–267.
Santangeli A., Hakkarainen H., Laaksonen T., Korpimäki E. (2012). Home range size is determined by habitat composition but feeding rate by food availability in male Tengmalm's owls. Anim. Behav. 83, 1115–1123. doi: 10.1016/j.anbehav.2012.02.002
Sonerud G. A., Solheim R., Jacobsen B. V. (1986). Home-range use and habitat selection during hunting in a male Tengmalm's owl Aegolius funereus. Fauna norvegica Ser. C Cinclus 9, 100–106.
Sorbi S. (2003). Size and use of Tengmalm's owl Aegolius funereus home range in the high Belgian Ardennes: Results from radio-tracking (In French with English summary). Alauda 71, 215–220.
Southern H. N. (1970). Natural control of a population of Tawny owls (Strix aluco). J. Zoology 162, 197–285. doi: 10.1111/j.1469-7998.1970.tb01264.x
Suedkamp Wells K. M., Millspaugh J. J., Ryan M. R., Hubbard M. W. (2008). Factors affecting home range size and movements of post-fledging grassland birds. Wilson J. Ornithology 120, 120–130. doi: 10.1676/06-117.1
Todd L. D. (2001). Dispersal patterns and post-fledging mortality of juvenile burrowing owls in Saskatchewan. J. Raptor Res. 35, 282–287.
Valkama J., Korpimäki E., Holm A., Hakkarainen H. (2002). Hatching asynchrony and brood reduction in Tengmalm's owl Aegolius funereus: The role of temporal and spatial variation in food abundance. Oecologia 133, 334–341. doi: 10.1007/s00442-002-1033-2
van Riper C., van Wagtendonk J. (2006). Home range characteristics of Great Gray Owls in Yosemite National Park, California. J. Raptor Res. 40, 130–141. doi: 10.3356/0892-1016(2006)40[130:HRCOGG]2.0.CO;2
Withey J. C., Bloxton T. D., Marzluff J. M. (2001). “"Effects of tagging and location error in wildlife radiotelemetry studies,",” in Radio tracking and animal populations. Eds. Millspaugh J. J., Marzluff J. M. (Academic Press, San Diego), 43–70.
Keywords: birds of prey, diurnal roosting, kernel density estimation, minimum convex polygon, movement patterns, nocturnal activity, prey abundance, radio-telemetry
Citation: Stehlíková Sovadinová S, Kouba M, Ševčík M, Tulis F, Bušina T and Korpimäki E (2024) Home range size of Tengmalm’s owl offspring during the post-fledging dependence period in Central and North Europe. Front. Ecol. Evol. 12:1347916. doi: 10.3389/fevo.2024.1347916
Received: 01 December 2023; Accepted: 19 February 2024;
Published: 01 March 2024.
Edited by:
Antoni Margalida, Spanish National Research Council (CSIC), SpainReviewed by:
Jesus Martinez, Spanish National Research Council (CSIC), SpainDavid Wiens, USGS Forest and Rangeland Ecosystem Science Center, United States
Copyright © 2024 Stehlíková Sovadinová, Kouba, Ševčík, Tulis, Bušina and Korpimäki. This is an open-access article distributed under the terms of the Creative Commons Attribution License (CC BY). The use, distribution or reproduction in other forums is permitted, provided the original author(s) and the copyright owner(s) are credited and that the original publication in this journal is cited, in accordance with accepted academic practice. No use, distribution or reproduction is permitted which does not comply with these terms.
*Correspondence: Simona Stehlíková Sovadinová, s.stehlikova.s@gmail.com
†These authors have contributed equally to this work
‡ORCID: Simona Stehlíková Sovadinová, orcid.org/0009-0008-9431-5156
Marek Kouba, orcid.org/0000-0003-2262-5733
Michal Ševčík, orcid.org/0000-0003-4533-9887
Filip Tulis, orcid.org/0000-0003-2673-5630
Tomáš Bušina, orcid.org/0000-0003-0301-5171
Erkki Korpimäki, orcid.org/0000-0001-7596-1955