Sampling the understory, midstory, and canopy is necessary to fully characterize native bee communities of temperate forests and their dynamic environmental relationships
 Michael J. Cunningham-Minnick
 H. Patrick Roberts
 Joan Milam1
 - 1Department of Environmental Conservation, University of Massachusetts Amherst, Amherst, MA, United States
- 2United States Fish and Wildlife Service, Northeast Regional Office, Hadley, MA, United States
- 3United States Department of Agriculture Forest Service Northern Research Station, University of Massachusetts Amherst, Amherst, MA, United States
Introduction: Native bee communities of temperate forests are conventionally sampled from the understory, yet there is growing evidence that bee assemblages in forest canopies are distinct from those in the understory. Therefore, conventional approaches to quantify forest bee–habitat relationships may not comprehensively characterize forest bee communities.
Methods: To examine this, we sampled bees 1–26 m from ground level at 5-m increments at 47 locations in forests located in western Massachusetts, USA. We evaluated bee abundance and species richness responses to a suite of environmental factors measured in the understory with linear and segmented regression comparing four bee sampling strategies: (1) understory sampling only, (2) understory and midstory, (3) understory and canopy, and (4) all strata combined.
Results: We found that not sampling higher strata underestimated bee abundance and species richness, and linear models had less ability to explain the data when bees of higher strata were included. Among strategies, responses analyzed linearly differed in magnitude due to overall differences in abundance and species richness, but segmented regressions showed relationships with understory characteristics that also differed in slope, which would alter interpretation.
Discussion: Collectively, our findings highlight the value of including vertically stratified sampling strategies throughout the flight season to fully characterize native bee and other pollinator communities of forests.
1 Introduction
Native pollinators and their pollination services are critical in supporting ecosystems worldwide (Klein et al., 2007; Winfree et al., 2007, 2008; Ollerton et al., 2011; Kennedy et al., 2013; Rodger et al., 2023). Evidence that many pollinator species are experiencing population declines (Biesmeijer et al., 2006; Cameron et al., 2011; Bartomeus et al., 2013; Burkle et al., 2013; Koh et al., 2016) has raised alarm among conservationists and the public. In response, there has been a rapid increase in research aimed at understanding basic habitat associations at community and species levels to inform pollinator conservation efforts (Williams et al., 2010; Tonietto and Larkin, 2017; Neumüller et al., 2020; Milam et al., 2022). To date, research within the temperate zone suggests that native bees tend to be more abundant and diverse within open and early-successional communities (Taki et al., 2013; Hanula et al., 2015; Roberts et al., 2017; Wagner et al., 2019; Milam et al., 2022; Ulyshen et al., 2022). As a result, the bulk of native bee research in the interest of pollinator conservation has focused on early-successional plant communities over other natural communities such as closed-canopy forest (herein referred to as ‘forests’; Ulyshen et al., 2023).
Limited research addressing native bee communities within forests has primarily focused on the understory (e.g., Rodríguez and Kouki, 2015; Roberts et al., 2017; Smith et al., 2019; Rivers and Betts, 2021; Eckerter et al., 2022; reviewed in Ulyshen et al., 2023). This sampling strategy, although accessible and convenient, is potentially problematic since the understory contains only a fraction of the vertically distributed resources available to bees (Saunders, 2018; Smith et al., 2019; Requier and Leonhardt, 2020; Urban-Mead et al., 2021). Indeed, field experiments that sampled at heights reaching beyond the understory have firmly established that bees are well distributed throughout temperate forest canopies (Ulyshen et al., 2010, 2020; Campbell et al., 2018; Cunningham-Minnick and Crist, 2020; Simon et al., 2021; Urban-Mead et al., 2021; Allen and Davies, 2022; Milam et al., 2022; Cunningham-Minnick et al., 2023), sometimes at significantly greater abundances than in the understory (Ulyshen et al., 2010; Campbell et al., 2018; Urban-Mead et al., 2021). Thus, sampling approaches that rely on understory sampling alone (e.g., Roberts et al., 2017; Harrison et al., 2018; Wagner et al., 2019) are informative but may not sufficiently characterize the full breadth of the forest bee community, although the magnitude and meaningfulness of this bias – from both a statistical and conservation perspective – remains uncertain. Further research in forests from a broader geographic range are necessary to gauge the extent to which vertical sampling affects the characterization of forest bee communities.
Milam et al. (2022) addressed the concern that only sampling forest understories may bias results and influence conclusions when comparing forest and early-successional communities in restored barrens. This study demonstrated how sampling the forest canopy does not change the conclusion drawn when comparing bee communities of the forest understory to the restored barrens: bee communities in barrens were more abundant and diverse. Though not the focus of their study, the authors also found significant differences in bee species composition between the forest understory (1.0 m) and canopy (8.6 m) in stands ~20 m tall, yet did not compare abundance or species richness between strata. Similarly, Ulyshen et al. (2010) sampled the forest understory at 0.5 m and canopy at 18.8 m near trees with an average height of 31.7 m and found a unique canopy assemblage with greater abundance, species richness, and diversity than the understory. Urban-Mead et al. (2021) sampled at 1.0 m and 22.5 m in a stand with an average maximum canopy height of 25 m and also found that the bee community was more diverse in the canopy but only more abundant for one of the three sampling years. Though regional differences (e.g., landscape composition or configuration; bee or plant species) may explain variation in vertical stratification of species among studies, the interaction between trap positioning and vegetation height may play an important role in the distribution of native bee communities (Geroff et al., 2014; Roberts et al., 2017; Ulyshen et al., 2023). Thus, the variation in results among these studies could also be due to differences in the maximum canopy height of these forests, which may affect the accessibility of canopy resources, or differences in the relative position of bee traps relative to the canopy, which could affect the proximity of the traps to different resources (e.g., canopy flowers, dead wood, alternative food sources; Cunningham-Minnick and Crist, 2020; Urban-Mead et al., 2021; Ulyshen et al., 2023). Of course, the maturity (size and flowering) and life histories of the tree species that comprise the forest community are likely to determine the availability of preferred resources throughout the canopy and thus the presence of particular bee species at different strata (Cunningham-Minnick and Crist, 2020; Urban-Mead et al., 2023). These points raise the question of whether the vertical stratification of bee communities can be better predicted from height above the ground or in relation to the height of the canopy. The inconsistency in findings across studies highlights the issue of how authors define each stratum, which complicates comparisons among studies and is exacerbated by studies that sampled at three (Ulyshen et al., 2020), four (Cunningham-Minnick et al., 2023), or more (Cunningham-Minnick and Crist, 2020) heights. Ulyshen et al. (2020) reconciled this issue with their recommendation of sampling at 5 m above the forest floor following findings that the bee assemblages at 1 and 15 m above the ground were distinct in composition while the assemblage at 5 m was not statistically different from either. Still, the variation in canopy height among forest types and forest composition based on geographic locations suggests the need for a more standardized approach that can account for these differences.
The goal of this study was to understand the extent to which sampling at different forest strata influences how forest bee communities might be characterized, and in turn, its implications for understanding broader environmental relationships. We vertically sampled a total of 47 forest sites for one year (17 sites in 2020; 30 sites in 2021) at 5-m increments from the understory into the upper reaches of the canopy to compare the effects of four potential sampling strategies on the characterization of the vertically stratified bee community: (a) understory sampling only, (b) understory and midstory sampling, (c) understory and canopy sampling, and (d) understory, midstory, and canopy sampling. Specific objectives were to: (1) determine if vertical stratification is best described in terms of absolute height above the ground or in relation to the height of the canopy, (2) compare abundance and diversity among these sampling strategies, and (3) examine whether sampling strategy has the potential to influence conclusions about relationships with the environment (e.g., microhabitat).
2 Methods
2.1 Study area
This study took place in western Massachusetts within heavily forested areas of three ecoregions in 2020 and 2021 (Figure 1). The Connecticut Valley ecoregion includes central and transition hardwood as well as floodplain forests in relatively rich soils due to thick outwash and alluvial deposits with a largely sedimentary geology while the Worcester/Monadnock Plateau and Lower Worcester Plateau/Eastern Connecticut Upland ecoregions include transition hardwood forests at southern sites of lower elevations on stratified deposits of sand, gravel, and silt as well as hardwood forests and forested wetlands with scattered monadnock relics from glaciation events, which are typically colder in temperature due to their higher elevation (150–425 m) on a shared gneiss, schist, and granite geology (Griffith et al., 2009). All study sites comprised closed-canopy forests with an average maximum canopy height of 24.6 m (range: 19–31 m); dominate species include Pinus strobus and Quercus rubra and codominant species Acer rubrum, Betula lenta, and Tsuga canadensis that reached the canopy ceiling while intermediate species included scattered Betula alleghaniensis, Betula papyrifera, Fagus grandifolia, Pinus rigida, Quercus alba, and Quercus montana depending on the forest type. The understory consisted largely of Amelanchier spp., Hamamelis virginiana, Kalmia latifolia, Vaccinium corymbosum, and snags, as well as immature Castanea dentata, F. grandifolia, and P. strobus trees, with an herbaceous layer primarily of ferns, seedlings, Vaccinium spp., and scattered Monotropa uniflora, Panax trifolius, Trientalis borealis, and Viola spp. on a groundcover of leaf litter, Maianthemum canadense, and Mitchella repens. These forests do not generally support spring ephemerals characteristic of mesic forests with rich soils.
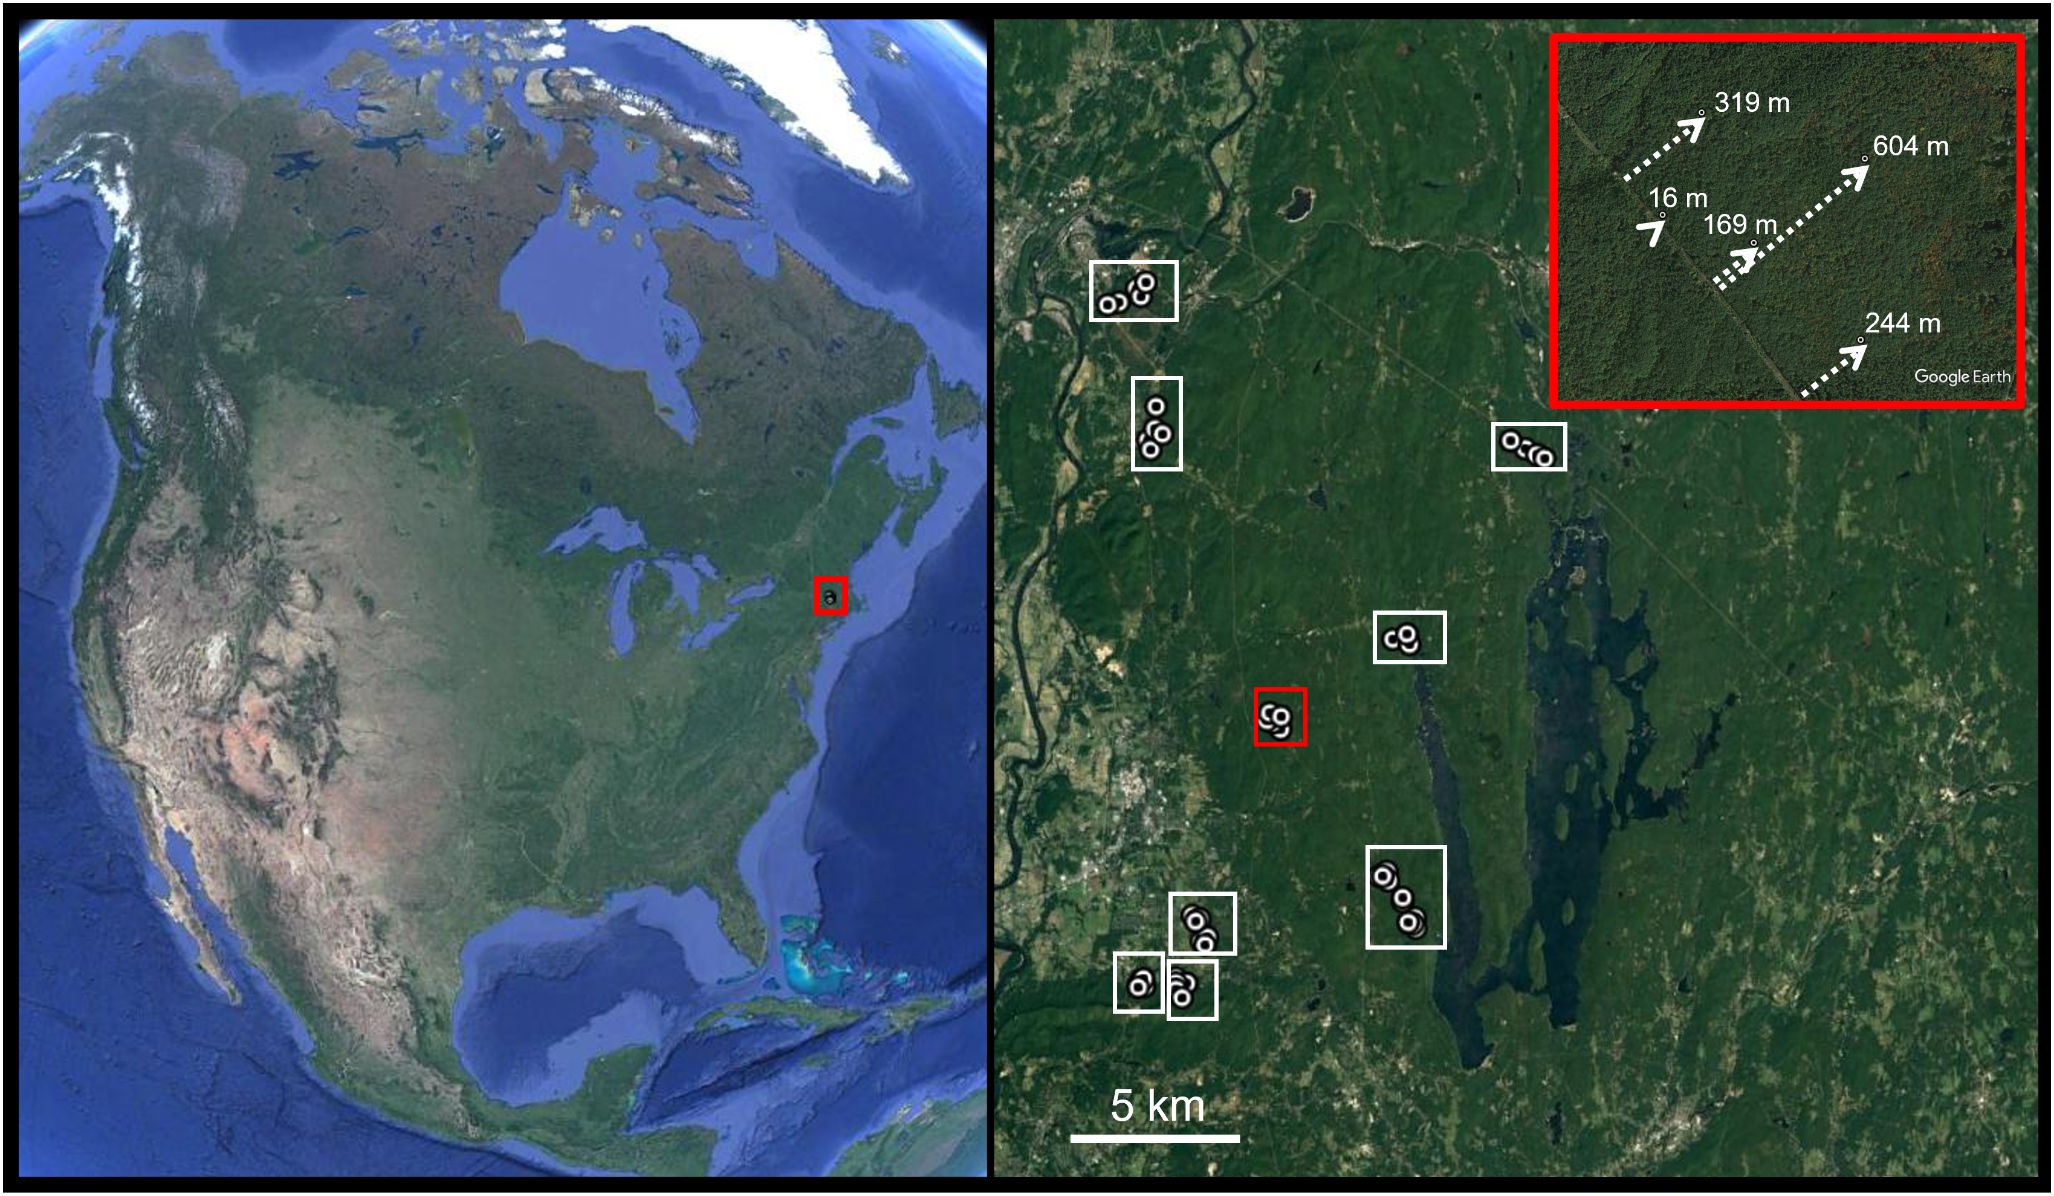
Figure 1 Sites were located in the northeastern United States in a forested landscape of western Massachusetts. Within each forest, or Wildlife Management Area, a series of sites were established that collectively represented a distance gradient from an opening, often a powerline right-of-way, managed for wildlife (see inset for an example).
2.2 Bee sampling
Bees were sampled at 17 sites in 2020 (April 29–October 14) followed by a different suite of 30 sites in 2021 (March 25–August 25) across nine forests (Figure 1) for a total of 47 sites that were each sampled for one year (Supplementary Table A1). Sites were established along a distance gradient from the edge of a managed opening and into the forest interior up to 640 m within each forest to represent the multidimensional aspect of a forest (Figure 1). Since some bee species have the capacity to forage long distances (Zurbuchen et al., 2010), and to include a variety of forest types and management histories into our study, we addressed potential spatial autocorrelation among sites within a forest through our statistical approach. The shortest distance between sites within a forest averaged 351 m (SD: 162 m; range: 157–973 m) and the shortest distance between forests averaged 3.1 km. We sampled bees at each site by attaching Blue Vane Traps (BanfieldBio Inc.™) to one central rope that reached from the forest floor to a branch high in the canopy (herein ‘trap line’) as in Cunningham-Minnick and Crist (2020). Tree species targeted for trap lines varied depending on the tree composition of the site and branch availability for a trap line, but included all aforementioned canopy species. Traps were vertically spaced five meters apart at 1, 6, 11, and 16 m on each trap line, though we included traps at heights of 21 and 26 meters if branches in the high canopy were strong enough, for a total of 4–6 traps per site. Soapy water was placed in traps to reduce surface tension and capture specimens. Sampling was continuous over time; the contents from traps were emptied and traps reset with fresh soapy water roughly every two weeks (Supplementary Table A1). Bees were taken back to the lab, pinned, and identified to species by JM using published keys (Mitchell, 1960, 1962; LaBerge, 1973, 1980, 1986, 1989; Gibbs, 2011; Gibbs et al., 2013) and the online source Discoverlife.org (Ascher and Pickering, 2020). Seven Nomada bees were lumped as Nomada bidentate group due to unresolved taxonomy. Voucher specimens are currently being held in the research collection of JM.
2.3 Vegetation sampling
2.3.1 Not tree-associated
To understand local environmental factors that may affect the bee community, including available nesting and food resources, we measured multiple aspects of the vegetation community. At each site, we recorded the ground substrate at 20 randomized locations (angle and distance up to 20.0 meters from trap line) as either bare soil, dead wood, duff, leaf litter, moss, or rock. Since 95% of the 340 randomized locations sampled were leaf litter, we did not include this as a predictor in our models. We converted the presence of coarse woody debris (>4 cm diameter) on the ground and herbaceous plants at each location into separate variables as proportions to represent relative availability of food and nesting resources. To address potential negative effects of vegetation density on the presence of bees in the understory, we took detailed measurements of understory structure including the highest contact point less than 1, 2, and 3 meters on a 3-m pole for a total of 60 measurements per site (Roberts et al., 2017). This information was used to create variables of the overall understory structure (proportion of potential contact points touched by vegetation), the average maximum vegetation height, and the coefficient of variation in the max height of vegetation at each site.
2.3.2 Tree-associated
To develop variables that are likely to influence bees at strata above the understory, we measured the diameter of each snag (dead standing tree) and mature tree (>8 cm diameter at breast height) within 11.3 m of the site center, chosen to account for the breadth of tree crowns, of the trap line and calculated the mean diameter at breast height, as well as total basal area, of the site for snags, coniferous trees, and deciduous trees as separate variables. We also qualified the presence of foliage and deadwood (estimated >4 cm diameter) above the ground and binned to distances above the ground that corresponded to the height of each trap (0–3.5 m for trap at 1 m, 3.6–8.5 m for trap at 6 m, etc. that corresponded with the understory stratum) at nine locations (site center and 5-m and 10-m in each cardinal direction) and converted the data into a proportion for predictor variables representing food (floral resources on live twigs near foliage in spring) and nesting (dead wood) sources.
2.3.3 Seasonality and edge-effects
Since the expected use of forest floral resources by bees is seasonally dependent on floral resource availability (Smith et al., 2019), yet some studies have found many bees in the forest late in the summer (e.g., Ulyshen et al., 2010; Milam et al., 2022; Cunningham-Minnick et al., 2023), we created a variable of ‘season’. Cunningham-Minnick et al. (2023) found that the bee community composition shifted among forest strata based on tree leaf phenology. Therefore, we categorized our seasons as ‘early spring’, ‘late spring’, and ‘summer’ based on the changes in canopy cover. We converted pictures taken of the forest canopy at the center of all sites in 2021 (Samsung Galaxy S10e camera at 1.0x zoom) at different times of the year into black and white contrasts using the imageJ software (Schneider et al., 2012), then graphed the proportion of pixels representing canopy cover as a function of the day of year and estimated changes in slope at May 8 and June 20 which represented the onset and completion of the forest leaf phenology and corresponded with season (Supplementary Figure A2). Finally, we accounted for potential edge effects by including distance to the nearest opening (powerline rights-of-way, road edges and managed barrens) as a covariate in all model building procedures.
2.4 Statistical analyses
2.4.1 Deriving forest strata
To determine if vertical stratification is best described in terms of absolute height above the ground or in relation to the height of the canopy (Objective 1), we built generalized linear mixed effects models. Specifically, we compared the fit of models with a single predictor of either the relative height of the trap to the mean height of the canopy (relative mean canopy height), relative height of the trap to the maximum height of the canopy (relative max canopy height), or height above the ground (absolute height) to each response (bee abundance and species richness). We employed a rangefinder to measure the canopy height at nine locations within 11.3 m of each site center, from which we extracted the mean and maximum heights (Figure 2). We allowed the model intercept to vary with year to account for interannual differences, as well as site nested within forest to account for the different forest types and effects of previous management, the repeated sampling of each site, and any imbalance in the sampling design due to lost traps due to extreme weather events and wildlife tampering; thus, our analysis differentiated between zeroes and NAs. Finally, to account for additional sampling effort in strategies with pooled strata (number of traps deployed) as well as traps that were deployed for more or less than fourteen days (e.g., we did not collect samples during storms), we included an offset of the number of days each trap was deployed (logged to be compatible with the log-link in models). We performed likelihood ratio tests of each single-predictor model against a null that only included the error terms for each response, for a total of four likelihood ratio tests and directly compared single-predictor models with AICc (Mazerolle, 2023). Since relative mean canopy height was a better predictor of bee abundance and species richness (Table 1), we binned relative mean canopy heights into three simple strata based on the growth forms of the vegetation including understory (herbaceous and shrub layer: relative height ≤ 0.167), midstory (midstory and immature trees: 0.167 < relative height < 0.640), and canopy (large mature trees: relative height ≥ 0.640) for all other analyses.
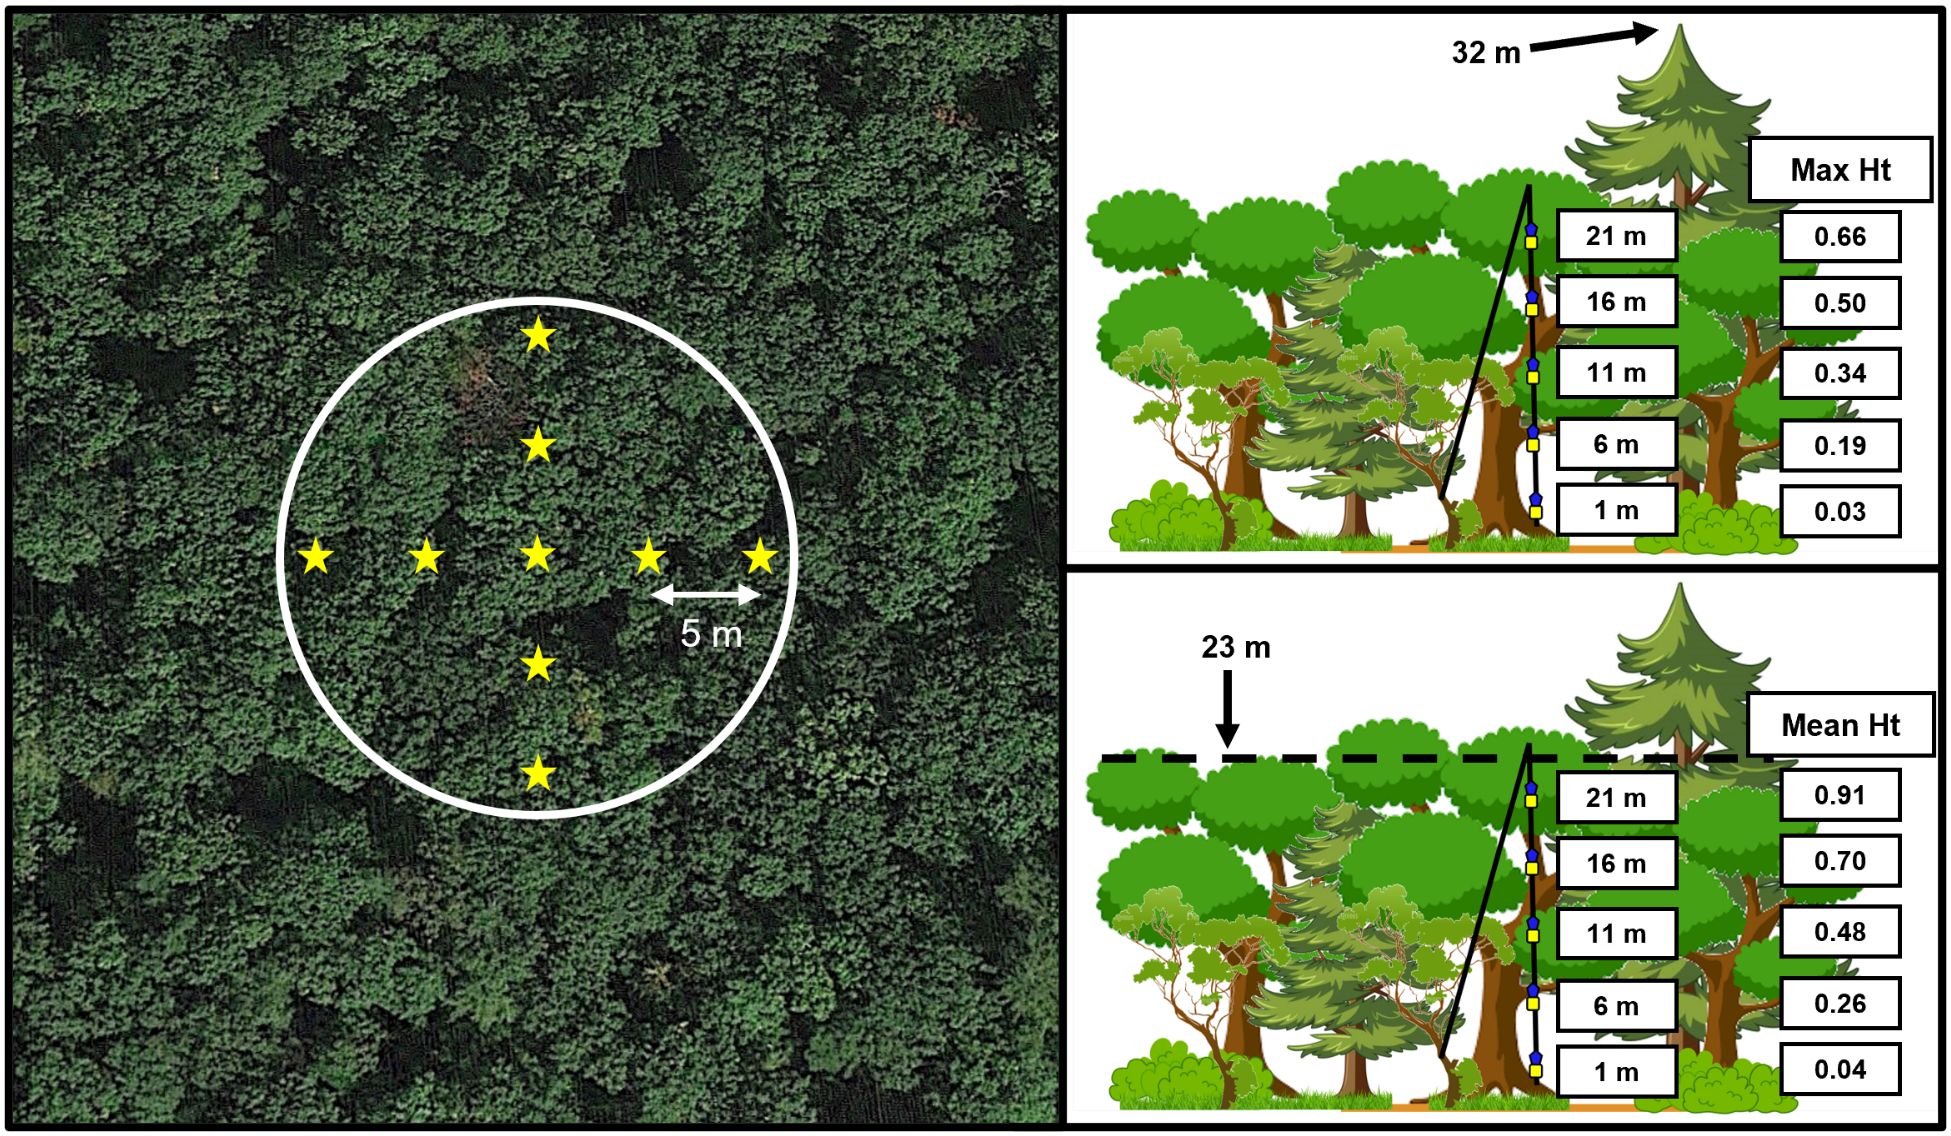
Figure 2 Sampling design as it relates to trap height above the ground (i.e., 1, 6, 11, 16, and 21 meters) relative to canopy height. Canopy height was measured at nine locations (stars) at each 11.3-m radius site (left) with a rangefinder, including at the trap line as well as 5 m and 10 m in each cardinal direction. Trap height relative to the maximum canopy height (top-right) was then calculated as the proportion of the height of each trap relative to the tallest measurement taken (32 m in figure). Similarly, trap height relative to the mean canopy height (bottom-right) compared trap heights above the ground to the average of all nine measurements (23 m in figure).
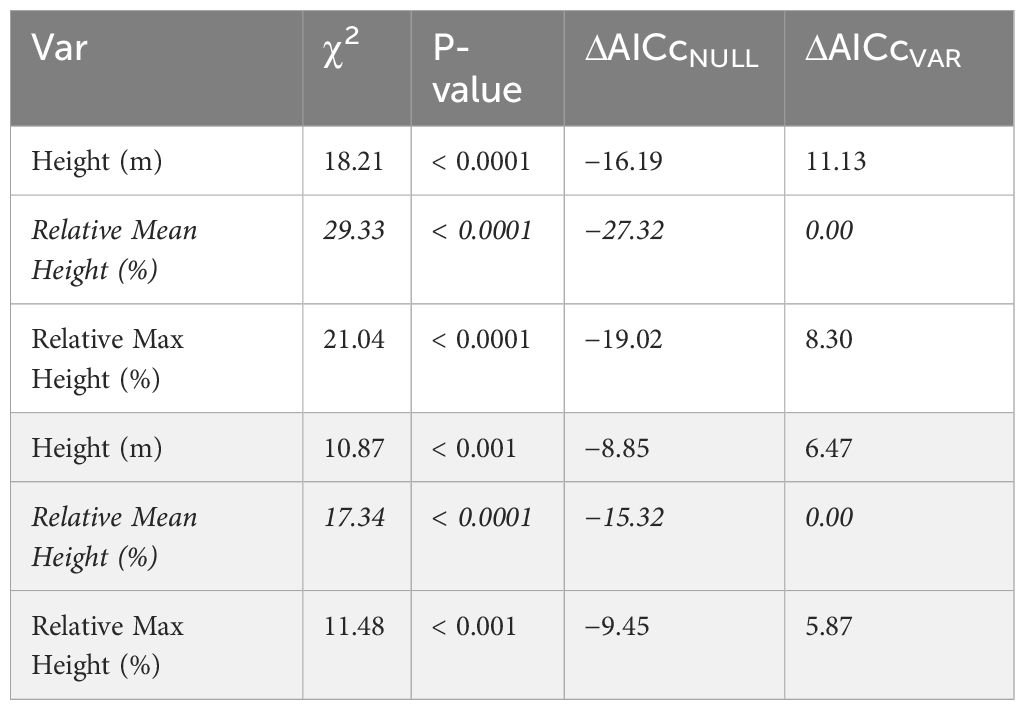
Table 1 Comparison of models to determine the best approach for stratum classification, including Chi-squared (χ2) statistics, associated p-values, and change (Δ) in Akaike Information Criterion corrected for small sample size (AICc) of single-predictor generalized linear mixed effects models (CVAR) compared against the null, as well as change in AICc compared to best model (italicized) for bee abundance (unshaded) and species richness (shaded) responses.
2.4.2 Comparing responses among strategies
To compare abundance and diversity among sampling strategies (Objective 2), we built generalized linear mixed effects models for each strategy. Bee abundance and species richness were response variables and represented pooled bees from each stratum included within each strategy. For instance, bee abundance for the strategy of sampling the understory and canopy was the sum of the bee abundances for those strata while species richness was the total number of species within the pooled assemblages of those strata. In all linear models, we tested the inclusion of distance to forest edge (continuous) and season (categorical based on change in canopy cover; Supplementary Tables A2, A3). Distance to forest edge rarely occurred as an interaction term with focal model covariates and will not be discussed further (Supplementary Table A2). The error structure was identical to the models comparing height variables.
Strategy models were fit with the glmmTMB function in the glmmTMB package (Mollie et al., 2017) term-by-term, including two-way interactions, with a suite of variables representing potential environmental associations of the understory with bees, including vegetation structure as well as food and nesting resource availability that were categorized as associated with mature trees (e.g., basal area of mature woody plants) or not (substrate on soil surface; vegetation cover and structure). If an additional term increased model fit >2 AICc units, then that term was added. This process was continued until all resulting models were >2 AICc units less than the simplified model, at which point the simplified model was considered the best model for that strategy and response. From each of the eight best models (two responses each for four sampling strategies), we calculated 95% CIs of the y-intercept representing the expected number of bees or bee species within each sample and determined strategies to be different if confidence intervals did not overlap.
2.4.3 Comparing bee ecology among strategies
To determine whether sampling strategy has the potential to influence inferences of forest-bee ecology (Objective 3), we considered linear and segmented (nonlinear) regression models. First, we determined the explanatory power of the environmental covariates by examining differences in coefficients of determination (R2) – a metric describing how well the model explains variation in the response data – between the marginal effects (fixed explanatory variables) of best models derived for Objective 2 with only the predictors of distance to forest edge and seasonality with the r.squaredGLMM function in the MuMIn package (Bartoń, 2023). This allowed us to calculate how much variation in the response was explained by the environmental factors within the model. We also calculated the proportion of all variation explained by each model due to captured environmental variation as the quotient of the marginal R2 of environmental predictors and the conditional R2 of the entire model. To determine if model variation explained by understory variables not associated with higher strata (non-tree) changed among strategies, we repeated the comparisons of R2 with marginal R2 calculations for models without non-tree variables.
We then determined if the relationship of each response differed per predictor among strategies by fitting single-predictor models of linear (as previously described) and nonlinear models and comparing the 95% CIs of fitted slopes. We considered predictors that were most often included in best models to linear fits. To examine potential nonlinear relationships between bee abundance and species richness to environmental factors, we employed a segmented, or broken-stick, regression model for each environmental variable examined in linear models across strategies with the segmented package (Muggeo, 2008). To ensure all strategies had the exact same breakpoints, we included all strategies within each model fit (Muggeo, 2003). We chose the number of breakpoints to use in a model through AICc comparison of models fit with one to five breakpoints. Once breakpoints were identified, we fit each strategy with a segmented regression and included an offset term for the total sampling duration of traps. We extracted the slopes from the summary output of the model (summary function) and calculated the 95% confidence interval of each slope as the slope plus or minus the square root of the sum of the variance–covariance matrix of included terms multiplied by 1.96. All plots were created with the ggplot2 package (Wickham, 2016) and all analyses were performed in R (R Core Team, 2023).
2.4.4 Bee community composition
The community composition among strata were statistically compared with PERMANOVA using the adonis function and differences among different combinations of season and stratum were determined with the pairwise.adonis function in the pairwiseAdonis package (Arbizu, 2017). Overall expected species richness of the community for each strategy was estimated with the estimateR function in the vegan package. We report 95% confidence intervals for Chao1 estimates, which calculate the number of unobserved species based on the observed number of singletons and doubletons, as well as ACE estimates, which employ a coverage-based estimator of rare (10 individuals or less) versus common (>10 individuals) species (Chao and Chiu, 2016).
3 Results
Traps sampled a total of 4,765 bees of 109 species, including 258 specimens that could not be identified to species due to body damage and unresolved taxonomy; for instance, 131 unidentified specimens were of the subgenus Lasioglossum (Dialictus), a taxonomically difficult group. The specific composition of this community and close examination of its ecological relationships is outside the scope of this study and will be published separately.
Generalized linear mixed effects models demonstrated that variation in the vertical distribution of bee abundance and species richness was better explained by the height of the trap in relation to the mean canopy height than relative height in relation to the maximum canopy height and the absolute height from the forest floor (Table 1; Figure 2). Subsequent model selection of strategies with the relative mean canopy height covariate showed that bee abundance and species richness were highest when all strata were considered followed by the strategy that included only understory and midstory strata, while abundance and species richness were lowest when only the understory was sampled (Figure 3). This pattern was also observed when comparing species richness estimates among strategies that considered sample coverage (Table 2) and collectively demonstrates that unique species occurred within each stratum.
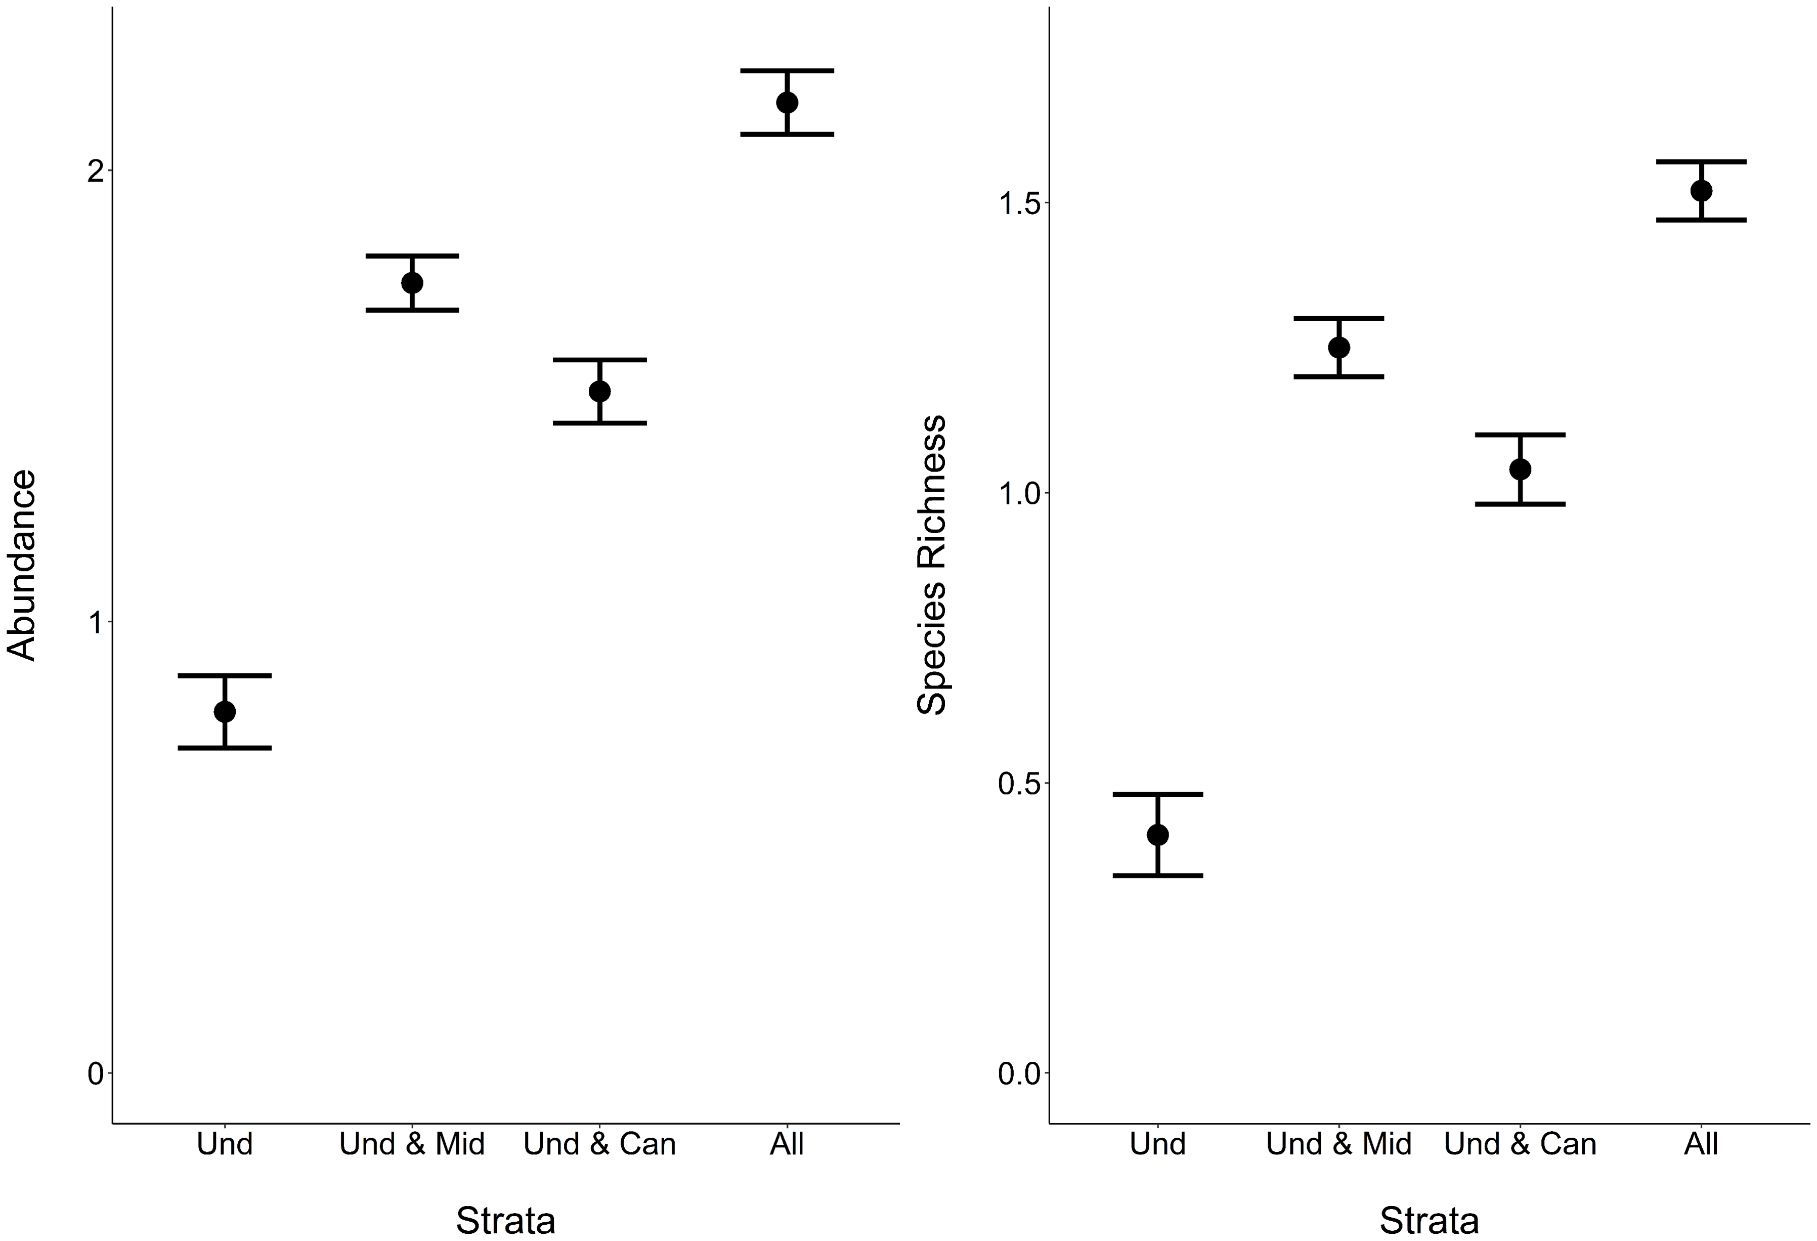
Figure 3 Comparing the interpretation of bee metrics with different strategies. Mean and 95% CI of fitted bee abundance (left) and species richness (right) per sample per site (two weeks of trap deployment) from generalized linear mixed effects models for each sampling strategy (Und, understory; Mid, midstory; Can, canopy; All, all strata).
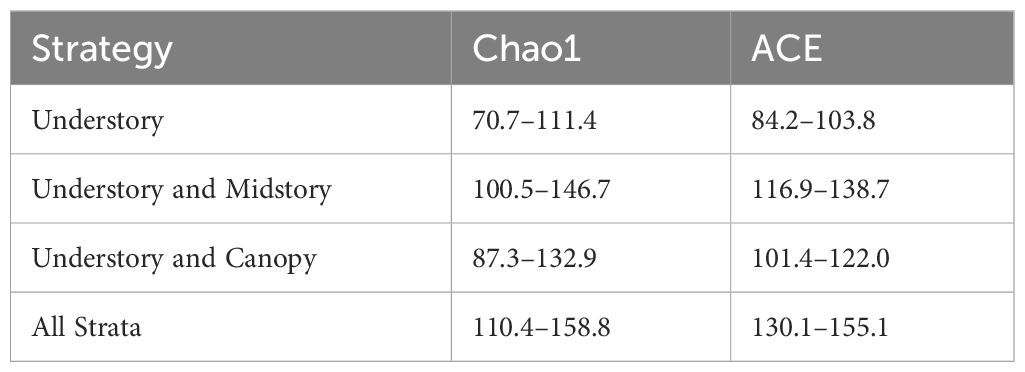
Table 2 Confidence intervals (95%) of bias-corrected species richness estimates that base the number of unobserved species on the number of singletons and doubletons (Chao1) and sampling completeness (ACE).
The predictor of herbaceous cover was included within the best model for all strategies of the abundance response, as well as strategies modeling the richness response (Table 3; Supplementary Table A2). Herbaceous cover was the only environmental predictor in best models for abundance not associated with mature trees, though coarse woody debris on the ground was included species richness models. The explanatory power of herbaceous cover for variation in bee abundance data was highest for the strategy only including understory bees (0.147) and lowest when bees in all strata were pooled (0.046), demonstrating a bee in the midstory or canopy is much less affected (< 33%) by resources offered by herbaceous plants than a typical bee found in the understory (Table 3). This pattern was also apparent when considering only variation explained by the model (understory: 53%, all strata: 23%), affirming this difference in relationships with herbaceous cover among strategies is due to biological responses of bees at different strata and not a modeling artifact (e.g., differences in covariates among models, unmeasured covariates; Table 3). The same pattern was found when considering both tree- and non-tree-associated predictors (Table 3). Modeled strategies explaining species richness also demonstrated a decrease in explanatory power of the dataset and model with the addition of bees in higher strata, meaning that variables in the model were explaining the occurrence of bees in the canopy poorer than bees in the understory. However, the strategy including all strata explained more variation in the data when all understory predictors were considered compared to the strategy of understory plus canopy. Further, sampling all strata showed that non-tree-associated factors (coarse woody debris on the ground and herbaceous plants) played a larger role in explaining the bee community than strategies including the understory and just one higher stratum (Table 3). Slopes of linear relationships between response variables and predictors did not vary among strategies with the exception that the understory and midstory sampling strategy in early spring in response to tree foliage was not significant, while the other strategies responded positively (Figures 4, 5; Supplementary Table A3).
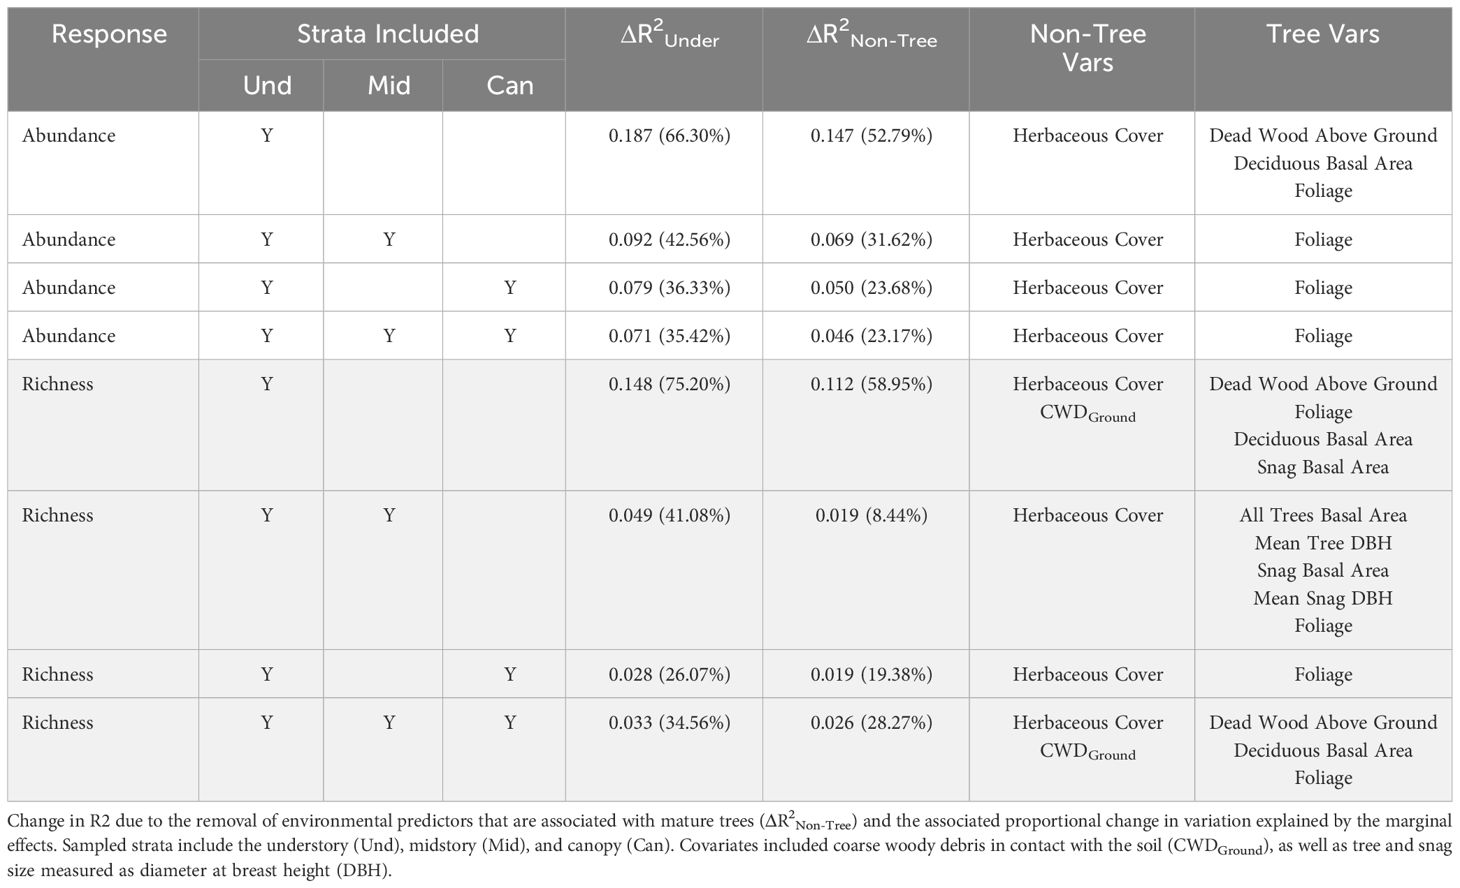
Table 3 Change (Δ) in coefficient of variation (R2) between all marginal effects (including distance to forest edge and season) of the best model and the marginal effects of the simplified model excluding all environmental factors measured in the understory (ΔR2Under), as well as the associated change in the proportion of the marginal variation to total variation explained in the model expressed as a percent in abundance (unshaded) and species richness (shaded) models.
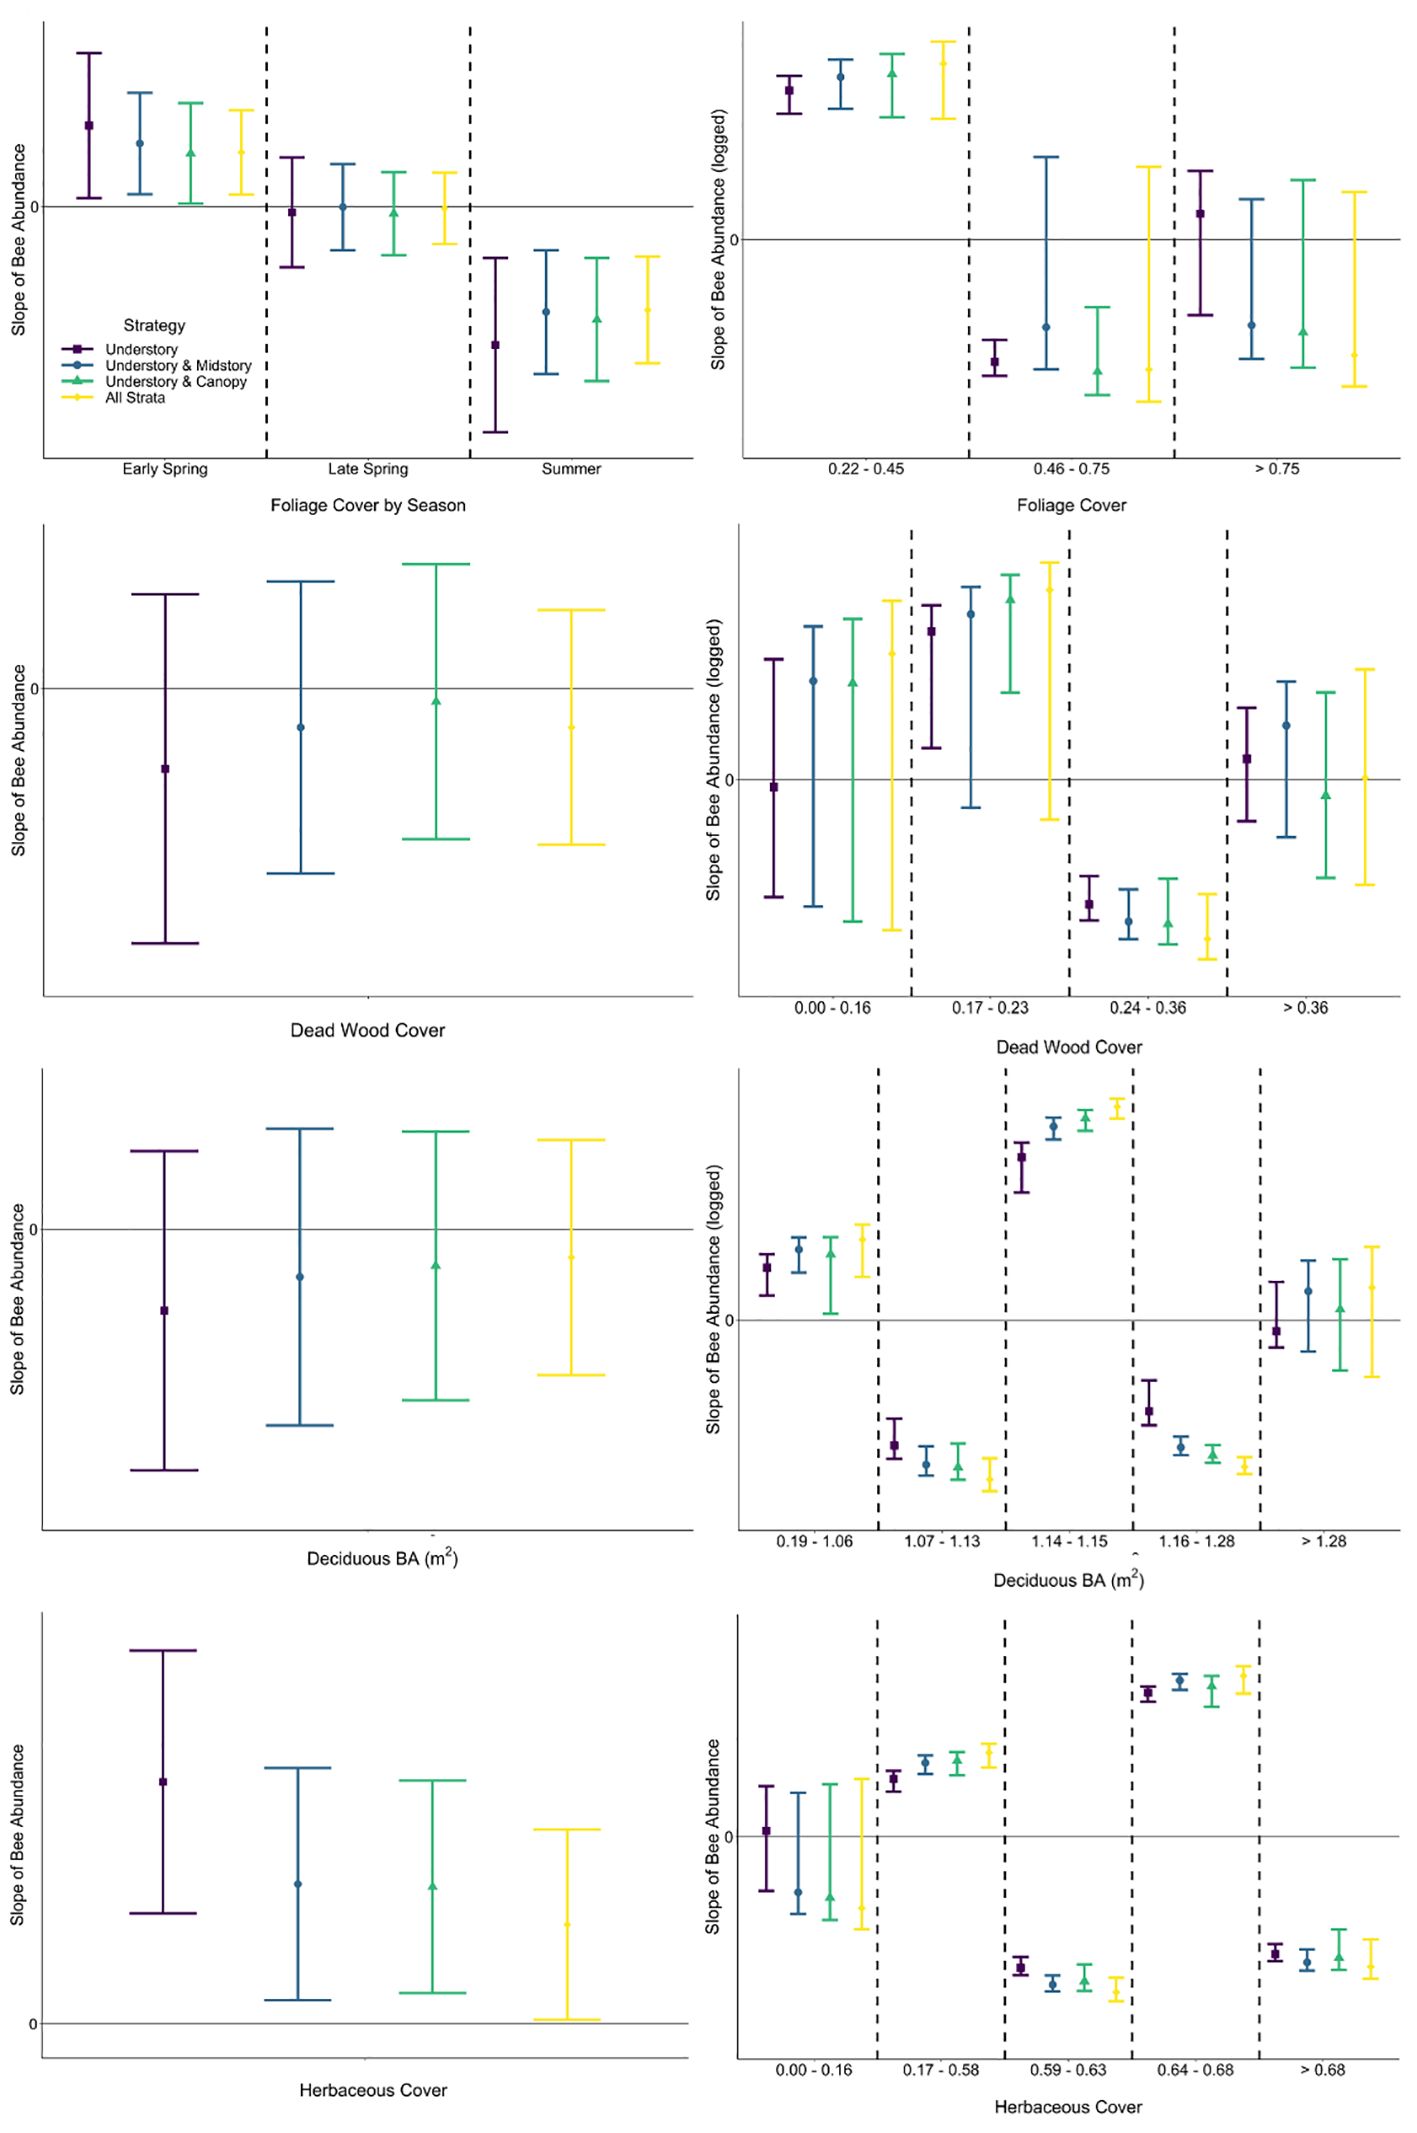
Figure 4 Comparison of slopes (with 95% CIs) of fitted single-predictor relationships (first row: foliage cover, second row: dead wood cover above the forest floor, third row: basal area of deciduous trees, fourth row: herbaceous cover) explaining bee abundance within generalized linear mixed effects (left column) and segmented regression (right column) for each strategy. Foliage cover was modeled with season interaction in linear regression. Among strategies, slopes with 95% CIs that do not overlap would be interpreted differently, as would slopes with 95% CIs that cross zero (not statistically significant) versus those that do not.
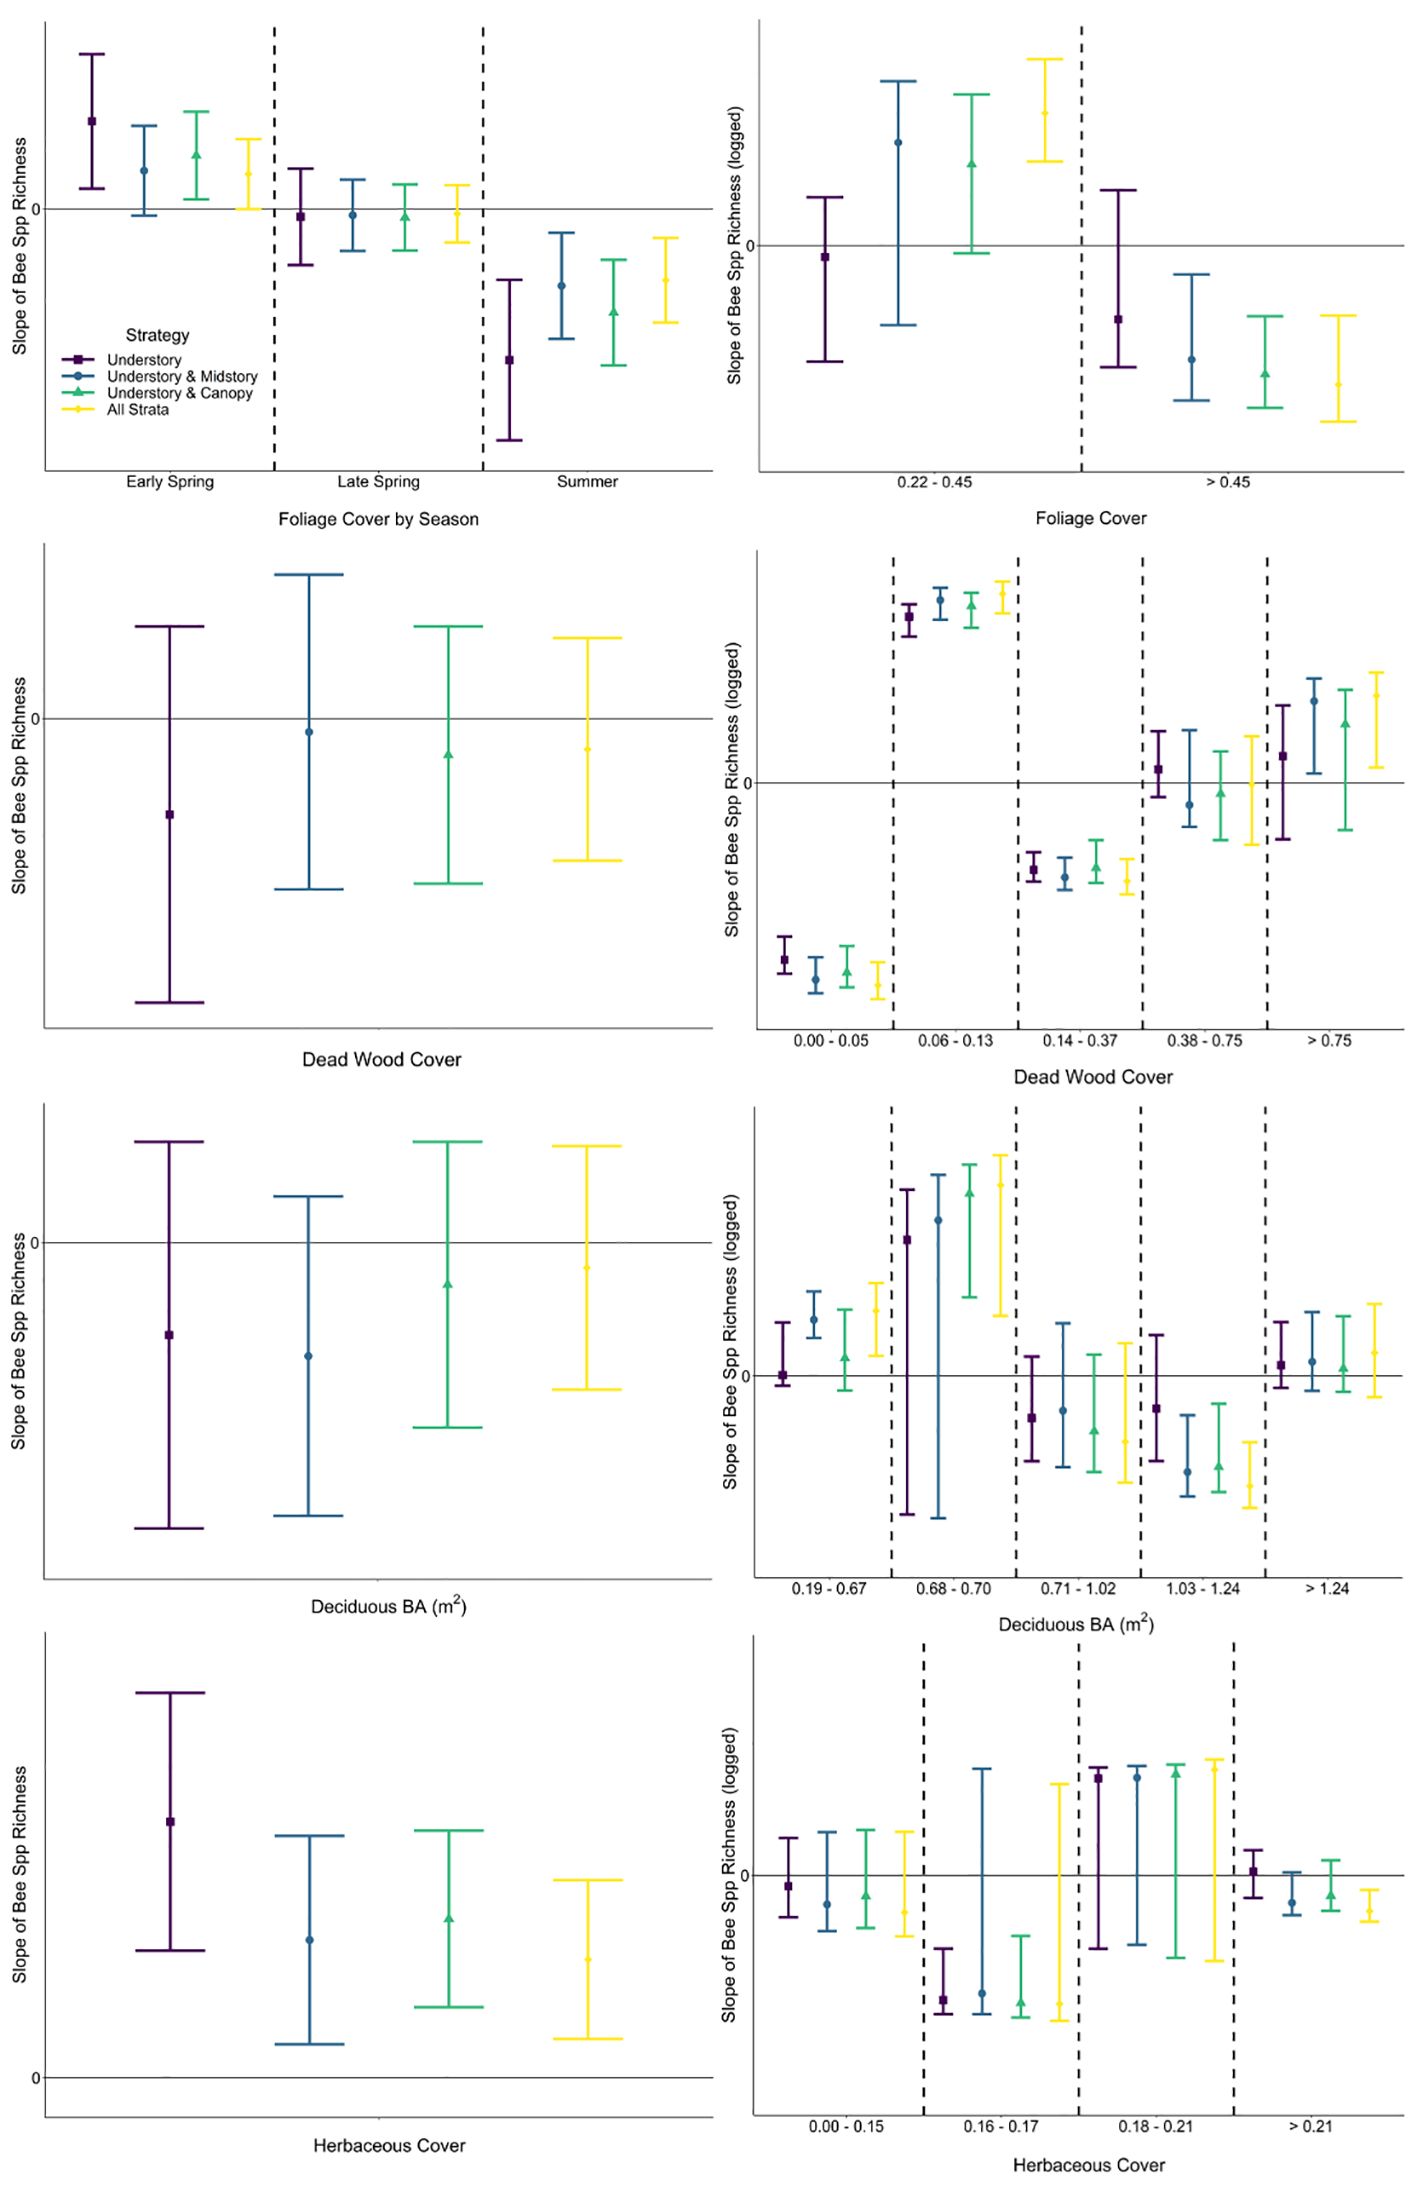
Figure 5 Comparison of slopes (with 95% CIs) of fitted single-predictor relationships (first row: foliage cover, second row: dead wood cover above the forest floor, third row: basal area of deciduous trees, fourth row: herbaceous cover) explaining bee species richness within generalized linear mixed effects (left column) and segmented regression (right column). Among strategies, slopes with 95% CIs that do not overlap would be interpreted differently, as would slopes with 95% CIs that cross zero (not statistically significant) versus those that do not.
A segmented modeling approach revealed that relationships between bee abundance and each predictor included negative and positive slopes for most strategies, demonstrating that the relationship was not linear (Figure 4). Furthermore, there were differences in segment slopes within most strategies both in direction and magnitude (mean or confidence interval on the positive or negative side of zero, respectively). Relationships of bee species richness via segmented regression similarly showed variability in direction and magnitude of fitted slopes among strategies and covariate values (Figure 5). Notably in the understory, there was high uncertainty that the slope of all segments across some predictors (i.e., foliage cover, basal area of deciduous trees) was different from zero; meaning that bees sampled in the understory were not responding consistently negatively or positively to environmental variables of the understory (Figure 5). Among strategies and within covariate values, there were many occurrences of non-overlapping confidence intervals, indicating that interpretation of the bee–environment relationship will differ by sampling strategy. Finally, bee community composition differed among all strata by season combinations except the midstory vs canopy in the early spring and summer, as well as the understory vs canopy and midstory vs canopy in the late spring (Supplementary Table A4).
4 Discussion
Our findings highlight that study design approaches, including sampling strategies and their analysis, can change how forest-bee communities are characterized. We demonstrate that not sampling higher strata may lead to poor estimates of forest bee community metrics and potentially misrepresent forest bee habitat associations. We discuss these issues as well as how they are likely to bias our understanding of bee communities within forests and the conservation value of closed-canopy forest systems.
4.1 Ignoring vertical strata underestimates community metrics
We encountered bees in all strata, which is consistent with other studies that sampled at least three strata (e.g., Cunningham-Minnick and Crist, 2020; Ulyshen et al., 2020; Cunningham-Minnick et al., 2023) indicating that sampling more strata increased the number of individuals and species that are expected to occur within forests. Our findings confirm that sampling the understory, midstory, and canopy will lead to abundance and species richness estimates that are greater than the expected values modeled from understory sampling alone. It follows that not including higher strata within the sampling design will underestimate community metrics and consequently the pool of pollination service potential that forests provide (Blaauw and Isaacs, 2014). Considering the importance of closed-canopy forests in pollinator conservation discussions (reviewed in Ulyshen et al., 2023), our study suggests future work is needed to characterize the temporal component – particularly following leaf-out – of these communities in the understory, midstory, and canopy to provide the most accurate understanding of native bee distribution in forests.
The finding that sampling the understory, midstory, and canopy provides a different interpretation of bee community metrics than other sampling strategies is likely a direct consequence of the unique composition of bee assemblages at each strata, albeit season dependent. However, Cunningham-Minnick and Crist (2020) and Cunningham-Minnick et al. (2023) found that community composition did not differ among understory, midstory, and canopy strata, while Ulyshen et al. (2020) found that bee community composition differed between understory and canopy assemblages, which is consistent with other studies that examined two strata (i.e., Ulyshen et al., 2010; Milam et al., 2022). Since most other studies did not evaluate how species composition changed across the three strata considered in this study throughout the temperate seasons, it is difficult to discern if our approach of employing relative height with respect to the mean canopy height for binning traps within strata is responsible for the observed differences with previous studies. It also remains unclear if division of the vertical gradient into three discrete strata is the best approach to describe a community of organisms that presumably move freely in and out of strata when resource availability changes seasonally (Bertrand et al., 2019). For instance, bee composition of the understory differed from the canopy between early spring and summer, but notably the midstory composition differed from that of the understory across seasons yet was never statistically different from the canopy. This clear seasonal shift in composition among strata indicates that forest-bee communities are spatially and temporally dynamic, and highlight the possibility for seasonal-dependent stratum specialists (Dorey et al., 2024). Further investigation into the local factors responsible for the occurrence of species along the vertical gradient of resource availability within the forest will surely provide insight into how many strata need to be considered in sampling strategies, or if vertical sampling is better approached as a continuum. Nonetheless, our findings collectively highlight that sampling the understory, midstory, and canopy strata of closed-canopy forests provide a more informed understanding of the bee community than other sampling strategies when strata are based on the trap height relative to the mean height of the canopy and sampling includes the entire flight period of native bees.
4.2 Bees respond at heights relative to the canopy
To our knowledge, we present the first analysis of bee community responses to forest strata in temperate forests described in terms of relative canopy height. The fact that relative mean canopy height was a better predictor of bee abundance and species richness than height above the ground suggests future work on forest bees should consider this metric in their analyses. Note that trap height relative to the maximum canopy height performed poorly and on par with height from the forest floor in models. Considering that the bee community extends above the forest canopy (Cunningham-Minnick et al., 2023), our findings highlight the potential importance of canopy topography, or variation in height among neighboring emergent trees, in affecting the distribution of forest bees. Thus, instead of considering the mean canopy height as a physical boundary for bees, it should be recognized as an important scaling point from which to describe the vertical distribution of the forest-bee community. There are likely many questions and exceptional situations pertaining to the degree of variability in mean canopy height of different forest types and geographic locations of varied topography (Rahman et al., 2022) that need to be addressed to validate the improved fit of bee community metrics to relative mean canopy height within analyses. Nonetheless, researchers adopting this consideration of trap height relative to the mean canopy height in their design and analyses will improve our understanding of forest bee communities and help standardize sampling.
4.3 The role of vertical strata in forest bee ecology
Our study demonstrates that the interpretation of ecological relationships between forest-bee communities and local forest characteristics change with sampling higher strata. Specifically, our findings highlight how the prediction ability of local factors present only in the understory (i.e., herbaceous cover, woody debris on the ground) is limited in describing the bees in higher strata. Combined with the overall decrease in the proportion of bee data explainable by all understory variables measured, our findings suggest there are important resources for forest bees associated with mature trees and snags in the midstory and canopy across seasons. Quantifying the relationships between bee community metrics and local forest factors or the conservation implications of these findings is outside the scope of this study; however, while foundational studies have identified important roles of canopy resources for bees in early spring (Smith et al., 2019; Cunningham-Minnick and Crist, 2020; Simon et al., 2021; Urban-Mead et al., 2023), more field studies are needed to identify and investigate mechanisms responsible for bee presence in the canopy throughout the rest of the year (Dorey et al., 2024).
In addition to changes in the magnitude of ecological relationships, we also found that the slope of these relationships with local forest factors were dependent on the included strata. Importantly, this was not the case when responses were analyzed with linear regression. Our results from segmented regressions demonstrated clear differences between strategies and suggest that relationships between common bee community metrics and local factors are not linear when additional strata are considered. The changes in slope directions among segments suggest that greatest bee abundance and species richness occurs at optimal values of each covariate rather than the ‘less or more’ situation associated with linear regression, which has been demonstrated when relating landscape composition to bee community metrics (Roberts et al., 2017). Therefore, analyzing bee abundance and species richness with linear regression may provide a false understanding of how the bee community responds to resources (e.g., food and nesting) within forest habitat. This warrants further investigation into nonlinear analysis techniques to describe bee ecological relationships, as it will be important for conservation practitioners to know that too much or too little of a particular resource may foil their efforts to meet pollinator conservation objectives. We also caution that we only modeled local forest factors as measured in the understory and were only interested in the slopes of these relationships. Thus, it remains unclear if these patterns will hold when covariates that include measurements at other vertical strata are employed in analyses. Further, the covariates used in segmented models were chosen based on optimal fits in linear regression models and thus did not undergo the same model selection process which would be needed to formally demonstrate these differences. If these patterns hold in future studies, their implications on forest-bee conservation will extend towards management of forests to meet optimal local conditions for an abundant and species rich bee community.
Though the methodology employed in this study demonstrates clear patterns, forest-bee researchers should keep in mind several factors that could, simply due to a lack of testing, result in a different interpretation. For instance, our study design included many blue vane traps in close proximity that were employed continuously. In bee habitat different than closed-canopy forest, these traps have been suggested to place some populations at risk due to their high catch-rates and potential oversampling (Gibbs et al., 2017). We based our sampling effort on previous experience with these traps in forest systems (e.g., Cunningham-Minnick and Crist, 2020; Milam et al., 2022; Cunningham-Minnick et al., 2023) and our total specimen count suggests that oversampling was likely not an issue, as each of our 47 trap lines (4–6 blue vane traps each) sampled an average of roughly 100 bees throughout the experiment. Nonetheless, employment effort of other trap types used in forest systems (e.g., Ulyshen et al., 2010; Campbell et al., 2018; Urban-Mead et al., 2021) may require a different design to avoid oversampling, which if present would interfere with data interpretations during multiyear studies and be counterproductive to conservation research efforts.
5 Conclusion
The current approach to most forest-bee studies largely limits 1) sampling of the bee community and environmental factors to the understory in the spring before leaf-out and 2) analyzing relationships of bee communities with environmental covariates using linear relationships. We demonstrate that only sampling bees and resources within a single season and stratum, or even two strata, does not represent the vertical stratification and seasonal dynamism of the forest bee community. Therefore, to prevent underestimation of the abundance and richness of forest-bee communities, we recommend that future studies of native bees in forests consider the bees occurring in at least the canopy, midstory, and understory in respect to the mean canopy height throughout a greater part of the year. We further urge researchers to consider analyzing the relationships between bees and local forest conditions at these strata using non-linear methods. Doing so will allow forest scientists and land managers to better evaluate the role of forests in conserving native bee communities. Notably, the implications of these recommendations may complicate the feasibility of land managers to survey or monitor forest-bee communities at this level; however, the sampling strategy we have selected should facilitate the discovery and description of mechanisms shaping the distribution of forest bees and other pollinator taxa, and modifications will likely be needed with additional research characterizing forest-pollinator communities. Following the guidelines presented in this paper will more broadly increase our understanding of the role of closed-canopy forests across forest types in supporting native pollinators, help standardize sampling and monitoring efforts of native bee and other pollinator communities, and further contribute to a deeper understanding of the currently undescribed mechanisms explaining forest pollinator distribution and conservation needs.
Data availability statement
The raw data supporting the conclusions of this article will be made available by the authors, without undue reservation.
Ethics statement
The manuscript presents research on animals that do not require ethical approval for their study.
Author contributions
MC: Conceptualization, Data curation, Formal Analysis, Investigation, Methodology, Project administration, Software, Visualization, Writing – original draft, Writing – review & editing. HR: Conceptualization, Data curation, Investigation, Methodology, Project administration, Writing – original draft, Writing – review & editing. JM: Data curation, Investigation, Methodology, Resources, Writing – review & editing. DK: Data curation, Funding acquisition, Investigation, Methodology, Resources, Writing – review & editing.
Funding
The author(s) declare that no financial support was received for the research, authorship, and/or publication of this article.
Acknowledgments
We are grateful to the Amherst Conservation Commission of the Town of Amherst Massachusetts and the Massachusetts Department of Conservation and Recreation in the Quabbin/Ware Region for permission to work on public lands, which we respectfully acknowledge were traditionally cared for by the Pocumtuk people. We also thank Logan Tohline for excellent technical assistance.
Conflict of interest
The authors declare that the research was conducted in the absence of any commercial or financial relationships that could be construed as a potential conflict of interest.
Publisher’s note
All claims expressed in this article are solely those of the authors and do not necessarily represent those of their affiliated organizations, or those of the publisher, the editors and the reviewers. Any product that may be evaluated in this article, or claim that may be made by its manufacturer, is not guaranteed or endorsed by the publisher.
Supplementary material
The Supplementary Material for this article can be found online at: https://www.frontiersin.org/articles/10.3389/fevo.2024.1352266/full#supplementary-material
References
Allen G., Davies R. G. (2022). Canopy sampling reveals hidden potential value of woodland trees for wild bee assemblages. Insect Conserv. Diversity 16, 33–46. doi: 10.1111/icad.12606
Arbizu P. M. (2017). pairwiseAdonis: Pairwise multilevel comparison using Adonis_. R package version 0.4.1. Available at: https://github.com/pmartinezarbizu/pairwiseAdonis
Ascher J. S., Pickering J. (2020) Discover Life bee species guide and world checklist (Hymenoptera: Apoidea: Anthophila). Available online at: http://www.discoverlife.org/mp/20q?guide=Apoidea_species.
Bartomeus I., Scher J. S., Gibbs J., Danforth B. N., Wagner D. I., Hetdke D. I., et al. (2013). Historical changes in northeastern US bee pollinators related to shared ecological traits. Proc. Natl. Acad. Sci. 110, 4656–4660. doi: 10.1073/pnas.1218503110
Bartoń K. (2023) MuMIn: Multi-Model inference. R package version 1.47.5. Available online at: https://CRAN.R-project.org/package=MuMIn.
Bertrand C., Eckerter P. W., Ammann L., Entling M. H., Gobet E., Herzog F., et al. (2019). Seasonal shifts and complementary use of pollen sources by two bees, a lacewing and a ladybeetle species in European agricultural landscapes. J. Appl. Ecol. 56, 2431–2442. doi: 10.1111/1365-2664.13483
Biesmeijer J. C., Roberts S. P. M., Reemer M., Ohlemüller R., Edwards M., Peeters T., et al. (2006). Parallel declines in pollinators and insect-pollinated plants in Britain and the Netherlands. Science 313, 351–354. doi: 10.1126/science.1127863
Blaauw B. R., Isaacs R. (2014). Flower plantings increase wild bee abundance and the pollination services provided to a pollination-dependent crop. J. Appl. Ecol. 51, 890–898. doi: 10.1111/1365-2664.12257
Burkle L. A., Martin J. C., Knight T. M. (2013). Plant-pollinator interactions over 120 years: loss of species, co-occurrence, and function. Science 339, 1611–1615. doi: 10.1126/science.1232728
Cameron S. A., Lozier J. D., Strange J. P., Koch J. B., Cordes N., Solter L. F. (2011). Patterns of widespread decline in North American bumble bees. Proc. Natl. Acad. Sci. 108, 662–667. doi: 10.1073/pnas.1014743108
Campbell J. W., Vigueira P. A., Viguiera C. C., Greenberg C. H. (2018). The effects of repeated prescribed fire and thinning on bees, wasps, and other flower visitors in the understory and midstory of a temperate forest in North Carolina. For. Sci. 64, 299–306. doi: 10.1093/forsci/fxx008
Chao A., Chiu C. (2016). Species richness: estimation and comparison (Wiley StatsRef: Statistics Reference Online), 1–26. doi: 10.1002/9781118445112.stat03432.pub2
Cunningham-Minnick M. J., Crist T. O. (2020). Floral resources of an invasive shrub alter native bee communities at different vertical strata in forest-edge habitat. Biol. Invasions 22, 2283–2298. doi: 10.1007/s10530-020-02248-y
Cunningham-Minnick M. J., Milam J., Kane B., Roberts H. P., King D. I. (2023). Abundant, distinct, and seasonally dynamic bee community in the canopy-aerosphere interface above a temperate forest. Ecol. Evol. 13, e9739. doi: 10.1002/ece3.9739
Dorey J. B., Davies O. K., Magnacca K. N., Schwarz M. P., Gilpin A., Ramage T., et al. (2024). Canopy specialist Hylaeus bees highlight sampling biases and resolve Michener’s mystery. Front. Ecol. Evol. 12, 1339446. doi: 10.3389/fevo.2024.1339446
Eckerter T., Braunisch V., Buse J., Klein A. M. (2022). Open forest successional stages and landscape heterogeneity promote wild bee diversity in temperate forests. Conserv. Sci. Pract. 4, e12843. doi: 10.1111/csp2.12843
Geroff R. K., Gibbs J., McCravy K. W. (2014). Assessing bee (Hymenoptera: Apoidea) diversity of an Illinois restored tallgrass prairie: methodology and conservation considerations. J. Insect Conserv. 18, 951–964. doi: 10.1007/s10841-014-9703-z
Gibbs J. (2011). Revision of the metallic Lasioglossum (Dialictus) of eastern North America (Hymenoptera: Halictidae: Halictini). Zootaxa 3073, 1–216. doi: 10.11646/zootaxa.3073.1
Gibbs J., Joshi N. K., Wilson J. K., Rothwell N. L., Powers K., Haas M., et al. (2017). Does passive sampling accurately reflect the bee (Apoidea: Anthophila) communities pollinating apple and sour cherry orchards? Environ. Entomology 46, 579–588. doi: 10.1093/ee/nvx069
Gibbs J., Packer L., Dumesh S., Danforth B. N. (2013). Revision and reclassification of Lasioglossum (Evylaeus), L. (Hemihalictus) and L. (Sphecodogastra) in eastern North America (Hymenoptera: Apoidea : Halictidae). Zootaxa 3672, 1–117. doi: 10.11646/zootaxa.3672.1
Griffith G. E., Omernik J. M., Bryce S. A., Route J., Hoar W. D., Homer J., et al. (2009). Ecoregions of New England (Reston, Virginia: U.S. Geological Survey).
Hanula J. L., Horn S., O’Brien J. J. (2015). Have changing forest conditions contributed to pollinator decline in the southeastern United States? For. Ecol. Manage. 348, 142–152. doi: 10.1016/j.foreco.2015.03.044
Harrison T., Gibbs J., Winfree R. (2018). Forest bees are replaced in agricultural and urban landscapes by native species with different phenologies and life-history traits. Global Change Biol. 24, 287–296. doi: 10.1111/gcb.13921
Kennedy C. M., Lonsdorf E., Neel M. C., Williams N. M., Ricketts T. H., Winfree R., et al. (2013). A global quantitative synthesis of local and landscape effects on wild bee pollinators in agroecosystems. Ecol. Lett. 16, 584–599. doi: 10.1111/ele.12082
Klein A. M., Vaissiére B. E., Cane J. H., Steffan-Dewenter I., Cunningham S. A., Kremen C., et al. (2007). Importance of pollinators in changing landscapes for world crops. Proc. R. Soc. B – Biol. Sci. 274, 303–313. doi: 10.1098/rspb.2006.3721
Koh I., Lonsdorf E. V., Williams N. M., Brittain C., Isaacs R., Gibbs J., et al. (2016). Modeling the status, trends, and impacts of wild bee abundance in the United States. Proc. Natl. Acad. Sci. 113, 140–145. doi: 10.1073/pnas.1517685113
LaBerge W. E. (1973). A revision of the bees of the genus Andrena of the Western hemisphere. Part VI. Subgenus Trachandrena. Trans. Am. Entomological Soc. 99, 235–371. Available at: http://www.jstor.org/stable/25078133
LaBerge W. E. (1980). A revision of the bees of the genus Andrena of the Western hemisphere. Part X. Subgenus Andrena. Trans. Am. Entomological Soc. 106, 395–525. Available at: http://www.jstor.org/stable/25078273
LaBerge W. E. (1986). A revision of the bees of the genus Andrena of the Western hemisphere. Part XII. Subgenera Leucandrena Ptilandrena Scoliandrena Melandrena. Trans. Am. Entomological Soc. 112, 191–248. Available at: http://www.jstor.org/stable/25078392
LaBerge W. E. (1989). A revision of the bees of the genus Andrena of the Western hemisphere. Part XIII. Subgenera Simandrena Taeniandrena. Trans. Am. Entomological Soc. 115, 1–56. Available at: http://www.jstor.org/stable/25078446
Mazerolle M. J. (2023) AICcmodavg: Model selection and multimodal inference based on (Q)AIC(c). R package version 2.3.2. Available online at: https://cran.r-project.org/package=AICcmodavg.
Milam J., Cunningham-Minnick M., Roberts H. P., Buelow C., King D. I. (2022). The contribution of canopy samples to assessments of forestry effects on native bees. Conserv. Sci. Pract. 4, e12690. doi: 10.1111/csp2.12690
Mitchell T. B. (1960). Bees of the eastern United States (Vol. 1) (Raleigh, North Carolina: North Carolina Agricultural Experiment Station).
Mitchell T. B. (1962). Bees of the eastern United States (Vol. 2) (Raleigh, North Carolina: North Carolina Agricultural Experiment Station).
Mollie E. B., Kristensen K., Benthem K. J. V., Magnusson A., Berg C. W., Nielsen A., et al. (2017). glmmTMB balances speed and flexibility among packages for zero-inflated generalized linear mixed modeling. R J. 9, 378–400. doi: 10.32614/RJ-2017-066
Muggeo V. M. R. (2003). Estimating regression models with unknown break-points. Stat Med. 22, 3055–3071. doi: 10.1002/sim.1545
Muggeo V. M. R. (2008). Segmented: an R package to fit regression models with broken-line relationships. R News 8/1, 20–25. Available at: https://cran.r-project.org/doc/Rnews/
Neumüller U., Burger H., Krausch S., Blüthgen N., Ayasse M. (2020). Interactions of local habitat type, landscapes composition and flower availability moderate wild bee communities. Landscapes Ecol. 35, 2209–2224. doi: 10.1007/s10980-020-01096-4
Ollerton J., Winfree R., Tarrant S. (2011). How many flowering plants are pollinated by animals? Oikos 120, 321–326. doi: 10.1111/j.1600-0706.2010.18644.x
R Core Team (2023). R: A language and environment for statistical computing (Vienna, Austria: R Foundation for Statistical Computing). Available at: https://www.R-project.org.
Rahman M. F., Onoada Y., Kitajima K. (2022). Forest canopy height variation in relation to topography and forest types in central Japan with LiDAR. For. Ecol. Manage. 503, 119792. doi: 10.1016/j.foreco.2021.119792
Requier F., Leonhardt S. D. (2020). Beyond flowers: including non-floral resources in bee conservation schemes. J. Insect Conserv. 24, 5–6. doi: 10.1007/s10841-019-00206-1
Rivers J. W., Betts M. G. (2021). Postharvest bee diversity is high but declines rapidly with stand age in regenerating douglas-fir forest. For. Sci. 67, 275–285. doi: 10.1093/forsci/fxab002
Roberts H. P., King D. I., Milam J. (2017). Factors affecting bee communities in forest openings and adjacent mature forest. For. Ecol. Manage. 394, 111–122. doi: 10.1016/j.foreco.2017.03.027
Rodger J. G., Bennett J. M., Razanajatovo M., Knight T. M., Kleunen M. V., Ashman T., et al. (2023). Widespread vulnerability of flowering plant seed production to pollinator declines. Sci. Adv. 7, eabd3524. doi: 10.1126/sciadv.abd3524
Rodríguez A., Kouki J. (2015). Emulating natural disturbance in forest management enhances pollination services for dominant Vaccinium shrubs in boreal pine-dominated forests. For. Ecol. Manage. 350, 1–12. doi: 10.1016/j.foreco.2015.04.029
Saunders M. E. (2018). Insect pollinators collect pollen from wind-pollinated plants: implications for pollination ecology and sustainable agriculture. Insect Conserv. Diversity 11, 13–31. doi: 10.1111/icad.12243
Schneider C. A., Rasband W. S., Eliceiri K. W. (2012). NIH Image to ImageJ: 25 years of image analysis. Nat. Methods 9, 671–675. doi: 10.1038/nmeth.2089
Simon S. J., Keefover-Ring K., Park Y.-L., Wimp G., Grady J., DiFazio S. P. (2021). Characterization of Salix nigra floral insect community and activity of three native Andrena bees. Ecol. Evol. 11, 4688–4700. doi: 10.1002/ece3.7369
Smith C., Weinman L., Gibbs J., Winfree R. (2019). Specialist foragers in forest bee communities are small, social or emerge early. J. Anim. Ecol. 88, 1158–1167. doi: 10.1111/1365-2656.13003
Taki H., Okochi I., Okabe K., Inoue T., Goto H., Matsumara T., et al. (2013). Succession influences wild bees in temperate forest landscape: the value of early successional stages in naturally regenerated and planted forests. PloS One 8, e56678. doi: 10.1371/journal.pone.0056678
Tonietto R. K., Larkin D. J. (2017). Habitat restoration benefits wild bees: A meta-analysis. J. Appl. Ecol. 55, 582–590. doi: 10.1111/1365-2664.13012
Ulyshen M. D., Horn S., Hanula J. L. (2020). Effects of Chinese privet on bees and their vertical distribution in riparian forests. For. Sci. 66, 416–423.
Ulyshen M., Elliott K., Scott J., Horn S., Clinton P., Liu N., et al. (2022). Effects of Rhododendron removal and prescribed fire on bees and plants in the southern Appalachians. Ecol. Evol. 12, e8677. doi: 10.1002/ece3.8677
Ulyshen M. D., Soon V., Hanula J. (2010). On the vertical distribution of bees in a temperate deciduous forest. Insect Conserv. Diversity 3, 222–228. doi: 10.1111/j.1752-4598.2010.00092.x
Ulyshen M., Urban-Mead K. R., Dorey J. B., Rivers J. W. (2023). Forests are critically important to global pollinator diversity and enhance pollination in adjacent crops. Biol. Rev. 98, 1118–1141. doi: 10.1111/brv.12947
Urban-Mead K. R., Dyke M. V., Muñiz P., Young A. D., Danforth B. N., McArt S. H. (2023). Early spring orchard pollinators spill over from resource-rich adjacent forest patches. J. Appl. Ecol. 60, 553–564. doi: 10.1111/1365-2664.14350
Urban-Mead K. R., Muñiz P., Gillung J., Espinoza A., Fordyce R., van Dyke M., et al. (2021). Bees in the trees: Diverse spring fauna in temperate forest edge canopies. For. Ecol. Manage. 482, 118903. doi: 10.1016/j.foreco.2020.118903
Wagner D. L., Metzler K. J., Frye H. (2019). Importance of transmission line corridors for conservation of native bees and other wildlife. Biol. Conserv. 235, 147–156. doi: 10.1016/j.biocon.2019.03.042
Wickham H. (2016). ggplot2: Elegant graphics for data analysis (New York: Springer-Verlag). doi: 10.1007/978-3-319-24277-4
Williams N. M., Cone E. E., Roulston T. H., Minckley R. I., Packer L., Potts S. G. (2010). Ecological and life-history traits predict bee species responses to environmental disturbances. Biol. Conserv. 143, 2280–2291. doi: 10.1016/j.biocon.2010.03.024
Winfree R., Williams N. M., Dushoff J., Kremen C. (2007). Native bees provide insurance against ongoing honey bee losses. Ecol. Lett. 10, 1105–1113. doi: 10.1111/j.1461-0248.2007.01110.x
Winfree R., Williams N. M., Gaines H., Ascher J. S., Kermen C. (2008). Wild bee pollinators provide the majority of crop visitation across land-use gradients in New Jersey and Pennsylvania, USA. J. Appl. Ecol. 45, 793–802. doi: 10.1111/j.1365-2664.2007.01418.x
Keywords: sampling strategy, native bee, vertical gradient, nonlinear analysis, forest strata, closed-canopy forest
Citation: Cunningham-Minnick MJ, Roberts HP, Milam J and King DI (2024) Sampling the understory, midstory, and canopy is necessary to fully characterize native bee communities of temperate forests and their dynamic environmental relationships. Front. Ecol. Evol. 12:1352266. doi: 10.3389/fevo.2024.1352266
Received: 07 December 2023; Accepted: 25 March 2024;
Published: 05 April 2024.
Edited by:
Kris Braman, University of Georgia, United StatesReviewed by:
Joshua Campbell, United States Department of Agriculture (USDA), United StatesElizabeth McCarty, University of Georgia, United States
Copyright © 2024 Cunningham-Minnick, Roberts, Milam and King. This is an open-access article distributed under the terms of the Creative Commons Attribution License (CC BY). The use, distribution or reproduction in other forums is permitted, provided the original author(s) and the copyright owner(s) are credited and that the original publication in this journal is cited, in accordance with accepted academic practice. No use, distribution or reproduction is permitted which does not comply with these terms.
*Correspondence: Michael J. Cunningham-Minnick, mcunninghamm@umass.edu