Seasonal and long-term climate drivers of tree species phenology and litterfall in a Nothofagus cool temperate rainforest of Australia
 Nara O. Vogado
 Michael J. Liddell
 Ross J. Peacock
- 1Centre for Tropical Environmental and Sustainability Science, College of Science and Engineering, James Cook University, Cairns, QLD, Australia
- 2New South Wales National Parks and Wildlife Service, Sydney, NSW, Australia
- 3Department of Natural Sciences, Macquarie University, Sydney, NSW, Australia
The cool temperate rainforests of eastern Australia are at risk from anthropogenic climate change with predicted changes in temperature, rainfall, severe weather, basal cloud layer, and droughts. Phenology and litter production are fundamental reproductive and growth processes to document in any ecosystem, yet very few long-term studies exist in Australian rainforests. In this study, long-term datasets are used to describe different phenological and litter production behaviours of tree species in a Nothofagus cool temperate rainforest in New South Wales (NSW), Australia, analysing seasonal and inter-annual climate drivers. Leaf fall at the community level was mostly influenced by Nothofagus moorei, driven by temperature and wind speed, and Ceratopetalum apetalum, driven by temperature, rainfall, and solar radiation. Mean dates of leaf fall at the community level were found to be advancing, correlated with an advance in solar radiation. We also analysed in detail the flowering behaviour of the dominant canopy tree species, N. moorei, which masts with a mean inter-flowering period of 3–4 years in 65% of flowering events. Three of the studied species presented mast flowering, C. apetalum, N. moorei, and Orites excelsus; however, they did not mast in the same years. All species presented strong seasonality in their phenological activity, but seasonality peaked in different months, and were driven by varied climate variables. Supra-annual peaks of flowering and fruiting did not occur at the same time for all species, and climate drivers of inter-annual phenological behaviour were different for each species. Our results show that projected changes in climate will affect species from cool temperate rainforests differently, affecting not only biomass production, but also species reproductive output and forest dynamics.
Introduction
Plant communities are expected to suffer from changes in their range, composition, and abundance due to climate change. Predicting and understanding these expected changes are essential to the management of ecosystem functions (Matsui et al., 2018). Cool temperate rainforests are known to stock the highest amount of aboveground living biomass carbon among all forest types (Keith et al., 2009). A key aspect of biomass accumulation in forests and, therefore, carbon cycle is the amount of litterfall that can add about one-third of annual carbon uptake to the soil (Grace, 2004; Zhao and Running, 2010; Malhi et al., 2011). Carbon stock in forest floor and soil can vary greatly due to the interaction of C input by litterfall and C output due to decomposition in soils (Neumann et al., 2018). Changes to litterfall patterns in these forests may affect not only the carbon cycling, but also reproduction due to changes in seed production and seedling survival. Species response to climate, therefore, will enable us to understand how forests are being affected in ecological processes and structure and how they may change in the future.
Phenology of cool temperate rainforests of the Southern Hemisphere has been found to be affected by temperature (Smith-Ramirez and Armesto, 1994; Schauber et al., 2002; Richardson et al., 2005; Kelly et al., 2013), El Niño-Southern Oscillation (ENSO) (Schauber et al., 2002), and rainfall (Smith-Ramirez and Armesto, 1994). Although phenology in some temperate rainforests has been found to be driven by climate variables, long-term reproductive data in Australian rainforests is scant (Wright et al., 2022) and no long-term study has been conducted and published in cool temperate rainforests of Australia. Consequently, understanding the phenological long-term patterns and their climate drivers is of high importance, as cool temperate rainforests of Australia are expected to be affected by the changes in temperature, rainfall, storm activity, and basal cloud cover (Worth et al., 2015). Additionally, the fire-sensitive cool temperate forests of eastern Australia, which typically occupy fire-protected refuges, are becoming more frequently subject to unplanned fire (Worth et al., 2015; Baker et al., 2022; Peacock and Baker, 2022). Changes to the phenology may lead to shifts in species reproduction success, as well as decrease in resources for frugivorous and folivorous animals. In New Zealand, it is in years when native beech (Nothofagus spp.) reproduces mast fruiting that the parrot kaka, Nestor meridionalis, attempts to reproduce. They commence to nest before and when the trees are flowering, 6 months before seed fall (Wilson et al., 1998). Beginning nesting prior to and during the trees’ flowering, approximately 6 months before seed release, they rely on the developing green seeds of Nothofagus for nourishment when the nestling peak happens (Wilson et al., 1998; White, 2011). In the northern New South Wales forests, the Crimson Rosella is known to predate on the flowers and fruits of Nothofagus species (Handbook of Australian, New Zealand & Antarctic birds (HANZAB), 1990).
Species from cool temperate rainforests have been found to present masting behaviour (Wright et al., 2022). Mast seeding, which refers to the irregular, occasional, and synchronised production of flowers and seeds within a population, emerges from a complex interplay of multiple functional limitations and evolutionary pressures (Kelly, 1994; Kelly and Sork, 2002; Rees et al., 2002). Masting activity in New Zealand tree species has been found to be potentially driven by warm dry summers from the previous year (Wardle, 1984; Allen and Platt, 1990; Schauber et al., 2002). Masting activity in Nothofagus species from the Southern Hemisphere has been mostly studied in South America and New Zealand, with only the closely related species Nothofagus cunninghamii studied in Australia to date (Howard, 1973; Hickey et al., 1982; Hickey and Wilkinson, 1999). Out of the 21 studies found on Nothofagus species phenology, one has tested for climate drivers in New Zealand (Schauber et al., 2002) and four in South America (Smith-Ramirez and Armesto, 1994; Richardson et al., 2005; Kelly et al., 2013 and Torres et al., 2015). Two metanalyses testing climate drivers of masting on species from temperate rainforests, including multiple species of Nothofagus, have found that mast flowering or seeding was highly influenced by temperature, including La Niña effects on summer temperature (Schauber et al., 2002; Kelly et al., 2013). In Australia, however, there is a great knowledge gap in how cool temperate forests behave phenologically, and what climate drivers influence these processes.
The fact that temperature has been previously found to be a major trigger of phenological activities in temperate rainforests raises concern, as these forests are expected to continue warming and becoming drier in the future (IPCC, 2021; Worth et al., 2015). Nothofagus species was found to be sensitive to even slight shifts in its climate conditions, especially at the edges of its habitat (Worth et al., 2015). Therefore, the future response of Nothofagus species to climate change will be determined by their ability to adapt to the hotter and drier conditions, along with the heightened risk of exposure to fires (Baker et al., 2022). Species from these forests, within the climate change context, may be vulnerable to extinction processes in the future (Worth et al., 2015).
Here, we present 20 years (1962–1967, 2009–2022) of litterfall data from a cool temperate Nothofagus rainforest in NSW, Australia. We used monthly collections of leaf, flowers, and fruits/seeds testing for seasonal and inter-annual climate drivers of total litterfall, leaf fall, and reproductive activity for 16 years (2009–2022). Understanding drivers and constraints on phenological activity is of high importance to better understand and predict forest responses to climate change. In addition, we also analysed 64 years of Nothofagus moorei flowering, showing mast flowering activity and developing an understanding of the drivers of inter-annual flowering phenology. This is the first time the long-term phenology of N. moorei is described in Australia.
Methods
Litterfall trapping was conducted from November 1961 to December 1967 in a 3.2-ha study area within a large homogeneous stand of Nothofagus cool temperate rainforest in Mount Boss State Forest (now Willi Willi National Park) at latitude −31.15597, longitude 152.3702 1,120 m GDA2020 Geographic. The single trap in this early study consisted of a 0.836-m2 section of canvas held approximately 0.91 m above the forest floor in a steel rod frame with a central collecting device funnelling the material into a gauze-bottomed metal container. The trap design was based on Cunningham (1957). Litterfall samples were collected approximately monthly and the vegetative components bulked (leaves, twigs up to 25 mm in diameter, and other fragments) and oven dried at 70°C for 48 h and weighed. Litterfall reproductive material was sorted into the following components: N. moorei was sorted into bracts, male and female flowers, buds, capsules, and two- and three-winged seed, and for Ceratopetalum apetalum, whole flowers. Trace amounts of reproductive material of other tree species were detected and are not reported here. Both vegetative and reproductive components of the litterfall are expressed as dry weight (grams) per m2 per month. Monthly accession rates were calculated assuming 30.42 days per month to account for variation in sample collection dates.
Litterfall trapping was conducted from March 2009 to 2023 using a network of 12 traps distributed randomly within the same 3.2-ha study area. The number of litterfall traps deployed in the rainforest stand (n = 12) was based on convention (e.g., Starr et al., 2005; Saarsalmi et al., 2007; Turner and Lambert 2002) rather than strict sampling design criteria such as the coefficient of variation of mean monthly litter dry weights. Each trap consisted of a single sprung collapsible plastic gardening bag with a diameter of 450 mm and a depth of 600 mm. Commercially available gardening bags were utilised because they provided a cost-effective option compared to a specially manufactured apparatus.
Litterfall samples were collected approximately monthly, oven dried at 70°C for 48 h and weighed. Monthly collection of litter fall traps was adopted to maintain consistency with the 1960’s collections. Litterfall material was sorted by litter trap into leaves, fronds, buds, scales, and bracts (all by species), reproductive parts (flowers, flower parts, fruits, seeds, and panicles by species), twigs (up to 25 mm diameter), bark and wood, epiphytic bryophytes (by species), and lichens. Undifferentiated miscellaneous material, which was typically insect frass and unidentifiable leaf fragments, was additionally sorted and weighed. Total biomass is the monthly sum of all of these litter components.
The study area
The vegetation of the study area is cool temperate rainforest, classified as N. moorei–C. apetalum sub-alliance (Floyd, 1990), located in the altitudinal range 900–1,240 m. The Gondwana Rainforests of Australia, a World Heritage serial property reserve system, protects the most extensive areas of subtropical rainforest in the world, large areas of warm temperate rainforest, and nearly all of the Antarctic beech N. moorei (F. Muell.) Krasser in existence (Peacock and Baker, 2022). The reserve consists of ancient vegetation and plant lineages that play a significant role in describing the evolutionary history of these rainforests and for biodiversity conservation. The climate of the study area is cool temperate, with a mean annual rainfall of 2,200 mm and a mean annual temperature of 14.2°C. Relative humidity usually exceeds 90% with afternoon mists common all year. The hottest months are December and January and the coolest months are July and August (Figure 1A). Rainfall decreases to below 100 mm in July, August, and September (Figure 1B). October to December are the months with the highest incidence of solar radiation, while lowest values occur between April and August (Figure 1C). The area presents four seasons, with spring from September to November, summer from December to February, autumn from March to May, and winter from June to August (BOM).
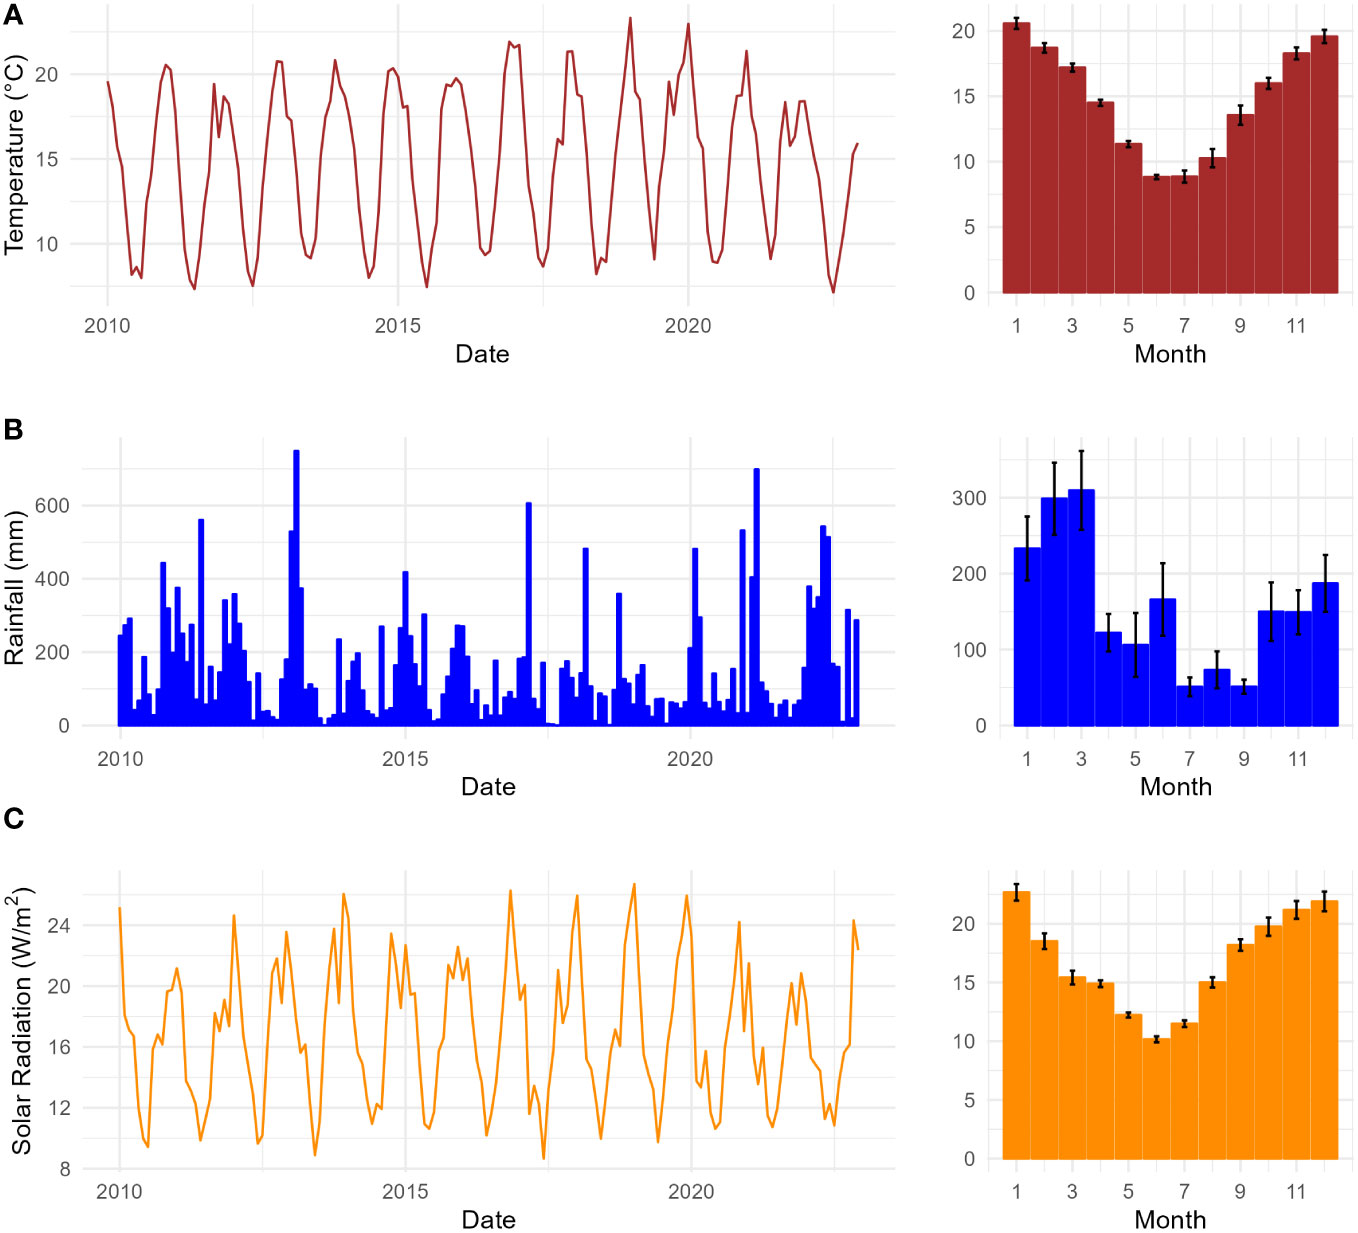
Figure 1 Climate variables of the study area in the Nothofagus forest, NSW: (A) Monthly mean temperature (°C) from 2010 to 2022 on the right, and seasonal monthly mean temperature, SE (n = 13), on the left; (B) monthly total rainfall (mm) from 2010 to 2022 on the right and seasonal monthly mean rainfall (mm), SE (n = 13), on the left; (C) monthly mean solar radiation (W/m2) from 2010 to 2022 on the right, and seasonal monthly mean solar radiation, SE (n = 13), on the left.
Nothofagus moorei is a key canopy species of these forests, forming an open canopy 25–40 m tall over a dense 15- to 25-m sub-canopy of C. apetalum, Orites exselsus, and Doryphora sassafras. The stand basal areas (70–130 m2 ha−1, mean 83 m2 ha−1; Table 1 and Figure 2) are some of the highest recorded in any NSW forest type and are substantially higher than those found in other rainforest types (Baur, 1989). More than half of the stand basal area is made up of Nothofagus trees, although they represent only 17% of the total number of stems. Stand structures are un-even aged or multi-aged, typical of the structures observed in the N. cunninghamii forests of north-western Tasmania (Hickey and Felton, 1987) and the Central Highlands of Victoria (Simkin and Baker, 2008). Stand structures suggest that regeneration is both continuous and episodic. Further information on rainforest structure and condition is provided in Peacock and Baker (2022).
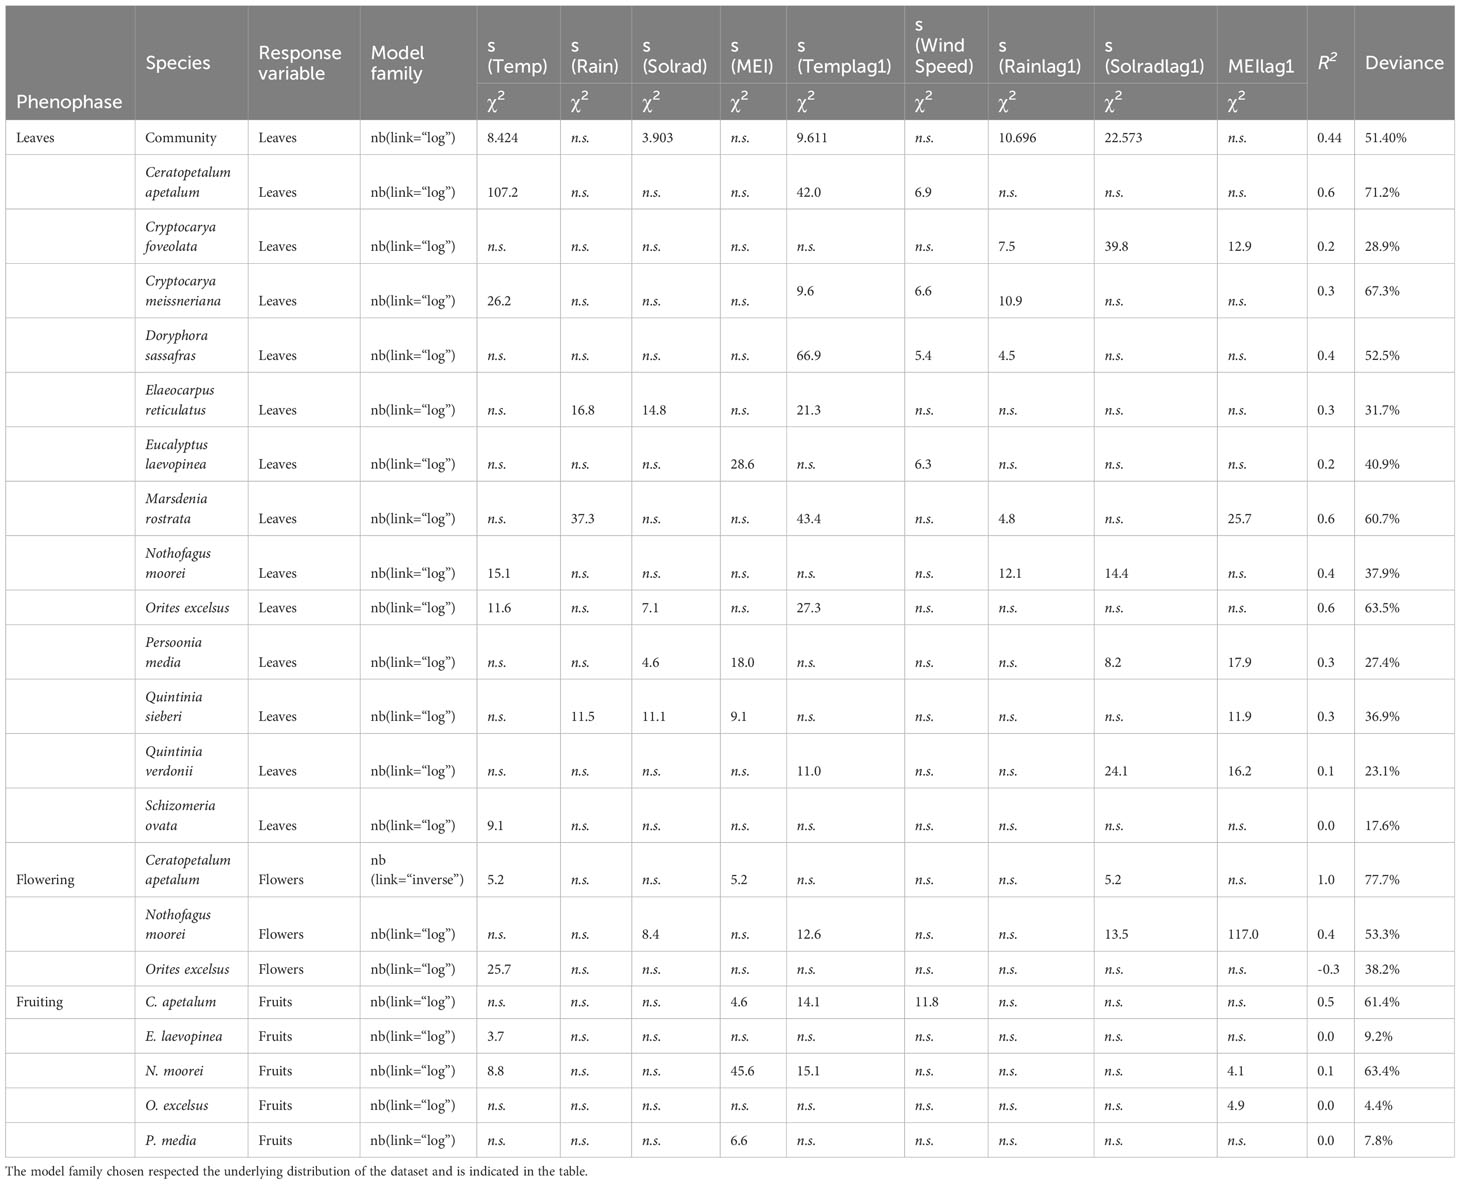
Table 1 Results of generalised additive model (GAM) analysis of the influence of climate variables on intra-annual leaf fall, flower, and fruit fall in the species found in the Nothofagus forest, NSW.
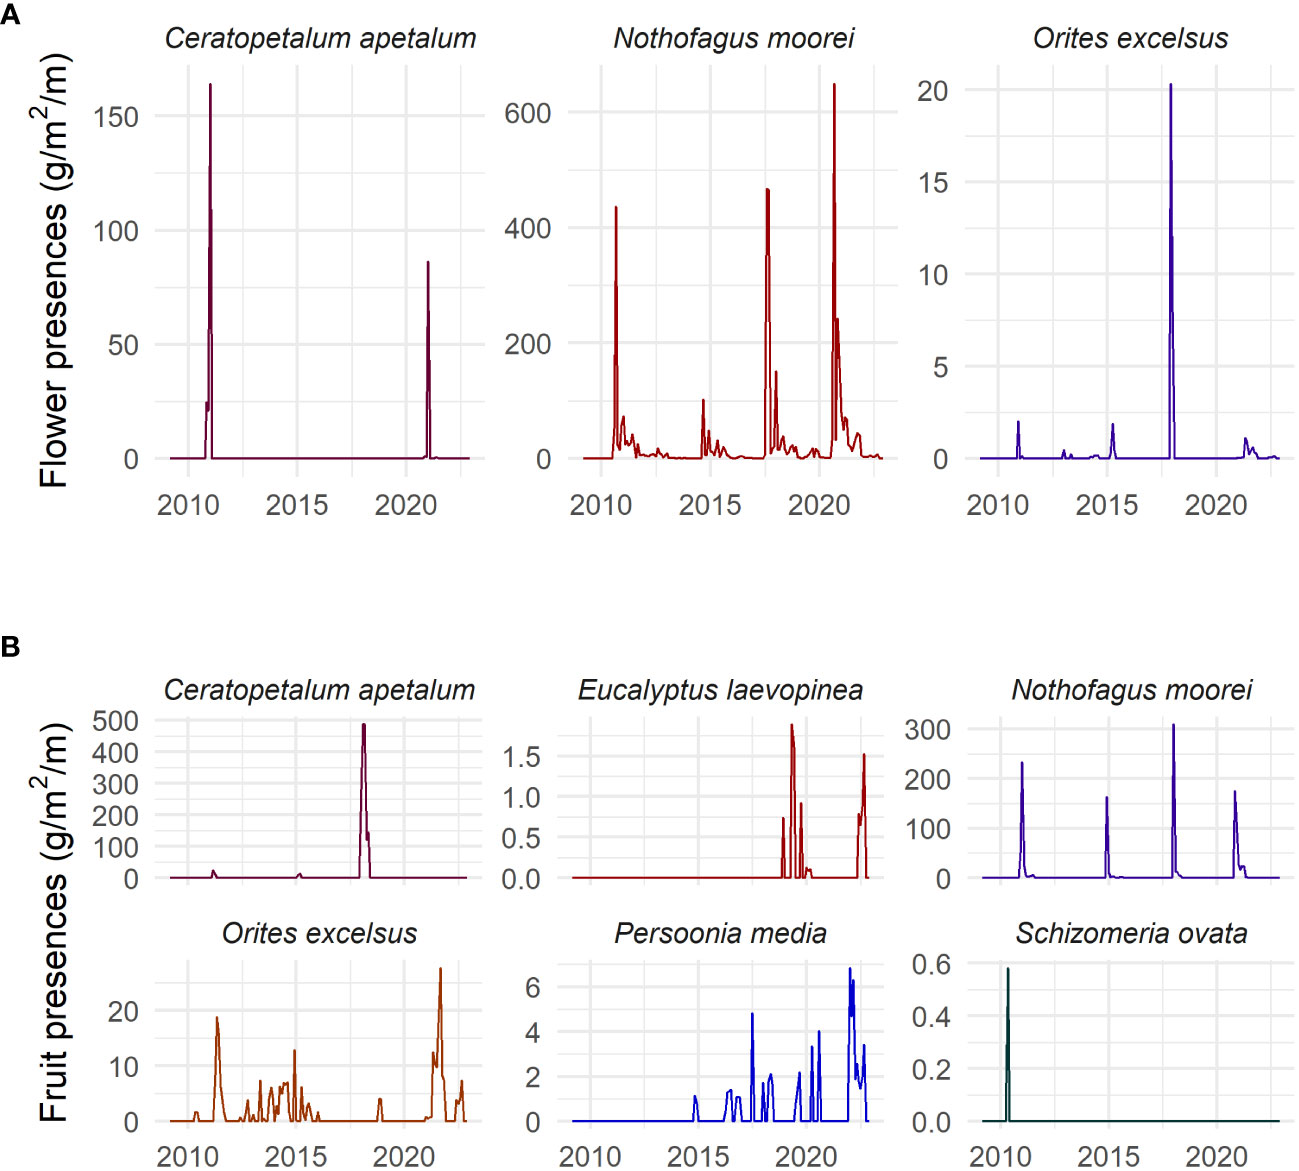
Figure 2 Time series of (A) flower presence (g/m2), and (B) fruit presence (g/m2) of each studied species in the Nothofagus forest, NSW.
The study area’s soils are derived from acid volcanic and sedimentary parent material and are infertile, highly acidic, and high in soil exchangeable aluminium. The litter layer both conserves essential plant growth nutrients and accumulates high levels of aluminium, typical of rainforests with aluminium accumulator species such as C. apetalum, Orites excelsus, Shizomeria ovata, and Quintinia species (Webb, 1959; Webb et al., 1959).
Studied species
We conducted statistical analyses in all species that have been found in at least 10 traps throughout the period 2009–2022. They are C. apetalum, Cryptocarya foveolata C.T. White & W.D. Francis, Cryptocarya meissneriana Frodin, D. sassafras Endl., Elaeocarpus reticulatus Sm., Eucalyptus laevopinea R.T. Baker, Marsdenia rostrata R.Br., N. moorei (F. Muell.) Krasser, O. excelsus R.Br., Persoonia media R.Br., Quintinia sieberi A.DC., Quintinia verdonii F. Muell., and Schizomeria ovata D. Don. C. apetalum, N. moorei, O. excelsus, and E. laevopinea have dry fruits dispersed by wind. P. media and S. ovata are the only fleshy fruit species, dispersed by vertebrates (Atlas of Living Australia website at http://www.ala.org.au. Accessed 5 December 2023). N. moorei is assumed to be wind pollinated. Seed dispersal distances in the closely related species N. cunninghamii are limited (Hickey and Felton, 1987).
Climate data
Site climate data were obtained through a combination of nearby Bureau of Meteorology (BOM) observations and modelled data. Rainfall data were sourced from the BOM (www.bom.gov.au) decommissioned station 060068 Yarras (Camerons Forestry Camp), latitude −310 11’ 52.23”, longitude 1520 24’ 1.34”, altitude 862 m for the period 1959 to 1981. Station 060068 is no longer in commission; however, at 5.4 km from the study area, it is the closest source of meteorological data. Daily 9 a.m. and 3 p.m. observations of air temperature and relative humidity were sourced from archival records held by Forestry Corporation of New South Wales Sydney for the same meteorological station. In 2009, new instrumentation was established at the site of the decommissioned station 060068 which logs rainfall, temperature, relative humidity, and solar radiation at an interval of 30 min.
Rainfall, mean temperature, and mean solar radiation from 1990 to 2022 were obtained from BOM station 60068 in northern NSW, Australia. The mean temperature was the average of the minimum and maximum for each day, averaged monthly, while the solar exposure is the total solar energy (W/m2), measured from midnight to midnight. High values of solar radiation indicate clear sun conditions, while low values indicate cloudy or shorter days (BOM). Rainfall was the total sum of rainfall for each day and month.
Statistical analyses
Species with not enough data, i.e., Schizomeria ovata’s fruiting, were excluded from the analyses. All other species were analysed with the following analytical procedures. Visualisation of seasonality for presence of leaves, flowers, and fruits was conducted using circular plots with mass of leaves, flowers, and fruits in the r-axis and month in the θ-axis of the polar coordinate system.
To understand climate drivers of seasonal phenological activity of leaf fall, flowering, and fruiting, we conducted generalised additive models as they can accommodate non-linear and non-monotonic relationships between variables (Wood, 2017). Models were developed using negative binomial as the family; this family was chosen based on the underlying data distribution. Model selection was done following significance of variables plus selection using “dredge” using AIC (Akaike Information Criterion), a function of the package “MuMin” (Bartoń, 2023). Residuals were assessed using the DHARMa package, which is a package to assess Residual Diagnostics for Hierarchical (Multi-Level/Mixed) Regression Models (Hartig, 2022).
To understand inter-annual phenological patterns, we assessed both the general patterns through time (multi-year) and the relationship between phenological patterns and annual climate variables (rainfall, temperature, and solar radiation). To identify changes through time, we fitted polynomial linear regressions with mean phenological activity as the response variable and the year as the predictor. Similarly, to assess the relationship between phenology and inter-annual changes in climate, we built univariate linear regressions using the annual sum of presence of each phenological activity as the response variable and the average value for each climate variable for current year, previous year, and 2 years prior as predictors. Specifically, the following climate variables were used: rainfall; rainfall from the previous year; rainfall from 2 years before; solar radiation; solar radiation from the previous year; solar radiation from 2 years before; mean temperature for the current year, the past year, and 2 years before; temperature of summer from the current year, the year before, and 2 years before; and the difference in summer temperature from 2 years before and the previous year (t−2 minus t−1). We added the difference in summer temperature from t−2 minus t−1 as per the model presented by Kelly et al. (2013), which found that this temperature difference was the main driver of mast seedings in the studied temperate forest. Model residuals were assessed using the DHARMa package (Hartig, 2022).
In addition, we extracted the seasonal component of all measured time series and conducted cross-correlation analyses. These analyses of the de-seasonalised data allow us to understand inter-annual behaviour monthly, and we developed appropriate lags with climate variables where relationships were found. Positive lags indicate that phenological activity preceded change in climate variable, while negative lags indicate that change in climate variable occurred before change in phenology. For subsequent analyses, the most significant lag was chosen, and R-values are presented. To examine the effect of the ENSO cycle, we also carried out cross-correlation analyses against the Multivariate El Niño/Southern Oscillation index (MEI), which is already an aseasonal time series, obtained at the NOAA ESRL website (http://www.esrl.noaa.gov/psd/enso/mei/). MEI scales vary from high positive values for El Niño events, and low negative values for La Niña events.
To test for inter-annual climate drivers of total biomass, we conducted multiple linear regressions with yearly total biomass as the response variable, and yearly rainfall, rainfall (lag 1), mean temperature, mean temperature (lag 1), solar radiation, and solar radiation (lag 1) as the explanatory variables. Statistical analyses were conducted in R (R Core Team, 2022).
Finally, to understand seasonal changes in leaf fall across the years, we used circular statistics with mass of leaf fall (as an integer) against month (transformed into angles). We then calculated the mean angle, circular standard deviation (SD), and vector length (r), which indicates the degree of seasonality, varying from 0 (aseasonal) to 1 (seasonal). To determine if leaf fall mass was significantly seasonal, we used Rayleigh tests (Zar, 1999). We used the same approach to calculate circular statistics for temperature, rainfall, and solar radiation. We used linear regression to test for yearly mean date against year, to assess if the mean date of leaf fall was changing with time. In addition, to understand if there was a correlation between changes in mean date for leaf fall and changes in mean date for climate variables, we also conducted circular statistics for temperature, rainfall, and solar radiation. We then developed linear models with the mean date for each year of leaf fall against the mean date for each year of temperature, rainfall, and solar radiation. For circular statistics, we used ORIANA 4.0 (Kovach Computing Services).
Flowering and masting of Nothofagus moorei
Flowering event years were identified for N. moorei using several sources of data. Herbarium species were the primary source of identifying flowering years, and we set a minimum date of 1950, which coincided with the period in which the forest road network was established to support access across the species range. Herbarium specimens at the National Herbarium of NSW were examined using their scanned specimen holdings and collection dates recorded for those in flower or fruit. Additional herbarium specimen holdings at the Australasian Virtual Herbarium were examined and specimens recorded as fertile were noted. Fertile specimens with retained capsules were allocated to the year of flowering for the previous year on the understanding that flowering occurs between August and October. Cultivated specimens or specimens in living collections were excluded. In addition, from 1955 to 1959, we used phenological monitoring of individually tagged trees at Mt Boss, NSW. Additional sources of data included author observations and photographic evidence of flowering provided to the authors by citizen scientists across New South Wales. Years with specimens that were vegetative only were allocated to non-flowering years and a small number of years without any herbarium holdings or other sourced or data were not attributed as either flowering or non-flowering years. Masting dates were cross-checked using these independent sources of data and flowering was found to be synchronous across the species range in northern New South Wales and southern Queensland.
We used the long-term time series (1950–2023) to analyse the climate drivers of inter-annual flowering activity in the species. To do so, we conducted a logistic regression with 0 (no flowering) and 1 (flowering) as the response variable, and annual total rainfall, mean temperature, mean solar radiation, and MEI as the explanatory variables. We also added spring and summer temperatures for the year before and 2 years before as explanatory variables, as these variables might be responsible for mast activity in Nothofagus species (Schauber et al., 2002; Richardson et al., 2005; Kelly et al., 2013).
Results
Seasonality and seasonal climate drivers
Community leaf fall occurred throughout the year, being mainly influenced by N. moorei and C. apetalum (Figure 3). The overall peak of both total biomass and leaf fall occurred in spring, between September and November (Figures 3A, B). Overall peaks for the whole community occurred in September 2019, October 2013, and December 2019 (Figures 3B, C). At the community level, seasonal leaf fall was mainly influenced by temperature, rainfall, and solar radiation from the previous month, and temperature and solar radiation from the current month (R2 = 0.44, Deviance explained = 51.4%, Table 1), while inter-annual leaf fall was mainly influenced by temperature, solar radiation from 9 months before, and a decrease in rainfall 5 months before (Table 2).
Figure 3 Time series of (A) total biomass, (B) total leaf fall (g/m2/month), and (C) species leaf fall (g/m2/month) of each studied species in the Nothofagus forest, NSW.
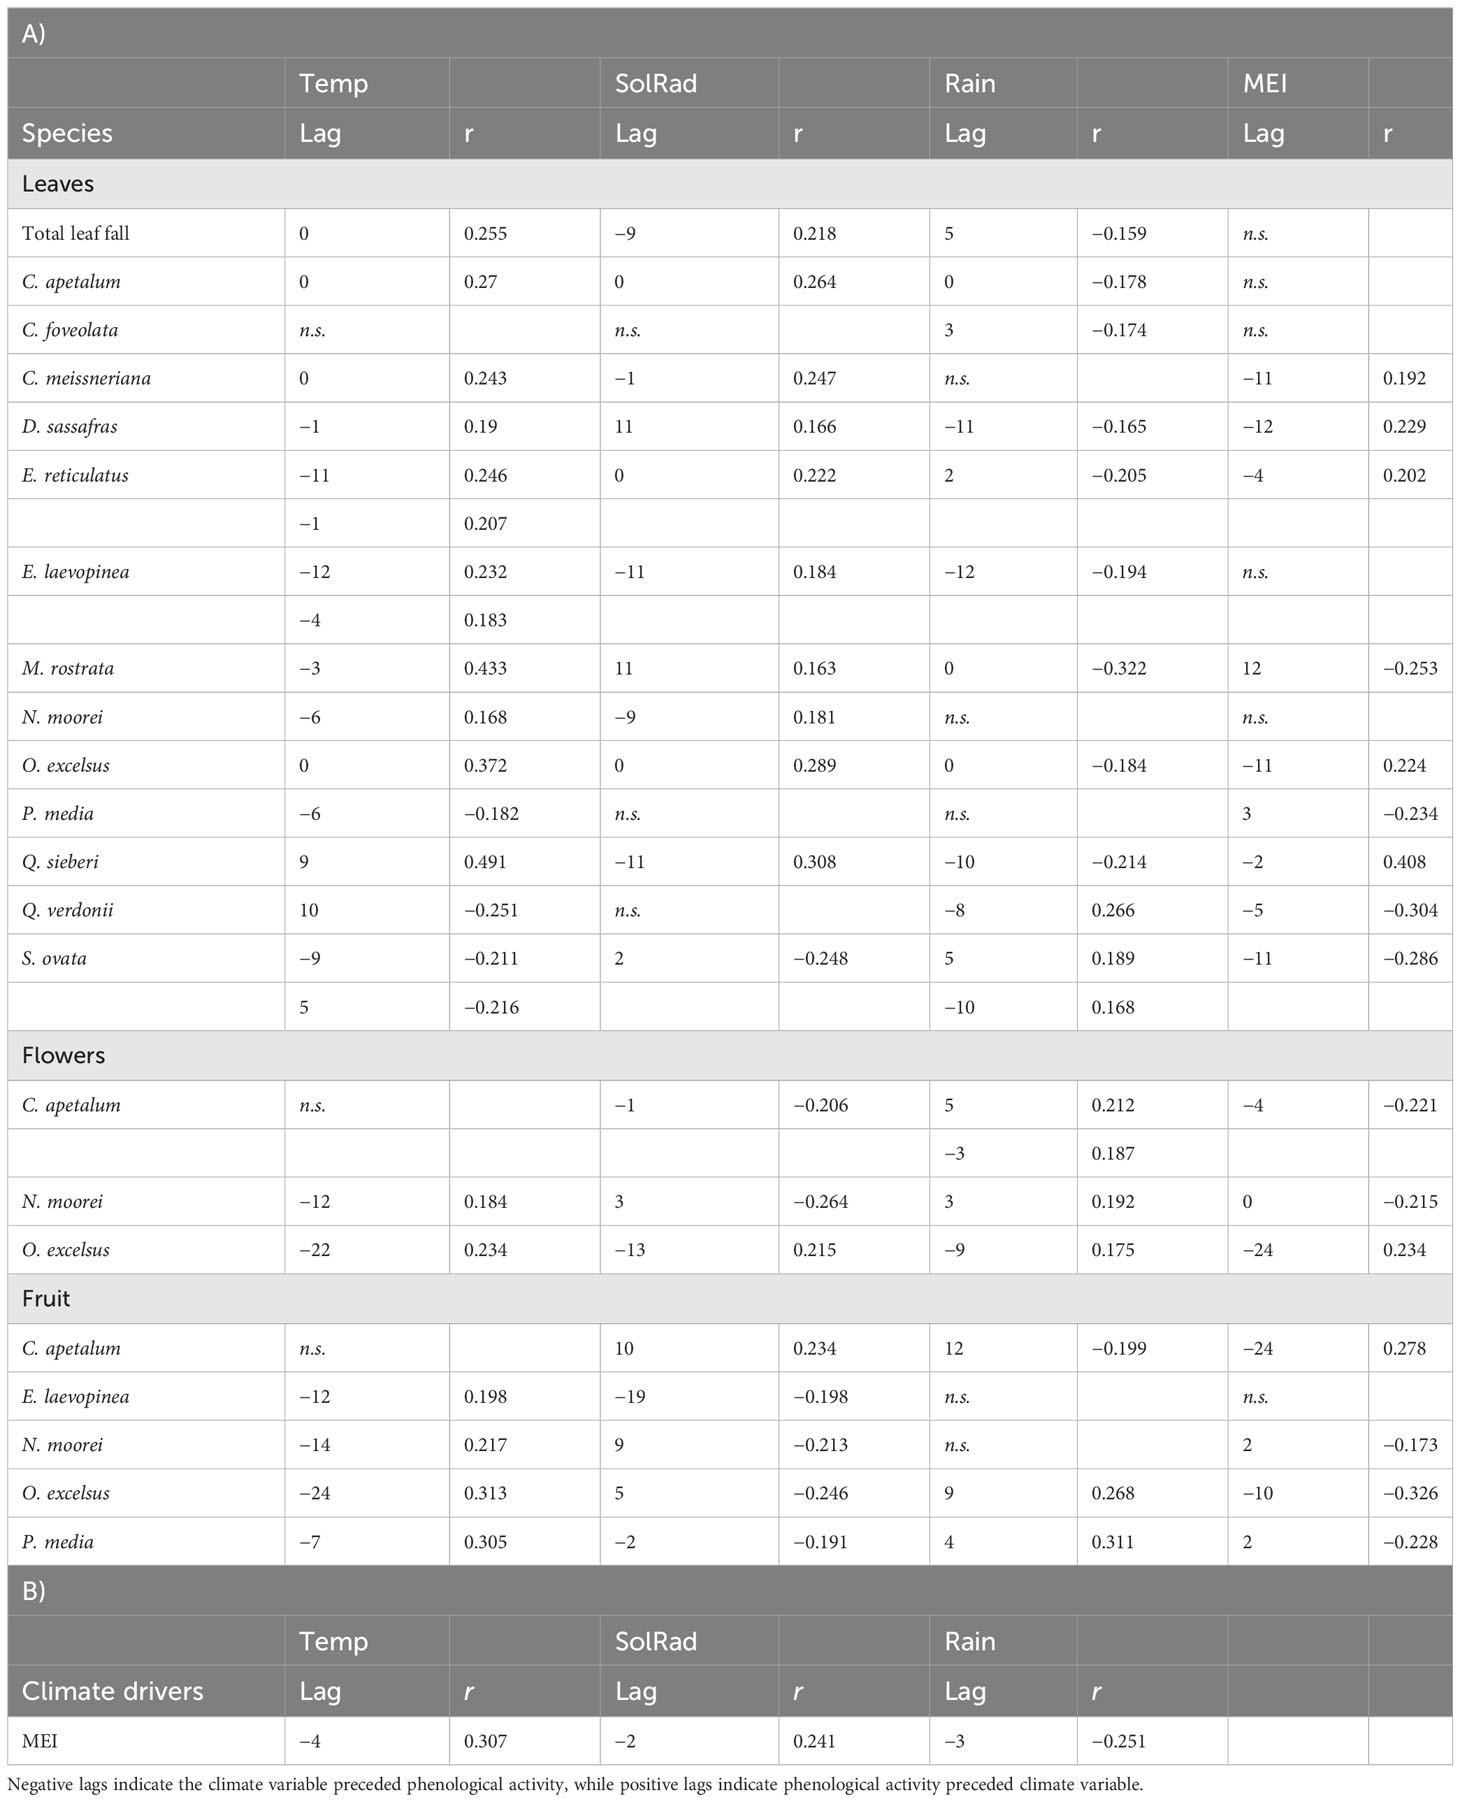
Table 2 Inter-annual climate drivers of phenology as determined by cross-correlation for the Nothofagus forest, NSW.
Leaf fall was seasonal in all species, with 11 species peaking in November (Figure 4; Supplementary Figure S1). The exceptions were N. moorei and S. ovata, which peaked in September, and C. meissneriana that peaked in January (Figure 4; Supplementary Figure S1). Leaf biomass was mostly composed of C. apetalum and N. moorei leaves. Peak of flowering activity occurred in January (summer), September (spring), and December (summer) for C. apetalum, N. moorei, and O. excelsius, respectively (Figure 4). Peak of fruiting activity occurred in February and March for C. apetalum, January for N. moorei, and May for O. excelsus, which presented another peak in September (Figure 4). Peak of fruiting occurred in June for E. laevopinea, January and July for P. media, and May for S. ovata (Supplementary Figure S1).
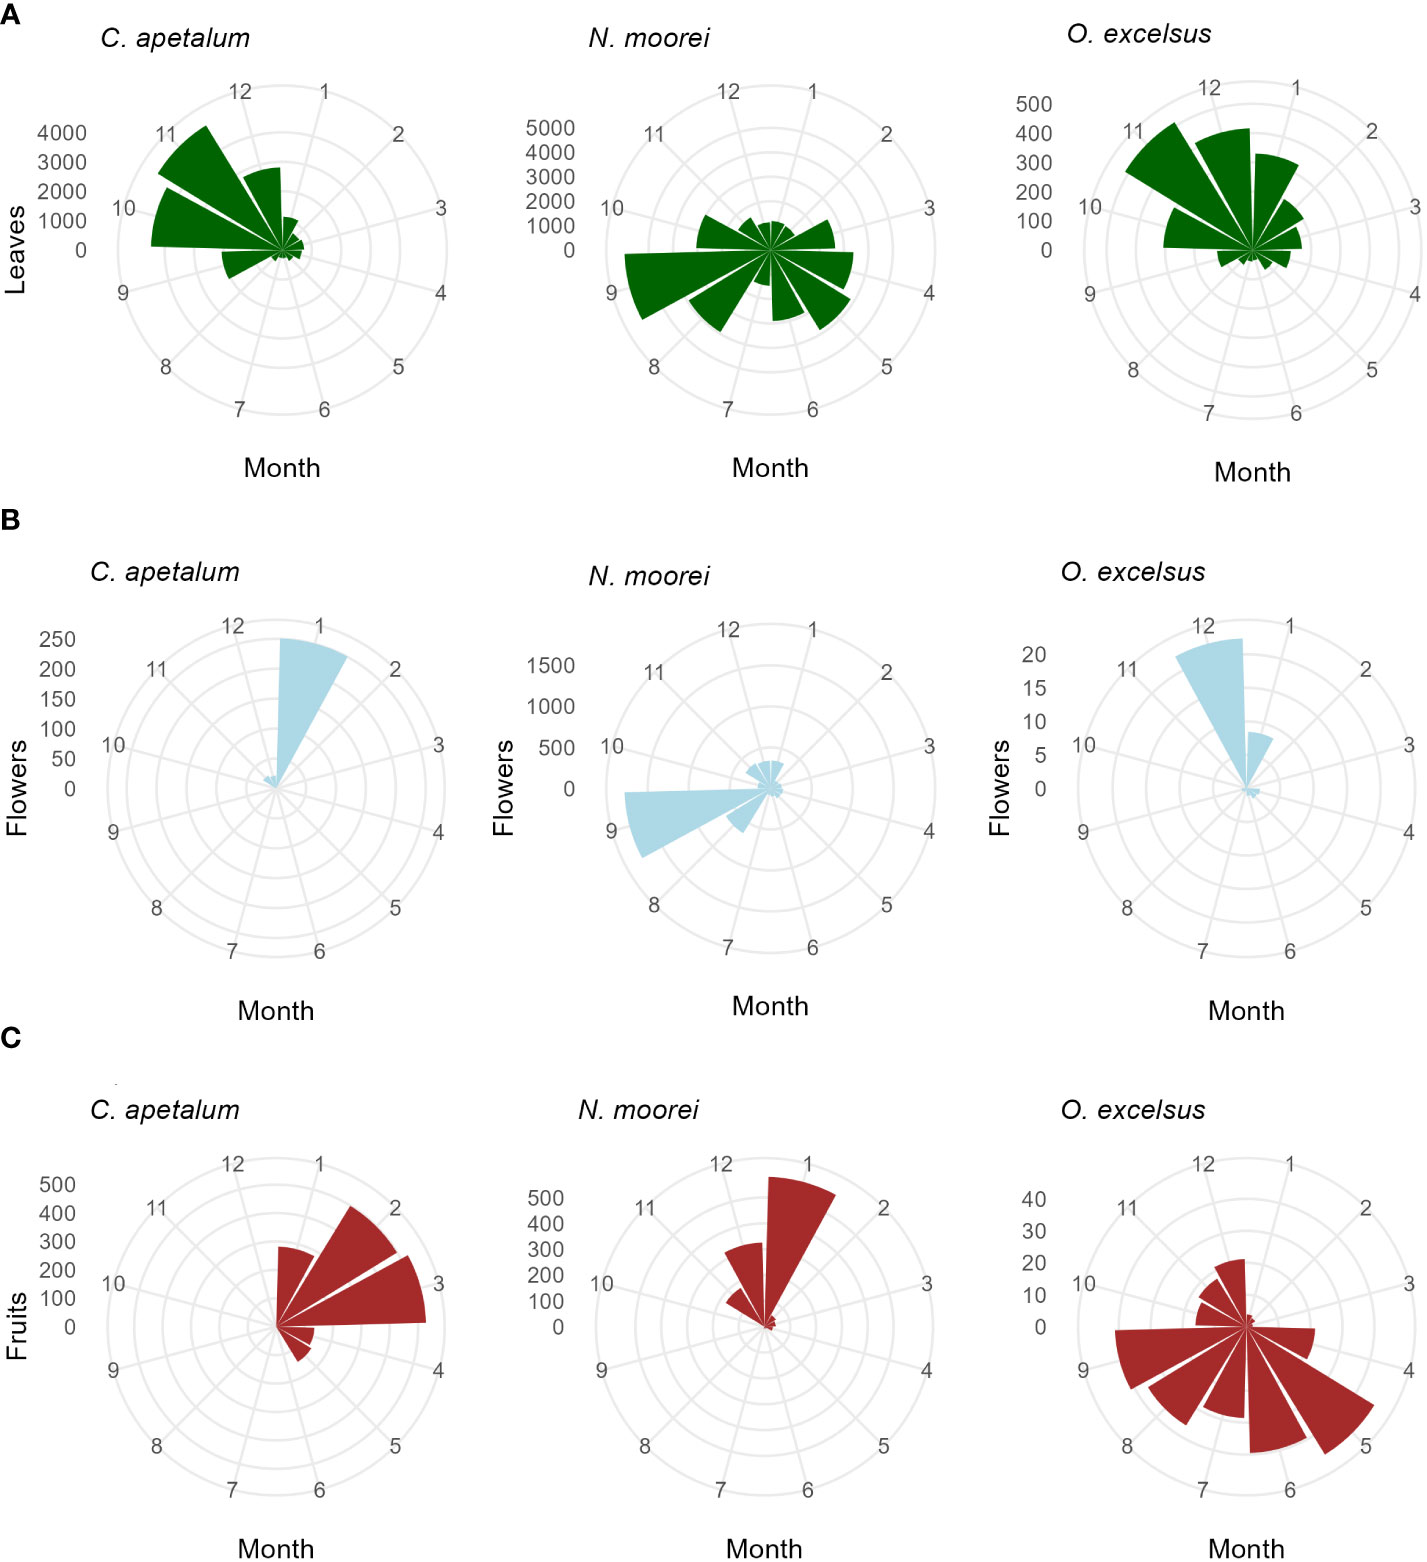
Figure 4 Circular plots of seasonal activity (g/m2/month) of the major species in the Nothofagus forest, NSW. (A) Leaf fall, (B) flower fall, and (C) fruit fall based on litterfall data collected from 2010 to 2022.
Flowering of C. apetalum and O. excelsus peaked in the beginning of summer. Peak of fruiting occurred in summer and beginning of autumn for C. apetalum, in summer for N. moorei, but in winter for O. excelsus (Figure 4). Temperature was a significant term in seasonal models of leaf fall of nine species: C. apetalum, C. meissneriana, D. sassafras, E. reticulatus, M. rostrata, N. moorei, O. excelsus, S. ovata, and Q. verdonii (Table 1). Rainfall was a significant influence on leaf fall of C. foveolata, C. meissneriana, D. sassafras, E. reticulatus, M. rostrata, N. moorei, and Q. sieberi. Solar radiation was significant on models for leaf fall of C. foveolata, E. reticulatus, N. moorei, O. excelsus, P. media, Q. sieberi, and Q. verdonii (Table 1). MEI significantly influenced leaf fall in M. rostrata, Q. sieberi, and Q. verdonii (Table 1). MEI was a significant term on leaf fall models of C. foveolata, E. laevopinea, M. rostrata, P. media, Q. sieberi, and Q. verdonii (Table 1). Wind speed had a significant influence on leaf fall of C. apetalum, C. meissneriana, D. sassafras, and E. laevopinea. Overall, temperature was the most present influence, and the variable with the most effect size for six of the species, on seasonal pattern of species leaf fall (Table 1). Seasonal reproductive phenology varied greatly among species. The three main species, C. apetalum, N. moorei, and O. excelcius, presented mast flowering.
Flowering of C. apetalum was correlated with MEI and solar radiation from the previous month. Flowering of N. moorei was correlated with solar radiation, both from the current and the previous month, and temperature and MEI, both from the previous month (Table 1). Flowering of O. excelsus was only correlated with temperature (Table 1). Fruiting was mainly influenced by MEI, whether from the current month or the previous month, in four of the five species: C. apetalum, E. laevopinea, N. moorei, O. excelsus, and P. media, followed by temperature that influenced fruiting of C. apetalum, E. laevopinea, and N. moorei (Table 1). Fruiting of C. apetalum was also influenced by wind speed (Table 1).
Inter-annual climate drivers
Inter-annual total biomass was mainly negatively influenced by rainfall, rainfall from the previous year, and MEI, as per multiple linear regression (Figure 5). Leaf fall was predominantly influenced by temperature, with most species exhibiting a positive correlation, except for P. media, Q. verdonii, and S. ovata (Table 2). Solar radiation had a positive influence on leaf fall for most species, with the exception of C. foveolate, P. media, and Q. verdonii for which no correlation was found (Table 2), and for S. ovata, which showed a significant negative correlation (Table 2). Rainfall had a significant negative effect for eight of the species, with no significant correlation for C. meissneriana, N. moorei, and P. media, and a positive correlation with Q. verdonii and S. ovata (Table 2). MEI was found to have a significant positive correlation with leaf fall in C. meissneriana, D. sassafras, E. reticulatus, O. excelsus, and Q. sieberi, while a negative correlation was found between MEI and leaf fall for M. rostrata, P. media, Q. verdonii, and S. ovata. There was no significant effect at the community level for C. apetalum, C. foveolata, E. laevopinea, and N. moorei (Table 2).
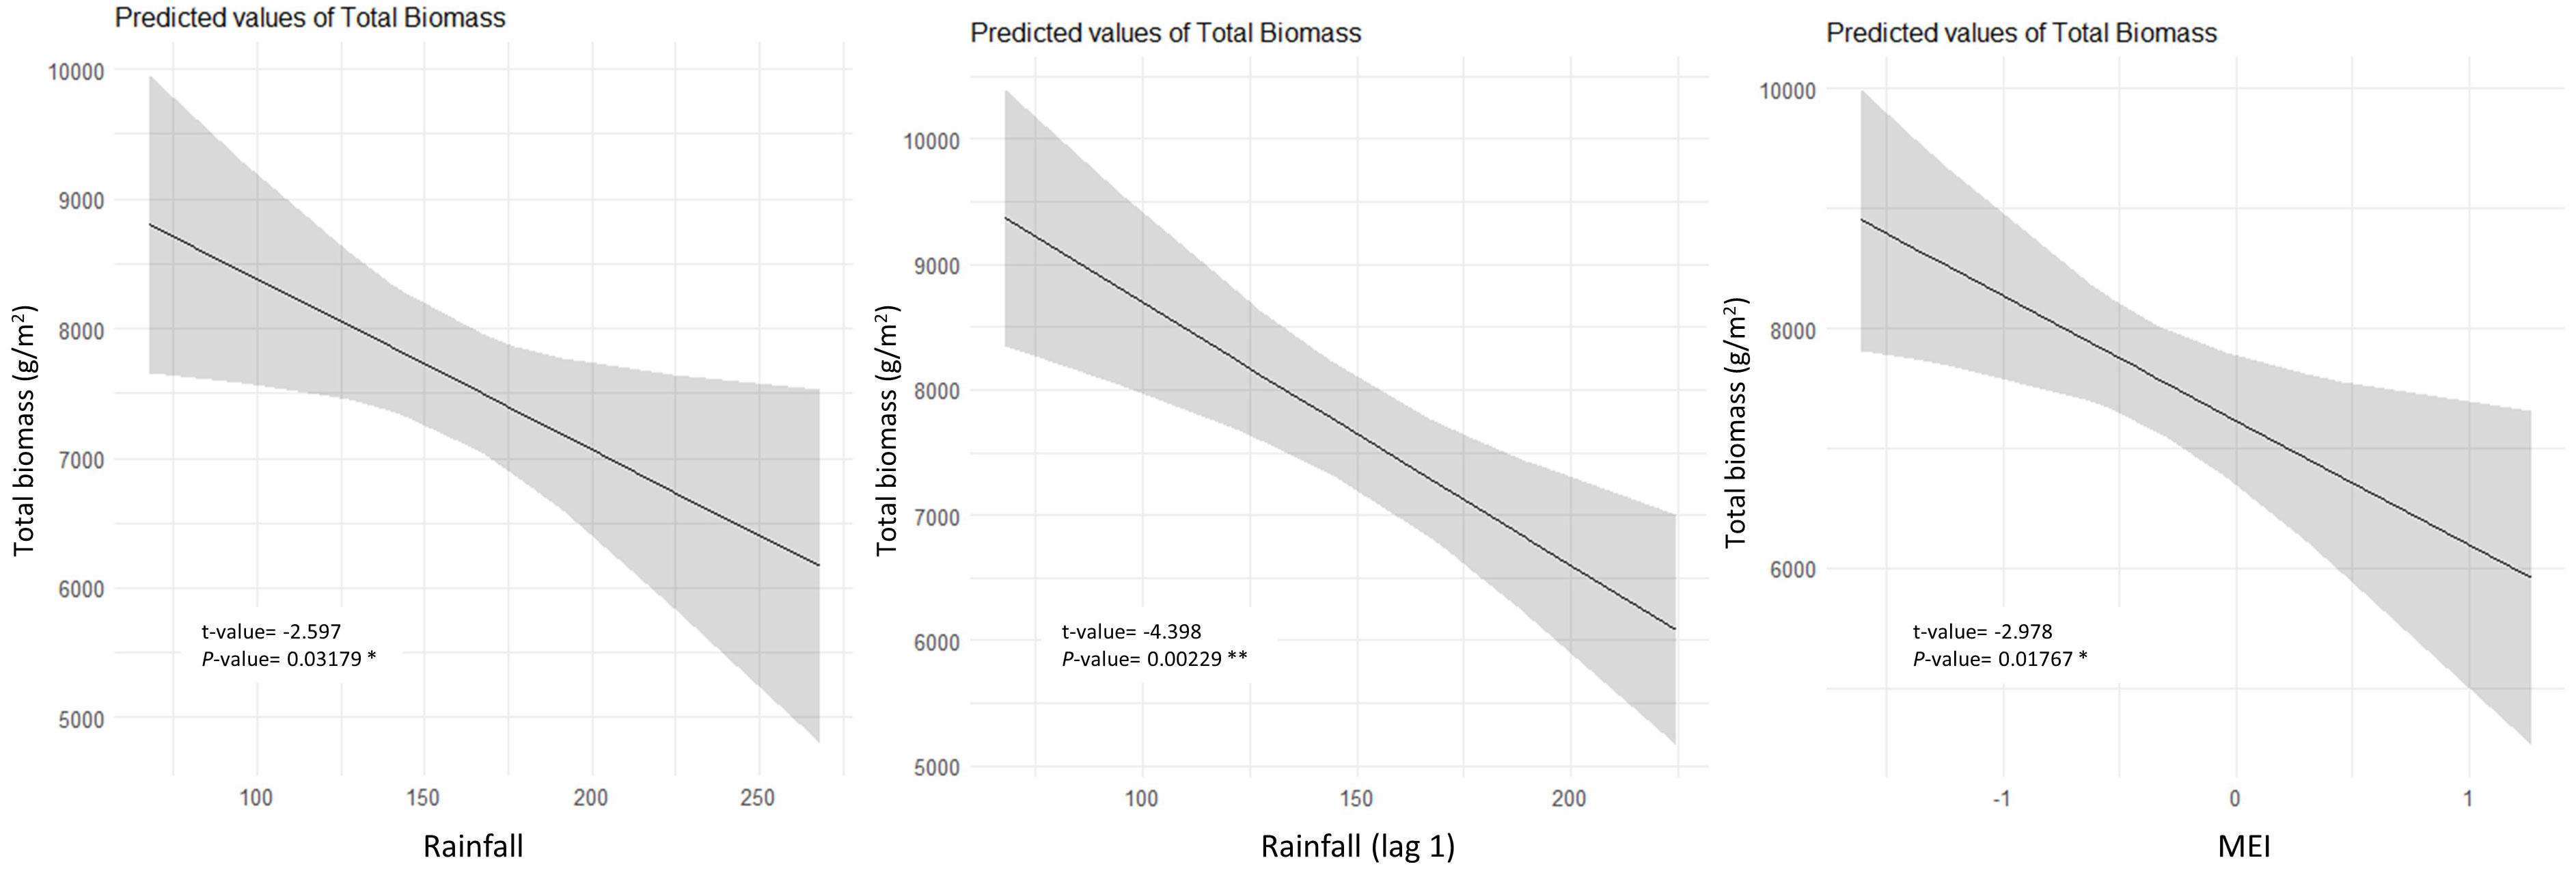
Figure 5 Partial plots of annual climate drivers of annual total biomass in the Nothofagus forest, NSW. The data were tested using linear regression. Individual climate drivers are presented considering the other model terms in their average (R2 = 0.65).
Rainfall had a significant positive correlation with flowering for all the species studied. There was also a significant negative correlation between MEI and flowering in C. apetalum and N. moorei and a positive correlation between MEI and flowering in O. excelsus. Temperature was found to have a positive significant correlation with flowering in N. moorei and O. excelsus. Solar radiation had a variable effect that was species dependent, with a negative correlation with flowering in C. apetalum and N. moorei, and a positive correlation with O. excelsus (Table 2).
Fruiting was significantly influenced by solar radiation in all species, with a positive correlation for C. apetalum, and a negative correlation for the other species. Temperature had a positive correlation with fruiting of all species, except C. apetalum for which no significant correlation was found. Rainfall was positively correlated with fruiting in O. excelsus and P. media, while it was negatively correlated with fruiting in C. apetalum (Table 2). MEI had a negative correlation in three of the seven species, N. moorei, O. excelsus, and P. media, and was positively correlated with C. apetalum (Table 2).
Linear regressions testing climate drivers of reproductive inter-annual behaviour showed that each species had a different climate driver (Supplementary Table S1). Best univariate linear models showed that the inter-annual behaviour of C. apetalum, N. moorei, and O. excelsus flowering were, respectively, mean temperature from 2 years before, mean temperature from the previous year (or wind speed), and El Niño from 2 years before (Supplementary Table S1). Fruiting of C. apetalum was mostly influenced by temperature from the previous year’s summer, E. laevopinea fruits by summer temperature from 2 years before, N. moorei fruits by the difference in temperature between 2 years before and the previous year, and O. excelsus fruits by mean annual temperature from 2 years before (Supplementary Table S1).
Inter-annual behaviour
Total annual leaf fall per square metre varied with years in both timing and intensity (Figures 6A, B). High leaf fall years (>4,500 g/m2) were observed in 2011, 2013, 2016, 2017, and 2019 (Figure 6B); those 5 years produced 44% of leaf fall collected throughout the study. Leaf litterfall was seasonal, peaking from September to November, mostly starting in winter/beginning of spring (Figures 6A, C). The mean date of leaf litterfall was found to be advancing through time (Figures 6A, D), as shown by the linear model (t-value = −2.1, p = 0.06, R2 = 0.29). Leaf fall mean date was positively correlated with solar radiation mean date (t-value = 4.51, p < 0.0001, R2 = 0.62), as shown by the linear model (Figure 6D). Inter-annual pattern showed a peak increase in leaf litterfall in 2019 (Figure 6B). Inter-annual patterns were found to be driven by temperature and solar radiation (Table 2; Supplementary Table S1).
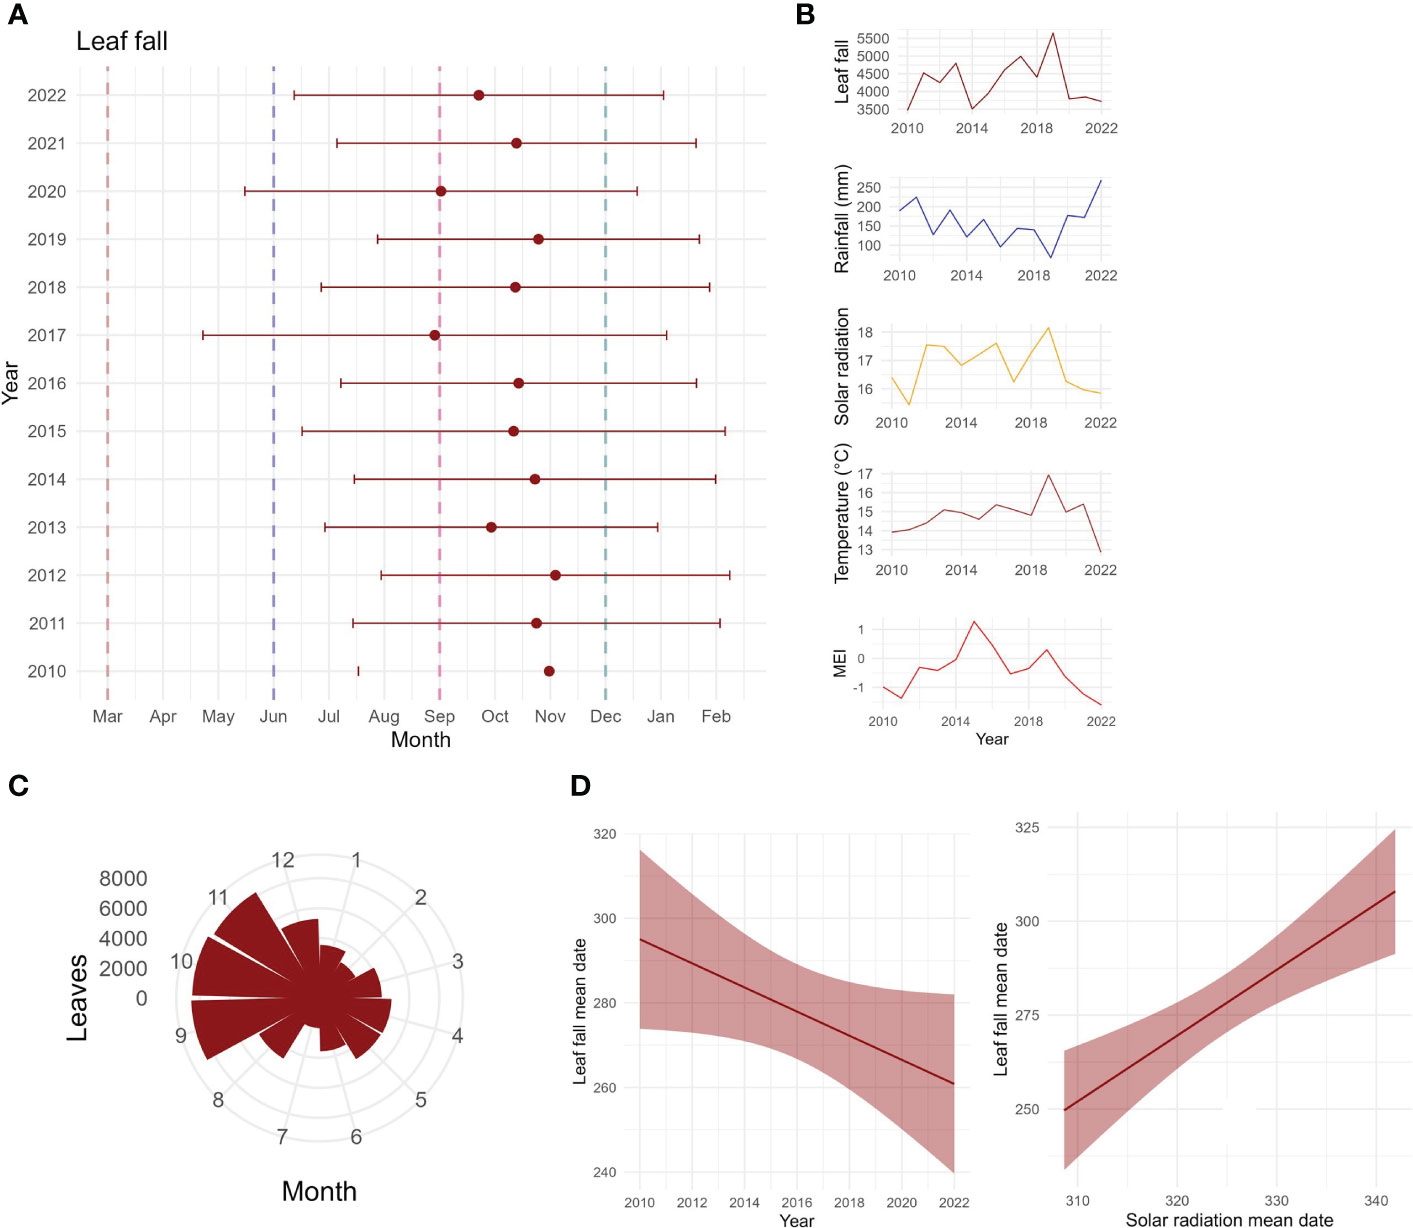
Figure 6 Long-term leaf fall data. (A) Mean dates of community leaf fall for each year, with circular standard deviation, in the Nothofagus forest, NSW. Dashed lines indicate beginning of seasons: autumn in March, winter in June, spring in September, and summer in December. (B) Variation in annual leaf fall, in comparison to annual rainfall, solar radiation, temperature, and the multivariate ENSO index MEI. (C) Circular plot of monthly leaf fall for the entire study period (g/m2/study period). (D) Mean date of leaf fall against years, showing an advancement of leaf fall across the years, and mean date of leaf fall against mean date of solar radiation, showing a significant positive relationship.
General behaviour throughout the years also varied with species. There was a linear decrease in leaf fall over time for P. media, C. fovoeolata, C. meissneriana, and S. ovata, while Q. verdonii displayed a more complex polynomial decrease/increase (Supplementary Figure S3). In contrast, a linear increase in leaf fall was found for E. laevopinea and M. rostrata, and for D. sassafras and E. reticulatus. For Q. sieberi, a complex polynomial behaviour showing an increase followed by a decrease was observed (Supplementary Figure S3). No significant changes over time in leaf fall were observed for N. moorei and O. excelsus. Changes in flowering activity were not significant for the studied species, except in C. apetalum, where a polynomial decrease/increase in flowering was found (Supplementary Figure S3). There was also a significant linear increase in fruiting in P. media and no change in other species (Supplementary Figure S3).
Masting
Masting activity was found for all species that were studied for both flowering and fruiting (seven species). This was not general flowering, however, as the years in which masting occurred were not the same across species. C. apetalum showed masting behaviour in 2011 and 2021 for flowering and 2018 for fruiting. N. moorei showed masting behaviour for flowering in 2017 and 2020, and fruiting in 2011, 2018, and 2020. O. excelsus showed masting behaviour for flowering in 2017 and 2018 (Figure 2). E. laevopinea showed mast fruiting in 2019 and 2022. O excelsus showed mast fruiting in 2021, P. media in 2022, and S. ovata in 2010 (Figure 2). The masting activity was supported by the coefficient of variation that appears in Supplementary Table S2.
The analysis of 64 years of flowering activity in N. moorei clearly demonstrated that the species presents mast flowering, with 65% of the flowering events occurring in intervals of 3 or 4 years (Figure 7A). Less commonly, an interval of 2 and 7 years was found for two mast flowering events, followed by an interval of 5 and 6 years for one subsequent flowering event (Figure 7A). The binomial regression for N. moorei showed that the probability of mast flowering is mainly influenced by increased rainfall of the previous year’s summer, mean temperature of the current year’s summer, and difference in temperature between 2 years before and the previous year (t−1 minus t−2) (R2 Tjur = 0.48, Figures 7A,B), with the most significant variable being the increase in mean temperature of the current year’s summer, followed by the difference in temperature (Figure 7B).
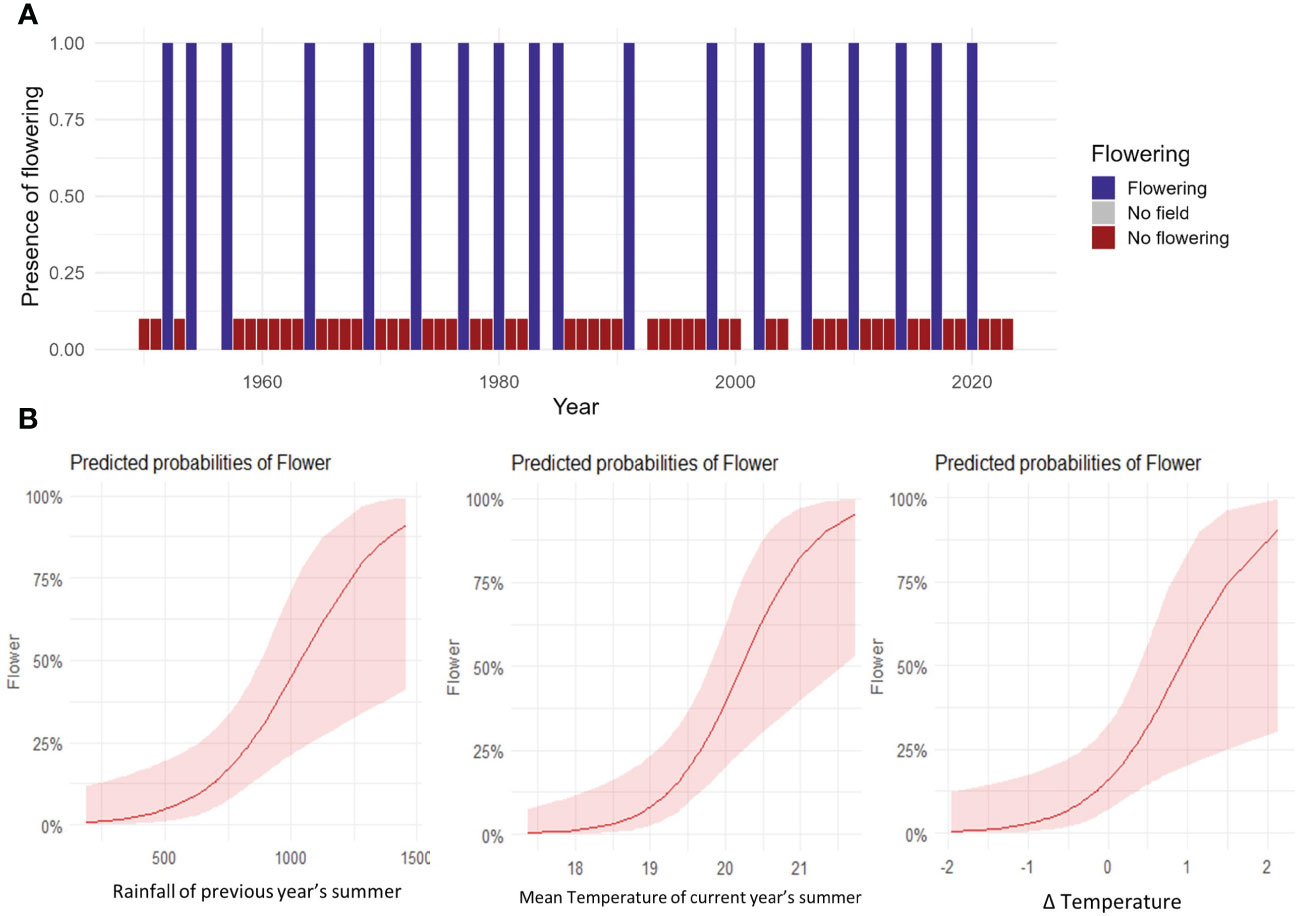
Figure 7 Long-term flowering data. (A) Time series data showing flowering of N. moorei from 1950 to 2023. Columns indicate presence of flowering (blue), absence of flowering (red) and no field work or data (grey). (B) Predicted probabilities of flowering of N. moorei in the Nothofagus forest, NSW. Analysis was based on logistic regressions of climate drivers of presence of flowering in the long time series data.
Discussion
Leaf litterfall
Litterfall plays a crucial role in the cycle of nutrients and organic materials within forest ecosystems (Alley et al., 1998). Litterfall patterns in this study have been mainly driven by two dominant species, N. moorei and C. apetalum. The patterns were seasonal, most influenced by temperature, solar radiation, and MEI at the seasonal scale, but temperature and solar radiation at inter-annual behaviour. Litter fall has also been found to be advancing through years.
Leaf fall behaviour of studied species was concentrated in spring, a pattern also found for N. truncata in New Zealand (Alley et al., 1998). Leaf senescence in winter deciduous species marks the shift from an active phase to a dormant one, with the aim to reabsorb nutrients before the leaves drop. The main triggers for leaf senescence in these species are photoperiod and temperature, with water stress adding an extra influence. While photoperiod is known to regulate leaf senescence in regions with harsh winters, temperature seems to play a bigger role in forests with milder winters (Estiarte and Peñuelas, 2015). The idea that leaf senescence tends to delay with increase in temperature, while drought tends to hasten it, seems to be accurate for species that drop leaves in winter. For the species of our study, leaf fall of community level was mostly influenced by an increase in temperature, followed by an increase in solar radiation and a decrease in rainfall. This suggests that the patterns of leaf fall in cool temperate forests of Australia do not follow some of the patterns found in other temperate forests.
The review on worldwide seasonal patterns of litterfall by Zhang et al. (2014) showed that, in temperate forests, seasonal pattern is highly variable, whereas a decrease in temperature may explain peaks of litterfall in autumn or winter. On the other hand, litterfall peaks in spring and summer, as found for the community studied in this paper, would be driven by solar radiation and temperature. This supports our findings, where the community leaf fall starts by the end of winter and peaks in spring until the beginning of summer. Nothofagus moorei has a marked seasonality of shoot growth, with a conspicuous flush of 7–10 new reddish leaves per shoot each September, and in some years, a second growth flush in autumn (March). As vegetative shoots expand, the previous leaves are shed during the later period of development of the new shoot in October. The models testing climate drivers of the species from our study show temperature and solar radiation as the main climate drivers, which agrees with the pattern discussed above.
We found an advancement of leaf fall mean date, which might be influenced by changes in climate variables. The advancement of leaf senescence in the studied forest may implicate the carbon cycle and nutrient availability for the trees, as it is an essential process that influences carbon availability and nutrient cycling in the forest (Roig et al., 2005). Because of that, soil respiration and organic carbon content are also tightly influenced by litterfall amount (Schlesinger and Andrews, 2000; Hansen et al., 2009; Zhang et al., 2014). Changes in leaf flushing could also affect the seasonality of leaf fall, since these processes can be both influenced by climate drivers that trigger leaf fall and leaf flush. In temperate forests, the production of new leaves is one of the most important processes, and sets the start of the growing season (Polgar and Primack, 2011). Even though species and individuals may present varied timing of leaf flushing, temperate species leaf production is often affected by temperature, which can be insightful in understanding the effects of climate change (Polgar and Primack, 2011). Previous phenology studies have shown that production of new leaves advances in warmer years (Polgar and Primack, 2011). As new leaf production generally occurs before leaf fall, changes to the timing of new leaves may have influenced the timing of leaf fall. Further work is underway documenting the phenophases of leaves and flowers in the Nothofagus forests of Australia.
Species presented varied inter-annual changes through time, with C. fovoeolata, C. meissneriana, P. media, Q. verdonii, and S. ovata decreasing through time; D. sassafras, E. reticularus, and Q. sibieri increasing and then decreasing; and E. laevopinea and M. rostrata increasing. There are varied responses of leaf fall to time; however, most of the species show a decrease in leaf fall. This could be due to a change in the length of leaf fall activity, whereas leaf fall is spread in a longer time period, and there is a lower concentration of leaf fall at one point. Our results show that the mean date of solar radiation is also advancing, having a positive correlation with leaf fall mean date. The advancement of solar radiation may increase the length of leaf fall activity, leading to a decrease in the leaf fall amount at one point in time. This is supported by the finding that solar radiation has the biggest effect on the seasonal GAMs explaining leaf fall at the community level. We are not certain of which mechanisms influence the advancement of solar radiation. However, Zeuthen et al. (1997) showed that an increase in UV-B and ozone in the troposphere, in different combinations, advanced leaf senescence by up to 21 days in European beech (Fagus sylvatica). Although it is still not clear what processes are influencing the advance of leaf fall, changes in the leaf fall activity may also influence the patterns of litter in the forest. It is known that change in the species composition of litter may affect decomposition rates, which highly influences the biogeochemical cycles and how ecosystems function, especially regarding species loss (Gartner and Cardon, 2004; Hättenschwiler et al., 2005; Jacob et al., 2010). Further work is underway reporting leaf decomposition experiments in these Nothofagus forests.
Reproductive phenology
Interestingly, even though C. apetalum, N. moorei, and O. excelsus have dry fruits, the peak of fruiting activity occurs in different months and seasons, with C. apetalum and N. moorei fruiting in summer, while O. excelsus experienced peak fruiting in winter. The diversity of climate drivers on phenology means climate change may affect species in different ways, therefore causing changes in forest cycles and possibly forest structure.
All studied species presented mast flowering and fruiting. In temperate forests, masting has been associated with climate drivers. Interestingly, our results showed different climate drivers of mast flowering and fruiting for each species. Schauber et al. (2002) conducted a meta-analysis for masting in New Zealand and found that fruiting synchronicity among species is linked to La Niña events that increase temperature in the summer before seedfall. However, the lone asynchronous species were found to be correlated with summer temperatures from 2 years before. The species from our study presented masting in different years, correlated with different variables from temperature (mean temperature, mean temperature from the previous year, mean temperature from 2 years before, mean temperature from the previous summer, mean temperature from two summers before, and difference between temperature from the previous year and 2 years before), with only O. excelsus being influenced by MEI. This means that the nuances in temperature changes are the main drivers of masting, while temperature on its own is not the same driver for all the species. Our results indicate the importance of conducting phenological analyses on species level as well as at the community level, since different drivers and patterns may get clouded by the varied species diversity at the community level.
Phenology of Nothofagus moorei
Multiple studies have analysed the masting activity of Nothofagus species, although most of the studies are conducted in either Patagonia or New Zealand. Of the 21 studies found analysing the phenology of Nothofagus species, only 5 presented analyses of climate drivers. Our study is the first one to analyse long-term phenology activity in a N. moorei forest in Australia. In our present study, masting activity was found in both flowering and fruiting of N. moorei.
The Nothofagus genus in New Zealand and Australia displays pronounced mast seeding, characterised by highly variable seed production across years. This pattern, however, contrasts the findings for N. cunninghamii in Victoria, Australia, which was found to flower annually with a high production among seeds (Howard, 1973). Flowering synchronicity is considered advantageous to wind pollination in species, which may support mast seeding. Monks and Kelly (2006) have analysed long-term seeding phenology and growth rings width in Nothofagus truncata in New Zealand, and found a switch between growth and reproduction where resources are diverted into and out of reproduction among years. They discussed two hypothesis that could explain the mast seeding in species of Nothofagus. The first hypothesis is related to enhanced pollination success, and might be the strongest one to explain the evolution of mast seeding in Nothofagus species. The second one is related to predator satiation, as Nothofagus trees produce nuts that are consumed by various species of birds, and during years of high seed production, they seem to constitute a significant portion of these birds’ diets (Wilson et al., 1998). It is important to note, however, that one hypothesis is not excluded from the other, and both could be playing a role in phenological patterns in Nothofagus species.
Our results show that the temperature from the previous year plays an essential role in the flowering activity of N. moorei and is supported by previous studies on other Nothofagus species. Richardson et al. (2005), for example, studied seed production of mountain beech (Nothofagus solandri var. cliffortioides) in New Zealand from 1973 to 2002. A rise in seed production was attributed to rising temperatures during flower bud formation, indicating that elevated temperatures might lead to more frequent seed production in high-altitude areas.
Masting in N. moorei was found to occur approximately three times a decade, which is broadly similar to the long-term patterns described in N. cunninghamii in Tasmania, which masts approximately every 3 years (Hickey et al., 1982; Hickey and Wilkinson, 1999). However, our results showed different climate cues for flowering in N. moorei compared to previous studies, which suggested that the main trigger was warm dry summer in the previous year (Wardle, 1984; Allen and Platt, 1990; Schauber et al., 2002). Mast flowering of N. moorei in our study site was mostly influenced by an increase in rainfall in the previous year’s summer, an increase in mean temperature of the current year’s summer, and an increase in the temperature difference from two previous summer temperatures, a variable proposed by Kelly et al. (2013) who studied seed masting in temperate plant species. The nuanced impact of climate variables on the flowering of N. moorei suggests that changes in photosynthetic activity during summer may play a role in the probability of flowering. Flowering shoots arise from buds in the axils of living leaves or from dormant buds that may be leafless stems at least 5 years old (Peacock et al. in prep). Switching from leaf budding to flower formation may be influenced by temperature, which drives physiological development processes in the dormant buds, and these may also contribute to the probability of flowering in certain years, due to either activation of flowering genes (Samarth et al., 2020) or hormones that induce flowering (Baktir et al., 2004; Bangerth, 2009).
Taken together, our results indicate the importance of conducting phenological analyses at a species level as well as at a community level. At the community level, the general response may easily obscure the diversity of species responses. The future stability of the relictual Nothofagus cool temperate rainforest of New South Wales in a changing climate will be reliant on ongoing studies and the modelling of these complex species’ responses.
Data availability statement
The raw data supporting the conclusions of this article will be made available by the authors, without undue reservation.
Author contributions
NV: Formal analysis, Investigation, Writing – original draft, Writing – review & editing. ML: Investigation, Supervision, Writing – review & editing. RP: Conceptualization, Data curation, Funding acquisition, Investigation, Methodology, Project administration, Resources, Supervision, Writing – review & editing.
Funding
The author(s) declare financial support was received for the research, authorship, and/or publication of this article. Funding was received from the New South Wales National Parks and Wildlife Service.
Acknowledgments
Phenological observations commenced at Mt Boss State Forest (now Werrikimbe NP) in 1955 by Karl Vogel and Jack Cousins of the former agency the Forestry Commission of New South Wales and continued until 1967. Observations were re-initiated by Peacock and William Chapman in 2009 and continue to present. Traecey Brassil of the NSW Department of Primary Industry provided access to archival forest research records and the NSW NPWS provided field logistical support.
Conflict of interest
The authors declare that the research was conducted in the absence of any commercial or financial relationships that could be construed as a potential conflict of interest.
Publisher’s note
All claims expressed in this article are solely those of the authors and do not necessarily represent those of their affiliated organizations, or those of the publisher, the editors and the reviewers. Any product that may be evaluated in this article, or claim that may be made by its manufacturer, is not guaranteed or endorsed by the publisher.
Supplementary material
The Supplementary Material for this article can be found online at: https://www.frontiersin.org/articles/10.3389/fevo.2024.1358676/full#supplementary-material
References
Allen R. B., Platt K. H. (1990). Annual seedfall variation in Nothofagus solandri (Fagaceae) (Canterbury, New Zealand: Oikos), 199–206. doi: 10.2307/3565940
Alley J. C., Fitzgerald B. M., Berben P. H., Haslett S. J. (1998). Annual and seasonal patterns of litter-fall of hard beech (Nothofagus truncata) and silver beech (Nothofagus menziesil) in relation to reproduction. New Z. J. Bot. 36, 453–464. doi: 10.1080/0028825X.1998.9512583
Baker A. G., Catterall C., Wiseman M. (2022). Rainforest persistence and recruitment after Australia’s 2019–2020 fires in subtropical, temperate, dry and littoral rainforests. Aust. J. Bot. 70, 189–203. doi: 10.1071/BT21091
Baktir I., Ulger S., Kaynak L., Himelrick D. G. (2004). Relationship of seasonal changes in endogenous plant hormones and alternate bearing of olive trees. HortScience 39, 987–990. doi: 10.21273/HORTSCI.39.5.987
Bangerth K. F. (2009). Floral induction in mature, perennial angiosperm fruit trees: similarities and discrepancies with annual/biennial plants and the involvement of plant hormones. Sci. Horticult. 122, 153–163. doi: 10.1016/j.scienta.2009.06.014
Bartoń K. (2023) MuMIn: Multi-Model Inference. R package version 1.47.5. Available online at: https://CRAN.R-project.org/package=MuMIn.
Baur G. N. (1989). Silviculture notes for New South Wales, Forestry Commission of New South Wales, CD-ROM version.
Cunningham T. M. (1957). Seed production and seed fall of E. regnans (F. Muell.). Aust. Forestry. 21, 30–39. doi: 10.1080/00049158.1957.10675336
Estiarte M., Peñuelas J. (2015). Alteration of the phenology of leaf senescence and fall in winter deciduous species by climate change: effects on nutrient proficiency. Global Change Biol. 21, 1005–1017. doi: 10.1111/gcb.12804
Floyd A. G. (1990). Australian rainforests in New South Wales (Chipping Norton, N.S.W.: Surrey Beatly and Sons).
Gartner T. B., Cardon Z. G. (2004). Decomposition dynamics in mixed-species leaf litter. Oikos 104, 230–246. doi: 10.1111/j.0030-1299.2004.12738.x
Grace J. (2004). Understanding and managing the global carbon cycle. J. Ecol. 92, 189–202. doi: 10.1111/j.0022-0477.2004.00874.x
Handbook of Australian, New Zealand & Antarctic birds (HANZAB) (1990). Oxford University Press Melbourne Platycerus elegans Crimson Rosella. 321–341.
Hansen K., Vesterdal L., Schmidt I. K., Gundersen P., Sevel L., Bastrup-Birk A., et al. (2009). Litterfall and nutrient return in five tree species in a common garden experiment. For. Ecol. Management. 257, 2133–2144. doi: 10.1016/j.foreco.2009.02.021
Hartig F. (2022) _DHARMa: Residual Diagnostics for Hierarchical (Multi-Level/Mixed) Regression Models_. R package version 0.4.6. Available online at: https://CRAN.R-project.org/package=DHARMa.
Hättenschwiler S., Tiunov A. V., Scheu S. (2005). Biodiversity and litter decomposition in terrestrial ecosystems. Annu. Rev. Ecol. Evol. Syst. 36, 191–218. doi: 10.1146/annurev.ecolsys.36.112904.151932
Hickey J. E., Blakesley A. J., Turner B. (1982). Seedfall and germination of Nothofagus cunninghamii (Hook.) Oerst., Eucryphia Iucida (Labill.) Bail!. and Atherosperma moschatum Labill. Implications regeneration practice. 13, 21–28.
Hickey J. E., Felton K. C. (1987). “Management of Tasmanian cool temperate rainforest,” in Conf. Proc. of Inst. For. Aust., Perth (Forest Management in Australia), 327–341.
Hickey J. E., Wilkinson G. R. (1999). Long-term regeneration trends from a silvicultural systems trial in lowland cool temperate rainforest in Tasmania. TASFORESTS-HOBART 11, 1–22.
Howard T. M. (1973). Studies in the ecology of Nothofagus cunninghamii Oerst. II. Phenology. Aust. J. Bot. 21, 79–92. doi: 10.1071/BT9730079
IPCC (2021). “Climate Change 2021: The Physical Science Basis,” in Contribution of Working Group I to the Sixth Assessment Report of the Intergovernmental Panel on Climate Change. Eds. Masson-Delmotte V., Zhai P., Pirani A., Connors S. L., Péan C., Berger S., et al (Cambridge University Press, Cambridge).
Jacob M., Viedenz K., Polle A., Thomas F. M. (2010). Leaf litter decomposition in temperate deciduous forest stands with a decreasing fraction of beech (Fagus sylvatica). Oecologia 164, 1083–1094. doi: 10.1007/s00442-010-1699-9
Keith H., Mackey B. G., Lindenmayer D. B. (2009). Re-evaluation of forest biomass carbon stocks and lessons from the world’s most carbon-dense forests. Proc. Natl. Acad. Sci. 106, 11635–11640. doi: 10.1073/pnas.0901970106
Kelly D. (1994). The evolutionary ecology of mast seeding. Trends Ecol. Evol. 9, 465–470. doi: 10.1016/0169-5347(94)90310-7
Kelly D., Geldenhuis A., James A., Holland P. E., Plank M. J., Brockie R. E., et al. (2013). Of mast and mean: differential-temperature cue makes mast seeding insensitive to climate change. Ecol. Lett. 16, 90–98. doi: 10.1111/ele.12020
Kelly D., Sork V. L. (2002). Mast seeding in perennial plants: why, how, where? Annu. Rev. Ecol. Syst. 33, 427–447. doi: 10.1146/annurev.ecolsys.33.020602.095433
Malhi Y., Doughty C., Galbraith D. (2011). The allocation of ecosystem net primary productivity in tropical forests. Philos. Trans. R. Soc. London. Ser. B. Biol. Sci. 366, 3225–3245. doi: 10.1098/rstb.2011.0062
Matsui T., Nakao K., Higa M., Tsuyama I., Kominami Y., Yagihashi T., et al. (2018). Potential impact of climate change on canopy tree species composition of cool-temperate forests in Japan using a multivariate classification tree model. Ecol. Res. 33, 289–302. doi: 10.1007/s11284-018-1576-2
Monks A., Kelly D. (2006). Testing the resource matching hypothesis in the mast seeding tree Nothofagus truncata (Fagaceae). Austral Ecol. 31, 366–375. doi: 10.1111/j.1442-9993.2006.01565.x
Neumann M., Ukonmaanaho L., Johnson J., Benham S., Vesterdal L., Novotný R., et al. (2018). Quantifying carbon and nutrient input from litterfall in European forests using field observations and modeling. Global Biogeochem. Cycles. 32, 784–798. doi: 10.1029/2017GB005825
Peacock R. J., Baker P. J. (2022). Informing post-fire recovery planning of northern NSW rainforests (Melbourne: Bushfire and Natural Hazards CRC).
Peacock R. J., Homberger D. G., Smart A. (in prep). Phenology of the Antarctic Beech (Sydney: Nothofagus moorei), a Gondwanan relict in Australia.
Polgar C. A., Primack R. B. (2011). Leaf-out phenology of temperate woody plants: from trees to ecosystems. New Phytol. 191, 926–941. doi: 10.1111/j.1469-8137.2011.03803.x
R Core Team (2022). R: A language and environment for statistical computing (Vienna, Austria: R Foundation for Statistical Computing). Available at: https://www.R-project.org/.
Rees M., Kelly D., Bjørnstad O. N. (2002). Snow tussocks, chaos, and the evolution of mast seeding. Am. Naturalist. 160, 44–59. doi: 10.1086/340603
Richardson S. J., Allen R. B., Whitehead D., Carswell F. E., Ruscoe W. A., Platt K. H. (2005). Climate and net carbon availability determine temporal patterns of seed production by Nothofagus. Ecology 86, 972–981. doi: 10.1890/04-0863
Roig S., del Río M., Cañellas I., Montero G. (2005). Litter fall in Mediterranean Pinus pinaster Ait. stands under different thinning regimes. For. Ecol. Management. 206, 179–190. doi: 10.1016/j.foreco.2004.10.068
Samarth K. D., Turnbull M. H., Jameson P. E. (2020). Molecular control of masting: an introduction to an epigenetic summer memory. Ann. Bot. 125, 851–858. doi: 10.1093/aob/mcaa004
Saarsalmi A., Starr M., Hokkanen T., Ukonmaanaho L., Kukkola M., Nöjd P., et al. (2007). Predicting annual canopy litterfall production for Norway spruce (Picea abies (L.) Karst.) stands. For. Ecol. Manage. 242 (2-3), 578–586.
Schauber E. M., Kelly D., Turchin P., Simon C., Lee W. G., Allen R. B., et al. (2002). Masting by eighteen New Zealand plant species: the role of temperature as a synchronizing cue. Ecology 83, 1214–1225. doi: 10.1890/0012-9658(2002)083[1214:MBENZP]2.0.CO;2
Schlesinger W. H., Andrews J. A. (2000). Soil respiration and the global carbon cycle. Biogeochemistry 48, 7–20. doi: 10.1023/A:1006247623877
Simkin R., Baker P. J. (2008). Disturbance history and stand dynamics in tall open forest and riparian rainforest in the Central Highlands of Victoria. Austral Ecol. 33, 747–760. doi: 10.1111/j.1442-9993.2008.01843.x
Smith-Ramirez C., Armesto J. J. (1994). Flowering and fruiting patterns in the temperate rainforest of chiloe, Chile–ecologies and climatic constraints. J. Ecol. 82, 353–365. doi: 10.2307/2261303
Starr M., Saarsalmi A., Hokkanen T., Merilä P., Helmisaari H. S. (2005). Models of litterfall production for Scots pine (Pinus sylvestris L.) in Finland using stand, site and climate factors. For. Ecol. Manage. 205 (1-3), 215–225.
Torres A. D., Cellini J. M., Lencinas M. V., Barrera M. D., Soler R., Díaz Delgado R., et al. (2015). Seed production and recruitment in primary and harvested Nothofagus pumilio forests: influence of regional climate and years after cuttings. For. Syst. 24 (1), e016, 11. doi: 10.5424/fs/2015241-06403
Turner J., Lambert M. J. (2002). Litterfall and forest floor dynamics in Eucalyptus pilularis forests. Austral Ecol. 27 (2), 192–199.
Wardle J. A. (1984). The New Zealand beeches: ecology, utilisation and management (New Zealand Forest Service, Christchurch).
Webb L. J. (1959). A physiognomic classification of Australian rain forests. J. Ecol. 47 (3), 551–570. doi: 10.2307/2257290
White T. C. (2011). The significance of unripe seeds and animal tissues in the protein nutrition of herbivores. Biol. Rev. 86 (1), 217–224.
Wilson P. R., Karl B. J., Toft R. J., Beggs J. R., Taylor R. H. (1998). The role of introduced predators and competitors in the decline of kaka (Nestor meridionalis) populations in New Zealand. Biol. Conserv. 83, 175–185. doi: 10.1016/S0006-3207(97)00055-4
Wood S. N. (2017). Generalized additive models: an introduction with R (Boca Raton: CRC press). doi: 10.1201/9781315370279
Worth J. R., Harrison P. A., Williamson G. J., Jordan G. J. (2015). Whole range and regional-based ecological niche models predict differing exposure to 21st century climate change in the key cool temperate rainforest tree southern beech (N othofagus cunninghamii). Austral Ecol. 40 (2), 126–138.
Wright B. R., Franklin D. C., Fensham R. J. (2022). The ecology, evolution and management of mast reproduction in Australian plants. Aust. J. Bot. 70, 509–530. doi: 10.1071/BT22043
Zeuthen J., Mikkelsen T. N., Paludan-Müller G., Ro-Poulsen H. (1997). Effects of increased UV-B radiation and elevated levels of tropospheric ozone on physiological processes in European beech (Fagus sylvat ica). Physiol. Plant 100, 281–290. doi: 10.1111/j.1399-3054.1997.tb04784.x
Zhang Z., Niu K., Liu X., Jia P., Du G. (2014). Linking flowering and reproductive allocation in response to nitrogen addition in an alpine meadow. J. Plant Ecol. 7, 231–239. doi: 10.1093/jpe/rtt030
Keywords: seasonality, flowering, fruiting, leaf fall, climate change
Citation: Vogado NO, Liddell MJ and Peacock RJ (2024) Seasonal and long-term climate drivers of tree species phenology and litterfall in a Nothofagus cool temperate rainforest of Australia. Front. Ecol. Evol. 12:1358676. doi: 10.3389/fevo.2024.1358676
Received: 20 December 2023; Accepted: 12 February 2024;
Published: 07 March 2024.
Edited by:
Johan Gielis, University of Antwerp, BelgiumReviewed by:
Roland Valcke, University of Hasselt, BelgiumGeert Potters, Antwerp Maritime Academy, Belgium
Copyright © 2024 Vogado, Liddell and Peacock. This is an open-access article distributed under the terms of the Creative Commons Attribution License (CC BY). The use, distribution or reproduction in other forums is permitted, provided the original author(s) and the copyright owner(s) are credited and that the original publication in this journal is cited, in accordance with accepted academic practice. No use, distribution or reproduction is permitted which does not comply with these terms.
*Correspondence: Nara O. Vogado, vogado.nara@gmail.com