Spatial dynamic simulation of beetles in biodiversity hotspots
 Ping He
 Ming Bai1,2*
 - 1Key Laboratory of Zoological Systematics and Evolution, Institute of Zoology, Chinese Academy of Sciences, Beijing, China
- 2University of Chinese Academy of Sciences, Beijing, China
- 3College of Plant Protection, Hebei Agricultural University, Baoding, China
Introduction: Coleoptera is the most species-rich order of animals with the widest distribution area; however, little is known about its global suitability distribution, and a substantial number of species are experiencing silent extinction. Most of Earth’s biocommunities are concentrated in biodiversity hotspots, and these hotspots receive the largest investment of conservation funds. The survival of beetles is closely related to the richness of biodiversity, so habitat loss in hotspots results in a high extinction risk for beetles.
Methods: We used the MaxEnt model to simulate the spatial suitable distribution in six time periods (1970-1980, 1980-1990, 1990-2000, 2000-2010, 2010-2020, and 1970-2020). Furthermore, we determined the priority suitable regions in hotspots after coupling the current biodiversity zones and evaluated the congruence between the suitable habitat of beetles and hotspots.
Results: The results revealed that less than 30% of suitable regions were located in hotspots, and approximately 49.08% of the suitable habitat remained constant in all six periods, and can be regarded as climatically stable refugia. The Mediterranean Basin had the largest suitable area in each period and was always ranked first; other regions, such as Indo-Burma, Irano-Anatolian, and Mesoamerica, also had large areas of suitable habitat. Nine excellent, ten stable, and seventeen lower hotspots were identified based on their dynamic changes in 36 hotspots.
Discussion: Based on these results, corresponding planning and management measures should be implemented in different biodiversity hotspots according to the changes in geographic distribution. In this paper, we propose practical advice for different regions to improve isolated and fragmented habitats, which will support the conservation of Coleoptera taxa and the restoration of biodiversity.
1 Introduction
Biodiversity hotspots, defined as sites with the highest species diversity or as the most threatened and diverse sites, have been widely used in multiple disciplines to identify the priority areas for conservation (Reid, 1998; Ceballos and Ehrlich, 2006; Jha and Bawa, 2006; Willis et al., 2007; Davies, 2010). Based on this definition, hotspots are usually described as the concentration areas with rare species, threatened species, and 70% loss of primary vegetation (Myers et al., 2000). Most of Earth’s biodiversity is found in hotspots, and these hotspots provide a refuge or suitable habitat for vascular plants, mammals, amphibians, insects and others (Habel et al., 2019; Kidane et al., 2019; Trew and Maclean, 2021). Currently, 36 biogeographical regions are highlighted as global conservation priorities owing to their exceptional endemism, and there is a great threat to vegetation integrity (Hrdina and Romportl, 2017). The annual average cost of the global network of conservation zones is estimated to be US$ 27.5 billion, representing the largest investment in protection funds (Gössling, 2002; Mittermeier et al., 2011). Further determining priority conservation zones on different geographic scales for species considering hotspots helps determine the concentration of resources and reallocation (Jepson and Canney, 2001; Trew and Maclean, 2021). However, few studies have discussed the spatial suitability of species in biodiversity hotspots. Evaluating the distribution suitability of species in hotspots is important for biodiversity conservation. For instance, the potential distribution map regarding wild strawberry and Ageratina adenophora was obtained by two studies (Yang et al., 2020; Changjun et al., 2021), and they both demonstrated the importance of exploring the distribution in hotspots. Farashi and Shariati (2017) studied Iran biodiversity hotspots and used a niche model and setting amounts of buffers for mammal, bird, and reptile species. Exploring the habitat suitability for some species and groups in the context of biodiversity hotspots is conducive to the implementation of targeted measures and the further conservation of biodiversity.
Insects, a neglected group, contribute to many functions and services in the natural ecosystem (Noriega et al., 2018; Elizalde et al., 2020; Noriega et al., 2020). Some of their contributions, such as pollination, pest control, and nutrient cycling, are of high value (Potts et al., 2016; Dainese et al., 2019; Uhler et al., 2021). For decades, increasing evidence has indicated that insect assemblages are undergoing significant changes in biodiversity owing to a suit of anthropogenic stress and climate change, especially in hotspots (Fattorini, 2011; Cardoso et al., 2020; Halsch et al., 2021; Moir, 2021; Outhwaite et al., 2022). This is attributable to the fact that substantial extinction pressure is put on insect populations by the fragmentation of biodiversity hotspots (Fonseca, 2009; Stork, 2010; Sullivan and Ozman-Sullivan, 2021). Hochkirch (2016) stated that we must preserve invertebrate biodiversity and pay more attention to the insect crisis. Thus, the protection of biodiversity hotspots will facilitate the reproduction and survival of insect taxa (Samways, 2007; Stork and Habel, 2014). Beetles, also known as Coleoptera, is the most diverse and species-rich insect group, and more than 380,000 species have been described worldwide (Zhang et al., 2018). Most beetles must rely on forests to survive, indicating that the increasing fragmentation of forest habitats will place enormous pressure on beetles. In addition to climate change, the alternation of natural landscapes by humans is a critical cause of insect biodiversity loss, especially for beetles. We focus on this group not only because it is the group with the largest number of species, but also because it has a high value for ecosystem services. For example, dung beetles perform functions such as nutrient cycling, bioturbation, secondary seed dispersal, and play an important role in increasing primary productivity and suppressing parasites in livestock (Nichols et al., 2008). Additionally, some beetles, such as ground beetles, are seen as bioindicators of the evaluation of environmental pollution and the recovery processes in postindustrial areas in accordance with their extreme sensitivity to ecological parameters, such as water quality and soil degradation (Elliott, 2008; Ghannem et al., 2018). Therefore, the critical role of beetles in ecological functions and ecosystems suggests that more attention should be given to beetle conservation. Understanding species distribution helps guide protection; however, there have been few studies on the distribution of beetles on the macro scale, which has fascinated many scholars. Consequently, exploring the spatial dynamics of the potential suitability distribution for beetles on several time scales may not only facilitate beetle biodiversity conservation, but also may be conducive to mitigating biodiversity degradation in hotspots.
For decades, the human footprint has spread all over the world, posing a huge threat to biodiversity, and thousands of species have lost their homes. As a means of determining global conservation priorities, exploring the spatial dynamics of beetles in hotspots is conducive to the conservation of biodiversity. Recently, the species distribution model (SDM) has been widely used to predict the potential geographic distribution of species, including the maximum entropy (MaxEnt) model, rule set prediction (GARP), ecological niche factor analysis (ENFA), and random forest (RF) (Pulliam, 2000; Farashi et al., 2013; Sheridan, 2013; Noriega et al., 2020; Yang et al., 2022). Among these, MaxEnt is preferred due to its impressive advantages, such as ease of operation, good performance, short run time, and relatively accurate results (Phillips and Dudík, 2008; Merow et al., 2013). Kong et al. (2021) established a climate distribution model under four climate change scenarios and revealed that isolated, fragmented giant panda populations were more vulnerable than other populations to extinction risk. Chowdhury et al. (2021) found that approximately 15% of butterflies may be at elevated extinction risk in the tropics, and most migratory butterflies face strong seasonal variation in habitat suitability by using MaxEnt to simulate the seasonal spatial dynamics of butterfly migration. To identify a stable refugia for relict plant species, Tang et al. (2018) mapped the distribution patterns for relict species in East Asia to identify suitable regions and obtained a long-term refuge combined with an abundance map. We also utilized this modeling approach to simulate the spatially suitable distribution for beetles in biodiversity hotspots.
Here, we develop current niche models for beetles and identify the priority suitable habitat under decades scales combined with hotspots, which allows us to observe the characteristics of spatial changes over the past decades. The objectives of this study include the following: (1) to simulate the integrated spatial suitability of beetles; (2) to identify the priority suitable habitat and hotspots for beetles at five scales; and (3) to evaluate the congruence between the suitable habitat of beetles and biodiversity hotspots.
2 Material and methods
2.1 Material
We obtained occurrence records (7,719,124 records) from the Global Biodiversity Information Facility (https://www.gbif.org/), which is an international network of data infrastructure that provides the most comprehensive and successful service for searches on taxa, species, or datasets. All occurrence point data were collected between 1970 and 2020. To explore the spatial dynamic changes in beetles, we grouped occurrence records into five periods (1970-1980, 1980-1990, 1990-2000, 2000-2010, 2010-2020, and 1970-2020). Then, we removed black cells and data without accurate coordinate information, and invalid coordinates outside the world were also deleted during the data clearing process of each scale. To improve the accuracy of the modeling, duplicate records were deleted in our study, and only one point was included in every grid cell (10 km×10 km) (Aiello-Lammens et al., 2015; Aidoo et al., 2022). In total, 77,569, 89,590, 106,700, 162,694, 620,653, and 970,056 occurrence presence records for 1970-1980, 1980-1990, 1990-2000, 2000-2010, 2010-2020, and 1970-2020, respectively, were ultimately obtained. Abundant species populations were found in each dataset; for example, in 1970-1980, 159 families, 5600 genera, and 24814 species were obtained. For 1980-1990, we determined 164 families, 5972 genera, and 25697 species. For 1990-2000, the distribution database included 162 families, 6470 genera, and 28244 species. For 2000-2010 and 2010-2020, a total of 30238 and 33802 species were identified, and they all belong to 171 and 167 families, respectively. In summary, 55743 species from 187 families and 8174 genera were found during the clearing of occurrence points in 1970-2020. Finally, all occurrence data of beetles were saved in the “CSV” format in accordance with the requirements of the MaxEnt model.
To better improve our results, we utilized 19 bioclimatic variables (WorldClim; https://worldclim.org/) to construct the MaxEnt model. The 19 bioclimatic parameters included annual mean temperature, mean diurnal range, isothermality, and others (Supplementary Table S1), which were identified by spatial interpolation based on weather stations from between 9000 and 60000 (Fick and Hijmans, 2017).
2.2 Methods
We implemented the MaxEnt model in R (Phillips et al., 2017) to simulate the spatial dynamics of beetles under current climate conditions. Bioclimatic parameters were utilized in our modeling process to comprehensively evaluate the distribution pattern in accordance with the degree of importance of bioclimatic factors to species (Chowdhury et al., 2021). For each ten-year scale, we attempted to adjust the parameters of the model to obtain more accurate results after inputting occurrence data and environmental variables and ultimately obtained different parameter assemblages of the model for various scales. The kuenm package in R version 3.6.3 was utilized to optimize the regularization multiplier (RM) and feature class parameters (FC). For RM, the values were set between 0.5 and 4 (increments of 0.5, total 8 values), and 31 various combinations of FC based on L (linear), Q (quadratic), H (hinge), P (product), and T (threshold) were selected to ultimately determine parameter collocation. The final parameters used in the MaxEnt model depended on the results of the Akaike information criterion (AICc), significance (partial ROC), and omission rates (E=5%). In addition, the significant models needed to meet the following conditions: omission rates ≤ 5%, and delta AICc values must be ≤ 2 (Cobos et al., 2019).
Then, we executed the R program with 10 replicates to obtain the average results, a logistic output format and the output file type is “ASC” after perfect model parameter combinations were received for each period. The AUC value represented the accuracy of the model, and a higher value indicated more MaxEnt model results. Then, we mapped the habitat distribution based on the results of R produced under various time scales using ArcGIS 10.4 to further analyze the spatial change dynamics of beetles.
3 Results
3.1 Spatial suitability of beetles
After optimizing all model combinations, we obtained the parameter settings for each time period. Specifically, when the RM value was 2 and FC was LQ for 1970-1980, the AICc value was the smallest with delta (AICc=0). The RM value setting for 1980-1990, 1990-2000, 2000-2010, 2010-2020, and 1970-2020 was 0.5, 2.5, 2, 1, and 3.5, respectively, while the choice of FC for these five periods was LHP, H, QP, LQ, and HP, respectively. Then, the MaxEnt model was used to model the spatial distribution of beetles under the optimal parameter setting. We developed several spatial habitat suitability maps for beetles by using the reclassification tool in ArcGIS 10.4 after obtaining the files originating from the results of the MaxEnt program. These distribution maps represented the suitability of beetles under the background of the GBIF database, not only one species, meaning that basic survival conditions such as temperature and precipitation were sufficient for most species, while the distribution of suitability for individual species may differ. Six global suitability maps were ultimately identified, including 1970-1980 (A), 1980-1990 (B), 1990-2000 (C), 2000-2010 (D), 2010-2020 (E), and 1970-2020 (Total). Figure 1 shows the suitable distribution of beetles from 1970 to 2020. Overall, the distribution of suitable habitat was mainly concentrated in western and southern Europe and North America, and southern Asia was also a critical distribution region. Some countries, such as France, Germany, Poland, Sweden, the United States, China, and Japan, were at excellent levels in our assessment and occupied most of the beetles’ suitable habitat. In contrast, the degree of habitat suitability for North Asia, North America, and Africa was low. From the perspective of biogeographic regions, most of these suitable zones belonged to the Palaearctic, Nearctic, and Holarctic, which are relatively rich in biodiversity and vegetation communities.
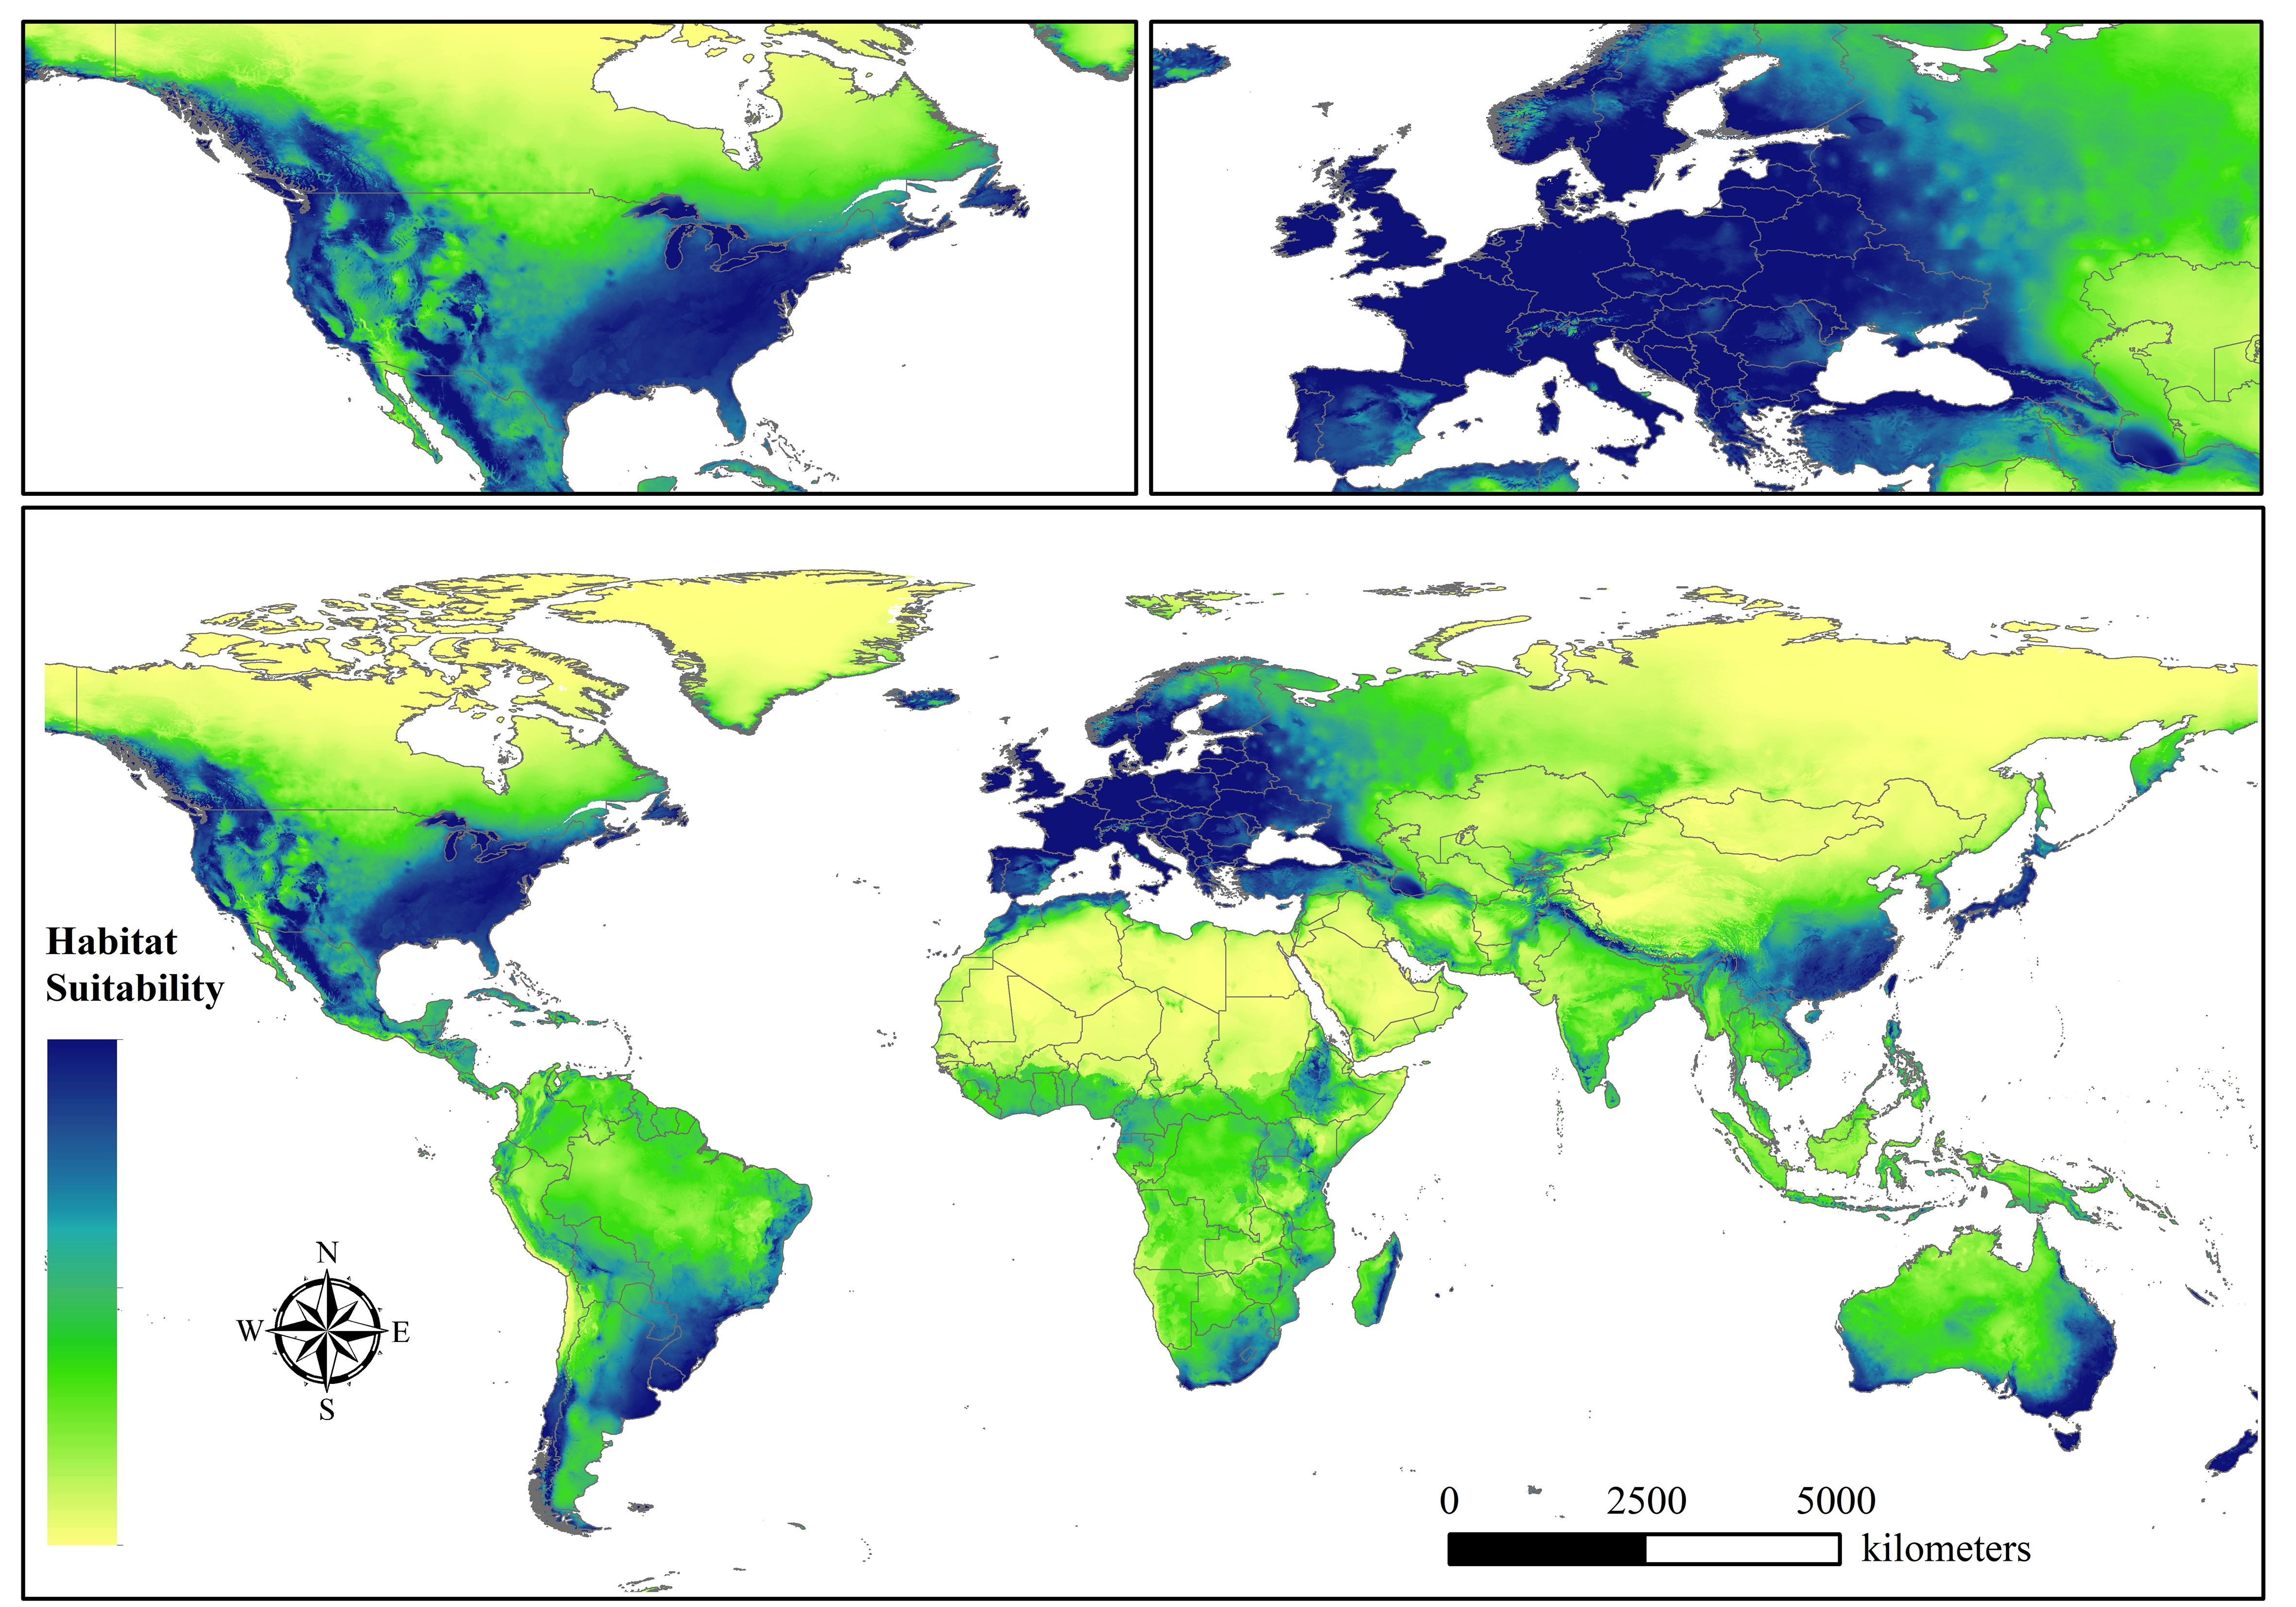
Figure 1 The habitat suitability of beetles globally in 1970-2020. We mapped the habitat suitability of beetles based on the GBIF database in six time periods, and the others are represented in the Supplementary Material.
Furthermore, beetles showed a range of volatility in every ten-year period, and the spatial distribution dynamics over fifty years are shown in Supplementary Figure S1. We classified the habitat suitability of beetles into two levels after comprehensively evaluating the distribution of the beetles. In that case, Europe and North America included most of the suitable regions, and the distribution areas in southeastern Asia were relatively stable. In terms of unstable regions, the suitability in South America, Africa, and Asia fluctuated substantially, especially in central and southern South America, and the suitable distribution zones for beetles expanded and contracted clearly. The total area of the spatially suitable regions for the five scales continuously decreased from the first period to the fifth period, and approximately 11.72 × 10⁷ km2 and 6.85× 10⁷ km2 were then obtained for 1970-1980 and 2010-2020, respectively. This most dramatic trend may reflect the significant influence of climate changes on the habitat in which beetles live. We clearly observed that the overall spatial suitable distribution of the beetles changed from scattered to relatively concentrated, indicating that some association between elevation and beetles may exist. In other words, some areas that are very sensitive to global warming may suffer more from more of the potential for disappearance, although protective measures have been taken by humans.
3.2 Spatial dynamics of priority zones
To better address the increasingly significant threat of habitat loss, 36 geographical regions were identified as conservation priorities and named biodiversity hotspots. For each ten-year period, the spatially suitable distribution in biodiversity hotspots was determined by using ArcGIS 10.4 to cover them in suitable habitats of beetles around the world. Next, we mapped the geographic distributions for beetles in biodiversity hotspots to explore the spatial dynamics of these populations. Specifically, some priority areas were obtained by using the intersect tool to overlay the biodiversity hotspots and the suitable regions received with spatial niche models (Figure 2). For coleopteran, the distribution of spatial suitability was relatively average while still retaining the overall distribution dynamics. Southern Europe and North America have always been the focus of distribution for decades, indicating the stability of distribution, although climate change exacerbated the degradation of habitat. In southern Asia, the number of priority areas was concentrated at the border between China and other countries, which may be attributed to the strong enforcement of conservation measures. In South America, the suitable zones of beetles changed considerably, while sporadic distributions in Africa were always present. We hypothesize that small populations of beetles in fragmented and isolated habitat patches may face a high risk of local extinction. In total, the distribution of priority areas was similar to the global suitability of beetles, and their area also fluctuated to a certain extent.
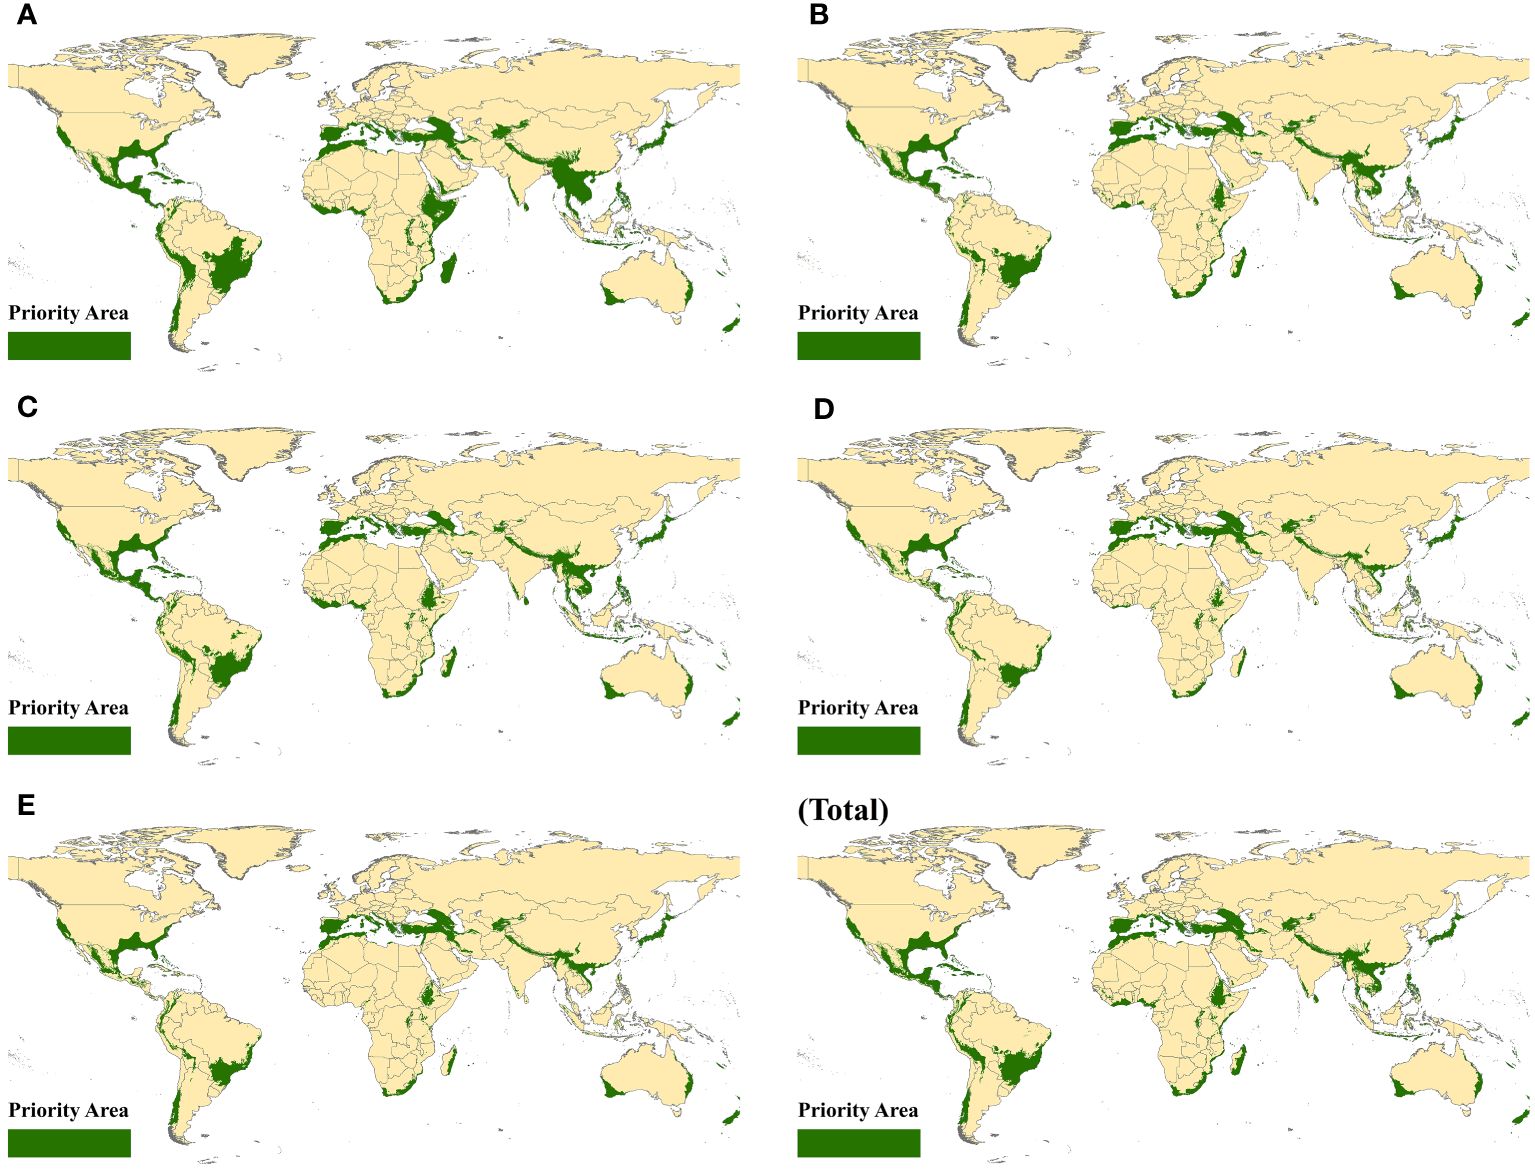
Figure 2 Priority suitable areas in biodiversity hotspots. (A) 1970–1980, (B) 1980–1990, (C) 1990–2000, (D) 2000–2010, (E) 2010–2020, and (Total) 1970–2020.
Then, we counted the distribution area of suitable regions in hotspots on each decadal scale. The total areas of selected priority habitats for A, B, C, D, E, and Total were 2.76×10⁷ km2, 2.03×10⁷ km2, 2.14×10⁷ km2, 1.66×10⁷ km2, 1.65×10⁷ km2, and 2.16×10⁷ km2, respectively. In 1970-1980, the suitable areas covered by hotspots were mostly for decades and corresponded to 23.58% of the overall suitable area in this period. Notably, the performance of 1990-2000 was excellent, with approximately 27.15% of the suitable zones being identified. In the context of various periods, approximately no more than 30% of the habitat was comparatively better for beetles located in hotspots, and they generally showed a downward trend (Figure 3).
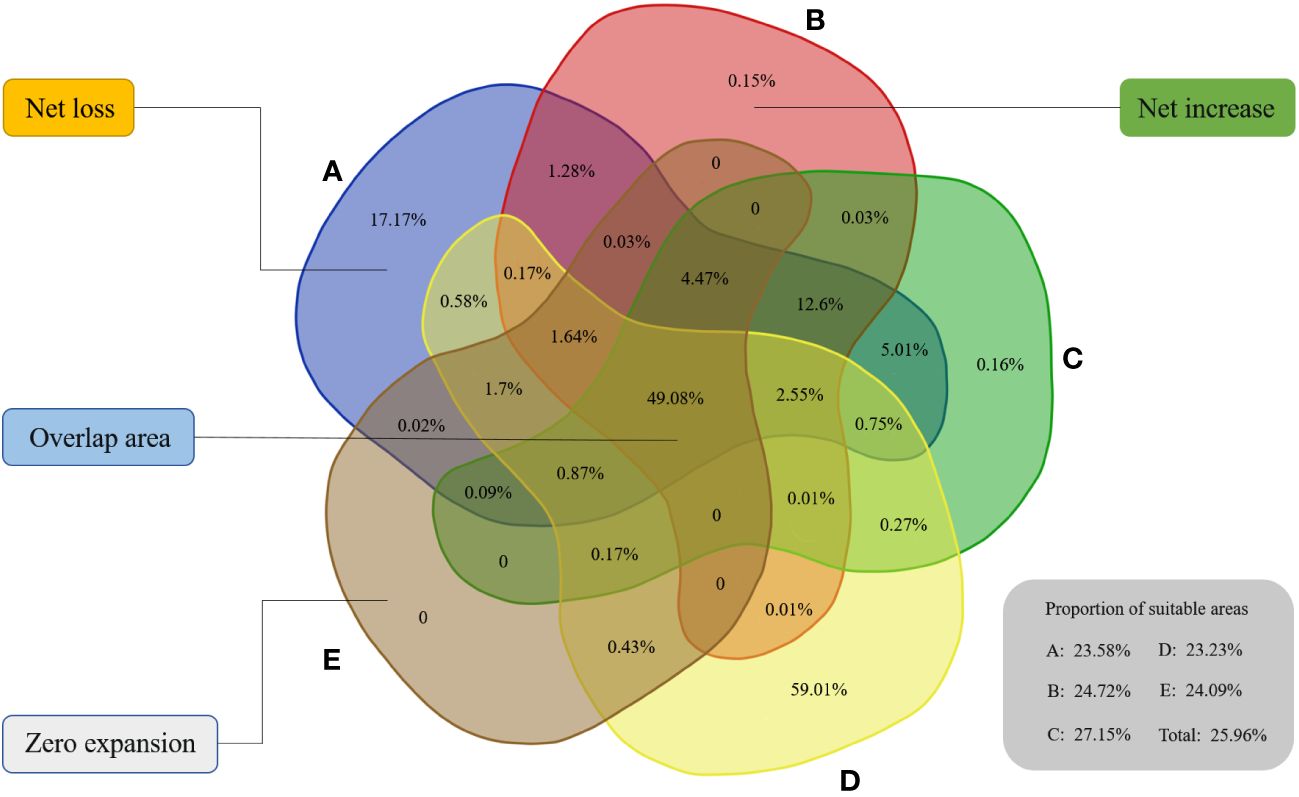
Figure 3 Spatial distribution dynamics of five time scales in biodiversity hotspots. The proportion of suitable areas in biodiversity hotspots for six scales is shown in this figure. (A) 1970–1980, (B) 1980–1990, (C) 1990–2000, (D) 2000–2010, (E) 2010–2020.
To better observe the dynamic changes from one period to the next, we used a Venn diagram to compare them in the basis of habitat suitable for beetles. Ultimately, approximately 49.08% of the suitable zones remained constant during each transition in the five stages (Figure 3), indicating that these regions had greater survival advantages for beetles. From A to B, 0.2% of the geographic suitable regions increased, while approximately 26.19% of the suitable habitat disappeared due to a variety of reasons. Then, we obtained 7.32% of the new suitable regions, and approximately 0.16% of the areas among them were completely new when transitioning to the third stage. Fortunately, 59.01% of the new distribution areas metamorphosed into suitable regions when entering the 21st century, which may be because the biodiversity hotspots in this stage were being established. Apparently, many habitats were recuperated after launching this initiative, which greatly increased the biodiversity of habitat and further encourage beetle reproduction.
3.3 Congruence evaluation between spatial suitability and hotspots
According to the statistical results of suitable areas in biodiversity hotspots, we generated a bar chart for every ten-year period to compare the area distribution of each hotspot. The top ten hotspots were identified based on the area of spatial geographic distribution, and three critical hotspots and the proportion of suitable areas occupied by them were determined (Figure 4). The Mediterranean Basin was the best region in this assessment, especially in 2000-2010, and had the most suitable habitat for beetles. Other hotspots, including Indo-Burma, North American Coastal Plain, Cerrado, and Irano-Anatolian, had a higher degree of suitability for the survival of beetles, and most of them were located in Europe, North America, and Asia. In 1970-1980, the Mediterranean Basin (11.74%), Indo-Burma (9.84%), and Cerrado (7.78%) included most of the suitable regions, while others, such as the North American Coastal Plain, Atlantic Forest, Tropical Andes, Mesoamerica, Hoern of Africa, Irano-Anatolian, and Caucasus, were relatively even. For D and E, the difference between various hotspots was somewhat large. In addition, some hotspots, including the Mediterranean Basin, Indo-Burma, and North American Coastal Plain, were comparatively stable when compared with others, such as Japan, Mesoamerica, Atlantic Forest, Himalaya, Mountains of Central Asia, and Chilean Winter Rainfall and Valdivian Forests. Consequently, the numbers of hotspot zones exhibited spatial dynamics in the different periods due to climate change. The areas described above with greater volatility may face greater pressure and challenges, indicating that local disappearance may occur for beetle communities.
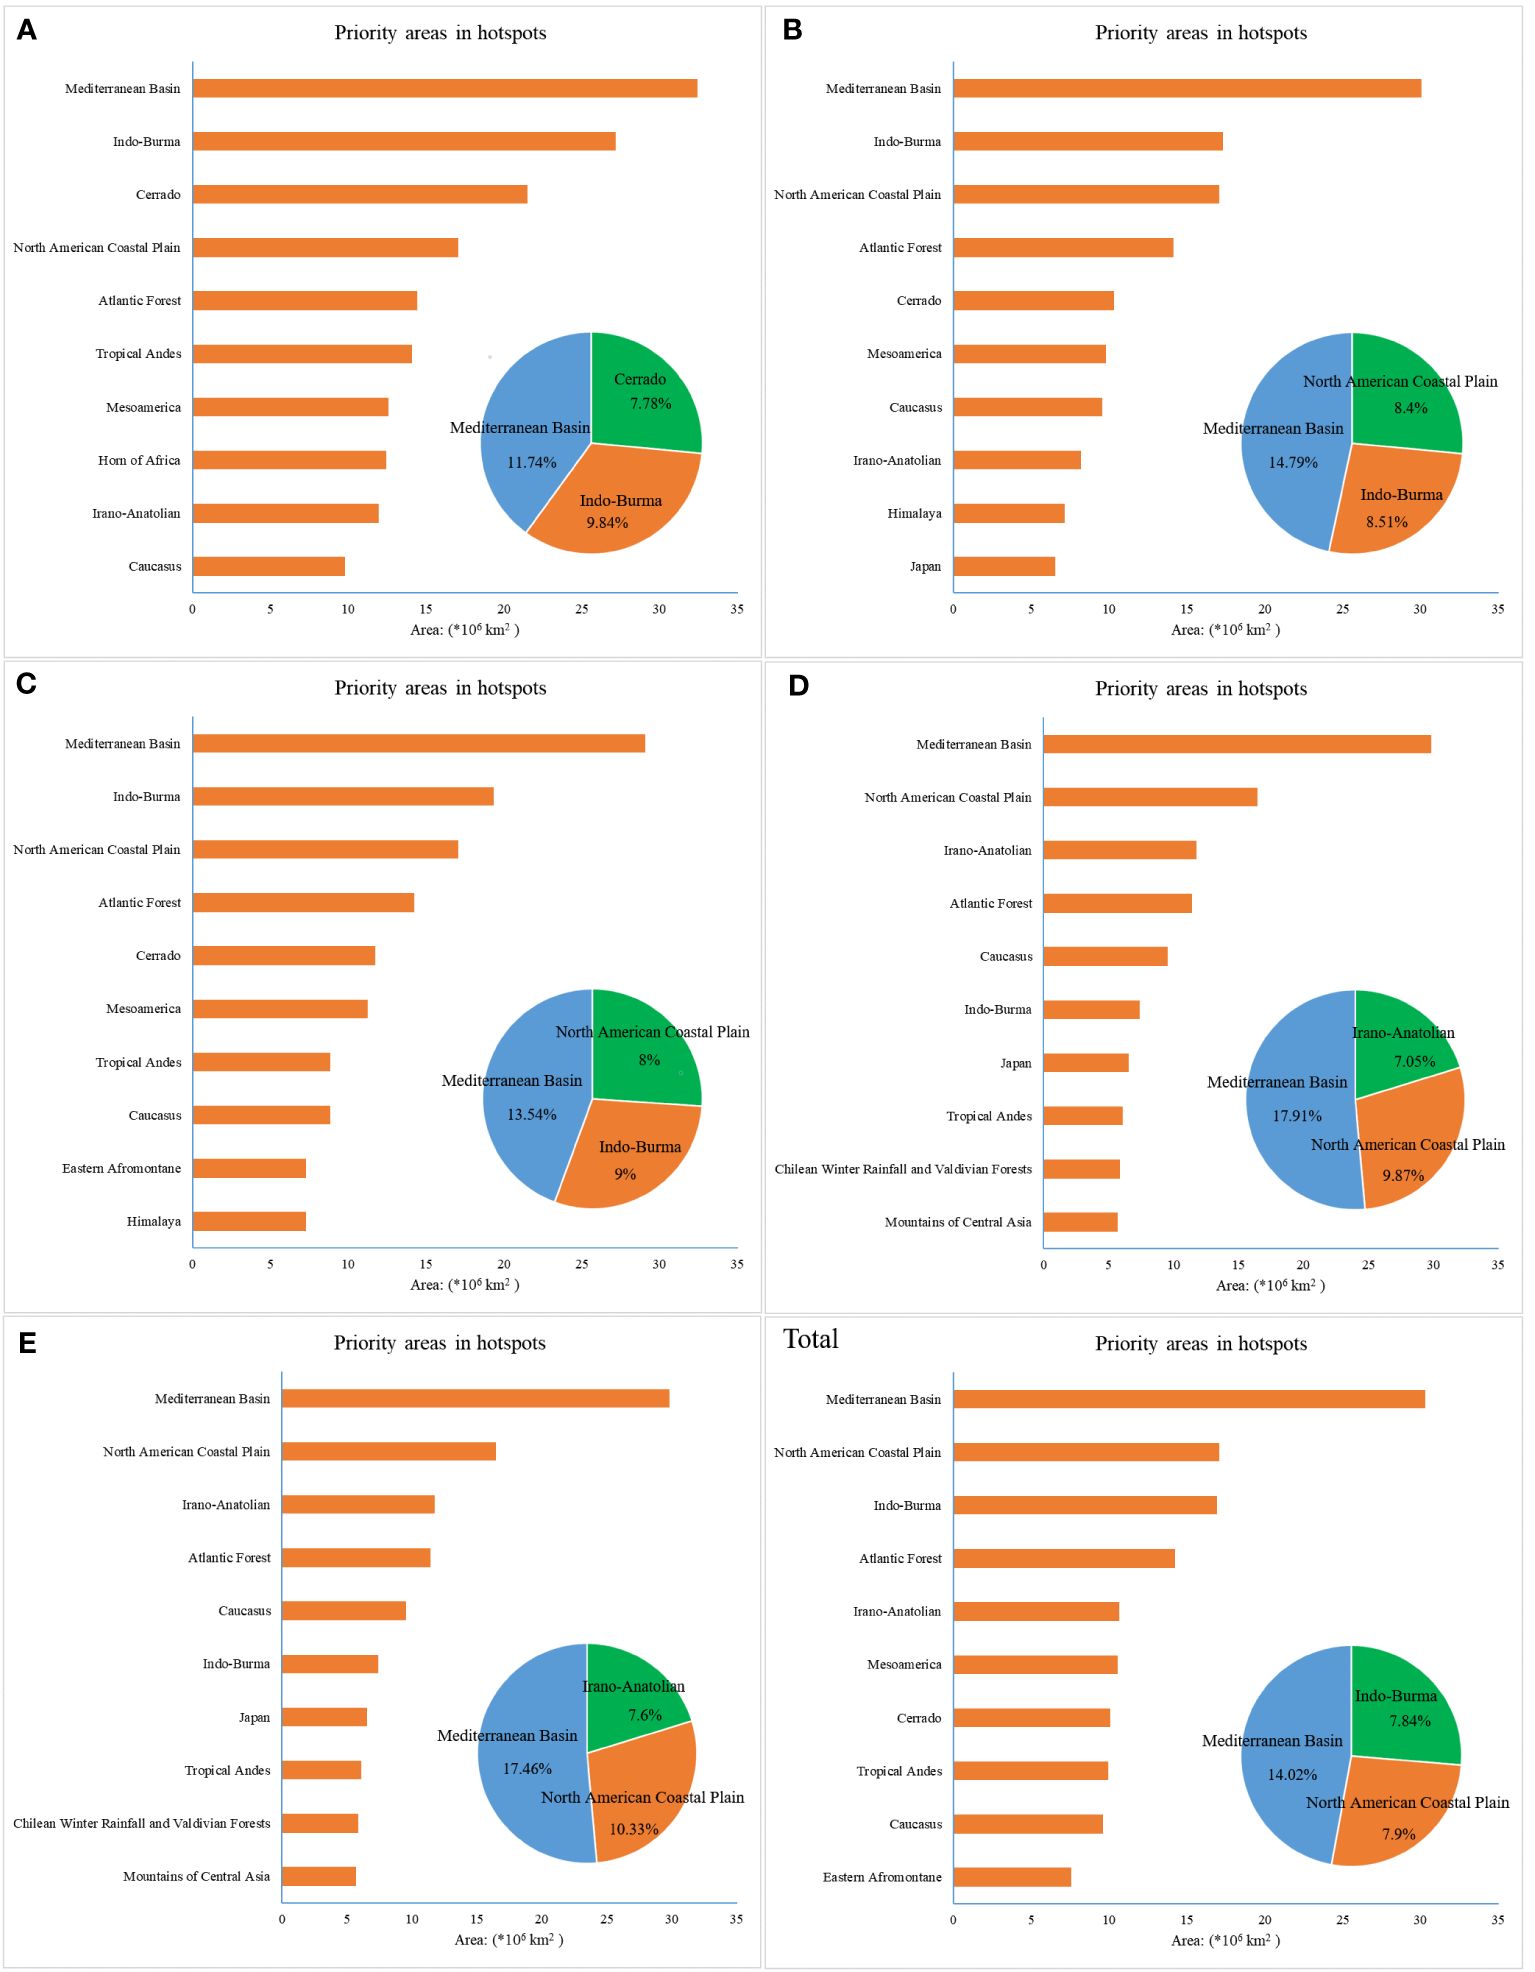
Figure 4 Priority areas in hotspots under six time scales. (A) 1970–1980, (B) 1980–1990, (C) 1990–2000, (D) 2000–2010, (E) 2010–2020, and (Total) 1970–2020.
Therefore, the biodiversity hotspots of the three levels were obtained after comprehensively evaluating the changes in hotspots to distinguish the suitable dynamics of different hotspots at different ten-year scales. Specifically, a hotspot was selected as excellent if it appeared more than four times in the six periods (A, B, C, D, E, and Total) and was in the top ten on the scale of occurrences. Then, we determined other hotspots on the basis of the degree of stability of these hotspots at five scales (A, B, C, D, and E). We considered these hotspots with little fluctuation to be stable, while the identification of lower hotspots depended on the trend of overall decrease (Supplementary Figure S2). Finally, approximately 25% of hotspots (Mediterranean Basin, Indo-Burma, Irano-Anatolian, Mesoamerica, Atlantic Forest, Caucasus, Cerrado, Tropical Andes, and North American Coastal Plain) were determined to be excellent regions (Figure 5). Among them, five biodiversity hotspots, including the Mediterranean Basin, Indo-Burma, Mesoamerica, Cerrado, and Tropical Andes, generally decreased, but the suitable distribution of these hotspots was widespread, especially in the Mediterranean Basin, Indo-Burma and Cerrado. Therefore, corresponding vigilance should be considered, although these regions are significant for beetle reproduction and dispersal. Furthermore, a total of ten (28%) and seventeen (47%) hotspot regions were deemed stable and lower, respectively. We can clearly see that most stable hotspots covered many sea areas, which is a key reason why these zones were identified as stable regions. Owing to proximity to the ocean, the combination of the low influence of human interference on habitat fragmentation and insusceptibility of endemic biodiversity to climate change has resulted in a smooth evolution of the beetles’ habitat suitability. For seventeen lower hotspots, the fragmentation of the landscape should be given more attention by managers, and sufficient eco-compensation payments and more conservation measures, such as reforestation or habitat recovery, could be implemented to reduce extinction possibilities.
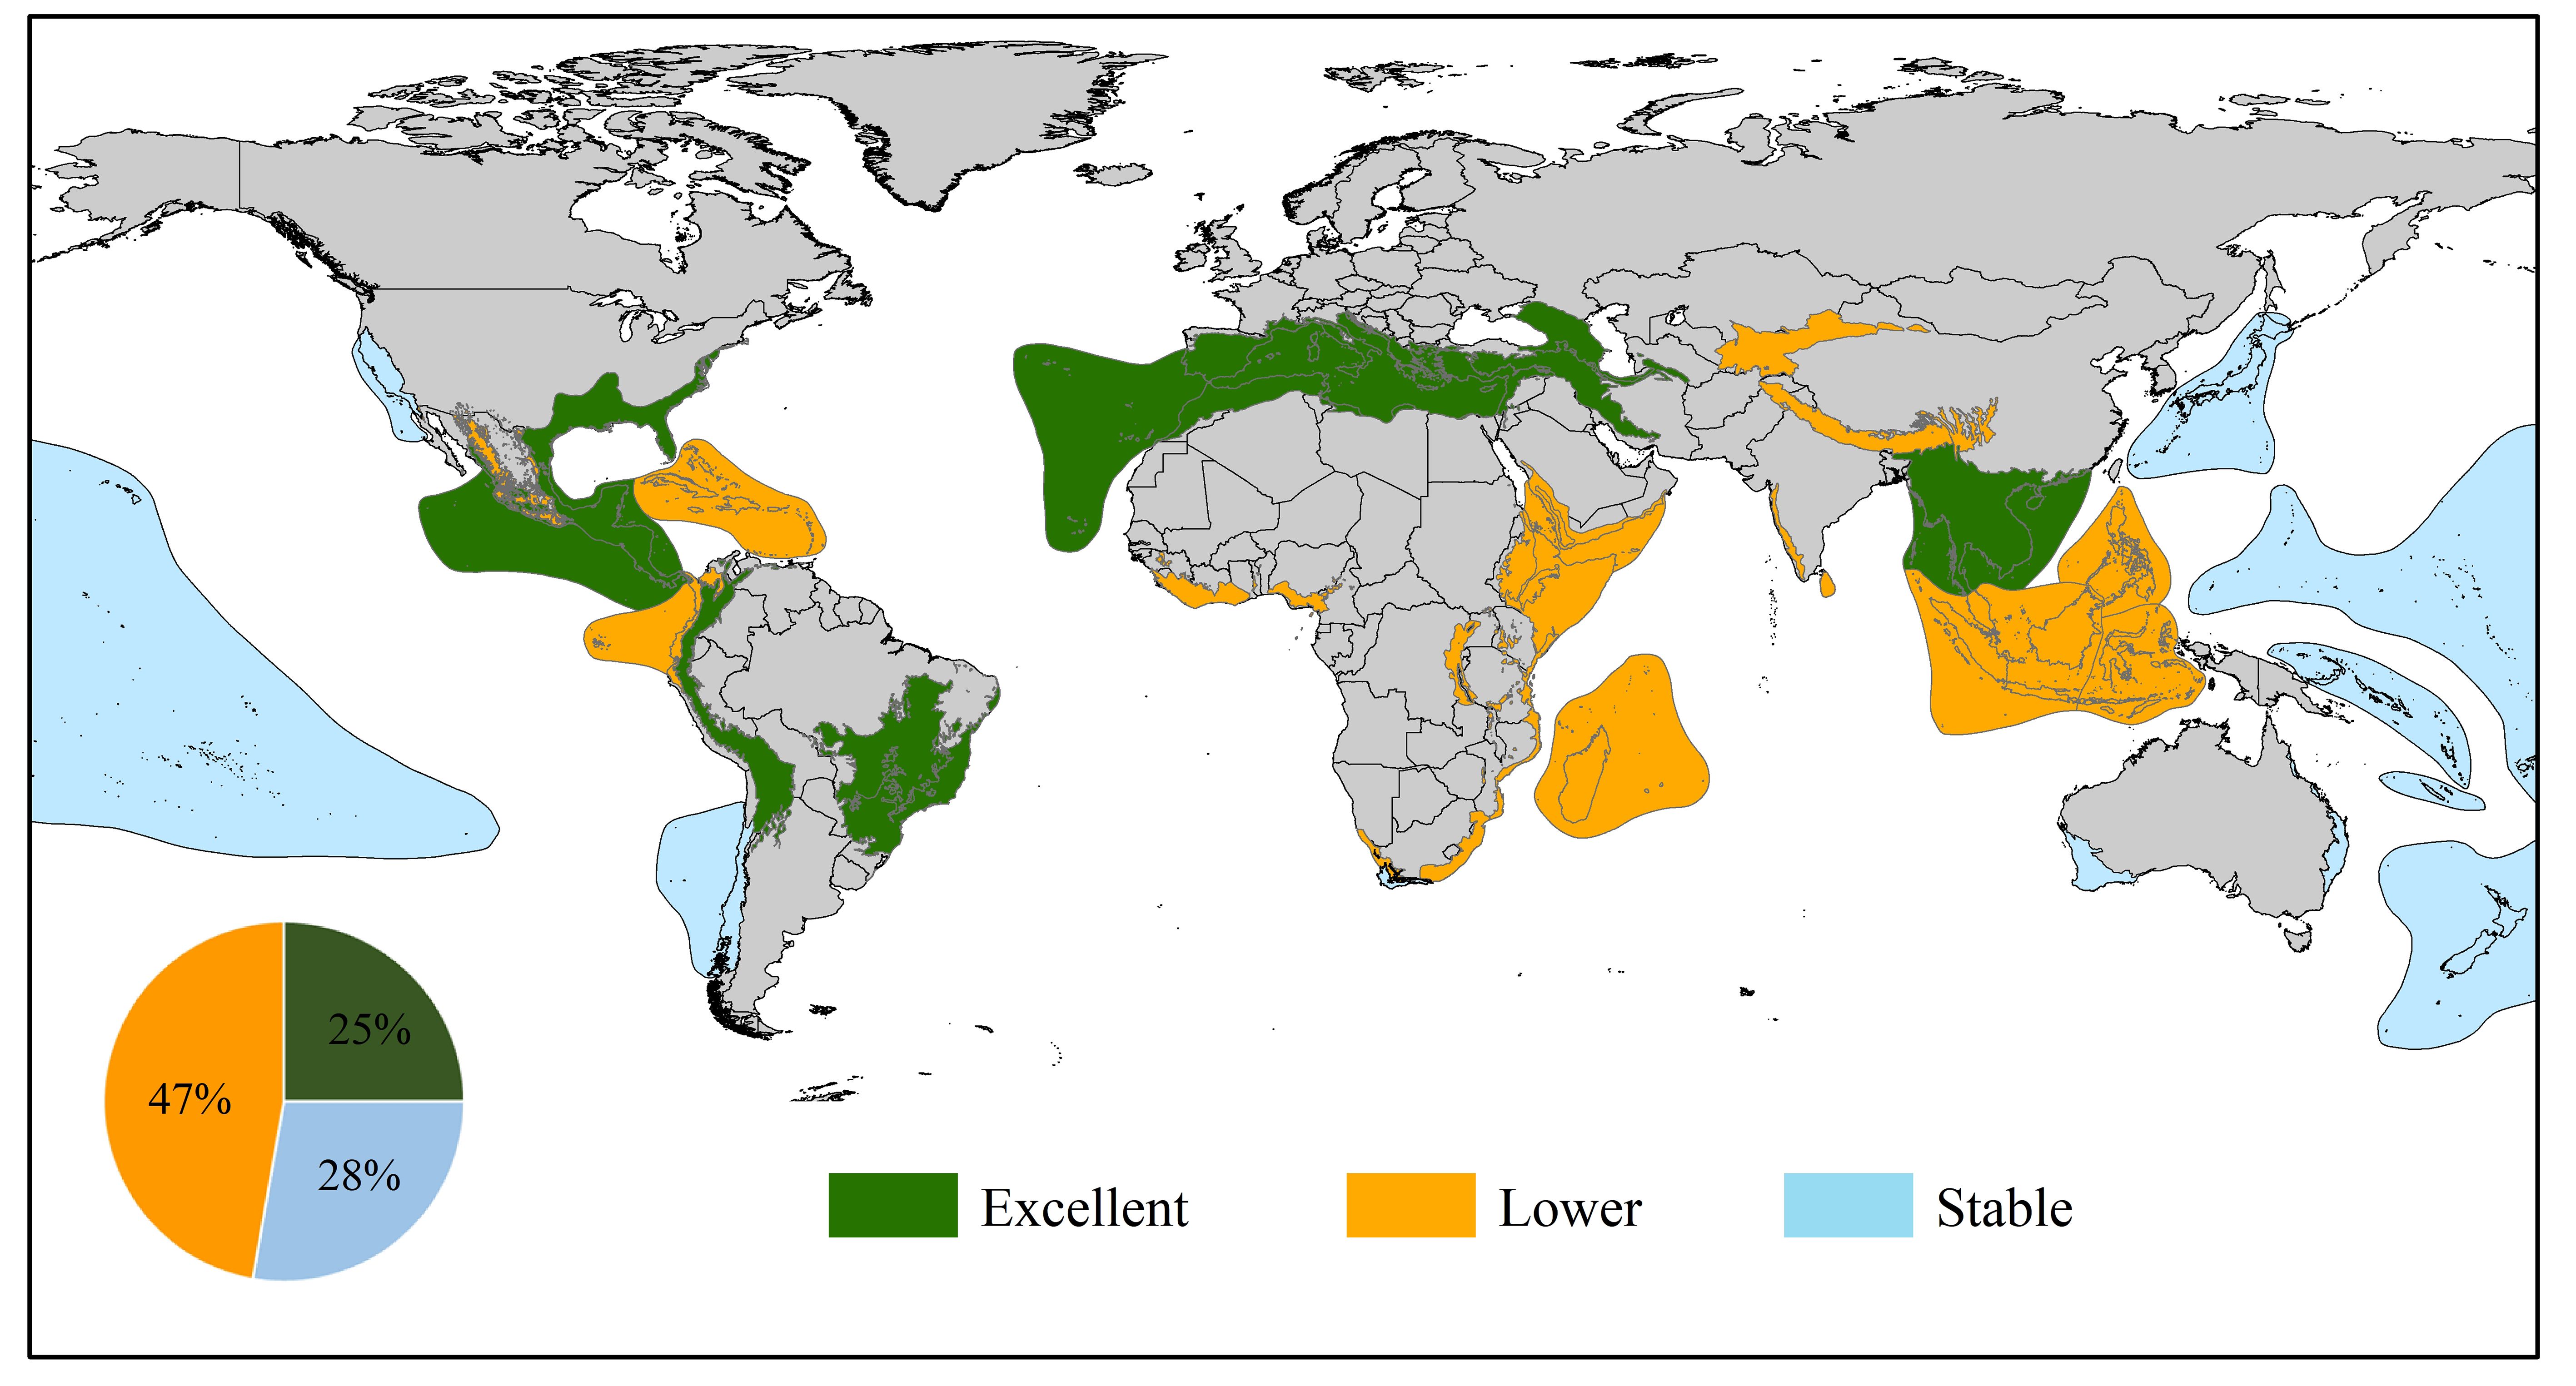
Figure 5 Three levels of biodiversity hotspots identified. The excellent hotspots represent the areas with the highest biodiversity, the lower hotspots indicate the regions where biodiversity has been or is vulnerable to destruction, and the stable means that biodiversity in these regions has not fluctuated much over the past few decades.
The purpose of this study was to propose informative suggestions based on our results to better protect biodiversity hotspots. For beetles, the degree of suitability for survival often depends on the species richness in the forest, especially the vegetation diversity. Therefore, constructive suggestions for forest restoration are provided based on the suitability distributions of beetles. We carried out this exercise: a series of spatial suitability distribution maps of hotspot areas at six ten-year scales (A, B, C, D, E, and Total) are produced (Supplementary Figures S3-S5). Then, the geographic distribution dynamics of each hotspot for beetles from 1970 to 2020 was clearly observed. Intriguingly, some regions experienced substantial expansion and contraction, such as the Cerrado, Coastal Forest of Eastern Africa, Guinean Forest of West Africa, Horn of Africa, Mountains of Southwest China, the Philippines, Succulent Karoo, Sundaland, Tumbes-Choco-Magdalena, and Wallacea. However, some hotspots, including the Mountains of Southwest China, Succulent Karoo, and others, eventually tended to have a stable suitability distribution. In the Mediterranean Basin, the suitable habitat areas of landmasses had a high degree of consistency across six timescales for countries such as Spain, Morocco, Algeria, Italy, Greece, and Turkey, although large swaths of oceans were identified as hotspots. For the Coastal Forest of Eastern Africa, Guinean Forest of West Africa, and Horn of Africa, the dynamic changes in beetle habitats were surprisingly dramatic. Climate change, human interference, and the vulnerability of the original ecology contributed to large areas of local habitat loss, and conservation and restoration measures should be implemented in local countries, including Somalia, Kenya, Ghana, Nigeria, Liberia, and Mozambique.
4 Discussion
To identify the level of complexity warranted, quantitative evaluation constitutes a significant component of distribution modeling, and the selection of optimal models was based on the results of evaluating various levels of complexity, resulting in different parameter combinations for different species under different times and spaces (Warren and Seifert, 2011; Radosavljevic and Anderson, 2014; Cobos et al., 2019; Kass et al., 2021). In our study, the complexity of the MaxEnt model became a critical part of obtaining a suitable distribution of Coleoptera in the context of 1970 to 2020, with temperature and precipitation as important driving factors. We determined different parameter combinations for beetles to simulate the comprehensive distribution under current climate changes. Unsurprisingly, model performance was effectively improved, as reflected in the model evaluation metrics (AUC≥0.85) and the agreement between the potential and actual distribution of beetles. Ultimately, we coupled current biodiversity hotspots with potential distributions to model the spatial priorities of beetles, and the consistency between them was assessed. This study also revealed the extinction risk of beetles in every biodiversity hotspot and the spatial dynamics of changes. Due to the high human interference of hotspots, we paid particular attention to some regions whose extinction risk in local habitat was correspondingly higher.
Our study indicated that ≤30% of the suitable zones in every ten-year period fell within the biodiversity hotspots, while the majority of suitable habitat were outside the hotspots, which did not mean that these suitable regions were not ecologically significant. In contrast, a higher suitability may occur in some other regions, but more concentrated manifestations were found in biodiversity hotspot areas because the delineation of hotspots contains more ecological significance (Cincotta et al., 2000; Marchese, 2015; Grande et al., 2020). Not only are these regions especially rich in endemic species and particularly threatened by human interference, but the largest sum was assigned to a single protection project (Norman, 2003). We clearly observed that most of Earth’s biodiversity is found in hotspots, and over 150,000 endemic plant species and approximately 13,000 endemic terrestrial vertebrates are sheltered (Bellard et al., 2014; Habel et al., 2019). However, the survival of insects and the richness of biodiversity go hand in hand, and thousands of modern insect extinctions are estimated to have occurred, which are the consequences of silent habitat loss and endemic biodiversity extinction (Dunn, 2005; Fonseca, 2009). The island biogeography theory proposed by Janzen (1968) states that any reduction in a plant species will result in a decrease in the richness of insect fauna. Direct conservation efforts have not been focused on insects. Therefore, we simulated the spatial distribution dynamics for Coleoptera, the largest order of insects, to explore the laws of changes and propose conservation recommendations. The results of this study indicated that the integrated suitability of beetles outside or in hotspots have similar dynamic changes. As the focus of distribution, Southern Europe and North America had a corresponding stability, while South America and Africa experienced a higher extinction risk, which may be attributed to climate changes, land use, and extensive growth of agriculture in recent decades (Higgins, 2007; Griffiths et al., 2010; Perrings and Halkos, 2015).
Although the overall distribution of suitable habitat in hotspots for beetles was relatively severe, these areas also demonstrated potential for beetle conservation and biodiversity restoration. Our results revealed that the potential areas for biodiversity improvement were 2.76×10⁷ km2, 2.03×10⁷ km2, 2.14×10⁷ km2, 1.66×10⁷ km2, 1.65×10⁷ km2, and 2.16×10⁷ km2 for A, B, C, D, E, and Total, respectively. In particular, approximately 49.08% (1.38×10⁷ km2) of fragmented habitat will strengthen forest restoration to increase carrying capacity. Thus, corresponding conservation and management measures should be implemented in some critical countries, including Spain, Turkey, Morocco, Italy, America, and Brazil. Natural recovery and reduction of human disturbance in these regions are significant measures, while a certain level of forest management monitoring should be implemented. For zones with a small but very concentrated distribution of suitable habitat, legislation should be strengthened to facilitate administration, and the further expansion of anthropogenic land must be reduced. Forest areas in these regions will continue to expand, diverse species may be reintroduced, and biodiversity will be improved to accommodate more populations in the long term. China, Chile, South Africa, Australia, and Japan are important countries to prioritize, and cross-border protection is a considerable initiative such as China, which will enhance connectivity between different suitable areas. For other scattered regions, implementing protection planning measures is a huge challenge as a result of fragmented suitability habitat, and many countries are involved. We must remind these countries, such as Mexico, Colombia, Feru, Bolivia, Ecuador, Iran, Kenya, and Tanrania, that attention should be given and that the fragmented suitable regions identified in this study will provide a useful reference for their conservation work.
Additionally, the Mediterranean Basin, Indo-Burma, Irano-Anatolian, and other excellent regions are optimistic. Local habitat restoration of forests and improvement of habitat connectivity for beetles can reduce the extinction risk and increase the population size. Most of beetles have difficulty traveling long distances (Ribak et al., 2013; Chen and Jackson, 2017; Javal et al., 2018). The beetle’s flight capacity is affected by environmental factors such as temperature, precipitation, elevation, and wind, so a significant influence produced by climate change on beetle dispersal and communication (Atkins, 1961; Evenden et al., 2014; Jones et al., 2019; Wijerathna and Evenden, 2020). This is also an important reason why the beetle’s suitable habitat is threatened. The restriction of dispersal and movement of insects can act at the individual to local ecosystem level and then affect the balance of the ecosystem (Loxdale and Lushai, 1999; Hore and Banerjee, 2017; Misso et al., 2017). Consequently, the improvement of fragmented habitat and local connectivity is imperative. Apparently, some conservation work is being carried out in an orderly manner, such as the construction of artificial log pyramids, the stumps colonized by a large tree transplanter, and a large-scale reintroduction of insects in Denmark (Tochtermann, 1987; Ebert, 2011; Méndez and Thomaes, 2021). Such protection measures specific to individual species are important for rare species and should be combined with measures such as afforestation and land use reduction to restore beetle habitat. All strategies, including increasing afforestation activities, reducing anthropogenic interference, and implementing other improvement measures, should be further implemented in different regions in combination with local management policies (Duffus et al., 2023). In addition, we recommend that the corresponding process of conservation work should consider the potential suitability habitat for species, which can indicate the direction and focus of future work.
According to the estimation areas for suitable regions in every biodiversity hotspot, the Cerrado, coastal forest of Eastern Africa, and others that experienced substantial expansion and contraction can formulate corresponding restoration measures combined with local forest distribution and biodiversity loss. Our results provide an important reference for their spatial dynamics and focus. As the first global study on the decadal spatial distribution of beetles, the dynamics of each biodiversity hotspot were expressed clearly. A detailed understanding of decade dynamics is crucial to evaluating the influence of climate change and anthropogenic threats to the suitable habitat of beetles, and we hope our study can provide useful references and recommendations for biodiversity conservation. In addition, some deficiencies exist for this study due to data limitations such as not every insect is adequately documented, substantial occurrence records from this database is significantly increasing from year to year, and the records keeping varies from region to region. All these limitations will affect the credibility and robustness of the model. Thus, our future work will focus on solving these challenges and collecting more accurate data, making our results more reliable.
Data availability statement
The original contributions presented in the study are publicly available. This data can be found here: https://datadryad.org/stash/share/gEt_wy0OztunonK733IACHX7FB54AJ_areUhv5Zm19c.
Ethics statement
This study does not contain any studies with human participants or animals performed by any of the authors.
Author contributions
PH: Writing – original draft, Writing – review & editing. MB: Data curation, Formal Analysis, Funding acquisition, Methodology, Project administration, Resources, Software, Supervision, Validation, Visualization, Writing – review & editing. LL: Formal Analysis, Funding acquisition, Investigation, Project administration, Resources, Software, Validation, Visualization, Writing – review & editing. YL: Conceptualization, Data curation, Formal Analysis, Funding acquisition, Investigation, Project administration, Resources, Software, Validation, Visualization, Writing – review & editing. JL: Data curation, Formal Analysis, Funding acquisition, Methodology, Project administration, Resources, Supervision, Validation, Visualization, Writing – review & editing. ZY: Conceptualization, Formal Analysis, Funding acquisition, Investigation, Project administration, Resources, Software, Validation, Visualization, Writing – review & editing.
Funding
The author(s) declare that financial support was received for the research, authorship, and/or publication of this article. This work was supported by National Key R&D Program of China (Grant No. 2022YFC2601200); the National Science & Technology Fundamental Resources Investigation Program of China (Nos. 2022FY100500, 2019FY100400, 2019FY101800); National Science Foundation of China (No. 32270468); the project of the Northeast Asia Biodiversity Research Center (NABRI202203); the Bureau of International Cooperation, Chinese Academy of Sciences; GDAS Special Project of Science and Technology Development (Nos. 2020GDASYL-20200102021, 2020GDASYL-20200301003); Wuyishan National Park Biological Resources Background Investigation Project; Guizhou Science and Technology Planning Project (General support-2022-173).
Acknowledgments
I wish to express gratitude to all the authors of this study; all of them provided helpful advice for writing our manuscript.
Conflict of interest
The authors declare that the research was conducted in the absence of any commercial or financial relationships that could be construed as a potential conflict of interest.
Publisher’s note
All claims expressed in this article are solely those of the authors and do not necessarily represent those of their affiliated organizations, or those of the publisher, the editors and the reviewers. Any product that may be evaluated in this article, or claim that may be made by its manufacturer, is not guaranteed or endorsed by the publisher.
Supplementary material
The Supplementary Material for this article can be found online at: https://www.frontiersin.org/articles/10.3389/fevo.2024.1358914/full#supplementary-material
References
Aidoo O. F., Souza P. G. C., da Silva R. S., Santana P. A. Jr., Picanço M. C., Kyerematen R., et al. (2022). Climate-induced range shifts of invasive species (Diaphorina citri Kuwayama). Pest Manage. Sci. 78, 2534–2549. doi: 10.1002/ps.6886
Aiello-Lammens M. E., Boria R. A., Radosavljevic A., Vilela B., Anderson R. P. (2015). spThin: an R package for spatial thinning of species occurrence records for use in ecological niche models. Ecography 38, 541–545. doi: 10.1111/ecog.01132
Atkins M. D. (1961). A study of the flight of the Douglas-fir beetle Dendroctonus pseudotsugae Hopk. (Coleoptera: Scolytidae): III flight capacity. Can. Entomol. 93, 467–474. doi: 10.4039/Ent93467-6
Bellard C., Leclerc C., Leroy B., Bakkenes M., Veloz S., Thuiller W., et al. (2014). Vulnerability of biodiversity hotspots to global change. Global Ecol. Biogeogr. 23, 1376–1386. doi: 10.1111/geb.12228
Cardoso P., Barton P. S., Birkhofer K., Chichorro F., Deacon C., Fartmann T., et al. (2020). Scientists’ warning to humanity on insect extinctions. Biol. Conserv. 242, 108426. doi: 10.1016/j.biocon.2020.108426
Ceballos G., Ehrlich P. R. (2006). Global mammal distributions, biodiversity hotspots, and conservation. Proc. Natl. Acad. Sci. 103, 19374–19379. doi: 10.1073/pnas.0609334103
Changjun G., Yanli T., Linshan L., Bo W., Yili Z., Haibin Y., et al. (2021). Predicting the potential global distribution of Ageratina adenophora under current and future climate change scenarios. Ecol. Evol. 11, 12092–12113. doi: 10.1002/ece3.7974
Chen H., Jackson P. L. (2017). Climatic conditions for emergence and flight of mountain pine beetle: implications for long-distance dispersal. Can. J. For. Res. 47, 974–984. doi: 10.1139/cjfr-2016-0510
Chowdhury S., Zalucki M. P., Amano T., Woodworth B. K., Venegas-Li R., Fuller R. A. (2021). Seasonal spatial dynamics of butterfly migration. Ecol. Lett. 24, 1814–1823. doi: 10.1111/ele.13787
Cincotta R. P., Wisnewski J., Engelman R. (2000). Human population in the biodiversity hotspots. Nature 404, 990–992. doi: 10.1038/35010105
Cobos M. E., Peterson A. T., Barve N., Osorio-Olvera L. (2019). kuenm: an R package for detailed development of ecological niche models using Maxent. PeerJ 7, e6281. doi: 10.7717/peerj.6281
Dainese M., Martin E. A., Aizen M. A., Albrecht M., Bartomeus I., Bommarco R., et al. (2019). A global synthesis reveals biodiversity-mediated benefits for crop production. Sci. Adv. 5, eaax0121. doi: 10.1126/sciadv.aax0121
Davies P. M. (2010). Climate change implications for river restoration in global biodiversity hotspots. Restor. Ecol. 18, 261–268. doi: 10.1111/rec.2010.18.issue-3
Duffus N. E., Echeverri A., Dempewolf L., Noriega J. A., Furumo P. R., Morimoto J. (2023). The present and future of insect biodiversity conservation in the Neotropics: Policy gaps and recommendations. Neotropical. Entomol. 52, 407–421. doi: 10.1007/s13744-023-01031-7
Dunn R. R. (2005). Modern insect extinctions, the neglected majority. Conserv. Biol. 19, 1030–1036. doi: 10.1111/j.1523-1739.2005.00078.x
Ebert J. (2011). Umsiedlungserfolg von Larven des Hirschkäfers: Ergebnisse einer fünfjährigen Schlüpf-Kontrolle. Naturschutz. und. Landschaftsplanung. 43, 92–93.
Elizalde L., Arbetman M., Arnan X., Eggleton P., Leal I. R., Lescano M. N., et al. (2020). The ecosystem services provided by social insects: traits, management tools and knowledge gaps. Biol. Rev. 95, 1418–1441. doi: 10.1111/brv.12616
Elliott J. M. (2008). The ecology of riffle beetles (Coleoptera: Elmidae). Freshw. Rev. 1, 189–203. doi: 10.1608/FRJ-1.2.4
Evenden M. L., Whitehouse C. M., Sykes J. (2014). Factors influencing flight capacity of the mountain pine beetle (Coleoptera: Curculionidae: Scolytinae). Environ. Entomol. 43, 187–196. doi: 10.1603/EN13244
Farashi A., Kaboli M., Karami M. (2013). Predicting range expansion of invasive raccoons in northern Iran using ENFA model at two different scales. Ecol. Inf. 15, 96–102. doi: 10.1016/j.ecoinf.2013.01.001
Farashi A., Shariati M. (2017). Biodiversity hotspots and conservation gaps in Iran. J. Nat. Conserv. 39, 37–57. doi: 10.1016/j.jnc.2017.06.003
Fattorini S. (2011). Insect extinction by urbanization: a long term study in Rome. Biol. Conserv. 144, 370–375. doi: 10.1016/j.biocon.2010.09.014
Fick S. E., Hijmans R. J. (2017). WorldClim 2: new 1-km spatial resolution climate surfaces for global land areas. Int. J. Climatol. 37, 4302–4315. doi: 10.1002/joc.5086
Fonseca C. R. (2009). The silent mass extinction of insect herbivores in biodiversity hotspots. Conserv. Biol. 23, 1507–1515. doi: 10.1111/j.1523-1739.2009.01327.x
Ghannem S., Touaylia S., Boumaiza M. (2018). Beetles (Insecta: Coleoptera) as bioindicators of the assessment of environmental pollution. Hum. Ecol. Risk Assessment.: Int. J. 24, 456–464. doi: 10.1080/10807039.2017.1385387
Gössling S. (2002). Funds for biodiversity. Environ. Conserv. 29, 411–413. doi: 10.1017/S0376892902000309
Grande T. O., Aguiar L., MaChado R. B. (2020). Heating a biodiversity hotspot: connectivity is more important than remaining habitat. Landscape Ecol. 35, 639–657. doi: 10.1007/s10980-020-00968-z
Griffiths C. L., Robinson T. B., Lange L., Mead A. (2010). Marine biodiversity in South Africa: an evaluation of current states of knowledge. PloS One 5, e12008. doi: 10.1371/journal.pone.0012008
Habel J. C., Rasche L., Schneider U. A., Engler J. O., Schmid E., Rödder D., et al. (2019). Final countdown for biodiversity hotspots. Conserv. Lett. 12, e12668. doi: 10.1111/conl.12668
Halsch C. A., Shapiro A. M., Fordyce J. A., Nice C. C., Thorne J. H., Waetjen D. P., et al. (2021). Insects and recent climate change. Proc. Natl. Acad. Sci. 118, e2002543117. doi: 10.1073/pnas.2002543117
Higgins P. A. (2007). Biodiversity loss under existing land use and climate change: an illustration using northern South America. Global Ecol. Biogeogr. 16, 197–204. doi: 10.1111/j.1466-8238.2006.00278.x
Hore G., Banerjee D. (2017). Necrophagous flies (Insecta: Diptera) and their role in maintaining ecosystem balance. ENVIS. Centre. Faunal. Diver. 23, 2–6. Available at: https://www.researchgate.net/publication/319353787.
Hrdina A., Romportl D. (2017). Evaluating global biodiversity hotspots–Very rich and even more endangered. J. Landscape Ecol. 10, 108–115. doi: 10.1515/jlecol-2017-0013
Janzen D. H. (1968). Host plants as islands in evolutionary and contemporary time. Am. Nat. 102, 592–595. doi: 10.1086/282574
Javal M., Roux G., Roques A., Sauvard D. (2018). Asian Long-horned Beetle dispersal potential estimated in computer-linked flight mills. J. Appl. Entomol. 142, 282–286. doi: 10.1111/jen.12408
Jepson P., Canney S. (2001). Biodiversity hotspots: hot for what? Global Ecol. Biogeogr. 10, 225–227. doi: 10.1046/j.1466-822X.2001.00255.x
Jha S., Bawa K. S. (2006). Population growth, human development, and deforestation in biodiversity hotspots. Conserv. Biol. 20, 906–912. doi: 10.1111/j.1523-1739.2006.00398.x
Jones K. L., Shegelski V. A., Marculis N. G., Wijerathna A. N., Evenden M. L. (2019). Factors influencing dispersal by flight in bark beetles (Coleoptera: Curculionidae: Scolytinae): from genes to landscapes. Can. J. For. Res. 49, 1024–1041. doi: 10.1139/cjfr-2018-0304
Kass J. M., Muscarella R., Galante P. J., Bohl C. L., Pinilla-Buitrago G. E., Boria R. A., et al. (2021). ENMeval 2.0: Redesigned for customizable and reproducible modeling of species’ niches and distributions. Methods Ecol. Evol. 12, 1602–1608. doi: 10.1111/2041-210X.13628
Kidane Y. O., Steinbauer M. J., Beierkuhnlein C. (2019). Dead end for endemic plant species? A biodiversity hotspot under pressure. Global Ecol. Conserv. 19, e00670. doi: 10.1016/j.gecco.2019.e00670
Kong L., Xu W., Xiao Y., Pimm S. L., Shi H., Ouyang Z. (2021). Spatial models of giant pandas under current and future conditions reveal extinction risks. Nat. Ecol. Evol. 5, 1309–1316. doi: 10.1038/s41559-021-01520-1
Loxdale H. D., Lushai G. (1999). Slaves of the environment: the movement of herbivorous insects in relation to their ecology and genotype. Philos. Trans. R. Soc. London. Ser. B.: Biol. Sci. 354, 1479–1495. doi: 10.1098/rstb.1999.0492
Marchese C. (2015). Biodiversity hotspots: A shortcut for a more complicated concept. Global Ecol. Conserv. 3, 297–309. doi: 10.1016/j.gecco.2014.12.008
Méndez M., Thomaes A. (2021). Biology and conservation of the European stag beetle: Recent advances and lessons learned. Insect Conserv. Diversity 14, 271–284. doi: 10.1111/icad.12465
Merow C., Smith M. J., Silander J. A. Jr. (2013). A practical guide to MaxEnt for modeling species’ distributions: what it does, and why inputs and settings matter. Ecography 36, 1058–1069. doi: 10.1111/j.1600-0587.2013.07872.x
Misso R., Shakir H. S. H., Cesaretti G. P. (2017). “Ecological Human Imprint: Global Agro Ecosystem, Balance of Human Race with Nature and Economic Sustainability,” in Ecological Human Imprint: Global Agro Ecosystem, Balance of Human Race with Nature and Economic Sustainability, Rivista di studi sulla sostenibilità: VII, 2, 7–30.
Mittermeier R. A., Turner W. R., Larsen F. W., Brooks T. M., Gascon C. (2011). “Global biodiversity conservation: the critical role of hotspots,” in Biodiversity hotspots (Springer, Berlin, Heidelberg), 3–22.
Moir M. L. (2021). Coextinction of Pseudococcus markharveyi (Hemiptera: Pseudococcidae): A case study in the modern insect extinction crisis. Austral Entomol. 60, 89–97. doi: 10.1111/aen.12506
Myers N., Mittermeier R. A., Mittermeier C. G., Da Fonseca G. A., Kent J. (2000). Biodiversity hotspots for conservation priorities. Nature 403, 853–858. doi: 10.1038/35002501
Nichols E., Spector S., Louzada J., Larsen T., Amezquita S., Favila M. E., et al. (2008). Ecological functions and ecosystem services provided by Scarabaeinae dung beetles. Biol. Conserv. 141, 1461–1474. doi: 10.1016/j.biocon.2008.04.011
Noriega J. A., Floate K. D., Génier F., Reid C. A., Kohlmann B., Horgan F. G., et al. (2020). Global distribution patterns provide evidence of niche shift by the introduced African dung beetle Digitonthophagus gazella. Entomol. Experimentalis. Applicata. 168, 766–782. doi: 10.1111/eea.12961
Noriega J. A., Hortal J., Azcárate F. M., Berg M. P., Bonada N., Briones M. J., et al. (2018). Research trends in ecosystem services provided by insects. Basic. Appl. Ecol. 26, 8–23. doi: 10.1016/j.baae.2017.09.006
Norman M. (2003). Biodiversity hotspots revisited. BioScience 53, 916–917. doi: 10.1641/0006-3568(2003)053[0916:BHR]2.0.CO;2
Outhwaite C. L., McCann P., Newbold T. (2022). Agriculture and climate change are reshaping insect biodiversity worldwide. Nature 605, 97–102. doi: 10.1038/s41586-022-04644-x
Perrings C., Halkos G. (2015). Agriculture and the threat to biodiversity in sub-Saharan Africa. Environ. Res. Lett. 10, 095015. doi: 10.1088/1748-9326/10/9/095015
Phillips S. J., Anderson R. P., Dudík M., Schapire R. E., Blair M. E. (2017). Opening the black box: An open-source release of Maxent. Ecography 40, 887–893. doi: 10.1111/ecog.03049
Phillips S. J., Dudík M. (2008). Modeling of species distributions with Maxent: new extensions and a comprehensive evaluation. Ecography 31, 161–175. doi: 10.1111/j.0906-7590.2008.5203.x
Potts S. G., Imperatriz-Fonseca V., Ngo H. T., Aizen M. A., Biesmeijer J. C., Breeze T. D., et al. (2016). Safeguarding pollinators and their values to human well-being. Nature 540, 220–229. doi: 10.1038/nature20588
Pulliam H. R. (2000). On the relationship between niche and distribution. Ecol. Lett. 3, 349–361. doi: 10.1046/j.1461-0248.2000.00143.x
Radosavljevic A., Anderson R. P. (2014). Making better Maxent models of species distributions: complexity, overfitting and evaluation. J. Biogeogr. 41, 629–643. doi: 10.1111/jbi.12227
Reid W. V. (1998). Biodiversity hotspots. Trends Ecol. Evol. 13, 275–280. doi: 10.1016/S0169-5347(98)01363-9
Ribak G., Mordechay O., Weihs D. (2013). Why are there no long distance jumpers among click-beetles (Elateridae)? Bioinspiration. Biomimetics. 8, 036004. doi: 10.1088/1748-3182/8/3/036004
Samways M. J. (2007). “Implementing ecological networks for conserving insect and other biodiversity,” in: Insect Conservation Biology. eds. Stewart A. J. A., New T. R., Lewis U. K. (Wallingford, UK: CABI), 127–143.
Sheridan R. P. (2013). Using random forest to model the domain applicability of another random forest model. J. Chem. Inf. Modeling. 53, 2837–2850. doi: 10.1021/ci400482e
Stork N. E. (2010). Re-assessing current extinction rates. Biodiversity. Conserv. 19, 357–371. doi: 10.1007/s10531-009-9761-9
Stork N. E., Habel J. C. (2014). Can biodiversity hotspots protect more than tropical forest plants and vertebrates? J. Biogeogr. 41, 421–428. doi: 10.1111/jbi.12223
Sullivan G. T., Ozman-Sullivan S. K. (2021). Alarming evidence of widespread mite extinctions in the shadows of plant, insect and vertebrate extinctions. Austral Ecol. 46, 163–176. doi: 10.1111/aec.12932
Tang C. Q., Matsui T., Ohashi H., Dong Y. F., Momohara A., Herrando-Moraira S., et al. (2018). Identifying long-term stable refugia for relict plant species in East Asia. Nat. Commun. 9, 1–14. doi: 10.1038/s41467-018-06837-3
Trew B. T., Maclean I. M. (2021). Vulnerability of global biodiversity hotspots to climate change. Global Ecol. Biogeogr. 30, 768–783. doi: 10.1111/geb.13272
Uhler J., Redlich S., Zhang J., Hothorn T., Tobisch C., Ewald J., et al. (2021). Relationship of insect biomass and richness with land use along a climate gradient. Nat. Commun. 12, 1–9. doi: 10.1038/s41467-021-26181-3
Warren D. L., Seifert S. N. (2011). Ecological niche modeling in Maxent: the importance of model complexity and the performance of model selection criteria. Ecol. Appl. 21, 335–342. doi: 10.1890/10-1171.1
Wijerathna A., Evenden M. (2020). Effect of environmental conditions on flight capacity in Mountain Pine Beetle (Coleoptera: Curculionidae: Scolytinae). J. Insect Behav. 33, 201–215. doi: 10.1007/s10905-020-09760-y
Willis K. J., Gillson L., Knapp S. (2007). Biodiversity hotspots through time: an introduction. Philos. Trans. R. Soc. B.: Biol. Sci. 362, 169–174. doi: 10.1098/rstb.2006.1976
Yang J., Huang Y., Jiang X., Chen H., Liu M., Wang R. (2022). Potential geographical distribution of the edangred plant Isoetes under human activities using MaxEnt and GARP. Global Ecol. Conserv. 38, e02186. doi: 10.1016/j.gecco.2022.e02186
Yang J., Su D., Wei S., Chen S., Luo Z., Shen X., et al. (2020). Current and future potential distribution of wild strawberry species in the biodiversity hotspot of Yunnan Province, China. Agronomy 10, 959. doi: 10.3390/agronomy10070959
Keywords: coleoptera, MAXENT model, conservation, habitat suitability, biodiversity hotspots
Citation: He P, Bai M, Li L, Lu Y, Li J and Yan Z (2024) Spatial dynamic simulation of beetles in biodiversity hotspots. Front. Ecol. Evol. 12:1358914. doi: 10.3389/fevo.2024.1358914
Received: 21 December 2023; Accepted: 11 March 2024;
Published: 25 March 2024.
Edited by:
Paulo A. V. Borges, University of the Azores, PortugalReviewed by:
Radomir Jaskula, University Łódź, PolandJorge Ari Noriega, University of Los Andes, Colombia
Copyright © 2024 He, Bai, Li, Lu, Li and Yan. This is an open-access article distributed under the terms of the Creative Commons Attribution License (CC BY). The use, distribution or reproduction in other forums is permitted, provided the original author(s) and the copyright owner(s) are credited and that the original publication in this journal is cited, in accordance with accepted academic practice. No use, distribution or reproduction is permitted which does not comply with these terms.
*Correspondence: Ming Bai, baim@ioz.ac.cn