Drought Effects on Tectona grandis Water Regulation Are Mediated by Thinning, but the Effects of Thinning Are Temporary
 Katherine Sinacore1*
  Connor Breton2
  Heidi Asbjornsen2
  Virginia Hernandez-Santana3
  Jefferson S. Hall1
- 1ForestGEO, Smithsonian Tropical Research Institute, Panama City, Panama
- 2Ecohydrology Lab, Department of Natural Resources and the Environment, University of New Hampshire, Durham, NH, United States
- 3Instituto de Recursos Naturales y Agrobiología de Sevilla, Consejo Superior de Investigaciones Científicas, Seville, Spain
Results from tropical planted forests have demonstrated that tree plantations can have variable growth and water use patterns in response to drought. Yet research on how specific species will perform during a drought and whether this response can be mediated through forest management is still poorly understood. We took advantage of the 2015–2016 El Niño drought in central Panama to test the effects of thinning on sap flux density, transpiration, and growth of planted Tectona grandis (teak), a non-native species introduced to Panama for timber production. Despite a reduction in growth of teak during drought for control and thinned sites, tree sap flux density of thinned sights significantly increased after thinning, but the effect was temporary. Sap flux density (Js) for teak is strongly driven by changes in vapor pressure deficit (VPD), temperature, and radiation; however, Js declines as temperature rises above 28°C and VPD is above 0.5, suggesting a temperature threshold that could be problematic as droughts and temperatures increase in unison in the future. At the stand-level, all sites reduced transpiration during the drought. Although diameter growth and transpiration declined during drought, the leaf area index after the drought ended returned to pre-drought levels.
Introduction
Tectona grandis (teak) plantations have increased rapidly over the last few decades, especially in Panama, where an estimated 55,000 hectares is covered by planted teak (Kollert and Chrubini, 2012). Although teak can grow well on high nutrient soils in Panama, teak has been associated with dry and degraded soils that are often accompanied with low infiltration rates and high overland flow rates during rain events (Ribolzi et al., 2017, see exceptions: Fernández-Moya et al., 2013, 2014), raising concerns of how teak may affect important ecosystem services in Panama (i.e., water quality, water supply, and carbon sequestration). Although teak is a dry season deciduous and occurs in dry areas across its natural range, with respect to ecosystem services, planting teak in areas of water scarcity, in particular, is of concern given their relatively high transpiration rates and low water use efficiency (Cernusak and Aranda, 2007).
Model predictions are increasingly more confident that climate change induced droughts will become the norm (Allen et al., 2010), but there is large uncertainty of how growth and water use of trees will respond to these future novel climates. Growing evidence suggests that tree responses to extreme future droughts will likely vary greatly by species traits (Pineda-García et al., 2015), successional status (Bretfeld et al., 2018), tree canopy position (Grote et al., 2016), and may often lead to unexpected and non-linear physiological and stand-level dynamics (Engelbrecht et al., 2007; Allen et al., 2010).
Plantation trees experience similar meteorological effects as upper canopy trees experience in secondary forests. Changes in vapor pressure deficit (VPD), temperature, precipitation, and radiation have all been shown to affect plant water use at hourly, daily, and monthly timescales (Bretfeld et al., 2018; Brum et al., 2018). There are often species-specific thresholds where plant water use begins to decline in response to high VPD, radiation, or temperature (Sinacore et al., in review), which often leads to reduced tree water use and stand transpiration during droughts (Brum et al., 2018; Zhang et al., 2018). With predicted increases in temperature, in particular, understanding at what threshold tree water use begins to decline at high temperatures and VPDs is crucial for modeling future stand and landscape level responses to a changing climate. While precipitation and soil moisture are sometimes decoupled from transpiration on seasonal timescales (del Campo et al., 2019), deficits in soil moisture can still affect long term transpiration trends and growth of trees (Detto et al., 2018).
An adaptive management tool to reduce competition, whereby individual trees are removed to open space so that crowns of individual trees can expand, also known as thinning, can increase photosynthetic capacity and, in turn, productivity. While the effects of thinning are generally considered in terms of growth, recent growing concern over water resources has sparked increasing attention on the effects of thinning as a tool to manage plantations for desirable productivity and water yield outcomes (Lagergren et al., 2008; Gavinet et al., 2019). At the individual tree level, thinning may increase tree water use due to a reduction in competition for resources and an increase in radiation hitting previously shaded leaves (Lagergren et al., 2008; del Campo et al., 2019). However, stand-level transpiration following thinning depends on many factors.
Assuming an increase in tree-level water use due to thinning, it is still possible that no change or even a decline in transpiration may be observed at the stand-level. For example, if trees double their water use, but density after thinning is reduced by more than 50%, stand transpiration in thinned stands may be less than adjacent unthinned stands. As such, thinning offers an opportunity to not only control tree growth, but tree and stand transpiration, both of which have implications for water regulation and landscape scale water availability. Under these conditions, thinning could also serve as a key management tool mitigating the effects of drought. For example, if soil moisture becomes limiting, trees growing in low density thinned stands may have greater access to limited soil moisture, and be able to maintain growth and transpiration rates better than unthinned stands with more intraspecific competition.
Our work focuses on plantations located in the Panama Canal Watershed, where there are many competing uses land, trees, and water. Freshwater from the watershed is used for both drinking water in Panama City and for boats transiting through the Panama Canal. Any changes in climate or land use can affect how much water comes off the watershed (Ogden and Stallard, 2013). In fact, Panama has recently created a National Water Authority (ConAgua), in recognition that, even in a country where water is abundant, access to water is an ever-increasing concern. Since teak is an important land use in Panama, a better understanding of teak management for growth and water use is important, with a strong emphasis on how teak will response to drought.
We asked three questions to better understand the effect that thinning has in mediating water use and growth responses during drought in teak plantations:
1. How does thinning affect teak tree-level water use patterns and growth during drought?
2. What are the implications of thinning on stand-level transpiration during drought?
3. What are the key meteorological variables that predict daily water use of teak?
Methods
Site Description
The study was conducted in the Agua Salud Project site within the Panama Canal Watershed (9◦13′ N, 79◦47′W, 330 m amsl). We worked in the 30-ha T. grandis plantations that were established in 2008. Trees were planted at a spacing of 3 m between trees and 2.6 m between rows (total of 1,111 trees per hectare), such that trees were planted in a triangular configuration to reduce potential erosion on steeper slopes. Prior to plantation establishment, the land was cleared of forest in the 1970s with the predominant land use being cattle grazing (Weber and Hall, 2009). Since tree establishment in 2008, four yearly understory cleanings occurred from May through August to prevent additional competition with the planted trees. The cleanings reduced to three and then two times a year as the tree canopies began to close. Teak trees were also pruned to maintain 4.9 m (16 ft) of a branch free bole. Teak is characterized as dry season deciduous, but we found it does not lose all of its leaves at once at our site (Fernández-Moya et al., 2014). The topography of the area is characterized by both flat areas and areas with short and steep slopes (Hassler et al., 2011; Mayoral et al., 2018) and the soils are silt clay to clay with pH values ranging from 4.4 to 5.8 (Batterman et al., 2018).
Sampling Design
The sampling design was meant to estimate water use in T. grandis stands. During June of 2014, we established five teak plots, measuring 25 m by 25 m in area with <10 degrees of inclination to avoid logistical problems with the sapflow cables. At all sites, trees were interacting aboveground, but were not overtopping one another. Between June and August of 2014 and 2015, all trees within each plot were measured for height and diameter at breast height (DBH, 1.3 m above ground). A total of 351 trees were inventoried. Between July and August of each year, the understory of the 30 ha teak plantation was cleaned, which included the teak plots where inventories were established.
In June 2014, we established four subplots within a subset of the monocultures to measure sap flow in selected trees (hereafter referred to as sap flow trees). We selected eight trees per plot for sap flow measurements based on the following criteria: (1) The tree crowns had to be interacting (i.e., the stand has reached canopy closure); and (2) The trees had to be within a 10 m radius of each other to be within reach of the sap flow cables. A total of 32 trees were measured, 17 of which were used for analysis. Trees were excluded from analysis if they were missing >20% of data points. Large data gaps were caused by ant attacks, termite infestations, or lightning. We refer to the two plots that were not thinned as Control 1 and Control 2.
Thinning Experiment
Two of the teak plantation plots received a thinning treatment in June 2015, and the other two were left unthinned as controls (Table 1). The thinned plots are referred to as Treatment 1 and Treatment 2. The thinning treatment consisted of removing 50% of the individual trees, which is around the percentage of trees thinned in Panama teak plantations (Griess and Knoke, 2011). Trees were felled with a chainsaw or machete in a direction to avoid damage to study trees. Sap flow trees in the thinned sites had three competing trees removed so that each sap flow tree had three neighbors after the thinning. In the unthinned stands, each sap flow tree had 6 neighbors during the study period.
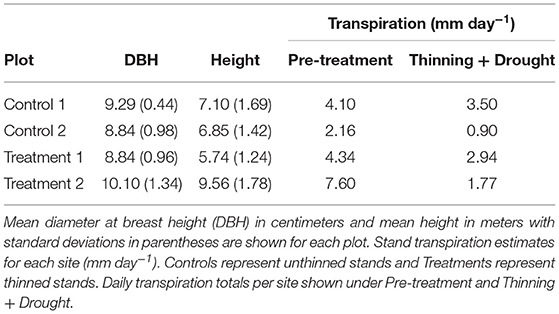
Table 1. Site characteristics of each plot.
Drought Index, Micrometeorological, and Soil Moisture Data
Central Panama experiences annual dry seasons that start in mid-December and end in mid-May, with the remainder of the year (May through early December) being considered the wet season. During the period of the study, the El Niño drought occurred such that the normal wet season was dry, essentially connecting the dry season of 2015 with the dry season of 2016, creating what we refer to as a prolonged drought. We selected the Standard Precipitation-Evapotranspiration Index to assess drought conditions based on the recommendation of Slette et al. (2019) for methods to define drought. We calculated the index using the SPEI package in R (Begueria and Vicente-Serrano, 2013). The SPEI calculates potential evapotranspiration (PET) using the Penman-Monteith equation. From the package, PET is calculated using the monthly minimum temperature, maximum temperature, average wind speed, sun hours, the site latitude, and site altitude in meters above sea-level. Negative values on the SPEI index (<−1) indicated drought conditions. We calculated the index based on 1 month periods and 6 month periods. We calculated the SPEI using data between 2002 and 2019. Data from 2002 to 2015 were collected from a nearby meteorological (MET) station on Barro Colorado Island. Data from 2015 onward were collected from the Agua Salud MET station (more details below). We also calculated monthly precipitation totals and subtracted precipitation from the PET for a 10 year period from 2009 to 2019 in order to determine the water deficit or surplus.
Two MET stations located within the Agua Salud Project study area collected local climate data for the 2014–2015 study period. From June 2014 through January 2015, MET data were collected from the Property 2 site while data after February 2015 were collected from the Celestino Tower site. Climate data from the Celestino Tower included air temperature (°C) and relative humidity (RH, %) using an HMP60 (Vaisala, Vantaa, Finland), and precipitation (mm) using a 260–250-A tipping bucket (NovaLynx, CA, USA), Vapor pressure deficit (VPD, kPA) was calculated from the air temperature and RH data following (Allen et al., 1998). Small gaps in the dataset exist due to either sensor malfunction or due to the transition period between taking down the Property 2 tower and constructing the Celestino Tower.
The 2014 dry season began December 21, 2013 and ended May 6, 2014 and the 2015 dry season began December 14, 2014 and ended May 16, 2015 (Paton, 2016). Mean annual rainfall for 2014 was 2,203 mm and for 2015 it was 1,810 mm (Paton, 2016). Generally, about 80% of the average annual precipitation falls between May and mid-December. Mean daily maximum and minimum temperatures are 32 and 23°C, respectively (http://striweb.si.edu/esp/physical_monitoring/descrip_bci.htm).
Soil volumetric water content (VWC) was measured using DeltaT PR2 sensors (DeltaT, Cambridge, United Kingdom) at six soil depths (100, 200, 300, 400, 600, and 1,000 mm) starting in December 2014. At each site, three trees with sap flow sensors were randomly selected. An access tube was placed 0.5 m in a random cardinal direction from the bole of the tree. Soil moisture measurements were collected for each tube every 1–4 days. A mean VWC was calculated for the first three depths (100, 200, and 300), where changes in VWC throughout the year were apparent. An ANOVA with a post-hoc Tukey test was performed to analyze mean VWC difference between plots.
Tree Sap Flux Density and Stand Transpiration
We analyzed data from June 15, 2014 through December 15, 2015. Tree-level water use estimates are based on data obtained from individual sap flow trees. Stand-level measurements are scaled using plot inventories and the relationship between DBH and water use (Hernandez-Santana et al., 2015). Sap flow was measured using the heat ratio method (HRM; Burgess et al., 2001). On each tree, one sensor was installed 1.30 m above the base of the tree facing north. Each sensor contained three probes (a heater probe and two temperature probes, installed equidistantly upstream and downstream from the heater probe, 0.6 cm). Each temperature probe contained three thermocouples located at 0.5, 1.7, and 3.0 cm from the bark of the tree. A heat pulse was automatically sent to the sensors every 15 min. The speed of the heat (Vh) was calculated according to Burgess et al. (2001) every 15 min. Heat pulse velocities were corrected (Vc) for errors (probe misalignment and wounding) following Burgess et al. (2001). Estimates of each tree's daily sap flux density (Js) were obtained from Vc (Green et al., 2003):
where ρd is the density of sapwood, ρs is the density of water, MC is the volumetric water content of the sapwood, Cdw is the thermal conductivity of dry wood, and Cs is the thermal conductivity of water.
Cores were taken from trees where sensors were not actively measuring sap flow to determine conducting sapwood area. No cores across the range of sampled tree diameters (7.1 to 13.3 cm at breast height) revealed heartwood, so the entire diameter cross section of each study tree was treated as conducting sapwood for the transpiration calculations. We found a significant but weak relationship (p < 0.001, R2 = 0.04) between DBH and whole tree water use. We calculated the daily water use of each sap flow tree (Equation 2):
Where Q is the daily water use of an individual tree and DBH is the diameter at breast height of the tree. Each Q was summed for the site and then divided by the ground area of the site to measure transpiration in mm day−1.
Radial Profile Characterization
The middle sap flux density (thermocouple 1.7 cm from the bark) was divided by the outer sap flux density (thermocouple 0.5 cm from the bark) to determine where sap flux density was greatest throughout the study period. If the sap flux ratio (Js ratio) is >1, the sap flux density is greater in the outer portion of the tree than the middle. Conversely, if the ratio is <1, the sap flux density is greater in the middle portion of the tree than the outer. We calculated the ratio for every 15 min reading and then averaged the ratio by week for thinned and unthinned sites across the study length (1.5 years).
Growth and Leaf Area Index Characterization
Relative growth rate (RGR) was calculated for all sap flow trees (n = 32) using aboveground tree biomass (AGB) and (Equation 3):
For the year before thinning, RGR was calculated using the 2015 (AGB2) and 2014 (t1, AGB1), while 2016 (AGB3) and 2015 (AGB2). Diameter at breast height measurements for each year were used to calculate AGB based on equations from Kraenzel et al. (2003).
Leaf area index (LAI) of the teak canopies were estimated using hemispherical photography photos. Photos were taken at two different time points—May 2015 (pre-treatment) and October 2015 (post-treatment). The teak canopies were fully foliated in May 2015 and October 2015, but during October 2015, the photos represent the end of the drought period. Photos were taken with a Canon Eos Xs 1000D (Canon, Ota, Tokio, Japan) with an attached Sigma 4.5 mm fisheye lens with an equisolid projection (Sigma, Ronkonkoma, New York, USA). A total of six photos were taken per plot at three different time points. Tubes were placed at each point so the same location could be used over the study period. At each tube, three photos were taken with a self-timer and automatic exposure compensation and bracketing at −2.0, −1.0, and 0. The camera was placed on a tripod so that the lens was one meter above the ground and level. If there were leaves at a distance <0.6 meters from the lens, they were pulled from the view of the lens. Photos were taken only if there was no direct sunlight or rain (typically occurring during the late morning. We took photos during the wet season prior to the drought/thinning and after the drought/thinning. Hemispherical photo analyses were performed with the Hemiphot package (ter Steeg, 2018).
Statistical Analyses
All statistical analyses were performed in R (R Core Team, 2017) and figures were produced with ggplot2 (Wickham, 2016). The lme4 package (Bates et al., 2015) was used to perform mixed effects models to determine differences in (1) pooled Js by temperature and VPD and (2) stand transpiration by treatment. All mixed effects models included an additional interaction of pre-treatment or thinning. The dabestr package (Ho et al., 2019) was used to create estimation graphics for both RGR and LAI analyses. We selected the Ho et al. (2019) method of estimating effect sizes and their uncertainty to take advantage of plotting full sampling curves and effect sizes to show the variability in the data.
Results
Drought Conditions at Site Based on SPEI
Based on the SPEI calculation, the time period of the study that experienced a drought in 2015/2016 coincided with an El Niño Southern Oscillation Event (ENSO). The SPEI was <−1 (moderately dry) at the beginning of the ENSO event, approaching −2 (extremely dry) toward the end of the ENSO event (Figure S1). Prior to and after the ENSO event, the annual precipitation was greater than the annual PET. There was always a PRCP-PET deficit during the dry seasons, but the deficit was longer (8 months) during the ENSO event than the other years (4–5 months). Additionally, the higher PRCP-PET during the ENSO event was lower than the previous years (Figure S2).
After thinning, 50% of the trees were removed in two of the plots. In the other two control plots, no trees were thinned. Around the same time of the thinning (June 2015), Panama experienced an El Niño Southern Oscillation Event (ENSO). At the sites, there was a 54% decrease in precipitation in comparison to the previous year (Figure 1E) and nearly a 32% reduction from the average (since 1927) in cumulative rainfall, based on a nearby site of Barro Colorado Island (Paton, 2016). The ENSO event also corresponded with increases in net radiation (40%) and VPD (20%). Volumetric water content (VWC) was not significantly different between treatments at the beginning of the study (dry season 2015) but started to become significantly different after the thinning. Notably, the thinned sites had 10% higher VWC than the unthinned sites from July until October 2015 (p < 0.001). After October, the VWC of the unthinned and thinned sites were no longer significantly different.
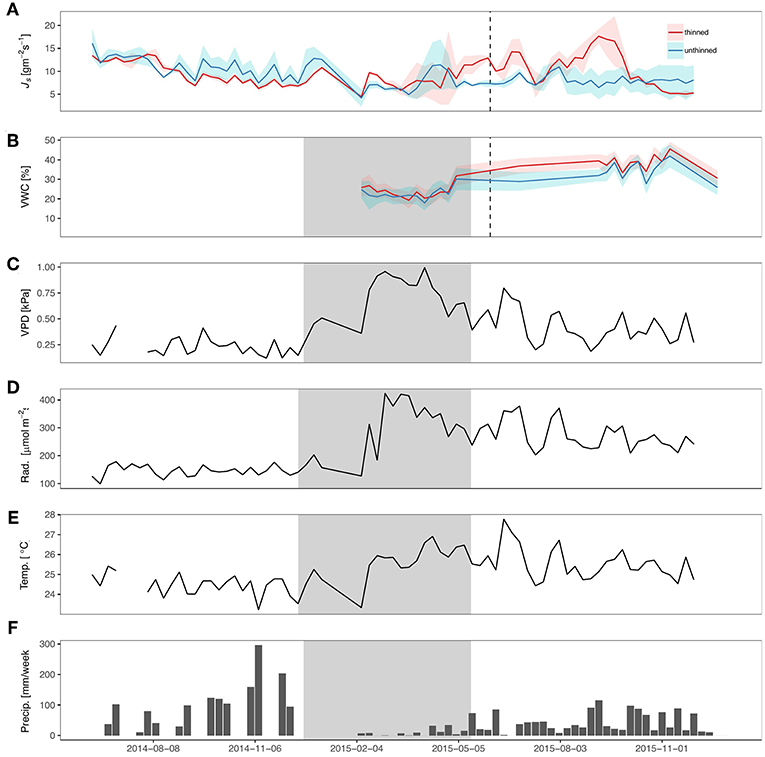
Figure 1. Sap flux density and meteorological variables during sampling period. (A) Mean sap flux density (Js; gm−2 s−1), (B) mean volumetric water content (VWC; %) for top 30 cm, (C) Vapor pressure deficit (VPD; kPa), (D) net radiation (Rad; W m−2), (E) temperature (Temp.; °C), and (F) precipitation (precip.; mm week−1) from June 2014 through June 2016. Gray shading represents dry season and dashed line represents the timing of the thinning.
Responses of Sap Flux Density
Js of teak generally increased with increasing VPD and temperatures, independent of treatment (Figure 2). At 28°C, Js began to decline as VPD increased, with the exception of 34°C. The slopes of the lines ranged from 1.20 for 20°C to −0.01 for 28°C, and did not follow a consistent pattern (i.e., decreasing slopes with increasing temperatures). All models relating Js with VPD and temperature were significant, but the R2 ranged from 0.24 to <0.01. Unlike the relationship of VPD and temperature, radiation had a pattern of decreasing slopes with increasing VPD. Js increased with increasing VPD and net radiation, until radiation reached 450 W m−2 (Figure 3), and notably, the rate of change decreased at each increase in net radiation of 50 W m−2.
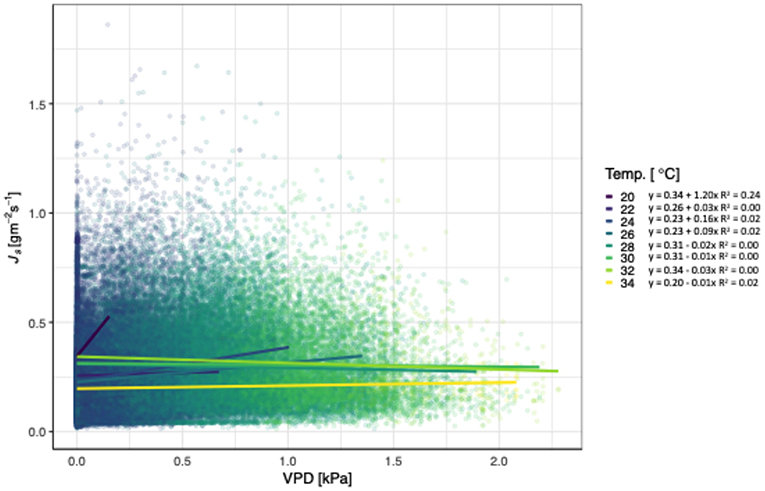
Figure 2. Relationship between vapor pressure deficit (VPD; kPa), sap flux density (Js; gm−2 s−1), and air temperature (Temp. °C) for Tectona grandis. Treatments (thinned and unthinned) are pooled. Colors represent binned hourly mean air temperatures (by 2°C) during daylight hours (07:00 to 18:00). Model equations for each temperature bin shown. R2 values included for all models where p < 0.0001).
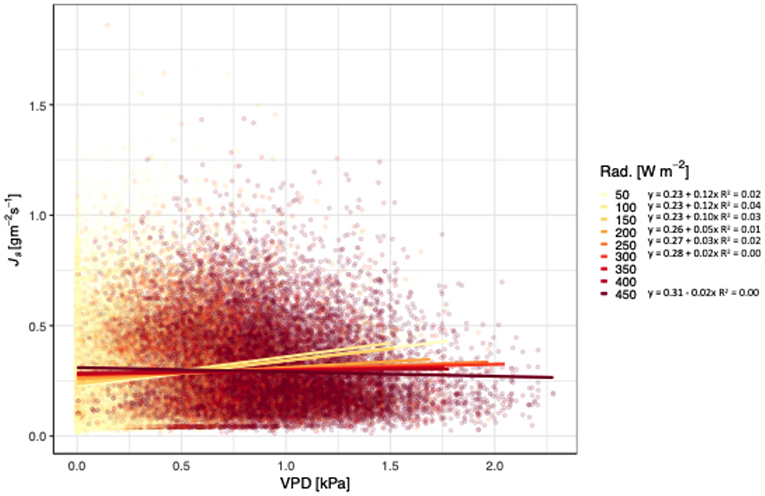
Figure 3. Relationship between vapor pressure deficit (VPD; kPa), sap flux density (Js; gm−2 s−1), and net radiation (Rad. Wm−2) for Tectona grandis. Treatments (thinned and unthinned) are pooled. Colors represent binned hourly mean net radiation (by 50 Wm−2) during daylight hours (07:00 to 18:00). Model equations for each temperature bin shown. R2 values included for all models where p < 0.0001).
Prior to thinning, both treatments had trees with similar Js (Figure 1A), except for a period immediately preceding the thinning, possibly due to a small rainfall event and differences in leaf cover among sites. The thinned sites began to have greater Js that corresponded with increases in VWC and the thinning, with the exception of a brief period in August when Js did not significantly differ. An increase in the ratio of outer to middle Js occurred in the thinned sites after the thinning (with no change in the control sites; Figures S3).
Stand Growth, Transpiration, and LAI Before and After Thinning
Relative growth rates (RGR) for all trees declined during the drought (Figure 4). The effect size was calculated to compare the thinning and drought treatment to the control (unthinned sites). The RGR effect size was negative for thinning + drought. The distribution of changes for RGR was greater for sites that were thinned than for the controls (Figure 4). Leaf area index (LAI) before the drought/thinning and after the drought/thinning did not vary (Figure 5). The effect size of the drought year was not significantly different from the control, regardless of whether the sites were thinned. Stand transpiration (E) was significantly different among sites pre-treatment, with one site having the greatest E with 7.60 mm day−1. All sites had lower E during the drought/post-thinning period. The two thinned sites had lower E (2.94 and 1.77 mm day−1) than one of the control sites which had the highest E during the second half of the study (3.50 mm day−1) (Table 1).
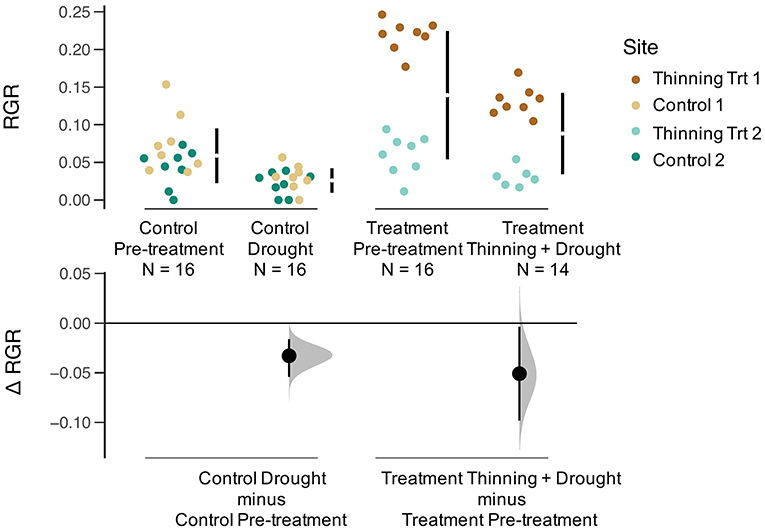
Figure 4. Gardner-Altman plot of relative growth rate (RGR, kg yr−1) for Pre-treatment Control, Drought Control, Pre-treatment, and Thinning + Drought Treatment. Colors represent the four sites. The change in RGR (Δ RGR, or effect size) is compared between the control and treatment, as well as pre-treatment and drought/drought+thinning conditions.
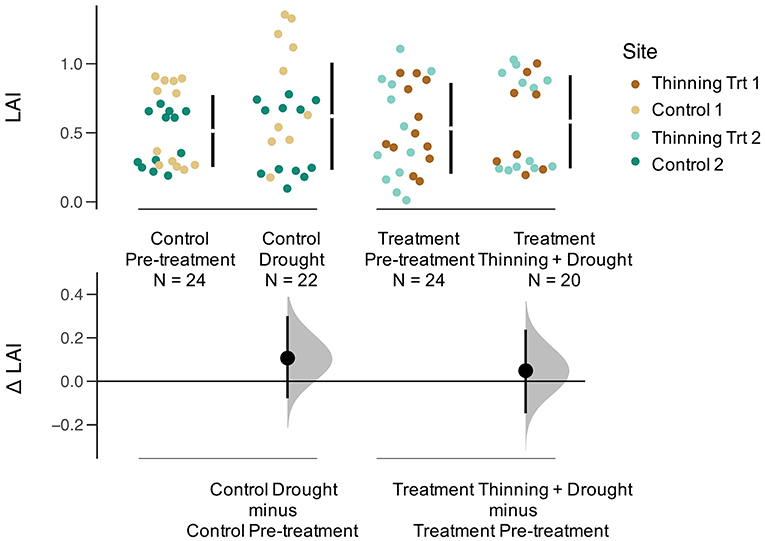
Figure 5. Gardner-Altman plot of leaf area index (LAI) for Pre-treatment Control, Drought Control, Pre-treatment, and Thinning + Drought Treatment. Colors represent the four sites. The change in LAI (Δ LAI, or effect size) is compared between the control and treatment, as well as pre-treatment and drought/thinning+drought conditions.
Discussion
Water Use and Transpiration Mediated by Thinning
Stand transpiration was on average lower in the thinned sites than the unthinned sites because of the reduction of trees. Additionally, thinning increased tree sap flux density for a short period and not enough to compensate for the lower stand density experienced in the thinned sites (Figure 1, Table 1). This result suggests that stands can be thinned to regulate stand transpiration. During the dry season or a drought event, when there is significantly less rainfall than the wet season and a normal year, respectively, reducing the evaporative demand of plantations by reducing the density can potentially benefit both individual tree growth and downstream water resources in the short-term, although long-term changes (i.e., 1 year +) in stand transpiration are still not fully understood. Stand transpiration was notably variable (Table 1), which may be partially attributable to the differences in stand LAI (Figure 4), but also could be caused by differences in soil nutrients or even slope, which have an effect on the growth of some native species in the adjacent area (Mayoral et al., 2018). All of these factors, when scaled to the stand-level, can result in significant differences in transpiration.
Although we expected teak to reduce LAI during the drought (like it does during the dry season), the teak trees did not fully lose leaves. In fact, LAI trended toward an increase during the drought regardless of whether the stands were thinned or not (Figure 5). Higher growth rates and altered leaf flushing to take advantage of the higher than normal radiation experienced during an El Niño event is common among some species in secondary forests (Detto et al., 2018; Schnabel et al., 2019). Our work shows, however, that even within the same species, drought can differentially affect tree-level and stand-level growth rates, Js, and transpiration.
One limitation of our conclusions at the stand-level is that the number of plots is a constraint and limits the generalizability of our results. However, this is a common limitation inherent to sapflow studies, given the high costs, labor, and resources involved in fully instrumenting and maintaining the plots. Although plot sample size was small, we were able to collect sapflow data on 32 trees, which we argue provides sufficient statistical power to draw robust conclusions for our specific study sites about sap flux density and stand transpiration.
Although thinning may decrease competition for soil moisture, the remaining trees after the thinning may experience higher levels of radiation on the sides of their crowns. Simultaneously, greater exposure of soil to radiation may increase evaporation from the upper soil layer faster than in unthinned plots due to reduced shading by trees. Based on thinning principles, we expected that relative growth rate of released trees to be greater than the year before the release, but we did not find this to be true. Both the controls and thinned stands had lower RGR during the ENSO event (Figure 4) suggesting that the drought had a negative impact on aboveground growth that overrode any positive growth impacts associated with thinning. However, despite decreases in RGR, LAI a year after thinning and the drought returned to pre-thinning levels (Figure 5). Since RGR is based on increases in DBH, this metric does not represent any below ground growth that could have been occurring in response to drought (Markesteijn and Poorter, 2009).
Thinning had an initial effect on tree Js, but this effect subsided when precipitation increased. Initially, there was an increase in tree Js after the thinning compared to the trees in the control sites, despite the presence of a drought. During a brief rainy period during the drought in September where precipitation was >PET (see Figure S1), Js of the trees in thinned and control sites were not significantly different. However, when PET shifted and was higher than precipitation, the differences between Js were more pronounced, with tree Js in thinned sites being higher than Js of trees in control sites. Soon after, when precipitation returned to more normal conditions and precipitation was higher than PET, Js of both treatments were no longer significantly different. The results from PET and precipitation also follow closely with VWC, in which VWC was initially higher in thinned sites than controls, but closely tracked differences in PET and precipitation. Based on these results, the increase in tree Js due to thinning was significant, but the effect was temporary (<6 months) and did not necessarily override the effect of the drought. This suggests that thinning might be a useful tool to use when trees are experiencing water shortages (e.g., low VWC), to increase access to VWC while a drought persists. However, since the effect appears short for teak, thinning may be more useful for longer droughts or for species that are slower to recover LAI. Although not directly tested here, thinning can affect the boundary layer and canopy roughness, which can result in trees losing more water. For example, trees growing next to forest edges in the Amazon and spruce trees in Denmark have higher water use due to changes in the boundary layer (Hernandez-Santana et al., 2011; Ringgaard et al., 2012; Kunert et al., 2015). A change in the boundary layer, combined with a reduction in competition for soil water for remaining trees after thinning, can in the short-term increase water use. However, for open stands (like the ones in this study), droughts can dry out the top soil layer faster, limiting the accessibility of water for the remaining trees, which will fade the effect of thinning over the long-term.
Also notable is that there was a transition to higher Js in the outer portion of the sapwood area after the thinning (Figure S3). Generally, Js is higher toward the bark of the tree, where newer wood is being added (Alvarado-Barrientos et al., 2013). The change to higher Js in the outer thermocouple post thinning, despite the drought, can be explained by the LAI of the thinned stands. The fact that the thinned stands were able to return to pre-thinned LAI within a year, suggests an increase in leaf production, which would necessitate greater water use by the tree, primarily in the outer portion of the tree which is preferentially connected to the newest leaves. Similarly, the control plots did not have an increase or decrease in LAI between the pre-treatment and treatment + drought years, which is expected.
High Radiation, Temperature, and Vapor Pressure Deficit Decrease Sap Flux Densities
In addition to tree species or site-specific characteristics (Hassler et al., 2018), atmospheric conditions and soil water availability are the primary controls of hourly, daily and yearly changes in sap flux density (Js) (Bovard et al., 2005). While some meteorological variables that affect Js are highly correlated with one another, others can interact and have opposite effects on Js. For example, while VPD, temperature, and radiation are tightly linked, they can have opposite effects on Js. For example, Js increases in the morning with increasing VPD and then often declines in the afternoon because radiation forces stomatal closure despite similar VPD levels (Zeppel et al., 2004).
Although Js generally increases with VPD and temperature, we found that teak hits a temperature and radiation threshold at high VPD (Figures 2, 3). Irrespective of treatment, Js increased with increasing VPD until 28°C, at which point, Js began to decline. In contrast, locally adapted species in adjacent sites had temperature thresholds up to 30°C (Sinacore et al., in revision). Given that climate change induced temperature increases are expected at our sites and may influence the ability of teak to regulate water, these results are particularly notable, especially when compared to native species alternatives. Radiation also had a negative effect on Js at higher VPD, with the threshold 450 W m−2, which was near the maximum radiation during the course of our study. Despite trees in tropical forests generally having positive responses to increasing VPD and radiation (i.e., through higher growth rates), predicted increases in temperatures may cause an opposite effect in the future, a concept that requires further investigation.
Conclusions
Thinning had short-term effects on plant water use and growth that mediated the effects of drought. At the tree-level, thinning increased Js and VWC during a period when drought conditions persisted. Once the drought ended, however, Js and VWC returned back to the levels in the unthinned treatment, providing evidence that thinning can be used as a short-term management strategy to reduce the water stress trees may face during a drought. At the stand-level, reducing tree density by 50% can have a significant impact on reducing transpiration, which has potential positive consequences for downstream water availability. While tree growth declined during drought and was not benefitted through thinning, leaf production was sufficient that LAI returned to pre-thinned levels following the drought, setting up the stands to be highly productive once the drought ended. Finally, we emphasize that more work on temperature and radiation thresholds is crucial to better predict how teak will respond to future droughts.
Data Availability Statement
The raw data supporting the conclusions of this article will be made available by the authors upon reasonable request.
Author Contributions
KS, JH, and CB: data curation. KS and VH-S: formal analysis. JH: funding acquisition. JH and HA: supervision. KS, JH, VH-S, CB, and HA: writing original draft, reviewing, and editing.
Funding
KS was supported by grants and fellowships from the Smart Reforestation® program of the Smithsonian Tropical Research Institute, Mr. Stanley Motta, the Silicon Valley Foundation, the Heising-Simons Foundation, and the University of New Hampshire. CB was supported by grants and fellowships from the Smithsonian Tropical Research Institute and the University of New Hampshire International Research Opportunities Program.
Conflict of Interest
The authors declare that the research was conducted in the absence of any commercial or financial relationships that could be construed as a potential conflict of interest.
Acknowledgments
We are grateful for the work of DanielaWeber, Estrella Yanguas, and Federico Davis for managing the plantation and providing field and lab support. We would also like to thank Señor Rosendo for protecting the plantation from fires and sharing many cups of coffee with us in the field. We are also grateful to Guillermo Fernandez, Mario Bailon, Miguel Nuñez, Andrea Miller, Adrián Brox, Victor Garcia, Lea Bernath, Andrés Rodriguez, Rand Snyder, and Martyna Glodowska who all spent many hours and days collecting sap flow, LAI, soil moisture, and physical growth measurements. We could not have done the thinning without the help of Carlos Días and Victorino Montenegro who carefully cut trees without damaging adjacent ones. The Agua Salud Project is part of ForestGEO and is a collaboration between the Smithsonian Tropical research Institute, the Panama Canal Authority (ACP), and the Panamanian Ministry of the Environment (MiAMbiente).
Supplementary Material
The Supplementary Material for this article can be found online at: https://www.frontiersin.org/articles/10.3389/ffgc.2019.00082/full#supplementary-material
References
Allen, C., Macalady, A., Chenchouni, H., Bachelet, D., Mcdowell, N., Vennetier, M., et al. (2010). A global overview of drought and heat induced tree mortality reveals emerging climate change risk for forests. For. Ecol. Manage. 259, 660–684. doi: 10.1016/j.foreco.2009.09.001
Allen, R. G., Pereira, L. S., Raes, D., and Smith, M. (1998). Crop Evapotranspiration: Guidelines for Computing Crop Water Requirements. Rome: FAO.
Alvarado-Barrientos, M. S., Hernandez-Santana, V., and Asbjornsen, H. (2013). Variability of the radial profile of sap velocity in Pinus patula from contrasting stands within the seasonal cloud forest zone of Veracruz, Mexico. Agric. For. Meteorol. 168, 108–119. doi: 10.1016/j.agrformet.2012.08.004
Bates, D., Maechler, M., Bolker, B., and Walker, S. (2015). Fitting linear mixed-effects models using lme4. J. Stat. Softw. 67, 1–48. doi: 10.18637/jss.v067.i01
Batterman, S. A., Hall, J. S., Turner, B. L., Hedin, L. O., LaHaela Walter, J. K., Sheldon, P., et al. (2018). Phosphatase activity and nitrogen fixation reflect species differences, not nutrient trading or nutrient balance, across tropical rainforest trees. Ecol. Lett. 21, 1486–1495. doi: 10.1111/ele.13129
Begueria, S., and Vicente-Serrano, S. M. (2013). SPEI: Calculation of the Standardised Precipitation-Evapotranspiration Index. R package version, 1, 6.
Bovard, B. D., Curtis, P. S., Vogel, C. S., Su, H. B., and Schmid, H. P. (2005). Environmental controls on sap flow in a northern hardwood forest. Tree Physiol. 25, 31–38. doi: 10.1093/treephys/25.1.31
Bretfeld, M., Ewers, B. E., and Hall, J. S. (2018). Plant water use responses along secondary forest succession during the 2015-2016 El Niño drought in Panama. New Phytol. 219, 885–899. doi: 10.1111/nph.15071
Brum, M., Gutierrez-Lopez, J., Asbjornsen, H., Licata, J., Pypker, T., Sanchez, G., et al. (2018). ENSO effects on the transpiration of eastern Amazon trees. Philos. Trans. R. Soc. B Biol. Sci. 373:20180085. doi: 10.1098/rstb.2018.0085
Burgess, S. S. O., Adams, M. A., Turner, N. C., Beverly, C. R., Ong, C. K., Khan, A. A. H., et al. (2001). An improved heat pulse method to measure low and reverse rates of sap flow in woody plants. Tree Physiol. 21, 589–598. doi: 10.1093/treephys/21.9.589
Cernusak, L., and Aranda, J. (2007). Large variation in whole-plant water-use efficiency among tropical tree species. New Phytol. 173, 294–305. doi: 10.1111/j.1469-8137.2006.01913.x
del Campo, A. D., González-Sanchis, M., García-Prats, A., Ceacero, C. J., and Lull, C. (2019). The impact of adaptive forest management on water fluxes and growth dynamics in a water-limited low-biomass oak coppice. Agric. For. Meteorol. 264, 266–282. doi: 10.1016/j.agrformet.2018.10.016
Detto, M., Wright, S. J., Calderón, O., and Muller-Landau, H. C. (2018). Resource acquisition and reproductive strategies of tropical forest in response to the El Niño-Southern Oscillation. Nat. Commun. 9, 1–8. doi: 10.1038/s41467-018-03306-9
Engelbrecht, B. M., Comita, L. S., Condit, R., Kursar, T. A., Tyree, M. T., Turner, B. L., et al. (2007). Drought sensitivity shapes species distribution patterns in tropical forests. Nature 447, 80–82. doi: 10.1038/nature05747
Fernández-Moya, J., Alvarado, A., Forsythe, W., and Marchamalo-Sacristán, M. (2013). Effect of teak (Tectona grandis) plantations on hydraulic conductivity and porosity of Alfisols in Costa Rica. J. Trop. For. Sci. 25, 259−267. Available online at: www.jstor.org/stable/23617041
Fernández-Moya, J., Alvarado, A., Forsythe, W., Ramírez, L., Algeet-Abarquero, N., and Marchamalo-Sacristán, M. (2014). Soil erosion under teak (Tectona grandis L.f.) plantations: general patterns, assumptions and controversies. Catena 123, 236–242. doi: 10.1016/j.catena.2014.08.010
Gavinet, J., Ourcival, J., and Limousin, J. (2019). Rainfall exclusion and thinning can alter the relationships between forest functioning and drought. New Phytol. 223, 1267–1279. doi: 10.1111/nph.15860
Green, S., Clothier, B., and Jardine, B. (2003). Theory and practical application of heat pulse to measure sap flow. Agron. J. 95, 1371–1379. doi: 10.2134/agronj2003.1371
Griess, V. C., and Knoke, T. (2011). Can native tree species plantations in Panama compete with Teak plantations? An economic estimation. New For. 41, 13–39. doi: 10.1007/s11056-010-9207-y
Grote, R., Gessler, A., Hommel, R., Poschenrieder, W., and Priesack, E. (2016). Importance of tree height and social position for drought-related stress on tree growth and mortality. Trees Struct. Funct. 30, 1467–1482. doi: 10.1007/s00468-016-1446-x
Hassler, S. K., Weiler, M., and Blume, T. (2018). Tree-, stand- and site-specific controls of landscape-scale patterns of transpiration. Hydrol. Earthy Syst. Sci. 22, 13–30. doi: 10.5194/hess-22-13-2018
Hassler, S. K., Zimmermann, B., van Breugel, M., Hall, J. S., and Elsenbeer, H. (2011). Recovery of saturated hydraulic conductivity under secondary succession on former pasture in the humid tropics. For. Ecol. Manage. 261, 1634–1642. doi: 10.1016/j.foreco.2010.06.031
Hernandez-Santana, V., Asbjornsen, H., Sauer, T., Isenhart, T., Schilling, K., and Schultz, R. (2011). Enhanced transpiration by riparian buffer trees in response to advection in a humid temperate agricultural landscape. For. Ecol. Manage. 261, 1415–1427. doi: 10.1016/j.foreco.2011.01.027
Hernandez-Santana, V., Hernandez-Hernandez, A., Vadeboncoeur, M. A., and Asbjornsen, H. (2015). Scaling from single-point sap velocity measurements to stand transpiration in a multispecies deciduous forest: uncertainty sources, stand structure effect, and future scenarios. Can. J. For. Res. 45, 1489–1497. doi: 10.1139/cjfr-2015-0009
Ho, J., Tumkaya, T., Aryal, S., Choi, H., and Claridge-Chang, A. (2019). Moving beyond P-values: data analysis with estimation graphics. Nat. Methods 16, 565–566. doi: 10.1038/s41592-019-0470-3
Kollert, W., and Chrubini, L. (2012). Teak resources and market assessment 2010, in FAO Plant. For. Trees Work. Pap. F.P. 47E. Rome: FAO.
Kraenzel, M., Castillo, A., Moore, T., and Potvin, C. (2003). Carbon storage of harvest-age teak (Tectona grandis) plantations, Panama. For. Ecol. Manage. 173, 213–225. doi: 10.1016/S0378-1127(02)00002-6
Kunert, N., Aparecido, L. M. T., Higuchi, N., dos Santos, J., and Trumbore, S. (2015). Higher tree transpiration due to road-associated edge effects in a tropical moist lowland forest. Agric. For. Meteorol. 213, 183–192. doi: 10.1016/j.agrformet.2015.06.009
Lagergren, F., Lankreijer, H., Kučera, J., Cienciala, E., Mölder, M., and Lindroth, A. (2008). Thinning effects on pine-spruce forest transpiration in central Sweden. For. Ecol. Manage. 255, 2312–2323. doi: 10.1016/j.foreco.2007.12.047
Markesteijn, L., and Poorter, L. (2009). Seedling root morphology and biomass allocation of 62 tropical tree species in relation to drought- and shade-tolerance. J. Ecol. 97, 311–325. doi: 10.1111/j.1365-2745.2008.01466.x
Mayoral, C., van Breugel, M., Turner, B., Asner, G., Vaughn, N. R., and Hall, J. S. (2018). Predicting the effect of microsite quality and species composition on tree growth: a new modeling approach. For. Ecol. Manage. 432, 534–545. doi: 10.1016/j.foreco.2018.09.047
Ogden, F. L., and Stallard, R. F. (2013). Land use effects on ecosystem service provisioning in tropical watersheds, still an important unsolved problem. Proc. Natl. Acad. Sci. U.S.A. 110:E5037. doi: 10.1073/pnas.1314747111
Paton, S. (2016). Meteorological and Hydrological Summary for Barro Colorado Island. Panama City, FL: Smithsonian Tropical Research Institute.
Pineda-García, F., Paz, H., Meinzer, F. C., and Angeles, G. (2015). Exploiting water versus tolerating drought: water-use strategies of trees in a secondary successional tropical dry forest. Tree Physiol. 36, 208–217. doi: 10.1093/treephys/tpv124
R Core Team (2017). A Language and Environment for Statistical Computing. Available online at: https://www.R-project.org/ (accessed January 6, 2014).
Ribolzi, O., Evrard, O., Huon, S., De Rouw, A., Silvera, N., Latsachack, K. O., et al. (2017). From shifting cultivation to teak plantation: effect on overland flow and sediment yield in a montane tropical catchment. Sci. Rep. 7, 1–12. doi: 10.1038/s41598-017-04385-2
Ringgaard, R., Herbst, M., and Friborg, T. (2012). Partitioning of forest evapotranspiration: the impact of edge effects and canopy structure. Agric. For. Meteorol. 166, 86–97. doi: 10.1016/j.agrformet.2012.07.001
Schnabel, F., Schwarz, J. A., Dănescu, A., Fichtner, A., Nock, C. A., Bauhus, J., et al. (2019). Drivers of productivity and its temporal stability in a tropical tree diversity experiment. Glob. Chang. Biol. 25, 4257–4272. doi: 10.1111/gcb.14792
Slette, I. J., Post, A. K., Awad, M., Even, T., Punzalan, A., Williams, S., et al. (2019). How ecologists define drought, and why we should do better. Glob. Change Biol. 25, 3193–3200. doi: 10.1111/gcb.14747
ter Steeg, H. (2018). Hemiphot.R: Free R Scripts to Analyse Hemispherical Photographs for Canopy Openness, Leaf Area Index and Photosynthetic Active Radiation Under Forest Canopies. Panama City, FL. Available online at: https://github.com/Hans-ter-Steege/Hemiphot
Wickham, H. (2016). ggplot2: Elegant Graphics for Data Analysis. New York, NY: Springer. doi: 10.1007/978-3-319-24277-4
Zeppel, M. J. B., Murray, B. R., Barton, C., and Eamus, D. (2004). Seasonal responses of xylem sap velocity to VPD and solar radiation during drought in a stand of native trees in temperate Australia. Funct. Plant Biol. 31, 461–470. doi: 10.1071/FP03220
Keywords: Agua Salud Project, drought, forest management, sap flow, teak, thinning, transpiration
Citation: Sinacore K, Breton C, Asbjornsen H, Hernandez-Santana V and Hall JS (2019) Drought Effects on Tectona grandis Water Regulation Are Mediated by Thinning, but the Effects of Thinning Are Temporary. Front. For. Glob. Change 2:82. doi: 10.3389/ffgc.2019.00082
Received: 07 October 2019; Accepted: 29 November 2019;
Published: 13 December 2019.
Edited by:
Julia Annick Schwarz, University of Freiburg, GermanyReviewed by:
Norbert Kunert, Smithsonian Institution, United StatesDirk Hölscher, University of Göttingen, Germany
Copyright © 2019 Sinacore, Breton, Asbjornsen, Hernandez-Santana and Hall. This is an open-access article distributed under the terms of the Creative Commons Attribution License (CC BY). The use, distribution or reproduction in other forums is permitted, provided the original author(s) and the copyright owner(s) are credited and that the original publication in this journal is cited, in accordance with accepted academic practice. No use, distribution or reproduction is permitted which does not comply with these terms.
*Correspondence: Katherine Sinacore, ksinacore@gmail.com