A Framework for Determining Population-Level Vulnerability to Climate: Evidence for Growth Hysteresis in Chamaecyparis thyoides Along Its Contiguous Latitudinal Distribution
 Neil Pederson1*
  Caroline Leland2 Daniel A. Bishop1,2 Jessie K. Pearl3,4 Kevin J. Anchukaitis3 Tessa Mandra1 Myvonwynn Hopton-Ahmed5
  Dario Martin-Benito6
- 1Harvard Forest, Harvard University, Petersham, MA, United States
- 2Tree-Ring Laboratory of Lamont-Doherty Earth Observatory and Columbia University, Palisades, NY, United States
- 3Laboratory of Tree-Ring Research, The University of Arizona, Tucson, AZ, United States
- 4Earthquake Science Center, U. S. Geological Survey, University of Washington, Seattle, WA, United States
- 5Mayfield Junior High School, Pasadena, CA, United States
- 6Forest Research Center INIA-CIFOR, Madrid, Spain
The impact of ecological and climatological factors on individual organisms over time and space is inherently complex and creates substantial uncertainty about how climate change will influence the global biosphere. To understand some of this complexity, we investigated the factors influencing individual growth of Chamaecyparis thyoides over 61 years within 18 populations across the ca 1500 km and 11 degrees of latitude. We then applied a vulnerability framework to understand how the variability of tree growth response to climate varies between populations and regions across our network. Surprisingly, we found the growth of trees in the central portion of our network responded more synchronously to warming and drought than trees in the southern end of our network, suggesting greater vulnerability in the central populations with continued warming. Our analyses and framework approach revealed substantial complexity in growth responses to climate within and between populations. We found potential resiliency within all populations, but higher inter-population than intra-population variability in response to climate. We found that latitude was an important proxy for the growth response to temperatures during the non-growing season and spring, but that ecosystem structure can modify the growth response and vulnerability to drought during the summer. The range of growth responses to warming is greater in the southern populations than in more northernly populations. This asymmetrical distribution of growth response across our study network provides evidence for a kind of ecological hysteresis, more southerly populations could be more resilient with warming. Despite the fact that this species primarily lives in wetlands, we found drought stress to be an important constraint on growth. Our study and analyses help to explain the disparities between forecasts of how climatic change might impact tree species and ecosystems over space.
Introduction
It is uncertain how global environmental change will alter ecosystems in coming decades (Friedlingstein et al., 2014; Duveneck et al., 2016; Swanston et al., 2017). A component of this uncertainty stems from the unique responses of individual organism to climate. The potential for great variability at the individual scale can add complexity to the dynamics and ecology of ecosystems. The multitude of ecological and climatological factors that influence plant growth are intrinsically complex, as they may compound and change over space and time (Billings, 1952; Turner, 2010; Heffernan et al., 2014; Zscheischler et al., 2018). Given the range of environmental heterogeneity and the uncertainty of future climate variability, forecasts on how the global biosphere will respond to future change are diverse and often contradict each other (e.g., Friedlingstein et al., 2014).
The urgency of understanding climate vulnerability of tree species and forests has stimulated research aimed toward quantifying the climate sensitivity of individual trees (e.g., Carrer, 2011; Clark et al., 2012; Itter et al., 2017; Laskurain et al., 2018). Traditionally, the climatic response of a species or populations has been determined using an averaged time-series of growth at the stand or landscape level (Fritts, 1976). While this approach maximizes the species climate response, it does so by reducing the inherent endogenous, genotypic and phenotypic, and exogenous complexity of individuals in a population. Because stand structure and microtopography have been shown to alter the climatic sensitivity of trees in a variety of forests and environmental conditions (e.g., Cescatti and Piutti, 1998; Bunn et al., 2005, 2018; Martin-Benito et al., 2011; Bottero et al., 2017; Lloyd et al., 2017), investigating the climate response of individual trees can be leveraged to illustrate how these interactions might increase or reduce potential vulnerability of a population to climatic change. Estimating the uncertainty of the response of vegetation to climate change, especially if we are to gain insight on the impact over a broader range of climatic variability, requires research that investigates the growth of individuals from population to broad regional scales over multiple decades.
Here, we introduce a framework to gain inference on population-level vulnerability to climatic variability through the examination of individual tree growth. The framework is based upon the interplay between the range of individual tree response to climate within a population and potential climatic change (Figure 1). To illustrate the framework, let’s compare two populations, Populations A and B. Trees in Population A have a symmetrical distribution of climate-growth responses to summer water availability, where responses range from positive to neutral and negative. Trees in Population B have an asymmetrical distribution of climate growth responses with a strong positive skew. Within this framework, more trees in Population B would be expected to decline in growth during a severe, multiannual drought, where some trees in Population A may actually grow more with the same drought. In this case, Population A could persist through the survival of the individuals who respond positively to drought or, for the trees with a neutral response (correlation coefficient around zero), are rather unaffected by drought. Thus, Population B would be more vulnerable to sustained reductions in water availability than Population A. Scaling up, if multiple populations across a region have a large range of individual growth responses, the species could persist at the regional level through the survival of individuals in multiple populations. The term used hereafter for populations where more trees respond to climate similarly is “climatic growth synchrony,” a term that may also be interpreted as representing populations that are potentially more vulnerable to climate change.
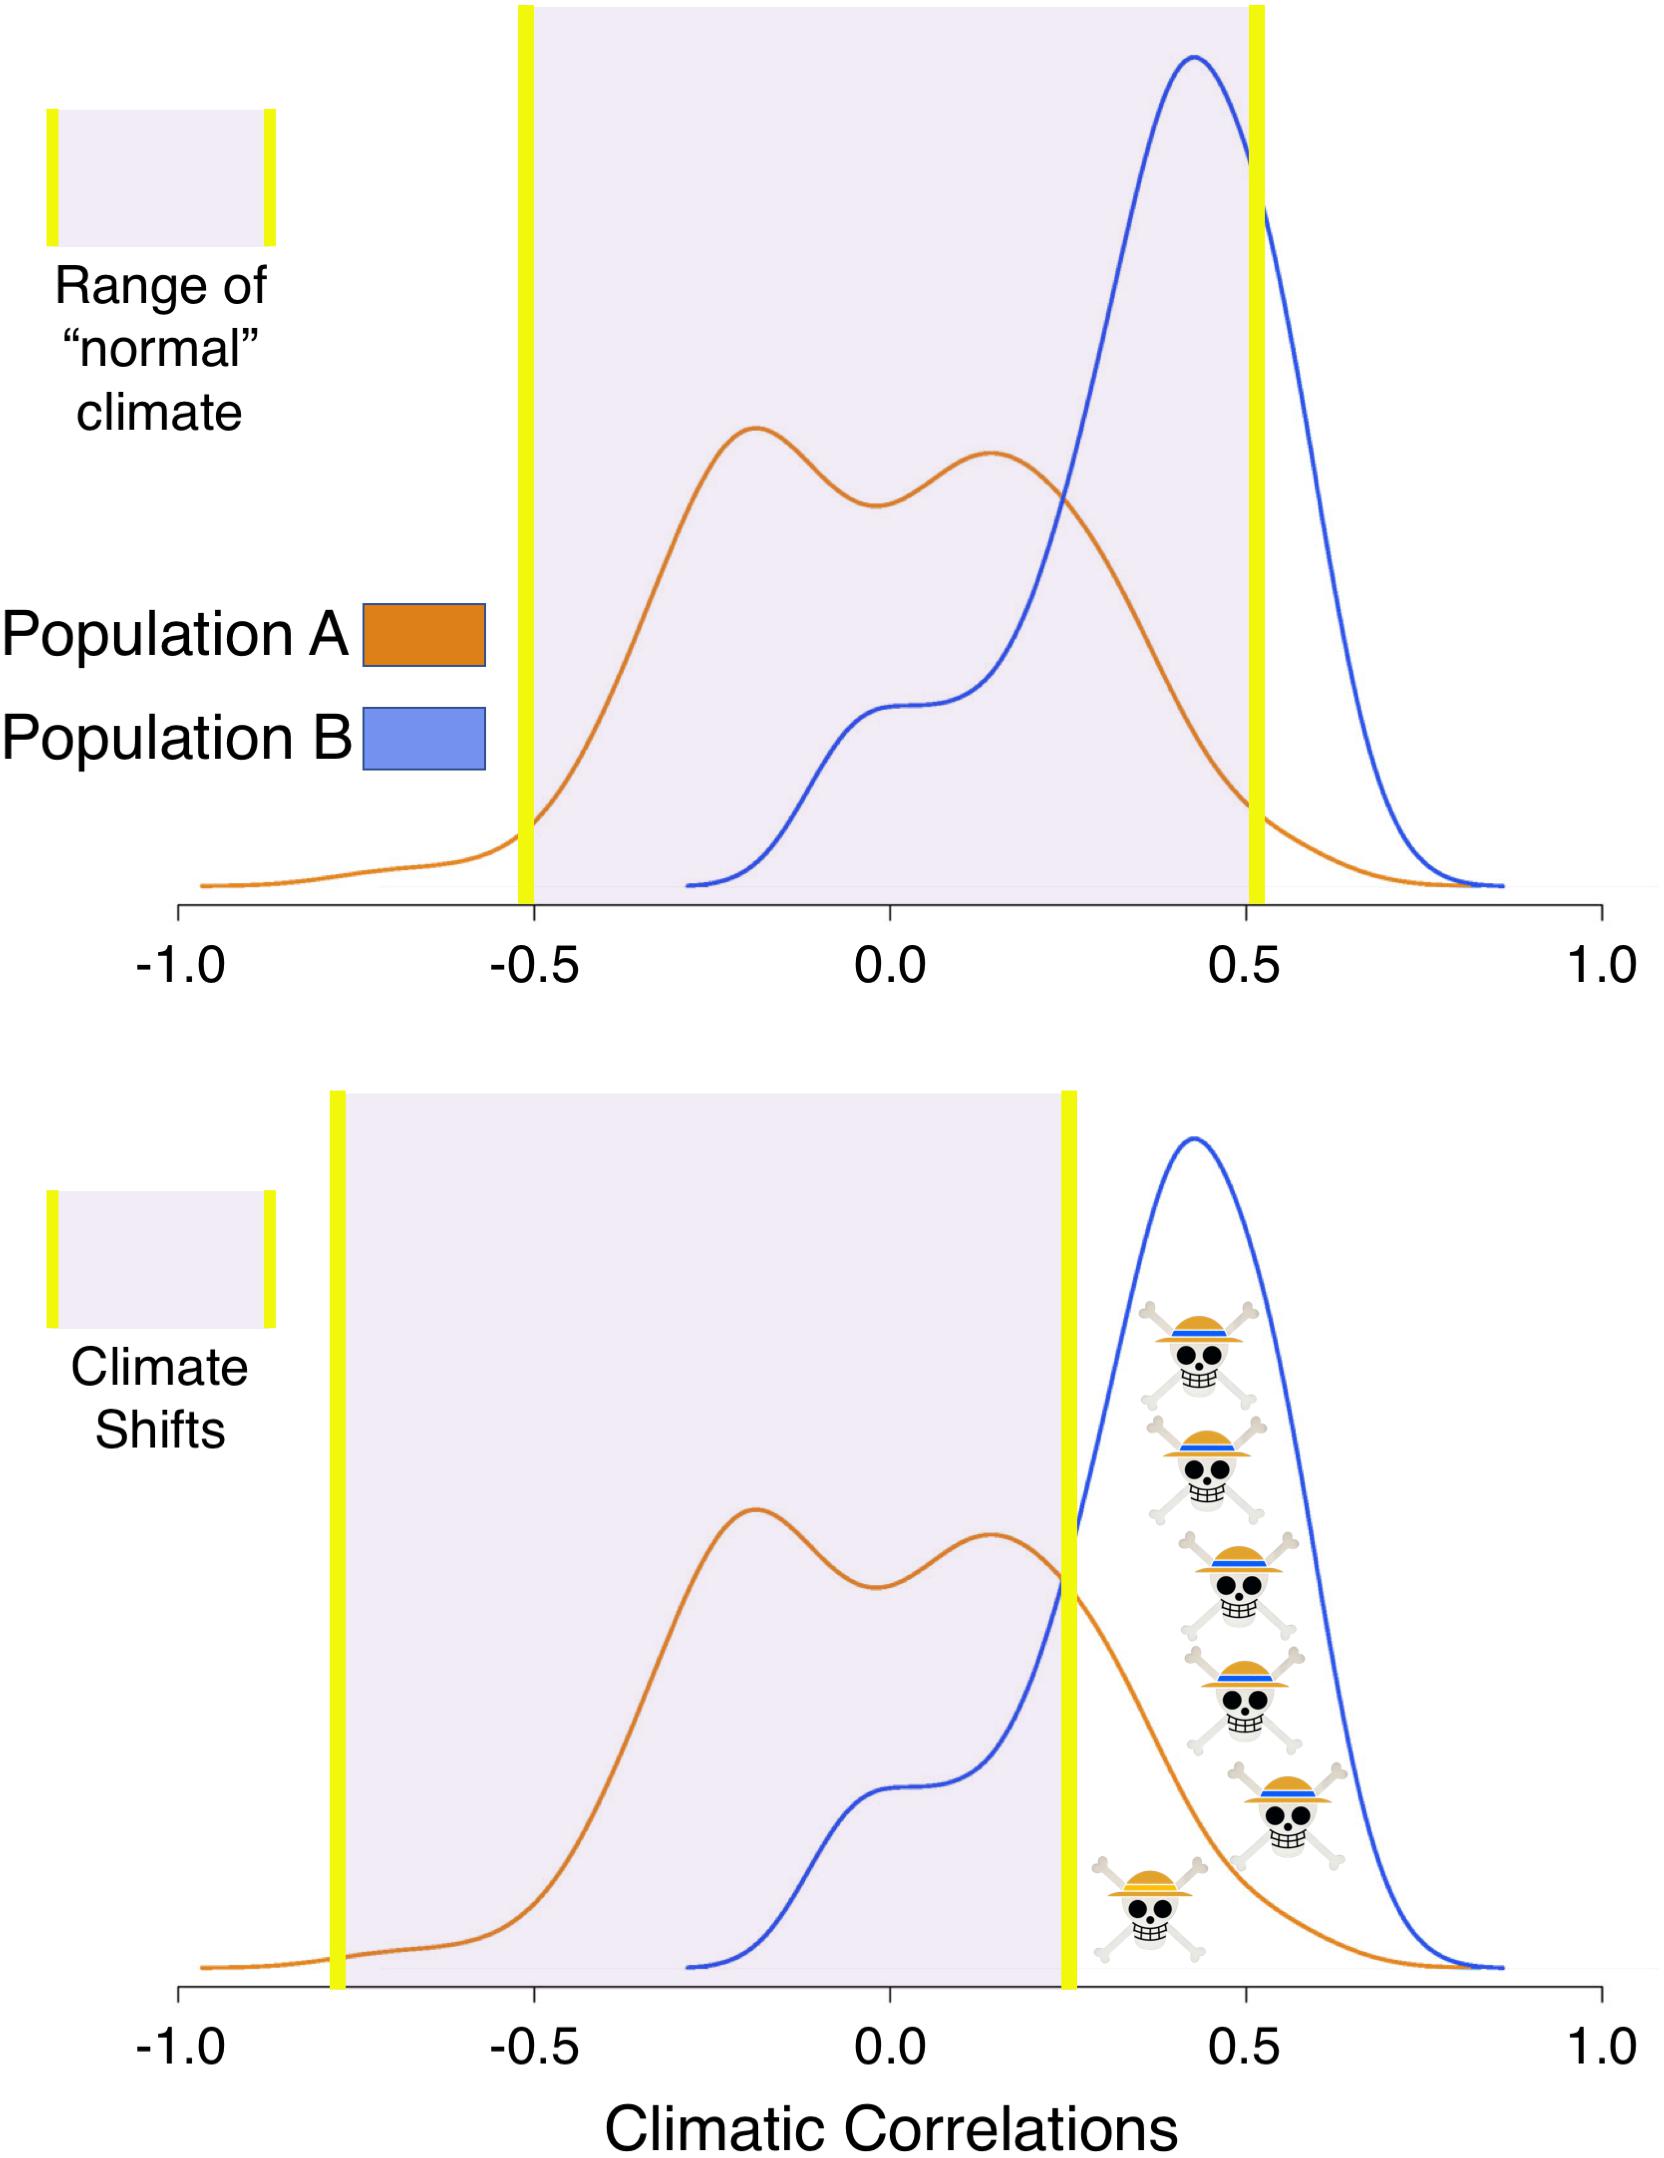
Figure 1. Population vulnerability Framework. In the first scenario (top panel) the climate is within a range suitable for the growth of most trees in Population A (orange, centered around zero) and Population B (blue, positively skewed). Using tree-level correlations to minimum temperatures as an example, the distribution of correlations indicates that in Population B, warming would enhance growth. In the second scenario (bottom panel), climate cools, making Population B, where more individuals correlate positively with temperature, more vulnerable to this particular shift in climate. See text to see how the framework is applied.
We apply our framework to 61 years of tree growth from a network of 18 Chamaecyparis thyoides populations that span ca 1500 kilometers of its contiguous latitudinal distribution, starting with its population in central Maine at the northern end of its distribution to a lower latitudinal distribution in central South Carolina (Figure 2A and Table 1). Chamaecyparis thyoides (L.) B.S.P. (Atlantic white-cedar) is an obligate wetland species that lives within 200 kilometers of the Atlantic Ocean and Gulf of Mexico. Chamaecyparis thyoides does not typically live more than 50 m above mean sea level and is currently surrounded by a matrix of intensive land-use in a heavily populated portion of eastern North America. The species is a focus for local and regional conservation programs (see the Atlantic White Cedar Initiative1) due to its foundational role in wetland ecosystems (Laderman, 1989) and its value to local biodiversity. Investigating its vulnerability to climate change is important for local and regional biological conservation goals.
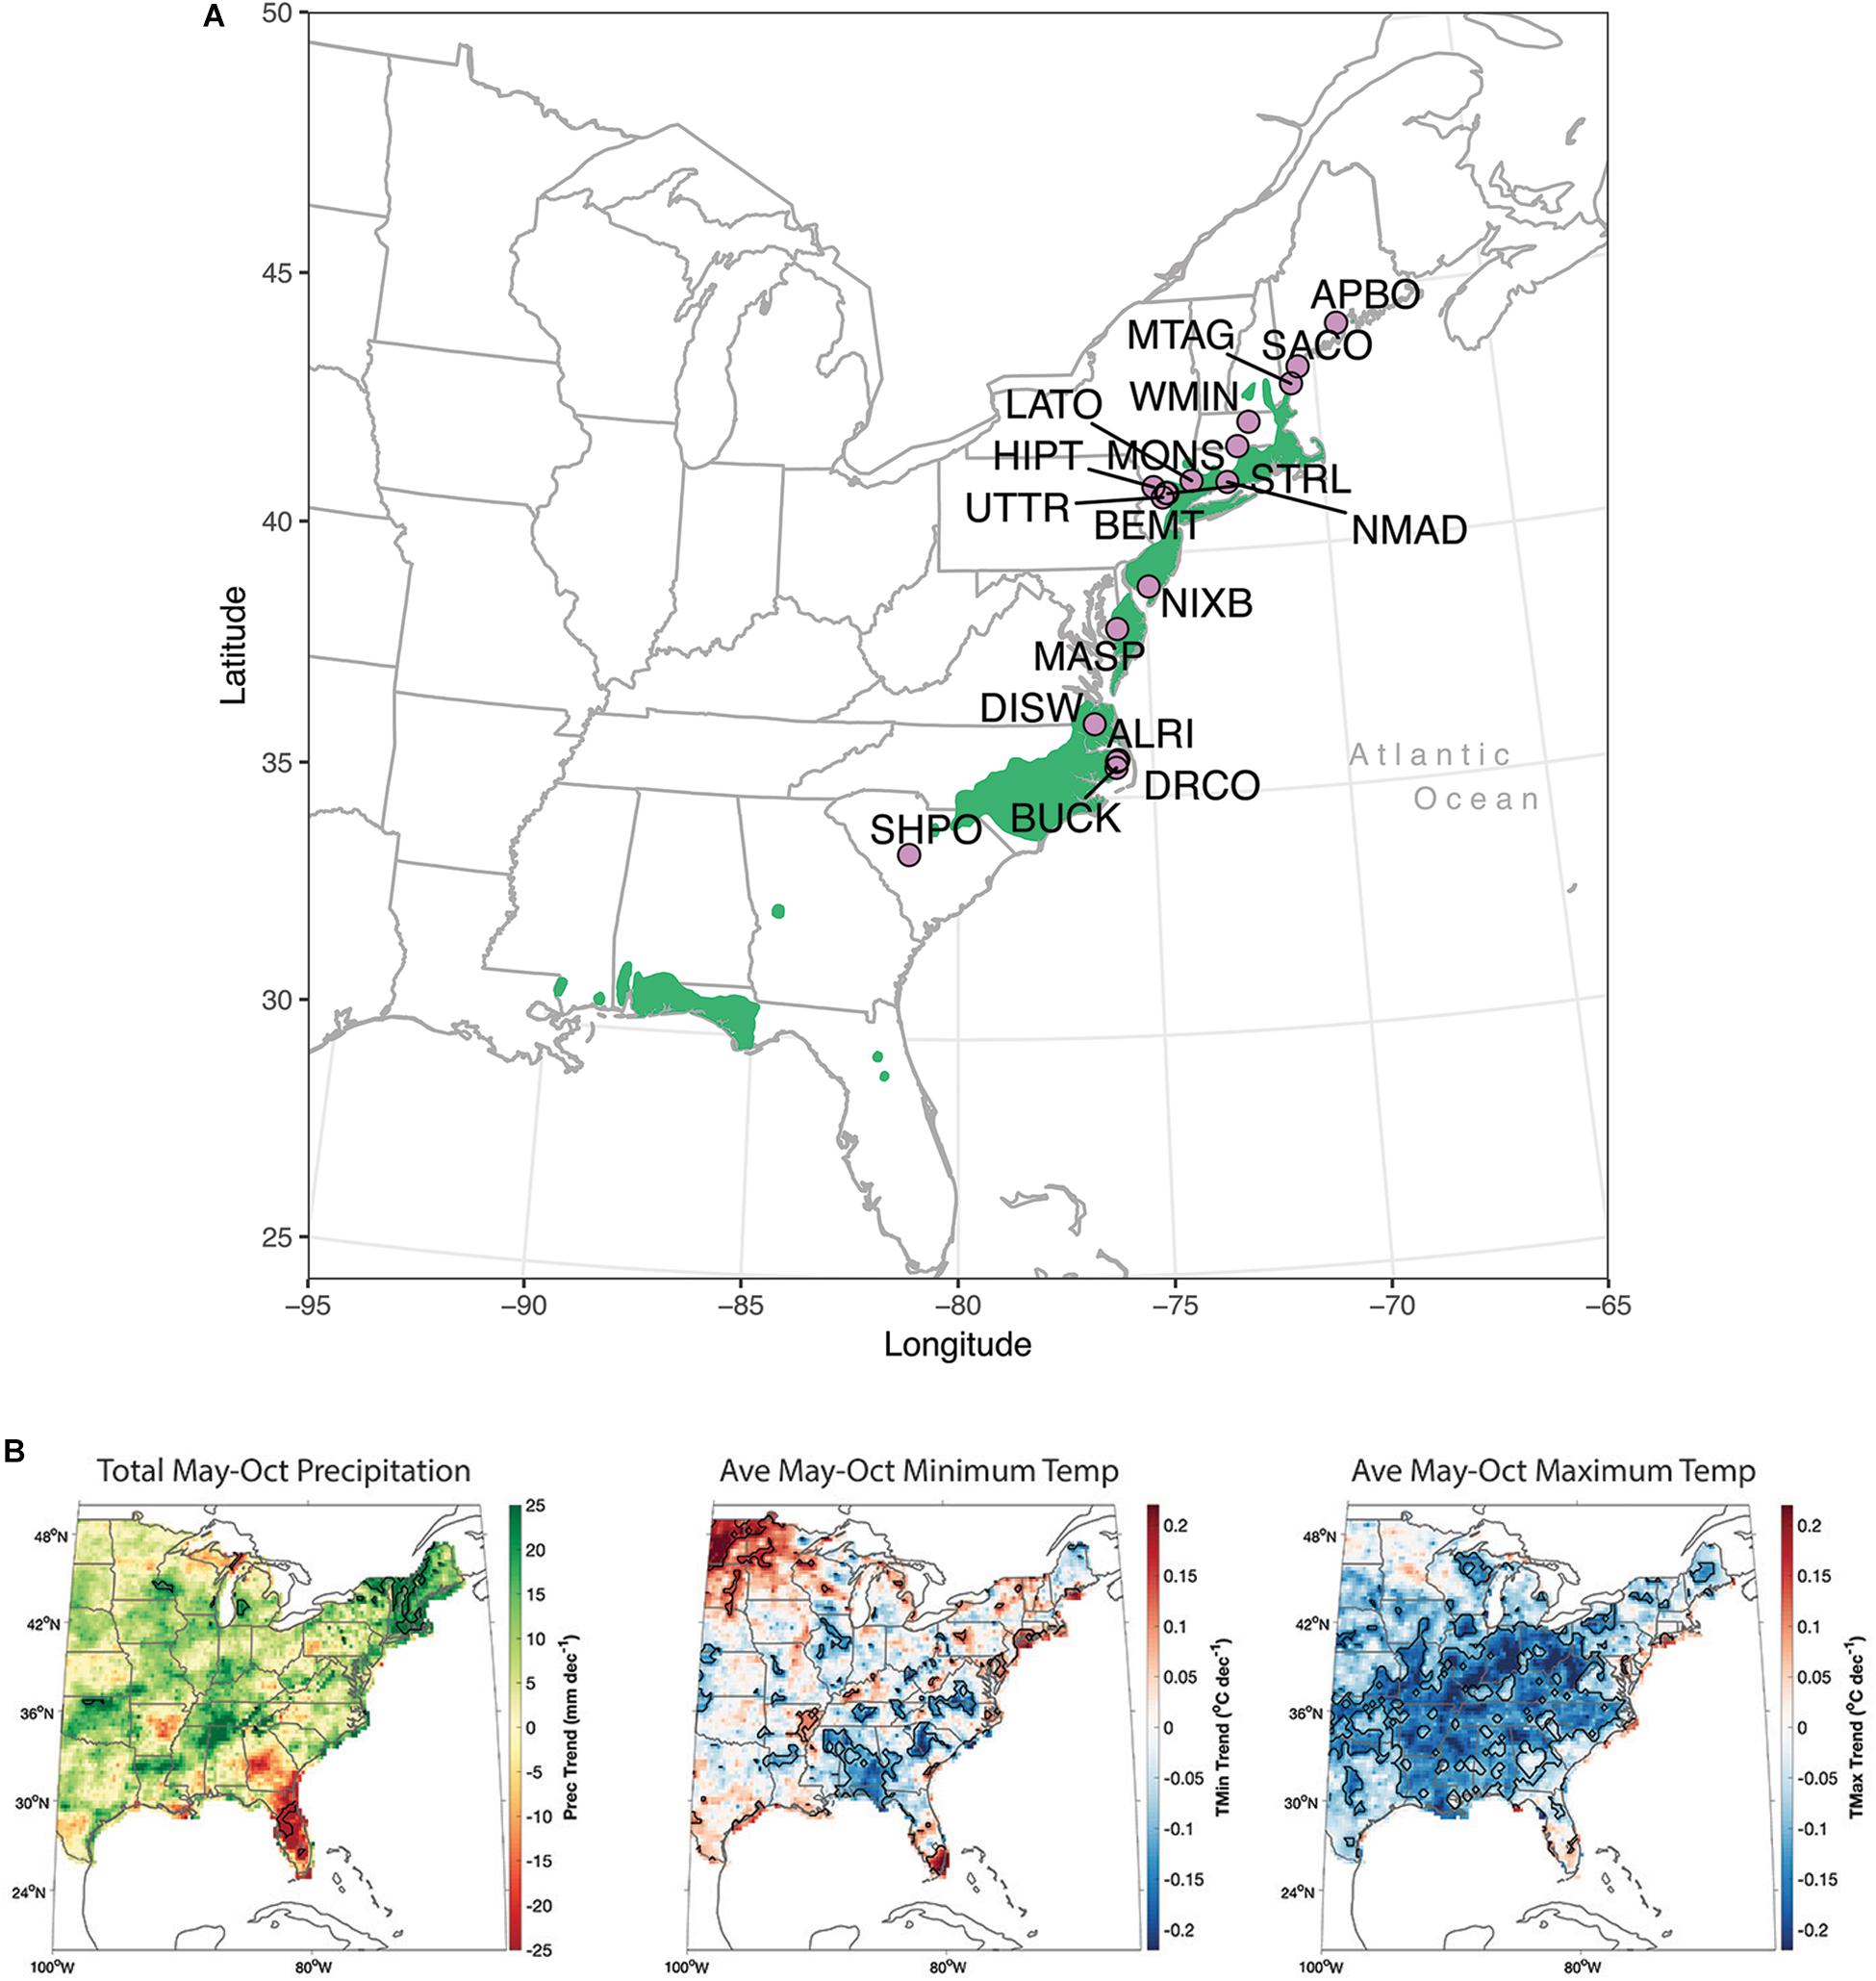
Figure 2. (A) Network of 18 populations of Chamaecyparis thyoides (lavender circles) within its distribution (in green). Population names for each abbreviation are in Table 1. (B) Linear trends in warm season (May-October) PRISM total precipitation, average monthly maximum, and minimum temperatures for the period of study, 1940–2000.
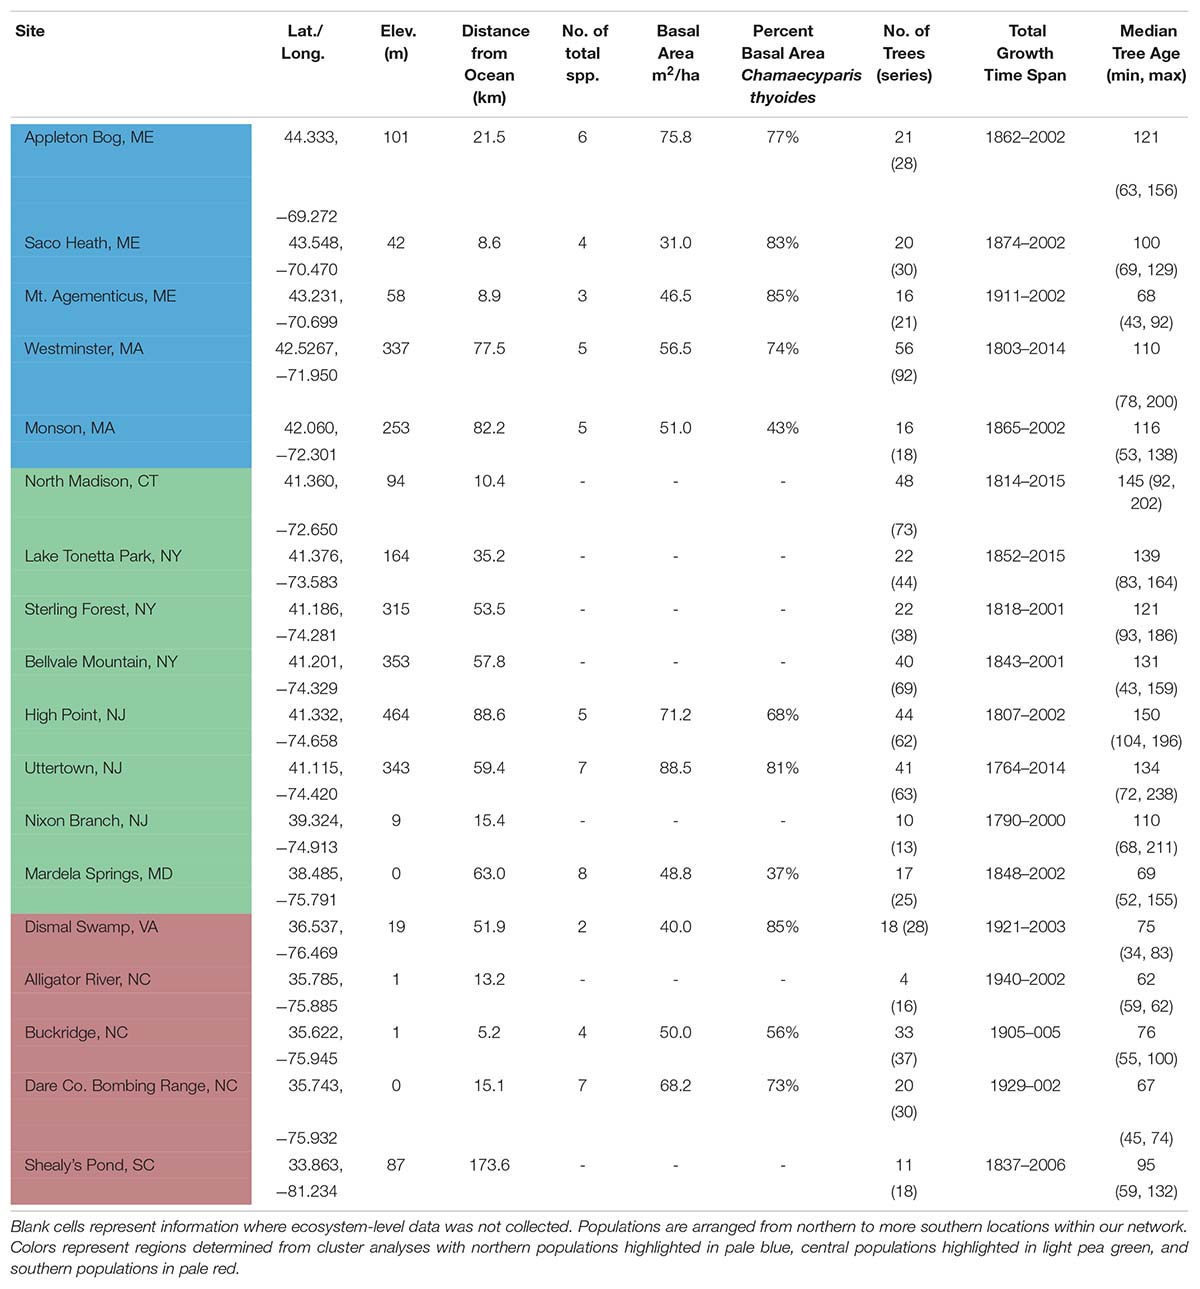
Table 1. Location, site information, composition, structure, and sample replication of 18 Chamaecyparis thyoides populations for this study, arranged from highest to lowest latitudes.
Studies on the long-term growth of trees, including those on Chamaecyparis thyoides, have shown contrasting results on the influence of local and regional influences on growth. Multiple studies suggest regional climate constrains growth such that it will be synchronous over broad regions despite differences in ecosystem structure, topography, and local hydroclimate (e.g., Brubaker, 1980; Cook, 1991; Graumlich, 1993; Meko et al., 1993; Cook et al., 2001). However, microsite topography has been shown to influence climate-growth dynamics of high elevational Pinus balfouriana and treeline Pinus longaeva (e.g., Bunn et al., 2005, 2018; Lloyd et al., 2017). Some studies of Chamaecyparis thyoides reveal large-scale synchrony in the climate-growth dynamics (Hopton and Pederson, 2005; Pearl et al., 2017), while other studies indicate local hydrology and site conditions are an important factor in the growth, survival, and climate response of Chamaecyparis thyoides (e.g., Eagle, 1999; Mylecraine et al., 2005; Seim et al., 2006; DeBerry and Atkinson, 2014; Pearl et al., 2019). Likely, both regional and local climatic constrains operate at different scales or during different periods in time, as has been shown for Chamaecyparis thyoides (Atkinson, 2019).
Important to the derivation of our research questions and hypotheses here, prior research on the long-term growth of trees indicates differences between conifers and broadleaf species in the climatic response over space (e.g., Martin-Benito and Pederson, 2015; Cavin and Jump, 2017; Seftigen et al., 2018). Notably for conifers, but not for broadleaf species (e.g., Pederson et al., 2004; Tardif et al., 2006) cool temperatures tend to constrain growth in trees near the northern end of their distributions (e.g., Cook and Cole, 1991; Cook et al., 1998; Bhuta et al., 2009). Growth of populations of Chamaecyparis thyoides closer to their northern distribution is most strongly constrained by cool temperatures (Pederson et al., 2004; Hopton and Pederson, 2005; Pearl et al., 2017). Preliminary evidence from Hopton et al. (2004) indicates that precipitation and water availability tends to become more important to the growth of Chamaecyparis thyoides that are closer to the southern end of the distribution of the species, similar to the response of several species in mesic North America and Europe (Cook and Cole, 1991; Bhuta et al., 2009; Babst et al., 2013; Harvey et al., 2019).
Given these results on the long-term growth of conifers over space, we expect greater variation in the climate response, and perhaps lower correlations, of Chamaecyparis thyoides trees in the more southerly populations because reduced regional climate constraints, i.e., higher temperatures and more abundant precipitation, could allow for local variables, such as local hydrology, to play a more important role on growth of trees within each population. Due to the cooling during the summer over much of the southeastern United States. during the late 20th century (Mascioli et al., 2017; Figure 2B), we expect that heat stress during our period of analysis could be relatively low, potentially reducing the influence of large-scale climate (Hiddink and Kaiser, 2005), and increasing the influence of local conditions even further.
We have four hypotheses that address two broad questions. First, we ask: “How do Chamaecyparis thyoides populations respond to climate across its latitudinal range?” We address this question by testing the following hypotheses:
(i) growth in the majority of Chamaecyparis thyoides populations will increase with warmer winter and spring temperatures toward the northern end of our network,
(ii) growth in the majority of Chamaecyparis thyoides populations will increase with more water availability (low temperature, high precipitation, or the combination of both) during the growing season, with stronger correlations to growing season water availability in the more southern end of our network than in the more northern end.
The next set of hypotheses derive from the second question: “Does synchrony in tree-level response to climate in Chamaecyparis thyoides change over space?” Building off of previous work cited above (e.g., Cook and Cole, 1991; Cook et al., 1998; Bhuta et al., 2009), we test the following hypotheses:
(iii) tree-level climate responses in more northerly Chamaecyparis thyoides populations are more synchronous than more southerly populations due to the top-down climatic constraint of colder temperatures and lower precipitation limiting growth across the entire northern portion of the network.
(iv) responses of more southerly Chamaecyparis thyoides populations to all climatic variables and seasons will be less synchronous than northern populations because large-scale climatic constraints will be less limiting for growth.
To test these hypotheses and explore potential vulnerability of populations to climatic change, we calculate climate-growth correlations between annual growth at the individual and population scale, and annual climate variations from 1940 to 2000 across our study network. Because ecological and physical factors can influence the response of trees to climate, we also explore how stand attributes and site characteristics (forest density, age structure, elevation, etc.) and potential mechanisms that would account for the responses of individual, population, and regional vulnerability to climatic change.
Materials and Methods
Research Network
We created a network of Chamaecyparis thyoides growth records from 18 populations in the eastern United States to assess the relationship between climate and tree growth along its contiguous distribution (Figure 2A). We selected Chamaecyparis thyoides ecosystems dominated by trees that were likely at least 100 years old. The network spans roughly 11° of latitude (33°−45°N), from South Carolina to population of Chamaecyparis thyoides at the highest latitude in Maine (Figure 2A and Table 1). In addition, sampling in most sites (except Alligator River and Buckridge) targeted canopy dominant trees, so their responses may not fully represent entire populations (Nehrbass-Ahles et al., 2014; Klesse et al., 2018b). We did core across a range of tree diameters and potential tree ages in an attempt to increase the ecological variability in our network (Pederson et al., 2004; Pederson, 2005).
The climate along the latitudinal gradient our network varies substantially. We used monthly precipitation totals and monthly mean maximum and minimum temperatures derived from the 800 m resolution PRISM Climate Group gridded dataset to characterize regional climatology across the network (Daly et al., 2008). Climate data was averaged for temperature and summed for precipitation seasonally for winter (December–February), spring (March–May), summer (June–August), fall (September–November), and the warm season (May–October). During our period of study (1940–2000), the coolest portion of our network was at higher latitudes (average daily winter minimum temperature of −9.7°C, average daily summer maximum temperature of 13.1°C) while the southern portion was the warmest portion of our network (−0.1°C in the winter, 19.2°C in the summer). Focusing on seasons that might be most pertinent to tree growth, areas at greater latitudes received the least amount of precipitation (550.7 mm of precipitation during the warm season, 267.1 mm during summer, and 1146.8 mm annually), while areas at lower latitudes received the most during the warm season and summer (669.7 mm and 378.3 mm, respectively) and the core of our study area received the most annually (1237.0 mm) (Supplementary Table S1).
Trends in precipitation and temperature from 1940 to 2000 vary substantially over space (Figure 2B and Supplementary Figure S1). While warm-season average daily maximum temperatures have cooled, most strongly in the southern portion of our network, average minimum temperatures have warmed significantly annually, during the warm season, and during the summer along the coast (annual trends are similar, but not presented). The most consistent warming trends are rising minimum temperatures in southern New England and New York State (Supplementary Figure S1). It is important to note that our study period follows the Dust Bowl of the 1930s, one of the warmer periods across a large portion of the contiguous United States. Our study period also includes the 1950s to 1970s, a period of enhanced summer and winter cooling (Mascioli et al., 2017). In stark contrast to anthropogenic global warming, regional cooling in this part of the United States. from 1940 to 2000 was likely due to natural climate variability (Mascioli et al., 2017). While there is drying during the summer in the lowest latitudes of our network, notably in southern Virginia and northeastern North Carolina (Supplementary Figure S1), our analyses of instrumental climate data across the eastern United States. indicates there is a general pattern of wetting over our network annually and during the warm season (Usgcrp, 2018), consistent with Pederson et al. (2015) and Bishop and Pederson (2015).
Tree-Growth Data
Age structure of our data indicates that most sampled forests were likely recovering from either a period of timber extraction or forest management; management has been more recent in the more southern forests of our network (Scott Smith [resource manager of Dare Co. Bombing Range in 2003], John Taggart and Mike Schafale [Dismal Swamp], personal communication, June 2004). Despite this, the median age of sampled trees in each population ranged from 62 to 150 years (Table 1). Forest composition, tree density, and basal area were estimated using basal area prism measurements in 11 of our 18 populations. Diameter at breast height (DBH) was recorded for each cored tree as a part of a forest structure census. Population-level forest composition, tree density, elevation, and distance from the Atlantic Ocean are in Table 1.
Increment cores were dried, stabilized, sanded, and visually crossdated within each population using standard dendrochronological methods (Stokes and Smiley, 1968). Radial increments were measured to the nearest ± 0.001 mm. Hypothetical calendar dates for each ring, as derived from visual crossdating, were statistically tested and confirmed using the program COFECHA (Holmes, 1983).
To homogenize variance in all Chamaecyparis thyoides growth series associated with tree allometry, size, tree age, and potential growth releases or declines, we applied a two-step standardization process. First, we applied a modified exponential curve, or a straight line constrained to having a slope ≤zero, and then we used a cubic smoothing spline with a 50% frequency response cut-off set at two-thirds the length of each series (Cook and Peters, 1981; Cook, 1985). Prior to detrending, variance was stabilized by applying a power-transformation to all series (Osborn et al., 1997), so that residuals could be calculated by subtraction from the curves, instead of ratios, to produce tree-ring indices (Cook and Peters, 1997). Final time-series of growth was produced using the robust mean of all indices within each population. We used the same standardization procedure on all cores within each tree to produce tree-level time-series of growth. Residual chronologies produced by the program ARSTAN (Cook and Krusic, 2008) were used in all analyses. Residual chronologies are processed to remove as much serial autocorrelation as possible, optimizing comparisons of interannual variability of radial increment without the influence of previous growth legacies or trends (Cook, 1985). Biweight robust means of all tree-ring indices were computed at the population level to develop population records of annual radial increment.
Our detrending approach, to reduce the influences of tree size, a dominant factor of growth (Foster et al., 2015), and competitive and disturbance processes (Cook, 1985; Cook and Kairiukstis, 1990), emphasizes the annual variation in growth. Part of the range in responses at tree level, therefore, may have to do with detrending leaving more non-climate signal in each tree, which evens out at population level.
Cluster Analysis
To determine the extent of common interannual variability in growth among trees across the Chamaecyparis thyoides network, we performed hierarchical cluster analysis (hclust package in R; Murtagh and Legendre, 2014; R core team, 2017) and correlation analysis on all time-series of growth at the population level. By using residual chronologies for these analyses, identified clusters represent populations with similar responses to interannual climatic variation. Based on a visual assessment of the dendrogram, we partitioned the network into regions based on a k-means approach to determine their spatial characteristics. We conducted a second analysis to identify potential regional clustering in the interannual variability of radial increment using a correlation matrix across the network. Clusters in this analysis were determined using the “corrplot” function in R (Wei et al., 2017).
Determining Climate-Growth Relations
Tree growth does not adhere to the human calendar. It might be initiated by factors and environmental cues that coincide with the human construction of seasons, but investigations into stem growth and climate-radial growth dynamics indicate that using climate seasons might not best capture when trees grow and what aspects of climate constrain or propel growth (Kim and Siccama, 1986). For example, most radial growth increment often occurs within 2–3 months and is mostly complete by late July in the Northern Hemisphere (Deslauriers et al., 2007; McMahon and Parker, 2015; Ziaco and Liang, 2019). High resolution analysis indicates the peak of climate-radial growth dynamics can occur in narrow bands that straddle month boundaries, like in Italy where peak dynamics occurs at the end of May and beginning of July (Carrer et al., 2017). Complicating this within our network, there are likely important differences in the timing of tree growth between populations due to differing seasonality over 11 degrees of latitude. That is, moisture stress might be more vital in May to trees in the southern end of our network while June is a critical period of moisture availability for trees in the northern portions of our network. Restricting our analysis to the same common seasons for all populations regardless of their latitude could mask differences in how changing seasonality over larger scales could affect growth. With these concerns as a guide, we first sought to test whether an approach that reflected potential local regional growing seasons might aid us in discerning differences in climate sensitivity between populations over our study area. For simplicity in this test case, we used daily meteorological data from PRISM to define the growing season for each based on the time after the average last freezing day (<0°C) of the year and the first freezing day in the fall of that same year between 1981 and 2017, the full period available at the time of this analysis (Prism Climate Group, 2020). Once this period was determined for each population, we summed or averaged all potential climatic variables during the growing and non-growing seasons for correlation analysis with population-level growth. This method prevented us from being able to assess sub-seasonal climate-growth relationships and masked sub-seasonal climate-growth relationships and the comparison of climate-growth relationships at the population levels. As a result, we abandoned this approach and re-started our analyses using more traditional approaches.
Our next approach to investigate potential differences in the response of growth to climate was to use traditional seasons: winter (prior-year December through current-year February), spring (March–May), and summer (June–August). Because stored non-structural carbohydrates are used for growth in subsequent years (Trumbore et al., 2002; Kagawa et al., 2006; Carbone et al., 2013), we included climate during the prior summer as a potential factor in the tree growth. We summarized this analysis at the regional level using the regions determined by cluster analysis. To compare and complement that approach, we then evaluated the climate response of Chamaecyparis thyoides growth at the population level using monthly climate variables. The nearest grid point to each population was selected to calculate correlations between monthly climate data and the residual chronologies for the 1940–2000 common period. We computed monthly Pearson’s correlation coefficients against all climate variables. Note: climate analyses for individual tree growth was determined using this same methodology.
Using what we learned from the seasonal and monthly analyses, we then developed a data-driven approach where we identified the seasons that most strongly and most commonly drove population-level growth within each region that was determined by cluster analysis. In this way, seasons could be defined broadly and, occasionally, longer than the traditional 3-month season. We then made reciprocal comparisons for the dominant seasons in a particular region against the trees and populations in other regions within our network. For example, the strongest, most consistent responses to climate for populations in the central region were with total May–August precipitation and April–August average maximum monthly temperature. The growth of trees and populations in the northern and southern portions of our network were then correlated to these two seasons to compare all trees and populations using the same metric for determining potential differences across our network. The strongest response of tree growth to climate in northern populations was average minimum monthly temperature from prior-year November through May of the current year. The growth response of trees and populations in the southern and central regions were compared to this season.
To compare the distribution of seasonal climatic responses within populations and between regions, we estimated whether the continuous probability distribution functions of climate correlations at individual-tree level differed between regions using the non-parametric two-sample Kolmogorov-Smirnov test. We also tested the stability of the continuous probability distribution functions of climate correlations using bootstrapping techniques. For the distribution of tree-growth correlations to climate at the regional scale, we ran 100 bootstraped PDFs, removing 25% of the trees in each region. We also conducted bootstrap analysis on these distributions on populations at the regional level by removing 1 population for each region to determine similarities and differences between regions.
Potential Geophysical and Ecological Factors Influence Climate-Growth Relations
We used linear mixed-effect models (LMEM) to determine the effect of site factors on the climate responses of individual trees (Zuur et al., 2009), and to account for the lack of independence between observations caused by the hierarchical structure of data (i.e., trees grouped within populations). In addition, linear mixed effect models allow us to analyze the variance not explained by fixed effects by allocating the variance to different hierarchical levels or random effects, in our case trees and populations.
These models were fit for the 11 populations for which stand density was available (Table 1); stand density was inferred from measured basal area per hectare at the time of sampling. For our purposes here, stand density was considered as a population-invariant variable measured at sampling time. Other variables included for the initial tests were: tree species diversity; classes of understory shrub density (0, little to no shrubs to 4, high density); wetland type, genetic factors; median, minimum, and maximum diameter at breast height; median, minimum, and maximum tree age; latitude; longitude; elevation (m); distance to the Atlantic Coast (m); site slope; site aspect; distance to open water; and species-level plant traits derived from the TRY database (Kattge et al., 2011). Distance to open water is used as a proxy for rooting height above the water table. Distance to the coast represents the nearest point of the Atlantic Ocean in any direction from each site. Genetic factors were derived from Mylecraine et al. (2004). While the genetics of our populations in their analysis fell into one region, we used clusters within that region to put populations in classes from 1 to 10, where classes 1 and 2 were most related to each other and classes 1 and 10 were most distantly related to one another. Some populations in our study were sampled by Mylecraine et al. (2004), but several were not. For the populations not sampled for genetics, we assigned classes based on their proximity to the nearest population sampled for genetics. Wetland type was derived from Laderman (1989) and U.S. Fish and Wildlife Service (2019). Shrub density was classed in categories of 0–25%, 25–50%, 50–75%, and 75–100% based on photographs from each site. Forest density and tree diversity was collected in 11 ecosystems using 2- and 3-meter factor cruise prisms (Table 1).
We started by fitting a model of growth indices with selected climate variables as fixed effects from those that are highly correlated with growth at tree and population level (see Results, Supplementary Figures S3–S5). Prior to fitting the models, all seasonal climate variables were centered and scaled while maintaining trends in each series. A level of p < 0.05 was used for significance testing of variables in the model. Radial-growth data can be highly autocorrelated, which could result in biased estimations of confidence intervals of parameter estimates in the models (Grégoire et al., 1995). Thus, we included an autoregressive parameter of order 1 to account for the potential temporal autocorrelation in growth indices within the same tree. Along these lines, because we used the residual growth indices, the autoregressive structure is greatly reduced (Cook and Kairiukstis, 1990). At this stage of model comparison, models were fit with maximum likelihood estimations. At each step, models were compared to the previous, more parsimonious model based on Akaike’s Information Criterion (AIC) decrease to check for significant model improvements. This best-fit model was checked for several assumptions such as temporal correlation, normal distributions, and homoscedasticity of residuals (homogenous variance), as well as non-collinearity of independent variables. Multicollinearity of variables was checked by assuring that the variance inflation factor remained below a recommended threshold value of three (Zuur et al., 2010).
After a best-fit model with only fixed effects was found, we explored random effects by considering both intercepts and slopes at two hierarchical levels (tree, population). Because our aim was to analyze the variability of the effect of climate at individual tree level within populations, we included random intercepts and slopes for all explanatory variables, excluding interactions. We used the log-likelihood ratio chi-squared test to compare the importance of different random effect structure, i.e., the same variables, but different hierarchical levels sites or both sites and trees. All linear mixed effects models were fitted using the package nlme (Pinheiro et al., 2012). We estimated marginal and conditional R2 for the model (including fixed effects only or both fixed and random effects) following Nakagawa and Schielzeth (2013) extended for random slopes by Johnson (2014).
All R packages used here are from in R statistical software (version 3.4.2; R core team, 2017).
Results
Regional Radial Growth Patterns
Hierarchical cluster analysis and correlation analysis conducted on residual growth chronologies indicate four clusters of populations within our network (Figure 3). Moving from the northern end of our network to the southern end, the first group is composed of four or five sites, depending on the analysis, ranging from central New England to coastal Maine. One outlier population for this group, Saco Heath, Maine, correlates positively with other northern populations, but hierarchical cluster analysis groups it with the southernmost populations. Correlation reveals similarly weak, but positive, correlations of the Saco Heath populations to the populations in North Carolina on the Albemarle Peninsula, Buckridge, and the Dare County Bombing Range (Figure 3C). Given the weaker correlation statistics and proximity to the more northern populations, we group Saco Heath with those populations, a grouping called hereafter the northern region. The next grouping falls in the north-central portion of our network and hereafter is called the central region. Both hierarchical cluster and correlation analyses cleave this portion of our network to the same size populations. We note that the annual growth of populations in the central region correlate from 0.2 to 0.4 to the growth of populations in the northern region (Figure 3C).
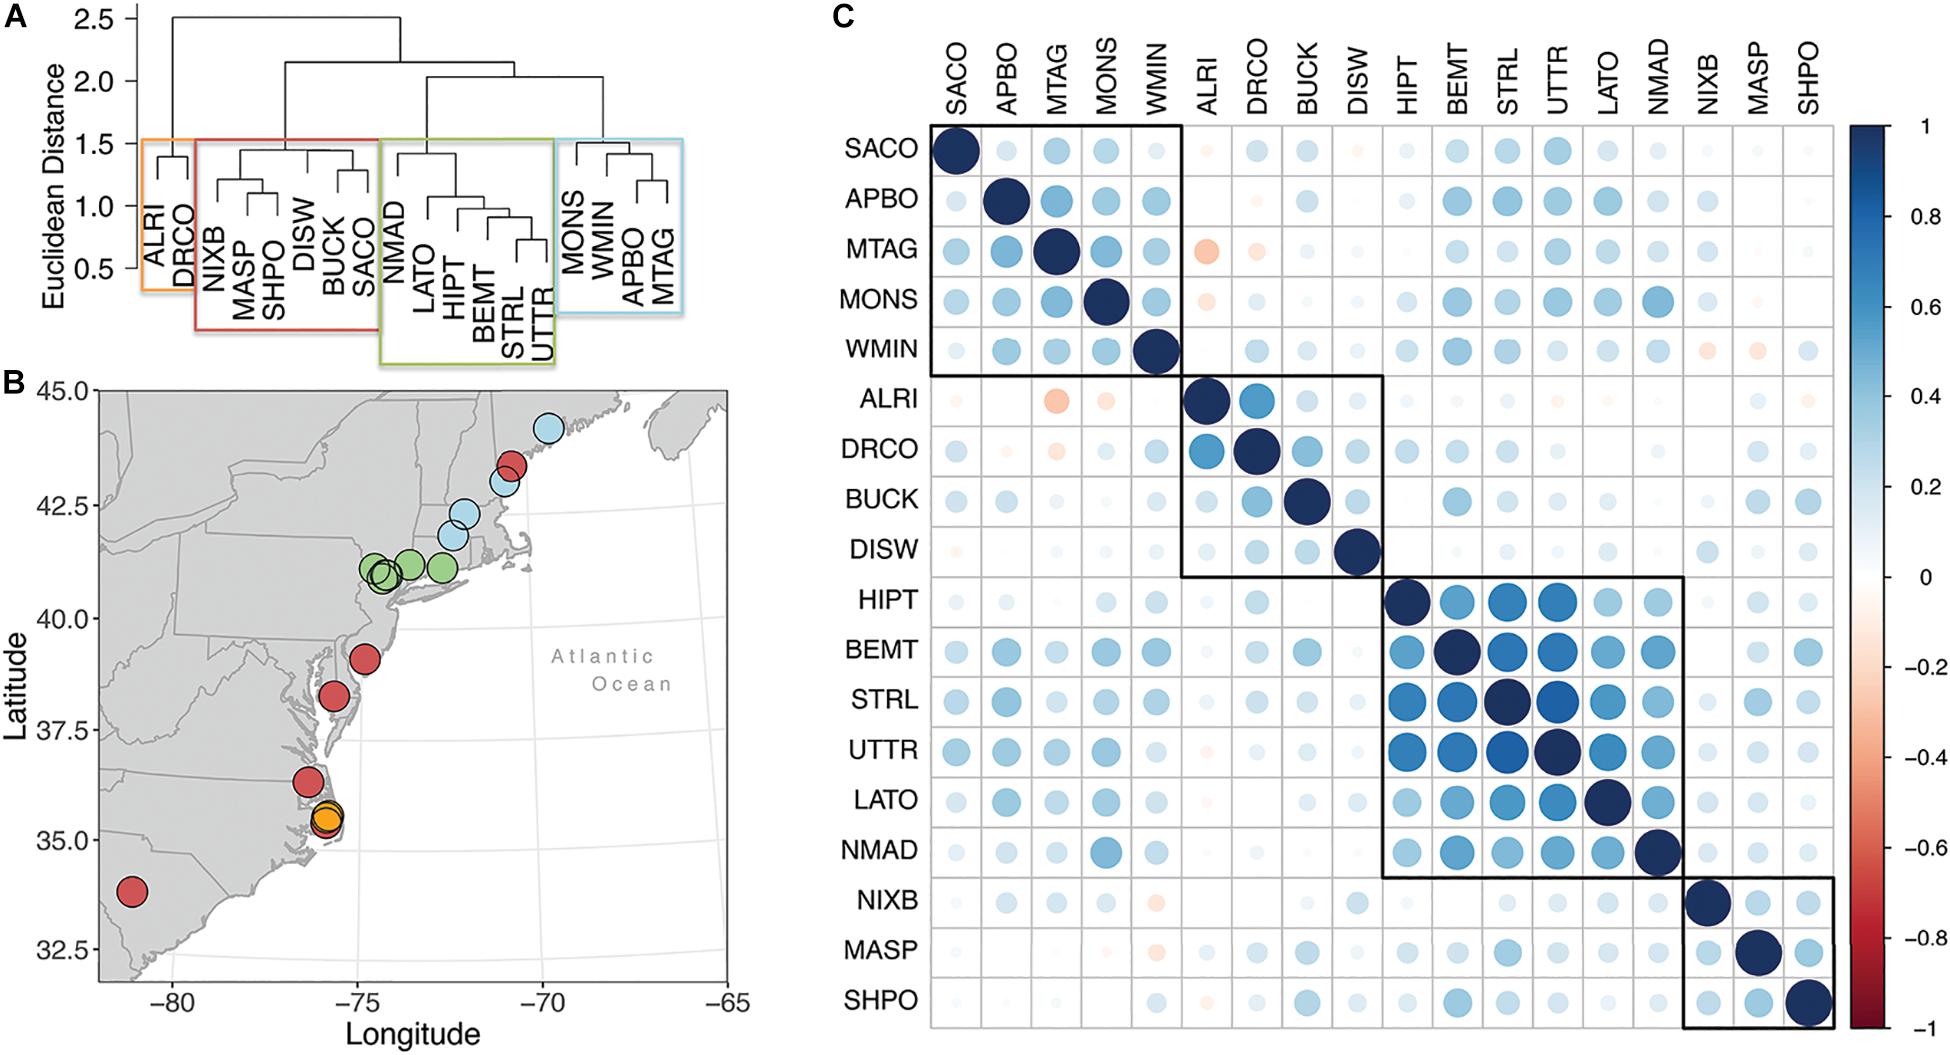
Figure 3. (A) Hierarchical cluster analysis of population-level Chamaecyparis thyoides growth from 1940 to 2000. Final clustering was based on Euclidean distance and Ward’s minimum variance method. Boxes represent population classification based on a k-means cluster analysis, in which the network was partitioned into 4 groups (red, blue, green, orange). (B) Map illustrating the group classification for each population, with each color corresponding to the group shown in panel (A). (C) Cross-correlation matrix, aka the correlogram, of the Chamaecyparis thyoides populations with each other, arranged from northern to southern ends of our network from left to right at the top of the matrix and top to bottom along the left-hand side of the matrix. Boxes identify clusters based on correlation and generally resemble the Hierarchical cluster analysis results.
Cluster analysis separated the remaining sites less consistently. Hierarchical analysis indicates a cluster of five populations distributed across the southern half of our network, the aforementioned Saco Heath, and a closely related second cluster of two populations in northeastern North Carolina. Correlation analysis also identifies two groups in the southern end of our network and also indicates that the hierarchical cluster of these three population correlates nearly equally with both the hierarchical cluster of five population and population in the central region (Figure 3C). To simplify further analyses, all population from southern New Jersey to South Carolina are considered the same group, hereafter the southern region. The interannual to decadal-scale radial growth variation of all trees highlighting the mean, minimum, maximum, upper 95%, and lower 5% distribution for each year in each region is plotted in Supplementary Figure S2.
Regional and Population Growth Response to Seasonal Climate
Here we present population-level correlations to climate at the regional level (Figure 4). Additional figures showing the climate responses for each population within each region are shown in supplementary material (Supplementary Figures S3–S5). The Supplementary Figures generally support the findings presented in Figure 4. Results displayed in Supplementary Figures S3–S5 helped us decide seasons for testing.
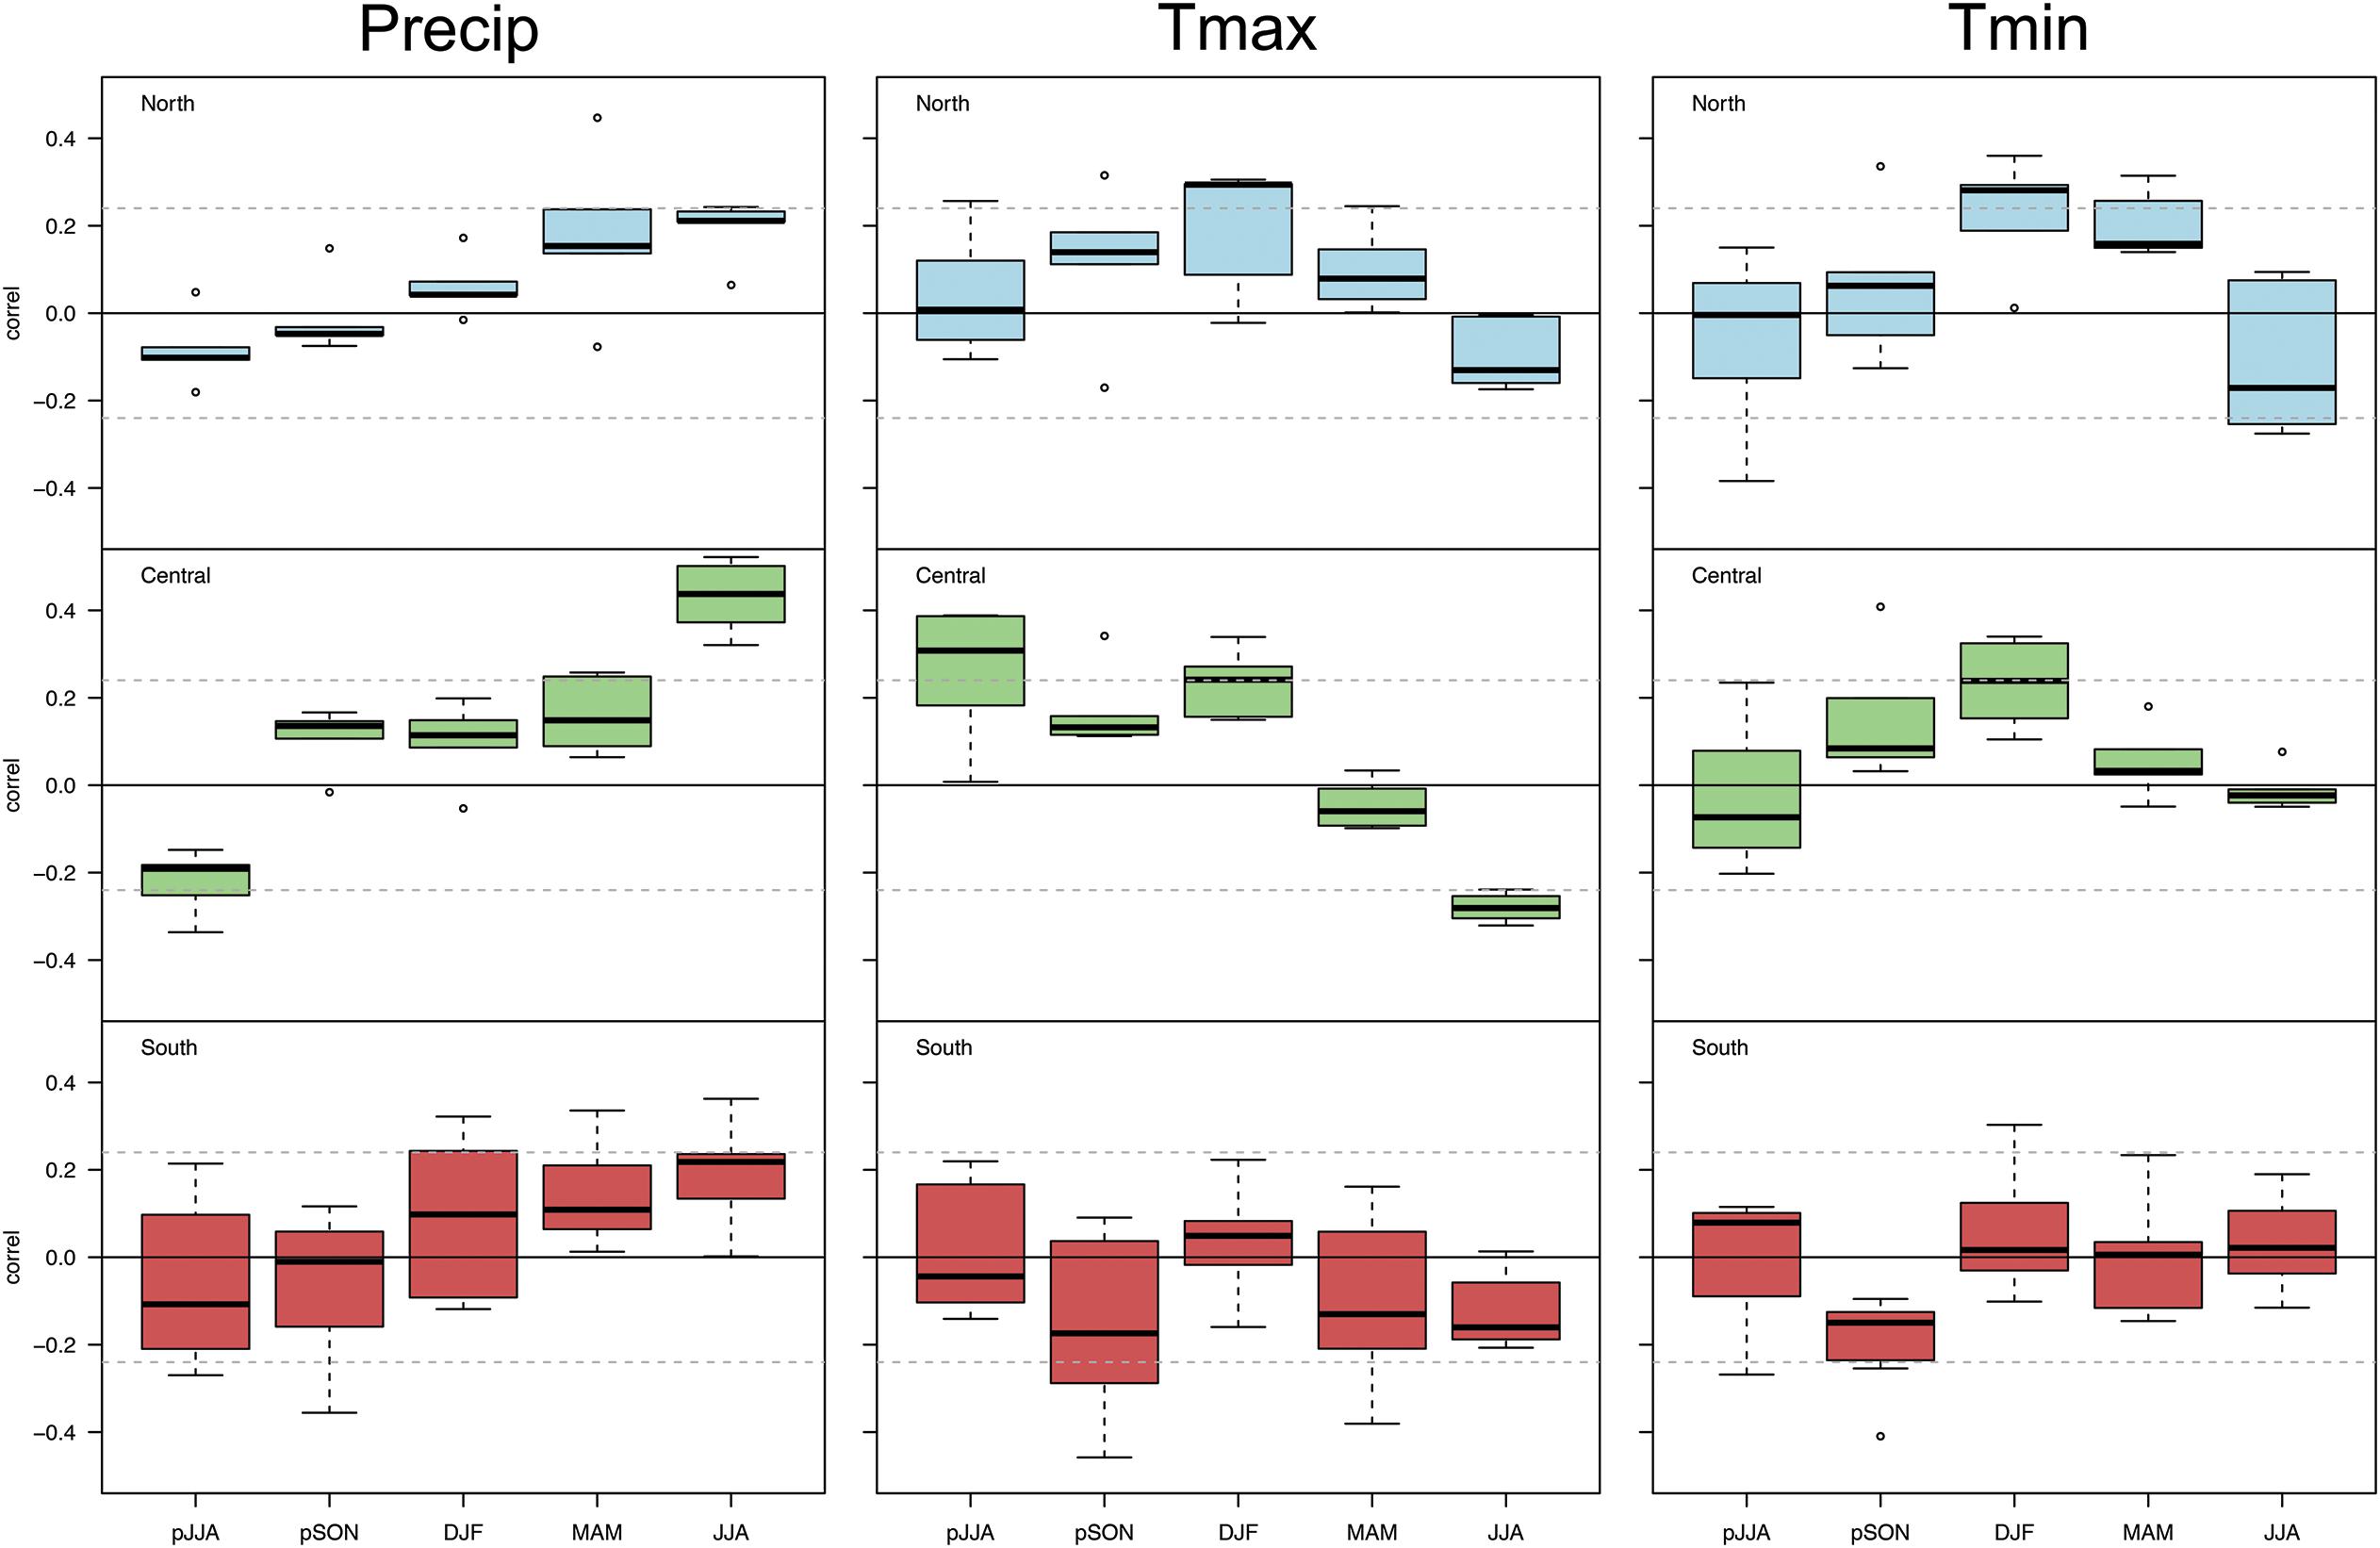
Figure 4. Box plots of correlation statistics of population-level Chamaecyparis thyoides growth versus total seasonal precipitation, average maximum seasonal temperature, and average minimum seasonal temperature by region, North (top panel, light blue), Central (middle panel, green), and South (bottom panel, red). The range of correlations represent average population-level growth in each region. Dashed, horizontal lines represent a significance level of p ≤ 0.05.
Precipitation
At the regional level, there are differences in the response of Chamaecyparis thyoides growth to total seasonal precipitation (Figure 4). Central region populations have the strongest relation to summer precipitation (p < 0.05; r > 0.4 in some cases), suggesting that precipitation increases growth in this region. Though weaker, the opposite pattern is apparent for responses to the prior summer. Precipitation weakly drives Chamaecyparis thyoides growth in the northern and southern populations. In contrast to most other populations, growth of southern populations generally increases with precipitation during winter (prior December -February), spring (March-May), and summer. Most notably, populations in this region show a greater spread in relation to precipitation during these seasons.
Maximum Temperature
The response of population-level Chamaecyparis thyoides radial growth to maximum temperatures at the regional level generally reflects patterns observed for total precipitation (Figure 4). The strongest and most consistent response of population-level growth to maximum temperatures is in the central region where higher temperatures during summer reduce growth, there is a negative correlation. As might be expected from the relation of growth among central populations to precipitation, there generally are positive, weak, but more significant relations to average seasonal maximum temperatures during the prior summer than to total precipitation during the same region. Chamaecyparis thyoides populations in the southern end of our network generally have negative relationships with maximum temperatures during fall of the prior year (prior September- prior November), current spring, and current summer. Positive relations between growth and winter maximum temperatures are seen in northern and central populations.
Minimum Temperature
The response of population-level Chamaecyparis thyoides radial growth to average seasonal minimum temperatures generally breaks from the patterns for precipitation and maximum temperatures. The strongest and most consistent response is in northern populations, where higher temperatures during the winter and spring increase growth (i.e., a positive correlation) (Figure 4); the relationship during the spring is weaker than during the winter in this region. Within the central Chamaecyparis thyoides populations, the strongest and most consistent growth relations to minimum winter temperatures are found during the winter. In southern populations, growth relations were weak and inconsistent.
Tree and Population Growth Response to Seasonal Climate at the Regional Level
Here we present bootstrapped probability distribution functions of individual-tree and population-level correlations to climate at the regional level, Figures 5, 6, respectively. Additional figures of the probability distribution functions for each population within each region are shown in supplementary material (Supplementary Figures S6–S8). The Supplementary Figures generally support the findings presented in Figures 5, 6. We focus the results on the tree-level distributions, but include the population level results in the main text to show that responses to climate are rather consistent across scales.
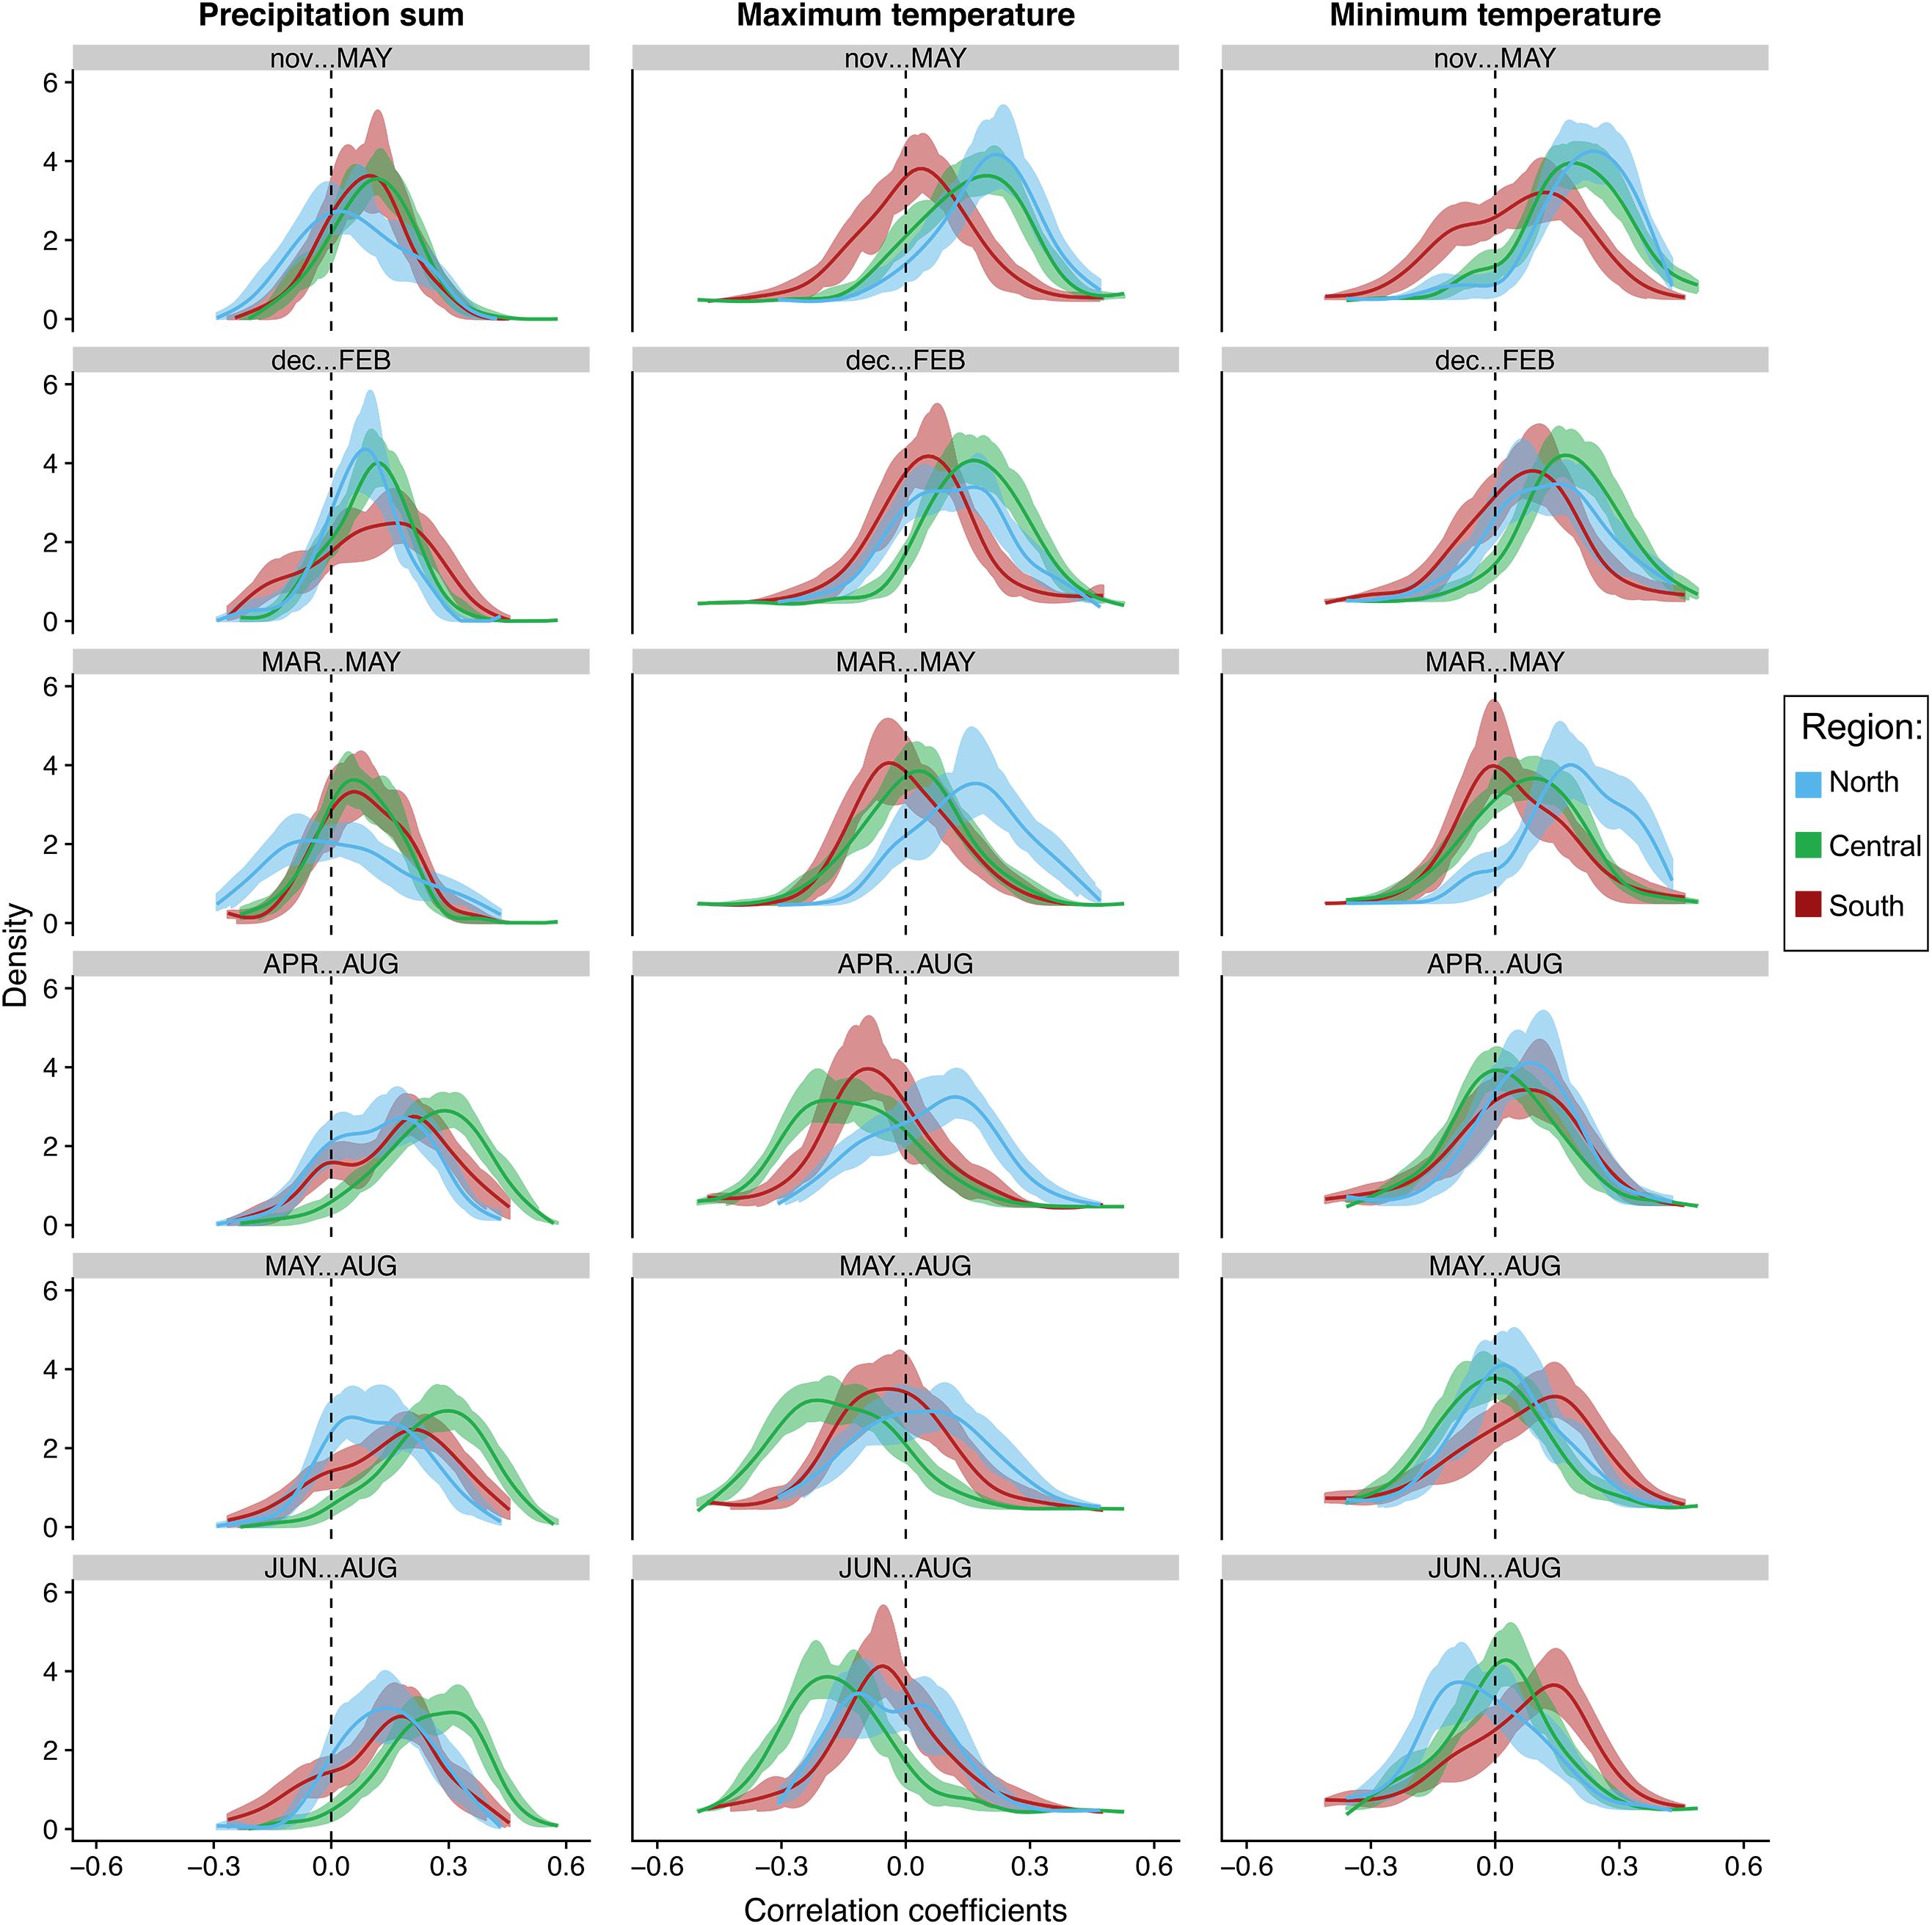
Figure 5. Bootstrapped distributions of correlations of individual tree growth to seasonal total precipitation, average maximum and minimum temperatures at the regional level. Blue represents the northern end of our network (North), green represents the central region (Central), while brick red represents trees in the southern portion of our network (South). Solid lines represent the mean. Shading represents 100 bootstrapped iterations.
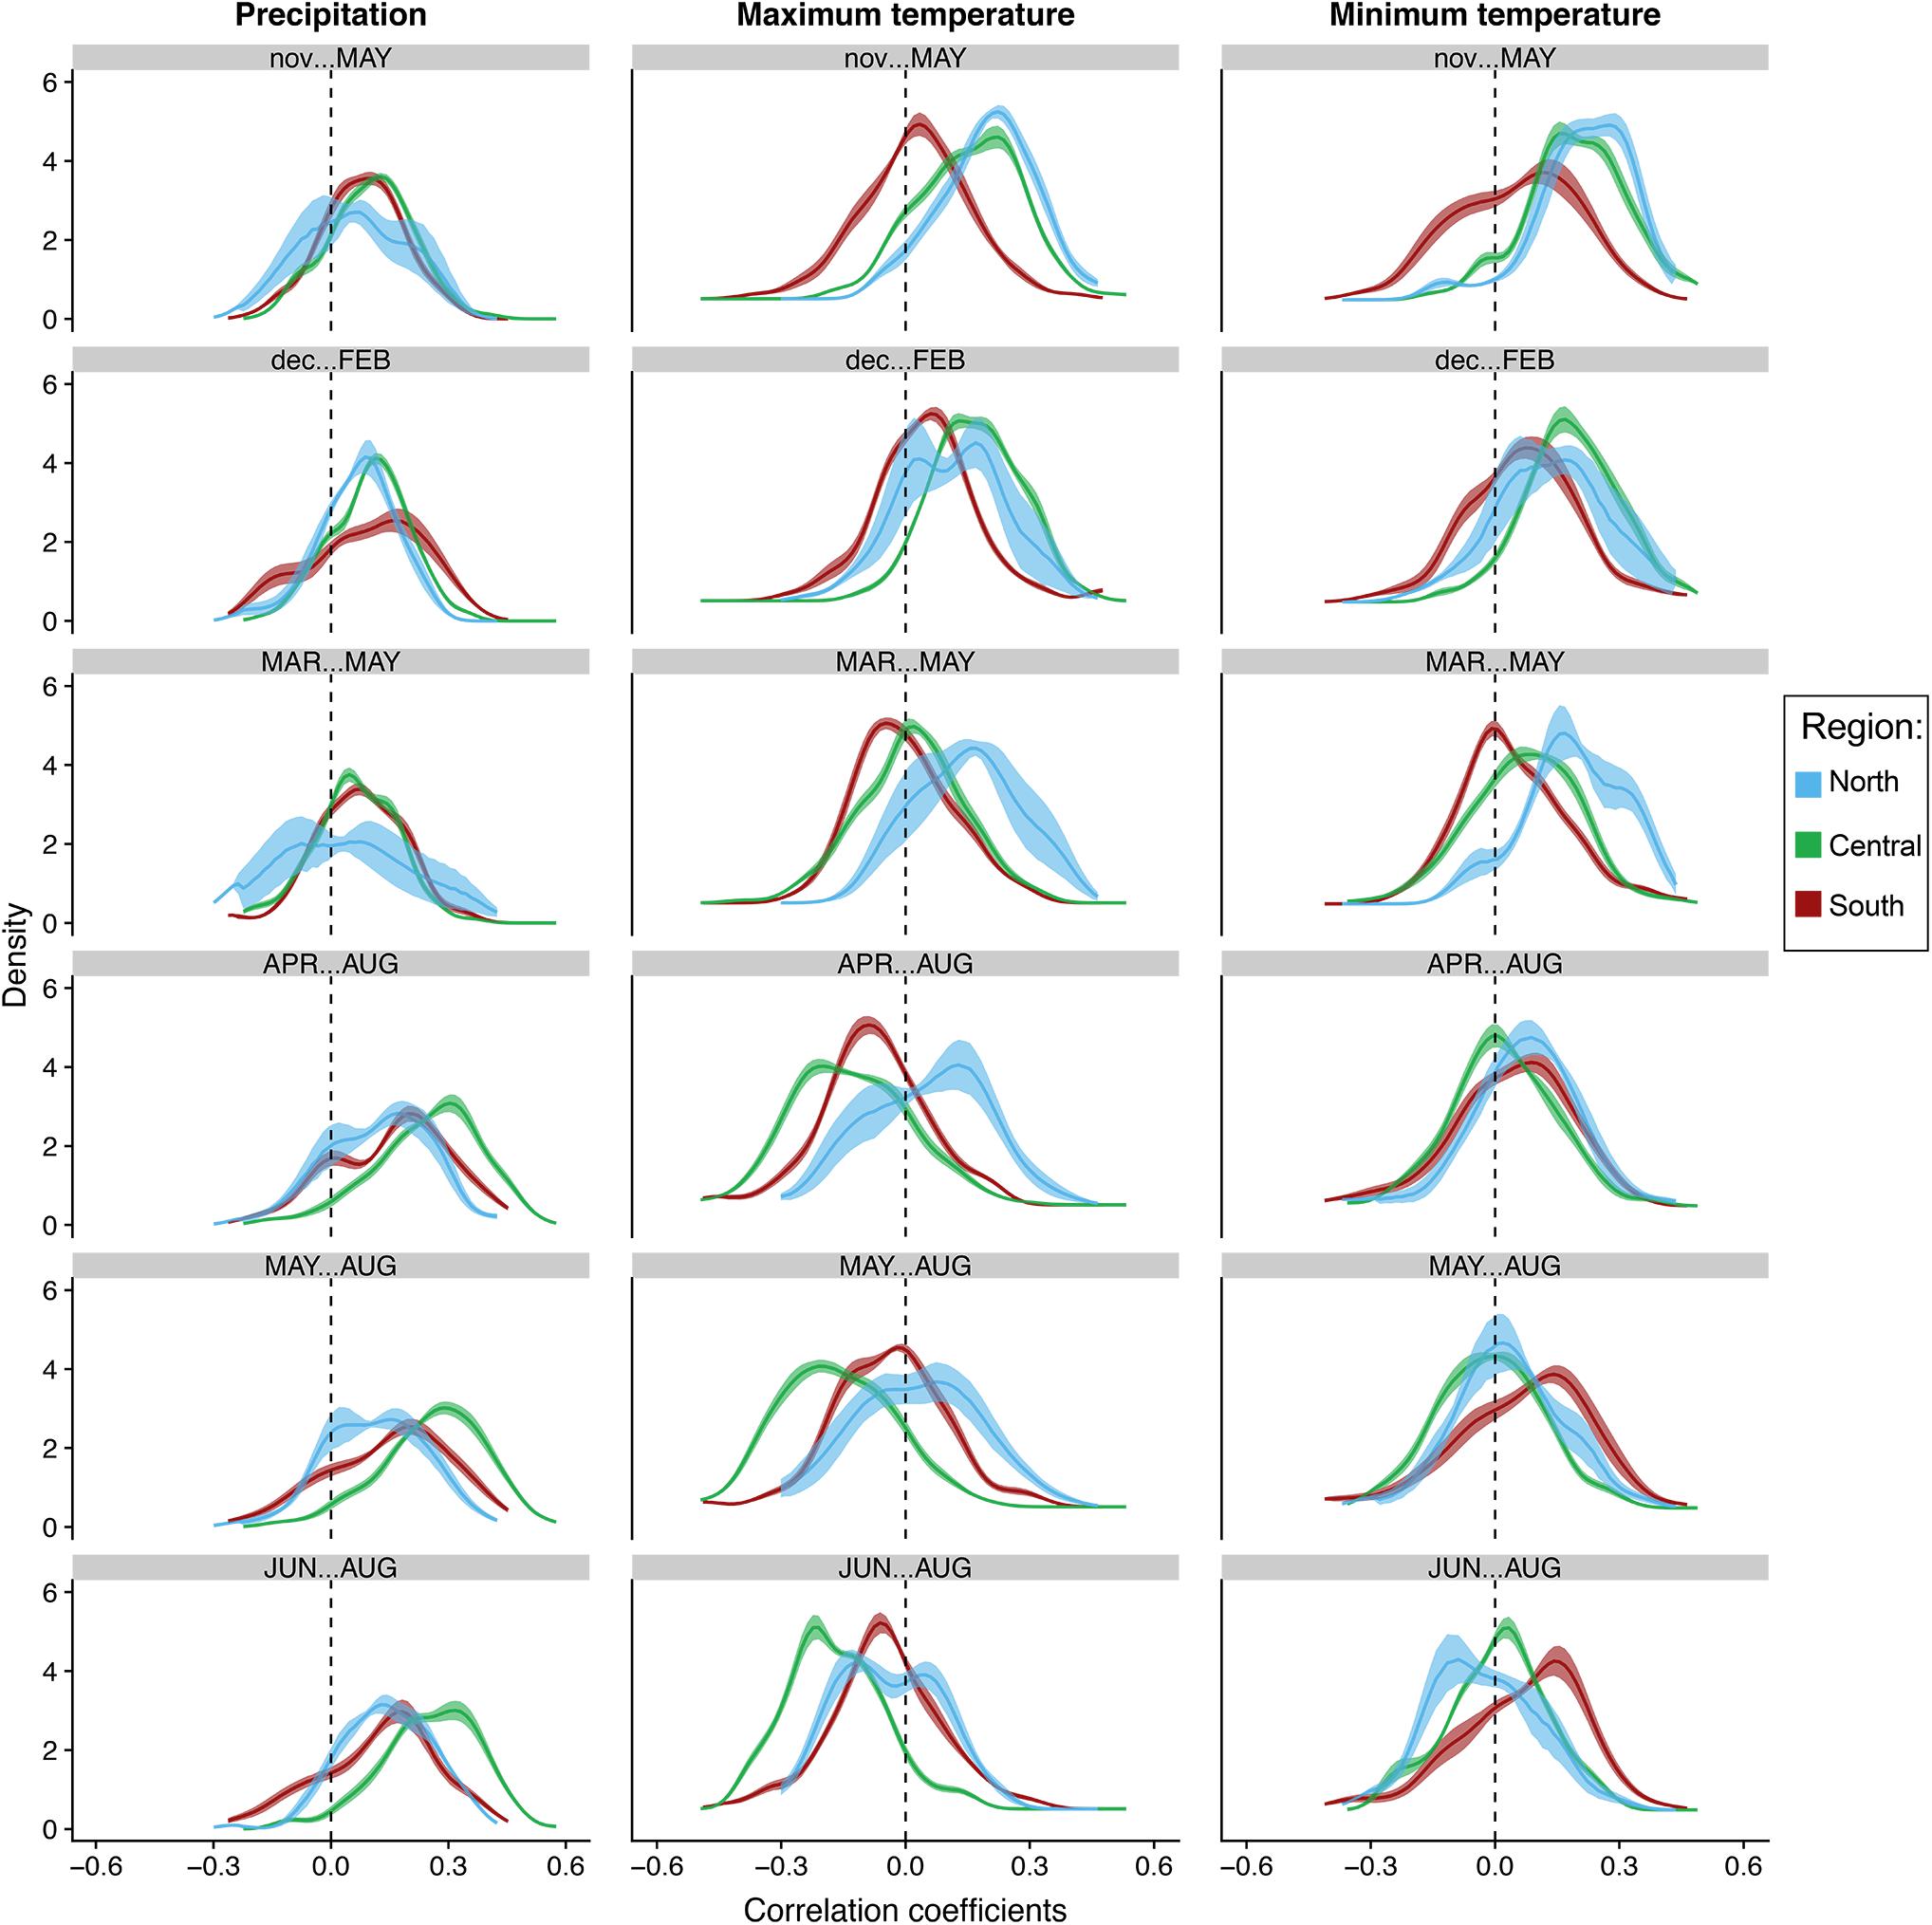
Figure 6. Bootstrapped distributions of correlations of population-level growth to seasonal total precipitation and average maximum and minimum temperatures at the regional level. Blue represents the northern end of our network (North), green represents the central region (Central), while brick red represents trees in the southern portion of our network (South). Solid lines represent the mean. Shading represents 100 bootstrapped iterations.
Precipitation
The distribution of correlations with total precipitation align strongly with the previous seasonal and monthly population level analyses. The distributions at the tree and population level increased toward more positive values moving from winter to summer in all populations. This trend strongest in the central populations. In fact, almost all trees in the central region are positively correlated to total precipitation in April–August, May–August and summer, indicating the most synchrony during those seasons (Figures 5, 6). Confidence intervals and cumulative distribution functions show that the central region precipitation response is also more consistently and statistically different from other regions during these warm seasons (Figures 5, 6 and Supplementary Figure S6). The distribution of tree correlations in northern populations are most different from those in other regions from prior November through current May and March through May where negative or neutral correlations are more prevalent.
Maximum Temperatures
Positive correlations with maximum temperatures during the cool season shift to either more negative distributions or center around zero during the warmest seasons, except for in the more northern populations where they are more positive and significantly different than other populations until summer (Figures 5, 6). Correlation distributions in northern populations were more positive, and significantly different from other populations during March–May, April–August, and May–August. In contrast, distributions in the central generally are more negative during the warm seasons. In more southern portion of our network, distributions against maximum temperatures trends more toward neutral, i.e., peak distribution closer to zero, from prior November-current May and in summer. Confidence intervals and cumulative distributions indicate substantial differences between all populations in five of the six seasons analyzed, prior November-current May, March–May, April–August, May–August, and June–August (Figures 5, 6 and Supplementary Figure S7).
Minimum Temperatures
The distribution of correlations to minimum temperatures are skewed toward positive values during the cool season in all regions and tend to become less positive and more neutral during the warm seasons (Figures 5, 6). The trend from positive to more values centered around zero is most strongly expressed in northern and central populations. Confidence intervals and cumulative distributions show the strongest differences in northern and central populations compared to more southern populations from prior November through current May (Figures 5, 6 and Supplementary Figure S8). Like the distributions for maximum temperatures, the northern populations skew significantly more positive during spring. It is interesting to note, however, that southern populations skew more positively than the central and northern populations from May-Aug and during summer.
Geophysical and Ecological Factors Influence Climate-Growth Relations
Based on previous results from correlation of climate with mean growth at the population- and individual-tree level, our final linear mixed effect model included the three seasonal climate variables with some of the strongest and most divergent responses between regions and populations: total summer precipitation, average summer maximum monthly temperature, and average monthly minimum temperature from prior November through current May. Two of these climatic variables showed significant interactions with site-invariant variables such as basal area and latitude. Prior November through current May minimum monthly temperatures had a positive interaction with latitude (p < 0.01) so that its effect increased with latitude shifting from a small negative influence in the southern populations (latitude <36°) to a positive effect in the northern populations (Figure 7), which is broadly consistent with other analyses. The growth of some southern trees and a few southern populations have some of the stronger negative relations to temperatures during the prior non-growing season (prior November through current May), especially prior November and current March and April (Figures 4–6 and Supplementary Figures S4, S5, S7, S8).
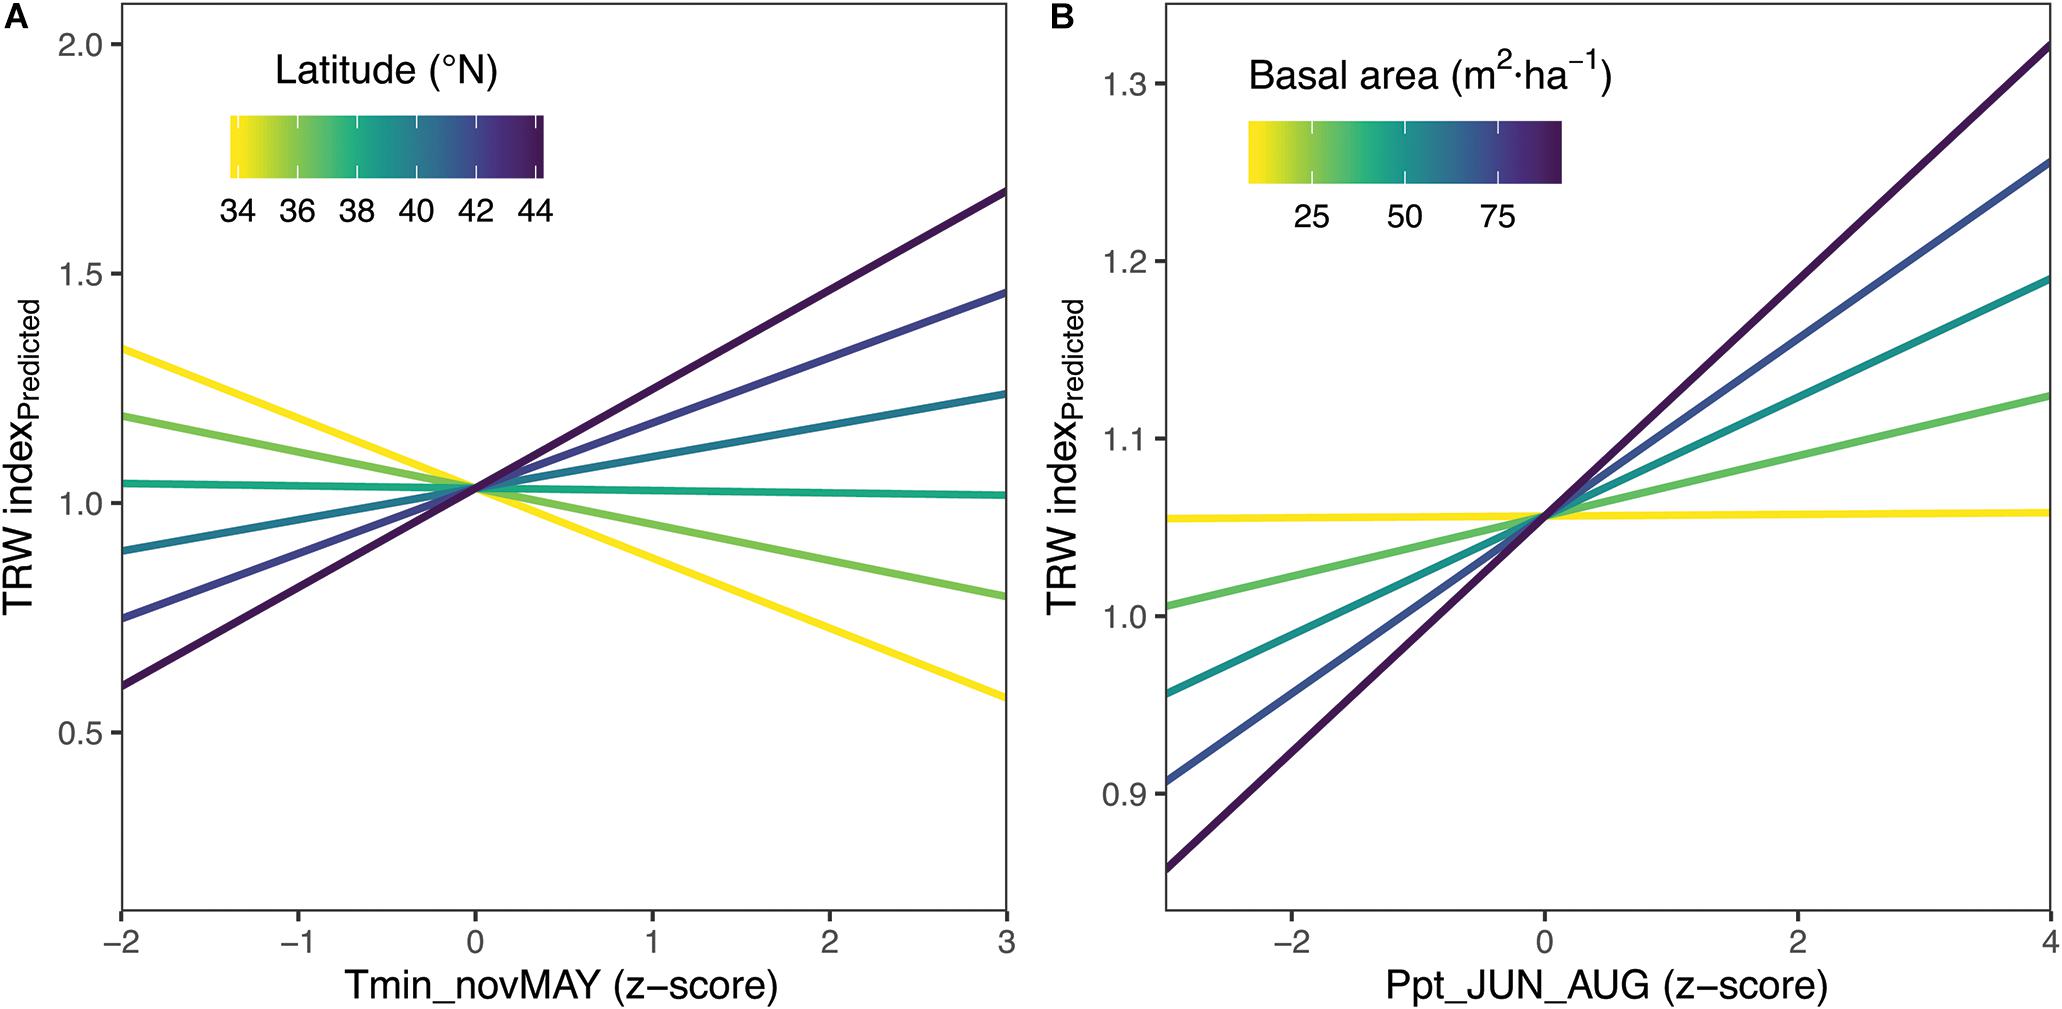
Figure 7. Linear Mixed Effects Model Results – (A) The effect of prior Nov-current May average minimum monthly temperatures (Tmin_novMAY) increases with latitude. (B) The effect of total summer precipitation increases with increasing basal area of sampled forests. The latitude × tmin effect shown corresponds to basal area of 50m2/ha, which is the midpoint value of 11 populations with measured basal area.
The effect of summer precipitation was positively modified by stand density (p < 0.01), making tree growth more sensitive to precipitation with increasing stand density (Figure 7). In this case, total summer precipitation had a positive effect on tree growth for the range of conditions considered except at the lowest stand densities where the effect was neutral. Two of the fixed effects, total summer precipitation and average summer maximum monthly temperature, were insignificant when only fixed effects were considered. However, allowing for varying slopes for different sites for the explanatory variables considered (i.e., our final model with fixed and random effects) showed that all of these variables were significantly related (p < 0.05) (Table 2). Fixed effects represent the mean response for Chamaecyparis thyoides along our entire gradient. Thus, the lack of significance in the fixed effects of total summer precipitation and average summer maximum monthly temperature was due to the higher variability of population-level growth response along the gradient for those two effects as shown by the random effects (see next paragraph). Overall the model showed a marginal R2 of 0.12 (considering fixed effects only) and a conditional R2 of 0.47 (considering fixed and random effects). Residuals for this model showed no departure from the assumption of normally distributed error with homogenous variance.
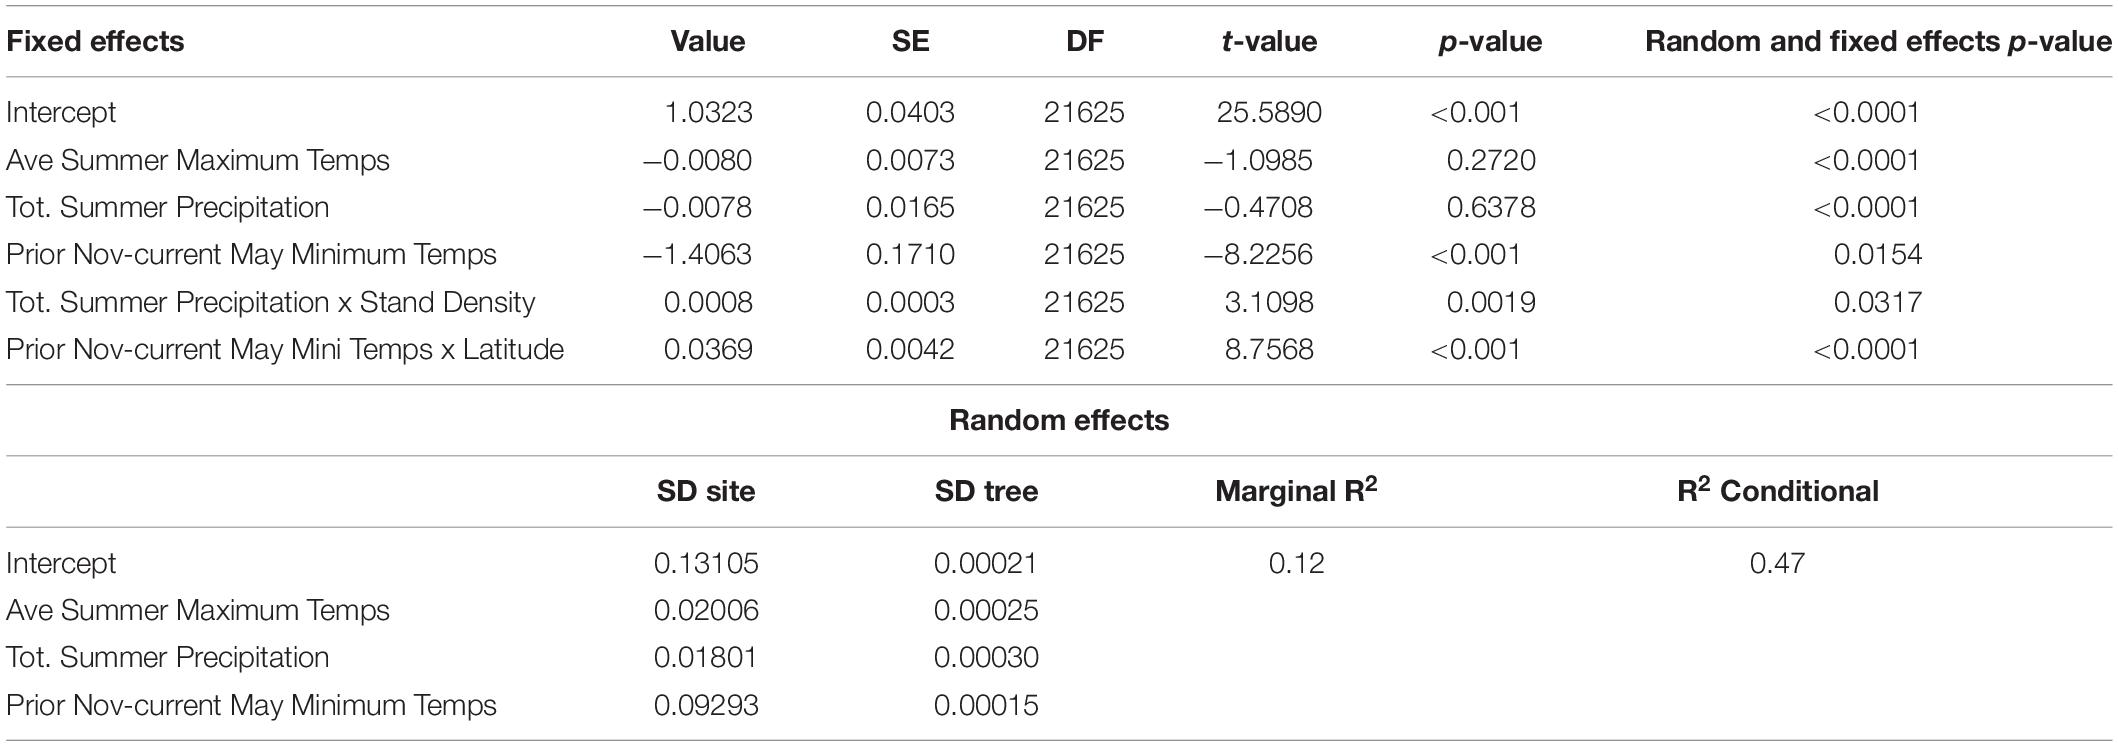
Table 2. Summary of the selected linear-mixed effects model of tree-ring width indices.
The use of random effects in our model as intercept and slopes allows us to estimate the importance of the variability within a population and among trees. The standard deviation of the random effects can be compared with the parameter estimates of the fixed effects in order to estimate the variability of response between different levels of hierarchy, trees or populations. Standard deviation of the random effect for all three climate variables for this analysis at tree level (<0.0005) was much lower compared to standard deviation for the random effects for populations (>0.018) (Table 2). Comparing models with random effects for sites only or for sites and trees using a log-likelihood ratio chi-squared test showed no support for the inclusion of tree random effects. These results indicate a higher inter- than intra-population variability in climate response. In fact, standard deviations for random effect for total summer precipitation and average summer maximum monthly temperature were larger than the corresponding fixed effects in line with the large spread of correlation coefficients for all three regions combined (Figures 5, 6 and Supplementary Figures S6–S8).
The standard deviation for the random effect prior November through current May minimum monthly temperatures compared to its fixed effect was lower than for the other two climate variables. Adding the interaction between prior November through current May minimum monthly temperatures and latitude reduces the variability associated with population response because part of that variability is related to latitude in the model. In contrast, the interaction between stand density and total summer precipitation seemed to only explain a small part of the variability in the response to total summer precipitation, suggesting that other environmental variables that we were unable to test (soil depth, stand topography, etc.) might be responsible for the different responses. The full final model can be found in Supplementary Material.
Discussion
Synthesizing six decades of climate-growth dynamics in 18 Chamaecyparis thyoides populations across its contiguous distribution using our vulnerability framework allowed us to address two broad questions: (Q1) “How do Chamaecyparis thyoides populations respond to climate across its latitudinal range?” and, (Q2) “Does the synchrony in tree-level response to climate in Chamaecyparis thyoides change over space?” Regarding (Q1), we found that the growth of trees in northern populations was most limited by cooler temperatures during the non-growing season and early in the growing season, but that trees in the central populations of our study network had stronger positive correlations to precipitation and negative correlations to maximum temperatures during the growing season (Figures 4–6 and Supplementary Figures S3, S4).
Regarding (Q2), we found less climate-growth synchrony among populations in the southern end of our network. However, we also found that climate-growth synchrony varied with the climatic variable being tested and other environmental and ecological factors. Latitude appears to drive the climate growth synchrony of northern populations to non-growing and spring season temperatures. This was in contrast to the central populations had the greatest amount of climate growth synchrony in response to precipitation and maximum temperatures during the growing season (Figures 5, 6 and Supplementary Figures S6, S7), which together induce drought stress in plants. While we found greater vulnerability to future climatic change in some populations, we found levels of potential resilience within all populations.
The distribution of individual tree-growth responses to climate across our network provides evidence for a kind of ecological hysteresis. One definition of ecological hysteresis considers how external conditions can induce different changes in state and that these changes are conditional on the state of the system and direction of external change, that there is a linear response over time (Litzow and Hunsicker, 2016; Li et al., 2019). Another definition considers to how resistant or slow a system is to change than might be expected (Jesse, 1999; Loehle, 2000; van Nes and Scheffer, 2005). Yet, another definition of ecological hysterisis considers asymmetrical and opposing responses to the same climate factor (Da Silveira Lobo Sternberg, 2001; Zhang et al., 2003). Here we invoke the asymmetrical response of growth to warming across our study area as ecological hysteresis: most trees in the northern end of our network increase in growth in response to warming while a substantial number of trees in several populations in the southern end of our network would be non-responsive or even increase in growth with warming while some will decline in growth (Figures 5 and Supplementary Figures S7, S8). The asymmetrical response to temperature in the two ends of our network indicates the potential for greater growth stability within populations on the southern edge of Chamaecyparis thyoides’ distribution than might be presumed under future warming (Loehle, 2000). Notably, our findings provide further evidence that climate envelope modeling approaches are not nuanced enough to model populations at broad scales, at least for the 61-year period tested here, from 1940 to 2000. Generalization of our results suggests greater potential resilience or, at least, reduced negative impacts due to lagged or slower than expected response from projected warming, a hysteresis, than what might be expected for southern Chamaecyparis thyoides populations if climate envelop modeling held true.
How do Chamaecyparis Thyoides Populations Respond to Climate Across Its Latitudinal Range?
Our findings generally support hypothesis, H(i), that growth in the majority of Chamaecyparis thyoides populations will increase with warmer winter and spring temperatures toward the northern end of our network. Growth of Chamaecyparis thyoides trees in northern populations, from ∼41–44 degrees north latitude, increased with warmer winter and spring temperatures more than trees in the southern end of our network (Figures 4–7 and Supplementary Figures S4, S5, S7, S8). These findings not only support work with Chamaecyparis thyoides in our study region, they also support findings that growth of conifers nearer to the northern end of their distribution is more limited by non-growing season minimum temperatures than more southerly populations (Cook and Cole, 1991; Cook et al., 1998; Hopton and Pederson, 2005; Bhuta et al., 2009).
Cleaving the greatest difference between the response of trees to temperature within the contiguous distribution of Chamaecyparis thyoides, growth in the northern end of our network is significantly more limited by minimum temperatures than trees in the central and more southern regions during spring and from April-August. While this generally supports Hypothesis (i), the response of trees in the central portion of our network to winter temperatures is virtually indistinguishable from more northern trees (Figures 5, 6 and Supplementary Figures S7, S8), undercutting the strict geographic expectations of Hypothesis (i).
For Hypothesis (ii), we hypothesized that growth in the majority of southern Chamaecyparis thyoides populations will increase more with more water availability during the growing season than populations in the northern end of our network. While this is a weak trend moving north to south, the strongest responses to drought are seen in the central portion of our network, which does not support this hypothesis. The implications of these findings are fully discussed below in see section “Implications and Mechanisms.”
Does the Synchrony in Tree-Level Response to Climate in Chamaecyparis Thyoides Change Over Space?
Our findings partially support Hypothesis (iii), that the tree-level climate responses in more northern Chamaecyparis thyoides populations are more synchronous than more southern populations. Linear mixed effect models indicated a top-down constraint of minimum temperatures in the northern end of Chamaecyparis thyoides’ distribution (Figure 7), supporting findings of more synchronous responses to minimum temperatures at tree and population levels (Figures 5, 6 and Supplementary Figure S8). However, the modulation of the growth response to precipitation by geomorphology (ombrotrophic wetlands) and ecological structure (stand density) does not support Hypothesis (iii). Stand density increased Chamaecyparis thyoides drought stress (Figure 7), providing evidence that water availability appears to have a bottom-up constraint on growth. The density and age structure of our study forests are indicative of the stem-exclusion stage of forest development. Stem-exclusion stage begins not too long after disturbance (within 2–3 decades) and is often characterized as having high stand density and low regeneration (Oliver and Larson, 1990). Our study forests dated back to either the time of intensive logging of Chamaecyparis thyoides ecosystems during the late 19th century (Laderman, 1989; Table 1) or in the more southern populations, recent forest management. Research on a larger network that includes other Chamaecyparis thyoides populations in the northern end of our network indicates that average population-level growth on ombrotrophic wetlands is mainly constrained by water availability (Pearl et al., 2019), a response we replicate with the Saco Heath population (Figures 5 and Supplementary Figures S3, S6). Trees growing on ombrotrophic wetlands gain water from incoming precipitation, not from groundwater, indicating how growth is constrained by water availability.
Our findings primarily support Hypothesis (iv), that the responses of southern Chamaecyparis thyoides populations to all climatic variables and seasons will be less synchronous than more northern populations. The climatic responses of and within the southern populations were generally more muted and more variable than other populations (Figures 4–6 and Supplementary Figures S3–S8). These findings support prior work that indicted local factors as important factors of Chamaecyparis thyoides growth within this region (e.g., Eagle, 1999; Hopton et al., 2004; Hopton and Pederson, 2005; Mylecraine et al., 2005; Seim et al., 2006; DeBerry and Atkinson, 2014). However, we must also note that the more southern populations within our network tended to have more consistent negative correlations to maximum temperatures, giving some support to the general expectation that southern populations in northern temperate regions will be vulnerable to rising temperatures in the future and indicating some potential synchronicity in the southern populations. We also must note that our analysis occurred to a period of broad cooling in the southern portion of our region (Figure 2; Mascioli et al., 2017). Hypothetically, hotter conditions earlier in the 20th century, ca 5000–10,000 years BP (Marcott et al., 2013), or the not too distant future might result in greater climatic growh synchrony than observed here.
Other Potential Factors of the Climate Response of Chamaecyparis thyoides
Our study considered some of the many potential factors influencing growth of Chamaecyparis thyoides. Only stand density was selected as an important factor on the climatic response of trees in this study. It is not clear why other factors were not selected. One reason could be that the accuracy of some of the environmental data is too coarse or similar variations between sites (e.g., distance to open water, slope, or aspect) to have a detectable impact on tree growth. It might also be that the range of environmental data we have for our 11 sites might be too small to capture differences between populations (e.g., similar distance to open water, slope, or aspect), which might limit the strength of the data. At the least, it seems we can say that overfitting is not a serious issue with the model results.
Some research suggests an age effect on the climate-growth relations in trees (Szeicz and MacDonald, 1994; Carrer and Urbinati, 2004; Martínez del Castillo et al., 2018). While there are differences in age structure between our regions, particularly with older trees in the central region (Table 1), linear effects modeling analyses suggests these differences do not strongly influence interannual to decadal scale growth, not more than the other environmental or ecological factors that we were able to test. It is possible that natural thinning during the early phases of ecosystem development removed individuals that represented a greater range of individual trees in the older central populations to reduce the overall range of growth response in this region. It is currently impossible to estimate how the trees that have died and are long faded from the landscape, so-called ghost trees (Foster et al., 2014), might have responded to climatic variations. It appears that age structure has a limited impact on climate-growth dynamics of Chamaecyparis thyoides in our network.
Implications and Mechanisms
Individuals in the southern portion of a species’ distribution are generally expected to be more vulnerable to a warming climate than individuals at higher latitudes in the distribution (e.g., Woodward and Woodward, 1987). In contrast, the stronger and more synchronous drought constraint on central Chamaecyparis thyoides trees during the warm season suggests these populations would be the most vulnerable to “hot droughts,” or periods characterized by both low precipitation and elevated temperatures. These so-called “hot droughts” typically increase drought stress in trees (Adams et al., 2017). Increased warming is expected to lead to drier conditions via increased surface evapotranspiration (Cook et al., 2014; Mankin et al., 2019). Multiannual droughts can lead to growth declines (Berdanier and Clark, 2016) and increase tree mortality rates in our study region (Clark et al., 2016; Druckenbrod et al., 2019). Dead trees have been shown to decline in growth for years and sometimes decades prior to mortality (Pedersen, 1998; Cailleret et al., 2017). The physical and ecological implications suggest that the central Chamaecyparis thyoides trees would be more vulnerable with continued warming and if the current cooling trend during the growing season is reversed.
While our findings appear counter to theoretical understandings, they generally follow findings that core populations of Fagus sylvatica might be more vulnerable to climatic variation than edge populations (Cavin and Jump, 2017). In that study, it was thought that Fagus sylvatica living at the species’ distributional margins had a greater resistance to drought due to local conditions. Our work provides some evidence to support that thesis: Chamaecyparis thyoides trees in forests with high stand density (basal area) are more likely to experience greater drought stress (Figure 7). Interestingly, trees in the central and southern regions of our network received a similar amount of precipitation during the period of analysis, but central region trees grew under summer conditions that were on average 4°C cooler than more southern trees (26.5°C vs. 30.5°C; Supplementary Table S1). That warming conditions during our study period did not synchronize the climate response of trees provides additional evidence that stand density can modulate the potential relief of a cooler climate. Our findings fall in line with the growing body of literature indicating that higher forest density can increase drought stress or vulnerability of trees to drought (Cescatti and Piutti, 1998; Martin-Benito et al., 2011; D’Amato et al., 2013; Bottero et al., 2017).
It might appear counterintuitive that Chamaecyparis thyoides trees growing in wetlands could be drought stressed, research has long shown that the annual growth of trees in mesic conditions or wetlands in mesic regions is often constrained by water availability (e.g., Hawley et al., 1941; Fritts, 1962; Stahle et al., 1988; Cook, 1991; Graumlich, 1993; D’Orangeville et al., 2018). As it appears now, the combination of future climatic projections and the ecology of drought stress in dense forests would seem to make dense Chamaecyparis thyoides populations more vulnerable to continued warming.
While the central populations appear vulnerable to summer warming, winter warming might also increase growth such that it could offset some of this potential negative impact on growth. Warm winter temperatures have been found to be associated with increased growth in the Northern Hemisphere for decades (e.g., Brubaker, 1980; Graumlich, 1993; Pederson et al., 2004; Babst et al., 2013; Martin-Benito et al., 2018; Weigel et al., 2018; Alexander et al., 2019; LeBlanc et al., accepted). Mechanisms that explain how dormant season temperatures might influence growth in conifers are, however, not an area of consensus. Warmer temperatures during the non-growing season can stimulate photosynthesis and carbon assimilation in conifers (Dolman et al., 2002; Ensminger et al., 2004) while low temperatures can inhibit photosynthesis and delay spring recovery of winter-stressed trees (Ottander and Öquist, 1991; Ensminger et al., 2004). The distributions of winter temperature correlations in central populations are statistically indistinguishable from more northern populations, indicating the potential for increased growth with warming. Overall, the vulnerability of growth in central populations will depend on the balance of winter warming and increased water stress during periods of growing-season warming and reduced precipitation.
There is greater climatic synchrony to cool temperatures during the non-growing season and spring in the more northern portion of our network (Figures 5–7 and Supplementary Figures S7, S8), which would make them more vulnerable to an abrupt reversal of the current warming to an extreme cold climate. Though less likely to occur in the near future, paleoecological records indicate a reduction of southern temperate species and an increase of boreal species at the beginning of the Younger Dryas (Peteet et al., 1990; Peteet, 2000) occurred when the warming trend at the end of the Pleistocene abruptly reversed to extremely and persistent cold conditions (Broecker et al., 1988). Our findings indicate the growth of Chamaecyparis thyoides in the more northern end of our network would be more vulnerable to cooler winter and spring temperatures.
Advantages of the Vulnerability Framework and Examinations Across Scale
Investigating six decades of individual tree growth response of Chamaecyparis thyoides to climate in 18 populations over 11 degrees of latitude and ca 1500 km revealed the complexity of how individual trees respond to climate. Investigating the ecology of the individual is statistically more fraught, messy one might say, than distilling the response of individual trees to a population mean. Using a combination of population mean and individual tree approaches over the spatial scale of a network like ours has important advantages. Determining the average population response to climate allowed us to determine what seasons influence tree growth over a study region with differing seasonality. Comparing disparate populations using only one season would likely mask important ecological differences to trees and populations across our network. For example, while central populations appear more heat-stressed during the summer, population level analyses indicated a strong tendency of heat stress in the southern populations across most of the months tested.
By moving beyond the average population response and characterizing the range of growth responses within a population, we were able to discern which populations had trees that responded to growth more synchronously than other populations. This insight allowed us to identify populations that might be more vulnerable to extreme climatic shifts. Theoretically, climate, population vulnerability, and adaptation influence the range of variability at the individual level more than the population level (Carrer, 2011; Clark et al., 2012). In fact, we found that understanding the levels of vulnerability and potential impact of continued climatic change depends on how bottom-up factors like stand density can modulate top-down factors like temperature within populations. Yet, surprisingly, we show how the climate-growth dynamics at the tree level reflects much of the broader patterns at the population and regional levels. In fact, linear mixed modeling indicated that climate-growth dynamics between populations at the average population level is greater than within populations. Despite this finding, we cannot help but think of the ecological nuance that would be extracted from large-scale studies of climate-growth dynamics had individual trees been analyzed instead of populations means (Martin-Benito and Pederson, 2015; Charney et al., 2016; Klesse et al., 2018a).
In thinking about vegetation modeling and our results, data assimilation between models, even Earth system models, and these kinds of studies could result in more nuanced understanding of climate constrains on tree growth. Our results show that, population-level responses of Chamaecyparis thyoides are more important than individual tree response. If this holds true for a larger number of species, considering the population level response in models may improve them enough so that individual tree responses might not be sufficiently justified given the trade-off between effort and gain. However, we also note that results for a species of restricted distribution, such as Chamaecyparis thyoides, limited to the specific sites might be hard to extrapolate to other systems. A good pursuit would be to continue efforts like ours and continued data-model assimilations (Dietze et al., 2013; Rollinson et al., 2017; Fisher et al., 2018).
Summary
By examining climate-growth responses at the individual tree level over the contiguous distribution of Chamaecyparis thyoides, we have shown that:
(1) The central portion of the species’ range has the most synchronous heat stress and drought response, which is counter to the common expectation that species are more responsive and vulnerable to climatic change at the southern end of their range in the Northern Hemisphere;
(2) There is potential resilience to warming and drought within all populations;
(3) Asymmetrical growth responses to projected warming across our study network provides evidence of ecological hysteresis;
(4) Local environmental conditions can override climatic controls toward the southern end of its distribution;
(5) Drought stress is an important constraint on growth, even for a species that primarily lives in wetland ecosystems;
(6) Variability of the influence of climate on tree growth among populations dominated over the common species influence or individual tree effects, indicating that endogenous (e.g., genetics) or exogenous (site conditions) characteristics for each individual population need to be considered for a thorough understanding of the species response to climate.
Researching growth-climate relationships at the individual tree level helps to understand how forests might respond to climatic change, and their potential productivity moving into the future (e.g., Carrer, 2011; Clark et al., 2012). However, some of the next steps in understanding the potential level of persistence and resilience of trees includes understanding how climate-growth relations might change over time (Cook and Zedaker, 1992; Visser et al., 2010; Carrer, 2011), the nonlinear response of tree growth to climate (Rollinson et al., 2017), and then linking these responses to individual genetics within a population (Housset et al., 2018). The ultimate growth vulnerability and potential mortality of tree populations likely depends on relative changes in climate, the genetic, phenotypic, and morphological adaptability of trees to change, and ecosystem development processes that influence ecological factors of growth. Overall, we find a complex structure of climate-tree growth responses within populations and over latitude that provides insight on the inherent difficulties in forecasting how climatic change will impact populations and forests over space.
Data Availability Statement
The datasets for this study will be found in the Harvard Forest Archive upon publication https://harvardforest.fas.harvard.edu/harvard-forest-data-archive.
Author Contributions
NP, DM-B, CL, TM, and DB designed the study. NP, DM-B, CL, DB, KA, and TM conducted data analyses and created data presentations. NP, MH-A, DB, and JP conducted field work and processed data. NP, DM-B, CL, JP, TM, and DB wrote the manuscript.
Funding
Funding was provided by United States National Science Foundation Paleo Perspectives on Climate Change program (P2C2; AGS-1304262) and Macrosystem Biology program (EF-1241930), United States Forest Service Northern Research Station Joint Venture Agreement (17-JV-11242306-038), National Science Foundation Division of Environmental Biology Long-term Ecological Research (LTER; DEB-1832210). DM-B was funded by projects AGL2015-73190-JIN and RYC-2017-23389 from the Spanish Ministry of Science and Innovation.
Conflict of Interest
The authors declare that the research was conducted in the absence of any commercial or financial relationships that could be construed as a potential conflict of interest.
Acknowledgments
Many thanks to the main agencies approving sampling on their property, including The Nature Conservancy, Massachusetts Department of Conservation and Recreation, New York State Department of Environmental Conservation, the Town of Southeast, NY, South Central Connecticut Regional Water Authority, New Jersey Division of Parks and Forestry, Maryland Department of Natural Resources, United States Fish and Wildlife Service, and the Dare County Bombing Range of the United States Air Force. Comments on the manuscript by Dave Orwig, Ross Alexander, Aaron Ellison, Audrey Barker-Plotkin, and David Foster are very much appreciated. Much thanks to Dave Orwig who long ago suggested measuring forest density and composition while making individual tree collections.
Supplementary Material
The Supplementary Material for this article can be found online at: https://www.frontiersin.org/articles/10.3389/ffgc.2020.00039/full#supplementary-material
Footnotes
References
Adams, H. D., Barron-Gafford, G. A., Minor, R. L., Gardea, A. A., Bentley, L. P., Law, D. J., et al. (2017). Temperature response surfaces for mortality risk of tree species with future drought. Environ. Res. Lett. 12:115014.
Alexander, M. R., Pearl, J. K., Bishop, D. A., Cook, E. R., Anchukaitis, K. J., and Pederson, N. (2019). The potential to strengthen temperature reconstructions in ecoregions with limited tree line using a multispecies approach. Quat. Res. 92, 583–597.
Atkinson, R. B. (2019). Growth rates of Atlantic white cedar depend on hydrologic regimes at two time scales. Wetlands. doi: 10.1007/s13157-019-01212-4
Babst, F., Poulter, B., Trouet, V., Tan, K., Neuwirth, B., Wilson, R., et al. (2013). Site- and species-specific responses of forest growth to climate across the European continent. Glob. Ecol. Biogeogr. 22, 706–717.
Berdanier, A. B., and Clark, J. S. (2016). Multiyear drought-induced morbidity preceding tree death in southeastern U.S. forests. Ecol. Appl. 26, 17–23.
Bhuta, A. A. R., Kennedy, L. M., and Pederson, N. (2009). Climate-radial growth relationships of northern latitudinal range margin longleaf pine (Pinus palustris P. Mill) in the Atlantic coastal plain of Southeastern Virginia. Tree Ring Res. 65, 105–115.
Billings, W. D. (1952). The environmental complex in relation to plant growth and distribution. Q. Rev. Biol. 27, 251–265.
Bishop, D. A., and Pederson, N. (2015). Regional variation of transient precipitation and rainless-day frequency across a subcontinental hydroclimate gradient. J. Extrem. Events 2:1550007.
Bottero, A., D’Amato, A. W., Palik, B. J., Bradford, J. B., Fraver, S., Battaglia, M. A., et al. (2017). Density−dependent vulnerability of forest ecosystems to drought. J. Appl. Ecol. 54, 1605–1614.
Broecker, W. S., Andree, M., Wolfli, W., Oeschger, H., Bonani, G., Kennett, J., et al. (1988). The chronology of the last deglaciation: implications to the cause of the younger Dryas event. Paleoceanography 3, 1–19.
Brubaker, L. B. (1980). Spatial patterns of tree growth anomalies in the Pacific Northwest. Ecology 61, 798–807.
Bunn, A. G., Salzer, M. W., Anchukaitis, K. J., Bruening, J. M., and Hughes, M. K. (2018). Spatiotemporal variability in the climate growth response of high elevation bristlecone pine in the White Mountains of California. Geophys. Res. Lett. 45, 312–313.
Bunn, A. G., Waggoner, L. A., and Graumlich, L. J. (2005). Topographic mediation of growth in high elevation foxtail pine (Pinus balfouriana Grev. et Balf.) forests in the Sierra Nevada, USA. Glob. Ecol. Biogeogr. 14, 103–114.
Cailleret, M., Jansen, S., Robert, E. M., Desoto, L., Aakala, T., Antos, J. A., et al. (2017). A synthesis of radial growth patterns preceding tree mortality. Glob. Chang. Biol. 23, 1675–1690. doi: 10.1111/gcb.13535
Carbone, M. S., Czimczik, C. I., Keenan, T. F., Murakami, P. F., Pederson, N., Schaberg, P. G., et al. (2013). Age, allocation and availability of nonstructural carbon in mature red maple trees. New phytol. 200, 1145–1155. doi: 10.1111/nph.12448
Carrer, M. (2011). Individualistic and time-varying tree-ring growth to climate sensitivity. PLoS One 6:e22813. doi: 10.1371/journal.pone.0022813
Carrer, M., Castagneri, D., Prendin, A. L., Petit, G., and von Arx, G. (2017). Retrospective analysis of wood anatomical traits reveals a recent extension in tree cambial activity in two high-elevation conifers. Front. Plant Sci. 8:737. doi: 10.3389/fpls.2017.00737
Carrer, M., and Urbinati, C. (2004). Age−dependent tree−ring growth responses to climate in Larix decidua and Pinus cembra. Ecology 85, 730–740.
Cavin, L., and Jump, A. (2017). Highest drought sensitivity and lowest resistance to growth suppression is found in the range core of the tree Fagus sylvatica L. not the equatorial range edge. Glob. Chang. Biol. 1, 362–379. doi: 10.1111/gcb.13366
Cescatti, A., and Piutti, E. (1998). Silvicultural alternatives, competition regime and sensitivity to climate in a European beech forest. For. Ecol. Manag. 102, 213–223.
Charney, N. D., Babst, F., Poulter, B., Record, S., Trouet, V. M., Frank, D., et al. (2016). Observed forest sensitivity to climate implies large changes in 21st century North American forest growth. Ecol. Lett. 19, 1119–1128. doi: 10.1111/ele.12650
Clark, J. S., Bell, D. M., Kwit, M., Stine, A., Vierra, B., and Zhu, K. (2012). Individual-scale inference to anticipate climate-change vulnerability of biodiversity. Philos. Trans. R. Soc. Lond. B Biol. Sci. 367, 236–246. doi: 10.1098/rstb.2011.0183
Clark, J. S., Iverson, L., Woodall, C. W., Allen, C. D., Bell, D. M., Bragg, D. C., et al. (2016). The impacts of increasing drought on forest dynamics, structure, and biodiversity in the United States. Glob. Chang. Biol. 22, 2329–2352. doi: 10.1111/gcb.13160
Cook, B. I., Smerdon, J. E., Seager, R., and Coats, S. (2014). Global warming and 21st century drying. Clim. Dyn. 43:2607.
Cook, E., and Krusic, P. (2008). A Tree-Ring Standardization Program Based on Detrending And Autoregressive Time Series Modeling, with Interactive Graphics (ARSTAN). Palisades, NY: Lamont-Doherty Earth Observatory.
Cook, E. R. (1985). A Time Series Analysis Approach to Tree Ring Standardization. Tucson, AZ: The University of Arizona.
Cook, E. R. (1991). Tree Rings As Indicators of Climate Change and the Potential Response of Forests to the Greenhouse Effect, ed. R. I. Wyman. New York, NY: Chapman and Hall, 56–64.
Cook, E. R., and Cole, J. (1991). On predicting the response of forests in eastern North America to future climatic change. Clim. Chang. 19, 271–282.
Cook, E. R., Glitzenstein, J. S., Krusic, P. J., and Harcombe, P. A. (2001). Identifying functions groups of trees in west Gulf Coast forests (USA): a tree-ring approach. Ecol. Appl. 11, 883–903.
Cook, E. R., and Kairiukstis, L. A. (1990). Methods of Dendrochronology, Applications in the Environmental Sciences. South Holland: Kluwer Acadamic press.
Cook, E. R., Nance, W. L., Krusic, P., and Grissom, J. (1998). “Modeling the differential sensitivity of loblolly pine to climatic change using tree rings,” in The Productivity and Sustainability of Southern Forest Ecosystems in a Changing Environment. Ecological Studies (Analysis and Synthesis) eds R. A. Mickler and S. Fox (New York, NY: Springer-Verlag), 717–739.
Cook, E. R., and Peters, K. (1981). The smoothing spline: a new approach to standardizing forest interior tree-ring width series for dendroclimatic studies. Tree Ring Bull. 41, 45–53.
Cook, E. R., and Peters, K. (1997). Calculating unbiased tree-ring indices for the study of climatic and environmental change. Holocene 7, 361–370.
Cook, E. R., and Zedaker, S. M. (1992). “The Dendroecology of Red Spruce Decline,” in Ecology and Decline of Red Spruce in the Eastern United States. Ecological Studies (Analysis and Synthesis), eds C. Eagar and M. B. Adams (New York: Springer-Verlag), 192-231Google Scholar
D’Amato, A. W., Bradford, J. B., Fraver, S., and Palik, B. J. (2013). Effects of thinning on drought vulnerability and climate response in north temperate forest ecosystems. Ecol. Appl. 23, 1735–1742.
D’Orangeville, L., Maxwell, J., Kneeshaw, D., Pederson, N., Duchesne, L., Logan, T., et al. (2018). Drought timing and local climate determine the sensitivity of eastern temperate forests to drought. Glob. Chang. Biol. 24, 2339–2351. doi: 10.1111/gcb.14096
Da Silveira Lobo Sternberg, L. (2001). Savanna–forest hysteresis in the tropics. Glob. Ecol. Biogeogr. 10, 369–378.
Daly, C., Halbleib, M., Smith, J. I., Gibson, W. P., Doggett, M. K., Taylor, G. H., et al. (2008). Physiographically sensitive mapping of climatological temperature and precipitation across the conterminous United States. Int. J. Climatol. 28, 2031–2064.
DeBerry, J. W., and Atkinson, R. B. (2014). Aboveground forest biomass and litter production patterns in atlantic white cedar swamps of differing hydroperiods. Southeast. Nat. 13, 673–690.
Deslauriers, A., Rossi, S., and Anfodillo, T. (2007). Dendrometer and intra-annual tree growth: what kind of information can be inferred? Dendrochronologia 25, 113–124.
Dietze, M. C., Lebauer, D. S., and Kooper, R. (2013). On improving the communication between models and data. Plant Cell Environ. 36, 1575–1585. doi: 10.1111/pce.12043
Dolman, A., Moors, E., and Elbers, J. (2002). The carbon uptake of a mid latitude pine forest growing on sandy soil. Agric. For. Meteorol. 111, 157–170.
Druckenbrod, D., Martin-Benito, D., Orwig, D. A., Pederson, N., Poulter, B., Renwick, K., et al. (2019). Redefining temperate forest responses to climate and disturbance in the eastern United States: new insights at the mesoscale. Glob. Ecol. Biogeogr. 28, 557–575.
Duveneck, M. J., Thompson, J. R., Gustafson, E. J., Liang, Y., and de Bruijn, A. M. (2016). Recovery dynamics and climate change effects to future New England forests. Landsc. Ecol. 32, 1385–1397.
Eagle, T. R. Jr. (1999). “Atlantic white-cedar ecosystem restoration on alligator river national wildlife refuge and United States air force dare county range,” in Proceedings of the Atlantic White-Cedar: Ecology and Management Symposium, eds T. H. Shear and K. O. Summerville (Asheville, NC: U.S. Department of Agriculture), 13–17.
Ensminger, I., Sveshnikov, D., Campbell, D. A., Funk, C., Jansson, S., Lloyd, J., et al. (2004). Intermittent low temperatures constrain spring recovery of photosynthesis in boreal Scots pine forests. Glob. Chang. Biol. 10, 995–1008.
Fisher, R. A., Koven, C. D., Anderegg, W. R., Christoffersen, B. O., Dietze, M. C., Farrior, C. E., et al. (2018). Vegetation demographics in Earth system models: a review of progress and priorities. Glob. Chang. Biol. 24, 35–54. doi: 10.1111/gcb.13910
Foster, J., D’Amato, A., and Bradford, J. (2014). Looking for age-related growth decline in natural forests: unexpected biomass patterns from tree rings and simulated mortality. Oecologia 175, 363–374. doi: 10.1007/s00442-014-2881-2
Foster, J. R., Finley, A. O., D’amato, A. W., Bradford, J. B., and Banerjee, S. (2015). Predicting tree biomass growth in the temperate−boreal ecotone: is tree size, age, competition or climate response most important? Glob. Chang. Biol. 22, 2138–2151.
Friedlingstein, P., Meinshausen, M., Arora, V. K., Jones, C. D., Anav, A., Liddicoat, S. K., et al. (2014). Uncertainties in CMIP5 climate projections due to carbon cycle feedbacks. J. Clim. 27, 511–526. doi: 10.1111/gcb.12827
Fritts, H. C. (1962). The relation of growth ring widths i American beech and white oak variations to variations in climate. Tree Ring Res. 25, 2–10.
Graumlich, L. J. (1993). Response of tree growth to climatic variation in the mixed conifer and deciduous forests of the upper Great Lakes region. Can. J. For. Res. 23, 133–143.
Grégoire, T. G., Schabenberger, O., and Barrett, J. P. (1995). Linear modelling of irregularly spaced, unbalanced, longitudinal data from permanent-plot measurements. Can. J. For. Res. 25, 137–156.
Harvey, J. E., Smiljanić, M., Scharnweber, T., Buras, A., Cedro, A., Cruz−García, R., et al. (2019). Tree growth influenced by warming winter climate and summer moisture availability in northern temperate forests. Glob. Chang. Biol. 26, 2505–2518. doi: 10.1111/gcb.14966
Hawley, F., Wedel, W., and Workman, E. (1941). Tree-Ring Analysis and Dating in the Mississippi Drainage. Chicago: University of Chicago Press.
Heffernan, J. B., Soranno, P. A., Angilletta, M. J., Buckley, L. B., Gruner, D. S., Keitt, T. H., et al. (2014). Macrosystems ecology: understanding ecological patterns and processes at continental scales. Front. Ecol. Environ. 12:130017. doi: 10.1890/130017
Hiddink, J. G., and Kaiser, M. (2005). Implications of Liebig’s law of the minimum for the use of ecological indicators based on abundance. Ecography 28, 264–271.
Holmes, R. L. (1983). Computer-assisted quality control in tree-ring dating and measurement. Tree Ring Bull. 43, 69–78. doi: 10.1016/j.dib.2018.08.019
Hopton, H. M., and Pederson, N. (2005). “Climate sensitivity of Atlantic white cedar at its northern range limit,” in Atlantic White Cedar: Ecology, Restoration and Management: Proceedings of the Arlington Echo Symposium, eds M. K. Burke and P. Sheridan (Asheville, NC: USDA Forest Service Southern Research Station), 22–30.
Hopton, H. M., Pederson, N., and Davi, N. (2004). “Climate sensitivity of Atlantic white cedar from North Carolina to Maine,” in Proceedings of Annual Meeting. Society of Conservation Biology, (New York, NY: International Institute for Sustainable Development).
Housset, J. M., Nadeau, S., Isabel, N., Depardieu, C., Duchesne, I., Lenz, P., et al. (2018). Tree rings provide a new class of phenotypes for genetic associations that foster insights into adaptation of conifers to climate change. New Phytol. 218, 630–645. doi: 10.1111/nph.14968
Itter, M. S., Finley, A. O., D’Amato, A. W., Foster, J. R., and Bradford, J. B. (2017). Variable effects of climate on forest growth in relation to climate extremes, disturbance, and forest dynamics. Ecol. Appl. 27, 1082–1095. doi: 10.1002/eap.1518
Jesse, K. J. (1999). Modelling of a diffusive Lotka-Volterra-system: the climate-induced shifting of tundra and forest realms in North-America. Ecol. Model. 123, 53–64.
Johnson, P. C. (2014). Extension of Nakagawa & Schielzeth’s R2GLMM to random slopes models. Methods Ecol. Evol. 5, 944–946.
Kagawa, A., Sugimoto, A., and Maximov, T. C. (2006). 13CO2 pulse-labelling of photoassimilates reveals carbon allocation within and between tree rings. Plant Cell Environ. 29, 1571–1584.
Kattge, J., Diaz, S., Lavorel, S. I., Prentice, C., Leadley, P., Bönisch, G., et al. (2011). TRY–a global database of plant traits. Glob. Chang. Biol. 17, 2905–2935.
Kim, E., and Siccama, T. G. (1986). “The influence of temperature and soil moisture on the radial growth of northern hardwood tree species at Hubbard Brook experimental forest, New Hampshire, USA,” in Proceedings of the International Symposium on Ecological Aspects of Tree-Ring Analysis, eds G. Jacoby and J. W. Hornbeck (Tarrytown, NY: Hubbard Brook Experimental Forest).
Klesse, S., Babst, F., Lienert, S., Spahni, R., Joos, F., Bouriaud, O., et al. (2018a). A combined tree ring and vegetation model assessment of European forest growth sensitivity to interannual climate variability. Glob. Biogeochem. Cycles 32, 1226–1240.
Klesse, S., DeRose, R. J., Guiterman, C. H., Lynch, A. M., O’Connor, C. D., Shaw, J. D., et al. (2018b). Sampling bias overestimates climate change impacts on forest growth in the southwestern United States. Nat. Commun. 9:5336. doi: 10.1038/s41467-018-07800-y
Laderman, A. (1989). The ecology of the Atlantic white cedar wetlands: a community profile (biological report). USGS Nat. Wetl. Res. Center 85, 1–114.
Laskurain, N. A., Aldezabal, A., Odriozola, I., Camarero, J. J., and Olano, J. M. (2018). Variation in the climate sensitivity dependent on neighbourhood composition in a secondary mixed forest. Forests 9:43.
LeBlanc, D., Maxwell, J., Pederson, N., Berland, A., and Mandra, T. (accepted). Radial Growth Responses of Tulip Poplar (Liriodendron tulipifera) to Climate in the Eastern United States. Ecosphere.
Li, Q., Staver, A. C., Weinan, E., and Levin, S. A. (2019). Spatial feedbacks and the dynamics of savanna and forest. Theor. Ecol. 12, 237–262.
Litzow, M. A., and Hunsicker, M. E. (2016). Early warning signals, nonlinearity, and signs of hysteresis in real ecosystems. Ecosphere 7:e01614.
Lloyd, A. H., Sullivan, P. F., and Bunn, A. G. (2017). “Integrating dendroecology with other disciplines improves understanding of upper and latitudinal treelines,” in Dendroecology, eds M. Amoroso, L. Daniels, P. Baker, and J. Camarero (Cham: Springer), 135–157.
Loehle, C. (2000). Forest ecotone response to climate change: sensitivity to temperature response functional forms. Can. J. For. Res. 30, 1632– 1645.
Mankin, J. S., Seager, R., Smerdon, J. E., Cook, B. I., and Williams, A. P. (2019). Mid-latitude freshwater availability reduced by projected vegetation responses to climate change. Nat. Geosci. 12, 983–988.
Marcott, S. A., Shakun, J. D., Clark, P. U., and Mix, A. C. (2013). A reconstruction of regional and global temperature for the past 11,300 years. Science 339, 1198–1201. doi: 10.1126/science.1228026
Martin-Benito, D., Kint, V., del Río, M., Muys, B., and Cañellas, I. (2011). Growth responses of West-Mediterranean Pinus nigra to climate change are modulated by competition and productivity: past trends and future perspectives. For. Ecol. Manag. 262, 1030–1040.
Martin-Benito, D., and Pederson, N. (2015). Convergence in drought stress, but a divergence of climatic drivers across a latitudinal gradient in a temperate broadleaf forest. J. Biogeogr. 42, 925–937.
Martin-Benito, D., Pederson, N., Köse, N., Doğan, M., Bugmann, H., Mosulishvili, M., et al. (2018). Pervasive effects of drought on tree growth across a wide climatic gradient in the temperate forests of the Caucasus. Glob. Ecol. Biogeogr. 27, 1314–1325.
Martínez del Castillo, E., Tejedor, E., Serrano-Notivoli, R., Novak, K., Saz, M., Longares, L., et al. (2018). Contrasting patterns of tree growth of mediterranean pine species in the iberian peninsula. Forests 9:416.
Mascioli, N. R., Previdi, M., Fiore, A. M., and Ting, M. (2017). Timing and seasonality of the United States ‘warming hole’. Environ. Res. Lett. 12:034008.
McMahon, S. M., and Parker, G. G. (2015). A general model of intra−annual tree growth using dendrometer bands. Ecol. Evol. 5, 243–254. doi: 10.1002/ece3.1117
Meko, D., Cook, E. R., Stahle, D. W., Stockton, C. W., and Highes, M. K. (1993). Spatial patterns of tree-growth anomalies in the United States and southeastern Canada. J. Clim. 6, 1773–1786.
Murtagh, F., and Legendre, P. (2014). Ward’s hierarchical agglomerative clustering method: which algorithms implement Ward’s criterion? J. Classif. 31, 274–295.
Mylecraine, K. A., Kuser, J. E., Smouse, P. E., and Zimmermann, G. L. (2004). Geographic allozyme variation in Atlantic white-cedar, Chamaecyparis thyoides (Cupressaceae). Can. J. For. Res. 34, 2443– 2454.
Mylecraine, K. A., Zimmermann, G. L., and Kuser, J. E. (2005). “Performance of Atlantic white-cedar plantings along water table gradients at two sites in the New Jersey Pinelands,” in Atlantic White Cedar: Ecology, Restoration, and management. Proceedings of the Arlington Echo Symposium, ed. P. H. Sheridan (Asheville, NC: United States Department of Agriculture), 7–10.
Nakagawa, S., and Schielzeth, H. (2013). A general and simple method for obtaining R2 from generalized linear mixed−effects models. Methods Ecol. Evol. 4, 133–142. doi: 10.1093/sysbio/syy060
Nehrbass-Ahles, C., Babst, F., Klesse, S., Nötzli, M., Bouriaud, O., Neukom, R., et al. (2014). The influence of sampling design on tree-ring-based quantification of forest growth. Glob. Chang. Biol. 20, 2867–2885. doi: 10.1111/gcb.12599
Osborn, T. J., Briffa, K. R., and Jones, P. D. (1997). Adjusting variance for sample-size in tree-ring chronologies and other regional-mean time series. Dendrochronologia 15, 89–99.
Ottander, C., and Öquist, G. (1991). Recovery of photosynthesis in winter-stressed Scots pine. Plant Cell Environ. 14, 345–349.
Pearl, J. K., Anchukaitis, K. J., Pederson, N., and Donnelly, J. P. (2017). Reconstructing Northeastern United States temperatures using Atlantic white cedar tree rings. Environ. Res. Lett. 12:114012.
Pearl, J. K., Anchukaitis, K. J., Pederson, N., and Donnelly, J. P. (2019). Multivariate climate eld reconstructions using tree rings for the northeastern United States. J. Geophys. Res. Atmos. 125:e2019JD031619.
Pedersen, B. S. (1998). The role of stress in the mortality of midwestern oaks as indicated by growth prior to death. Ecology 79, 79–93.
Pederson, N. (2005). Climatic Sensitivity and Growth of Southern Temperate Trees in the Eastern US: Implications for the Carbon Cycle. Doctoral Thesis, Columbia University, Columbia.
Pederson, N., Cook, E. R., Jacoby, G. C., Peteet, D. M., and Griffin, K. L. (2004). The influence of winter temperatures on the annual radial growth of six northern range margin tree species. Dendrochronologia 22, 7–29.
Pederson, N., D’Amato, A. W., Dyer, J. M., Foster, D. R., Goldblum, D., Hart, J. L., et al. (2015). Climate remains an important driver of post-European vegetation change in the eastern United States. Glob. Chang. Biol. 21, 2105– 2110.
Peteet, D. (2000). Sensitivity and rapidity of vegetational response to abrupt climate change. Proc. Natl. Acad. Sci. U.S.A. 97, 1359–1361.
Peteet, D. M., Vogel, J. S., Nelson, D. E., Southon, J. R., Nickmann, R. J., and Heusser, L. E. (1990). Younger dryas climatic reversal in northeastern USA? AMS ages for an old problem. Quat. Res. 33, 219–230.
Pinheiro, J., Bates, D., DebRoy, S., and Sarkar, D. R Core Team. (2012). nlme: Linear and Nonlinear Mixed Effects Models. R Package Version 3.
Prism Climate Group (2020). Time Series for Individual Locations. http://www.prism.oregonstate.edu/explorer/ (accessed January 22, 2020)
R core team. (2017). R: A Language And Environment for Statistical Computing. Vienna: R Foundation for Statistical Computing.
Rollinson, C. R., Liu, Y., Raiho, A., Moore, D. J., McLachlan, J., Bishop, D. A., et al. (2017). Emergent climate and CO2 sensitivities of net primary productivity in ecosystem models do not agree with empirical data in temperate forests of eastern North America. Glob. Chang. Biol. 23, 2755–2767. doi: 10.1111/gcb.13626
Seftigen, K., Frank, D. C., Björklund, J., Babst, F., and Poulter, B. (2018). The climatic drivers of normalized difference vegetation index and tree-ring-based estimates of forest productivity are spatially coherent but temporally decoupled in Northern Hemispheric forests. Glob. Ecol. Biogeogr. 27, 1352–1365.
Seim, A., Merry, S., Pederson, N., and Atkinson, R. (2006). “The effect of temperature on the growth of Atlantic white cedar in two mid-atlantic national wildlife refuges,” in Proceedings of the International Conference on Hydrology and Management of Forested Wetlands, (New Bern, CA: American Society of Agricultural and Biological Engineers).
Stahle, D. W., Cleaveland, M. K., and Hehr, J. G. (1988). North Carolina climate changes reconstructed from tree rings: AD 372 to 1985. Science 240, 1517–1519.
Stokes, M. A., and Smiley, T. (1968). An Introduction to Tree-Ring Dating. Chicago: University of Chicago Press.
Swanston, C., Brandt, L. A., Janowiak, M. K., Handler, S. D., Butler-Leopold, P., Iverson, L., et al. (2017). Vulnerability of forests of the Midwest and Northeast United States to climate change. Clim. Chang. 146, 1–14.
Szeicz, J. M., and MacDonald, G. M. (1994). Age-dependent tree-ring growth responses of subarctic white spruce to climate. Can. J. For. Res. 24, 120–132.
Tardif, J. C., Conciatori, F., Nantel, P., and Gagnon, D. (2006). Radial growth and climate responses of white oak (Quercus alba) and northern red oak (Quercus rubra) at the northern distribution limit of white oak in Quebec. Can. J. Biogeogr. 33, 1657–1669.
Trumbore, S., Gaudinski, J. B., Hanson, P. J., and Southon, J. R. (2002). Quantifying ecosystem-atmosphere carbon exchange with a 14C label. EOS Trans. 83, 267–268.
Turner, M. G. (2010). Disturbance and landscape dynamics in a changing world. Ecology 91, 2833–2849.
Usgcrp. (2018). Impacts, Risks, and Adaptation in the United States: Fourth National Climate Assessment, Vol. 2. Washington, DC: U.S. Global Change Research Program.
U.S. Department of the Interior, Fish and Wildlife Service (2019). National Wetlands Inventory Website. Washington, D.C: U.S. Department of the Interior, Fish and Wildlife Service.
van Nes, E. H., and Scheffer, M. (2005). Implications of spatial heterogeneity for catastrophic regime shifts in ecosystems. Ecology 86, 1797–1807.
Visser, H., Büntgen, U., D’Arrigo, R., and Petersen, A. (2010). Detecting instabilities in tree-ring proxy calibration. Clim. Past 6, 367–377.
Wei, T., Simko, V., Levy, M., Xie, Y., Jin, Y., and Zemla, J. (2017). Package ‘corrplot’. Statistician 56, 316–324.
Weigel, R., Muffler, L., Klisz, M., Kreyling, J., van der Maaten-Theunissen, M., Wilmking, M., et al. (2018). Winter matters: sensitivity to winter climate and cold events increases towards the cold distribution margin of European beech (Fagus sylvatica L.). J. Biogeogr. 45, 2779–2790.
Woodward, F. I., and Woodward, F. (1987). Climate and Plant Distribution. Cambridge: Cambridge University Press.
Zhang, J., Jørgensen, S. E., Beklioglu, M., and Ince, O. (2003). Hysteresis in vegetation shift—Lake Mogan prognoses. Ecol. Model. 164, 227–238.
Ziaco, E., and Liang, E. (2019). New perspectives on sub-seasonal xylem anatomical responses to climatic variability. Trees 33, 973–975.
Zscheischler, J., Westra, S., Hurk, B. J., Seneviratne, S. I., Ward, P. J., Pitman, A., et al. (2018). Future climate risk from compound events. Nat. Clim. Chang. 8, 469–477.
Zuur, A., Ieno, E. N., Walker, N., Saveliev, A. A., and Smith, G. M. (2009). Mixed Effects Models and Extensions in Ecology with R. Berlin: Springer Science & Business Media.
Keywords: climate change, forest ecology, tree rings, tree growth, population ecology
Citation: Pederson N, Leland C, Bishop DA, Pearl JK, Anchukaitis KJ, Mandra T, Hopton-Ahmed M and Martin-Benito D (2020) A Framework for Determining Population-Level Vulnerability to Climate: Evidence for Growth Hysteresis in Chamaecyparis thyoides Along Its Contiguous Latitudinal Distribution. Front. For. Glob. Change 3:39. doi: 10.3389/ffgc.2020.00039
Received: 27 November 2019; Accepted: 17 March 2020;
Published: 22 April 2020.
Edited by:
Brian J. Palik, Forest Service (USDA), United StatesReviewed by:
Maxime Cailleret, Institut National de Recherche pour l’Agriculture, l’Alimentation et l’Environnement (INRAE), FranceChristopher R. Schwalm, Woods Hole Research Center, United States
Copyright © 2020 Pederson, Leland, Bishop, Pearl, Anchukaitis, Mandra, Hopton-Ahmed and Martin-Benito. This is an open-access article distributed under the terms of the Creative Commons Attribution License (CC BY). The use, distribution or reproduction in other forums is permitted, provided the original author(s) and the copyright owner(s) are credited and that the original publication in this journal is cited, in accordance with accepted academic practice. No use, distribution or reproduction is permitted which does not comply with these terms.
*Correspondence: Neil Pederson, neilpederson@fas.harvard.edu