 Camille S. Stevens-Rumann
 Andrew T. Hudak
 Penelope Morgan
 Alex Arnold2
 Eva K. Strand
- 1Forest and Rangeland Stewardship, Colorado State University, Fort Collins, CO, United States
- 2Department of Forest, Rangeland, and Fire Sciences, University of Idaho, Moscow, ID, United States
- 3Rocky Mountain Research Station, United States Forest Service, United States Department of Agriculture, Fort Collins, CO, United States
Accumulation of dead woody material is a critical management concern following wildfires, especially given the possibility of subsequent wildfires. Forest structure and fuel accumulation are largely driven by site climatic conditions, so variability in site conditions is important to consider in management beyond the one-size fits all model for post-fire fuel dynamics. Moreover, dead woody material provides important ecological functions for forested ecosystems. Understanding when surface fuels biomass is highest following wildfires and how these dynamics change after repeated fires affords land management agencies opportunities to adjust fuel reduction strategies without removing large quantities of dead trees that are important in these post-fire landscapes for a variety of ecosystem services, including wildlife, water and nutrient retention, and soil stabilization. Here, we examined how surface fuels and standing dead trees change over time, by burn severity, site climate, and with repeated fires at seven different years-since-fire (1–24 years) across 182 sites from ten wildfires in central Idaho. Downed woody fuel loads were higher on moister and cooler sites. Large-diameter woody fuels saw significant increases after about 14 years post-fire while smaller woody fuels had the highest loads at 20 years post-fire. Surface fuel loads varied by burn severity and years since fires, with the highest loadings at longer years since fire and sites burned in stand replacing fire. Litter and duff had not sufficiently accumulated to compensate for continued decomposition, resulting in lower forest floor biomass through 24 years post fire. Density of snags of all sizes generally declined after 7–9 years, but large-diameter snags were still standing 24 years post fire. Repeated fires resulted in >40% reduction in both surface fuels and standing trees compared to once-burned areas at the same years since fire. Burned landscapes can serve a great ecological benefit by providing an infusion of both standing and downed dead woody debris. Additionally, though some sites burned in stand replacing fires exceed recommended surface fuel loadings, these ecological considerations should be weighed against concerns about reburning potential and fire fighter hazards.
Introduction
The increasing footprint of wildfires across the western U.S. (Moritz et al., 2012; Stephens et al., 2013; Parks et al., 2016) has raised concerns about surface fuel accumulation on post-fire landscapes. Woody fuel accumulation in burned landscapes following large wildfires is a dominant concern when considering how these sites will burn in the event of a subsequent fire, including both the ecological effects and fire suppression issues that may arise. While reburning at low burn severity has been demonstrated as ecologically beneficial and able to achieve restoration objectives (Larson et al., 2013; Stevens-Rumann and Morgan, 2016), repeated high severity fires present multiple management and ecological concerns. A primary concern of U.S. land management agencies related to reburning is the potential for increased “resistance to control” or a compromised ability for fire crews to build fire lines due primarily to increased surface fuel loading (USDA et al., 1976; Alexander, 2000). As fire seasons lengthen (Jolly et al., 2015) and burned areas increase, there is an increased likelihood of extensive reburning, especially of younger forests (Parks et al., 2016; Harvey et al., 2016). However, little is known about long-term woody fuel dynamics and accumulation in forests across a range of climatic regimes and the impact of repeated wildfires in quick succession.
Though standing dead trees (referred to here as ‘snags’) and woody surface fuels are a safety concern for fire fighters during a wildfire event, these dead trees also serve valuable ecological functions. Snags and downed wood provide wildlife and insect habitat and influence soil moisture, nutrient content, and stabilization (Harmon et al., 1986; Graham et al., 1994; Bull et al., 1997; Jurgensen et al., 1997; Brown et al., 2003). In an attempt to identify areas that had sufficient surface woody fuel to provide these ecological functions without presenting excessive “resistance to control,” Graham et al. (1994) and Brown et al. (2003) developed the concept of “optimum” woody fuel loading for conifer forests of the western U.S. Further, recommendations and guidelines across many national forests address retention of snags during logging operations to promote snag density suitable for bird habitat (e.g., Hutto, 2006). One of the potential ecological benefits of areas burned with high severity is the number of snags, particularly when such snags are large. However, the time period that snags remain standing as opposed to contributing to the surface fuels varies geographically (Everett et al., 1999; Fornwalt et al., 2018).
Previous wildfires can influence subsequent burn severity, but these effects are somewhat short-lived, likely due to gradual accumulation of both surface fuels and live biomass (Parks et al., 2016; Harvey et al., 2016; Stevens-Rumann et al., 2016). While shifts in fire behavior, especially on extreme fire weather days, can be driven by climate and weather factors, the other dominant driver of fire behavior in many western U.S. forests is the quantity of both surface and canopy fuels (Parks et al., 2016; Harvey et al., 2016). Thus, it is critical to understand fuel accumulation in the years following wildfires to identify periods after wildfires where fuel loads are highest and of most concern.
While the US northern Rockies have experienced many large fires in recent decades, due to both climate (Westerling, 2016) and past forest management (Hessburg et al., 2016), there are no regional studies on post-fire fuels across a range of conditions and time since fire, and little is understood about how fuels change following a subsequent fire. Researchers have examined post-fire fuel dynamics through time in other regions, such as the northwestern (Everett et al., 1999; Dunn and Bailey, 2015) and southeastern U.S. (Sah et al., 2006), California (Eskelson and Monleon, 2018), southern Rockies, and southwestern U.S. (Passovoy and Fulé, 2006; Roccaforte et al., 2012; Fornwalt et al., 2018). In the western U.S., researchers documented surface fuel loads peak 6–18 years post fire (Roccaforte et al., 2012; Dunn and Bailey, 2015; Fornwalt et al., 2018; Eskelson and Monleon, 2018), indicating the first 20 years after an area burns with high severity may be of most concern for managers. In one of the only repeated measures studies in the region, Nelson et al. (2016) found surface fuel accumulation 24 years post-fire in lodgepole pine forests (Pinus contorta) of Yellowstone National Park had exceeded levels needed for initiation of a subsequent high severity surface fire and/or active crown fire on more than 63% of plots measured.
Most studies focus on fuel variability in a single forest type within a region (e.g., Dunn and Bailey, 2015; Eskelson and Monleon, 2018; Fornwalt et al., 2018). Very few have examined how fuels complexes vary across severity, forest types, and climate space within a region. Here, we analyzed data collected from 10 large wildfires burned between 1989 and 2007 in forests of the US Northern Rockies to better understand the dynamics of woody fuel accumulation and snag retention following wildfires across a range of mixed-conifer forests. We asked the questions: (1) How do canopy and surface fuels change through time following wildfires at sites burned with different severities and with different site climates in mixed-conifer forests of the northern Rockies? and (2) How are woody fuel dynamics influenced by repeated wildfires in a short period of time (<20 years)?
Materials and Methods
Standing and downed fuels data were collected between 2008 and 2016 in Idaho (Figure 1). In all studies, fuels sampling was confined to forested sites with elevations of 1,000 to 2,400 m. Dominant overstory tree species on lower elevation sites included ponderosa pine (Pinus ponderosa) and Douglas-fir (Pseudotsuga menziesii), while higher elevation sites transitioned to dominance by lodgepole pine (Pinus contorta), Engelmann spruce (Picea engelmannii), and grand fir (Abies grandis). Common understory shrubs included ninebark (Physocarpus malvaceus), common snowberry (Symphoricarpos albus), spirea (Spiraea betulifolia), and thinleaf huckleberry (Vaccinium membranaceum), with shinyleaf ceanothus (Ceanothus velutinus) particularly occurring in areas burned at high severity. Common forbs included common yarrow (Achillea millefolium), heartleaf arnica (Arnica cordifolia), pearly everlasting (Anaphalis margaritacea), and forbs of the genera Fragaria, Lupinus, and Penstemon. Fireweed (Chamerion angustifolium) occurred frequently on high severity burned sites. Common grasses were Idaho fescue (Festuca idahoensis), Sandberg bluegrass (Poa secunda), pinegrass (Calamagrostis rubescens), and blue wildrye (Elymus glaucus). Sedges (Carex spp.) were common across burn severity levels. Large, highly flammable shrubs are not a large component of these systems and the large wildfires studied here were largely wind driven wildfires during extreme fire weather conditions (Hudak et al., 2011). We verified the burn severity by considering tree mortality and seedling age at each plot in the field. While our sampled sites likely burned before the 20th century, no large wildfires were recorded since 1950 until our study fires occurred, according to local history of large fires compiled by Gibson et al. (2014). We excluded all sites that had logging prior to data collection based on management action records provided by the National Forests, both through personal communications and the FACTS database (U.S. Department of Agriculture, Forest Service, 2016). Our data was compiled from multiple initial studies and more recent unpublished field work; for a full description of the original studies, see Hudak et al. (2011), Stevens-Rumann et al. (2015), Stevens-Rumann and Morgan (2016), and Strand et al. (2019).
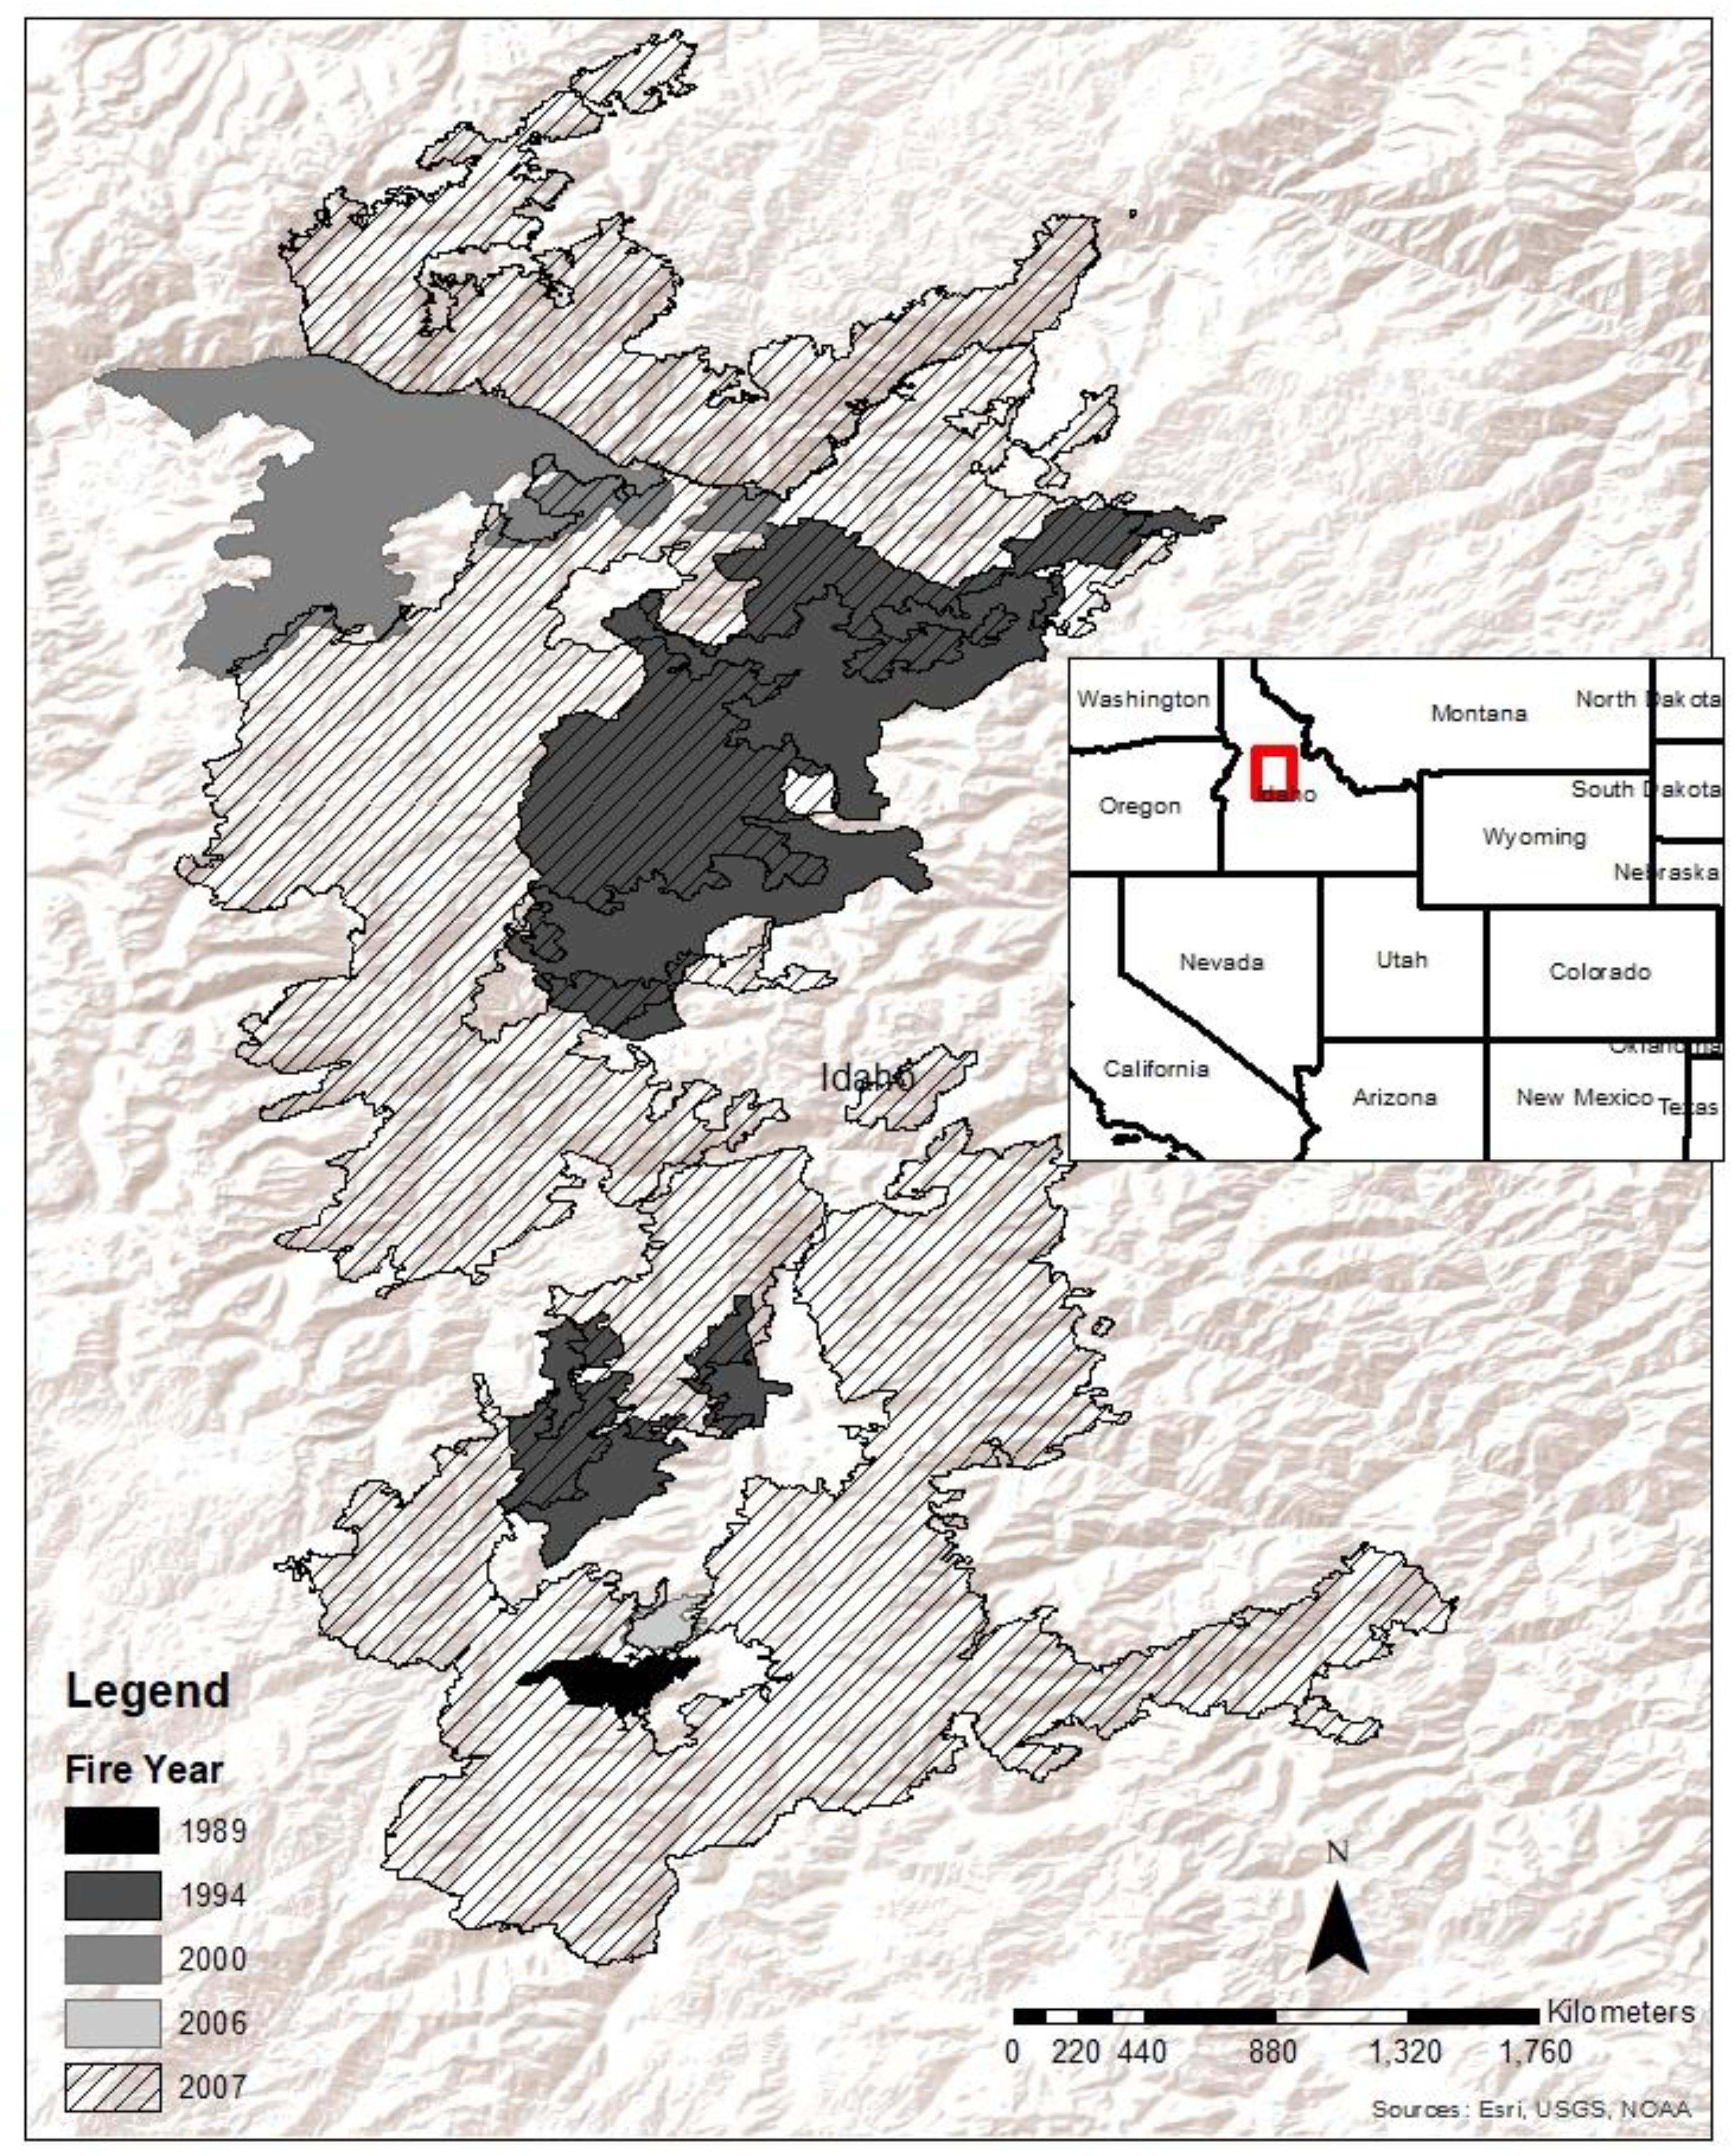
Figure 1. Gray-scale perimeters indicate burn areas we sampled in Idaho, United States. These large fires burned between 1989 and 2007 according to the MTBS database (http://www.mtbs.govmtbs.gov).
In all sites (N = 182), we established a plot at each randomly located point within a stratification of stand replacing fire or non-stand replacing fire excluding sites too close to the road (>30 m), in order to preclude edge effects. For the purposes of figure display and summary statistics, we grouped burn severity into two categories: “non-stand replacing fire” (<90% tree mortality) and “stand replacing fire” (>90% tree mortality). Plot size varied slightly: on 158 plots, a 0.04-ha circular plot was established, while on 24 plots measured 9 years post-fire, a 0.02-ha circular plot was established (Table 1). On 138 of the 0.04-ha circular plots, we tallied all trees >7.62 cm DBH (1.37 m above the ground) as alive or dead, including fallen trees, to estimate percent tree mortality. On 20 additional 1-year-post-fire plots, trees were tallied in 2008 (also 0.04-ha plot), but the minimum DBH was 12.7 cm and no fallen trees were quantified. On 24 plots, each 0.02-ha and circular, we tallied live and dead trees ≥10 cm, but no fallen trees were tallied. For all plots, we classified a “large snag” as any dead tree >30 cm DBH. Live tree basal area and total basal area was calculated; total basal area included both live and dead basal area on each plot. We also determined burn severity based on percent tree mortality. While we estimated tree species to the best of our ability, with the long time-since-fire for some sites, we were unable to determine definitively the species of long-dead trees, thus species-level analyses were not performed. We also could not distinguish reliably between standing dead trees present pre-fire and those created by the wildfire itself.
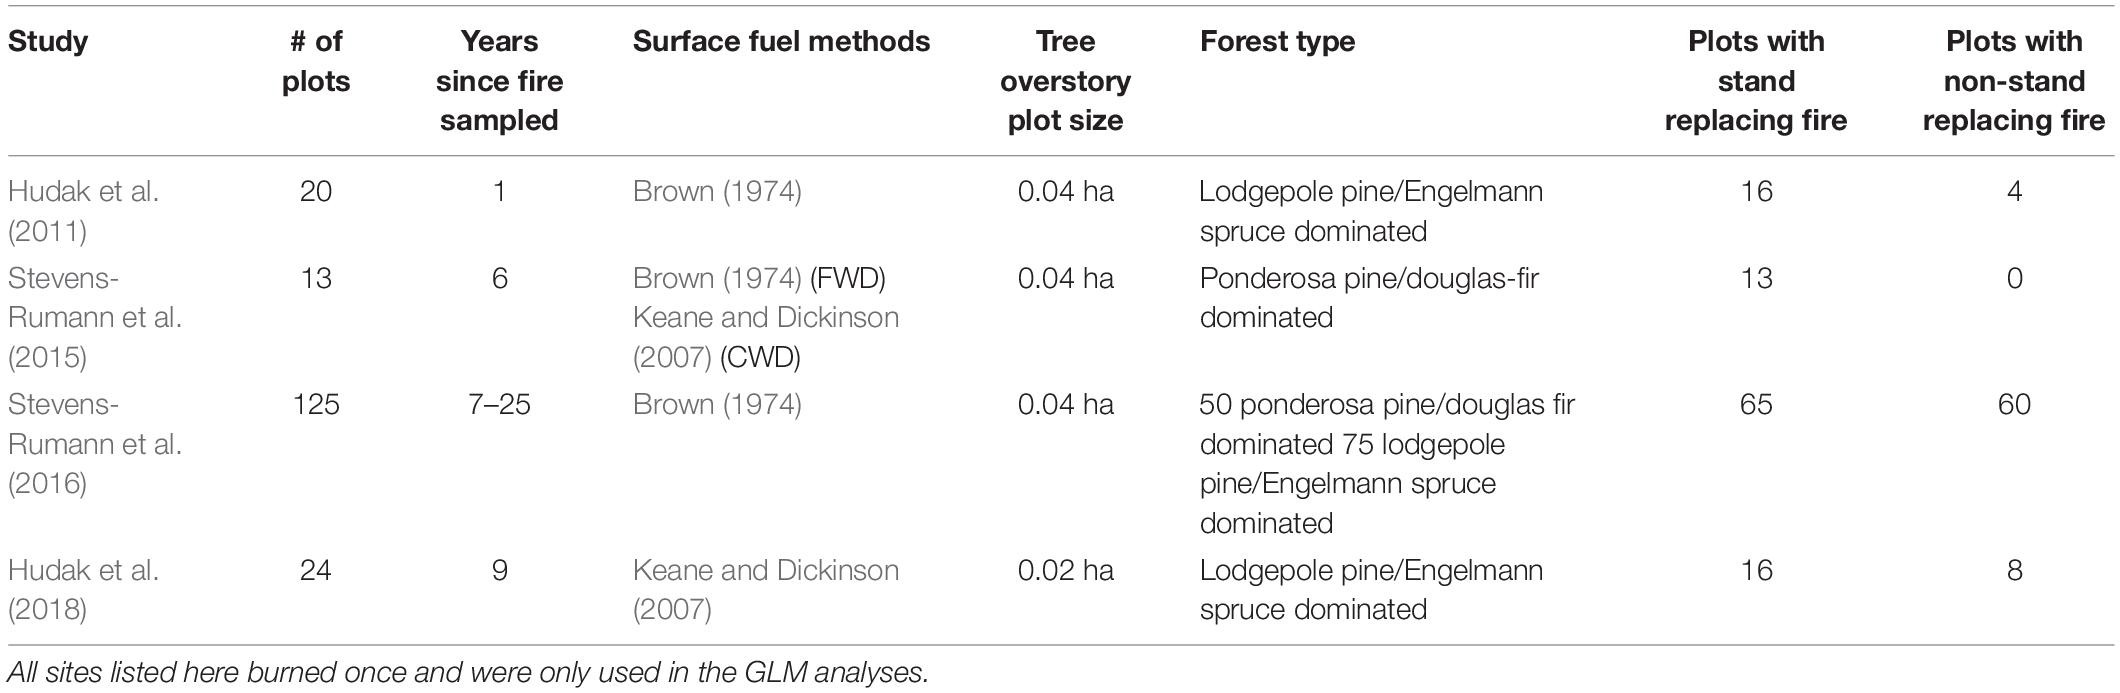
Table 1. List of studies, with number of sites and surface fuel methods described.
To quantify downed woody fuels, methods varied slightly by study. We tallied FWD, litter depths, and duff depths following methods outlined by Brown (1974) for most plots and used Keane and Dickinson (2007) methods in 2016 for 24 plots. Dead down woody debris were tallied by size classes (0–0.64, 0.65–2.54, 2.55–7.62 cm diameter) to correspond with 1-, 10-, and 100-h time-lag fuel classes, along 4–6 m, 4–6 m, and 4–10 m of one 30 m fuels transect through plot center, respectively. On 24 1-year-post-fire plots tallied in 2008, all three fuel size classes were tallied along the 7–9 m section of two 15-m fuel transects. These tallies were converted to biomass (Mg ha–1) using Brown’s (1974) allometric equations, and we additionally grouped 1-, 10-, and 100-h time-lag fuel classes together into FWD (<7.62 cm). Litter and duff depths were measured 5–10 times at points along the central transect within each plot and averaged for each site; litter and duff depths were also combined for a forest floor depth metric. Litter and duff biomasses were estimated in Mg/ha from the litter and duff depth measures following Eq. (2) in Stephens et al. (2004) for white fir litter (10.394∗litter_depth_cm^1.352) and a bulk density of 42.473 kg/m2 for lodgepole pine duff in Table 1 of Brown et al. (1982).
Slightly different methods were employed between various studies for 1,000-h fuels or CWD (>7.62 cm). Briefly, on 125 plots, 1,000-h fuels were tallied and diameters taken following methods outlined by Brown (1974) along two 15-m transects (Hudak et al., 2011) or one 30-m transect (Stevens-Rumann and Morgan, 2016). On 24 circular plots, 100 m2 in size, photoload methods (Keane and Dickinson, 2007) were employed to estimate CWD biomass 9 years post fire. On 13 plots, 6 years post fire, CWD was measured in a 100-m2 circular subplot located within the center of each plot. Within this subplot the length and diameter at both ends of each piece was measured for every CWD fuel and the fuel load was estimated following Keane et al. (2012). Downed woody debris (DWD) was also calculated as the combined loading of FWD and CWD.
Climate variables indicative of average climate conditions for each site were derived from 30-year (1961–1990) climate normals using thin-plate splines of Hutchinson (2000) per Rehfeldt et al. (2006), available at http://charcoal.cnre.vt.edu/climate/. We examined fifteen climate variables (Table 2), choosing for the final models only those that contributed to the best predictive model of the responses. We also considered as predictors topographic slope (%) and aspect; aspect was transformed from degrees to range between 0 (wettest aspect at 30°) and 1 (driest aspect at 210°) following Roberts and Cooper (1989). As a final predictor to indicate burn severity, we considered the dNBR calculated from pre-fire and 1-year post-fire Landsat satellite imagery. Though we used dNBR, Scan Line Corrector (SLC) data gaps specific to Landsat 7imagery did exist on imagery of some of our fires, therefore, we employed a 5 × 5 pixel (150 m × 150 m) window to assign the nearest neighbor dNBR value within 150 m of any sites located in a SLC data gap.
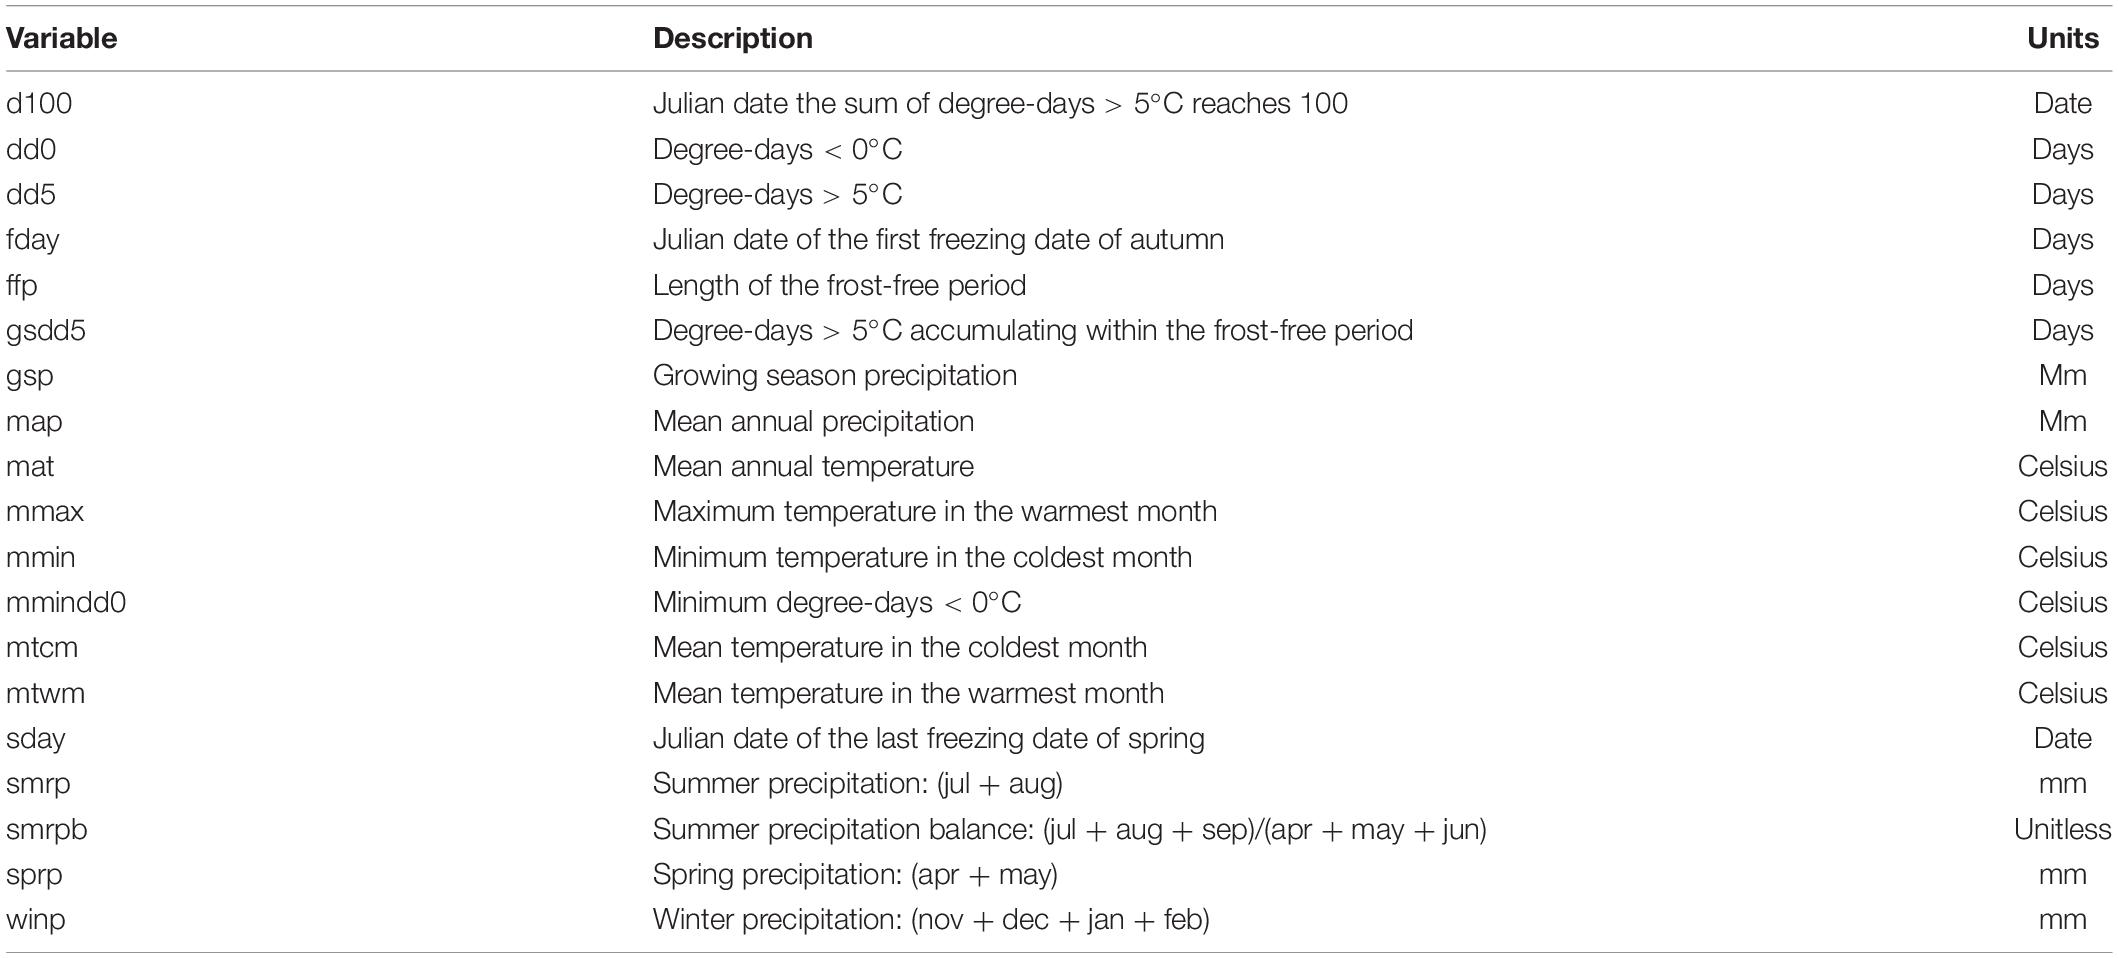
Table 2. Climate variables derived from Rehfeldt (2006) climate models.
Data Analysis
Pre-fire tree density was reconstructed from standing and down trees post-fire. Variability in pre-fire tree density was tested across years since fire using an Analysis of Variance (ANOVA) to understand if sites within each fire year varied significantly prior to each wildfire.
To answer our first question, we fit generalized linear models (glm function in the stats package in R) using the Gamma (link = “log”) family object (R Development Core Team, 2011), which is recommended for right-skewed, continuous response variables (McCullagh and Nelder, 1989), to predict the fuel and stand attributes using the 15 climate variables, years since fire, slope, transformed aspect, and dNBR as potential predictors. Total sample size across all once burned sites was 182, however, the number of sampled sites at each year-since-fire ranged from n = 13 to n = 39 (Figure 2). The predictor variables were chosen by initially performing a regression subsets procedure using the leaps package in R. The continuous response variables invariably had right-skewed distributions, and so were natural log transformed before fitting and comparing best subsets models using ordinary least squares multiple linear regression (lm function in the stats package in R). Those selected predictor variables comprising the best subsets model, as defined by the smallest Akaike Information Criterion (AIC) statistic, were then transferred to GLMs specified for a gamma distributional fit and a natural log link function. Finally, the GLMs were tested to see if they could be improved slightly, by either dropping a weakly significant predictor or adding a new predictor that was sufficiently highly correlated to the model residuals, to minimize the AIC statistic between competing GLMs. Model residuals were examined for randomness and normality, and in the case of the surface fuel attributes, compared between the planar transect (Brown, 1974) vs. photoload (Keane and Dickinson, 2007) fuel sampling methods to confirm that there were no methodological artifacts (i.e., only negligible differences).
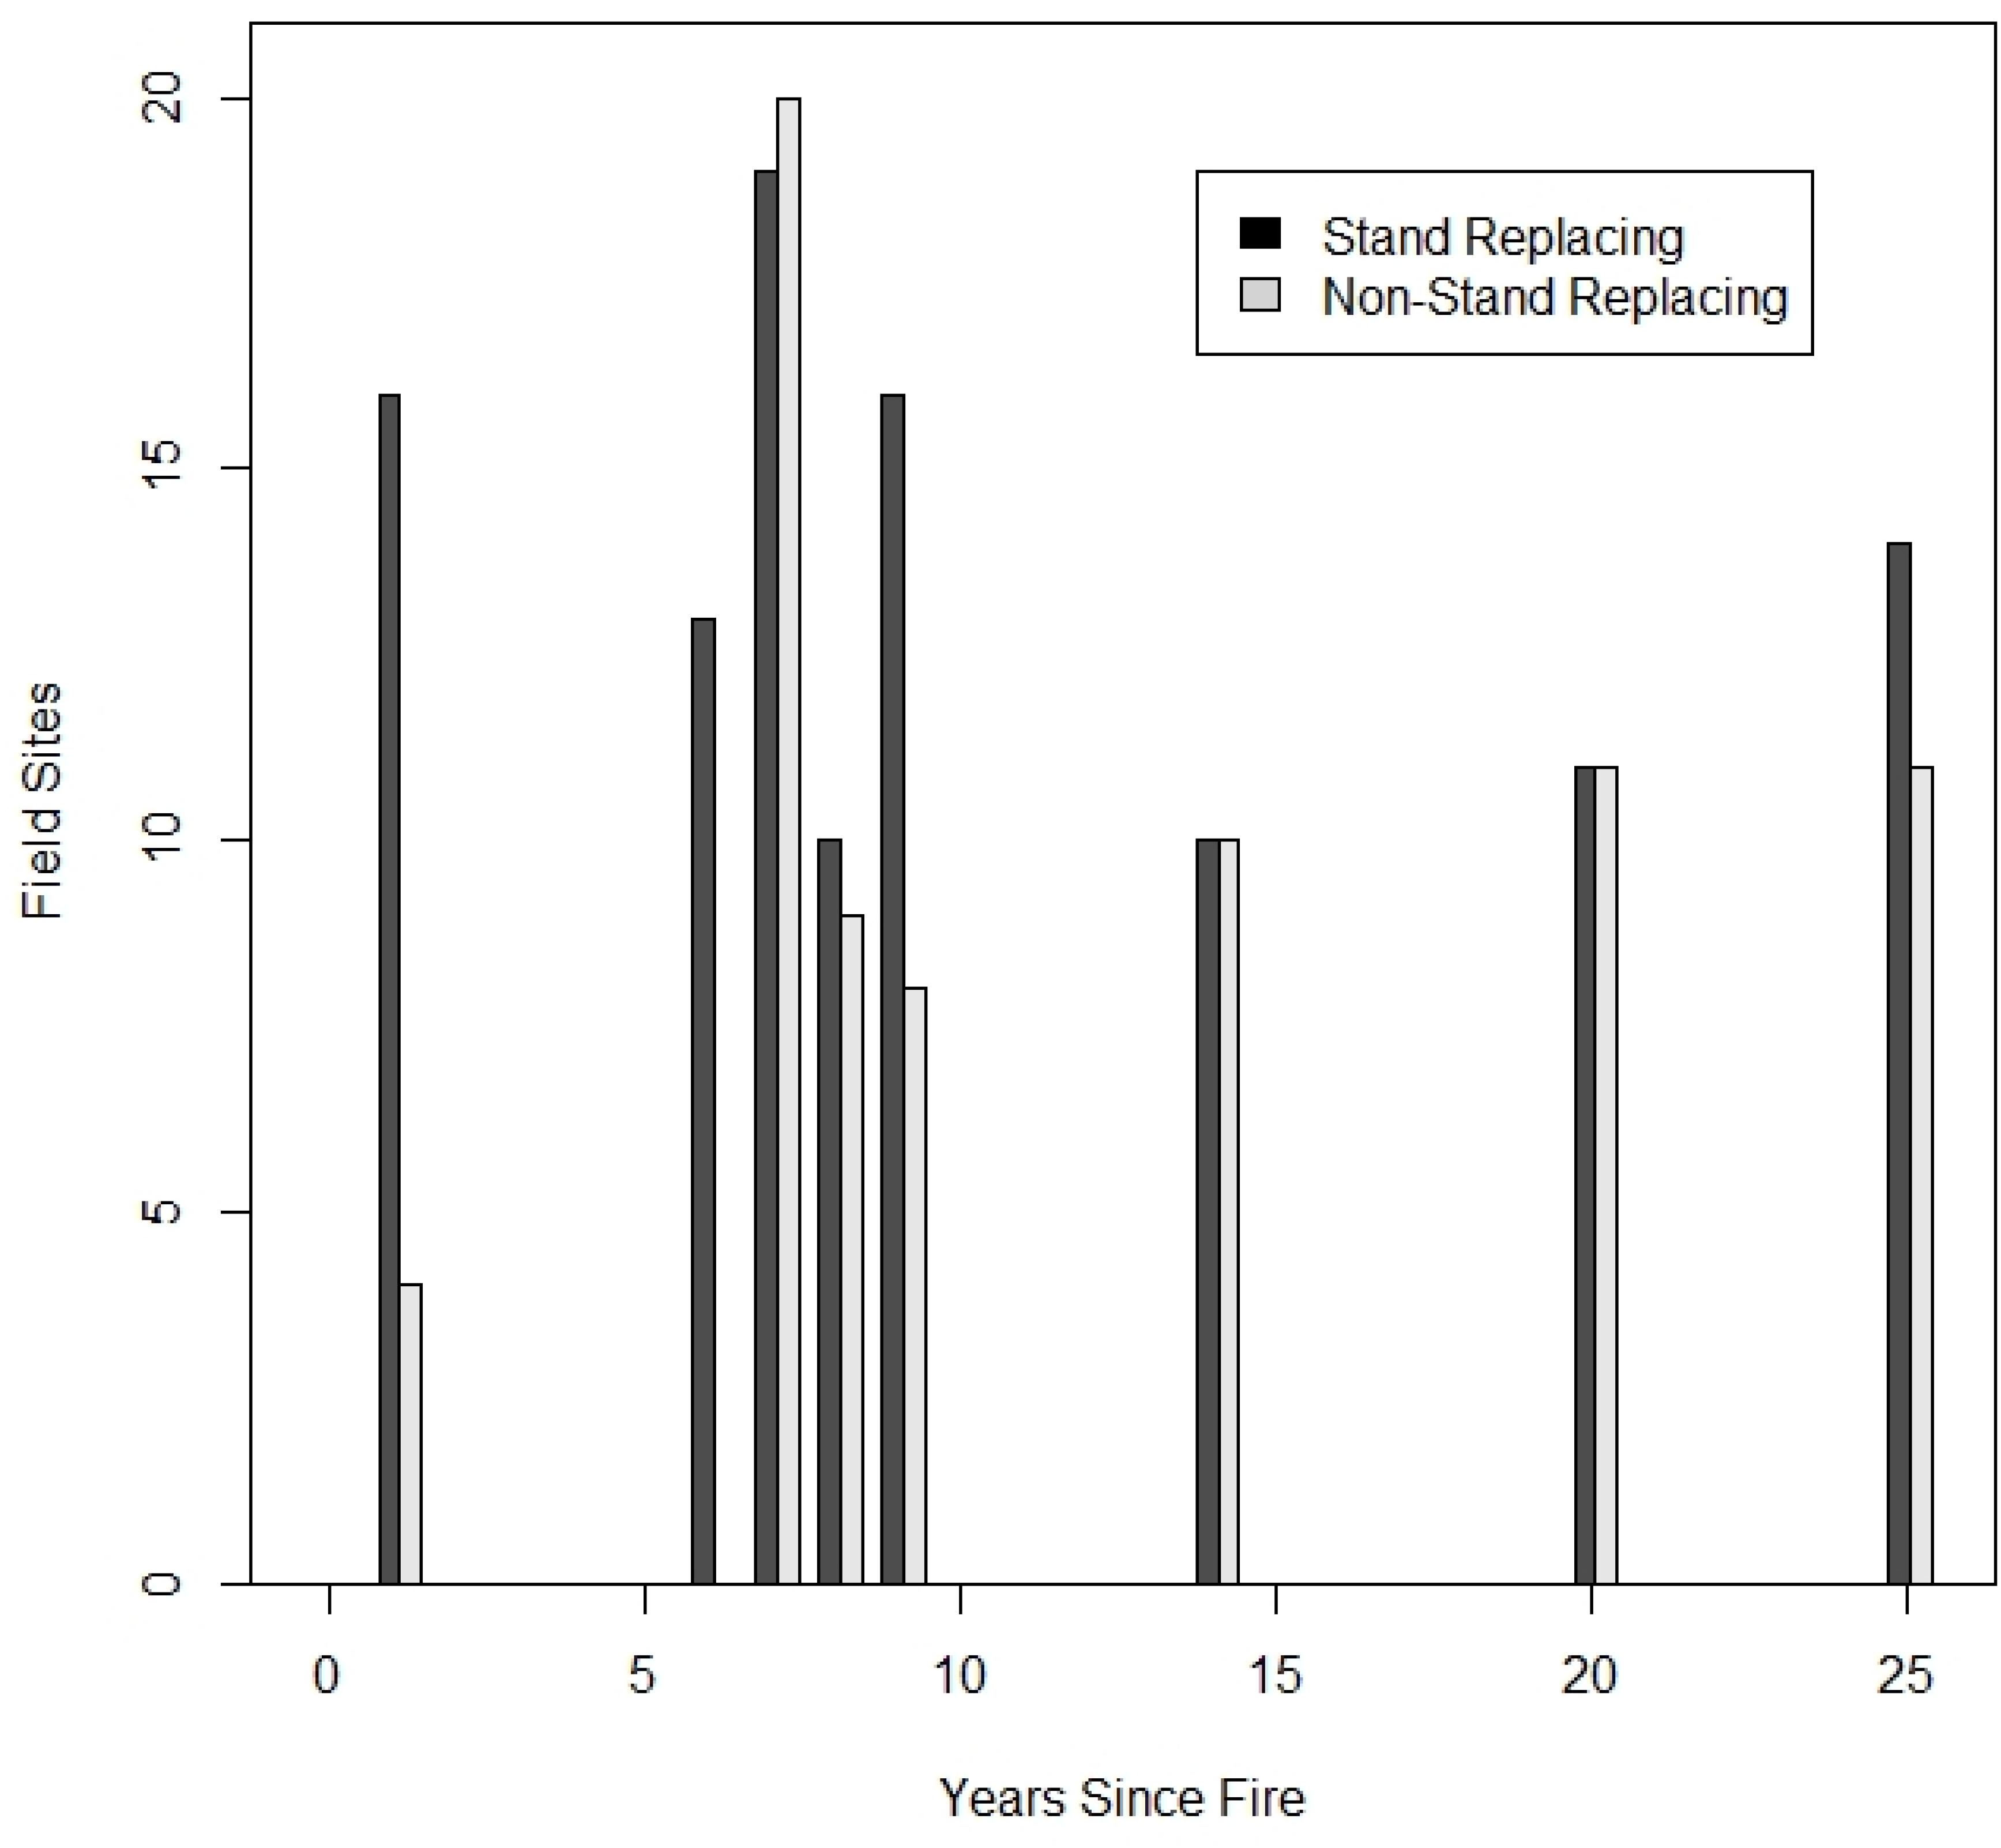
Figure 2. Number of field plots sampled versus years since fire, separated by sites burned in stand replacing fire versus those burned in non-stand replacing fire. All shown plots only burned once in the last >50 years.
To answer our second question regarding the impact of repeated fires on fuel dynamics, only sites burned in the same year as the later fire (for those sites burned twice) were used. Sites were visited 7 years post-fire. In this case, N = 94 with n = 46 for once-burned sites and n = 48 for twice-burned sites; only sites burned in stand replacing fire were considered. Years between fires, which ranged from 1 to 24 years, was previously analyzed and found to have no significant relationship in fuel loading following the second fire (Stevens-Rumann and Morgan, 2016). Twice burned sites are not shown in Figure 2 but burned in the second fire 7 years prior to sampling. We performed a two-sample t-test to understand the impact of repeated fires versus a single fire on fuel loading and stand structure.
Results
Surface Fuels
Total DWD, CWD, and FWD each had a strong positive relationship with years since fire (Figure 3 and Table 3). Further, the biomass of these three woody fuel classes trended toward a significant correlation with dNBR. The strongest climate metrics varied slightly by fuel category, but all three had summer precipitation balance as a significant positive predictor. Also significant across these three surface woody fuel variables was some metric of extreme climate conditions, with all three variables having a negative relationship to the maximum temperature on the hottest month. Thus, those sites that were extremely hot or exposed did not experience as much surface fuel accumulation as those on sites with more moderate climates. Additionally, some metric of the growing season length was significant; for DWD and CWD frost-free period was significant, while Julian date of the first freeze in Autumn significantly predicted FWD (Table 3).
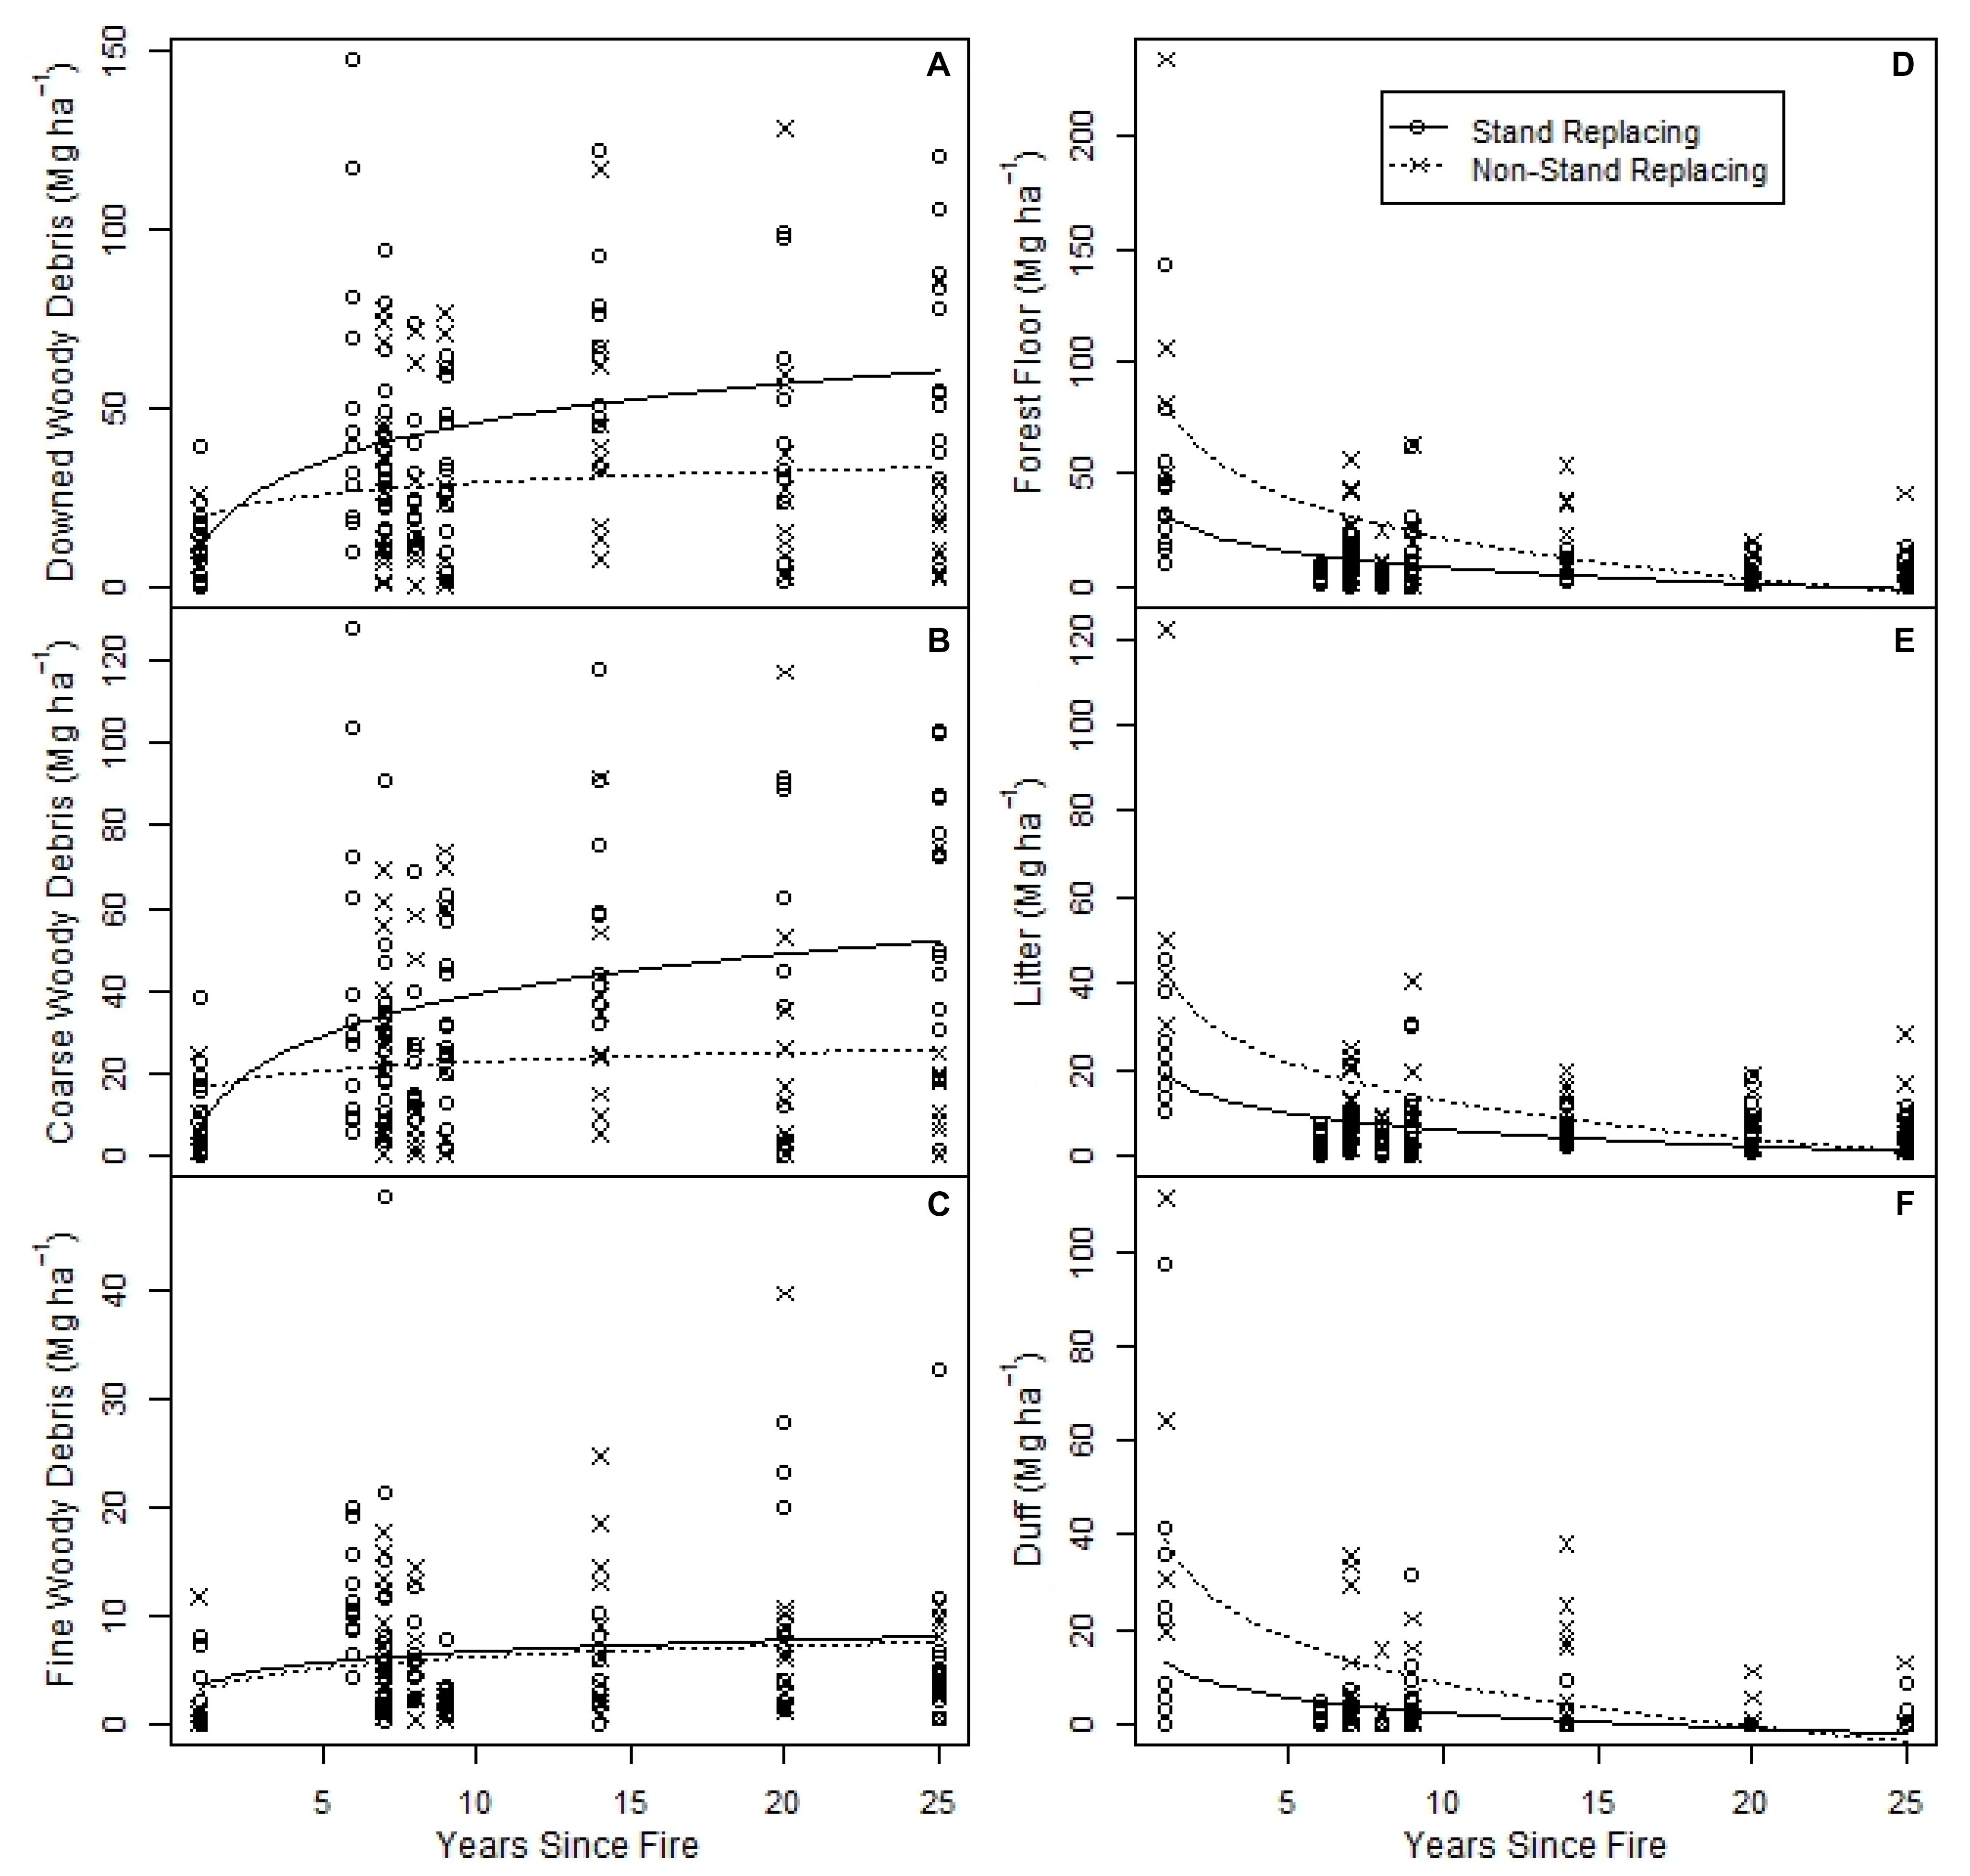
Figure 3. Effect of years since fire on surface and ground fuel biomass densities: (A) Total downed woody debris. (B) Coarse woody debris. (C) Total fine woody debris. (D) Forest floor. (E) Litter. (F) Duff. Open circles indicate individual stand replacing sites and “x”s indicate non-stand replacing fire and Lines indicate natural logarithm fits for each class. Years since fire was a significantly positive predictor of downed woody debris fuels (A–C) and a significantly negative predictor for forest floor fuels (D–F; Table 3).
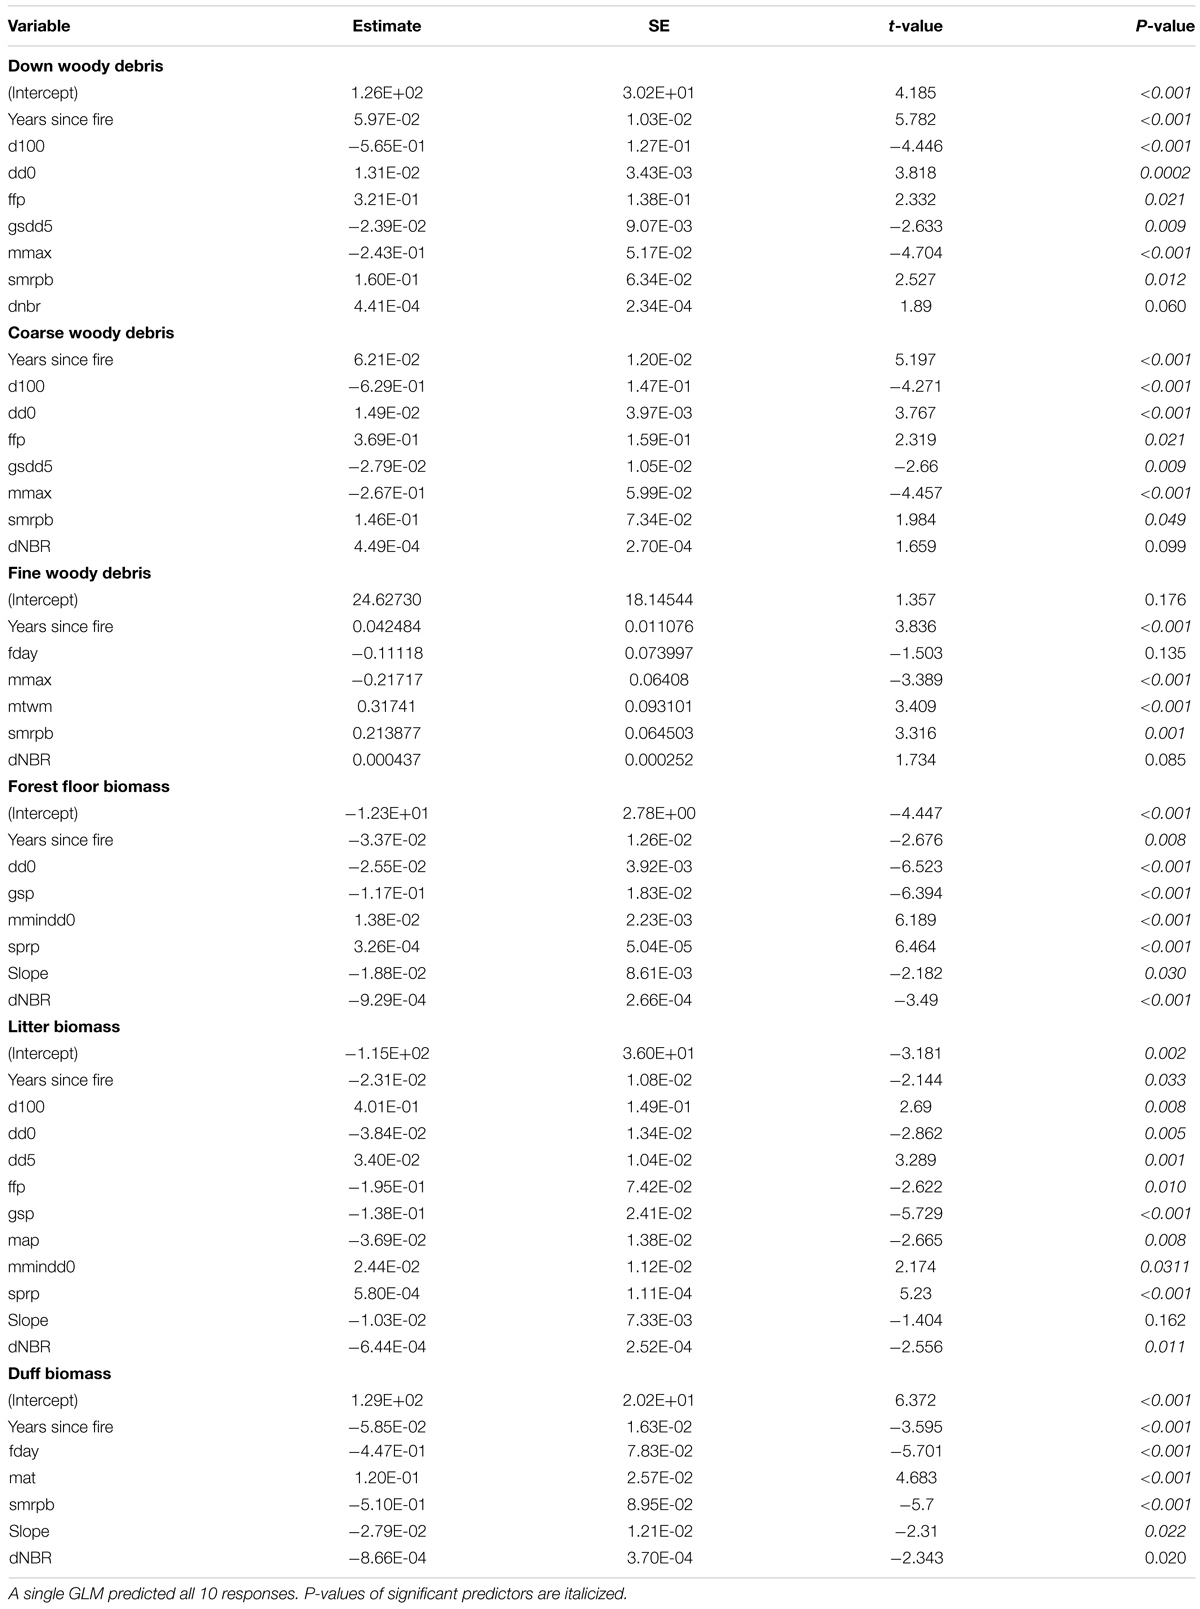
Table 3. Results of generalized linear models (GLM) of site climate variables, topography, years since fire, and severity (dNBR) to predict total downed woody debris, coarse woody debris, fine woody debris, forest floor biomass, litter biomass, and duff biomass.
Forest floor, litter, and duff biomass were negatively correlated with years since fire and dNBR (Figure 3 and Table 3). Metrics of moisture availability were generally negatively correlated with all three variables.
Canopy Fuels
Pre-fire tree density was not significantly different among the subset of sites for which we were able to quantify this variable (N = 138, F = 1.24, P = 0.56). Post-fire, total basal area was significantly related to years since fire, but large snag density was only marginally related, and live tree density was not related (Table 4 and Figure 4). Total basal area was highest in post-fire years 1–9, with much lower basal area in years 14–25 post-fire (Table 4 and Figure 4). Though total basal area was consistent among sites in early post-fire years, sites burned in stand replacing fire diverged from the rest, especially in later years, due to the live tree component. Total basal area was negatively associated with spring and summer precipitation and positively associated with number of degree days less than 0°C. Mean density of large-diameter snags was also higher in years 1–9, with a reduction in the number of large snags after 9 years post-fire. Large snag density was positively correlated with dNBR. Live tree density and live tree basal area had similar significant predictor variables and both were strongly influenced by dNBR but not years since fire. Years since fire was selected for the GLM model for total basal area because including it lowered the model AIC, even though its contribution to the model was not statistically significant. Live tree density also had a significant positive relationship with spring precipitation and with maximum temperatures in the warmest month (Table 4).
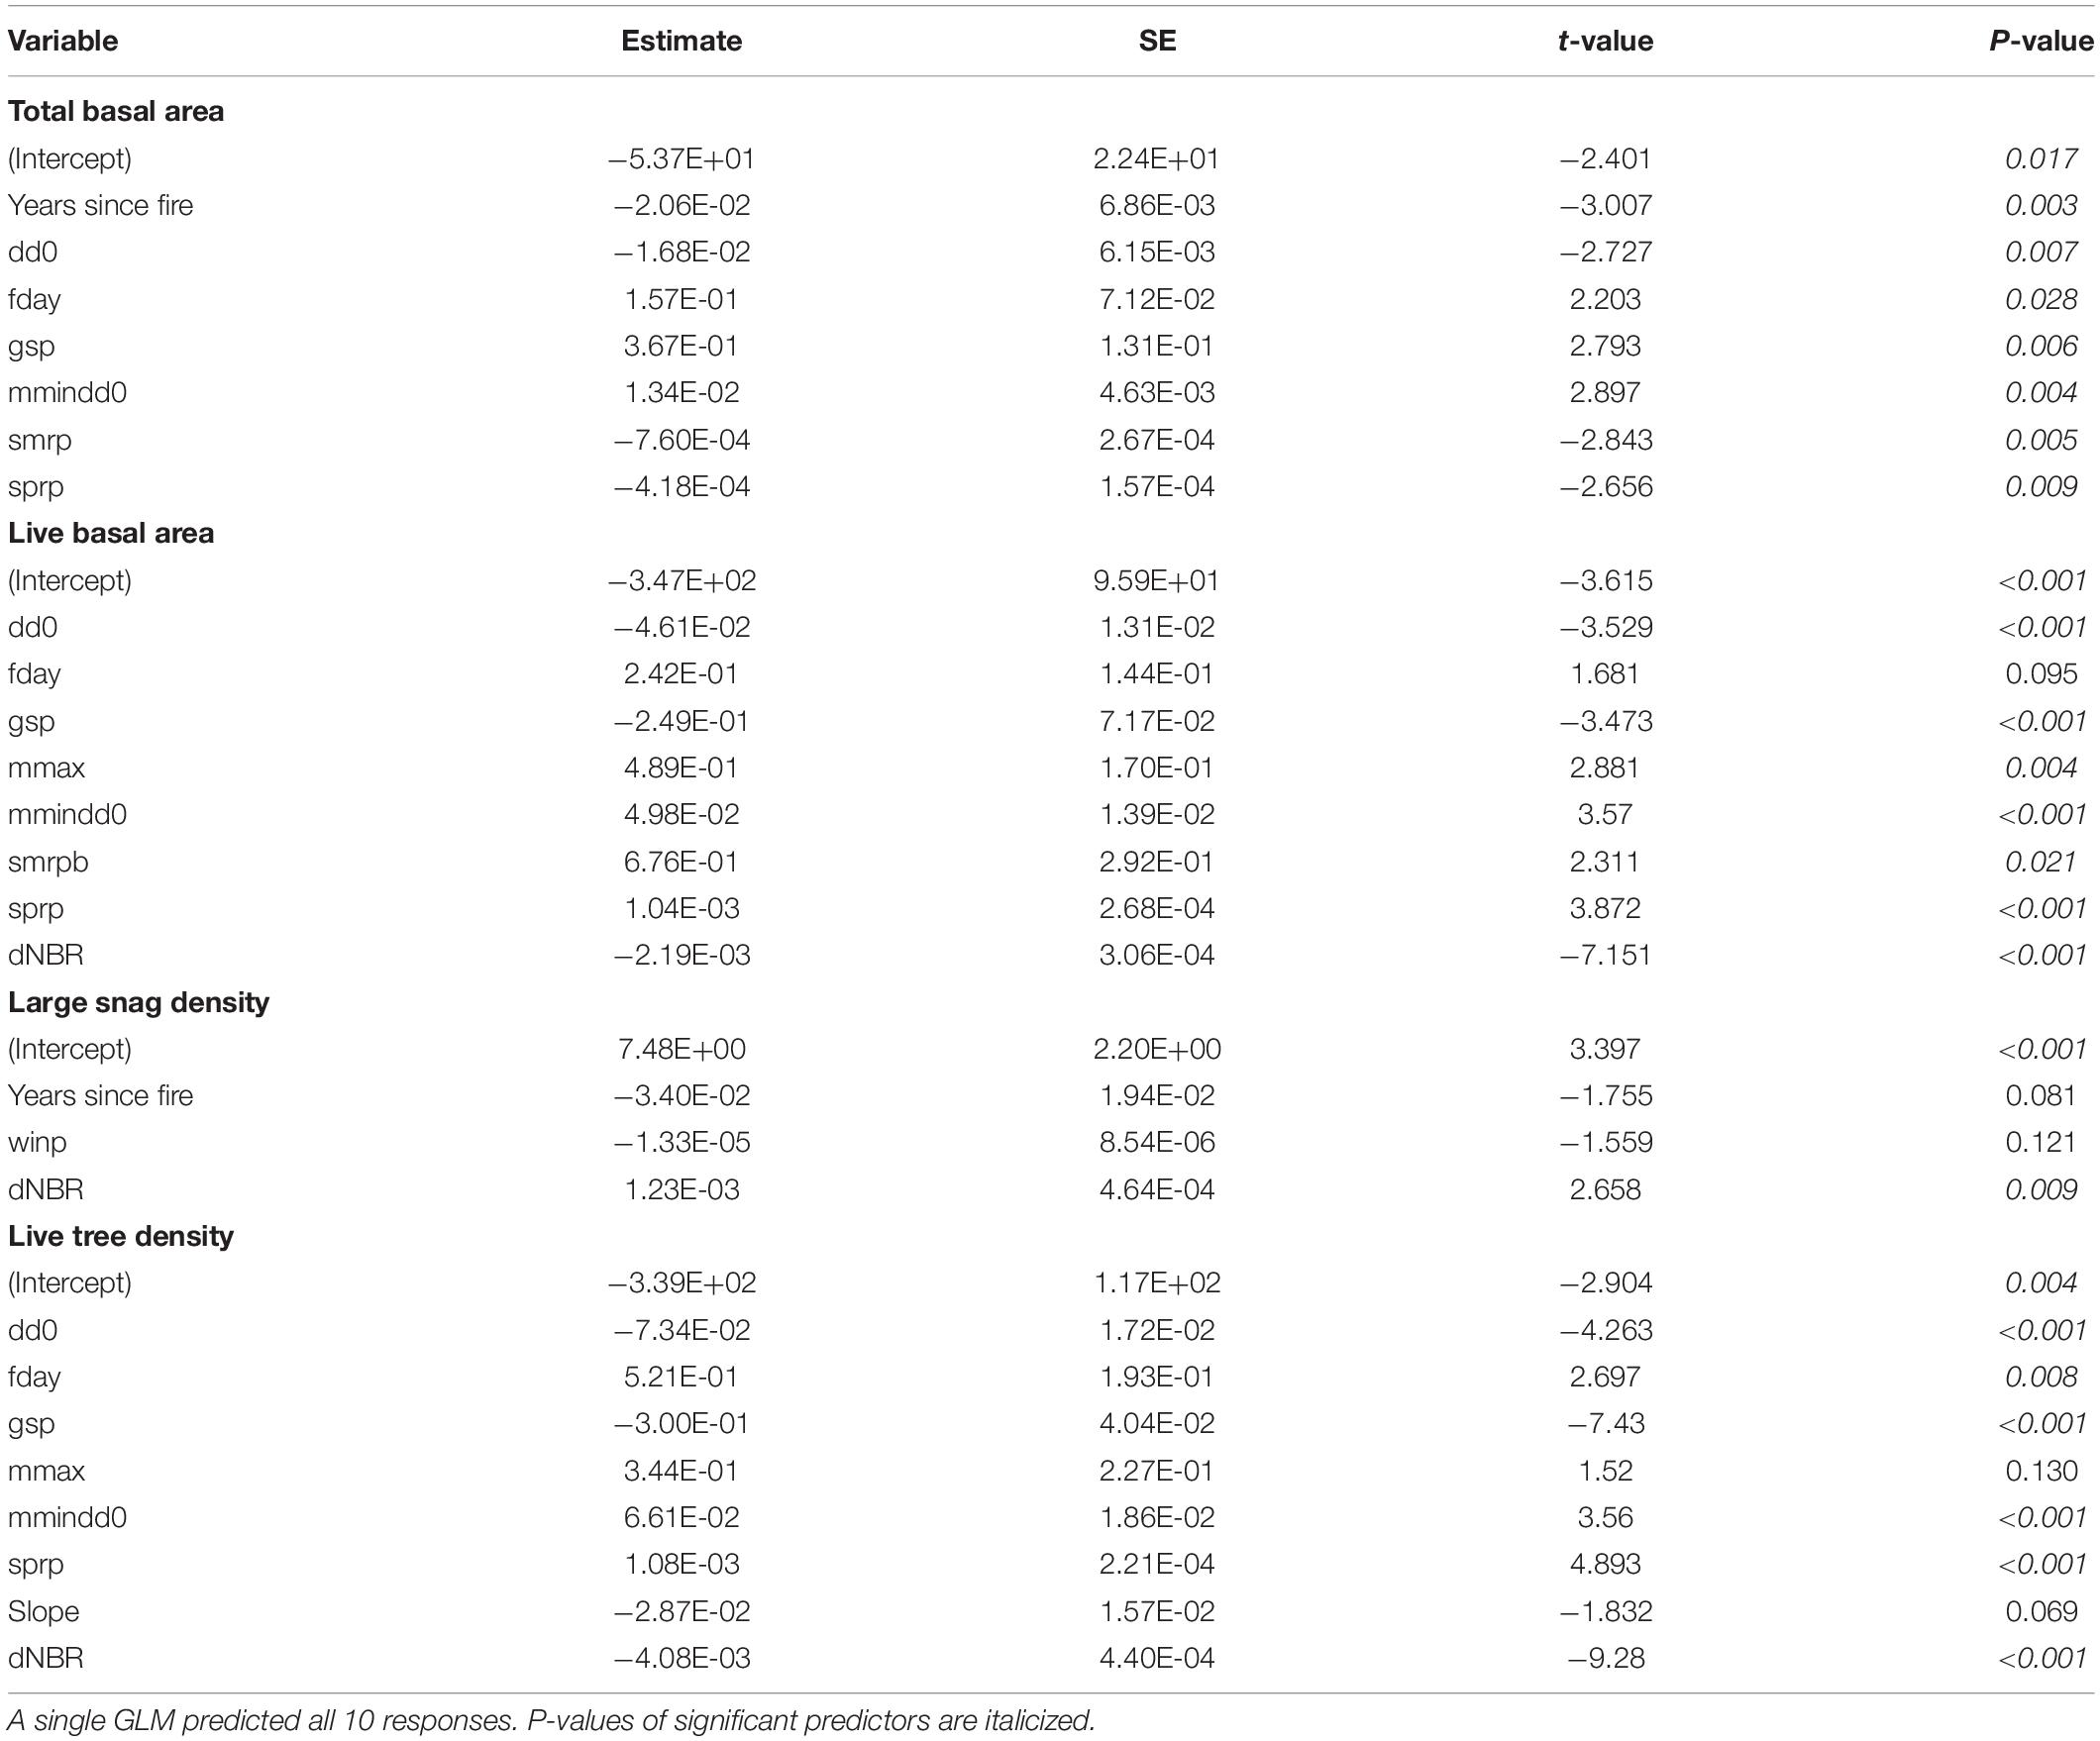
Table 4. Results of generalized linear models (GLM) of site climate variables, topography, years since fire, and severity (dNBR) to predict total basal area, live basal area, large snag density, and live tree density.
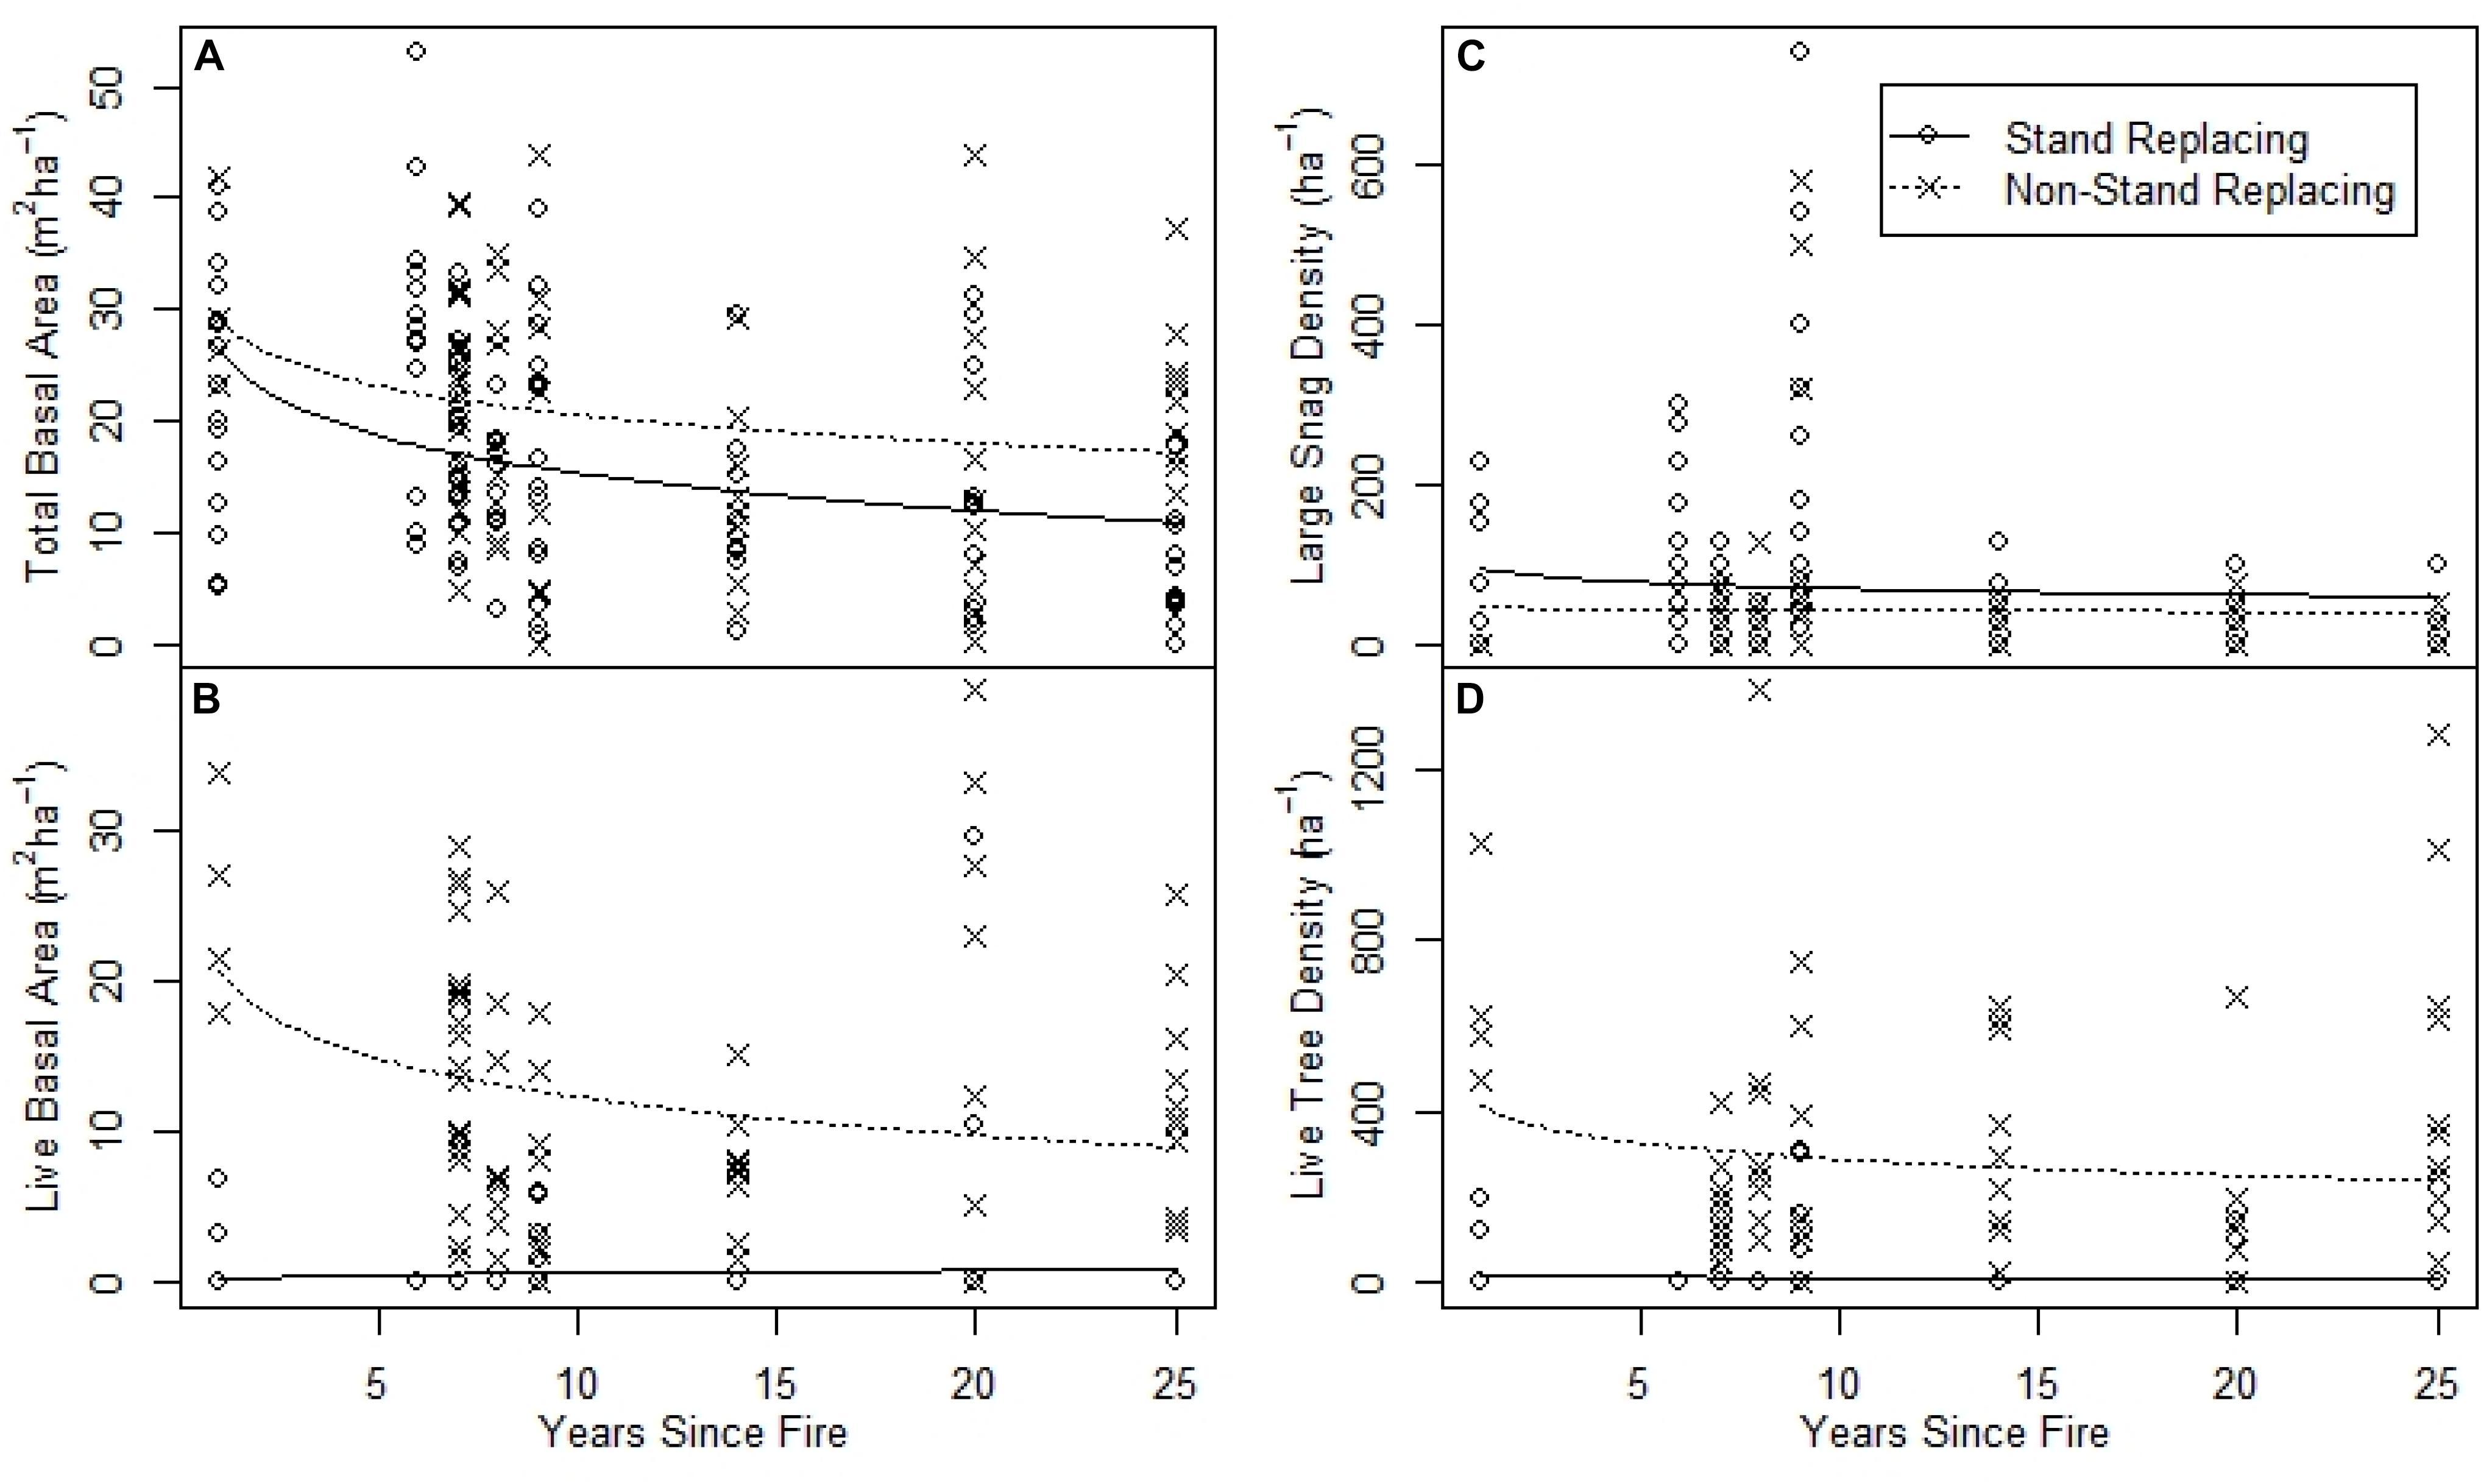
Figure 4. Effect of years since fire on trees. (A) Total basal area (live and dead standing trees). (B) Live tree basal area. (C) Large-diameter snag density. (D) Live tree density. Open circles indicate individual stand replacing sites and “x”s indicate non-stand replacing fire and lines indicate natural logarithm fits for each class. Years since fire is a significant predictor of total basal area but only marginally significant for large-diameter snag density and not significant for live tree density (Table 4).
Repeated Fires
FWD and CWD were significantly less on repeated high severity burns than on sites only burned once (F > 8.0, P < 0.01; Figure 5). FWD and CWD did not vary significantly between once- and twice-burned sites at other combinations of burn severity (e.g., high then low, or low then high). Total basal area and large snag density were also significantly lower on sites repeatedly burned with high severity than those sites burned once at high severity (F = 5.2, P = 0.02 and F = 6.1, P = 0.001, respectively).
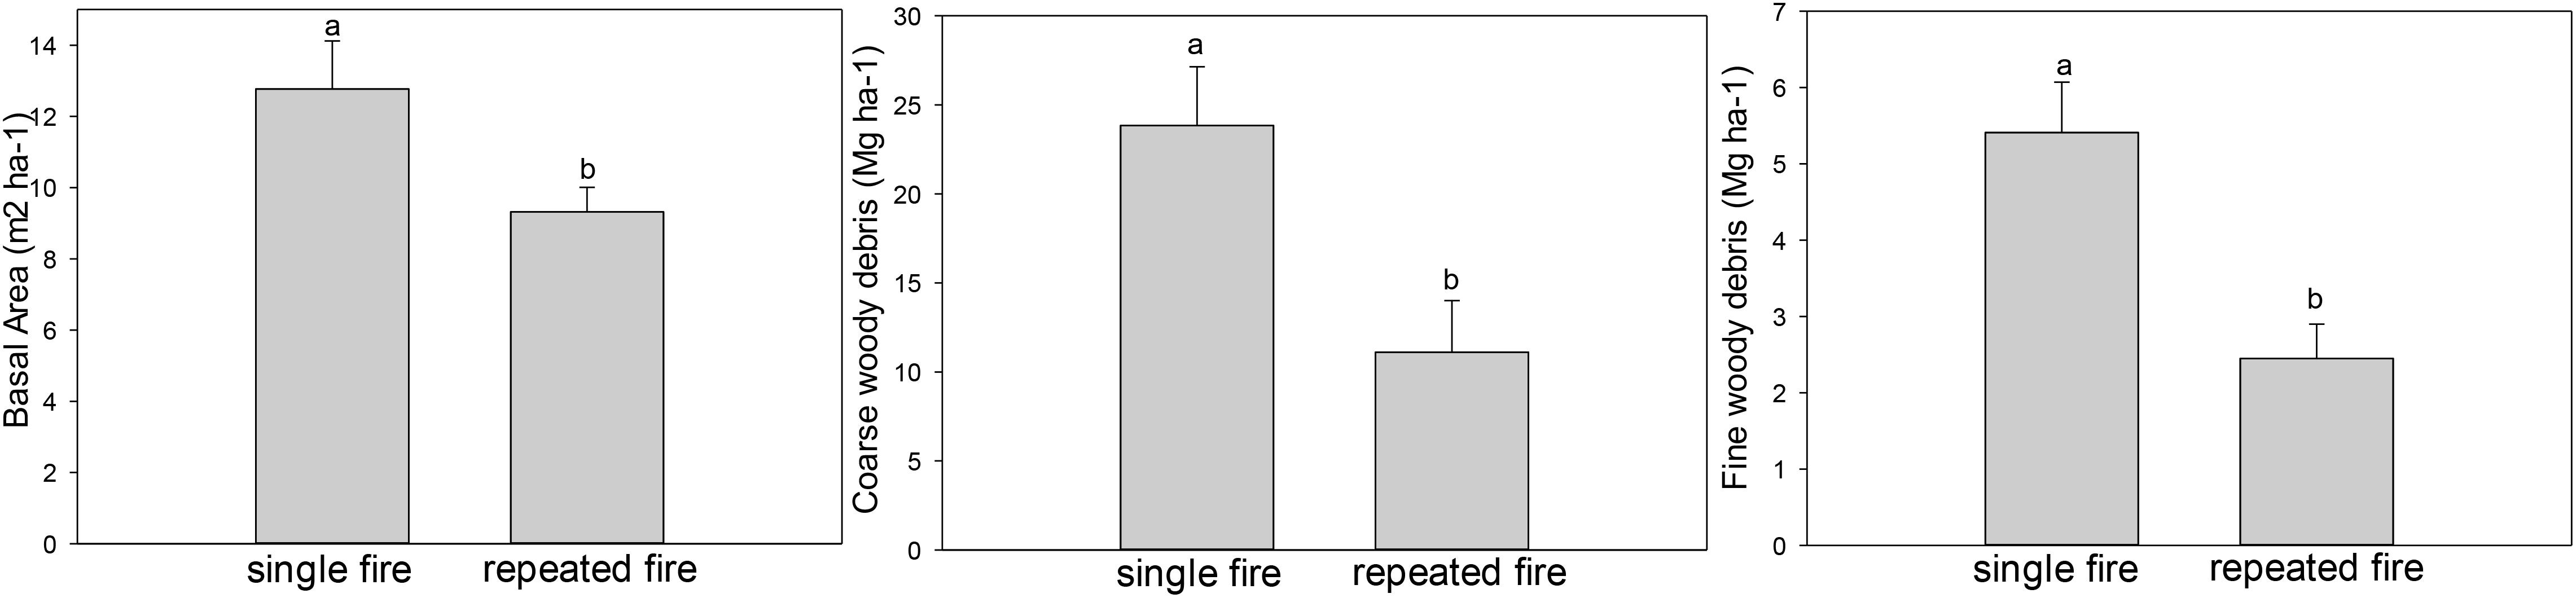
Figure 5. Effect of a single wildfire compared to repeated wildfires measured 7 years following the most recent fire on tree basal area (includes both live and dead trees), coarse woody debris, and fine woody debris. Letters indicate significant differences at the α = 0.05 level.
Discussion
Surface fuels increased and snag density declined substantially as years since fire increased, regardless of dominant tree species, and were strongly influenced by climate across the large spatial extent (250,000 ha) within central Idaho. Surface woody fuel accumulation was highest on our sites between 14 and 24 years after the previous fire, suggesting that these years were those with the highest resistance to control of forest fires (Peterson et al., 2015; Harvey et al., 2016; Nelson et al., 2016; Parks et al., 2016), especially following stand replacing fire. Sites with higher precipitation and more moderate climatic conditions had higher surface loadings post-fire than colder and/or drier sites, indicating a relationship between fuel accumulation and site productivity (Schoennagel et al., 2004). Forest floor, litter, and duff dynamics demonstrate that less biomass accumulation and retention occurred on moister sites perhaps due to more decomposition, while warmer sites had more total forest floor biomass than colder sites, perhaps due to higher production and/or less decomposition.
Higher live tree densities persisted on sites burned in a non-stand replacing fire, where little to no delayed tree mortality in the years following fires was observed. Seedlings began to contribute to the overstory basal area on some high severity burned sites at 20–24 years post-fire. Large-diameter snags that provide critical habitat began to decline in density around 7–9 years post-fire, but following this initial decline, the density of large-diameter snags remained relatively constant through 24 years post-fire. Snags were most abundant in areas burned with stand replacing fire (Roccaforte et al., 2012), and large snags that remain standing after this period may have some longevity on these landscapes, especially on lesser slopes (Everett et al., 1999) and on sites that experience less extreme temperatures; although, these variables were only strong predictors of total basal area, not large snags alone.
By comparison, sites burned twice at high severity had significantly lower surface fuels, tree density, and basal area than sites burned only once in 24 years. This demonstrates that resistance to control is low in these reburned areas, but these sites also lack similar post-fire habitat due to low snags and low surface fuel loading. All these reburned sites burned twice at high severity, thus there is a continued and persistent lack of accumulated fuel. These attributes, when combined with low understory plant cover and limited tree regeneration, may indicate long-term ecosystem shifts away from similar forest structures (Donato et al., 2016; Stevens-Rumann and Morgan, 2016). However, it is important to distinguish between sites burned repeatedly at high severity, versus areas burned repeatedly at low to moderate severity which has shown to maintain or enhance historical forest structure in many western U.S. forests (Larson et al., 2013; Stevens-Rumann and Morgan, 2016).
High Surface Woody Fuels in More Years Since Fire
The high CWD biomass 14–24 years post-fire combined with the FWD biomass demonstrate that this post-fire time period has the highest susceptibility to burning again in a stand replacing fire, as others have found (Thompson et al., 2011; Parks et al., 2016; Harvey et al., 2016). During this time, the abundant coarse fuels are especially susceptible to prolonged smoldering with high biomass consumption, heat release, and soil heating (Byram, 1959; Rothermel, 1972; Sikkink and Keane, 2012).
At year one post fire, higher mean CWD biomass was present on sites burned in non-stand replacing fire, likely due to lower fuel consumption of downed material during the wildfire compared to sites burned with high severity. However, by 14 years post fire, CWD loadings on plots burned with stand replacing fire significantly surpassed the CWD loadings in areas burned with non-stand replacing fire, and CWD loading remained high through 24 years post fire. The higher CWD loadings in stand replacing fire areas compared to sites burned with non-stand replacing has been observed elsewhere (Stevens-Rumann et al., 2012; Fornwalt et al., 2018) and can largely be attributed to high tree mortality rates and snag fall rates through time, especially following stand replacing fire.
Downed woody debris is important for numerous ecosystems services such as wildlife habitat and improved nutrient cycling in post-fire environments (Harmon et al., 1986; Graham et al., 1994), however, this benefit must be weighed against the risk presented by having heavy flammable fuels that increase the resistance to control and promote potential soil heating in subsequent wildfires (USDA et al., 1976; Sikkink and Keane, 2012). Our greatest annual mean CWD biomass of 70.4 Mg ha–1 in year 14 and FWD biomass of 10.1 Mg ha–1 in year 20 on stand replacing fire sites were well above those found by Roccaforte et al. (2012) in Arizona and in dry conifer forests, and more similar to the loadings observed by Dunn and Bailey (2015) and Peterson et al. (2015) in eastern Oregon and Washington. In sites burned with stand replacing fire, for 14–24 years post fire, CWD loadings exceeded the desired CWD threshold suggested by Brown et al. (2003). Thus, these areas warrant special consideration in the event of subsequent fires and careful monitoring in subsequent years if loadings remain high. This concern about high fuel loading is likely restricted to those areas with high tree mortality, as loadings were significantly lower in areas burned with non-stand replacing fires, as others have found (Stevens-Rumann et al., 2012; Fornwalt et al., 2018). In cases of mixed-conifer forests burning at lower severities, a single fire may not warrant concern for excessive fuel accumulation, resistance to control, and the need for post-fire harvesting (Ritchie et al., 2013; Campbell et al., 2016). In areas of high CWD loading, prescribed fire during times of moderate to high fuel moistures could help reduce the overabundance of fuel without the soil heating effects and other issues arising from reburning these areas in wildfire conditions (Graham et al., 1994).
Interestingly, the surface woody fuel accumulation through time contrasts with the decline in litter and duff biomass through time. Without the establishment of a dominant overstory, litter and duff appear to be continuing to decompose at faster rates than new litter deposition into the system, particularly where trees are absent (i.e., stand replacing fire), resulting in a negative relationship through time. Over longer time periods one would expect this relationship to switch with the establishment of woody shrubs or trees that provide litter input, but on these sites even 24 years post-fire, the lack of an overstory continues to result in low litter and duff biomass. A similar result was recently found in drier pinyon-juniper woodlands (Wozniak et al. unpublished).
High Snag Fall by Seven to Nine Years Post Fire
Total basal area, comprised of both living and dead standing trees, gradually declined over time as trees fell (Roccaforte et al., 2012; Dunn and Bailey, 2015), with both stand replacing and non-stand replacing fires resulting in a reduction of standing trees in the first decade post fire. This pattern was especially pronounced and continued throughout the 24-year chronology in areas burned with stand replacement. Large-diameter snags are of particular interest post disturbance and may remain standing much longer than smaller-diameter trees (Graham et al., 1994). We observed a decline in large snags around 7–9 years post fire, similar to the pattern observed by others for Douglas-fir and ponderosa pine (Everett et al., 1999; Russell et al., 2006; Ritchie et al., 2013). However, after 7 years post fire, large snag basal area did not continue to substantially decline, unlike total tree basal area. We observed 15–36% of fire-killed snags still standing 20 years post fire, unlike the ∼90% snag fall rate at about 20 years observed by Dunn and Bailey (2015). This may be a result of both the low quantity of large snags (<10–15% of the standing trees above 30-cm DBH) and site conditions that may allow for higher snag retention after the initial loss of both small and large-diameter, fire-weakened trees. Though large-diameter snags decreased with year since fire, even 25 years post fire many of the largest snags (mean of 17 trees ha–1 of trees 30 cm or greater) are still standing and may serve as habitat for cavity-nesting birds and raptors. Some snags may persist longer in low to moderate severity burned sites due to less wind induced fall patterns as a result of a less open stand, thus the high variability in large snag density 9 years post-fire. There is also likely variability by species with some species remaining standing for longer periods of times than others (Ritchie et al., 2013), though we did not examine species differences in part because long dead snags (10+ years) is difficult to definitively identify to species in mixed conifer forests. This highlights great regional variability in surface fuel and snag dynamics, as our results vary from those in other regions.
Site climate strongly controlled surface fuel accumulation and smaller snag fall rates. In many ways, this is a proxy for forest type and site productivity. On sites with higher productivity, such as those with higher precipitation and less extreme temperatures, we observed higher surface fuel accumulation and greater retention of large snags. This is often expected with short-term plant responses post fire (e.g., DeSiervo et al., 2015; Stevens et al., 2015), but has not been previously quantified for fuel complexes.
Reduced Fuels in Twice-Burned Sites
While fires in areas burned once both consume and create dead wood, subsequent wildfires only consume woody material and do not contribute to the creation of large woody fuel (Donato et al., 2016). In our study, this was so regardless of the time since previous fire or time between wildfires. Areas reburning with high severity 1–23 years after an initial high severity fire reduced CWD biomass by 47% and FWD biomass by 45% compared to a single high severity fire in the same year, similar to what others have found (Brown and Johnstone, 2012; Donato et al., 2016). However, this reduction in fuels was only observed on sites that experienced consecutive fires that burned with high severity (Stevens-Rumann and Morgan, 2016). Repeated high severity fires in quick succession (<24 years apart) were and continue to be a relatively small portion of the landscape. Of the 12 study fires presented here, repeated high severity fires comprised 3% of the area within these fires (Stevens-Rumann et al., 2016), as others have found across the western U.S. (Teske et al., 2012; Harvey et al., 2016; Morgan et al., 2017). Thus, across landscapes, only small areas will experience this significant drop in surface fuels and standing snags. Conversely, a subsequent low severity burn following a high severity burn likely results in sustained high fuel loads due to minimal consumption of large woody fuels and the contribution of small-diameter regenerating trees that following the second fire add to the dead biomass (Nelson et al., 2016; Stevens-Rumann and Morgan, 2016). Thus, sustained high fuel loads 14–24 years post-fire are likely regardless of a single or repeated wildfire event.
The basal area and densities of large snags were significantly lower on repeated burn sites 7 years post fire compared to once-burned sites at these same years since fire. This demonstrates a change in the longevity of standing fuel following repeated wildfires. This is likely due to both consumption in the second wildfire and the weakening of the already dead trees that will likely, if not consumed, fall more readily post fire (Donato et al., 2016). The reduction in both standing and down wood fuel in repeated burn sites corresponds to changes in ecosystem services observed in repeatedly disturbed ecosystems (Harmon et al., 1986).
Limitations
Post fire fuels were highly variable, as many prior studies have found. Multiple researchers have presented limitations of the Brown (1974) fuels methods and photoload methods (e.g., Keane et al., 2012; Vakili et al., 2016). In the future, improved sampling techniques that better account for the heterogeneity of fuels will improve our understanding of long-term surface fuel dynamics (Vakili et al., 2016). Given that our primary concern was understanding the comparative differences and not the absolute loadings, there is some evidence that the Brown (1974) methods may be adequate (Keane et al., 2012), but do not align well with other methods for absolute comparisons. The limitations of the Brown (1974) methods were an unavoidable issue in this case, as the first data collection occurred in 2008 prior to the publication of many of these methodological critiques and before improved methods were available. However, when isolating data only collected with similar methods, dominant drivers of biomass and stand structure characteristics did not change.
Further, we used multiple fires across a large geographic area comprised of multiple forest types for a broad range of fuel and stand conditions from which to assess the effect of years since fire. The clustering of our sample site distribution temporally, from 6 to 9 years post fire, made our dataset particularly sensitive to this transition period from predominantly standing snags to predominantly fallen logs. Nevertheless, we were limited temporally to large fire years and may have missed some of the fuel dynamics that occurred during those peak CWD and FWD loading years (9–20 years post-fire), during which time period we only had observations from 14 and 20 years post-fire. While our chronosequence of fires can help inform managers on fuel dynamics, repeated measures studies of the same plots is a more robust way to verify snag fall rates, surface fuel accumulation, and fuel decay (Ritchie et al., 2013; Nelson et al., 2016). Finally, it is not well known how burned fuels age and transition between fuel size classes, decay and, ultimately, contribute to litter and duff. This may also be highly variable between species and is not well understood. We can observe these patterns of change somewhat within this 25-year post-fire window, but much longer intervals are needed to truly understand burned wood decay.
Conclusion
Surface fuels and thus resistance to control peaks 14–20 years post-fire as snags fall and CWD and FWD are at their highest. Repeated wildfires alter woody fuel dynamics, reducing surface fuels by more than 40% and basal area by 27% compared to forests burned once. In these mixed-conifer forests of central Idaho, representative of much of the northern Rockies, fuel accumulation appears to only exceed recommended surface fuel loadings for several years, however, longer-term studies are required to fully understand fuel decay until the time at which fuels don’t present excessive risk. The ecological value of both the standing and downed dead material is critical to forested ecosystems for numerous ecosystem functions and should be considered prior to any post-fire fuels reduction action. As area burned continues to increase in the coming decades, it is important to consider when and where these previously burned stands will aid in suppression efforts, and when and where resistance to control and potential for severe reburn arises.
Data Availability Statement
The original contributions presented in the study are publicly available. This data can be found here: https://www.frames.gov/catalog/25470.
Author Contributions
CS-R led data collection for half of the presented data, analyzed part of the dataset, and wrote the manuscript. AH led data collection for the other half of the presented data, analyzed part of the data set, and assisted in the manuscript writing and editing. PM provided funding for original data collection efforts and assisted in the manuscript writing and editing. AA assisted in data collection and manuscript editing. ES assisted in data collection and manuscript editing.
Funding
Funding was provided by Joint Fire Science Program Project 16-1-01-20, 14-1-02-27, and the USDA Forest Service, Rocky Mountain Research Station under Joint Venture Agreements 12-JV-11221637-136, 14-JV-11261987-047, 14-JV-11221633-112, and 03-JV-111222065-279 with the University of Idaho.
Conflict of Interest
The authors declare that the research was conducted in the absence of any commercial or financial relationships that could be construed as a potential conflict of interest.
Acknowledgments
We thank field crews who collected these data with the authors in 2007, 2008, 2014, and 2015, including John Byrne, Ben Bright, Darcy Hammond, Jonathan Bontrager, Eli Berman, Carrie Minerich, Brittni Brown, Ryan McCarley, Carlos Silva, Jessica Romain, Travis Zalesky, Olivia Guthrie, and Sebastian Busby. We also thank Ben Bright but Azad Henareh Khalyani for the GIS and 30 m downscaled climate metrics. We also thank many people from the USDA Forest Service Boise National Forest, Nez Perce-Clearwater National Forest, Payette National Forest, and the Bitterroot National Forest. We also thank the reviewers for their edits and critiques.
Abbreviations
CWD, coarse woody debris; DBH, diameter at breast height; dNBR, differenced normalized burn ratio; DWD, downed woody debris; ESP, environmental site potential; FACTS, forest service activity tracking system; FWD, fine woody debris.
References
Alexander, M. E. (2000). Fire Behavior as a Factor in Forest and Rural Fire Suppression. For. Res., Rotorua in assoc. N.Z. Fire Service Communication and Natural Rural Fire Authority, Wellington, New Zealand. Forest Research Bulletin No. 197, For. Rural Fire Science Technical Service Report. No. 5. 28. Wellington: Fire Service Communication and Natural Rural Fire Authority.
Brown, C. D., and Johnstone, J. F. (2012). Once burned, twice shy: repeat fires reduce seed availability and alter substrate constraints on Picea mariana regeneration. For. Ecol. Manage. 266, 34–41. doi: 10.1016/j.foreco.2011.11.006
Brown, J. K. (1974). Handbook for Inventorying Downed Woody Material. USDA Forest Service General Technical Report GTR-INT-16. Ogden, UT: Intermountain Forest and Range Experiment Station, 24.
Brown, J. K., Oberheu, R. D., and Johnston, C. M. (1982). Handbook for Inventorying Surface Fuels and Biomass in the Interior West. USDA Forest Service General Technical Report GTR-INT-129. Ogden, UT: Intermountain Forest and Range Experiment Station, 48.
Brown, J. K., Reinhardt, E. D., and Kramer, K. A. (2003). Coarse Woody Debris: Managing Benefits And Fire Hazard in the Recovering Forest. USDA Forest Service General Technical Report RMRS-GTR-105. Fort Collins, CO: Rocky Mountain Research Station.
Bull, E. L., Parks, C. G., and Torgerson, T. R. (1997). Trees and Logs Important to Wildlife in the Interior Columbia River basin. USDA Forest Service General Technical Report PNW-GTR-391. Fort Collins, CO: Rocky Mountain Research Station.
Byram, G. M. (1959). Combustion of Forest Fuels. Forest Fire: Control and Use. New York, NY: McGraw-Hill, 61–89.
Campbell, J. L., Donato, D. C., and Fontaine, J. B. (2016). Effects of post-fire logging on fuel dynamics in a mixed-conifer forest. Oregon, USA: a 10-year assessment. Int. J. Wildland Fire 25, 646–656.
DeSiervo, M. H., Jules, E. S., and Safford, H. D. (2015). Disturbance response across a productivity gradient: postfire vegetation in serpentine and nonserpentine forests. Ecosphere 6, 1–19.
Donato, D. C., Fontaine, J. B., and Campbell, J. L. (2016). Burning the legacy? Influence of wildfire reburn on dead wood dynamics in a temperate conifer forest. Ecosphere 7:e01341.
Dunn, C. J., and Bailey, J. D. (2015). Temporal fuel dynamics following high severity fire in dry mixed conifer forests of the Eastern Cascades, Oregon, USA. Int. J. Wildland Fire 24, 470–483.
Eskelson, B. N. I., and Monleon, V. J. (2018). Post-fire surface fuel dynamics in California forests across three burn severity classes. Int. J. Wildland Fire 27, 114–124.
Everett, R., Lehmkuhl, J., Schellhaas, R., Ohlson, P., Keenum, D., Riesterer, H., et al. (1999). Snag dynamics in a chronosequence of 26 wildfires on the east slope of the Cascade Range in Washington State. USA. Int. J. Wildland Fire 9, 223–234.
Fornwalt, P. J., Stevens-Rumann, C. S., and Collins, B. J. (2018). Overstory structure and surface cover dynamics in the decade following the Hayman Fire. Colorado. Forests 9:152.
Gibson, C. E., Morgan, P., and Wilson, A. M. (2014). Atlas of Digital Polygon Fire Extents For Idaho and Western Montana, 2nd Edn. Fort Collins, CO: USDA Forest Service, Forest Service Research Data Archive, doi: 10.2737/RDS-2009-0006-2
Graham, R. T., Harvey, A. E., Jurgensen, M. F., Jain, T. B., Tonn, J. R., and Page-Dumroese, D. S. (1994). Managing coarse woody debris in forests of the Rocky Mountains. USDA Forest Service Research Paper INT-RP-477. Ogden, UT: Intermountain Research Station.
Harmon, M. E., Franklin, J. F., Swanson, F. J., Sollins, P., Gregory, S. V., Lattin, J. D., et al. (1986). Ecology of coarse woody debris in temperate ecosystems. Adv. Ecol. Res. 15, 133–302.
Harvey, B. J., Donato, D. C., and Turner, M. G. (2016). Burn me twice, shame on who? Interactions between successive forest fires across a temperate mountain region. Ecology 9, 2272–2282. doi: 10.1002/ecy.1439
Hessburg, P. F., Spies, T. A., Perry, D. A., Skinner, C. N., Taylor, A. H., Brown, P. M., et al. (2016). Tamm review: management of mixed-severity fire regime forests in Oregon, Washington, and Northern California. For. Ecol. Manag. 366, 221–250. doi: 10.1016/j.foreco.2016.01.034
Hudak, A. T., Morgan, P., Newingham, B., and Strand, E. (2018). How Vegetation Recovery and Fuel Conditions In Past Fires Influences Fuels And Future Fire Management In Five Western U.S. Ecosystems. Joint Fire Science Program Report Summary Project: 14-1-02–27. Washington, DC: USDA.
Hudak, A. T., Rickert, I., Morgan, P., Strand, E. K., Lewis, S. A., Robichaud, P. R., et al. (2011). Review of fuel treatment effectiveness in forests and rangelands and a case study from the 2007 megafires in central Idaho. USDA Forest Service General Technical Report RMRS-GTR-252. Fort Collins, CO: Rocky Mountain Research Station.
Hutchinson, M. F. (2000). ANUSPLIN user’s guide, version 4.1. Canberra: Australian National University Centre for Resource and Environmental Studies.
Hutto, R. L. (2006). Toward meaningful snag management guidelines for postfire salvage logging in North American conifer forests. Conserv. Biol. 20, 984–993. doi: 10.1111/j.1523-1739.2006.00494.x
Jolly, W. M., Cochrane, M. A., Freeborn, P. H., Holden, Z. A., Brown, T. A., Williamson, G. J., et al. (2015). Climate-induced variations in global wildfire danger from 1979 to 2013. Nat. Commun. 6:7537. doi: 10.1038/ncomms8537
Jurgensen, M. F., Harvey, A. E., Graham, R. T., Page-Dumroese, D. S., Tonn, J. R., Larsen, M. J., et al. (1997). Impacts of timber harvesting on soil organic matter, nitrogen, productivity, and health of Inland Northwest forests. Forest Sci. 43, 234–251.
Keane, R. E. (2012). Describing wildland surface fuel loading for fire management: a review of approaches, methods and systems. Int. J. Wildland Fire 22, 51–62.
Keane, R. E., and Dickinson, L. J. (2007). Development and Evaluation of the photoload technique. RMRS-RP-61. Fort Collins, CO: Rocky Mountain Research Station.
Keane, R. E., Gray, K., and Bacciu, V. (2012). Spatial Variability of Wildland Fuel Characteristics In Northern Rocky Mountain Ecosystems. USDA Forest Service Research Paper RMRS-RP-98. Fort Collins, CO: Rocky Mountain Research Station.
Larson, A. J., Belote, R. T., Cansler, C. A., Parks, S. A., and Dietz, M. S. (2013). Latent resilience in ponderosa pine forest: effects of resumed frequent fire. Ecol. Appl. 23, 1243–1249. doi: 10.1890/13-0066.1
Morgan, P., Hudak, A. T., Wells, A., Parks, S. A., Baggett, L. S., Bright, B. C., et al. (2017). Multidecadal trends in area burned with high severity in the Selway-Bitterroot Wilderness Area, 1880-2012. Int. J. Wildland Fire 26, 930–943.
Moritz, M. A., Parisien, M. A., Batllori, E., Krawchuk, M. A., Van Dorn, J., Ganz, D. J., et al. (2012). Climate change and disruptions to global fire activity. Ecosphere 3:art49. doi: 10.1890/ES11-00345.1
Nelson, K. N., Turner, M. G., Romme, W. H., and Tinker, D. B. (2016). Landscape variation in tree regeneration and snag fall drive fuel loads in 24-year old post-fire lodgepole pine forests. Ecol. Appl. 26, 2422–2436. doi: 10.1002/eap.1412
Parks, S. A., Miller, C., Holsinger, L. M., Baggett, S., and Bird, B. J. (2016). Wildland fire limits subsequent fire occurrence. Int. J. Wildl. Fire 25, 182–190. doi: 10.1071/WF15107
Passovoy, M. D., and Fulé, P. Z. (2006). Snag and woody debris dynamics following severe wildfires in northern Arizona ponderosa pine forests. Forest Ecol. Manag. 223, 237–246.
Peterson, D. W., Dodson, E. K., and Harrod, R. J. (2015). Post-fire logging reduces surface woody fuels up to four decades following wildfire. For. Ecol. Manag. 338, 84–91. doi: 10.1016/j.foreco.2014.11.016
R Development Core Team (2011). R: A Language And Environment For Statistical Computing. Vienna: R Foundation for Statistical Computing, 639.
Rehfeldt, G. E., Crookston, N. L., Warwell, M. V., and Evans, J. S. (2006). Empirical analyses of plant-climate relationships for the western United States. Int. J. Plant Sci. 167, 1123–1150. doi: 10.1086/507711
Rehfeldt, G. L. (2006). A Spline Model of Climate for the Western United States. Gen. Tech. Rep. RMRS-GTR-165. Fort Collins, CO: U.S. Department of Agriculture, Forest Service, Rocky Mountain Research Station, 21.
Ritchie, M. W., Knapp, E. E., and Skinner, C. N. (2013). Snag longevity and surface fuel accumulation following post-fire logging in a ponderosa pine dominated forest. Forest Ecol. Manag. 287, 113–122.
Roberts, D. W., and Cooper, S. V. (1989). “Concepts and techniques of vegetation mapping,” in Proceedings of the Land Classifications Based On Vegetation: Applications for Resource Management. General Technical Report INT-257, U.S, eds D. P. Ferguson, P. Morgan, and F. D. Johnson (Ogden, UT: Department of Agricultural, Forest Service).
Roccaforte, J. P., Fulé, P. Z., Chancellor, W. W., and Laughlin, D. C. (2012). Woody debris and tree regeneration dynamics following severe wildfires in Arizona ponderosa pine forests. Can. J. Forest Res. 42, 593–604.
Rothermel, R. C. (1972). A Mathematical Model for Predicting Fire Spread in Wildland Fuels. USDA Forest Service, General Technical Report GTR-INT-115. Ogden, UT: Intermountain Research Station.
Russell, R. E., Saab, V. A., Dudley, J. G., and Rotella, J. J. (2006). Snag longevity in relation to wildfire and postfire salvage logging. Forest Ecol. Manag. 232, 179–187.
Sah, J. P., Ross, M. S., Snyder, J. R., Koptur, S., and Cooley, H. C. (2006). Fuel loads, fire regimes, and post-fire fuel dynamics in Florida Keys pine forests. Int. J. Wildland Fire 15, 463–478.
Schoennagel, T., Veblen, T. T., and Romme, W. H. (2004). Interaction of fire fuels and climate across the Rocky Mountain forests. BioScience 54, 661–676.
Sikkink, P. G., and Keane, R. E. (2012). Predicting fire severity using surface fuels and moisture. USDA Forest Service Research Paper, RMRS-RP-96. Fort Collins, CO: Rocky Mountain Research Station.
Stephens, S. L., Agee, J. K., Fulé, P. Z., North, M. P., Romme, W. H., Swetnam, T. W., et al. (2013). Managing forests and fire in changing climates. Science 342, 41–42. doi: 10.1126/science.1240294
Stephens, S. L., Finney, M. A., and Schantz, H. (2004). Bulk density and fuel loads of ponderosa pine and white fir forest floors: Impacts of leaf morphology. Northwest Sci. 78, 93–100.
Stevens, J. T., Safford, H. D., Harrison, S., and Latimer, A. M. (2015). Forest disturbance accelerates thermophilization of understory plant communities. J. Ecol. 103, 1253–1263.
Stevens-Rumann, C. S., and Morgan, P. (2016). Repeated wildfires alter forest recovery of mixed-conifer ecosystems. Ecol. Appl. 26, 1842–1853. doi: 10.1890/15-1521.1
Stevens-Rumann, C. S., Morgan, P., and Hoffman, C. M. (2015). Bark beetles and wildfires: How does forest recovery change with repeated disturbances in mixed conifer forests? Ecosphere 6:100. doi: 10.1890/ES14-00443.1
Stevens-Rumann, C. S., Prichard, S. J., Strand, E. K., and Morgan, P. (2016). Prior wildfires influence burn severity of subsequent large fires. Can. J. Forest Res. 46, 1375–1385.
Stevens-Rumann, C. S., Sieg, C. H., and Hunter, M. E. (2012). Ten years after wildfires: how does varying tree mortality impact fire hazard and forest sustainability? Forest Ecol. Manag. 267, 199–208.
Strand, E. K., Satterberg, K. L., Hudak, A. T., Byrne, J. C., Khalyani, A. H., and Smith, A. M. S. (2019). Does burn severity affect plant community diversity and composition in mixed conifer forests of the United States Intermountain West one decade post-fire? Fire Ecol. 15:25. doi: 10.1186/s42408-019-0038-8
Teske, C. C., Seielstad, C. A., and Queen, L. P. (2012). Characterizing fire-on-fire interactions in three large wilderness areas. Fire Ecol. 8, 82–106. doi: 10.4996/fireecology.0802082
Thompson, M. P., Calkin, D. E., Finney, M. A., Ager, A. A., and Gilbertson-Day, J. W. (2011). Integrated national-scale assessment of wildfire risk to human and ecological values. Stochastic Environ. Res. Risk Assess. 25, 761–780.
U.S. Department of Agriculture, Forest Service (2016). Forest Service Activity Tracking System (FACTs) harvest database. Washington, DC: USDA.
USDA, Forest Service, and Region Five (1976). Resistance to Control Calculation Matrix. USDA Forest Service Manual, Region Five Supplement 5151. Washington, DC: USDA, 14–12.
Vakili, E., Hoffman, C. M., Keane, R. E., Tinkham, W. T., and Dickinson, Y. (2016). Spatial variability of surface fuels in treated and untreated ponderosa pine forests of the southern Rocky Mountains. Int. J. Wildland Fire 25, 1156–1168.
Keywords: fuel loading, wildfires, snags, woody debris, resistance to control, repeated wildfires
Citation: Stevens-Rumann CS, Hudak AT, Morgan P, Arnold A and Strand EK (2020) Fuel Dynamics Following Wildfire in US Northern Rockies Forests. Front. For. Glob. Change 3:51. doi: 10.3389/ffgc.2020.00051
Received: 16 January 2020; Accepted: 09 April 2020;
Published: 19 May 2020.
Edited by:
Michele Salis, Italian National Research Council, ItalyReviewed by:
Melisa Blackhall, Universidad Nacional del Comahue, ArgentinaJohn Bailey, Oregon State University, United States
Copyright © 2020 Stevens-Rumann, Hudak, Morgan, Arnold and Strand. This is an open-access article distributed under the terms of the Creative Commons Attribution License (CC BY). The use, distribution or reproduction in other forums is permitted, provided the original author(s) and the copyright owner(s) are credited and that the original publication in this journal is cited, in accordance with accepted academic practice. No use, distribution or reproduction is permitted which does not comply with these terms.
*Correspondence: Camille S. Stevens-Rumann, Qy5TdGV2ZW5zLVJ1bWFubkBjb2xvc3RhdGUuZWR1