Soil Phosphorus Dynamics Across a Holocene Chronosequence of Aeolian Sand Dunes in a Hypermaritime Environment on Calvert Island, BC, Canada
 Lee-Ann Nelson
 Barbara J. Cade-Menun
 Ian J. Walker
 Paul Sanborn1,2
- 1Ecosystem Science and Management Program, University of Northern British Columbia, Prince George, BC, Canada
- 2Hakai Institute, Victoria, BC, Canada
- 3Swift Current Research and Development Centre, Agriculture and Agri-Food Canada, Swift Current, SK, Canada
- 4School of Geographical Sciences and Urban Planning, School of Earth and Space Exploration, Arizona State University, Tempe, AZ, United States
Phosphorus (P) is an essential nutrient for plant growth, but soil P concentrations decline with increasing soil age. Phosphorus often limits tree growth within the hypermaritime Coastal Western Hemlock zone in British Columbia, Canada, particularly where parent material with low P concentrations have experienced rapid weathering. To sustainably manage forests in this region, more information is needed about changes in soil P concentrations and dynamics that occur with time. This study characterized the forms and abundance of soil and foliar P compounds using a soil chronosequence developed on aeolian sand dunes on Calvert Island and compared results to chronosequences in other locations. Eight time points were examined, from a modern foredune to a relict, stabilized dune (~10,760 years old). Soil horizons were analyzed for bulk density, pH, and concentrations of total carbon (C), nitrogen (N) and total P (TP), iron (Fe), and aluminum (Al), total organic P (Po), and Mehlich-extractable P and cations. For each site, P forms in L, H and organically-enriched mineral (M) horizons were characterized with solution 31P nuclear magnetic resonance spectroscopy (P-NMR), as were foliar samples from tree species spanning all age classes except the youngest dune. This chronosequence followed the Walker and Syers (1976) model, with an exponential decline in TP mass and a humped-shape curve in Po mass with increasing age. The L horizon had lower TP concentrations than foliage samples, but similar P forms. The H horizons had a greater proportion of DNA, phosphonates and nucleotides than the L horizon and increased proportions of myo- and scyllo-inositol hexakisphosphate (IHP) with increasing age. The mineral horizons had much lower TP concentrations than other horizons and increased proportions of IHP and DNA with increasing age, which were correlated to increased exchangeable and amorphous Al concentrations. In all sample types, the proportion of orthophosphate declined with increasing age. These results enhance knowledge of P cycling within hypermaritime soils, particularly the P decline that will occur with age. This will aid in the sustainable management of the low-productivity forests typical of these ecosystems.
Introduction
Phosphorus (P) is one of the most limiting nutrients to plant growth worldwide along with nitrogen (N), and both are integral to the productive functioning of ecosystems. Total P (TP) in soil is divided into various chemical forms (compounds), which vary in their bioavailability and cycling in soil. Molecules of organic P (Po) contain carbon (C), while inorganic P (Pi) compounds do not (Condron et al., 2005; Pierzynski et al., 2005). Inorganic Pi compounds include phosphate (H2 or in the pH range of most soils), and phosphates linked together as pyrophosphate (with two phosphate groups) and polyphosphate (more than two phosphates). Phosphate is the only P form that plants and microbes can directly take from the soil solution, and is the predominant Pi compound in most soils (Schachtman et al., 1998; Stevenson and Cole, 1999). The main Po compounds can be divided into: orthophosphate monoesters (herein referred to as monoesters), which have one C group per phosphate and include sugar phosphates (e.g., glucose 6-phosphate), mononucleotides such as adenosine monophosphate, and storage compounds such as myo-inositol hexakisphosphate (myo-IHP, phytate); orthophosphate diesters with two C groups per phosphate (herein referred to as diesters), which include phospholipids and DNA; and phosphonates with a direct C-P bond.
The soil P cycle is controlled by five main pools of P: (1) dissolved within the soil solution; (2) adsorbed to mineral surfaces; (3) precipitated from the soil solution; (4) contained within living microbial biomass; and (5) bound within non-living organic matter (Stevenson and Cole, 1999). Both Pi and Po compounds are found in all of these pools (Condron et al., 2005; Pierzynski et al., 2005), and P cycling in these pools is controlled by geochemical and biological processes. The soil solution P pool is most critical; P in this pool is directly available for sorption, precipitation, biological uptake and incorporation into organic matter. However, the soil solution P concentration is usually low and soil P moves mainly by diffusion, unlike other nutrients, thereby limiting availability (Schachtman et al., 1998; Stevenson and Cole, 1999). In forests, P cycling is influenced by parent material, plant species and successional stage, and the biological P cycle is generally more dominant in the surface horizons, while geochemical P cycling is more dominant in the mineral horizons (Wood et al., 1984; Cade-Menun et al., 2000a; Lang et al., 2017).
The Walker and Syers (1976) model is the most widely-used model of P change with soil age, and states that Ca-phosphates (Ca-P) will be the first forms of P to be exploited because they are generally the most abundant P forms in the parent material and are more easily solubilized than other P forms. As soil ages and phosphate becomes scarcer, Po and P sorbed to Fe and Al (hydr)oxides will dominate, including Pi and Po forms that are tightly sorbed and thus resistant to desorption (occluded P). Therefore, to effectively manage forest soils it is necessary to characterize and measure the concentrations of Po due to the increasing dominance of Po with age, especially within P-limited systems (Walker and Syers, 1976).
Declining P with increasing age has been widely documented on soil chronosequences spanning many climates, parent materials, disturbance histories and age ranges (Table 1). Depending on the soil forming factors, chronosequences may become depleted of P by different mechanisms. Sandy chronosequences, such as Cooloola (Queensland, Australia), Jurien Bay (Western Australia) and Cox Bay [British Columbia (BC), Canada], generally have parent material with inherently low P concentrations and become P depleted faster than soils with greater initial P concentrations (Vitousek et al., 2010; Turner et al., 2012; Chen et al., 2015; Turner and Laliberté, 2015). The loss of Pi and dissolved Po via weathering and subsequent leaching is referred to as depletion-driven P limitation, which generally takes millions of years but can occur faster with parent materials with low P concentrations (Vitousek et al., 2010). Other forms of P limitation may be caused by barriers to root exploration or transactional P limitations caused by the slow release of P from minerals compared to other nutrients (Vitousek et al., 2010).
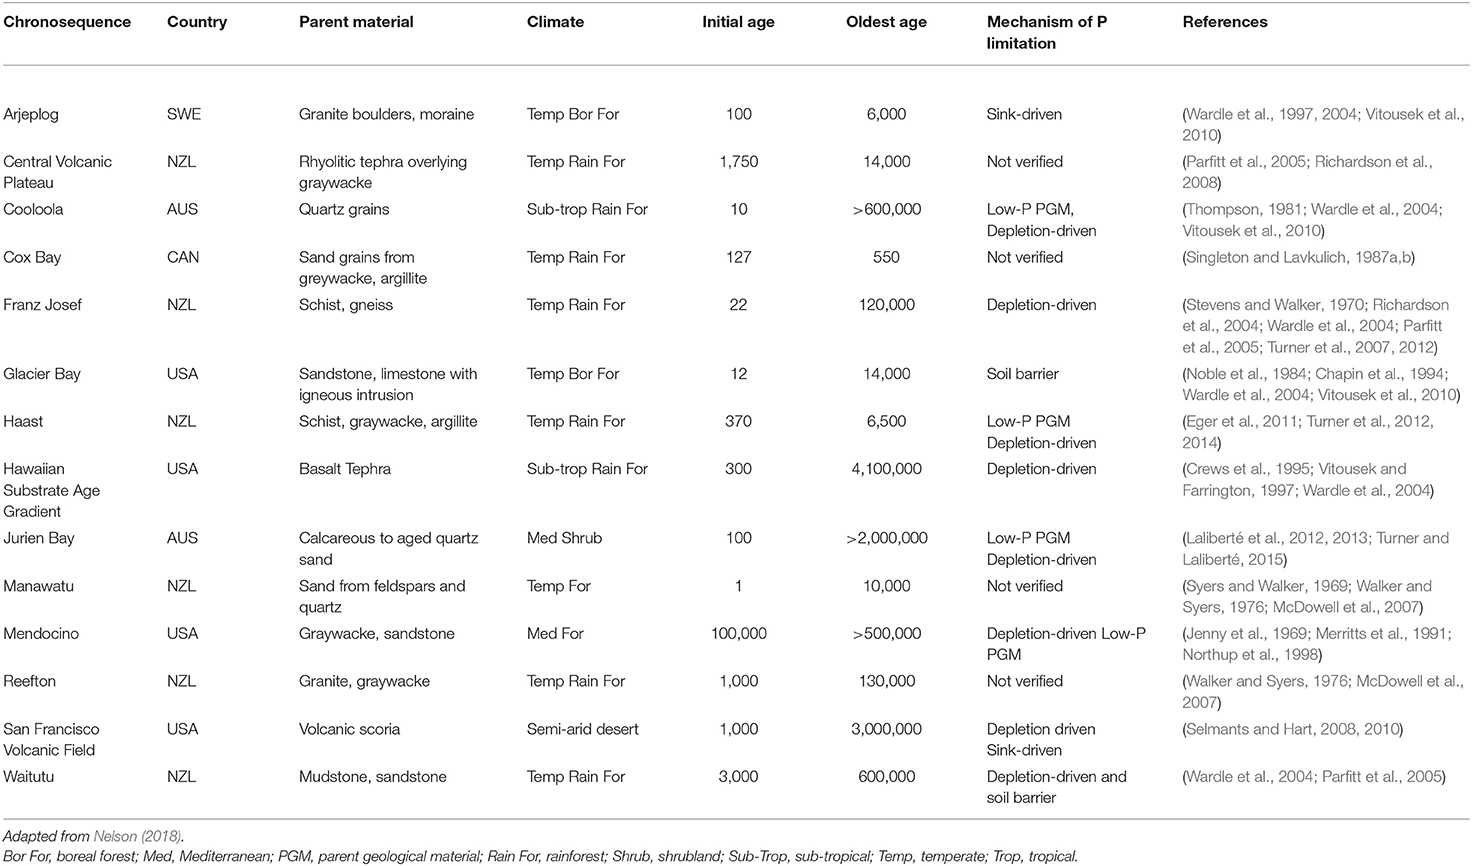
Table 1. Chronosequences exhibiting phosphorus (P) decline with age, country, parent material, climate, initial and oldest ages, and the mechanism of P limitation.
McDowell et al. (2007) proposed that within mineral horizons, pyrophosphate, diesters (including DNA) and myo- and scyllo-IHP would increase on aging chronosequences as shown on Manawatu (North Island, New Zealand) and Reefton (South Island, New Zealand) chronosequences (Table 1; Parfitt, 1979; Shang et al., 1990; Celi and Barberis, 2005). Mineral soil on the Franz Josef chronosequence (South Island, New Zealand) was dominated by DNA that was correlated to OM, and myo- and scyllo-IHP and other monoesters on the oldest site that were sorbed to amorphous metals (Turner et al., 2007). Unlike the mineral horizon, microbial P compounds dominated the organic horizon on the Haast chronosequence (South Island, New Zealand), illustrating the importance of microbial cycling of P in the forest floor (Turner et al., 2014). The origins of many soil Po forms are not fully understood; although plants are known to be the source of some compounds such as myo-IHP, other compounds such as scyllo-IHP have not been identified in plant matter (Makarov et al., 2002; Condron et al., 2005; Turner et al., 2007). Studies characterizing changes in foliar P forms with soil age are limited, although they could be used to link the forms of P found within the L horizon to the surrounding plant species.
In addition to examining P pools with time, nutrient ratios such as NP are frequently utilized in chronosequence studies to indicate potential N or P limitation with age (Parfitt et al., 2005), with Güsewell (2004) suggesting that an NP <10 was N-limited and >20 was P-limited.
Across a range of chronosequences worldwide, these ratios generally indicate a shift from N limitation on young sites, to co-limitation by N and P on intermediate-aged sites and P limitation on older sites (Vitousek et al., 1995; Richardson et al., 2004; Parfitt et al., 2005; Izquierdo et al., 2013; Hayes et al., 2014). Over time, foliar and organic soil horizon NP ratios may increase to a plateau, like a reverse logistic regression (Richardson et al., 2004; Hayes et al., 2014) or be hump-shaped (Vitousek et al., 1995; Wardle et al., 2004).
Within the Coastal Western Hemlock (CWH) climatic zone of coastal BC, Canada, very wet, hypermaritime variant (CWHvh2; Figure 1), low-productivity forests dominated by western redcedar (Thuja plicata; Cw), western hemlock (Tsuga heterophylla; Hw) and shore pine (Pinus contorta var. contorta) account for 12% of the North Coast Timber Supply Area or 235,000 ha (Banner et al., 2005). Due to the increasing value of Cw and yellow cedar (Chamaecyparis nootkatensis), these lower-productivity areas became of interest economically for timber and fiber production, so a greater ecological understanding was needed and the factors affecting productivity were assessed (Banner et al., 2005). The CWH zone in British Columbia, Canada, is characterized by a temperate, hypermaritime climate. Podzolization is the key process controlling soil development in this region, and soils are characterized by the accumulation of amorphous organic matter and/or the enrichment of Fe and Al in the B horizon (Sanborn et al., 2011). Many soils in the CWH zone have humic-cemented horizons (Bhc) known as ortstein horizons and Fe-enriched cemented horizons (Bfc) known as placic horizons (Banner et al., 1993; Green and Klinka, 1994), designated as Bhm and Bsm horizons, respectively, in the World Reference Base (FAO, 2006). These cemented horizons can impede water flow and can initiate paludification (Ugolini and Mann, 1979; Sanborn et al., 2011; Turner et al., 2012). In the CWH zone, P is often limiting due to rapid weathering of parent material with low P concentrations (Prescott et al., 1993; Kranabetter et al., 2013). Thus, soil P cycling in the CWH zone is typically strongly influenced by soil age.
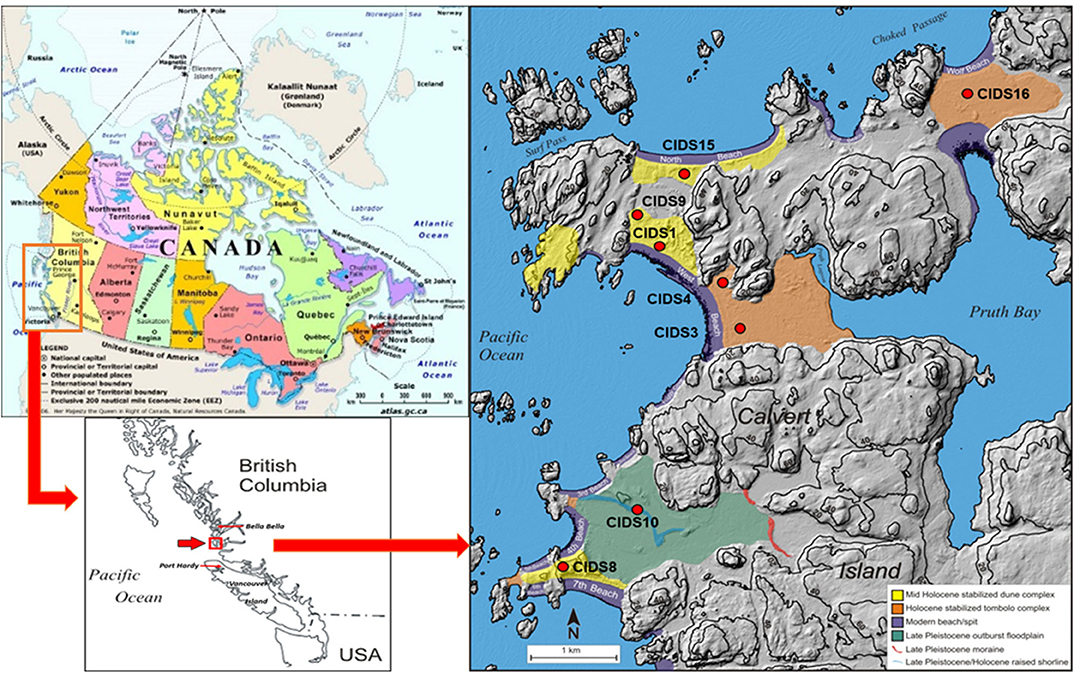
Figure 1. Map of study site on Calvert Island, BC, Canada. The map of Canada is from The Atlas of Canada, available at https://www.nrcan.gc.ca/maps-tools-and-publications/maps/atlas-canada/10784. The maps showing more details of the sampling locations are from Nelson (2018), and were adapted from Neudorf et al. (2015). Sampling sites are denoted with red circles.
Within the CWH zone in BC, Canada, researchers have studied a short chronosequence in Cox Bay [> ~550 y BP (years before present)] and longer chronosequences such as the Naikoon chronosequence on Graham Island (~550–6,500 y BP; Sanborn and Massicotte, 2010) and the Brooks Peninsula chronosequence on Vancouver Island (> 8,000 y BP; Maxwell, 1997). At Cox Bay, there was a sharp decline in Ca-P within 371 years, associated with rapid podzolization (Singleton and Lavkulich, 1987a,b). The Naikoon and Brooks Peninsula chronosequences also exhibited rapid podzolization and the development of placic horizons, but no in-depth chemical analysis of P within these soils was conducted. The Calvert Island chronosequence is the longest and best-constrained chronosequence on the coast of BC (Neudorf et al., 2015) and is the first study in the region to explore the relationship between soil age and the P cycle, specifically Po.
The overall objective of this study was to examine how the broad pools of P and specific chemical P forms have changed over time in a soil chronosequence developed during the Holocene on aeolian sand dunes within the CWH zone on Calvert Island, on the central coast of BC, Canada. The first research hypothesis was that total C, N and P would change with site age, with TP and Po following the trends of the Walker and Syers (1976) model.The second objective was to examine how soil Po compounds varied with increasing age in select organic and mineral soil horizons as well as in dominant foliage species. It was hypothesized that with increasing age, Po would become an increasingly dominant pool of soil P, with an increase in DNA in the organic horizons and increases in myo- and scyllo-IHP in the mineral horizons. The third hypothesis was that Po forms within foliage would be comparable to those within the L horizon, particularly as Po became a more dominant pool of P with increasing age. The fourth and final hypothesis was that the NP ratios would increase in foliage and organic horizons with increasing age.
Materials and Methods
Study Area and Sample Collection
The soil chronosequence is located on Calvert Island on the central coast of BC, Canada (Figure 1). Soil samples were dated by optically stimulated luminescence (OSL) dating (Neudorf et al., 2015). Eight aeolian sand dunes that developed during a sea-level regression during the Holocene (Eamer et al., 2017) were examined in this study, with ages ranging from a modern foredune to approximately 10,760 y BP (Table 2; Figures S1, S2). Two sampling locations were examined on each sand dune to capture the variability of soil formation within the dune and age. Sampling locations were chosen to best reflect a stable landscape position (Table 2). Additional information regarding the study area can be found in Nelson (2018). Soil sampling was completed in accordance with the Canadian System of Soil Classification (Soil Classification Working Group (SCWG), 1998), which was used to classify the soil horizons. Two soil samples were taken from each genetic horizon. One sample, for basic chemical analysis, was air-dried and sieved to 2 mm. For cemented horizons, a mortar and pestle was used to disaggregate the sample. A coffee grinder was used to grind organic samples. The second sample from each site was oven-dried at 60°C until constant weight to prevent hydrolysis and degradation of P compounds, and was subsequently used for P-NMR analysis.
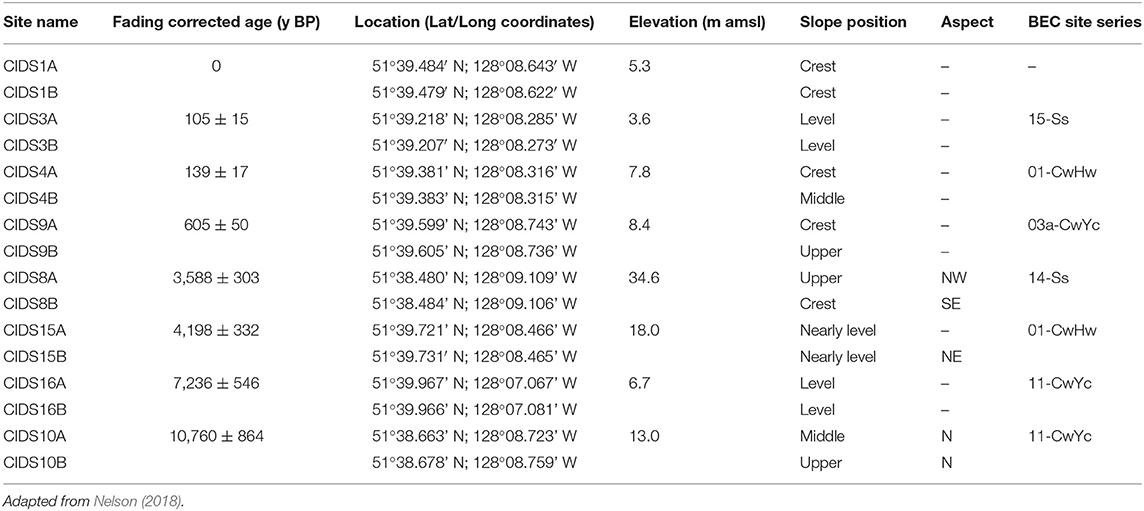
Table 2. The sampling sites used in this study, including chronosequence site name, the most accurate age (in years before present, y BP), location, approximate elevation in meters above mean sea level (m amsl), slope position, aspect, and biogeoclimatic (BEC) site series classification (Green and Klinka, 1994).
To examine trends in foliage with increasing age, foliage was collected from two tree species found on the majority of sites, except for the modern dune. These species were Hw, present on 13 of the 16 sites, and Cw, present on 6 of the 16 sites. Samples were also collected from a dominant shrub in most plots, salal (Gaultheria shallon). Foliage samples were pruned by hand when possible, or intact green foliage was retrieved off the ground if hand sampling were not feasible, within a 5 m radius plot around each soil pit. All foliage samples were oven-dried at 60°C until constant weight and then ground using a coffee grinder. Foliage samples were composited into groups with equal weights of each dried sample: Group 1, sites CIDS3 and CIDS4; Group 2, of CIDS8, CIDS9 and CIDS15; Group 3, CIDS16, and CIDS10.
Chemical Analysis
Soil pH was analyzed using a 1:1 soil:water ratio for mineral soils. For samples with high organic matter contents, soil:water ratios ranged from 1:15 to 5:45, depending on viscosity (Kalra and Maynard, 1991). Total C and N were analyzed using a ThermoFischer Scientific Flash 2,000 CHNS. Total C was assumed to be organic C as there were no carbonates in these soils. Total Po was determined using the ignition method, followed by colorimetric analysis using a Cary-60 UV/vis spectrophotometer (Saunders and Williams, 1955; O'Halloran and Cade-Menun, 2008). The Mehlich method was used to extract P and exchangeable cations [Al, Ca, Fe, and magnesium (Mg)], and the extracts were analyzed on a Teledyne Leeman Labs Prodigy dual-view ICP-optical emission spectrophotometer (ICP-OES) with a sea spray nebulizer (Mehlich, 1984; Kalra and Maynard, 1991). Sodium pyrophosphate (0.1 N) and acidified ammonium oxalate (0.2 N) were used to extract Fe and Al from mineral samples, followed by ICP-OES analysis (McKeague and Day, 1966; Courchesne and Turmel, 2008). Pyrophosphate-extractable Fe (Fep) and Al (Alp) represent organically-complexed forms, whereas oxalate-extractable Fe (Feo) and Al (Alo) represent amorphous and organically-complexed forms. Therefore, the difference between oxalate- and pyrophosphate-extractable Fe and Al provides an indication of how much of these elements occur in amorphous inorganic forms.
Foliage and L horizon samples were analyzed for TP by digestion (Parkinson and Allen, 1975; Cade-Menun and Lavkulich, 1997), followed by colorimetric analysis (Murphy and Riley, 1962) for molybdate-reactive P (MRP). For organic samples total elemental analysis (including TP) was analyzed by closed-vessel microwave acid digestion ICP-OES (Kalra and Maynard, 1991). For mineral samples, total elemental analysis (including TP) was analyzed by high temperature fusion with lithium metaborate/lithium bromide using a Claisse M4 Fluxer followed by ICP-OES.
Solution Phosphorus NMR Spectroscopy
Analysis of all horizons for one profile revealed that high Po concentrations could be extracted from organic horizons and organic-matter enriched mineral horizons only, with other mineral horizons containing mainly orthophosphate (Figure S3). Thus, L horizons (litter, uppermost organic horizons) and select H (humified lower organic horizons) and humic-enriched mineral (M) horizons were analyzed for each replicate plot, as well as composited foliage samples. The mineral horizons included both A and B horizons, depending on the site, so are designated as M horizons here. The youngest site was not forested, so in the absence of an L horizon, a discontinuous thatch derived from dune grasses was analyzed. Samples [1 g (dry weight) for L horizon and foliage samples, 3 g for organic horizons and 10 g for mineral samples] were extracted with 30-mL of 0.5 M NaOH + 0.1 M Na2EDTA (NaOH-EDTA), shaken for 4 h in the dark at ~20°C, and then centrifuged for 15 min at 12,000 × g (Cade-Menun and Preston, 1996; Cade-Menun and Liu, 2014). A 1-mL subsample of each supernant was diluted (1:10) with DI water and analyzed using ICP-OES to determine the extract concentrations of P, Al, Ca, Fe, Mg, and Mn. The remaining supernants were filtered through Whatman 42 in a Buchner funnel to remove OM from the sample, frozen, and then lyophilized until dry (~3 days). The recovery of TP in NaOH-EDTA extracts was calculated (Table 3).
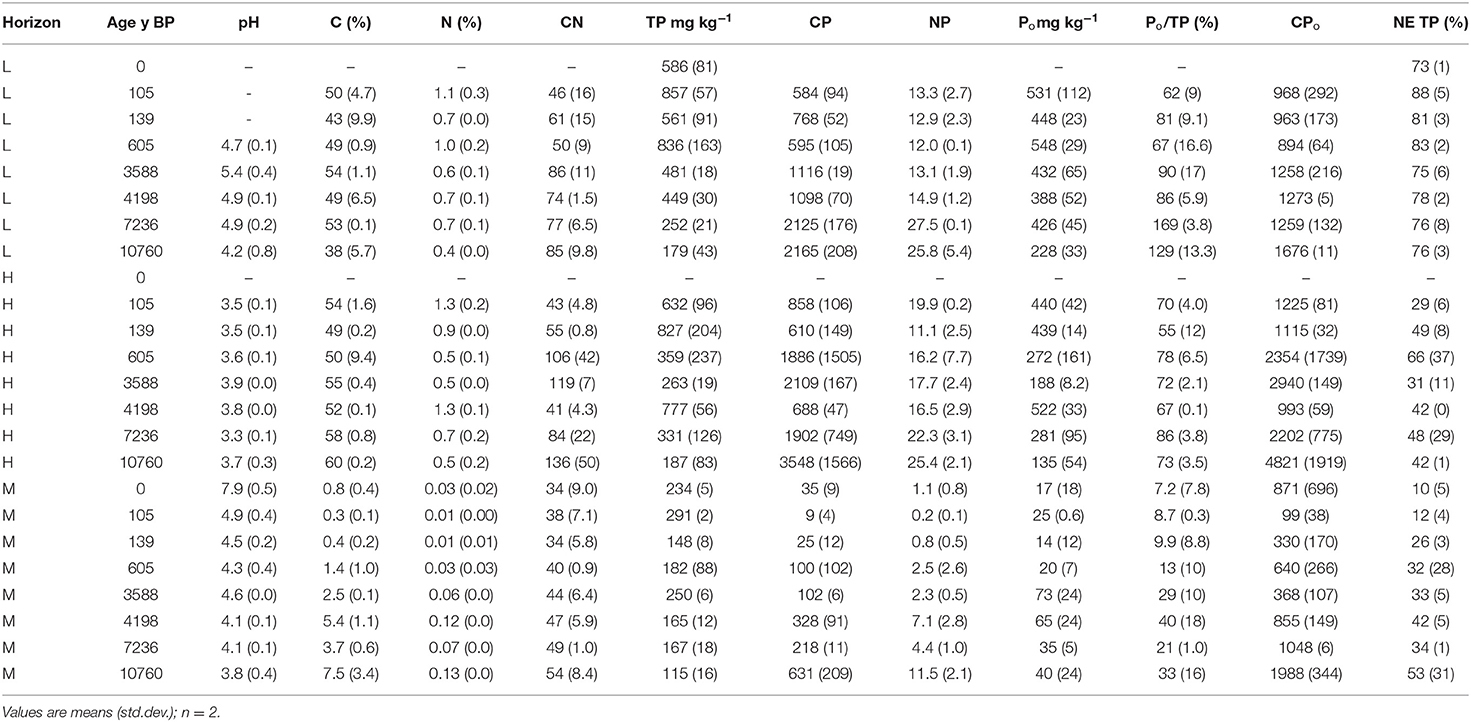
Table 3. Soil pH (in water), total carbon (C), total nitrogen (N), total (TP), and organic P (Po) concentrations within litter (L), humic-enriched organic (H) and mineral (M) horizons, and the recovery of TP in NaOH-EDTA extracts (NE TP).
The freeze-dried extracts of the select H horizon and M horizon samples were sent to the Stanford Magnetic Resonance Laboratory (SMRL) at Stanford University for NMR analysis. The L horizon and composited foliage samples were analyzed at the Saskatchewan Structural Sciences Center (SSSC) at the University of Saskatoon, due to the closure of the SMRL. At the SMRL, the freeze-dried extracts were prepared for P-NMR analysis by adding 0.5–1.5 ml of D2O, 0.5 ml H2O, 0.5–4.0 ml of NaOH-EDTA extracting solution and 0.5–1.0 mL of 10 M NaOH to increase the sample pH above 12 (Cade-Menun and Liu, 2014). Samples were centrifuged at 3260 × g for 5 min. The spectra were obtained on a Varian Inova 600-MHz spectrometer (202.5 MHz for P) with a 10-mm broad band probe. The NMR parameters were: 45° (0.22-μs) pulse, 4.5-s pulse delay, 0.5-s acquisition time, 20°C, and no proton decoupling. Sample LAN30 (CIDS16B, Bhc horizon) was very viscous and had a very low paramagnetic ion (Fe, Mn) content so a 9.5 s pulse delay was used on this sample only. Total NMR analysis for the H and mineral horizon samples ranged from 8 to 16 h, to achieve an acceptable S/N.
At the SSSC, the freeze-dried supernants of the L horizon and foliage samples were prepared by adding 0.6 ml of D2O, H2O and the NaOH-EDTA extracting solution, as well as 0.4 mL of 10 M NaOH to increase the sample pH above 12. Some samples were very viscous so an additional 0.4 mL each of D2O and NaOH-EDTA extracting solution were added. All samples were centrifuged at 3260 × g for 5 min. Spectra were obtained on a Bruker Avance 500 MHz spectrometer (202.5 MHz for P) with a 10-mm broadband probe. The NMR parameters were: 45° (0.13-μs) pulse, 4.5-s pulse delay, 0.5-s acquisition time, 21°C, and no proton decoupling. Analysis times ranged from 4 to 8 h. During sample analysis at both SMRL and SSSC, selected samples were spiked with different reference compounds after initial NMR analysis, to confirm peak identifications within the monoester region. The chemical shift of compounds were slightly different for each sample type (L vs. H vs. mineral horizons), so a few samples of each sample type were spiked to confirm peak assignments (Cade-Menun, 2015). Spiking compounds included: myo-IHP, adenosine monophosphate (AMP), α- and β-glycerophosphate, glucose-1-phosphate, glucose 6-phosphate (g6P), and phosphocholine, all dissolved in NaOH-EDTA, as described in Cade-Menun (2015).
Spectra were processed using NMR Utility Transform Software (NUTS, Acorn NMR, Livermore, CA, 2,000 edition), using 7 Hz line-broadening for the full spectra and 2 Hz line-broadening for finer details, and the orthophosphate peak was adjusted to 6.000 ppm in all samples. Concentrations of P compounds were determined by multiplying the percentage of each P compound by the concentration of P extracted by NaOH-EDTA.
Statistical Analyses
Due to the small sample set and limited size of the dataset, statistical analysis was performed for the purpose of statistical exploration only. Data were analyzed with STATA 14 IC. Linear and non-linear regression analyses were performed on the masses of TP and Po to 1 m depth, and on Mehlich P and orthophosphate concentrations with age. The following models were used to examine the data: linear, second order polynomial, Michaelis-Menten, logarithmic, and exponential (decay or increase). Akaike's information criteria and visual examination of the residuals were used to determine the best-fitting model (Gotelli and Ellison, 2004). Parametric pair-wise correlations and non-parametric Spearman correlations were used to test relationships of P forms with other soil parameters. The Shapiro-Wilk normality test and visual examination of box plots using Stata 14 IC, for each horizon type (α = 0.05) were also performed. All NMR data were centered log ratio transformed prior to statistical analyses (Abdi et al., 2015).
Results
General Chemical Analyses
Soil pH ranged from 7.5 to 8.6 for the modern foredune and from 2.6 to 5.2 in the forested sites (~105 y BP and older), with the lowest pH values in samples from the oldest sites (Table S1). In the L, H and M horizons, pH was generally similar among samples and was lower in the H horizon than the L horizon (Table 3). The greatest pH range with age was observed in the M horizon, from 3.8 in the oldest samples to 7.9 in the modern foredune.
Total C concentrations were greatest in the forest floor and humified horizons (34–60%) and lowest in the mineral horizons (<2%), while total N concentrations were below 1.4% for all samples (Table 3, Table S1). Carbon and N concentrations were generally similar with age for the L and forest floor horizons, increasing with age in the mineral horizons.
With increasing age, Mehlich-extractable P concentrations declined in all sample types (Table S2), and were greatest in the L horizon and least in the mineral horizons (Figure 2A). Mehlich-extractable Ca and Mg concentrations were greatest in the surface samples from all sites and decreased with depth, while Mehlich-extractable Al and Fe concentrations generally showed the opposite trend (Table S2). The L horizon had the greatest concentration of Mehlich Ca+Mg followed by the H horizon and then the M horizon (Figure 2B). Conversely, the mineral horizons had the greatest Mehlich Fe+Al concentrations followed by the H horizon and then the L horizon (Figure 2C). In the L horizon, Mehlich Ca+Mg concentrations remained relatively stable with age, exhibiting only a slight decrease with increasing age (Figure 2). The H horizon samples maintained stable Ca+Mg concentrations until ~4,200 years followed by a decline, and there was a sharp decline in the M horizon samples between 0 and 105 years. The L and H horizons had a slight increase in Fe+Al concentrations with age compared to the M horizon, which had a much larger increase with age that peaked around 4,000 years. The H horizon at the ~7,236 y BP site had an unusually high Fe+Al concentration that was not consistent with other H horizon samples (Figure 2).
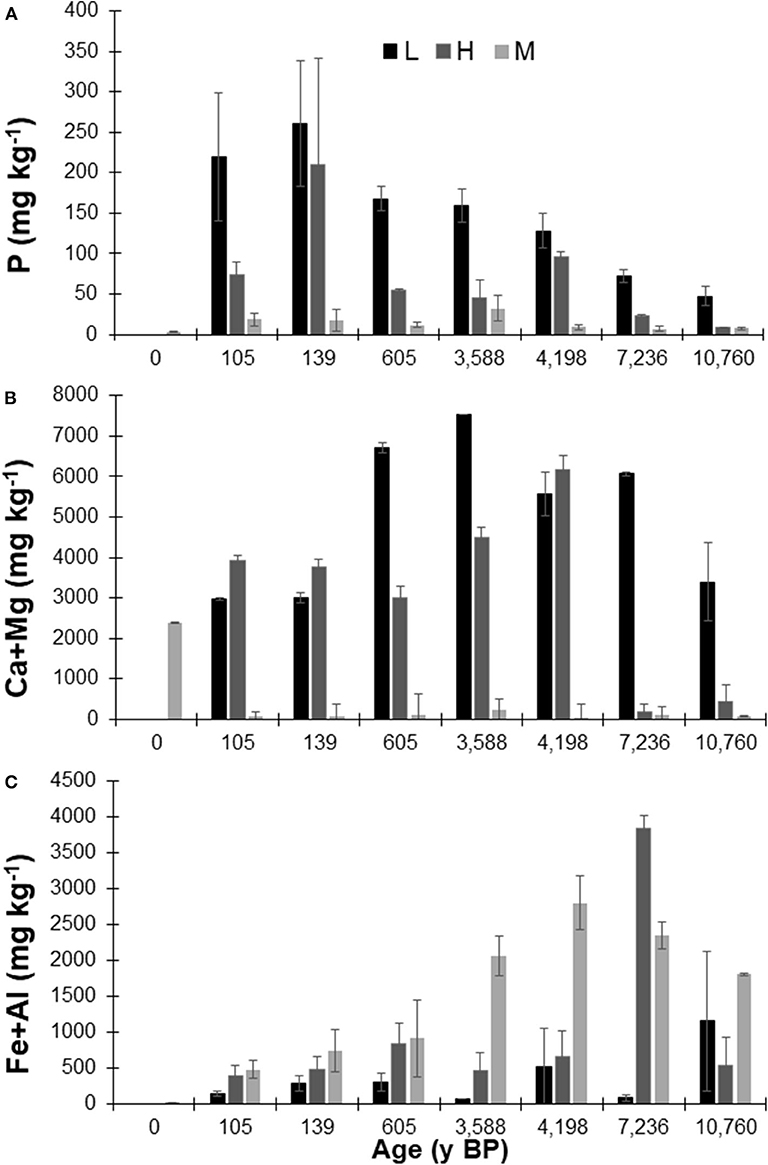
Figure 2. Average Mehlich-3 extractable (A) phosphorus (P), (B) calcium (Ca) + magnesium (Mg) and (C) iron (Fe) + aluminum (Al) concentrations within the select litter (L), humic-enriched organic (H) and mineral horizon (M) samples used for P-NMR analysis from the Calvert Island, BC chronosequence. Values are means ± standard deviation; n = 2.
Concentrations of Alp and Alo were similar in samples from profiles up to ~3,588 y BP, as were Fep and Feo concentrations, indicating that organically-complexed Fe and Al were predominant in the younger profiles (Table S1; Nelson, 2018). In samples from soil profiles from ~4,198 y BP and older, concentrations of Alo and Feo increased relative to those of Alp and Fep, especially at lower depths, indicating an increase in Fe and Al (oxy)hydroxides.
Soil Phosphorus (Total and Organic P)
Total P concentrations were greatest in the L horizon and decreased with depth (Table 3). The CP and NP ratios generally increased from H>L>M horizons, and generally increased with age in all horizons. Concentrations of Po were greater in the L and H horizons, decreasing substantially in the M horizon. As a proportion of TP, Po was 52–86% of TP in the L and H horizons. In the M horizon, samples from the sites <605 y BP had a lower proportion of Po to TP (7.2–13%), which increased to 21–40% of TP in older sites. Within each age category, CPo was greatest in the H horizon for all but the ~4,198 y BP site (Table 3). For the youngest and oldest sites, the CPo ratios were comparable in the L and M horizons; for other ages, CPo was lowest in the M horizon.
P-NMR Spectroscopy
Extraction with NaOH-EDTA recovered 73–88% of TP from L horizons, 29–66% from H horizons and 10–53% from the M horizons (NE PT, Table 3), and 90 ± 9% of TP from the foliar samples (Nelson, 2018). Although TP within the M horizon declined with increasing age, the recovery of P in NaOH-EDTA extracts increased with age and decreasing soil pH.
Example P-NMR spectra are shown in Figures 3, 4 and in Nelson (2018). Chemical shifts for foliage and L horizons, H horizons and M horizons are shown in Tables S3–S5, respectively. Compounds identified in the monoester region were IHP stereoisomers (myo, scyllo, neo, and D-chiro), α and β-glycerophosphate, mononucleotides, choline phosphate, g6P and an unidentified peak at ~5 ppm, labeled as “Unknown” (Figures 5–8; Tables S6, S7) Other unidentified signals in the monoester region were grouped into Mono1 (~7.0-6.0 ppm chemical shift), Mono2 (~6.0–3.5 ppm), and Mono3 (3.5–2.5 ppm). The orthophosphate diester region was divided into DNA and other diesters (other diester 1 downfield from DNA; Other Diester 2 upfield from DNA). Because some peaks in the monoester region result from alkaline hydrolysis of RNA and phospholipids during NMR analysis (Makarov et al., 2002; Turner et al., 2003b; Doolette et al., 2009; Cade-Menun, 2015; Schneider et al., 2016), total monoester and diester concentrations were corrected by adding the concentrations of α and β glycerophosphates and mononucleotides to the total diester concentration (cdiesters, cDi), and subtracting them from the total monoester concentration (cmonoesters, cMono). The P-NMR results as percentages for all samples are given in Tables S6, S7. Concentrations of P forms are given in Table S2 and Figures 5–8.
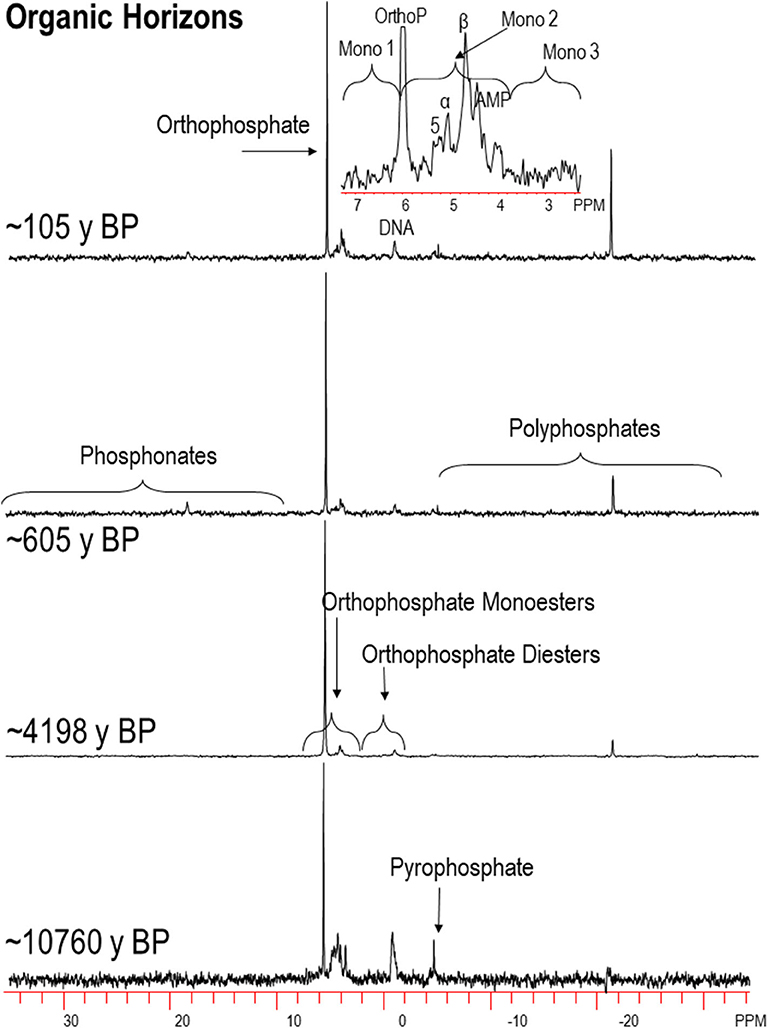
Figure 3. Select 31P-NMR spectra for humic-enriched organic (H) horizon samples along the Calvert Island chronosequence extracted with NaOH-EDTA and processed with 7 Hz line-broadening. OrthoP, orthophosphate, Mono, orthophosphate monoesters; α, α-glycerophosphate; β, β-glycerophosphate; AMP, amino monophosphate; 5, unknown peak, 5 ppm; y BP, years before present. See text for more details.
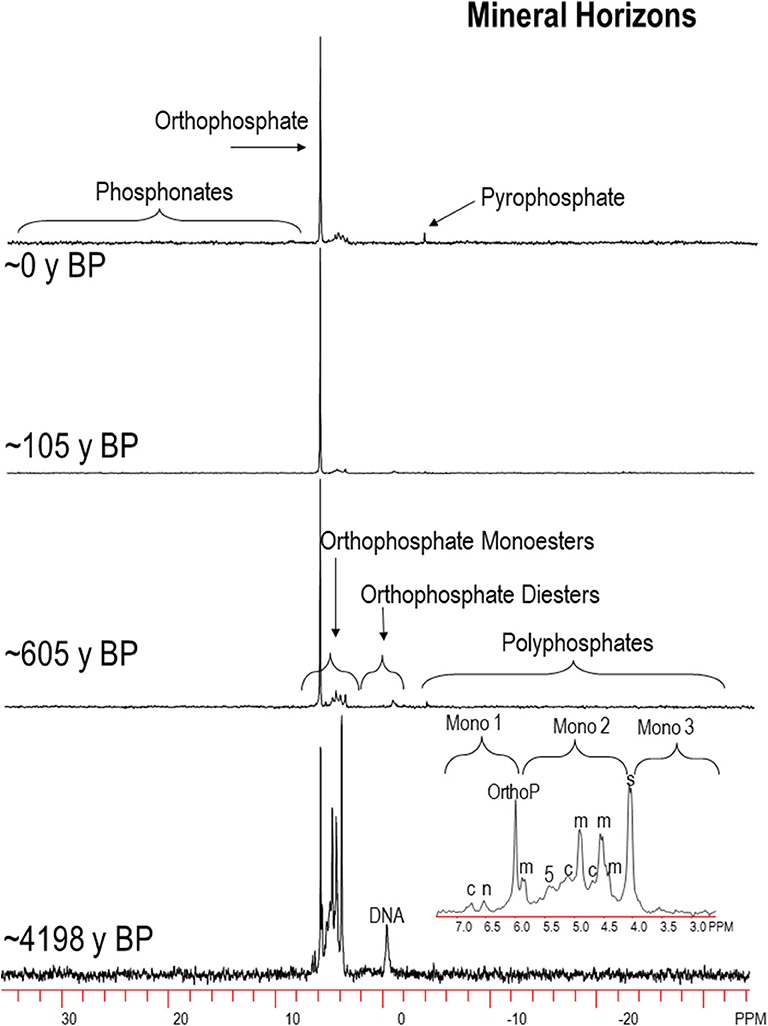
Figure 4. Select 31P-NMR spectra for humic-enriched mineral (M horizon) samples (A or B horizon depending on age) along the Calvert Island chronosequence extracted with NaOH-EDTA and processed with 7 Hz line-broadening. OrthoP, orthophosphate, Mono, orthophosphate monoesters; α, α-glycerophosphate; β, β-glycerophosphate; AMP, amino monophosphate; 5, unknown peak, 5 ppm; y BP, years before present; c, chiro-inositol hexaphosphate (IHP); m, myo-IHP; n, neo-IHP; s, scyllo-IHP; See text for more details.
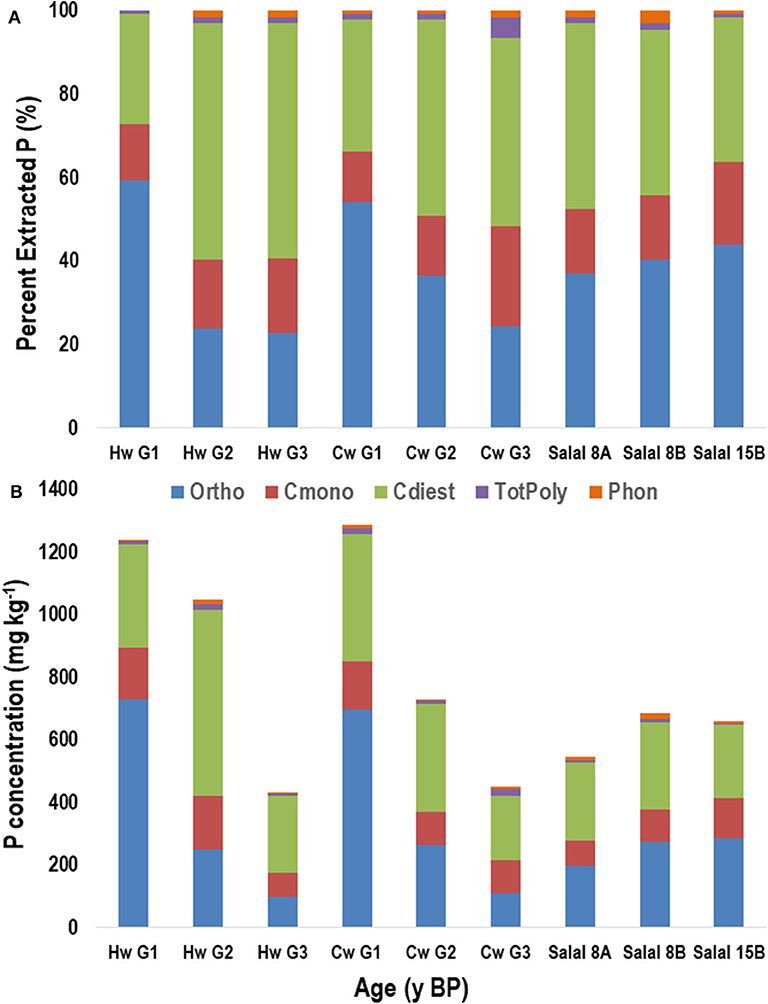
Figure 5. Proportion (A) and concentration (B) of phosphorus (P) in NaOH-EDTA extracts analyzed by P-NMR of three foliage species from the Calvert Island, BC chronosequence: western hemlock (Hw), western redcedar (Cw) and salal by age groupings (G1, G2, G3) or by site (CIDS8A, 8B, 15B). Ortho, orthophosphate; Cmono, Cdi, orthophosphate monoesters and diesters corrected for degradation during analysis; totPoly, total polyphosphates; Phon, phosphonates. Age groupings were made based on soil total P concentrations with G1 representing ages ~105 to ~139 years, G2 representing ~605 to ~4,198 years and G3 representing ~7,236 to ~10,760 years.
Foliage samples from age group 2 for Hw and Cw were compared to the salal samples (Figure 5, Table 4). Orthophosphate, DNA, α- and β-glycerophosphates, and other diesters were the dominant P compounds in all foliage samples (Figure 5, Table S7). The Cw and Salal samples were most comparable. Hemlock had the lowest proportion of orthophosphate and greatest proportion of cmonoesters and cdiesters while Cw and Salal had a greater proportion of orthophosphate and lower proportions of cmonoesters and cdiesters. The proportions of total polyphosphates and phosphonate were similar among all foliage species. Both Cw and Salal had all four stereoisomers of IHP and Hw had all but scyllo-IHP. With increasing age, the proportion of orthophosphate declined in both Hw and Cw species while cdiesters and cmonoesters increased in proportion (Figure 5A). For both Hw and Cw, the concentrations of all forms of P declined with increasing age, with the most substantial decline in orthophosphate (Figure 5B).
Table 4. Concentration of P compounds within NaOH-EDTA extracts of soil (Hor) and composited foliage species (Sp.).
In the L horizon, orthophosphate comprised <40% of extracted P (Figure 6A). The next most dominant groups were the cdiesters, followed by pyrophosphate and polyphosphate together (total polyphosphates) and then cmonoesters. The proportion of cmonoesters in the L horizon remained similar throughout the chronosequence, while the proportion of cdiesters generally increased with increasing age. The concentration of all P compound classes of extracted P declined with increasing age (Figure 6B), and there was an apparent shift in the dominance of different P compounds with age. On the youngest site with thatch rather than L horizon, orthophosphate and within the first 100 years, cdiesters became the most dominant forms of P. By ~10,000 y BP, cdiesters still dominated but the proportion of cmonoesters increased while orthophosphate and total polyphosphates declined.
Figure 6. Average proportion (A) and concentration (B) of phosphorus (P) in NaOH-EDTA extracts analyzed by P-NMR for the main groupings of P compounds in the litter (L) horizon from the Calvert Island BC chronosequence. Ortho, orthophosphate; Cmono, Cdi, orthophosphate monoesters and corrected for degradation during analysis; totPoly, total polyphosphates; Phon, phosphonates. Values are means; n = 2.
Within the H horizons, orthophosphate represented a considerable portion of the extracted P on all sites up until ~7,000 y BP, and then declined (Figure 7A). The cmonoesters and cdiesters, in H horizon samples, increased in proportion and concentration (Figure 7B) with increasing age. The concentrations of phosphonates and total polyphosphates declined with increasing age.
Figure 7. Average proportion (A) and concentration (B) of phosphorus (P) in NaOH-EDTA extracts analyzed by P-NMR for the main groupings of P compounds in the humic-enriched organic (H) horizon from the Calvert Island chronosequence. Ortho, orthophosphate; Cmono, Cdi, orthophosphate monoesters and corrected for degradation during analysis; totPoly, total polyphosphates; Phon, phosphonates. Values are means; n = 2.
Within the M horizons, the proportion and concentration of orthophosphate declined with increasing age and was associated with an increase in the proportions of cmonoesters and cdiesters with age (Figures 8A,B). The proportions of total polyphosphates and phosphonates did not fluctuate significantly with age although the concentration of phosphonates increased minimally with increasing age.
Figure 8. Average proportion (A) and concentration (B) of phosphorus (P) in NaOH-EDTA extracts analyzed by P-NMR for the main groupings of P compounds in the mineral (A or B, depending on age) horizon from the Calvert Island chronosequence. Ortho, orthophosphate; Cmono, Cdi, orthophosphate monoesters and corrected for degradation during analysis; totPoly, total polyphosphates; Phon, phosphonates. Values are means; n = 2.
Like the foliage and L horizon samples, the concentration of total Po decreased with age in the H horizon, as did the concentrations of myo- and chiro- and neo-IHP. However, the concentration of scyllo-IHP increased (Table 4). The concentrations of pyrophosphate and polyphosphates were much lower in the M horizon than other horizons. The M horizon was the only horizon in which total cmonoesters were greater than cdiesters, with myo- and scyllo-IHP comprising the majority of the cmonoesters (Table 4). The ratio of cmonoesters to cdiesters (cM:D) was lowest in the foliage samples and the L horizon (Table S7). The cM:D increased in the soil with increasing depth.
The results in Table S7 clearly demonstrate the need to correct for degradation of diesters to monoesters, especially for organic horizons. Degradation compounds were 22 ± 6 and 22 ± 5% of the foliage and L horizon samples, respectively, and 10 ± 3 and 9 ± 4% of the O and M horizons. The uncorrected M:D ratio was >1 for all samples, and was >10 in many samples. However, this dropped to <1 for all but the M horizon after correction.
Exploratory Modeling of P Pools
Linear, second order polynomial and exponential decay models were applied to the masses of TP and Po to 1 m depth with age (Figure 9). The second order polynomial model did not appropriately fit the TP mass data when examined visually. The linear model for TP mass had an appropriate fit but the 4,198 y BP site was identified as an outlier. The exponential decay model had the greatest adjusted R2 (0.982), lowest P (< 0.0001), and best visual fit. For the mass of Po with time, the linear model did not fit the data and the exponential decay model fit the data statistically but did not corroborate the trends identified in previous studies. The second order polynomial was chosen as the best fit for Po mass because it appropriately fitted the data and was in accordance with a priori knowledge (Figure 9, Table 1). The concentrations of Mehlich P and orthophosphate in the L, H, and M horizons were modeled with time. The exponential decay model was the best fit for Mehlich P concentration in the L, H, and M horizons and for orthophosphate in the L and M horizons (Table 5, Figures S5, S6). The large variability of orthophosphate concentration with age in the H horizon prevented a significant, explanatory fit of the data.
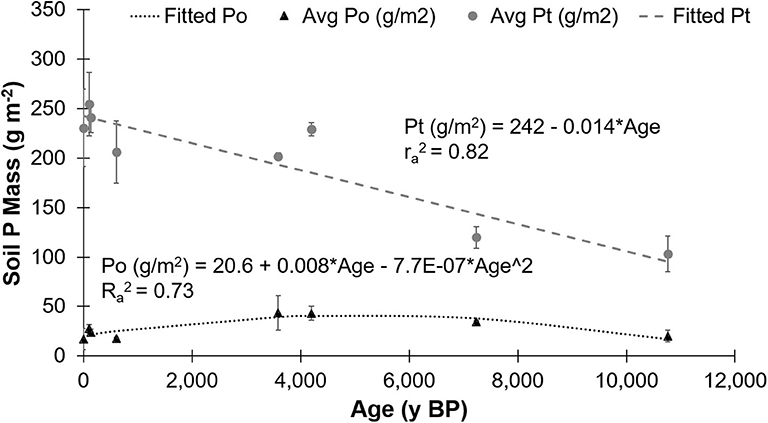
Figure 9. Average mass of total phosphorus (Pt) and organic phosphorus (Po) to a 1 m depth with the associated linear and non-linear regression formulas, respectively, and associated r-value, for soil sampled from the Calvert Island, BC, chronosequence. Values are means ± standard deviation; n = 2.
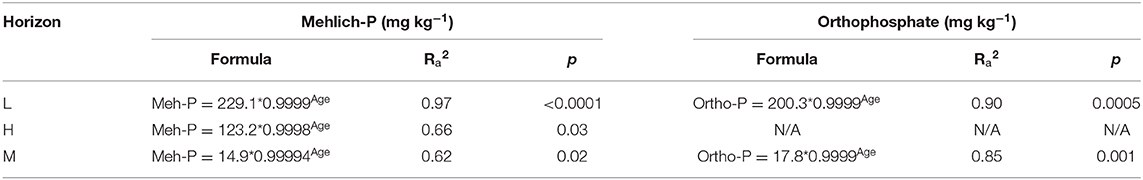
Table 5. Mehlich phosphorus (P) and orthophosphate exponential decay formulas for the litter (L), and select humified organic (H), and mineral (M) horizons with adjusted R2 (Ra2) and p-value (p).
Relationships of Select Organic P Compounds With Soil Chemical Parameters
Of the parameters analyzed with correlation analysis, DNA concentration was positively correlated to Alo concentration (r2 = 0.79, P < 0.05), and Alo+Feo concentrations (r2 = 0.81, P < 0.05). Total IHP concentration in the mineral horizon was significantly correlated to concentrations of total C (r2 = 0.91, P < 0.001), Alo (r2 = 0.86, P < 0.001), and Alo+Feo (r2 = 0.87, P < 0.001), and there was a strong relationship of Alo and total IHP concentrations for all but the 7,236 y BP sites (Figure S4). Mehlich P concentrations within the samples used for P-NMR and orthophosphate concentration determine by P-NMR were also significantly correlated (r2 = 0.941, P < 0.0001).
Discussion
Comparison of Total, Total Organic, and Mehlich 3 Phosphorus to Other Chronosequences
The Walker and Syers (1976) model suggests that primary mineral P concentrations will rapidly decline within the first ~4,000 years, accompanied by an increase in organic, occluded and non-occluded P forms. In the Calvert Island soils, the mass of TP to 1-m depth followed the typical exponential decline with age (Walker and Syers, 1976). This rapid decline in P concentration with increasing age is similar to the decline in P concentration on the Cox Bay chronosequence, which has a very similar climate (Singleton and Lavkulich, 1987b). Though TP data were not reported for Cox Bay, a linear decline of Ca-P concentrations was apparent in the first 550 years to 1 m depth and an exponential decline of Ca-P concentrations occurred in the first 10 cm of mineral soil (Singleton and Lavkulich, 1987b).
On Calvert Island, total Po mass displayed a hump-shaped curve that increased until ~4,000 years and then declined. This is characteristic of the Walker and Syers (1976) model: as phosphate becomes more scarce with increasing age, less-labile P forms including Po forms will remain, as well as Po within soil microorganisms from uptake and immobilization (Quiquampoix and Mousain, 2007). Within organic horizons, the Volcanic plateau (Arizona, USA), Franz Josef, and Waitutu (South Island, New Zealand) chronosequences exhibited a humped decline of Po concentration with increasing age (Parfitt et al., 2005). The same hump-shaped curve was seen in the mineral horizons on the Reefton, Manawatu, Hawaiian Islands, Jurien Bay, Franz Josef, Cooloola and Mendocino (California, USA) chronosequences (Walker and Syers, 1976; Crews et al., 1995; Richardson et al., 2004; Parfitt et al., 2005; Eger et al., 2011; Izquierdo et al., 2013; Chen et al., 2015; Turner and Laliberté, 2015).
Although the fractionation method used in the Walker and Syers (1976) model was not utilized in this study, fractionation was performed on one profile on the Calvert Island chronosequence (Figure S3). Those results suggest that the Mehlich cation data provide a good approximation to fractionation. Thus, TP, Po, exchangeable (Mehlich) P, and the sum of exchangeable (Mehlich) Ca+Mg and Fe+Al concentrations provide an adequate data set to see if the Calvert Island chronosequence follows the general trends of the Walker and Syers (1976) model. For the Calvert Island chronosequence, this can be seen in the exponential decline of Mehlich P concentration with increasing age in all horizons (Figure S5), the dramatic decrease in Mehlich Ca and Mg concentrations within ~105 y BP in the mineral horizon, and the increase in Fe and Al concentrations to ~4,198 y BP. Effective cation exchange capacity and exchangeable Ca and Mg concentrations also declined with increasing age on the Haast, Mendocino, Cox Bay and Jurien Bay chronosequences (Singleton and Lavkulich, 1987b; Northup et al., 1998; Eger et al., 2011; Turner and Laliberté, 2015). The Calvert Island chronosequence can thus be added to the list of chronosequences worldwide that follow the Walker and Syers (1976) model, regardless of differences in parent material or climate (Table 1).
Within organic horizons, TP concentrations declined consistently at the San Francisco Volcanic Field, Franz Josef and Waitutu sites at lower rates than in the mineral horizons (Parfitt et al., 2005), which is comparable to the Calvert Island chronosequence with the exception of the ~4,198 y BP site. On the Haast chronosequence, TP concentrations in organic horizons declined exponentially, reaching a stable concentration after only 1,000 years that coincided with the development of a mature Podzol (Turner et al., 2012).
Within mineral horizons, TP concentrations declined with age on chronosequences across the world, with significant declines at the Cooloola, Jurien Bay, Franz Josef, Reefton, and Waitutu, Manawatu, and Mendocino sites (Syers and Walker, 1969; Walker and Syers, 1976; Parfitt et al., 2005; Izquierdo et al., 2013; Chen et al., 2015; Turner and Laliberté, 2015). The Haast chronosequence and the Hawaiian substrate age gradient (sub-tropical rain forest) both had rejuvenating dust inputs that buffered TP concentrations within the soil, but a significant decline with age was still apparent (Crews et al., 1995; Kurtz et al., 2001; Eger et al., 2011). Haast also had an increase in TP concentrations following the formation of placic horizons, most likely due to the reduction and subsequent mobilization of Fe (Turner et al., 2012), but this was not seen in the Calvert Island soils, although placic horizons developed.
Nutrient Ratios
Using the NP ratios suggested by Güsewell (2004), where an NP <10 was N-limited and >20 was P-limited, foliage samples within this study were within the co-limitation or adequate supply region of the ratios. This suggests no limitation of P to plant growth within the foliage, unlike Jurien Bay where the NP ratio within foliage was >20 after 6,700 y (Hayes et al., 2014). The Mendocino chronosequence also had an increase in NP within foliage with age from 6.0 to 14.4 on Terraces one through five (Izquierdo et al., 2013) and Franz Josef foliage NP was ~14 after 12,000 years (Richardson et al., 2004). The NP ratio within the L Horizon samples increased with increasing age up to 27.5 for the second oldest site (Table 3) which is within the P-limited range (Güsewell, 2004). The NP ratios within the H horizon suggest N and P co-limitation for all but the two oldest sites. In contrast, NP ratios in the M horizon show N limitation in all but the oldest site, which was in the range for co-limitation or adequate supply (Güsewell, 2004). The mineral soils on Calvert Island had a much lower NP ratio compared to other chronosequences spanning similar ages. On the Haast chronosequence the NP ratio did not increase consistently with age, but was 8.6 after 290 years and ~10 after 6,500 years (Turner et al., 2012). After 6,700 years, the mineral soils from the Jurien Bay chronosequence had NP > 20 suggesting P limitation (Hayes et al., 2014). On the Cooloola chronosequence the NP was 11.5 after 7,500–9,600 years and reached 30.5 after > 460,000 years within the upper 30 cm of mineral soils (Chen et al., 2015). Foliage samples in the current study did not show increasing NP ratios with increasing age as expected; however, the L and H horizons did display the expected trend. Interestingly, the NP ratio in the M horizons suggest N limitation on young sites and possibly co-limitation on the oldest site. Nutrient acquisition strategies and plant communities should be explored on this chronosequence in more detail to further understand foliar nutrients.
Phosphorus Extraction for P-NMR
Extraction of P, especially Po, with NaOH-EDTA for P-NMR is currently the most quantitative method to recover Po from soil and other environmental samples (Turner et al., 2005; Cade-Menun and Liu, 2014). The recovery of P in NaOH-EDTA extracts from the foliage and L horizon samples was the greatest of all types of the Calvert Island samples, with a recovery rate >73% of TP. Phosphorus recovery was lower in the H and M horizon samples, and generally increased with age. It was also lower in samples with higher pH. Changes in P recovery with age may be related to humification processes that incorporated Po within organic matter (Celi and Barberis, 2005), reducing the solubility in NaOH-EDTA. The recovery of TP within this study is comparable to recovery rates from studies of other Podzols on Vancouver Island, BC, such as 71–95% recovery within the LF layer, 32–95% recovery in the H horizon and 4–64% recovery within mineral horizons (Cade-Menun et al., 2000a,b). On the Franz Josef chronosequence, Turner et al. (2007) also observed lower recovery rates on young soils compared to older mineral soils, while Turner et al. (2014) reported lower recovery rates from mineral soil than organic horizons for the Haast chronosequence, especially for soils from younger and older sites. Wang et al. (2019) reported greater P recovery in NaOH-EDTA extracts from L horizons than H horizons for German forests.
Much of the P not extracted by NaOH-EDTA in samples is thought to be occluded Pi (Cade-Menun et al., 2015) With increasing age, Po dominated and was more easily extractable with NaOH-EDTA than Pi forms that may be precipitated or occluded (Turner et al., 2003a; Turner, 2008). The youngest site (~0 y BP) was minimally weathered and receives daily influxes of sea spray rich in basic cations, increasing pH relative to the older samples (7.9 vs. 3.8 for M horizon samples). Higher-pH samples generally have lower recoveries with NaOH-EDTA because P bound by Ca and Mg is harder to extract with NaOH-EDTA than P bound to Fe and Al (Turner et al., 2003a; Weyers et al., 2016). With increasing age, both the H and mineral horizons became more enriched in Fe and Al, which corresponds to an increase in the recovery of Po. It is important to note that the mechanisms of P recovery with NaOH-EDTA are not fully understood and more studies should be conducted comparing the extract and the residual P in the remaining sample after extraction with NaOH-EDTA (e.g., Turner, 2008; Cade-Menun and Liu, 2014). It is also important to note that if the majority of unextracted P is Pi, then total Pi calculated from NMR spectra will be underestimated in samples with low recovery in NaOH-EDTA, such as for the M horizons of the younger sites.
Changes in Phosphorus Forms Among Sample Types and With Depth
Different processes control the concentrations and forms of P within the different sample types of this study. In foliage, P forms and concentrations are directly related to the specific plant species and the soil nutrient status (Yan et al., 2019), and in turn control inputs to the L horizon. One Po compound of particular interest is myo-IHP (phytate), which can be a significant component of soil Po. It is a P storage compound commonly found in high concentrations in seeds, and in variable concentrations in other plant materials, and has been widely studied in agriculturally-important crops (Noack et al., 2014). However, there is no published information about myo-IHP in plant material of forests such as those found on Calvert Island. In addition to myo-IHP, other IHP stereoisomers detected in soils are chiro-, scyllo-, and neo-IHP, which have not been detected in appreciable quantities in plant tissues (Turner, 2007). In soils, the stereoisomers of IHP are either microbially synthesized or are formed from epimerization of myo-IHP (Smith and Clark, 1951; Cosgrove, 1980; Martin et al., 2000; Turner and Richardson, 2004; Giles et al., 2011). In the foliage samples from Calvert Island, stereoisomers of IHP were found in plant foliage in varying concentrations depending on the plant species. Redcedar (Cw) and salal foliage had all four IHP stereoisomers, whereas hemlock (Hw) had all stereoisomers except scyllo-IHP. It is important to note, however, that these foliage samples were not always collected directly from the plants and were not sterilized prior to extraction. As such, there is a possibility that microbial alteration and epimerization may have occurred and influenced the IHP forms and concentrations. This may also have altered other P compounds such as polyphosphates. However, the high concentrations of diesters in the foliage samples from Calvert Island are consistent with analysis of other plant materials (e.g., Noack et al., 2014; Yan et al., 2019).
The L horizon had lower TP concentrations than the foliage samples, but it appears that there were few alterations to P compounds in the L horizon: the forms of Po within the L horizon were directly comparable to the foliage samples, which confirms the third hypothesis of this study. Organic P forms within the foliage and L horizon were dominated by DNA and by the products of diester degradation during P-NMR extraction and analysis, α- and β- glycerophosphates, from phospholipids, and nucleotides, from RNA.
The forms of P within the foliage and L horizon will influence the H horizon, but the direct effect may be diminished by increased biological alteration. The H horizons had P forms similar to those of the L horizon, but there were increases in concentrations of DNA, scyllo-IHP, polyphosphates and phosphonates. The differences in P forms between the L and H horizons can be explained by microbial degradation and scavenging. The increased phosphonate concentrations within H horizons are most likely due to differences in the soil microclimate, including wetter condition and different microbial communities due to lower pH. These are ideal conditions for the formation and accumulation of phosphonates, because these conditions limit bacterial activity and subsequently phosphonatase enzyme production (Tate and Newman, 1982; Hawkes et al., 1984; Condron et al., 2005). The specific origins of the phosphonates in these soils are unknown, but phosphonates in general are produced by a number of organisms, including snails (in eggs), protozoa (in cilia), and Actinomyces (Condron et al., 2005). Phosphonates are also found in a number of agricultural chemicals, including herbicides and fungicides, but that is unlikely to be the origin of phosphonates in these soils, given that the study sites are remote and generally undisturbed by human management. The H horizons of the Calvert Island sites were well-humified humic or wood-enriched horizons with an abundance of mycelia, and P can be transported within mycelia as polyphosphate granules (Smith and Read, 1997; Makarov et al., 2002; Oberson and Joner, 2005; Bünemann et al., 2008); thus, an increase in polyphosphate concentrations could be tied to the increased fungal cycling of nutrients. Pyrophosphate may be a storage compound for microbes (Condron et al., 1990), which could explain the increased proportion within the L horizon compared to the foliage and the decline when transitioning to the more active H horizon. It may also originate from degradation of polyphosphates during extraction and NMR analysis (Cade-Menun et al., 2006).
The humic-enriched M horizon had a considerably lower TP concentration compared to the upper horizons. There were few to no roots in the mineral horizons and no identifiable mycelia (Nelson, 2018), which would limit the biological aspects of P cycling in this horizon (Greaves and Webley, 1969). The increase in phosphonates may be attributed to the increasingly wetter conditions with age, because the placic and ortstein horizons that formed between ~600 and ~3,500 y BP can impede water flow, making conditions wetter, cooler and more acidic. The dominant Po forms in the M horizon were myo- and scyllo-IHP, followed by DNA, nucleotides and chiro-IHP and minimal concentrations of glycerophosphates. Mineral horizon samples dominated by orthophosphate had a lower concentration of cmonoesters and the sites dominated by cmonoesters had lower concentrations of orthophosphate. The increased proportion of cmonoesters results from an increase in IHP.
The buildup of IHP and DNA suggests that the controlling process in the mineral horizons of Calvert Island is sorption, because IHP can easily sorb onto humic materials, clays or form insoluble precipitates, making them less likely to be mineralized (Goring and Bartholomew, 1952; Condron et al., 1990; Turner et al., 2002; Giles et al., 2011). This is corroborated by the increase of amorphous and exchangeable Fe and Al in the mineral horizon compared to the other horizons, and there was a clear relationship. Jørgensen et al. (2015) examined IHP stabilization on the Haast chronosequence and suggested that all IHP were sorbed onto amorphous metals. This finding is consistent with the Calvert Island soils. DNA can also be sorbed onto amorphous metals in addition to humic materials (Greaves and Wilson, 1969; Levy-Booth et al., 2007; Turner et al., 2007). Similar to IHP, DNA was correlated to amorphous Fe and Al on the Calvert Island chronosequence.
Cade-Menun et al. (2000a) also used P-NMR to characterize P forms in soils from the CWH zone within Cw-dominated forests. In their study the L and H horizons were dominated by uncorrected monoesters and diesters followed by orthophosphate. The mineral horizons from Cw sites presented in Cade-Menun et al. (2000a) were dominated by orthophosphate and monoesters, similar to Calvert Island. Preston and Trofymow (2000) also used P-NMR to characterize P forms in soils from the CWH zone, however they extracted samples with NaOH and Chelex rather than NaOH-EDTA. They compared the east side of Vancouver Island, BC, in the very dry variant, to the west side in the very wet variant. The west coast soils were characteristic of forests with nutrient restrictions and cool, wet conditions within the CWH zone that are also characteristic of the Calvert Island chronosequence. The young mineral soils on Calvert Island (0–139 y) were comparable to the mineral soils on the west coast of Vancouver Island in Preston and Trofymow (2000), with orthophosphate dominating followed by uncorrected monoesters, and diesters. In other regions of the world, diesters and diester degradation compounds dominated Po compounds, and pyrophosphate was more abundant, in organic horizons compared to mineral horizons in forest soils of Sweden (Vincent et al., 2012), Russia (Celi et al., 2013), Spain (García-Oliva et al., 2018; Merino et al., 2019), and Taiwan (Lin et al., 2018). In organic forest horizons of Germany, Wang et al. (2019) reported phosphonates in lower organic horizons but not surface litter layers, and generally more pyrophosphate and polyphosphates at the surface than in lower organic horizons.
Another factor that can influence P forms and concentrations in forests is fire. The ~7,236- and ~10,760-y BP sites on the Calvert Island chronosequence had evidence of a fire history, with visible fire scars on shore pine (Pinus contorta var. contorta, and charcoal fragments in soils > 3,500 Y bP (Nelson, 2018). Hoffman et al. (2016a,b) documented fire chronology on northern Calvert Island, with most fires occurring within the last 1,000 years, and found that there was a fire-free period between roughly 7,500 and 5,500 y BP. This suggests that all charcoal found on this chronosequence could be assumed to be <5,500 y BP. The effects of fire on soil P compounds were also investigated within Cw-Hw forests by Cade-Menun et al. (2000b). Post-fire LF and H horizons displayed an increase in Pi following fire since fire mineralizes Po forms to phosphate (DeBano and Klopatek, 1988). Similar effects were reported after fire in Spain (García-Oliva et al., 2018; Merino et al., 2019). In Cade-Menun et al. (2000b), after 10 years the effects of fire were diminished and Pi concentrations were comparable to old growth forests. The L and H horizons of the Calvert Island sites with a fire history did not have an apparent increase in phosphate, so the fires that did occur may not have been severe enough to alter soil P forms, or were long enough ago that their effects have diminished.
Changes in Phosphorus Forms With Site Age
The concentrations of all P forms within the foliage and L and H horizons decreased with increasing age while the concentration of P extracted using NaOH-EDTA increased with age. All samples from Calvert Island (foliage, and L, H, and M horizons) had declining proportions of orthophosphate, with the L horizon exhibiting the least change. The concentration of orthophosphate in the L and M horizon declined exponentially with increasing age (Figure S6). This decline in orthophosphate is consistent with the literature because phosphate is a more labile form of P released from primary minerals, plant material and microbes and is subsequently immobilized into microbial and plant tissues, leaving less-labile P forms in soil (Vitousek and Farrington, 1997; McDowell et al., 2007; Bünemann et al., 2008).
Coupled with a decline in orthophosphate concentration and proportion there was an increase in the proportion of Po in all sample types with age, which is consistent with the second hypothesis for this study. Foliar samples from both Hw and Cw had comparable changes in the P forms with age; however, Hw had a slightly larger increase in the proportion of DNA while Cw had a slightly larger increase in the proportion of monoester 3 category and G6P. The L horizon had a considerable increase in the proportion of cdiesters, the H horizon had an increase in cmonoesters and cdiesters while the M horizon had an increase in the proportion of cMono.
Analysis of the organic horizons on the Haast chronosequence showed an increase in the proportions of phospholipids, DNA and total polyphosphates with age (Turner et al., 2014). Similar to Haast, the H horizons on Calvert Island had an increase in the proportions of cmonoesters and cdiesters with age that can be attributed to an increase in the proportion of DNA, phospholipids, RNA, myo- and scyllo-IHP and the general monoester 2 category. This is also consistent with the second hypothesis for this study. Interestingly, phosphonates were not detected in the organic horizon on Haast (Turner et al., 2014), whereas phosphonates were detectable on all sites on Calvert Island and slightly increased in proportion with age. This suggests that soil conditions were wetter and more acidic on Calvert Island compared to Haast. It is also consistent with current literature that myo- and scyllo-IHP increased in proportion with increasing age in the H and mineral horizon samples (McDowell et al., 2007; Turner et al., 2007, 2014) although the concentrations declined between ~7,236 and ~10,760 y BP.
On the Franz Josef, Haast, Manawatu and Reefton chronosequences, the proportions of DNA, pyrophosphate, and myo-and scyllo-IHP increased with increasing age in the mineral horizon (McDowell et al., 2007; Turner et al., 2007, 2014). Similar increases in DNA, myo-and scyllo-IHP were observed in the mineral horizons on Calvert Island, which fully supports the second hypothesis of the study; however, an increase in pyrophosphate was not apparent. Interestingly, the potential sorption mechanisms for DNA on the Franz Josef and Calvert Island chronosequences differ, with humic material stabilizing DNA on Franz Josef (Turner et al., 2007), and crystalline and amorphous Al on Calvert Island.
Turner et al. (2014) presented a figure of the total IHP concentration and amorphous Al+Fe with increasing age for the Franz Josef chronosequence, and the IHP concentration mirrored the amorphous Al+Fe concentration. The total IHP concentration exhibited a hump shape, with the decline coinciding with the decline in amorphous Fe+Al. The decline in IHP may have been due to biological utilization of these compounds or due to a decline in the stabilization sites for IHP (Turner et al., 2014). As was noted in the previous section, IHP was also correlated to available and amorphous Al and Alo+Feo in the Calvert Island chronosequence, although Fe alone was not correlated with IHP. When Alo+Feo and total IHP concentration were graphed with age for the Calvert Island chronosequence, the IHP and Alo+Feo concentration curves were similar, but the concentration of IHP increases or declines before Alo+Feo, which differs from the Turner et al. (2014) data (Figure S4).
Ratio of Monoesters to Diesters
For the Calvert Island samples, the cM:D ratio was <1 in the foliage and L horizon, between 0.5 and 2 in the H horizons and greater >1 in the mineral horizons, while the uncorrected M:D ratio was much more variable than the cM:D within all samples types. This suggests that diesters, including degradation products, dominate the foliage, L horizon and sometimes the H horizon, while true monoester compounds (e.g., IHP) are more dominant in the mineral horizon. These data are consistent with our prior conclusion suggesting minimal alteration of the foliage within the L horizon, greater biological cycling and alteration in the H horizon and the dominance of chemisorption processes in the mineral horizons.
The ratio of monoesters to diesters (M:D), or sometimes diester to monoesters (D:M) is widely reported for P NMR literature (e.g., McDowell et al., 2007; Lang et al., 2017), and is thought to reflect Po lability and mineralization. This is based on the assumption that, in general, monoesters will sorb more readily than diesters, thus restricting their enzymatic hydrolysis. However, there are some flaws with this assumption. First, it makes broad generalizations about sorption by monoesters and diesters that aren't necessarily true for all P species within each category. While IHP sorbs strongly, other monoesters such g6P are not as tightly sorbed (Shang et al., 1996). And while phospholipids do not sorb, DNA will, especially at lower pH. In addition, the degradation of RNA and phospholipids during NMR extraction and analysis requires correction before reporting total monoesters, total diesters or the M:D (Schneider et al., 2016). Without correction, M:D should be used very cautiously, especially in modeling or to test theories about P-acquisition or P-recycling strategies (Lang et al., 2017).
Studies that have used P-NMR on chronosequences have used uncorrected data with the exception of Vincent et al. (2013) on the Vaserbotten chronosequence in Sweden, although other studies note that due to the degradation of diesters, total diesters are underestimated (McDowell et al., 2007; Turner et al., 2007, 2014). The Vaserbotten chronosequence did not have a significant decline in TP with age so it isn't directly comparable to the Calvert Island chronosequence, but it is interesting to note that Vincent et al. (2013) found that ~40% of non-IHP monoesters were degradation products of RNA. This supports the current data for Calvert Island about the need to correct for degradation of Po compounds within NaOH-EDTA extracts. The M:D within mineral soil on the Manawatu and Reefton chronosequence declined with increasing age similarly to Calvert Island (McDowell et al., 2007). However, once the correction for monoesters and diesters was applied, the cM:D actually increased with age on Calvert Island. Due to the increased dominance of IHP with age on Manawatu and Reefton, the cM:D might also be comparable to Calvert Island, reflecting an increased dominance of cmonoesters with age (McDowell et al., 2007).
Conclusions
The objective of this study was to examine changes in broad P pools with time using a Holocene soil chronosequence developed on aeolian sand dunes in a hypermaritime climate within the CWH zone on Calvert Island, BC, Canada. The study specifically examines how soil Po compounds varied with increasing age in organic (L, H) and humic-enriched mineral (M) soil horizons as well as in dominant foliage species. As hypothesized, the Calvert Island chronosequence followed the trends of the Walker and Syers (1976) model with an exponential decline in total P with age and a hump-shaped trend for Po, allowing the Calvert Island chronosequence to be added to the list of chronosequences worldwide that follow the Walker and Syers (1976) P model. As expected, Po became an increasingly dominant P pool with age, with an increase in DNA in the L and H horizons and increases in myo- and scyllo-IHP in the M horizons. In all sample types, the proportion of orthophosphate declined with increasing age while the proportion of diesters after correction for degradation (cdiesters) increased with age. There was an increase in the Po concentration in the M horizons. This was due to increased concentrations of IHP and DNA, which were correlated to total C concentrations and the increased concentration of organically-bound and amorphous Al, and a decline in exchangeable Ca+Mg concentrations that coincided with an increase in concentrations of exchangeable Al+Fe.
The forms of Po within the foliage and L horizon were comparable as expected, even though the total P concentration of the L horizon was less than the foliage. Several IHP stereoisomers were detected in foliage samples, which is novel given the lack of published data on IHP stereoisomers in plant material from forests in the CWH zone. Ratios of NP increased in L and H horizons but not in foliage samples, with the NP ratios in the M horizons suggesting N limitation on young sites and possible co-limitation by N and P on the oldest site. The information in this study will add to the current understanding of P cycling on the coast of BC and may aid in the management of low-productivity forests that are prevalent in this region.
Data Availability Statement
The datasets generated for this study are available on request to the corresponding author.
Author Contributions
This work was performed as part of the M.Sc. thesis requirements for L-AN, which was funded by a program led by IW. L-AN was co-supervised by BC-M and PS, with IW on the thesis committee. BC-M conducted some of the NMR analysis and processed and interpreted all NMR spectra. All authors contributed to writing and have read and approved this manuscript.
Funding
Financial support was provided by a research grant from the Tula Foundation and the Hakai Institute to IW and PS and by AAFC A-Base funding (J-00127) to BC-M.
Conflict of Interest
The authors declare that the research was conducted in the absence of any commercial or financial relationships that could be construed as a potential conflict of interest.
Acknowledgments
The authors recognize that this study took place on the traditional territory of the Heiltsuk and Wuikinuxv First Nations and are grateful for the opportunity. The project was supported financially by the Tula Foundation and logistically by the Hakai Institute. The authors are grateful for the support of Eric Peterson and Christina Munck and staff at the Calvert Island field station, especially Lori Johnson for assisting with field work. We thank Dr. Corey Liu for NMR analysis at the Stanford Magnetic Resonance Laboratory and staff at the Saskatchewan Structural Science Center, University of Saskatchewan, for assistance with the NMR work done there. We gratefully acknowledge staff at the BC MECCS Analytical Chemistry Services Laboratory and at the AAFC Swift Current Research and Development Center, especially Katie Hagman, for assistance with sample analysis.
Supplementary Material
The Supplementary Material for this article can be found online at: https://www.frontiersin.org/articles/10.3389/ffgc.2020.00083/full#supplementary-material
References
Abdi, D., Cade-Menun, B. J., Ziadi, N., and Parent, L.-E. (2015). Compositional statistical analysis of soil 31P-NMR forms. Geoderma 257–258, 40–47. doi: 10.1016/j.geoderma.2015.03.019
Banner, A., LePage, P., Moran, J., and de Groot, A. (2005). The Hyp3 Project: Pattern, Process, and Productivity in Hypermaritime Forests of Coastal British Columbia - A Synthesis of 7-Year Results, Spec. Rep. 10. (Victoria, BC, British Columbia Ministry of Forest, Research Branch), 161.
Banner, A., Mackenzie, W., Haeussler, S., Thomson, S., Pojar, J., and Trowbridge, R. (1993). A Field Guide to Site Identification and Interpretation for the Prince Rupert Forest Region, LMH No. 26. (Victoria, BC: Information Services Branch Ministry of Forests), 281.
Bünemann, E., Smernik, R., Marschner, P., and McNeill, A. (2008). Microbial synthesis of organic and condensed forms of phosphorus in acid and calcareous soils. Soil Biol. Biochem. 40, 932–946. doi: 10.1016/j.soilbio.2007.11.012
Cade-Menun, B. J. (2015). Improved peak identification in 31P-NMR spectra of environmental samples with a standardized method and peak library. Geoderma 257–258, 102–114. doi: 10.1016/j.geoderma.2014.12.016
Cade-Menun, B. J., Berch, S. M., Preston, C. M., and Lavkulich, L. M. (2000a). Phosphorus forms and related soil chemistry of Podzolic soils on northern Vancouver Island. I. a comparison of two forest types. Can. J. Forest Res. 30, 1714–1725. doi: 10.1139/x00-098
Cade-Menun, B. J., Berch, S. M., Preston, C. M., and Lavkulich, L. M. (2000b). Phosphorus forms and related soil chemistry of Podzolic soils on northern Vancouver Island. II. The effects of clear-cutting and burning. Can. J. For. Res. 30, 1726–1741. doi: 10.1139/x00-099
Cade-Menun, B. J., He, Z., Zhang, H, Endale, D. M., Schomberg, H. H., and Liu, C. W. (2015). Stratification of phosphorus forms from long-term conservation tillage and poultry litter application. Soil Sci. Soc. Am. J. 79, 504–516. doi: 10.2136/sssaj2014.08.0310
Cade-Menun, B. J., and Lavkulich, L. M. (1997). A comparison of methods to determine total, organic, and available phosphorus in forest soils. Commun. Soil Sci. Plant Anal. 28, 651–663. doi: 10.1080/00103629709369818
Cade-Menun, B. J., and Liu, C. W. (2014). Solution phosphorus-31 nuclear magnetic resonance spectroscopy of soils from 2005 to 2013: a review of sample preparation and experimental parameters. Soil Sci. Soc. Am. J. 78, 19–37. doi: 10.2136/sssaj2013.05.0187dgs
Cade-Menun, B. J., Navaratnam, J. A., and Walbridge, M. R. (2006). Characterizing dissolved and particulate phosphorus in water with 31P-NMR spectroscopy. Environ. Sci. Technol. 40, 7874–7880. doi: 10.1021/es061843e
Cade-Menun, B. J., and Preston, C. (1996). A comparison of soil extraction procedures for 31P NMR spectroscopy. Soil Sci. 161, 770–785. doi: 10.1097/00010694-199611000-00006
Celi, L., and Barberis, E. (2005). “Abiotic stabilization of organic phosphorus in the environment,” in Organic Phosphorus in the Environment, eds B. L. Turner, E. Frossard, and D. S. Baldwin (Cambridge, MA: CABI Publishing), 113–132. doi: 10.1079/9780851998220.0113
Celi, L., Cerli, C., Turner, B. L., Santoni, S., and Bonifacio, E. (2013). Biogeochemical cycling of soil phosphorus during natural revegetaion of Pinus sylvestris on disused sand quarries in Northwestern Russia. Plant Soil 367, 121–134. doi: 10.1007/s11104-013-1627-y
Chapin, F. S., Walker, L. R., Fastie, C. L., and Sharman, L. C. (1994). Mechanisms of primary succession following deglaciation at Glacier Bay, Alaska. Ecol. Monogr. 64, 149–175. doi: 10.2307/2937039
Chen, C. R., Hou, E. Q., Condron, L. M., Bacon, G., Esfandbod, M., Olley, J., et al. (2015). Soil phosphorus fractionation and nutrient dynamics along the Cooloola coastal dune chronosequence, southern Queensland, Australia. Geoderma 257–258, 4–13. doi: 10.1016/j.geoderma.2015.04.027
Condron, L. M., Moir, J., Tiessen, H., and Stewart, J. (1990). Critical evaluation of methods for determining total organic phosphorus in tropical soils. Soil Sci. Soc. Am. J. 54, 1261–1266. doi: 10.2136/sssaj1990.03615995005400050010x
Condron, L. M., Turner, B. L., and Cade-Menun, B. J. (2005). “Chemistry and dynamics of soil organic phosphorus,” in Phosphorus: Agriculture and the Environment, eds J. T. Sims and A. N. Sharpley (Madison, WI: American Society of Agronomy), 87–121. doi: 10.2134/agronmonogr46.c4
Cosgrove, D. J. (1980). Inositol Phosphates: Their Chemistry, Biochemistry and Physiology. Amsterdam, NLD: Elsevier. 191.
Courchesne, F., and Turmel, M.-C. (2008). “Extractable Al, Fe, Mn, and Si,” Soil Sampling and Methods of Analysis, 2nd Edn., eds M. R. Carter and E. G. Gregorich (Boca Raton, FL: Canadian Society of Soil Science and CRC Press), 307–312.
Crews, T. E., Kitayama, K., Fownes, J. H., Riley, R. H., Herbert, D. A., Mueller-Dombois, D., et al. (1995). Changes in soil phosphorus fractions and ecosystem dynamics across a long chronosequence in Hawaii. Ecology 76, 1407–1424. doi: 10.2307/1938144
DeBano, L. F., and Klopatek, J. M. (1988). Phosphorus dynamics of pinyon-juniper soils following simulated burning. Soil Sci. Soc. Am. J. 52, 271–277. doi: 10.2136/sssaj1988.03615995005200010048x
Doolette, A., Smernik, R., and Dougherty, W. (2009). Spiking improved solution phosphorus-31 nuclear magnetic resonance identification of soil phosphorus compounds. Soil Sci. Soc. Am. J. 73, 919–927. doi: 10.2136/sssaj2008.0192
Eamer, J. B. R., Shugar, D., Walker, I. J., Neudorf, C., Lian, O., Eamer, J. L., et al. (2017). Late Quaternary landscape evolution in a region of stable postglacial relative sea-levels, British Columbia central coast. Boreas 47, 738–753. doi: 10.1111/bor.12297
Eger, A., Almond, P. C., and Condron, L. M. (2011). Pedogenesis, soil mass balance, phosphorus dynamics and vegetation communities across a Holocene soil chronosequence in a super-humid climate, south Westland, New Zealand. Geoderma 163, 185–196. doi: 10.1016/j.geoderma.2011.04.007
García-Oliva, F., Merino, A., Fonturbel, M. T., Omil, B., Fernández, C., and Vega, J. A. (2018). Severe wildfire hinders renewal of soil P pools by thermal mineralization of organic P in forest soils: Analysis by sequential extraction and 31P NMR spectroscopy. Geoderma 309, 32–40. doi: 10.1016/j.geoderma.2017.09.002
Giles, C., Cade-Menun, B. J., and Hill, J. (2011). The inositol phosphates in soils and manures: abundance, cycling, and measurement. Can. J. Soil Sci. 91, 397–416. doi: 10.4141/cjss09090
Goring, C., and Bartholomew, W. (1952). Adsorption of mononucleotides, nucleic acids, and nucleoproteins by clays. Soil Sci. 74, 149–164. doi: 10.1097/00010694-195208000-00005
Gotelli, N. J., and Ellison, A. M. (2004). A Primer of Ecological Statistics. Sunderland, MA: Sinauer Associates, Inc.
Greaves, M., and Wilson, M. (1969). The adsorption of nucleic acids by montmorillonite. Soil Biol. Biochem. 1, 317–323. doi: 10.1016/0038-0717(69)90014-5
Greaves, M. P., and Webley, D. (1969). The hydrolysis of myo-inositol hexaphosphate by soil microorganisms. Soil Biol. Biochem. 1, 37–43. doi: 10.1016/0038-0717(69)90032-7
Green, R. N., and Klinka, K. (1994). A Field Guide for Site Identification and Interpretation for the Vancouver Forest Region, LMH No. 28. (Victoria, BC: Research Branch, British Columbia Ministry of Forests), 293.
Güsewell, S. (2004). N:P ratios in terrestrial plants: variation and functional significance. New Phytol. 164, 243–266. doi: 10.1111/j.1469-8137.2004.01192.x
Hawkes, G. E., Powlson, D. S., Randall, E. W., and Tate, K. R. (1984). A 31P nuclear magnetic resonance study of the phosphorus species in alkali extracts of soils from long-term field experiments. Eur. J. Soil Sci. 35, 35–45. doi: 10.1111/j.1365-2389.1984.tb00257.x
Hayes, P., Turner, B. L., Lambers, H., and Laliberté, E. (2014). Foliar nutrient concentrations and resorption efficiency in plants of contrasting nutrient-acquisition strategies along a 2-million-year dune chronosequence. J. Ecol. 102, 396–410. doi: 10.1111/1365-2745.12196
Hoffman, K., Gavin, D., Lertzman, K., Smith, D., and Starzomski, B. (2016b). 13,000 years of fire history derived from soil charcoal in a British Columbia coastal temperate rain forest. Ecosphere 7, 1–13. doi: 10.1002/ecs2.1415
Hoffman, K., Gavin, D., and Starzomski, B. (2016a). Seven hundred years of human-driven and climate-influenced fire activity in a British Columbia coastal temperate rainforest. R Soc. Open Sci. 3, 1–14. doi: 10.1098/rsos.160608
Izquierdo, J. E., Houlton, B. Z., and van Huysen, T. L. (2013). Evidence for progressive phosphorus limitation over long-term ecosystem development: Examination of a biogeochemical paradigm. Plant Soil 367, 135–147. doi: 10.1007/s11104-013-1683-3
Jenny, H., Arkley, R. J., and Schultz, A. (1969). The pygmy forest-Podsol ecosystem and its dune associates of the Mendocino coast. Madroño 20, 60–74.
Jørgensen, C., Turner, B. L., and Reitzel, K. (2015). Identification of inositol hexakisphosphate binding sites in soils by selective extraction and solution 31P NMR spectroscopy. Geoderma 257–258, 22–28. doi: 10.1016/j.geoderma.2015.03.021
Kalra, Y. P., and Maynard, D. G. (1991). Methods Manual for Forest Soil and Plant Analysis. Edmonton, AB: Forestry Canada Northern Forestry Center, 125.
Kranabetter, J. M., LePage, P., and Banner, A. (2013). Management and productivity of cedar-hemlock-salal scrub forests on the north coast of British Columbia. For. Ecol. Manage. 308, 161–168. doi: 10.1016/j.foreco.2013.07.058
Kurtz, A. C., Derry, L. A., and Chadwick, O. A. (2001). Accretion of Asian dust to Hawaiian soils: isotopic, elemental, and mineral mass balances. Geochim. Cosmochim. Acta 65, 1971–1983. doi: 10.1016/S0016-7037(01)00575-0
Laliberté, E., Turner, B. L., Costes, T., Pearse, S. J., Wyrwoll, K. H., Zemunik, G., et al. (2012). Experimental assessment of nutrient limitation along a 2-million-year dune chronosequence in the south-western Australia biodiversity hotspot. J. Ecol. 100, 631–642. doi: 10.1111/j.1365-2745.2012.01962.x
Laliberté, E., Turner, B. L., Zemunik, G., Wyrwoll, K. H., Pearse, S. J., and Lambers, H. (2013). Nutrient limitation along the Jurien Bay dune chronosequence: response to Uren & Parsons. J. Ecol. 101, 1088–1092. doi: 10.1111/1365-2745.12123
Lang, F., Krüger, J., Amelung, W., Willbold, S., Frossard, E., Bünemann, E. K., et al. (2017). Soi phosphorus supply controls P nutrition strategies of beech forest ecosystems in Central Europe. Biogeochem. 136, 5–29. doi: 10.1007/s10533-017-0375-0
Levy-Booth, D. J., Campbell, R. G., Gulden, R. H., Hart, M. M., Powell, J. R., Klironomos, J. N., et al. (2007). Cycling of extracellular DNA in the soil environment. Soil Biol. Biochem. 39, 2977–2991. doi: 10.1016/j.soilbio.2007.06.020
Lin, C.-W., Tian, G., Pai, C.-W., and Chiu, C.-Y. (2018). Characterization of phosphorus in subtropical coastal sand dune forest soils. Forests 9:710. doi: 10.3390/f9110710
Makarov, M., Haumaier, L., and Zech, W. (2002). The nature and origins of diester phosphates in soils: a 31P-NMR study. Biol. Fertil. Soils 35, 136–146. doi: 10.1007/s00374-002-0454-8
Martin, J. B., Laussmann, T., Bakker-Grunwald, T., Vogel, G., and Klein, G. (2000). Neo-inositol polyphosphates in the amoeba Entamoeba histolytica. J. Biol. Chem. 275, 10134-−10140. doi: 10.1074/jbc.275.14.10134
Maxwell, R. E. (1997). “Soils of Brooks Peninsula” in Brooks Peninsula: An Ice Age Refugium on Vancouver Island, (Occasional Paper No. 5.), eds R. J. Hedba and J. C. Haggarty (Victoria, BC: B.C. Min. Environ., Lands and Parks), 4.1–4.49.
McDowell, R. W., Cade-Menun, B. J., and Stewart, I. (2007). Organic phosphorus speciation and pedogenesis: Analysis by solution 31P nuclear magnetic resonance spectroscopy. Eur. J. Soil Sci. 58, 1348–1357. doi: 10.1111/j.1365-2389.2007.00933.x
McKeague, J., and Day, J. (1966). Dithionite-and oxalate-extractable Fe and Al as aids in differentiating various classes of soils. Can. J. Soil Sci. 46, 13–22. doi: 10.4141/cjss66-003
Mehlich, A. (1984). Mehlich 3 soil test extractant: a modification of Mehlich 2 extractant. Commun. Soil Sci. Plant Anal. 15, 1409–1416. doi: 10.1080/00103628409367568
Merino, A., Jiménez, E., Fernández, C., Fontúrbel, M. T., Campo, J., and Vega, J. A. (2019). Soil organic matter and phosphorus dynamics after low intensity prescribed burning in forests and shrubland. J. Environ. Manage. 234, 214–225. doi: 10.1016/j.jenvman.2018.12.055
Merritts, D. J., Chadwick, O. A., and Hendricks, D. M. (1991). Rates and processes of soil evolution on uplifted marine terraces, northern California. Geoderma 51, 241–275. doi: 10.1016/0016-7061(91)90073-3
Murphy, J., and Riley, J. P. (1962). A modified single solution method for the determination of phosphate in natural waters. Anal. Chim. Acta 27, 31–36. doi: 10.1016/S0003-2670(00)88444-5
Nelson, L.-A. (2018). Examination of Long-Term Soil Development and Phosphorus Dynamics in a Hypermarine Chronosequence, Calvert Island, British Columbia, Canada. [MSc. Thesis] (Prince George, BC: University of Northern British Columbia). Available online at: https://unbc.arcabc.ca
Neudorf, C. M., Lian, O. B., Walker, I. J., Shugar, D. H., Eamer, J. B. R., and Griffin, L. C. M. (2015). Toward a luminescence chronology for coastal dune and beach deposits on Calvert Island, British Columbia central coast, Canada. Quat. Geochronol. 30, 275–281. doi: 10.1016/j.quageo.2014.12.004
Noack, S. R., McLaughlin, M. J., Smernik, R. J., McBeath, T. M., and Armstrong, R. D. (2014). Phosphorus speciation in manure wheat and canola plants as affected by phosphorus supply. Plant Soil 378, 125–137. doi: 10.1007/s11104-013-2015-3
Noble, M. G., Lawrence, D. B., and Streveler, G. P. (1984). Sphagnum invasion beneath an evergreen forest canopy in southeastern Alaska. Bryologist 87, 119–127. doi: 10.2307/3243117
Northup, R. R., Dahlgren, R. A., and McColl, J. G. (1998). Polyphenols as regulators of plant-litter-soil interactions in northern California's pygmy forest: a positive feedback? Biogeochem. 42, 189−220. doi: 10.1023/A:1005991908504
Oberson, A., and Joner, E. J. (2005). “Microbial turnover of phosphorus in soil,” in Organic Phosphorus in the Environment, eds B. L. Turner, E. Frossard, and D. S. Baldwin (Cambridge, MA: CABI Publishing), 133–164. doi: 10.1079/9780851998220.0133
O'Halloran, I. P., and Cade-Menun, B. (2008). “Total and organic phosphorus,” in Soil Sampling and Methods of Analysis, 2nd Edn., eds M. R. Carter and E. G. Gregorich (Boca Raton, FL: Canadian Society of Soil Science and CRC Press), 265–291. doi: 10.1201/9781420005271.ch24
Parfitt, R. (1979). The availability of P from phosphate-goethite bridging complexes. Desorption and uptake by ryegrass. Plant Soil 53, 55–65. doi: 10.1007/BF02181879
Parfitt, R. L., Ross, D. J., Coomes, D. A., Richardson, S. J., Smale, M. C., and Dahlgren, R. A. (2005). N and P in New Zealand soil chronosequences and relationships with foliar N and P. Biogeochem. 75, 305−328. doi: 10.1007/s10533-004-7790-8
Parkinson, J., and Allen, S. (1975). A wet oxidation procedure suitable for the determination of nitrogen and mineral nutrients in biological material. Commun. Soil Sci. Plant Anal. 6, 1–11. doi: 10.1080/00103627509366539
Pierzynski, G. M., McDowell, R. W., and Sims, J. T. (2005). “Chemistry and dynamics of soil organic phosphorus,” in Phosphorus: Agriculture and the Environment, eds J. T. Sims and A. N. Sharpley (Madison, WI: American Society of Agronomy), 53–86.
Prescott, C. E., McDonald, M. A., and Weetman, G. F. (1993). Availability of N and P in the forest floors of adjacent stands of western redcedar – western hemlock and western hemlock – amabilis fir on northern Vancouver Island. Can. J. For. Res. 23, 605–610. doi: 10.1139/x93-080
Preston, C. M., and Trofymow, J. A. (2000). Characterization of soil P in coastal forest chronosequences of southern Vancouver Island: Effects of climate and harvesting disturbance. Can. J. Soil Sci. 80, 633–647. doi: 10.4141/S99-073
Quiquampoix, H., and Mousain, D. (2007). “Enzymatic hydrolysis of organic phosphorus),” in Organic Phosphorus in the Environment, eds B. L. Turner R. Frossard, and D. S. Baldwin (Cambridge, MA: CABI Publishing), 89–112. doi: 10.1079/9780851998220.0089
Richardson, S. J., Allen, R. B., and Doherty, J. E. (2008). Shifts in leaf N: P ratio during resorption reflect soil P in temperate rainforest. Func. Ecol. 22, 738–745. doi: 10.1111/j.1365-2435.2008.01426.x
Richardson, S. J., Peltzer, D. A., Allen, R. B., McGlone, M. S., and Parfitt, R. L. (2004). Rapid development of phosphorus limitation in temperate rainforest along the Franz Josef soil chronosequence. Oecologia 139, 267–276. doi: 10.1007/s00442-004-1501-y
Sanborn, P., Lamontagne, L., and Hendershot, W. (2011). Podzolic soils of Canada: Genesis, distribution, and classification. Can. J. Soil Sci. 91, 843–880. doi: 10.4141/cjss10024
Sanborn, P., and Massicotte, H. (2010). A Holocene Coastal Soil Chronosequence: Naikoon Provincial Park, Graham Island, Haida Gwaii: Progress Report. Prince George, BC: University of Northern British Columbia. 53.
Saunders, W., and Williams, E. (1955). Observations on the determination of total organic phosphorus in soils. Eur. J. Soil Sci. 6, 254–267. doi: 10.1111/j.1365-2389.1955.tb00849.x
Schachtman, D. P., Reid, R. J., and Ayling, S. M. (1998). Phosphorus uptake by plants: from soil to cell. Plant Physiol. 116, 447–453. doi: 10.1104/pp.116.2.447
Schneider, K. D., Cade-Menun, B. J., Lynch, D. H., and Voroney, R. P. (2016). Soil phosphorus forms from organic and conventional forage fields. Soil Sci. Soc. Am. J. 80, 328–340. doi: 10.2136/sssaj2015.09.0340
Selmants, P. C., and Hart, S. C. (2008). Substrate age and tree islands influence carbon and nitrogen dynamics across a retrogressive semiarid chronosequence. Global Biogeochem. Cycles 22, 1–13. doi: 10.1029/2007GB003062
Selmants, P. C., and Hart, S. C. (2010). Phosphorus and soil development: does the Walker and Syers model apply to semiarid ecosystems? J. Ecol. 91, 474–484. doi: 10.1890/09-0243.1
Shang, C., Caldwell, D. E., Stewart, J. W. B., Tiessen, H., and Huang, P. M. (1996). Bioavailability of organic and inorganic phosphates adsorbed on short-range ordered aluminum precipitate. Microb. Ecol. 31, 29–39. doi: 10.1007/BF00175073
Shang, C., Huang, P., and Stewart, J. (1990). Kinetics of adsorption of organic and inorganic phosphates by short-range ordered precipitate of aluminum. Can. J. Soil Sci. 70, 461–470. doi: 10.4141/cjss90-045
Singleton, G. A., and Lavkulich, L. M. (1987a). A soil chronosequence on beach sands, Vancouver Island, British Columbia. Can. J. Soil Sci. 67, 795–810. doi: 10.4141/cjss87-077
Singleton, G. A., and Lavkulich, L. M. (1987b). Phosphorus transformations in a soil chronosequence, Vancouver Island, British Columbia. Can. J. Soil Sci. 67, 787−793. doi: 10.4141/cjss87-076
Smith, D. H., and Clark, F. E. (1951). Anion-exchange chromatography of inositol phosphates from soil. Soil Sci. 72, 353–360. doi: 10.1097/00010694-195111000-00004
Smith, D. H., and Read, D. J. (1997). Mycorrhizal symbiosis. 2nd Edn. San Diego, CA: Academic Press. 605.
Soil Classification Working Group (SCWG) (1998). The Canadian System of Soil Classification. 3rd Edn. Ottawa, ON: Agriculture and Agri-Food Canada, 202.
Stevens, P. R., and Walker, T. W. (1970). The chronosequence concept and soil formation. Q. Rev. Biol. 45, 333–350. doi: 10.1086/406646
Stevenson, F. J., and Cole, M. A. (1999). Cycles of Soil: Carbon, Nitrogen, Phosphorus, Sulfur and Micronutrients. New York, NY: Wiley and Sons, Inc., 279–329.
Syers, J. K., and Walker, T. W. (1969). Phosphorus transformations in a chronosequence of soils developed on wind-blown sand in New Zealand. Eur. J. Soil Sci. 20, 57–64. doi: 10.1111/j.1365-2389.1969.tb01554.x
Tate, K., and Newman, R. (1982). Phosphorus fractions of a climosequence of soils in New Zealand tussock grassland. Soil Biol. Biochem. 14, 191–196. doi: 10.1016/0038-0717(82)90022-0
Thompson, C. H. (1981). Podzol chronosequences on coastal dunes of eastern Australia. Nature 91, 59–61. doi: 10.1038/291059a0
Turner, B. L. (2007). “Inositol phosphates in soil: amounts, forms and significance of the phosphorylated inositol stereoisomers,” in Inositol Phosphates: Linking Agriculture and the Environment, eds B. L. Turner, A. E. Richardson, and E. J. Mullaney (Wallingford: CAB International), 186–207. doi: 10.1079/9781845931520.0186
Turner, B. L. (2008). Soil organic phosphorus in tropical forests: an assessment of the NaOH-EDTA extraction procedure for quantitative analysis by solution 31P NMR spectroscopy. Eur. J. Soil Sci. 59, 453–466. doi: 10.1111/j.1365-2389.2007.00994.x
Turner, B. L., Cade-Menun, B. J., Condron, L. M., and Newman, S. (2005). Extraction of soil organic phosphorus. Talanta 66, 294–306. doi: 10.1016/j.talanta.2004.11.012
Turner, B. L., Cade-Menun, B. J., and Westermann, D. T. (2003a). Organic phosphorus composition and potential bioavailability in semi-arid arable soils of the Western United States. Soil Sci. Soc. Am. J. 67, 1168–1179. doi: 10.2136/sssaj2003.1168
Turner, B. L., Condron, L. M., Richardson, S. J., Peltzer, D. A., and Allison, V. J. (2007). Soil organic phosphorus transformations during pedogenesis. Ecosystems 10, 1166–1181. doi: 10.1007/s10021-007-9086-z
Turner, B. L., Condron, L. M., Wells, A., and Andersen, K. M. (2012). Soil nutrient dynamics during Podzol development under lowland temperate rain forest in New Zealand. Catena 97, 50–62. doi: 10.1016/j.catena.2012.05.007
Turner, B. L., and Laliberté, E. (2015). Soil development and nutrient availability along a 2 million-year coastal dune chronosequence under species-rich Mediterranean shrubland in southwestern Australia. Ecosystems 18, 287–309. doi: 10.1007/s10021-014-9830-0
Turner, B. L., Mahieu, N., and Condron, L. M. (2003b). Phosphorus-31 nuclear magnetic resonance spectral assignments of phosphorus compounds in soil NaOH–EDTA extracts. Soil Sci. Soc. Am. J. 67, 497–510. doi: 10.2136/sssaj2003.4970
Turner, B. L., Papházy, M. J., Haygarth, P. M., and McKelvie, I. D. (2002). Inositol phosphates in the environment. Phil. Trans. R. Soc. Lond. B 357, 449–469. doi: 10.1098/rstb.2001.0837
Turner, B. L., and Richardson, A. E. (2004). Identification of scyllo-inositol phosphates in soil by solution phosphorus-31 nuclear magnetic resonance spectroscopy. Soil Sci. Soc. Am. J. 68, 802–808. doi: 10.2136/sssaj2004.8020
Turner, B. L., Wells, A., and Condron, L. M. (2014). Soil organic phosphorus transformations along a coastal dune chronosequence under New Zealand temperate rain forest. Biogeochem. 121, 595–611. doi: 10.1007/s10533-014-0025-8
Ugolini, F. C., and Mann, D. H. (1979). Biopedological origin of peatlands in south east Alaska. Nature 281, 366−368. doi: 10.1038/281366a0
Vincent, A. G., Schleucher, J., Gröbner, G., Vestergren, J., Persson, P., Jansson, M., and Giesler, R. (2013). Changes in organic phosphorus composition in boreal forest humus soils: the role of iron and aluminum. Biogeochem. 108, 485–499. doi: 10.1007/s10533-011-9612-0
Vincent, A. G., Vestergren, J., Gröbner, G., Persson, P., Schleucher, J., and Giesler, R. (2012). Soil organic phosphorus transformations in a boreal forest chronosequence. Plant Soil 367, 149–162. doi: 10.1007/s11104-013-1731-z
Vitousek, P. M., and Farrington, H. (1997). Nutrient limitation and soil development: Experimental test of a biogeochemical theory. Biogeochem 37, 63–75. doi: 10.1023/A:1005757218475
Vitousek, P. M., Porder, S., Houlton, B. Z., and Chadwick, O. A. (2010). Terrestrial phosphorus limitation: mechanisms, implications, and nitrogen–phosphorus interactions. Ecol. Appl. 20, 5–15. doi: 10.1890/08-0127.1
Vitousek, P. M., Turner, D. R., and Kitayama, K. (1995). Foliar nutrients during long-term soil development in Hawaiian montane rain forest. J. Ecol. 76, 712–720. doi: 10.2307/1939338
Walker, T., and Syers, J. K. (1976). The fate of phosphorus during pedogenesis. Geoderma 15:1–19. doi: 10.1016/0016-7061(76)90066-5
Wang, L., Amelung, W., Prietzel, J., and Willbold, S. (2019). Transformation of organic phosphorus compounds during 1500 years of organic soil formation in Bavarian Alpine forests – a 31P NMR study. Geoderma 340, 192–205. doi: 10.1016/j.geoderma.2019.01.029
Wardle, D. A., Walker, L. R., and Bardgett, R. D. (2004). Ecosystem properties and forest decline in contrasting long-term chronosequences. Science 305, 509–513. doi: 10.1126/science.1098778
Wardle, D. A., Zackrisson, O., Hörnberg, G., and Gallet, C. (1997). The influence of island area on ecosystem properties. Science 277, 1296–1299. doi: 10.1126/science.277.5330.1296
Weyers, E., Strawn, D. G., Peak, D., Moore, A. D., Baker, L. L., and Cade-Menun, B. J. (2016). Phosphorus speciation in calcareous soils following annual dairy manure amendments. Soil Sci. Soc. Am. J. 80, 1531–1542. doi: 10.2136/sssaj2016.09.0280
Wood, T. E., Bormann, F. H., and Voigt, G. K. (1984). Phosphorus cycling in a northern hardwood forest: biological and chemical control. Science 223, 341–393. doi: 10.1126/science.223.4634.391
Keywords: P-NMR, organic phosphorus, podzolization, forests, western red cedar, western hemlock
Citation: Nelson L-A, Cade-Menun BJ, Walker IJ and Sanborn P (2020) Soil Phosphorus Dynamics Across a Holocene Chronosequence of Aeolian Sand Dunes in a Hypermaritime Environment on Calvert Island, BC, Canada. Front. For. Glob. Change 3:83. doi: 10.3389/ffgc.2020.00083
Received: 27 February 2020; Accepted: 15 June 2020;
Published: 23 July 2020.
Edited by:
Friederike Lang, University of Freiburg, GermanyCopyright © 2020 Nelson, Walker, Sanborn, and Her Majesty the Queen in Right of Canada, as represented by the Minister of Agriculture and Agri-Food Canada. This is an open-access article distributed under the terms of the Creative Commons Attribution License (CC BY). The use, distribution or reproduction in other forums is permitted, provided the original author(s) and the copyright owner(s) are credited and that the original publication in this journal is cited, in accordance with accepted academic practice. No use, distribution or reproduction is permitted which does not comply with these terms.
*Correspondence: Barbara J. Cade-Menun, barbara.cade-menun@canada.ca