Small-Area Estimation for the USDA Forest Service, National Woodland Owner Survey: Creating a Fine-Scale Land Cover and Ownership Layer to Support County-Level Population Estimates
 Vance Harris
 Jesse Caputo
 Andrew Finley
 Brett J. Butler1,2*
 - 1Department of Environmental Conservation, Family Forest Research Center, University of Massachusetts Amherst, Amherst, MA, United States
- 2United States Department of Agriculture, Northern Research Station, Forest Service, Amherst, MA, United States
- 3Department of Forestry, College of Agriculture and Natural Resources, Michigan State University, East Lansing, MI, United States
Small area estimation is a powerful modeling technique in which ancillary data can be utilized to “borrow” additional information, effectively increasing sample sizes in small spatial, temporal, or categorical domains. Though more commonly applied to biophysical variables within the study of forest inventory analyses, small area estimation can also be implemented in the context of understanding social values, behaviors, and trends among types of forest landowners within small domains. Here, we demonstrate a method for deriving a continuous fine-scale land cover and ownership layer for the state of Delaware, United States, and an application of that ancillary layer to facilitate small-area estimation of several variables from the USDA Forest Service’s National Woodland Owner Survey. Utilizing a proprietary parcel layer alongside the National Land Cover Database, we constructed a continuous layer with 10-meter resolution depicting land cover and land ownership classes. We found that the National Woodland Owner Survey state-level estimations of total acreage and total ownerships by ownership class were generally within one standard error of the population values calculated from the raster layer, which supported the direct calculation of several population-level summary variables at the county levels. Subsequently, we compare design-based and model-based methods of predicting commercial harvesting by family forest ownerships in Delaware in which forest ownership acreage, taken from the parcel map, was utilized to inform the model-based approach. Results show general agreement between the two modes, indicating that a small area estimation approach can be utilized successfully in this context and shows promise for other variables, especially if additional variables, e.g., United States Census Bureau data, are also incorporated.
Introduction
Of the approximate 816 million acres of forestland in the United States, private land ownership accounts for an estimated 56% (Butler et al., 2021). Therefore, understanding private land ownership attitudes and behaviors is fundamental to successfully cultivating socially positive land stewardship practices (Kumer and Štrumbelj, 2017; Mozgeris et al., 2017; Sotirov et al., 2019; Butler et al., 2021). Private forest landowners consist of “forest industry companies, other businesses or corporations, partnerships, tribes, families, and individuals” (Butler and Leatherberry, 2004) according to the National Woodland Owner Survey (NWOS). However, dynamic heterogeneity in attitudes and behaviors, both within and between private ownership classes, require robust datasets and appropriate models to accurately differentiate trends in ownership typologies (Kumer and Štrumbelj, 2017; Sotirov et al., 2019). Efforts to conduct high resolution ownership analyses have historically been thwarted due to a lack of sufficient data (Sotirov et al., 2019). Low sampling sizes generated from the results of these surveys cause problems such as low statistical power, inflated effect estimations and poor replicability. Low sample sizes also require that population estimates be calculated within relatively large spatial domains (nationwide, regional or state-level) in order to ensure sufficient levels of precision.
Traditional mechanisms for understanding forest ownership behavior are through social surveys via mail, phone, or the internet (Kumer and Štrumbelj, 2017; Sotirov et al., 2019; Butler et al., 2021). In the United States, the NWOS, a product of the United States Department of Agriculture, Forest Service Forest Inventory and Analysis (FIA) Program, is the official survey aimed at increasing understanding regarding private forest owners (Butler et al., 2021). The target sample size for the NWOS is 250 responses per geographic unit, based on a target coefficient of variation of 5% (Butler and Caputo, 2021). In practice, however, the NWOS reporting protocol allows for published estimates for geographic regions with at least 100 responses. This lower target is always met at the regional level and for most states (Butler et al., 2021), but rarely at the sub-state or county level. This level of analysis is not always sufficient to make programmatic or policy decisions, such as for forestry assistance programs, at the county or sub-state scale.
To compensate for the low sample size at the sub-state level and to allow for accurate, precise estimation of NWOS attributes at finer scales, this pilot effort focuses on the development of a parcel-level land cover and ownership layer for use in small area estimation. Small area estimation (SAE) refers generally to approaches for making population-level estimates within small domains for which sample sizes are deemed inadequate to produce estimates of acceptable precision using traditional design-based techniques. This umbrella term refers to a number of methods that rely on ancillary data sources in order to “borrow” additional information, increasing the effective sample size – and consequently, the precision of the estimates – for the selected domain. In particular, model-based small area estimation techniques can deliver rich inference – especially when compared to traditional design-based approaches. Design-based and model-based modes of inference have long been contrasted in survey research (Little, 2004). Design-based inference automatically accounts for the survey design but has limited ability to leverage ancillary information and deliver precise estimates for small sample sizes (i.e., small area estimates). On the other hand, model-based inference must explicitly consider the design and data jointly, but can use ancillary information and borrow from the rich modeling literature to deliver robust inference for small samples sizes. Within the model-based realm, Bayesian methods provide additional flexibility in model specification and inference (Ghosh and Meeden, 1997; Rao, 2011; Chen et al., 2017). Small area estimation is an increasingly important tool for forest inventory analyses (Breidenbach et al., 2020). To date, however, most efforts have focused on estimation of biophysical variables (Breidenbach and Astrup, 2012; Goerndt et al., 2019; Green et al., 2020). An equal need, however, exists for precise estimates of ownership attributes within small domains, especially small (i.e., sub-state) spatial domains.
As part of the NWOS efforts, forest ownership spatial products have been periodically released (Hewes et al., 2014; Sass et al., 2020). Updates to these map layers have incorporated newer information and increasing resolution of forest ownership categories. These spatial products have used a Thiessen polygon approach based on FIA plot and ancillary data to produce wall-to-wall coverage of forest ownership across the conterminous United States (Butler et al., 2014). This technique is acceptable for strategical level analyses and visualization of broad ownership patterns, but it cannot be used for tactical level analyses or any applications where a high level of spatial precision is required. Although spatial layers such as these are potentially rich sources of ancillary data for small area estimation efforts, the current suite of NWOS-derived spatial products do not have the needed level of accuracy or resolution for this purpose.
There are two primary goals in this pilot study: (1) to produce a spatial layer that accurately depicts land cover and ownership classes that are compatible with FIA land classes at a fine resolution (i.e., at the parcel scale), and which result in summary statistics compatible with FIA and NWOS results, and (2) demonstrate the utility of the ownership layer as an input in model-based estimation to produce small domain (e.g., county-level) estimates of the proportion of ownerships engaging in commercial harvesting as good as or better than those produced using the standard NWOS methodology. For the focus of this initial pilot, we decided for operational efficiency to focus on a state that is small and has complete DMP coverage. For that reason, we confined our analysis to the state of Delaware, United States. Although Delaware is not state in which forests and forestry are traditionally seen as important, more than 50% of the state is forested and more than 40% of family forest landowners have harvested sawlogs, firewood, or other forest products (Butler et al., 2021).
Materials and Methods
Land Cover and Ownership Layer
To date, NWOS results have primarily been reported for family forest ownerships (FFOs) – families, trusts, individuals, estates, and family partnerships which own forestland (Butler et al., 2021). Ownerships are defined as groups of one or more owners that jointly own one or more forested parcels. FFOs are defined as ownerships owning at least one acre of forest, with forest defined as forested “…land that has at least 10 percent crown cover by live tally trees of any size or has had at least 10 percent canopy cover of live tally species in the past, based on the presence of stumps, snags, or other evidence.” (USDA Forest Service, 2016). For comparison’s sake, the primary emphasis of this study will also be on FFOs. Summary results include estimates of number of ownerships, acreage, and size of holdings. Figure 1 illustrates the approach taken to generate these estimates and is further described in this section. However, an additional goal of this study is to generate these estimates for all ownership classes in addition to FFOs, including public, corporate, and other private ownerships. This is possible due to the application of a secondary dataset developed by Digital Map Products Lightbox™ (DMP) [Digital Map Products (DMP), 2021]. This proprietary data includes ownership information at the parcel scale across the United States, including parcel boundaries and owner name and address information. This data is aggregated from individual sources at the state, county, and local levels and represents a standardized continuous vector layer for analysis. Although several state agencies publish parcel-level landcover maps, no non-proprietary layers exist nationwide. Within the scope of this work, both address and name data can be utilized to classify individual parcels to the FIA ownership classes. For this study, we used data for the state of Delaware, nominally current as of 2020.
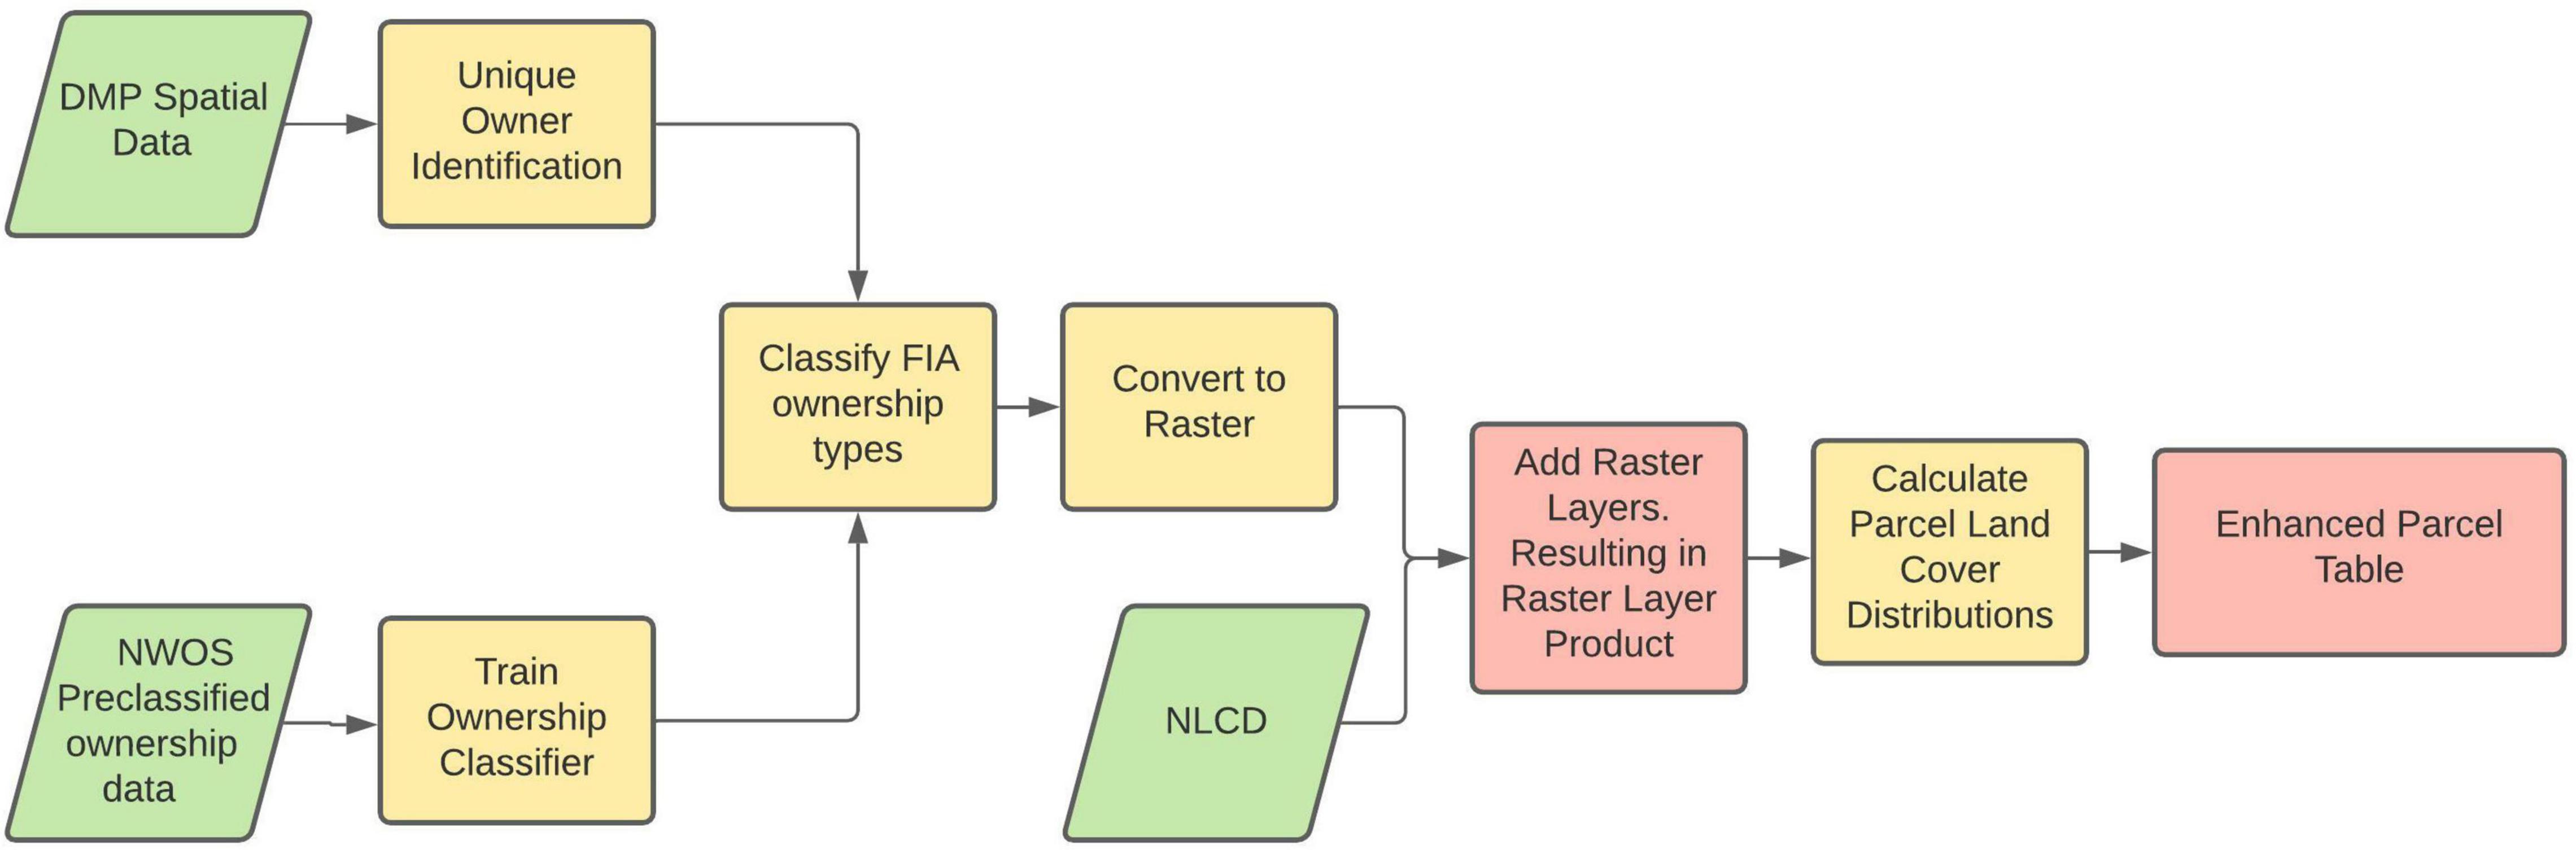
Figure 1. Logic flow chart illustrating the process of creating a land cover and ownership spatial layer, from NLCD and a parcel ownership polygon layer.
To calculate the number of unique ownerships within the DMP data, multiple instances of the same ownership associated with two or more parcels needed to be identified. Ownerships were identified and matched utilizing name and address data. Names were transformed into a standardized format to reduce effects such as misspellings, additional/missing name elements and similar erroneous influences. To account for differences in reporting practices, consideration for the type of owners was needed. Individual/family ownerships were isolated and processed differently than those of other legal ownership entities. This was primarily done to enhance the individual/family ownership matches by incorporating home address data, whereas another legal entity (such as a corporate owner) might have multiple mailing addresses associated with local/regional offices of the same company and were therefore matched on name alone. In order to prevent parents and children with similar names living at the same address from being erroneously identified as the same individual, generational suffixes (e.g., Jr, II, etc.) were used to split otherwise very similar names and ensure identification of multiple unique ownerships.
The primary tool used to match records by ownerships names was utilizing a reference table populated with every record and a phonetic code associated with the ownership names. The phonetic codes were generated via the Python package DoubleMetaphone (Philips et al., 2007). Utilizing this package, the text-based name data were converted to their phonetic spelling and reduced to their key phonetic elements.1 Each record’s code was written into a reference table, in which all records with the same phonetic spelling were linked. In the case of the individual/family owners, the dataset was first grouped into records with the same home address. From there the names were coded into internal reference tables to match names only within the subgrouping. Once unique IDs were generated, ownership data can be associated with all their relevant parcels. In this manner, for example, total size of forest holdings could be calculated at the ownership level.
The next phase of the analysis was to determine the ownership classes according to the FIA ownership typology (Family, Corporate, Other Private, and Public and Tribal). Both logical classification criteria and a machine learning model (hereto referred as the classification model) were implemented to build upon previously established FIA manual classification methodologies. As a training set, we used a portion of the sample from the 2018 iteration of the NWOS (Butler et al., 2021). All records (n = 8,862) used originally came from the same commercial vendor (DMP lightbox) as the data for the current study and were therefore in a very similar format. All records had been manually classified using the FIA classification. This training set was also preprocessed through the same name standardization methods mentioned earlier, in order to preserve consistency.
The logical classification stage was used to affix ownership classes if known conditions were met, thereby capitalizing on known elements within the ownership names. Primarily these conditions included the presence of keywords or language associated with the FIA ownership classes (e.g., “Revocable trust” or “Living trust” for family owners; “Authority” or “Maintenance” for corporate, etc.). Additionally, keyword searches were implemented in a ordered manner in which searches were given different levels of priority. If records were classified in one search, then they would not be classified in subsequent searches. Delaware has no tribal reservations, and the tribal category was therefore omitted from this analysis. After the logical classification, the remaining unclassified records were then isolated and passed through a classification model.
The classification model was fit to the training set, and implemented using Python’s scikit-learn package (Pedregosa et al., 2011) and similarly utilized individual elements in the ownership names as opposed to the name in its entirety. The metric Term Frequency-Inverse Document Frequency (TF-IDF) was utilized to score every name element in the training set to determine every word’s association with all other words in the dataset. Identifying impactful (i.e., highly associated) words allows for more robust data to be utilized in the training of the ML model. A random forest classification model was selected for its computational speed and its predictive accuracy.
Before passing the unclassified dataset through the resulting model, this data needed to undergo the same TF-IDF computations as the training set. The full, unclassified dataset was substantially larger than the training set and contained more unique words, therefore, only the words which appeared in the training set were selected as independent variables. The unclassified records were then passed through the classification model and FIA ownership class assignments were then available for all records. In these procedures, we attempted to replicate as closely as possible the guidelines that are used for deduplication and classification of the NWOS sample (Butler et al., 2021).
The next phase was to determine the land cover types associated with each parcel. The National Land Cover Database (NLCD) (Dewitz, 2019) 30-meter land cover raster data was utilized here. In order to efficiently join the two data types, the vector-based DMP parcels were converted to a raster with a 10-meter resolution based on the unique Parcel ID field ranging from 1 to 423051. 10 meters allowed for the joining of the two rasters without dropping the smaller parcels. The NLCD data was resampled to a 10-meter resolution. The original 15 land cover classes were reclassified to a numeric label ranging from 100,000,000 (Open Water) to 900,000,000 (Mixed Forest). The larger integer classification allows the Parcel ID values to be appended and preserve both pieces of information in an aspatial format (i.e., parcel[420000] + Deciduous Forest[700000000] = 700420000).
Once achieved, the unique Parcel IDs were utilized to aggregate all pixels and their associated land cover types to each parcel. Total occurrences of each NLCD land cover class within a parcel were divided by the total parcel pixels to determine the percent coverage of each land cover class. We also merged the NLCD classes into a simplified three-class typology, to correspond to the FIA land use classification. Of the 15 original NLCD classes, four (Deciduous Forest, Evergreen Forest, Mixed Forest, and Woody Wetlands) are representative of the FIA-defined “forest” class, one corresponded to “open water”, and the remaining 10 corresponded to “non-forest”. Although, strictly speaking, FIA is measured and reported in terms of land use instead of land cover, these four NLCD classes have been determined to correspond adequately to the FIA definition of forest use (Nelson et al., 2020).
The final products include a raster layer in which both ownership and land cover are encoded at the level of the individual pixel, and an enhanced parcel table in which each row represents a single parcel, with parcels assigned ownership IDs allowing for aggregation across ownerships. This last product includes the calculated values for total acreage and acreage by land cover type. By aggregating across this table, we can directly calculate several population-level summary variables at the state or county levels, including the number of forest acres, ownerships, and parcels. In this paper, we focused on forest ownerships owning one or more acres – and in particular on family forest ownerships owning one or more acres. This corresponds to one of the primary strata/domains used for reporting NWOS results (Butler et al., 2021).
Custom National Woodland Owner Survey Estimates
Using the standard NWOS methodology for deriving population-level estimates (Butler and Caputo, 2021; Butler et al., 2021), we estimated statewide and county-level estimates of the total number of FFOs, total FFO acreage, mean size-of-holdings, and total acreage owned by ownerships who have undertaken commercial harvest in the past 5 years (all at the 1+ acre domain). These estimates provide a benchmark comparison to summary variables calculated either directly or indirectly (i.e., through estimation) from the parcel table. It is important to note that there is a small temporal scale mismatch between the DMP data (which are nominally current as of 2020) and the NWOS data (which were collected in 2017/2018), but this magnitude of this mismatch is assumed to be negligible relative to the rate of change inherent to land ownership.
Small Area Estimation
To illustrate the utility of model-based inference, we first developed state- and county-level estimates of a simulated, non-specific response variable, derived for each of the population units (i.e., ownerships) enumerated in the parcel map. We limited our population to FFOs within Delaware holding at least one acre of forest land. The simulated response variable is binary and non-specific, and can be thought of as representing a hypothetical binary attribute of interest (such as, for example, do landowners have forest management plans? Or do landowners hunt on their land?). We help inform these estimates using the county in which an ownership is situated as well as an ownership’s size-of-holdings, defined as the total acreage of forested land owned by the ownership within the state (as derived from the parcel layer). We first undertook a simple simulation exercise, in which a simple random sample of ownerships was taken from the parcel layer and the simulated response variable was simulated for each. This simulation exercise allows us to compare model-based and design-based estimation methods against a known population, in order to demonstrate their utility and justify their subsequent use in making small-area estimates using NWOS data
Model-based inference about a finite population based on a probability sample can be viewed as a prediction problem. Parameters in the posited model are estimated using sample data and subsequently used to predict the response for the unobserved population units (i.e., those not included in the sample). Following Bayesian methods, we estimated the posterior distribution of model parameters and posterior predictive distribution for unobserved population units. The survey design used to select sampling units determines if and how the design is acknowledged in the posited model. Here, we assume a stratified simple random sampling (SRS) design that allows design components to be ignored in the modeling (see, e.g., Gelman et al., 2013).
Given the binary response, availability of covariates from the parcel map, and focus on county-level estimates, a natural model would be a logistic regression with county specific intercept and regression coefficients. We modeled the non-specific, binary response variable yij, where i and j index ownership and county, respectively, using a Bernoulli distribution and logit link function as
where, pij is the probability of the non-specific response variable being true for an ownership,xij is the total size-of-forest-holdings owned by that ownership, β0j is the county-specific intercept, and βj is the regression coefficient. To pool sample information, we modeled the normally distributed coefficients as
with means μ and variances σ2. To complete the Bayesian specification, we assigned noninformative prior distributions to all model parameters. We refer to this as the full model. For comparison, we also consider a sub model that includes only the county-varying intercept without the forest ownership acreage covariate.
The simulation exercise compares design- and model-based inference for data similar to that collected in the NWOS. The study generated a realization of yij’s for all population units using the full model and parameter values provided in Table 2. From this population we drew a simple random sample of size n = 167 (which is the sample size of the most recent NWOS survey of Delaware). The number of sampling units within each county was proportional to the number of population units in that county. Given this sample, county and state estimates were generated using the sub model, full model, and design-based stratified estimator. The design-based estimator for proportions, given a stratified simple random sample, is defined in Lohr (1999). The sub and full models were compared using the widely applicable information criterion (WAIC; Watanabe, 2010). This criterion favors models with better fit to observed data while penalizing models by their effective number of parameters (Pw). Models with lower values WAIC have better fit to the observed data and should yield better out-of-sample prediction, see Gelman et al. (2013), Vehtari et al. (2017), or Green et al. (2020) for more details.
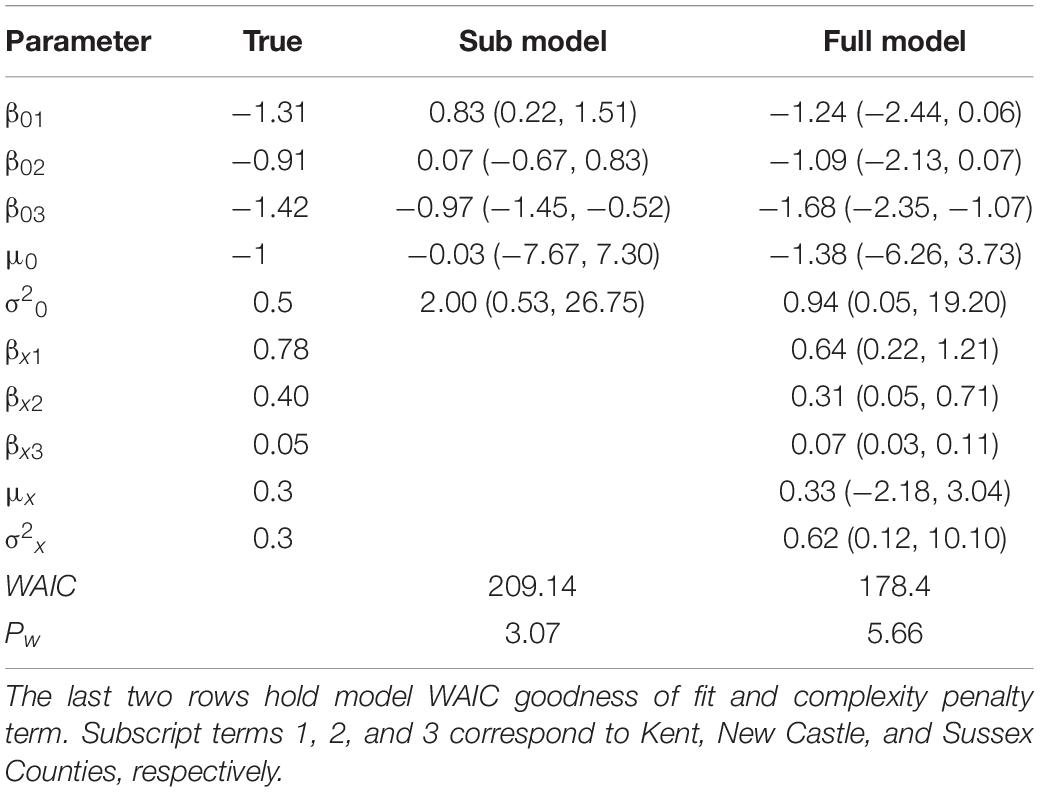
Table 2. Simulated data parameters (True) and candidate models’ posterior distribution median and lower and upper 95% credible intervals in parentheses.
After assessing the results of the simulation exercise and affirming the suitability of model-based estimation in this case, we fit additional models (equivalents of both the full and sub models) to the actual 2018 NWOS sample for Delaware (Butler et al., 2021) in place of the simulated sample. The observational units of the NWOS are individual ownerships and survey responses apply to all parcels owned by each ownership. Survey responses include measurements of ownerships’ size-of-holdings as well as the measured response variable, occurrence of commercial harvest. This variable is binary, coded one if harvest occurred on an ownership’s holdings within the past 5 years and 0 otherwise. We then estimated the proportion of family forest ownerships (1+ acres) who undertook commercial harvests, by using these models to predict harvest occurrence for each of the unobserved parcels in the complete parcel layer. We then compared these estimates to estimates produced using the standard NWOS methodology and the same raw data. These estimates were used as a point-of-comparison in place of the SRS that was used for that purpose in the simulation exercise, as the NWOS sample does not use an SRS design (Butler et al., 2021). All estimation was done using R (R Core Team, 2019).
Results and Discussion
Land Use and Ownership Layer
Per the intent of the first goal of this study, Figure 2 represents the layer for the state of Delaware United States that accurately depicts land cover and ownership classes that are compatible with FIA land classes at a 10-meter resolution.
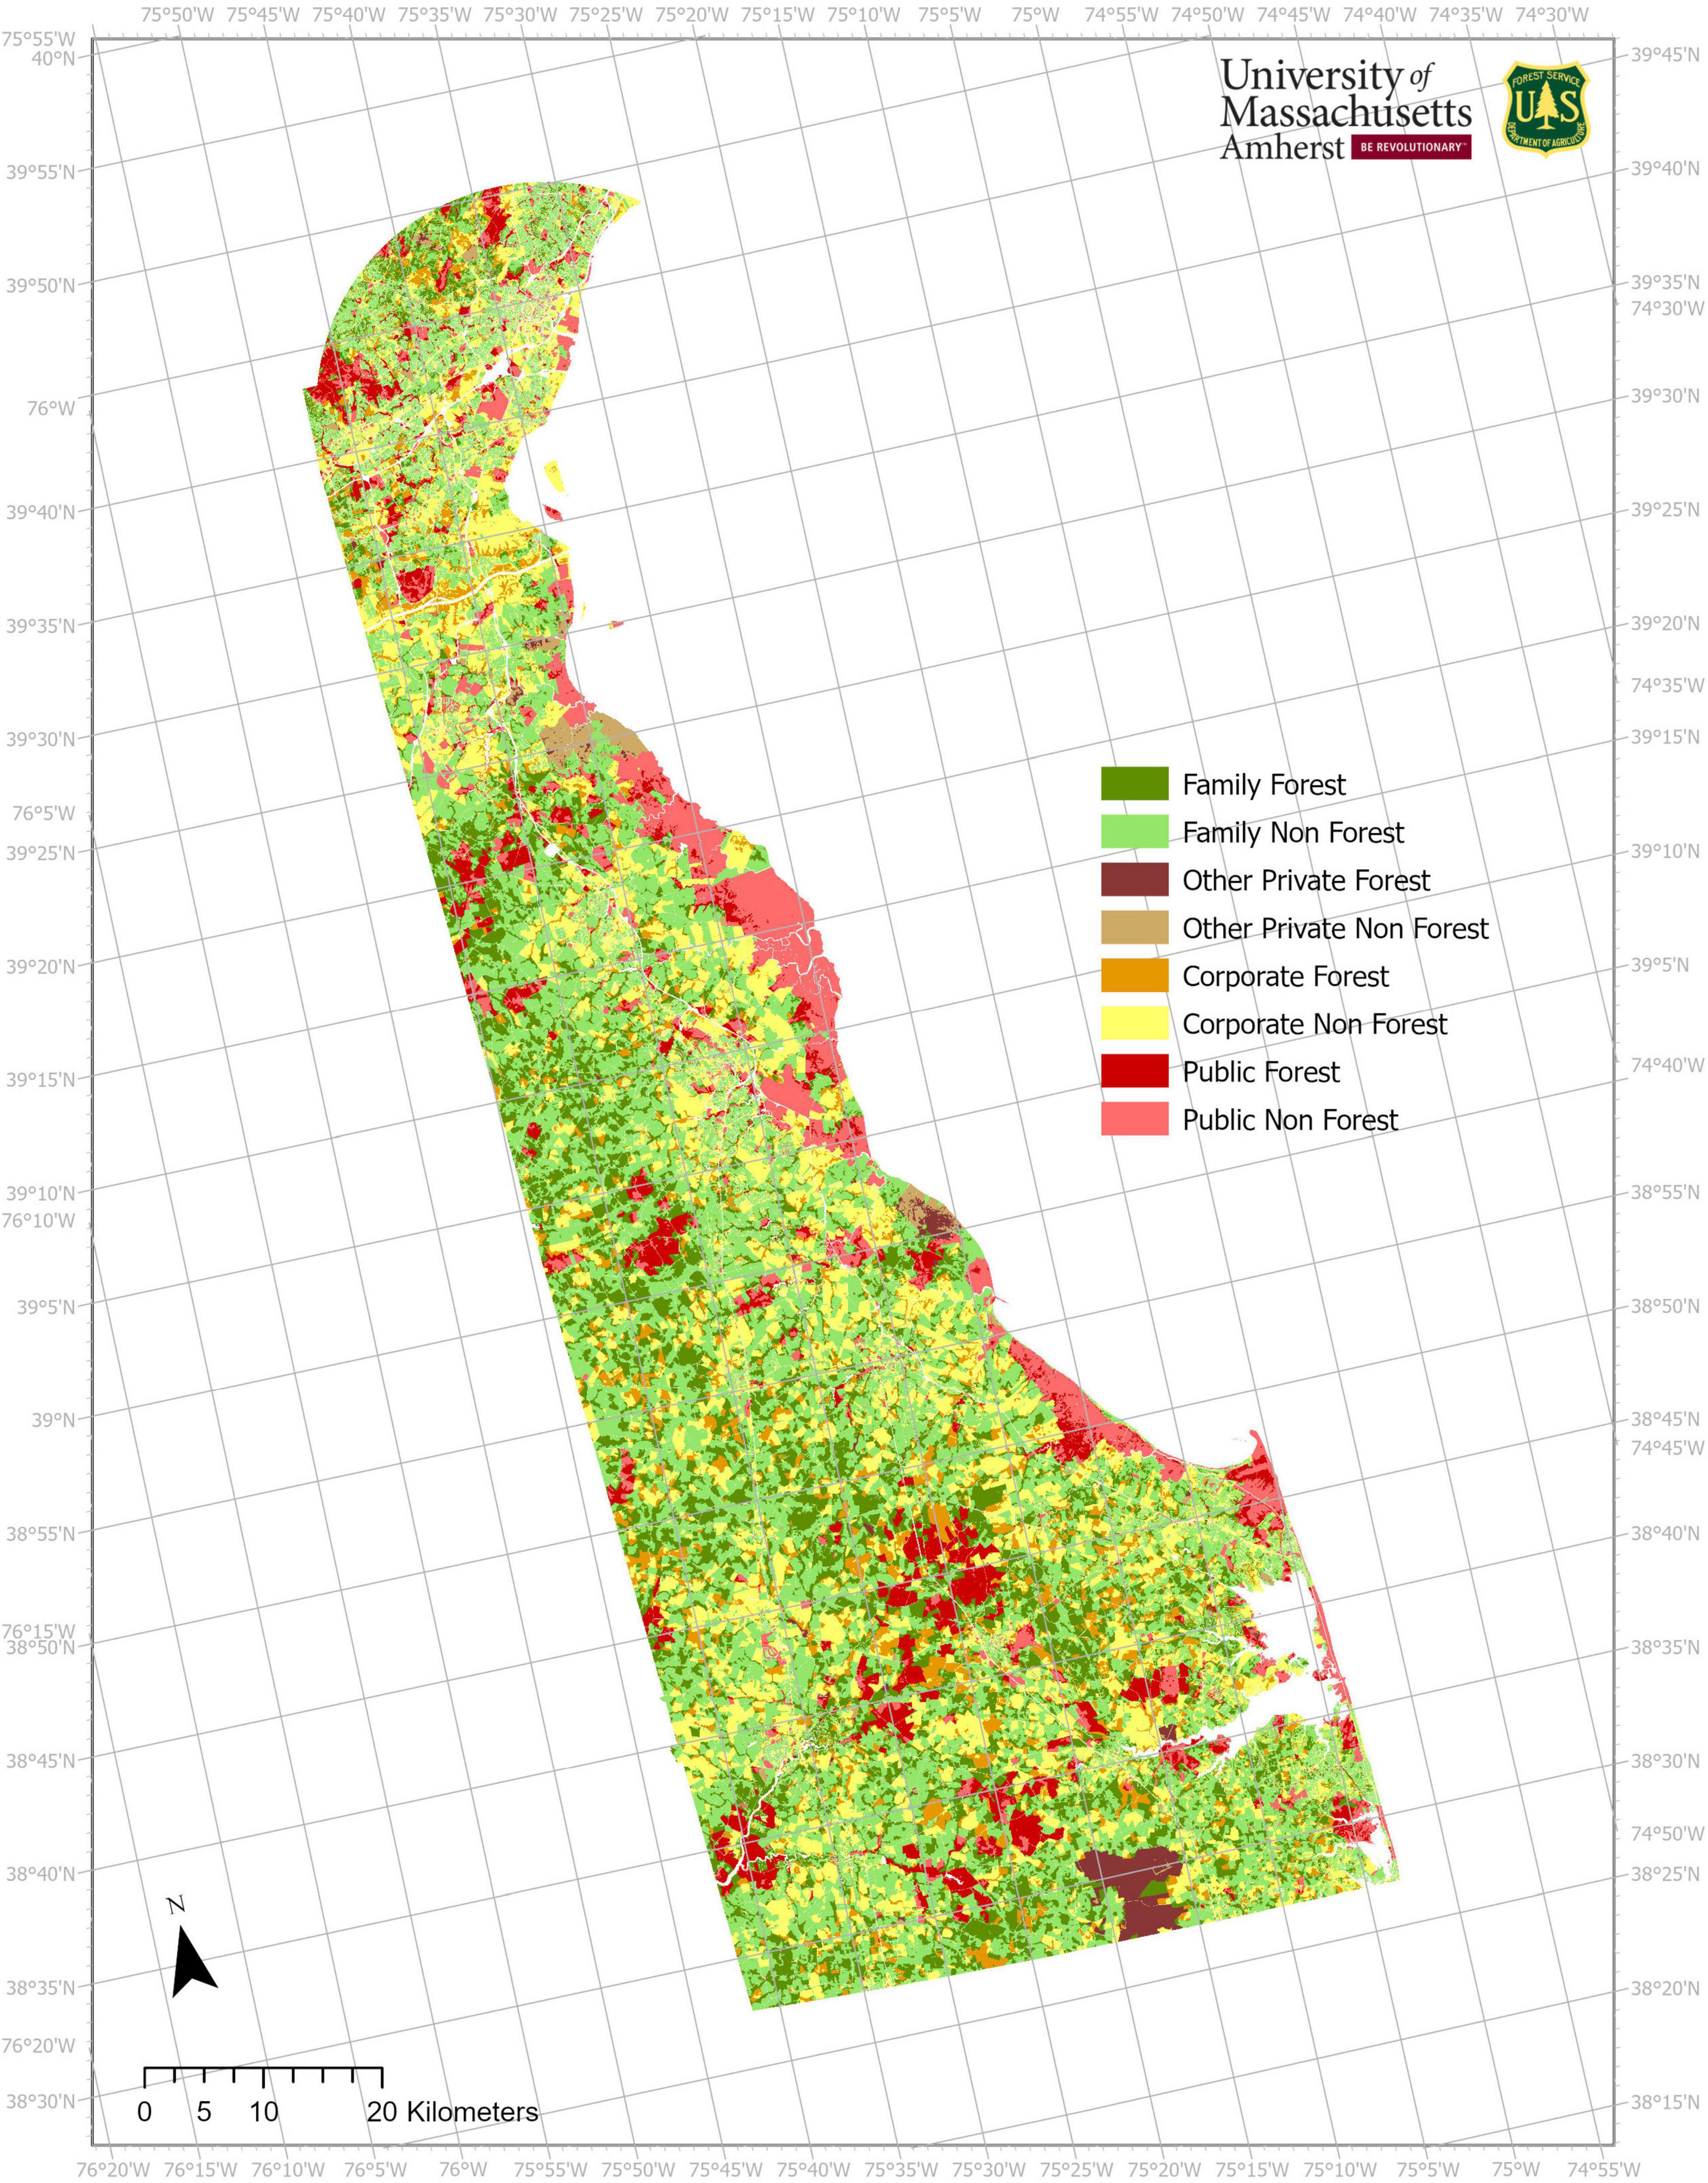
Figure 2. Distribution of ownership classes by forest/non-forest land cover. Delaware, United States, 2020.
A cross-validation approach was utilized to assess the Ownership Classification model accuracy. The training dataset was split into a fitting set (80%, n = 7090) and a testing set (20%, n = 1772). The model was trained using the fitting set and was applied to the testing set in order to generate a predictive classification. The testing set’s actual classification was compared to the predicted classification and yielded a measure of weighted accuracy of approximately 96%. This error metric only accounts for the specific variability introduced in this ownership classification phase and does not address the accuracy of the entire study as a whole.
At a 10-meter resolution, the final layer had a total of 48.6 million pixels. Forested pixels make up 32.3% of the total area, with family forest being the largest share -- 17.1% of the total pixels. The other 67.7% consists of non-forest including developed land, agriculture, barren land, shrubland and the like. Public roads and open water are represented by null values. Most non-forest land is family (36.0%) or corporate (22.2%), followed by public (8.4%) and other private2 (1.1%).
Among forest ownerships with one or more acres, the predominant type of ownership is family, accounting for 192.1 thousand acres (Table 1). The published NWOS estimate of this value (198 thousand acres, SE = 13; Butler et al., 2021) is within one standard error of the “true” value represented by the parcel table. Likewise, the published estimates of the acreages owned by public and other private entities are within one standard error of the true population values. The largest discrepancy is with corporate ownerships; the published estimate of 68 thousand acres (SE = 13) is more than two standard errors less than the true population value, 94.6 thousand acres. Delaware’s family forests are owned by 17.7 thousand unique family forest ownerships. Family forest owners own on average a mean of 1.4 parcels and a mean of 10.9 acres of forest land. Standard estimates of the total number of ownerships and mean size-of-forest-holdings calculated using the published NWOS methodology (18.4 thousand total ownerships, SE = 2.9; mean size-of-forest-holdings = 10.7 acres, SE = 2.0) are within one standard error of the population values.
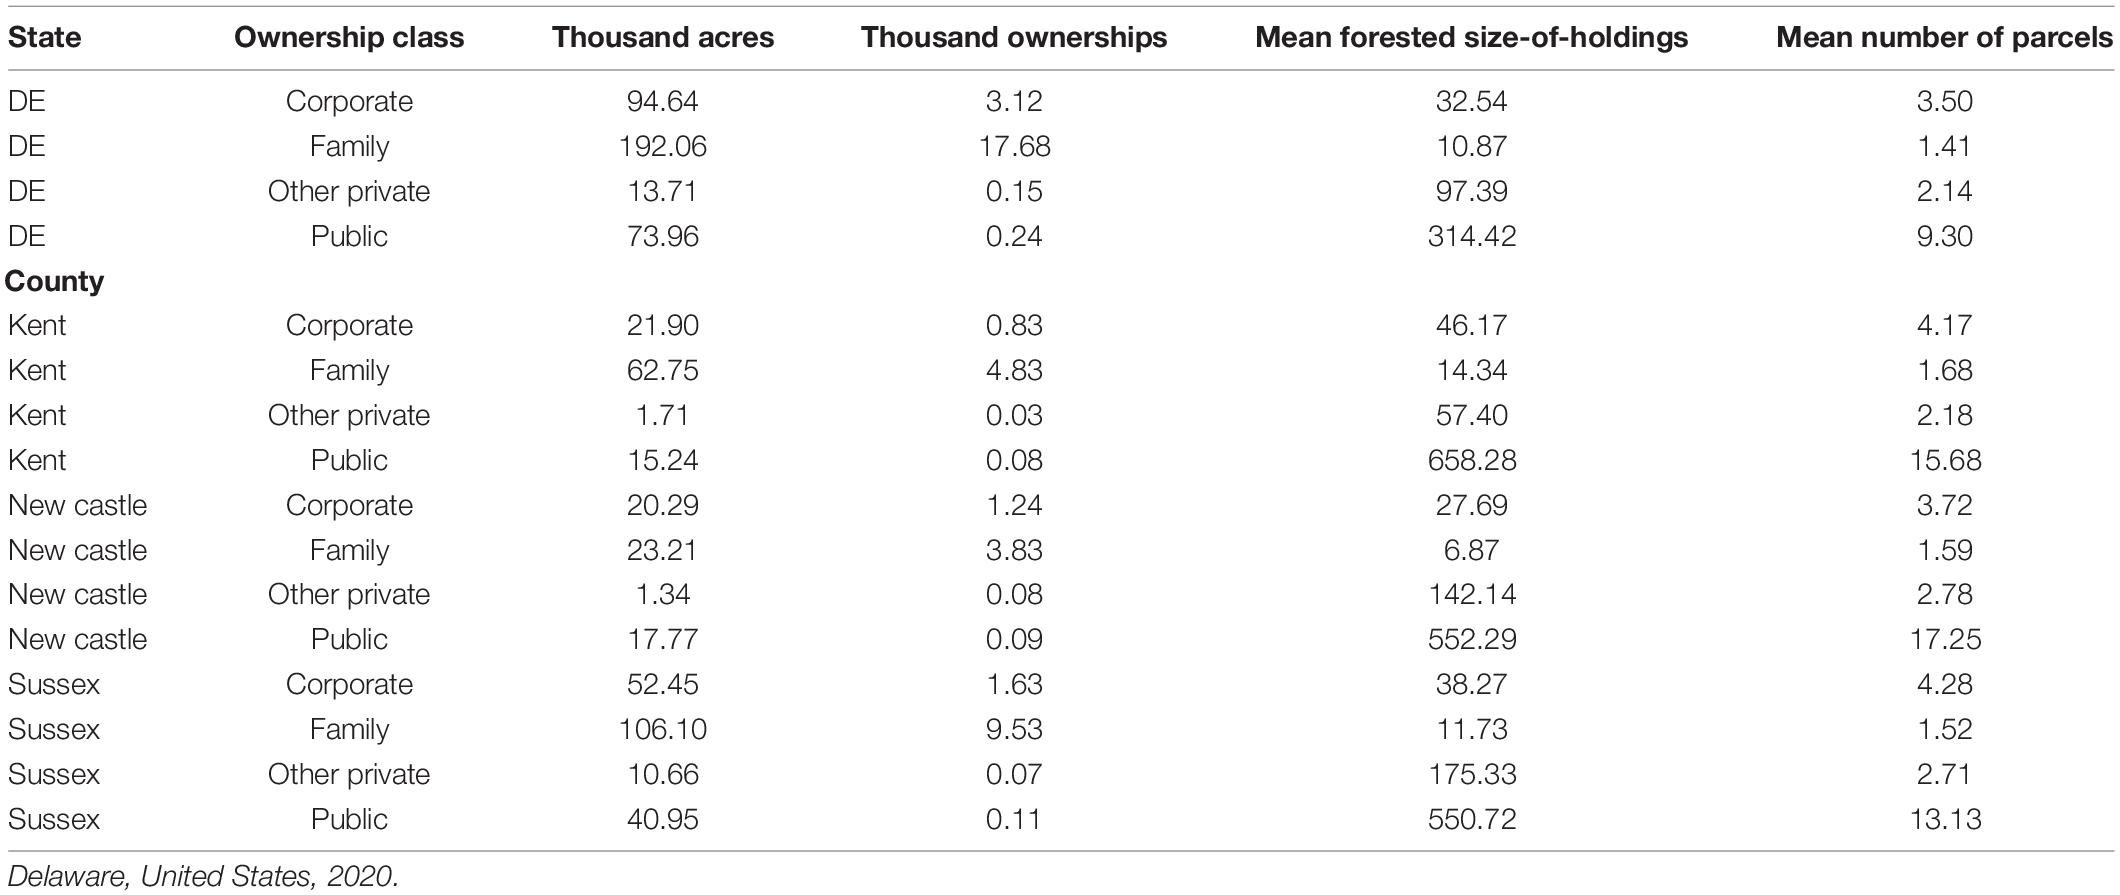
Table 1. Total number of ownerships, total acreage, mean size of forest holdings, and mean number of forested parcels, by Ownership Class, statewide and by counties, as derived from a state-wide ownership and land use map.
The greatest proportion of FFO acreage and ownerships is found in Sussex County, followed by Kent and New Castle Counties (Table 1). Total FFO acreage ranges from 23.2 to 10.6 thousand acres, and in all cases the standard estimates are within one standard error of the true population values. Total numbers of FFOs range from 3.8 to 9.5 thousand ownerships. In Kent and New Castle Counties, the estimates are within one standard error of the population totals. In Sussex County, they are not. The mean size-of-forest-holdings ranged from 6.9 acres in New Castle County to 14.3 acres in Kent County. In all but Sussex County, the standard estimates are within one standard error of the population level. Given the smaller sample sizes, it is not surprising that the county-level standard estimates are less accurate relative to the population levels as compared with the state-wide estimates. All counties have a sample size of less than 100, a standard adopted in NWOS reporting as an indicator of reliability (Butler et al., 2021).
Small Area Estimation
The true parameter values used to generate the simulated population along with their associated estimates from the sub and full models are provided in Table 2. Given the full model is the model used to generate the population data, it is reassuring that all posterior 95% credible intervals capture their respective True parameter values. Further, the WAIC given in the second to last row in Table 2 correctly identifies the full model as the most plausible for the given data.
The true values and estimates for the proportion of ownerships associated with the simulated response variable are given in Table 3. The values in this table show negligible differences among design-based and model-based estimates. Also, while the interpretation of the design-based confidence interval and Bayesian model-based credible intervals is fundamentally different, they both reflect approximately the same level of uncertainty. Theoretically, given some conditions and parameter prior specifications, the sub model can be shown to replicate the design-based estimate (Ghosh and Meeden, 1997), and it is therefore not surprising their parameter estimates are so similar. Compared with the design-based and sub model, the full model yields slightly narrower credible interval estimates, reflecting the additional information provided by the covariate.
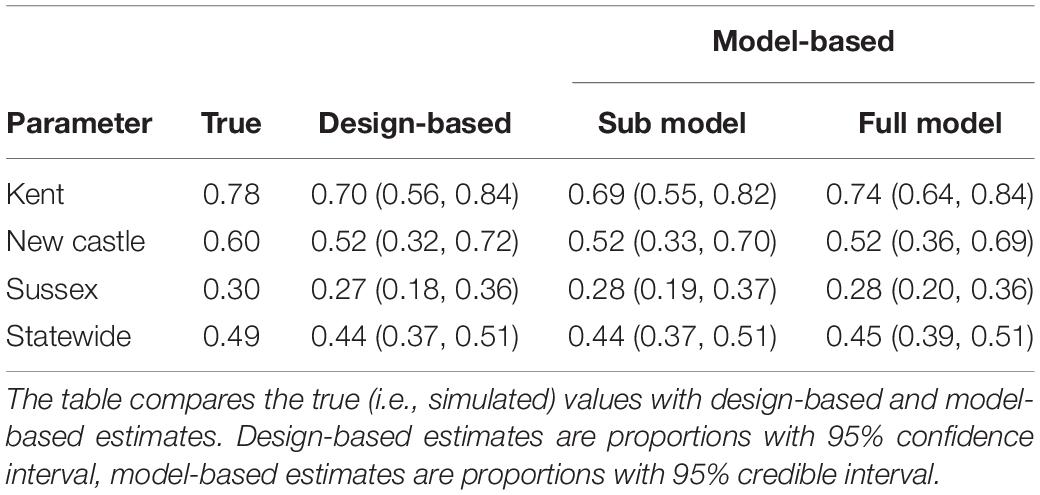
Table 3. County and state-wide proportions of family forest landowners in Delaware, United States, associated with a simulated, non-specific attribute.
Based on the results of the simulation exercise, we feel confident that the model-based estimators are sufficiently accurate, precise, and unbiased for use in making estimates of NWOS attributes at the county-level. Consequently, we adopted the full model as the preferred model for making estimates of the measured response variable, commercial harvest. While population parameter estimates at various levels are our main interest, the model-based approach does offer additional insights into the relationship between the response and covariates. For example, Figure 3 summarizes the county-level relationship between commercial harvest variable and the number of acres owned by an ownership as predicted by the full model. In all three counties, the probability of commercial harvest sharply increases with the total amount of forested land owned by an ownership. This probability approaches 1.0 at about 1,000 acres in both Kent and New Castle Counties, but not until ∼2500 acres in Sussex County. Such information can be useful when designing further survey instruments and guiding outreach/policy efforts.
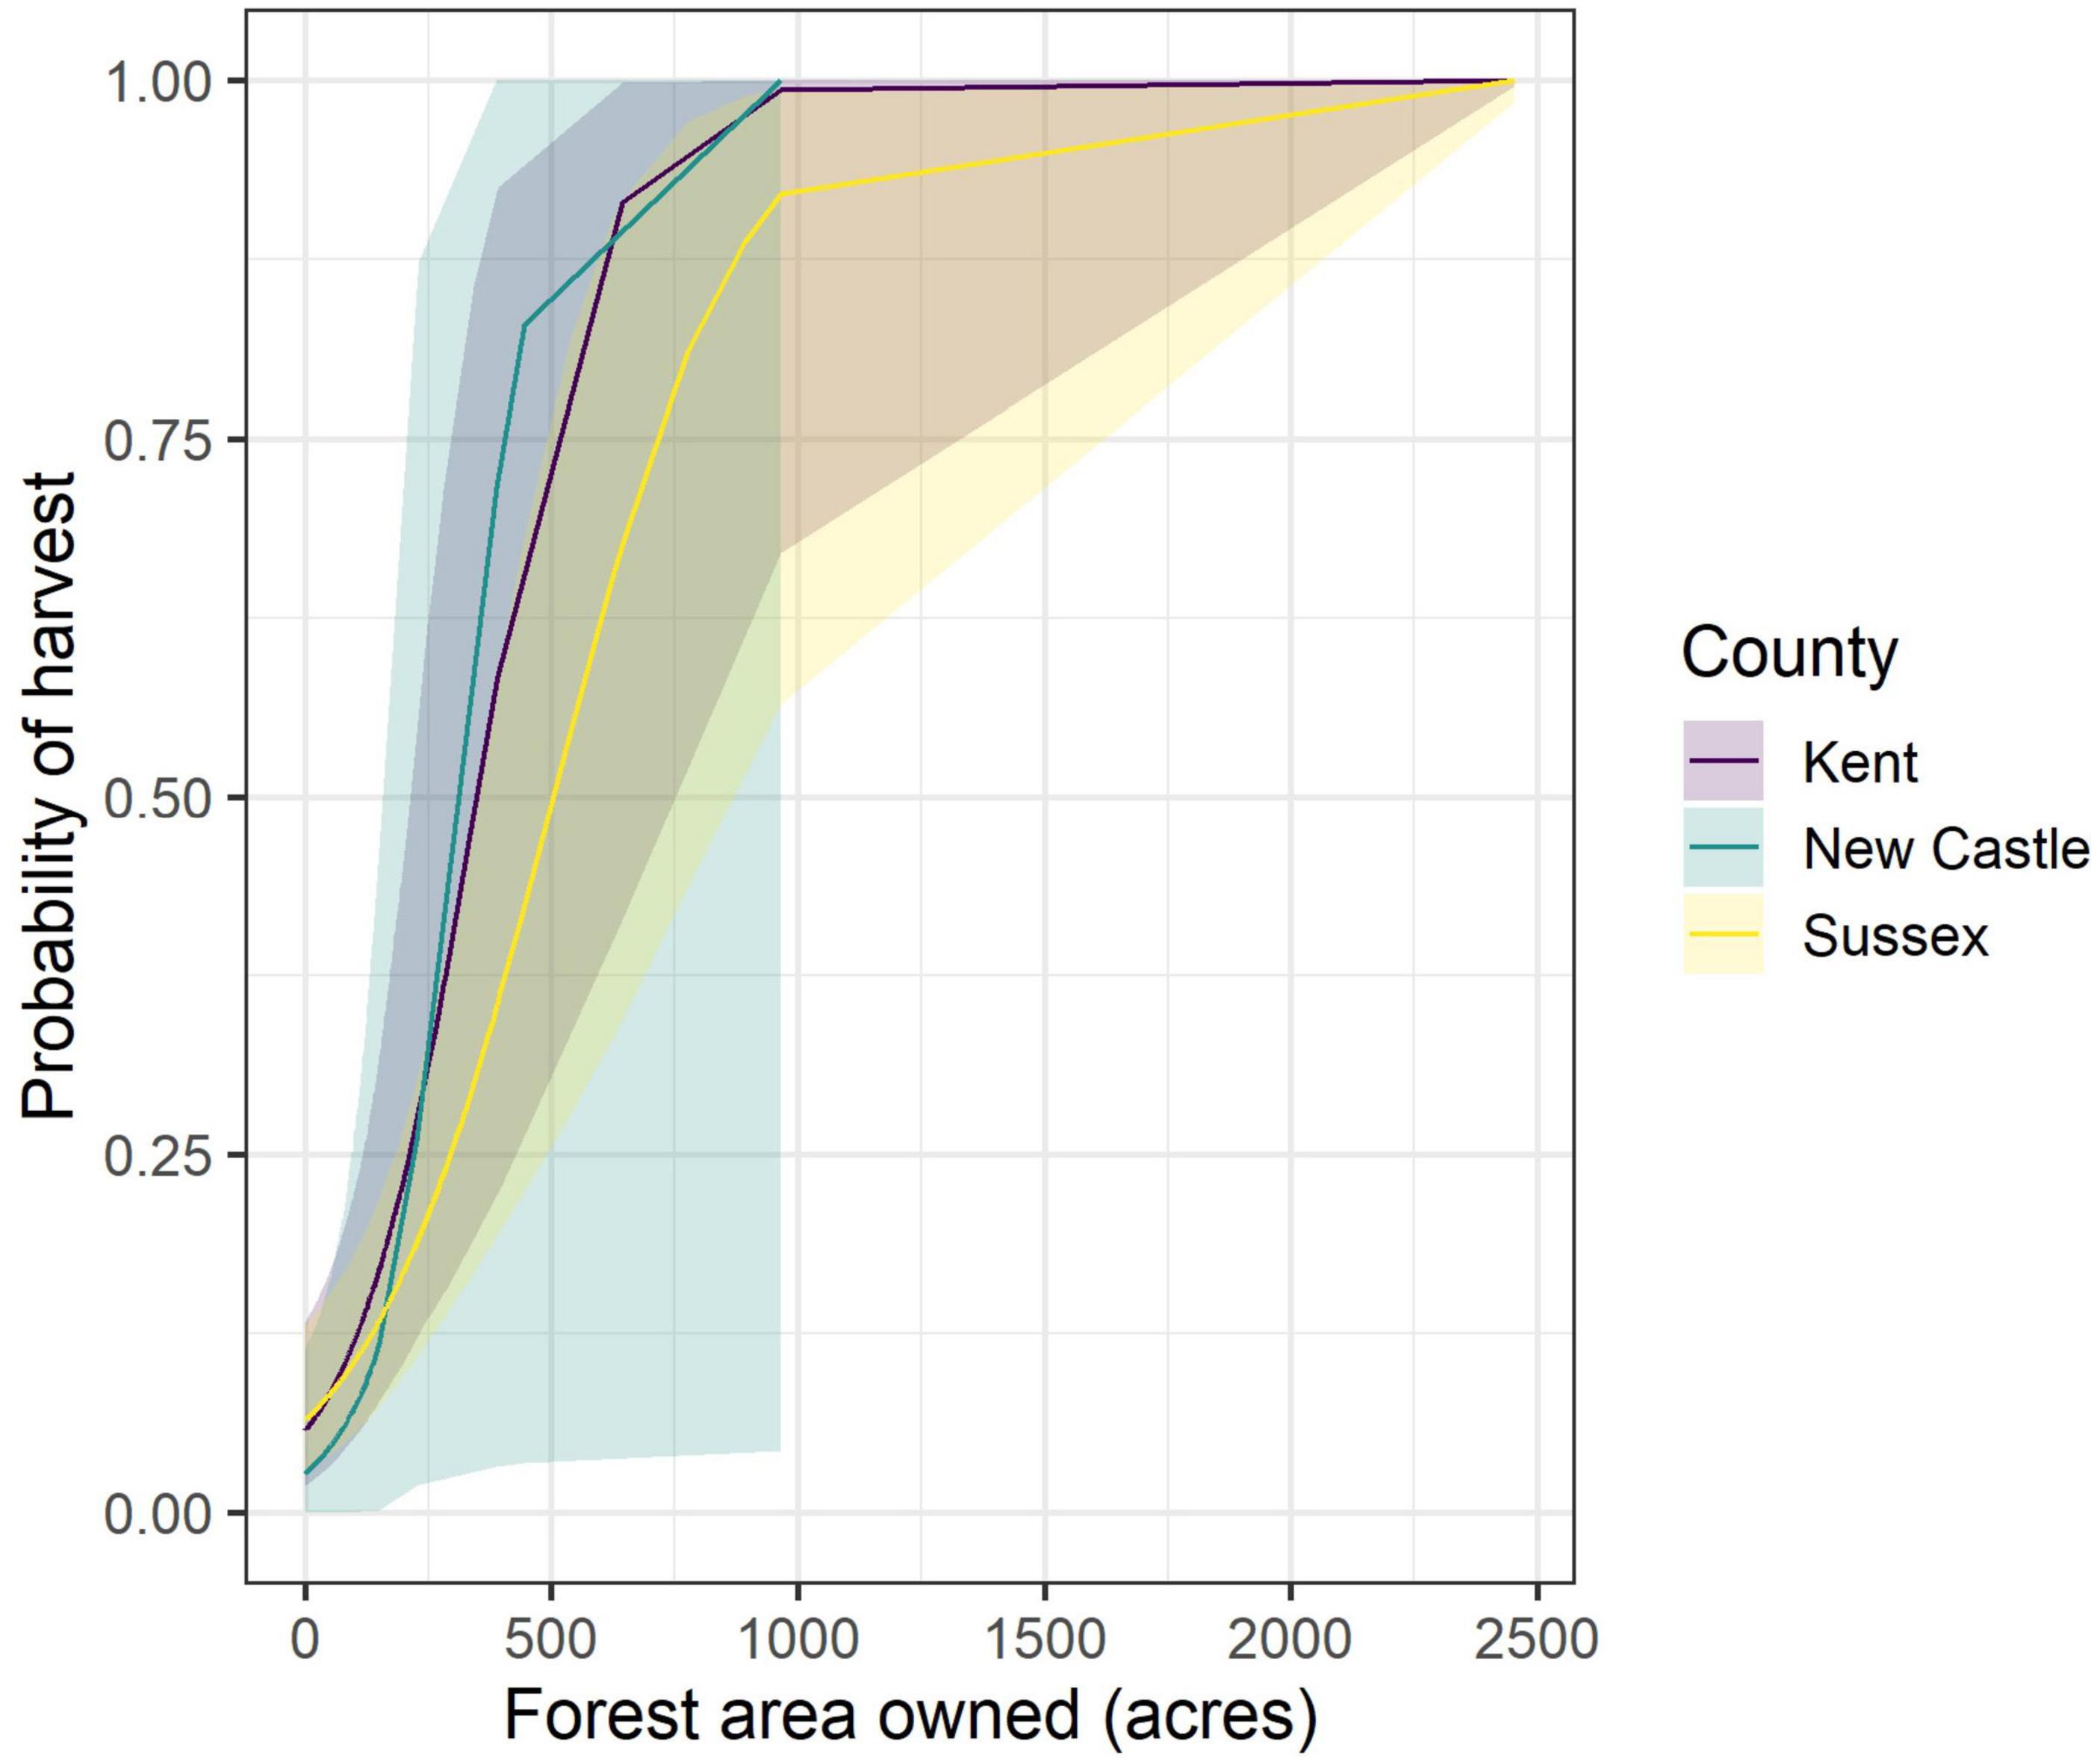
Figure 3. Predicted probability of commercial forest harvest (previous 5 years) by family forest ownerships, by county and size-of-forest-holdings in Delaware, United States. Lines represent posterior median and bands show 95% credible intervals.
In addition to county- and state-level estimates, the models provide individual population unit level posterior predictive distributions which can be summarized and mapped at the level of the individual parcel or pixel. As can be seen in Figure 4, commercial harvest is relatively improbable across the bulk of family forest land (median = 7.5%), with probability increased on larger parcels. Only a few of the largest parcels are both highly probable and highly certain (i.e., they have a narrow 95% credible interval) to conduct commercial harvest. Overall, the width of the intervals for individual parcels ranges from 0.4 to 96.7%. Information such as this is potentially valuable for targeting regions (or even individual parcels) for programs and interventions.
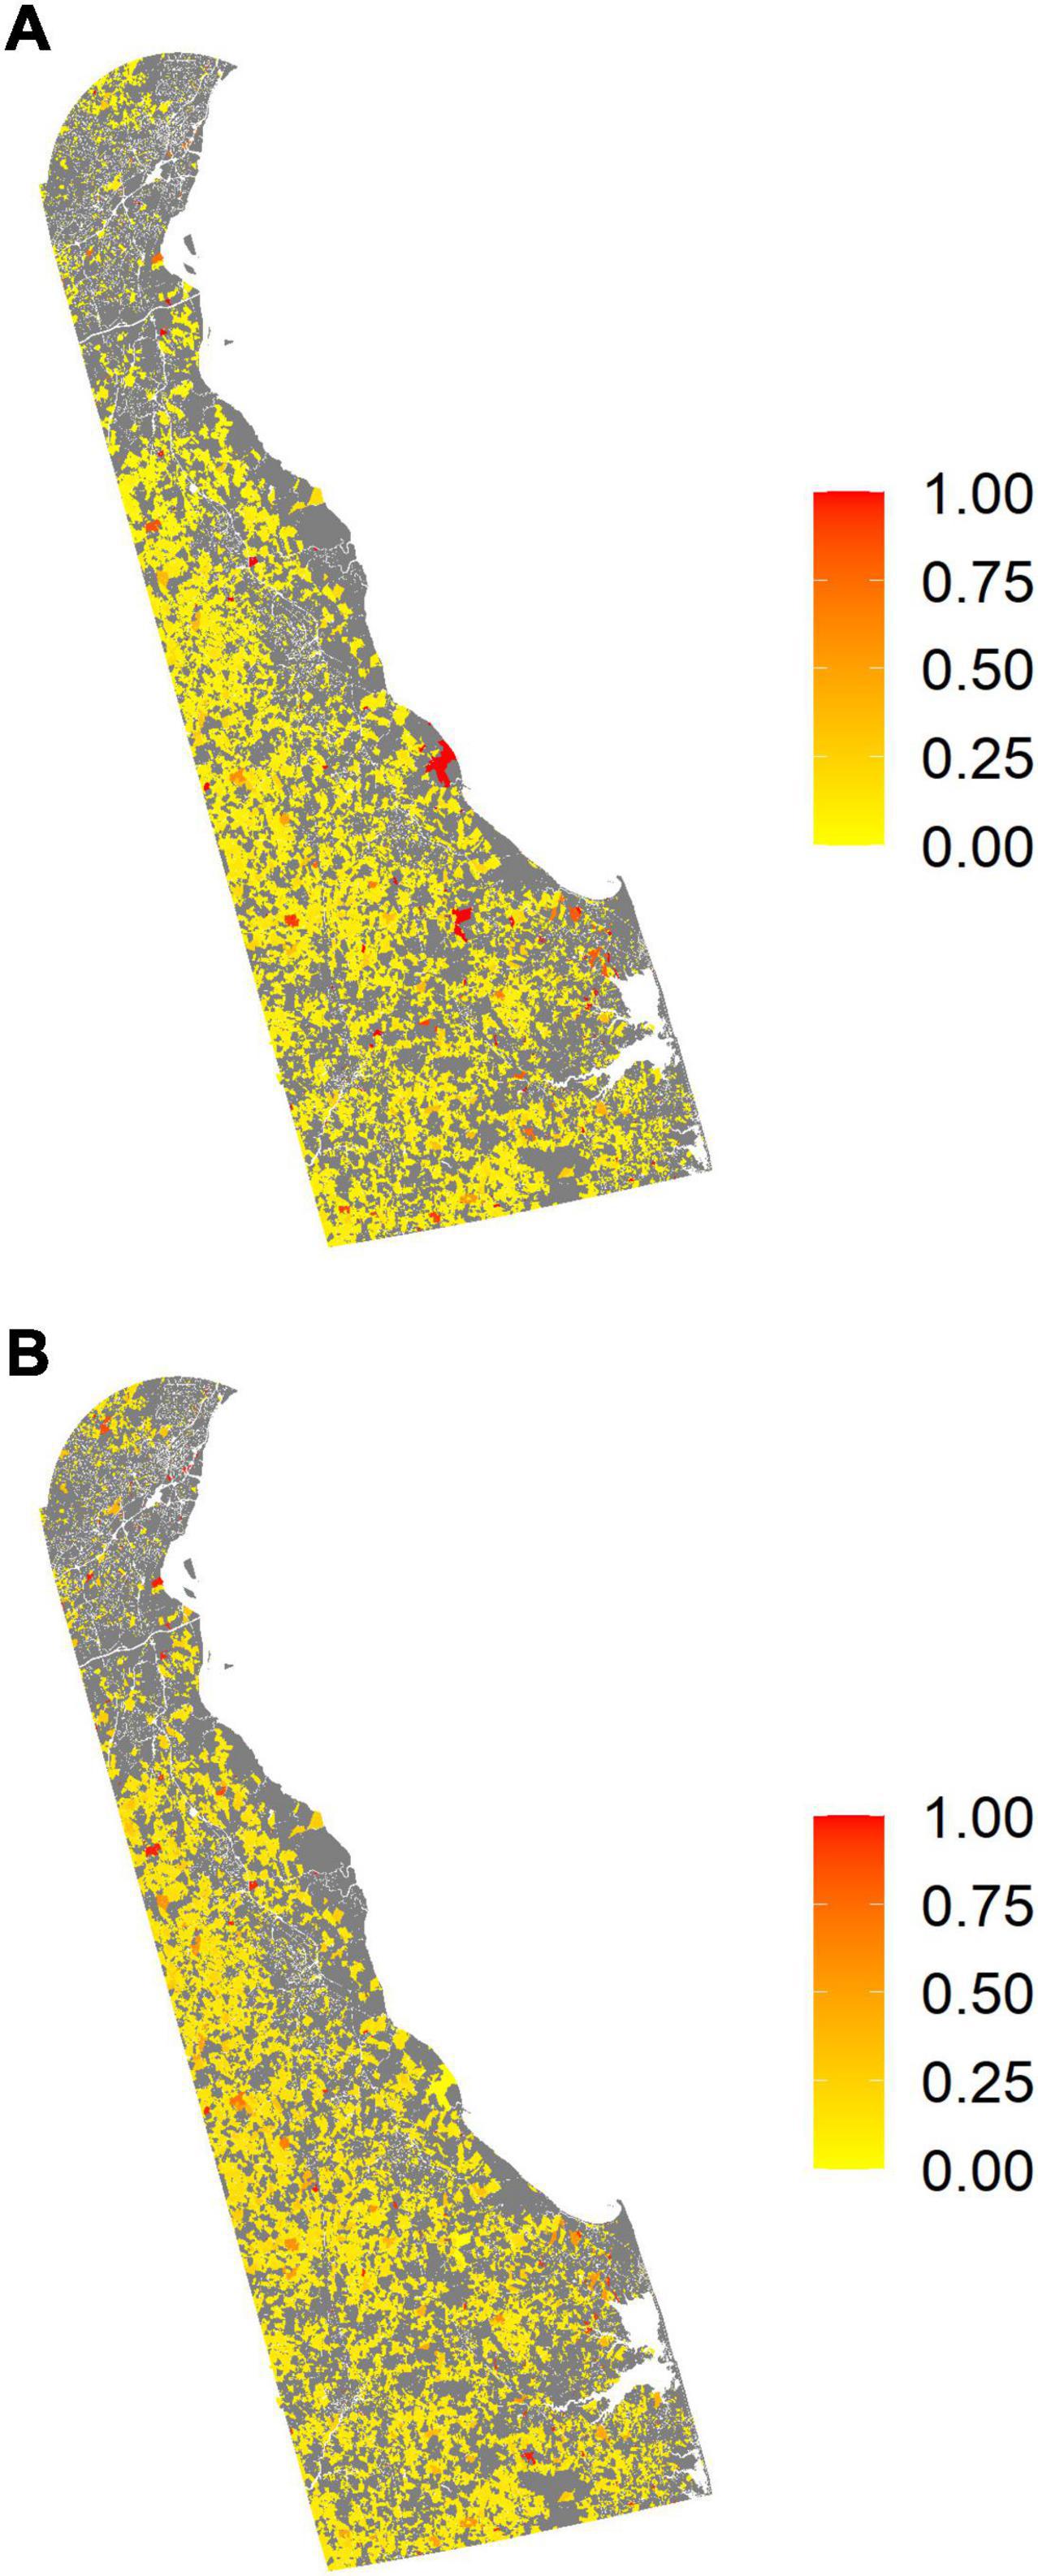
Figure 4. Predicted probability of commercial forest harvest by family forest ownerships across Delaware, United States. (A) Shows the probability of commercial harvest in the previous 5 years. (B) Shows the width of the 95% credible interval. Null values are represented in gray and correspond to public ownerships, corporate ownerships, other non-family private ownerships, and family ownerships owning less than one acre of forest. Values at the scale of the individual pixel reflect harvest probabilities across the entire parcel, regardless of whether the specific pixel is forest or non-forest.
At the county-level, the full model estimates of the proportion of family forest ownerships with one or more acres having had commercial harvest in the previous 5 years range from 3.7% in New Castle County to 7.2% in Sussex County (Figure 5). In all cases, the error bars of the NWOS standard estimates (95% confidence intervals) overlapped with those of the model-based estimates (95% credible intervals). The complete code and output for both the full and sub commercial harvest models is available in Supplement 1.
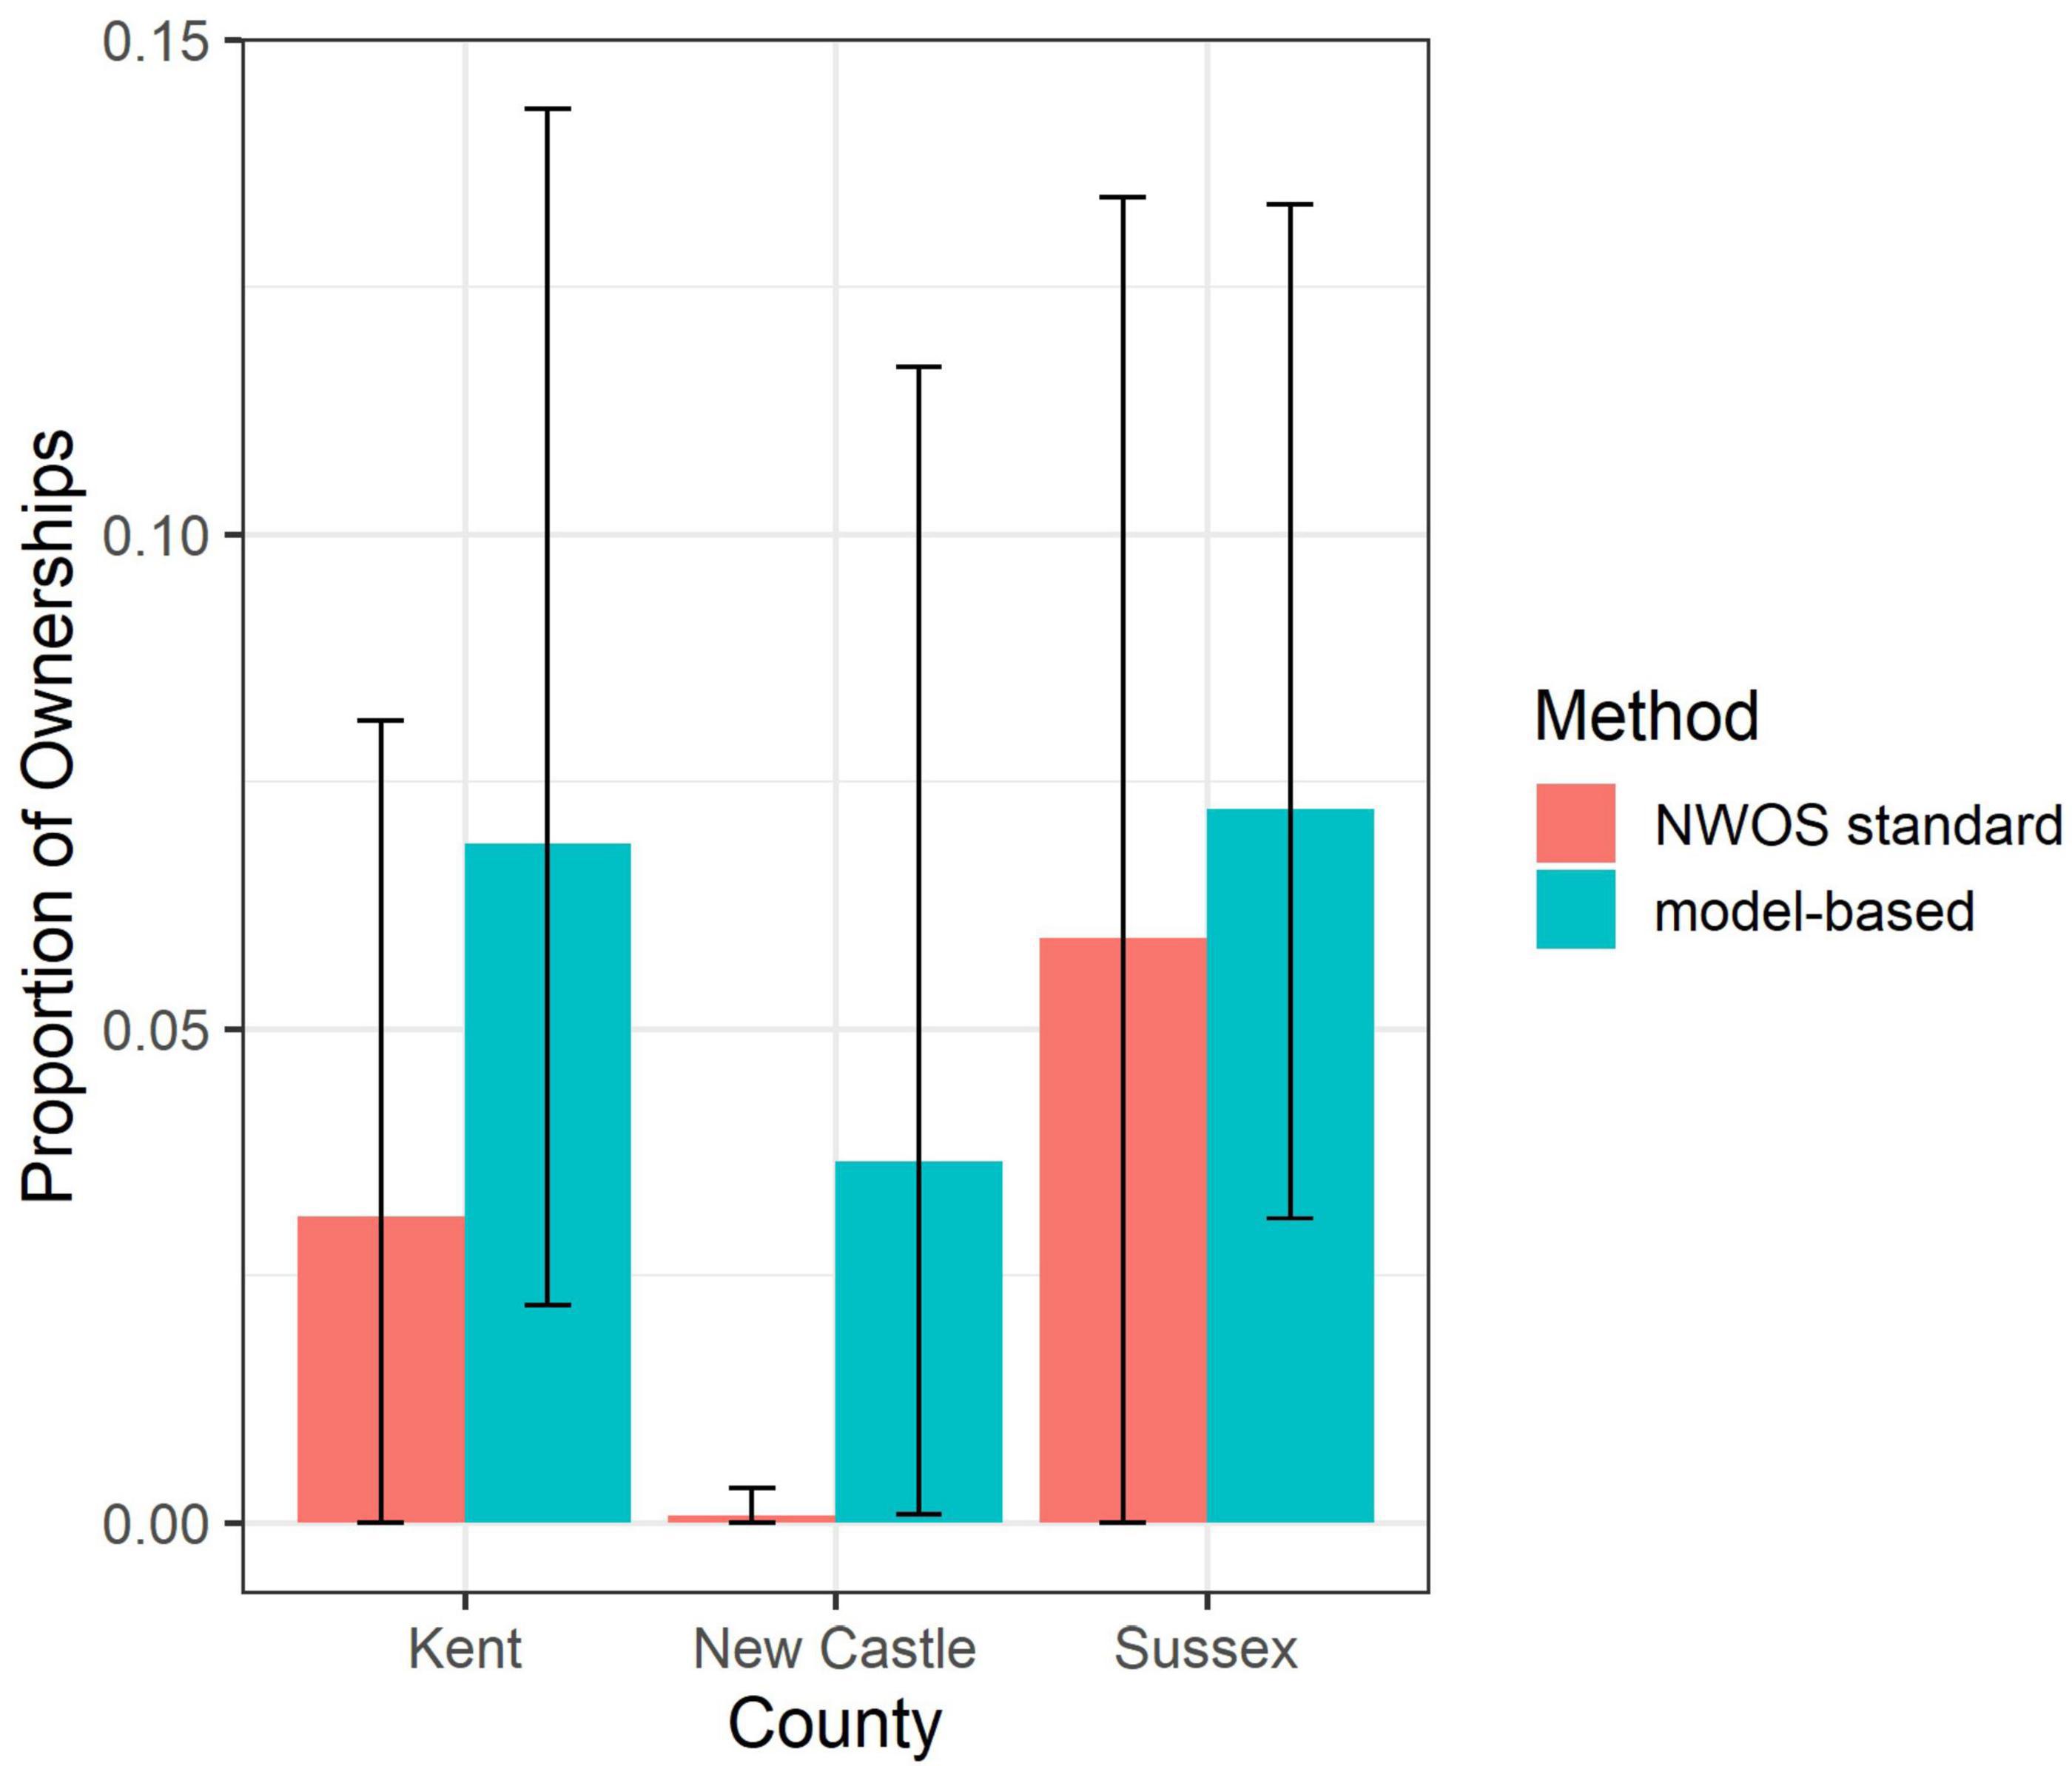
Figure 5. Proportion of family forest ownerships (1+ ac) who have conducted commercial harvests in the past 5 years, by county. Delaware, United States, 2018–2020. Comparison of NWOS standard estimates and model-based estimates. Error bars are 95% confidence intervals for the NWOS estimates and 95% credible intervals for the model-based estimates.
Conclusion and Future Directions
Using parcel level ownership data in tandem with the National Land Cover Database was more than sufficient for the creation of a continuous land cover and ownership class surface across the state of Delaware, United States. The models created were successful in the classification of ownership classes based on ownership name data with an accuracy estimate of 96%. Furthermore, the final layer resulted in aggregated values of acreage and ownerships that agreed strongly with the published NWOS estimates. Future iterations of this work are going to include optimizing and expanding the application across the United States with a more rigorous focus on quantifying the error of uncertainty at each stage of the process. For ancillary products such as the NLCD, published error rates, ranging from 71 to 97% (Dewitz, 2019), can be utilized, but the uncertainties and inconsistencies in the underlying parcel data and errors in our classification models resist easy quantification. The goal is to obtain a continuous layer coverage, as well as county and sub-state scale estimates for a wide suite of NWOS attributes for every state accompanied with reflective error metrics for each spatial extent.
Future efforts will also need to address some operational hurdles that were not fully resolved within the context of this pilot study. Firstly, Delaware lacks any tribal reservations. However, other states will include that ownership class. Plans are to incorporate identification of tribal ownerships with a spatial overlay of tribal land boundaries at the end of the classification stage. This will render the tribal ownership class with the highest priority, thereby ensuring its preservation within the analysis. Additionally, Delaware had continuous parcel coverage in the DMP Lightbox’s™ dataset. Other states will have gaps in coverages, which will impact distribution estimates of ownerships. Faulty estimates will degrade the agreement with the NWOS estimates, and therefore will need to be addressed. Finally, quantifying the null values for the public road network and open water is necessary in order to make the raster product truly continuous.
The results of our simulation exercise, comparing estimates of a simulated variable against a known population, demonstrated that model-assisted estimation using our land cover and ownership layer as a primary input had the potential to produce precise, unbiased estimates. Using the same approach with the actual NWOS data for the state of Delaware, we estimated that 3.7 to 7.2% of ownerships conducted commercial harvest in the past 5 years – estimates that agreed closely with those made using the standard NWOS methodology. This supports the claim that an SAE approach to estimating ownership attributes at sub-state scales is appropriate. In order to increase precision and reduce error estimates, future efforts will likely rely on more optimized models with additional predictor variables. Additional ancillary datasets, such as the Census data, would likely be useful in this regard. This additional data will “lend” even more strength (and consequently precision) to the estimates that are produced.
Ultimately, a small area estimation approach to modeling the social attributes of forest landowners is both feasible and productive. The insights and understanding it can provide within small spatial domains offer many opportunities for research as well as to aid in the efficient implementation of forest management and landowner assistance programs at small scale.
Data Availability Statement
The data analyzed in this study is subject to the following licenses/restrictions: Raw data used in this analysis are confidential (e.g., NWOS) and/or proprietary (e.g., DMP) and are therefore not publicly available. Requests to access these datasets should be directed to JC, jessecaputo@umass.edu.
Author Contributions
VH, JC, and AF did the analyses and wrote the manuscript. VH performed the initial analysis that generated the raster and table outputs to be utilized in JC’s and AF’s analyses. BB, FB, and PC contributed to the conceptualization and guided the project. All authors contributed to the article and approved the submitted version.
Funding
Funding for this research was provided by the USDA Forest Service, State and Private Forestry and the Northern Research Station (Grant No. 20-CS-11242305-116).
Conflict of Interest
The authors declare that the research was conducted in the absence of any commercial or financial relationships that could be construed as a potential conflict of interest.
Publisher’s Note
All claims expressed in this article are solely those of the authors and do not necessarily represent those of their affiliated organizations, or those of the publisher, the editors and the reviewers. Any product that may be evaluated in this article, or claim that may be made by its manufacturer, is not guaranteed or endorsed by the publisher.
Acknowledgments
The findings and conclusions in this publication are those of the author(s) and should not be construed to represent any official USDA or United States Government determination or policy. We thank Emma Sass for her contributions to the initial discussions that inspired this work. Additionally, we are grateful to Delaware’s family forest owners for responding to the National Woodland Owner Survey.
Supplementary Material
The Supplementary Material for this article can be found online at: https://www.frontiersin.org/articles/10.3389/ffgc.2021.745840/full#supplementary-material
Footnotes
- ^ For example, the name VANCE HARRIS ALLEN JR would hypothetically be split into component words and associated with the following phonetic standardizations: ALNRSRRFNS, ALNRSFNS, ALNJRRFNS, HRSRRFNS, and ALNRSRR.
- ^ Other private consists of conservation organizations, NPOs, community groups, and unincorporated private entities.
References
Breidenbach, J., and Astrup, R. (2012). Small area estimation of forest attributes in the Norwegian National Forest Inventory. Eur. J. For. Res. 131, 1255–1267. doi: 10.1007/s10342-012-0596-7
Breidenbach, J., Granhus, A., Hylen, G., Eriksen, R., and Astrup, R. (2020). A century of National Forest Inventory in Norway – informing past, present, and future decisions. For. Ecosyst. 7:46. doi: 10.1186/s40663-020-00261-0
Butler, B. J., and Caputo, J. (2021). Weighting for the USDA Forest Service, National Woodland Owner Survey. Gen. Tech. Rep. NRS-198. Madison, WI: U.S. Department of Agriculture, Forest Service, Northern Research Station. 24. doi: 10.2737/NRS-GTR-198
Butler, B. J., Butler, S. M., Caputo, J., Dias, J., Robillard, A., and Sass, E. M. (2021). Family Forest Ownerships of the United States, 2018: Results From the USDA Forest Service, National Woodland Owner Survey. Gen. Tech. Rep. NRS-199. Madison, WI: USDA Forest Service, Northern Research Station, 52.
Butler, B. J., Hewes, J. H., Liknes, G. C., Nelson, M. D., and Snyder, S. A. (2014). A comparison of techniques for generating forest ownership spatial products. Appl. Geogr. 46, 21–34. doi: 10.1016/j.apgeog.2013.09.020
Butler, J. B., and Leatherberry, E. C. (2004). Leatherberry, America’s family forest owners. J. For. 102, 4–14. doi: 10.1093/jof/102.7.4
Chen, Q., Elliott, M. R., Haziza, D., Yang, Y., Ghosh, M., Little, R., et al. (2017). Approaches to improving survey-weighted estimates. Statist. Sci. 32, 227–248.
Dewitz, J. (2019). National Land Cover Database (NLCD) 2016 Products. Reston, VA: U.S. Geological Survey, doi: 10.5066/P96HHBIE
Gelman, A., Carlin, J. B., Stern, H. S., Dunson, D. B., Vehtari, A., and Rubin, D. B. (2013). Bayesian Data Analysis. London: Chapman and Hall/CRC.
Digital Map Products [DMP] (2021). Unpublished data; Land Parcel and Ownership Layer. Available online at: https://www.digmap.com/
Ghosh, M., and Meeden, G. (1997). Bayesian Methods for Finite Population Sampling. London: Chapman Hall/CRC Press.
Goerndt, M. E., Wilson, B. T., and Aguilar, F. X. (2019). Comparison of small area estimation methods applied to biopower feedstock supply in the Northern U.S. Region. Biom. Bioener. 121, 64–77. doi: 10.1016/j.biombioe.2018.12.008
Green, E., Finley, A., and Strawderman, W. (2020). Introduction to Bayesian Methods in Ecology and Natural Resources. Cham: Springer International Publishing.
Hewes, J. H., Butler, B. J., Liknes, G. C., Nelson, M. D., and Snyder, S. A. (2014). Public and Private Forest Ownership in the Conterminous United States: Distribution of Six Ownership Types – Geospatial Database. RDS-2014-0002. Newtown Square, PA: U.S. Department of Agriculture, Forest Service, Northern Research Station. doi: 10.2737/RDS-2014-0002
Kumer, P., and Štrumbelj, E. (2017). Clustering-based typology and analysis of private small-scale forest owners in slovenia. For. Policy Econom. 80, 116–124. doi: 10.1016/j.forpol.2017.03.014
Little, R. (2004). To model or not to model? Competing modes of inference for finite population sampling inference for finite population sampling. J. Am. Statist. Associat. 99, 546–556. doi: 10.1198/016214504000000467
Mozgeris, G., Vilis, B., Andrius, S., Marius, K., and Michailas, P. (2017). Owner mapping for forest scenario modelling — a lithuanian case study. For. Policy Econom. 85, 235–244. doi: 10.1016/j.forpol.2016.02.002
Nelson, M. D., Riitters, K. H., Coulston, J. W., Domke, G. M., Greenfield, E. J., Langner, L. L., et al. (2020). Defining the United States Land Base: A Technical Document Supporting the USDA Forest Service 2020 RPA Assessment. Gen. Tech. Rep. NRS-191. Madison, WI: U.S. Department of Agriculture, Forest Service, Northern Research Station, 70. doi: 10.2737/nrs-gtr-191
Pedregosa, F., Varoquaux, G., Gramfort, A., Michel, V., Thirion, B., Grisel, O., et al. (2011). Scikit-learn: machine learning in python. J. Mach. Learn. Res. 12, 2825–2830.
Philips, L., Collins, A., Somerville, M., Barran, R., Dornself, M., Metrot, S., et al. (2007). “Metaphone.py.” Github, Python 3. Available online at: gist.github.com/nsh87/cba8824ba720181e820f (accessed December 15, 2020).
R Core Team (2019). R: A Language and Environment for Statistical Computing. Vienna: R Foundation for Statistical Computing.
Rao, J. N. K. (2011). Impact of frequentist and Bayesian methods on survey sampling practice: a selective appraisal. Statist. Sci. 26, 240–256.
Sass, E. M., Butler, B. J., and Markowski-Lindsay, M. (2020). Forest Ownership in the Conterminous United States, 2017: Geospatial Dataset. Fort Collins, CO: U.S. Department of Agriculture, Forest Service, doi: 10.2737/RDS-2020-0044
Sotirov, M., Ola, S., and Ola, E. L. (2019). Forest owner behavioral models, policy changes, and forest management. an agent-based framework for studying the provision of forest ecosystem goods and services at the landscape level. For. Policy Econom. 103, 79–89. doi: 10.1016/j.forpol.2017.10.015
USDA Forest Service (2016). Forest Inventory and Analysis Glossary. Available online at: www.nrs.fs.fed.us/fia/data-tools/state-reports/glossary/default.asp (accessed March 4, 2021).
Vehtari, A., Gelman, A., and Gabry, J. (2017). Practical bayesian model evaluation using leave-one-out cross-validation and waic. Statist. Comput. 27, 1413–1432.
Keywords: private forest land, family forest ownerships, commercial forest harvesting, small area estimation, model-based estimations
Citation: Harris V, Caputo J, Finley A, Butler BJ, Bowlick F and Catanzaro P (2021) Small-Area Estimation for the USDA Forest Service, National Woodland Owner Survey: Creating a Fine-Scale Land Cover and Ownership Layer to Support County-Level Population Estimates. Front. For. Glob. Change 4:745840. doi: 10.3389/ffgc.2021.745840
Received: 22 July 2021; Accepted: 16 November 2021;
Published: 15 December 2021.
Edited by:
Philip Radtke, Virginia Tech, United StatesReviewed by:
Steve Prisley, National Council for Air and Stream Improvement, Inc., (NCASI), United StatesGarret Dettmann, Virginia Tech, United States
Copyright © 2021 Harris, Caputo, Finley, Butler, Bowlick and Catanzaro. This is an open-access article distributed under the terms of the Creative Commons Attribution License (CC BY). The use, distribution or reproduction in other forums is permitted, provided the original author(s) and the copyright owner(s) are credited and that the original publication in this journal is cited, in accordance with accepted academic practice. No use, distribution or reproduction is permitted which does not comply with these terms.
*Correspondence: Vance Harris, vharris@umass.edu; Brett J. Butler, bbutler@umass.edu