Assessing the Welfare Impacts of Forest Ecosystem Service Management Policies and Their Distributional Rules
 Ilda Dreoni
 Henri Utila2
  Marije Schaafsma
- 1School of Geography and Environmental Science, University of Southampton, Southampton, United Kingdom
- 2Forestry Research Institute of Malawi, Zomba, Malawi
- 3Department of Environmental Economics, Institute for Environmental Studies, Vrije Universiteit Amsterdam, Amsterdam, Netherlands
Community based management (CBM) is widely advocated as an effective method for governing and managing ecosystem services (ES). However, the distributional rules and maximum harvesting levels are likely to affect both the effectiveness of CBMs in maintaining ES and the fairness and equity of access to these ES. This article proposes a methodological approach for investigating normative trade-offs involved in CBM of forests, where forest conservation objectives need to be traded off against livelihoods objectives. The study uses remote sensing methods to quantify forest ES supply in Namizimu Forest Reserve in Malawi, and links this to demand for ES within the villages near the reserve. It then investigates how a plausible set of CBM rules can be developed to cap consumption of forest products to sustainable amount and quantifies, by using monetary valuation techniques, how these set of rules may affect the total well-being of local population. Our results demonstrate that, due to the spatial mismatches between demand and supply, the distribution of provisioning ES to the population across the harvesting area is unequal in biophysical terms. The current available stock of forest products is sufficient to cover the current demand, however, it is higher than the mean annual increment indicating that this level of consumption is ecologically unsustainable and will lead to forest degradation as shown under the business-as-usual scenario. We then examined the impact of governance and how CBM rules to allocate forest ES to different social groups (poor and rich) under a co-management regime will affect total societal welfare. We found that the distributional scenario that maximises total societal welfare expressed in monetary terms across the whole harvesting area is the scenario that distributes 40% of biomass to the rich group while the remaining 60% is allocated to the poor group. However, this scenario maximises Willingness to Pay (WTP) at total level but does not maximise WTP in each sub-area of forest but just for those that have a high availability for biomass. This indicates that the distributional rules that maximise total welfare at aggregate level may not maximise welfare at local level where constraints from biomass availability require to restrict further the distribution of forest products. When biomass availability is low, total societal welfare is maximised with distributional rules that distribute more trees to richer. Yet, a policymaker may choose a distributional rule that distribute more trees to the poor on normative grounds and forego the objective of maximising total welfare. In such cases the WTP analysis outlined in this paper can support the policymaker in choosing the distributional rule that minimise trade-offs between efficiency, i.e., maximising total welfare, and livelihoods objectives.
Introduction
Sustainable governance of natural ecosystems requires managing trade-offs between the conservation of ecological resources and the consumption of those resources to fulfil human population needs. Such trade-offs are especially relevant in low-income countries, where rural communities are strongly reliant on natural ecosystems for their basic needs and income (Angelsen et al., 2014; Fisher et al., 2014; Guerry et al., 2015) and the provision of ecosystem services play an important role in poverty alleviation (Daw et al., 2011, 2015; Ryan et al., 2016). In these contexts, the ecosystem governance mechanisms determine how these ecosystem services are allocated to different social groups by defining the rules and the rights for ecosystem users to access the resource and such mechanisms therefore have an impact on the distribution of these resources and its equality.
Attention to inequality and social injustice in ecosystem management and conservation is growing (Chaplin-Kramer et al., 2019; Martin et al., 2020). Different ecosystem governance arrangements lead to different outcomes for people and nature, as they adjust rights and responsibilities in ecosystem conservation, and seek to resolve resulting normative trade-offs in different ways (Sikor et al., 2014; Mace et al., 2018). Normative trade-offs between achieving ecological sustainability and improving or safeguarding the livelihoods of users of the natural ecosystem, remain understudied in the ecosystem services literature (Lautenbach et al., 2019; Schaafsma et al., 2021). Few ecosystem assessment studies present disaggregated analyses and evaluate distributive trade-offs among stakeholders to understand whether ecosystem governance projects that may seem to provide net positive gain overall also turn out to be positive for all actors involved (Kremen et al., 2000; Peh et al., 2014; Liu et al., 2017). Therefore, an environmental justice lens applied to the analysis of ecosystem service (ES) governance can reveal and evaluate distributional patterns arising from different governance mechanisms and provide support for decision-making where such normative trade-offs exists (McDermott et al., 2013; Schlosberg, 2013; Sikor et al., 2014).
This article aims to examine the relevance of such normative trade-offs focussing on a case study on the management of a forest ecosystem in Malawi. In the study area, forest resources have an important role in supporting the livelihood strategies of rural communities, especially for the poorest village members, and can have an important equalising effect. Forest management policies in Malawi are transitioning toward community-based management (CBM) agreements and co-management for public forest reserves where local rural communities become responsible, in partnership with the forest department, for coordinating management and harvesting of forest resources. CBM is a widespread institutional mechanism for managing natural resources such as forests and fisheries in low-income countries (Agrawal et al., 2008; Sunderlin et al., 2008)1. In CBM, local ecosystem users are involved in the definition of management rules for the natural ecosystem, thereby aiming to both improve ecological outcomes and facilitate access to all local users (Agrawal, 2001). The hypothesis underlying CBM is that local communities have the incentives and the knowledge to manage sustainably the natural ecosystem as well as establish management objectives and rules which accommodate all users’ needs (Ostrom et al., 1999; Bowler et al., 2012). The corollary from this is that CBM governance mechanisms are expected to solve conflicts arising from normative trade-offs and generate equitable outcomes for all forest users.
In reality, whilst CBM has been found to improve ecological sustainability and reduced unsustainable harvesting in multiple cases, results suggest it may be less effective in terms of achieving an equitable distribution of benefits and improve livelihoods (Lund and Treue, 2008; Persha and Andersson, 2014; Chomba et al., 2015; Dawson and Coolsaet, 2015; Mutune and Lund, 2016). Such inequities are associated with low levels of active engagement of forest users, which can lead to a limited development of equitable rules, where the interests of more marginalised groups are excluded and elite capture can further exacerbate existing inequalities (Adhikari et al., 2014; Persha and Andersson, 2014; Chomba et al., 2015; Yadav et al., 2015). Moreover, harvesting limits, although necessary to guarantee long-term ecosystem service supply, may put overly high opportunity costs on local users (Green et al., 2018). As such, CBM may generate an unequal distribution of forest resources and trade-offs in well-being across different social groups, increasing inequalities may also decrease compliance and negatively affect nature conservation (Dawson et al., 2017).
This article investigates the normative trade-offs between local welfare and forest conservation objectives for CBM governance systems when the ecological constraints on ecosystem services supply, the potential (mis-)match between supply and demand levels for these services, and the distributional preferences of forest users are taken into account all together. It uses an interdisciplinary approach, in which preference surveys among community members are combined with a spatial analysis of forest stocks and flows, to better understand the implications of different hypothetical co-management policies and their distributional rules for local welfare and actual ecosystem services benefits.
Materials and Methods
This study employs a 3-step methodological approach to examine the welfare impacts of distributional rules of hypothetical co-management policies in our case study – Namizimu Forest Reserve in Malawi. We first give a broad outline of the methodological approach (see section “Methodological Approach”), before briefly describing the case study (see section “Case Study: Co-management in Namizimu Forest Reserve”), and then providing detailed methods for each step (see section “Methods and Data”).
Methodological Approach
Identifying the actual contribution of nature to human well-being requires an understanding of the potential demand of the human population for ES and how this demand is connected to the potential supply of those services across space (Syrbe and Walz, 2012; Bagstad et al., 2013; Ala-Hulkko et al., 2019; Vallecillo et al., 2019). The potential supply of ES depends on the structure and the ecological processes of the natural ecosystem and is characterised by spatial variation (Burkhard et al., 2012; Syrbe and Walz, 2012; Barò et al., 2016). Such potential supply becomes an actual ES if there is a population that has demand for those services, can access it and benefit from it and thus hold values for it (Potschin and Haines-Young, 2011). The ability of the population to benefit from ecosystem services depends on the spatial connection with the areas that supply the forest resources, i.e., the ecological endowment vis-à-vis the total demand of the population and their distributional preferences (Fisher et al., 2014; Syrbe and Grunewald, 2017). Therefore, to assess the welfare impacts of natural resource management on local welfare, we first need to quantify both the potential supply and the potential demand as well as their spatial connection to quantify the actual flow of ES, and then quantify the total value placed by people on the estimated actual flow of ES. The three main methodological steps in this study are:
(1) Step 1: Evaluate the current level of forest degradation and quantify and map the potential supply of ES, i.e., woody biomass available, and potential demand of ES, i.e., current and expected consumption of woody products by the local population.
(2) Step 2: Model the spatial connection between potential demand and supply to quantify the actual flow of ES that can be consumed.
(3) Step 3: Scenario analysis to assess the ecological consequences of current ES demand and welfare implications of co-management policies across different distributional scenarios.
Step 1 – Mapping and Quantifying Ecosystem Service Supply and Demand
The development of approaches for mapping and quantifying ES in semi-arid systems, such as African woodlands, is still in its infancy compared to the more frequently analysed tropical and temperate areas (Egoh et al., 2012; Wangai et al., 2016; Willemen et al., 2018). Most of the studies on mapping ES have assessed the provision of regulating services such as carbon storage (Batjes, 2008; Egoh et al., 2011; Leh et al., 2013), water flow regulation (Egoh et al., 2008), soil accumulation and retention (Egoh et al., 2011; Leh et al., 2013). Mapping and quantifying woody biomass provided by forest ecosystems, when lacking primary data such as national forest inventories, relies on indicators derived from remote sensing data combined with ground observations (DeFries et al., 2007; Ryan et al., 2012). Therefore, to quantify and map the total biomass supplied by the forest ecosystem analysed in this article, we combine high resolution remote sensing images that measure changes in vegetation cover with biomass estimates from ground observations. We use woody biomass as a proxy to measure the provisioning ecosystem services of interest: fuelwood, poles, and timber provision. To assess the current situation of our case study area we examined the current ecological condition of Namizimu forest reserve by mapping the current level of degradation. To quantify and map the future demand for biomass, i.e., potential demand, we use the current average consumption of forest products of the local population. This consumption is quantified by using primary data on household consumption of forest products collected through a household survey administered to a sample of the population living in the surrounding of the forest ecosystem under examination (Wolff et al., 2015).
Step 2 – Linking Supply and Demand
As forests (that supply ES) and village members (that demand ES) are not located in the same place, we employed a spatial modelling technique to model their connection and quantify the actual flow of ES. We used accessibility analysis to determine the potential link between the service providing area, i.e., the forest, and the reference population (Syrbe and Grunewald, 2017; Ala-Hulkko et al., 2019). By simulating the spatial connectivity between supply and demand, we identified the actual flow of ES and we evaluated where demand could exceed ES provision. This revealed where the supply of ES would not be able to meet demand in the future and harvesting could become ecologically unsustainable. By using a spatial approach, we also took into account the consequences of spatial heterogeneity in the ecological structure of the forest as well as in population density and desired amount of forest resources.
Step 3 – Scenario Analysis of Co-management Distributional Rules
The third step of our analysis focussed on assessing the contribution to welfare of provisioning ES under alternative distributive scenarios using Willingness to Pay (WTP) analysis. We used a Discrete Choice Experiment (DCE) to elicit individual preferences for different level of biomass supply under a CBM policy (Villamagna et al., 2013; Wolff et al., 2015). Based on welfare theory, DCEs are an economic valuation method that can be used to assess respondents maximum WTP as a measure of “strength of preference” for, or value of, a commodity, in monetary terms. We employed a novel DCE designed to measure user’s preferences for different distributions of biomass across different social groups defined by their wealth status, i.e., better-off, and worse-off village members, and thus assess the users’ distributional preferences. Forests are common-pool resources characterised by a conflict between the personal interest of forest users to maximise resource harvesting, and societal interests in managing the resource sustainably to guarantee a long-term flow of benefits for all users (Perman et al., 2003). As a consequence, individual preferences and behaviour regarding forest management may be driven by ethical and moral considerations such as fairness concerns. This raises the question of how members of forest-adjacent communities would prefer to see such fairness considerations addressed in forest management, i.e., how they would want to distribute the limited amount of biomass that can be harvested sustainably across current village members. Our DCE asked respondents to make choices across different forest management scenarios, involving different levels of private forest resources, different allocations of forest resources to others, and different payment levels. The trade-offs between changes in forest resources and payment levels results in individual WTP estimates. By aggregating the individual WTP for these options across the full population, we could quantify in monetary terms the total welfare impacts associated with different distributive scenarios. By using one metric, WTP, we were hence able to assess in monetary terms the value of the trade-offs between social groups which arise from different institutional arrangements (rules).
Case Study: Co-management in Namizimu Forest Reserve
Rural communities in Malawi strongly rely on forest ecosystem services. Forests are the primary source of energy-related goods, i.e., firewood and charcoal; other important forest products include construction materials, timber, wild food, and medicines (Campbell, 1996; Lowore, 2003; Kamanga et al., 2009). Moreover, forests provide important indirect benefits such as flood protection and soil fertility, regulation of the availability of water in streams during the dry season, and cultural benefits. Forest resources are an important source of income for most rural households, contributing about 10–20% of household income, and have an important equalising effect (Fisher, 2004; Angelsen et al., 2014; Chilongo, 2014). At the same time, forest cover in Malawi has been declining at a fast rate; although the actual forest cover is not known with certainty, it has been estimated that the annual deforestation rate ranges between 1% and 3.5% (Bekele, 2001; FAO, 2010; Zulu, 2010). As a mean to pursue effective forest management, the Malawian government has introduced co-management of forest protected areas (GoM, 2001). This co-management policy involves the sharing of rights and responsibilities about forest reserve between government and local resource users. In the Malawi co-management policy, the local communities are involved in the management of a delimited block of the forest reserve and through the election of a Village Forest Committee (VFC), the local communities coordinate all harvesting activities and the distribution of all forest products among local users.
In this study, we focussed the spatial and scenario analysis on the area of Namizimu forest reserve and surrounding villages. We chose Namizimu forest reserve as it is currently managed fully by the forest department and co-management is not implemented yet, but it may be implemented in the future. In this area, forest products are used almost exclusively for domestic consumption. Firewood and charcoal are used as main energy source while poles and timber are used as construction material. Briefly, the development of a co-management scheme requires identifying the interested communities of local users, evaluate their needs and potential demand for forest products, carry on an ecological assessment of the forest reserve areas to evaluate its potential supply and based on all this information, develop a sustainable management plan. The communities of local users involved in co-management schemes are usually selected between those located within a 5 km buffer from the forest reserve and are grouped at the administrative level of group village. Each of these user group is then assigned a portion of forest reserve to manage, known as a “block.” The management partnership between the local community and the government becomes effective through a signed binding agreement between the forest department and the residents of the communities involved which are represented by a committee (GoM, 1997, 2016).
Methods and Data
Step 1: Spatially Explicit Quantification of Supply and Demand of Biomass
Assessment of Current Forest Degradation
In Malawi, the assessment of forest biomass stock in forest reserves which is currently publicly available is based on estimates which employ data from the two forestry inventories carried out in 1973 and in 1991 (FAO, 2010) and data on periodic field measurement in permanent plots are not available. Therefore, to provide a more updated assessment of the current ecological condition of the whole Namizimu forest reserve, we used a degradation index (Baumann et al., 2014) estimated using satellite images of the forest area. The degradation index employs a qualitative approach to examine changes in biomass stocks and providing an overall assessment of degradation patterns within the study area for the period 2013–2018. This qualitative approach are often used when accurate ground data information on the current forest stocks and, more importantly, how it changes over time are lacking (Mitchell et al., 2017).
The disturbance index is a spectral index calculated using a tasselled cap-based transformation, i.e., a remote sensing technique used to estimate vegetation condition from satellite images (Healey et al., 2005). The approach used by Neil (2018) allow to produce maps of the forest area where for each pixel the level of degradation is assigned through comparison to a chosen threshold that is completely disturbed (Healey et al., 2005). Specifically, this tasselled cap-based transformation reduces the remote sensing images obtained from Landsat satellite reflectance bands to three distinct tasselled components (Brightness, Wetness, and Greenness) and evaluates how much these components differ compared to the chosen threshold. For each year from 2013 to 2018, the area covering the Namizimu forest reserve was classified in disturbed and undisturbed pixels using Landsat-8 images at 30 m resolution collected at the end of the wet season (Neil, 2018). The yearly disturbance index maps were then combined over the chosen time period to obtain an overall disturbance index according to the number of years in which the pixel was disturbed (Table 1). All the GIS processing was done using ArcGIS (Version 10.6.1).
Table 1. Disturbance index classification.
We employed the overall disturbance index to evaluate (a) spatial patterns of degradation in the harvesting area and (b) whether patterns of degradation were associated with human presence by performing proximity analysis (see Supplementary Appendix 2).
Identify the Forest Catchment Area for the Reference Population Chosen
We defined the boundary of the total forest area used for the supply mapping based on a walking distance approach (Uchida and Nelson, 2008; Albers and Robinson, 2013). The basic assumption of this approach is that the walking distance between villages and harvesting locations in the forest represents a cost for the individual who collects forest products (Schaafsma et al., 2012). The higher the distance between the village, the higher the cost for the users to reach it and therefore less likely that the individual will harvest in that specific location.
Therefore, to define the forest catchment area we produced an accessibility map that assigns a foot-based travel time to each possible harvesting location (grid cell 30 m × 30 m) in Namizimu forest reserve considering the 110 selected villages as starting points. The travel time by foot was assumed to be 4 km/h on flat terrain and it is weighted by the slope expressed in gradients, extracted from the 30 arc-second elevation product SRTM30, following the van Wagtendonk and Benedict (1980) formula2. We defined the forest area of analysis (called harvesting area henceforth) by including all harvesting locations that can be reached by walking a maximum of 180 min. The threshold of 180 min was chosen according to the household survey data on walking time to collect forest products (mean = 76 min, mode = 120 min; 96% of the sampled households declare to walk 180 min or less). To account for the fact that the population of the villages located on the west side of the forest would also harvest forest products from Namizimu forest, we calculated a travel time map for both the west and the east side villages and assigned the pixels that overlay to the group of villages (east or west) for which the walking time is lower. We used cost distance analysis tools to produce the final harvesting area map for the east side villages which covers 31,752 ha of the Namizimu forest reserve.
Mapping the Ecosystem Service Potential Supply
We quantified the current biomass stock, i.e., potential supply of ES, in the Namizimu forest reserve using a combination of remote sensing data, i.e., Normalised Difference Vegetation Index mapped at 30 m resolution, and forest biomass measurements performed on the ground. We thereby produced a map of biomass supply expressed in tonnes, i.e., 1,000 kg of dry biomass, at 30 m resolution for the Namizimu forest reserve area.
The field inventory data were extracted from a forest biomass survey conducted in Malawi in 2011 by the Forestry Research Institute of Malawi (FRIM). The biomass survey was part of the Forest Preservation Programme funded by the government of Japan which aimed to develop a monitoring, reporting and verification (MRV) system for the reduction of carbon emission in the forestry sector (Makungwa, 2012). The survey covered 17 priority forest reserves across the three regions of Malawi which were selected by the Department of Forestry as pilot sites for the implementation of REDD+ programmes. For the Namizimu forest reserve, 53 sample plots were randomly selected through overlaying grid points at a 4 km interval on the whole forest area. Each grid point was associated with GPS coordinates which were used to determine the centre of a circular plot of a size of 0.1 ha. For each plot, all trees with diameter at breast height (DBH) greater than or equal to 20 cm were included in the dataset, the trees species names were recorded and the DBH, tree height (HT), clear length and crown diameter were measured.
The above-ground dry biomass (AGB) of each sampled tree in the plots was estimated using the allometric biomass model (eq. 1) developed for miombo woodlands in Malawi (Kachamba et al., 2016). The carbon content is assumed to be 47% of the dry biomass (Kachamba et al., 2016).
The total AGB value for each plot was calculated by summing up the AGB estimates for each tree in the plot.
Next, we estimated a regression model to quantify the relationship between AGB estimates for each plot and the Normalised Difference Vegetation Index (NDVI) georeferenced values to interpolate the biomass value stock across the whole Namizimu area and produce a map of total biomass supply. We used a map of NDVI at 30 m resolution as processed by Neil (2018) who used Landsat-8 images collected at the end of the wet season for 2013. The year 2013 was chosen because the images were cloud-free over the Namizimu area, and therefore less prone to measurement error. The NDVI is a spectral vegetation index which is derived from remote sensing images by combining algebraically the values of the spectral reflectance in the red and in the near infrared (Beck et al., 2011). The NDVI index ranges between 0 and 1, where a very low value corresponds to bare areas while high values indicate a high prevalence of vegetation. The spectral index was associated to biophysical variables such as Leaf Area Index, biomass and productivity (Beck et al., 2011; Gizachew et al., 2016).
To link the AGB data with the NDVI data, we first had to spatialise the AGB estimates. We did this by creating a circular buffer centred on the UTM coordinates of each field plot, using the plot radius reported in the field measurement dataset. We then overlaid the AGB map with the NDVI map and calculated the average NDVI value for each plot to be used as independent variable in the regression model. We masked the NDVI map using the FAO dominant landscape map at 30 arc-second resolution (Latham et al., 2014) and selected the area classified as forest; this allowed us to exclude areas which are included within the reserve boundaries but that have been deforested (e.g., tea plantations areas). We explored the relationship between AGB and NDVI statistically by calculating the Spearman’s rank correlation coefficient (ρ) and visually by analysing the scatter plot of AGB against NDVI. The scatter plot (see Supplementary Appendix 1) suggested a linear relationship, so we estimated a linear regression model and used the Bonferroni outlier test together with visual analysis of the scatter plot to detect and exclude outliers (Fox, 2016). We then interpolated the biomass estimates across the whole Namizimu forest area using the estimated regression model and assigned value zero to each pixel that had a negative biomass value. For the linear regression model, we excluded four plots from the forest inventory sample because there were no data recorded and we further excluded two other plots because they were identified as outliers using the Bonferroni outlier test. The dataset used for the regression analysis hence included the total AGB estimated for 47 plots of 0.1 ha; for each plot there are on average 9 trees (SD 5 trees) and the mean estimated AGB is 6.49 tonnes of dry biomass (SD 4.03; mean biomass per ha 62 tonnes).
Current Use
To estimate the current demand for dry biomass by the 110 villages of interest, we used the data obtained through a household survey administered in six villages selected from the east side villages (Figure 1). The six villages were selected using a random spatial sampling strategy. The households to be interviewed within each village were selected using a stratified random sampling strategy based on gender, age, and wealth status.
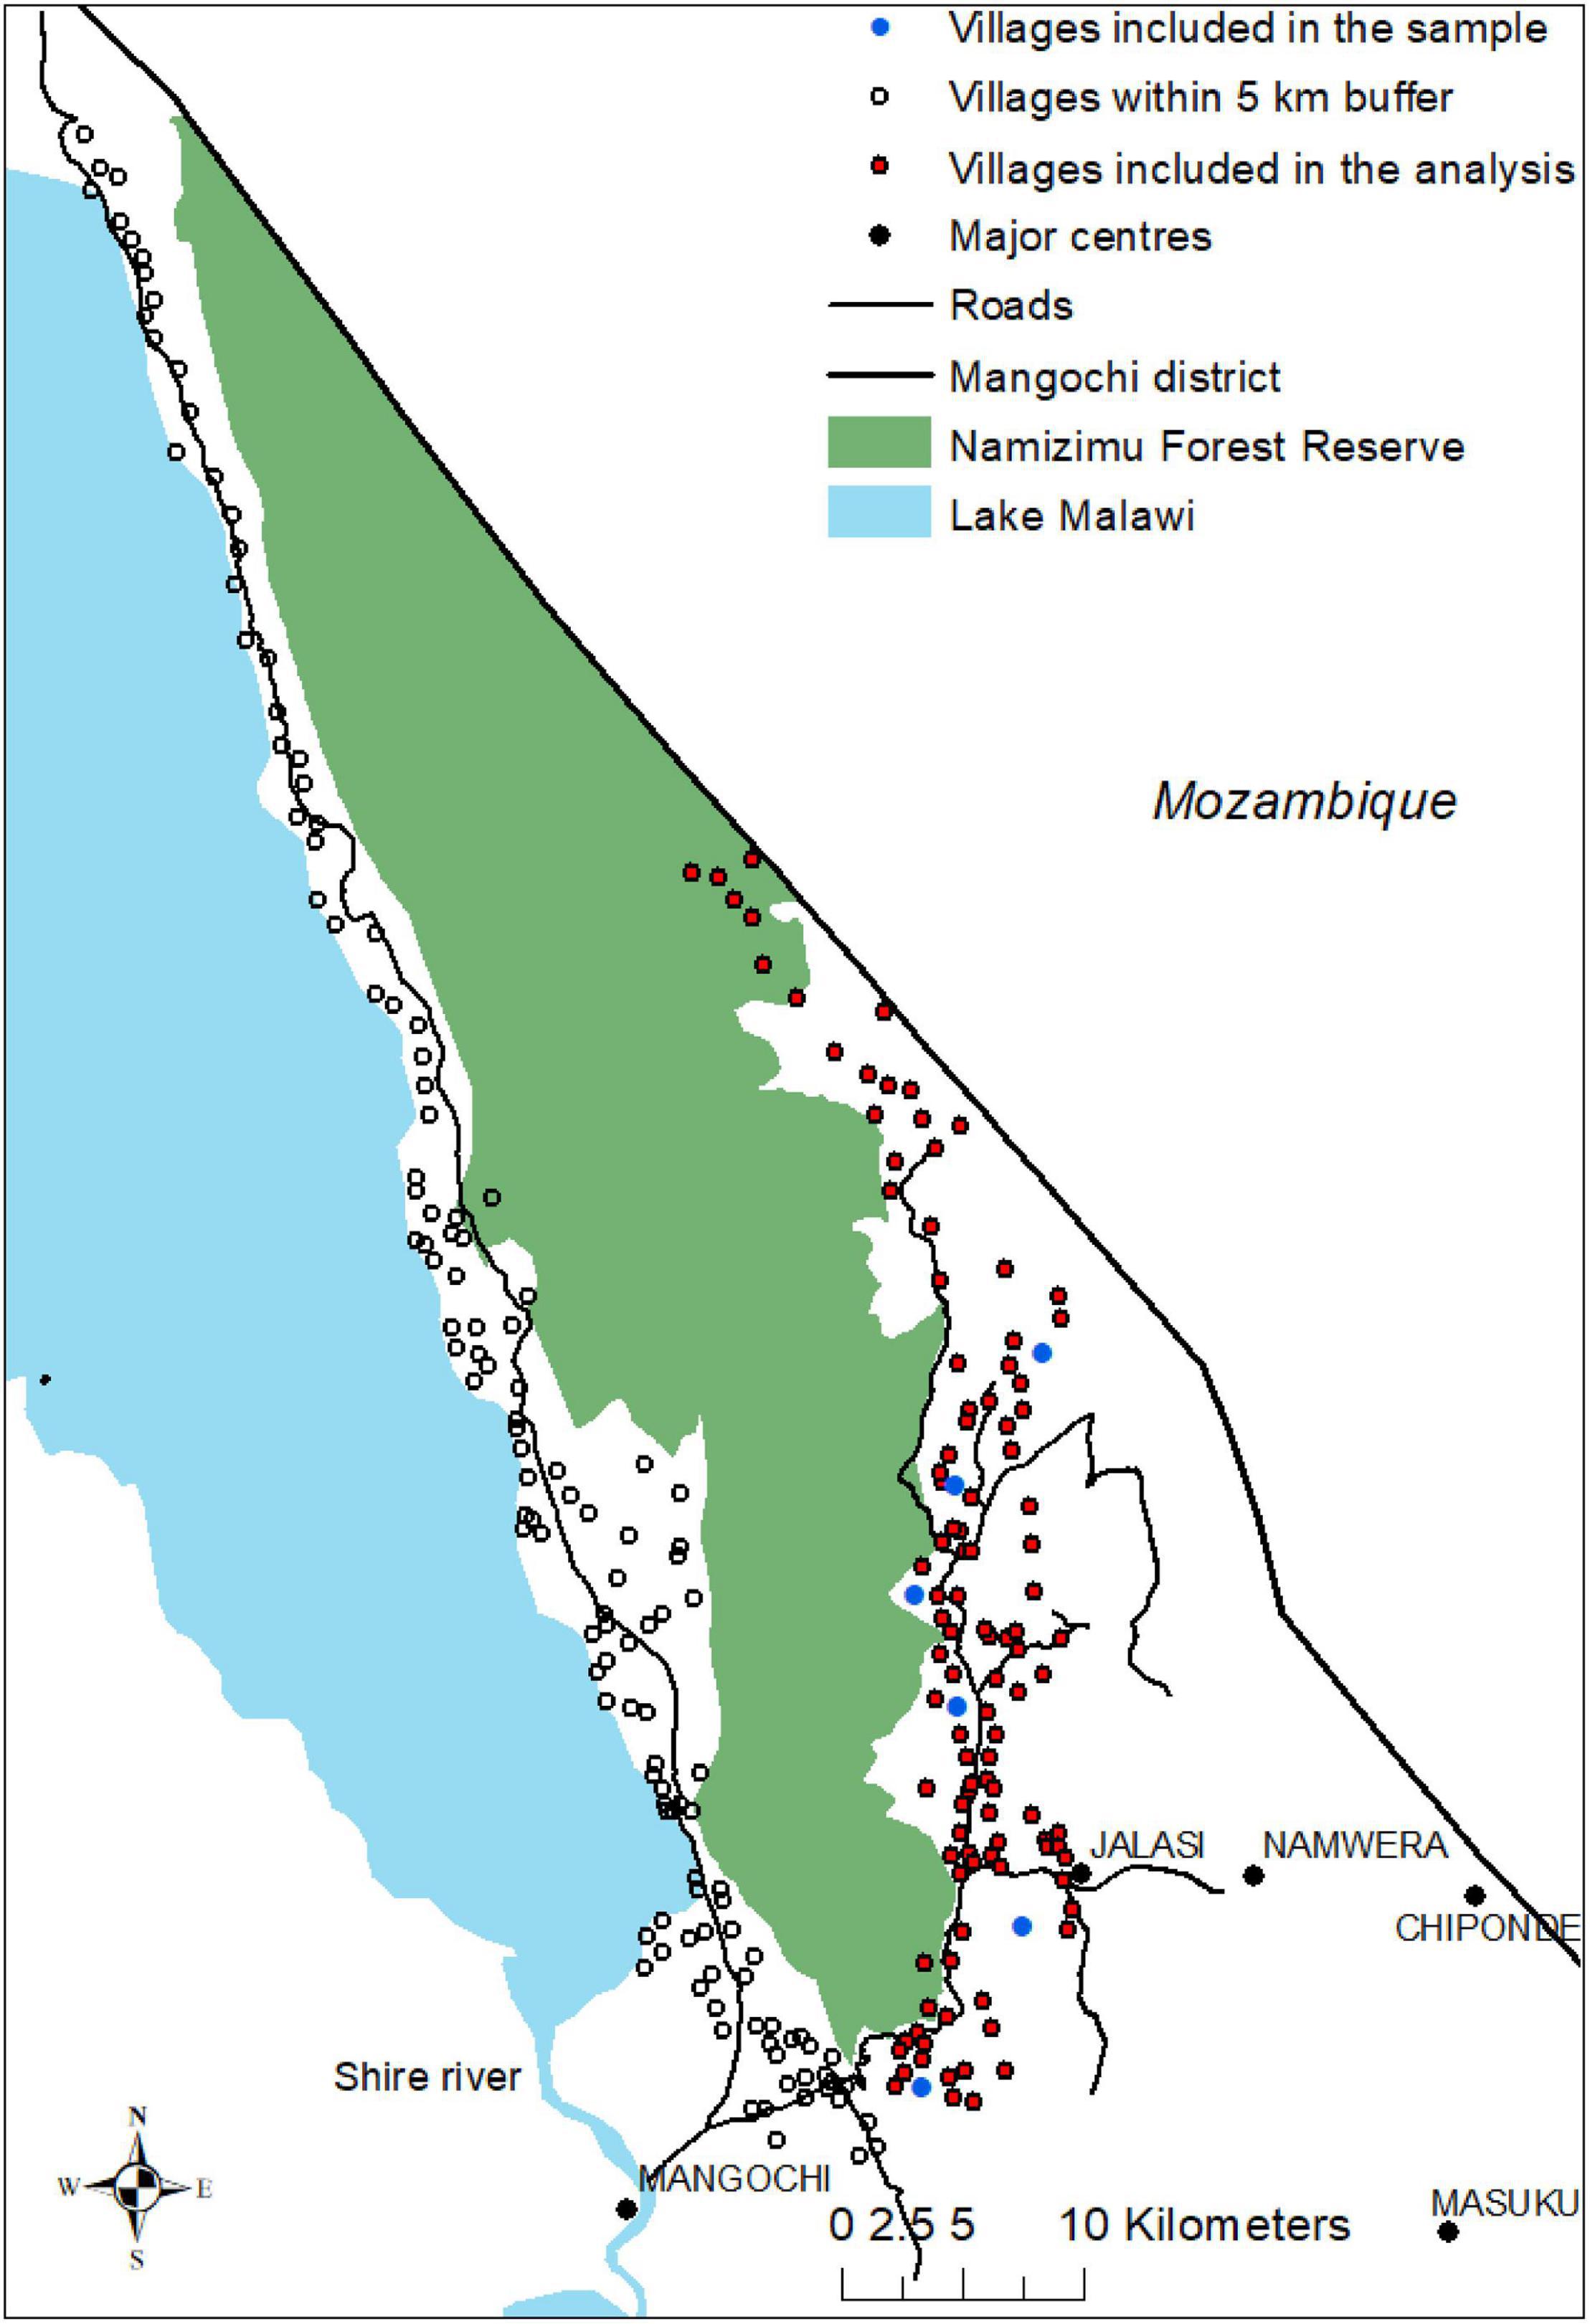
Figure 1. Case-study area. The map includes a visualisation of Namizimu Forest Reserve boundaries and all the villages surrounding the area that are located within a 5 km buffer. The villages included in the scenario analysis are in red while the villages where we collected primary data on consumption of forest products through household survey are in blue. The location of the blue villages is slightly shifted to guarantee compliance with research ethic requirements.
We quantified the woody biomass extracted by households based on the sample median yearly consumption of four different forest products: firewood, poles, timber, and charcoal. The quantities extracted for each product were recorded using customary measurement units, such as headloads for firewood. These were translated into dry biomass expressed in tonnes using conversion factors adopted by FRIM, available in the literature (Marge, 2009) or information provided in the original survey. The data were collected within a 3-week period. The data collected through household surveys suffer from some limitations which are common in data collection on natural resource uses (Schaafsma et al., 2012). The survey question required respondents to recall how much forest products they collected over a certain time period, and this recalled quantity may be inaccurate. Moreover, collecting forest products from Namizimu forest reserve is illegal unless licenced by the forest department, but some harvesting is done without a licence and therefore classified as illegal. Even though we put great care in guaranteeing anonymity to our respondents and obtained information on illegal harvesting from some respondents, it is likely that our data are characterised by underreporting especially for poles and timber collection.
Step 2: Model the Spatial Connection Between Demand and Supply by Connecting Villages With the Forest Catchment Area
To model the spatial connection between potential supply for ES, biomass available in the forest, and potential demand for ES, forest products consumption of population in the surrounding villages, we simulated a hypothetical co-management scheme. To simulate such scheme, we grouped each village included in the east side villages together with its closest villages by using cluster analysis and assigned to each of these group of villages a sub-area of the forest catchment area, i.e., co-management block, for harvesting activities by using the walking distance approach. We consider each group of villages as the basic unit of analysis for quantifying the potential demand of ES while each co-management block is the basic unit of analysis for potential supply of ES.
We grouped single villages together in a group village, called village cluster henceforth, using a cluster algorithm that aims to minimise the distance between village points within the group and maximise the distance between village points across the different groups. The underlying assumption is that villages which are closer to each other are all close to the same forest sub-area and are also more likely to have aligned interests regarding management objectives. We used the Partitioning Around Medoids (PAM) clustering method which, given the chosen number of clusters (k), finds the optimal partition of the objects contained in the dataset in k clusters (Leonard et al., 1987). We chose the number of k clusters assuming that each forest management block would be allocated to a group of 5 villages, following interviews with experts from the forest department; this means that the total of 110 villages had to be clustered into 22 groups. The algorithm employed for the clustering exercise (PAM) is usually sub-optimal and the clusters produced by it may vary depending on which are the chosen k starting points from the dataset (Fowler et al., 1981). Therefore, to evaluate the sensitivity of our modelling approach we ran the algorithm several times specifying a different random set of k starting points and verified that the algorithm produces a stable set of clusters, i.e., either the same exact clusters or with very minimal differences (just one village gets allocated to a different cluster).
Next, we defined the harvesting area for each cluster of villages using a walking distance approach. We produced an accessibility map that assigns a foot-based travel time to each possible harvesting location for each village (see Supplementary Appendix 3 for an example of map output). Then, we produced a single travel time map for each village cluster by taking the average values of the travel maps relative to each village within the cluster. We defined the cluster harvesting area by including all harvesting locations that can be reached within 180 min. Finally, we assigned each harvesting location exclusively to one cluster by assigning it either to the cluster that can reach the location or, when the harvesting location falls into two or more cluster harvesting areas, to the cluster that can reach it in the lowest walking time.
Step 3: Scenario Analysis
Business as Usual Scenario
To evaluate the future ecological sustainability of current management practices and consumption patterns we estimated a business-as-usual scenario to compare quantity of biomass supplied and biomass demanded for each co-management block. The base year is 2015 and we analysed the scenario over a horizon of 15 years, until 2030, with yearly steps assuming an annual population increase and that per household consumption of forest products across time is constant.
We calculated the biomass supplied by each block for each year by adding to the current estimated biomass the mean annual increment per ha estimated by Green et al. (2016) for Malawi miombo woodlands. We calculated the total biomass demanded by each village cluster by estimating average consumption of a household based on data collected through household’s survey data for six villages. The number of people collecting the various forest products did not differ significantly across the villages (P-value > 0.10 for each forest product, Fisher’s exact test), therefore we considered our estimated demand representative of the whole sub-population located in the east side of the forest reserve. Under this assumption we multiplied the estimated amount for the total population of each village cluster of the east side villages to obtain total consumption for each village clusters.
We estimated the total population of each cluster using the gridded population map of Malawi for 2015 version 2.0 produced by WorldPop (Tatem, 2017) at a 100 m resolution, which reports the total number of people for each pixel. We used the modelled gridded population because it is more representative of the spatial distribution of the population across the area than the administrative unit counts. We used the Thiessen polygon tool in ArcGIS, from the proximity toolset, to partition the population map in unique polygons with one village point at its centre. The population of each cluster was calculated as the sum of the population within all villages’ polygons of the cluster. Finally, we calculated the number of households assuming a mean household size of four members according to our household survey data. Finally, we estimated the population for each year using the UN world population average exponential rate of growth for Malawi estimated over a period of 5 years of 2.66% (medium fertility variant, UN DESA, 2019).
Co-management Scenario
To evaluate co-management policies and their distributional rules, we performed a monetary valuation exercise using a DCE. We developed a co-management scenario based on the assumption that the quantity of biomass that can be extracted from each co-management block would be capped to its sustainable level. The ecologically sustainable amount is defined as the quantity of biomass that can be extracted without reducing the productive capacity of the forest (Luckert and Williamson, 2005). We assumed that the annual sustainable harvest rate for each forest co-management block is equal to 80% of the AGB growth (Otuoma et al., 2011) and we approximated the AGB growth using the mean annual increment per ha modelled by Green et al. (2016). The average estimated quantity of biomass that Miombo woodlands in Malawi can provide in a year is 1.639 t/ha. We calculated the total quantity of biomass that can be extracted under a sustainable management regime by multiplying each block area by the estimated mean annual increment.
Finally, we developed a set of hypothetical distributional rules to allocate the sustainable biomass amount available to each cluster to its total population. We converted the total biomass supply expressed in tonnes in number of trees using an average quantity of biomass per tree calculated from our field inventory dataset. We analysed nine different distributional scenarios where the available biomass is distributed in different proportions among better-off (“rich”) and worse-off (“poor”) village members in each cluster (Table 2). We calculated the total number of rich and poor households using the proportion of people that define themselves as relatively rich and relatively poor in our household sample (31 and 69%, respectively) and we assume that this proportion remains constant over time.
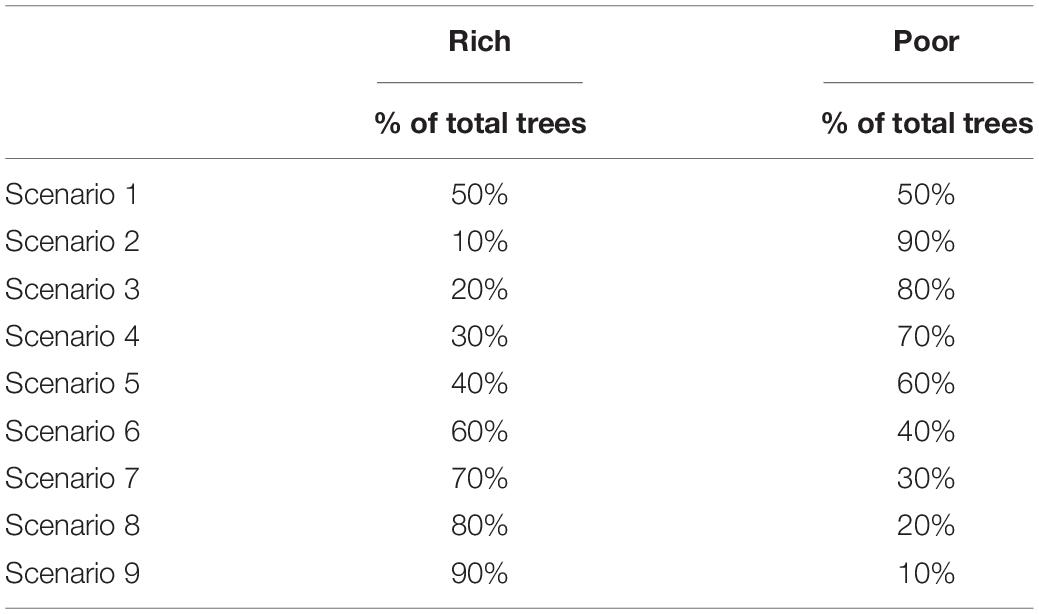
Table 2. Distributional rule for scenarios.
The maximum number of trees available for each household under all scenarios is capped to 15 per year as this was the maximum amount that could be harvested in the hypothetical policy scenario in the DCE. To account for variability in forest users’ needs we applied our distributional scenarios considering that total biomass is distributed to: (1) the total population, (2) the proportion of people who stated to be interested in harvesting forest products in our sample (97%), (3) the proportion of people interested in harvesting poles and timber (55%) and (4) the proportion of people interested in harvesting timber (21%) [see Supplementary Appendix 2 for a summary of the results for scenarios (2–4)].
Finally, we assessed the welfare impact of co-management policies by using WTP estimates from our DCE survey. Our DCE survey assessed the contribution to individual welfare of different levels of biomass provision under a co-management policy and of the distributional rules used to allocate the biomass to other village members identified based on a wealth status category, i.e., rich, and poor village members.
In our DCE respondents were asked to choose among co-management options described as a hypothetical distribution of biomass, expressed as the number of trees for each household, among the respondent himself, a village member poorer than them and a village member richer than them. Formally, the individual is assumed to maximise their utility function, i.e., an additive function including all the different characteristics of the co-management policies on offer:
The marginal WTP for each of the DCE attributes (MWTP) provides a monetary measure of individual’s welfare gain (or loss) for a one unit increase of biomass, here described using trees as a proxy. The MWTP associated with allocating one additional tree to a village member poorer than the respondent is calculated as the ratio of the biomass (trees for self) attribute coefficient and the price attribute coefficient:
We used the estimated MWTP for the biomass attributes to calculate the monetary welfare changes associated with the different distributional scenarios. Water availability is assumed to be constant across the scenarios, primarily because a suitable hydrological model coupled with forest cover was unavailable for the type of biome of the Namizimu forest.
The individual WTP values for a poor and a rich village member for cluster 1 are calculated as:
Where Treesrich_1 and Treespoor_1 are the number of trees allocated to rich and poor village members in cluster 1 following the rules of the distributional scenarios. MWTPself does not differ between rich and poor respondents (Dreoni, 2019).
According to the utilitarian framework, the societal welfare value, i.e., the welfare effects of a policy change for the whole population, is obtained as the sum of the individual WTP. The total WTP aggregated over the population for cluster 1 is calculated as:
We used total WTP estimates at cluster level to evaluate which distributional scenario maximises total societal welfare, the societal welfare of the poor and of the rich population, for each cluster and for the total forest catchment area, where the latter is calculated as the sum of the total WTP of all clusters.
Results
Potential Biomass Supply and Demand
Current Potential Supply
The linear relationship between estimated AGB and NDVI is positive and statistically significant (Table 3). We used this model to produce a biomass supply map for the year 2013 (Figure 2). Following Gizachew et al. (2016) we evaluated the model performance using the root mean square error (RMSE) expressed as the percentage of the mean AGB estimated from the field inventory and the absolute bias. The RMSE% is 53% and the absolute bias is 0.0001 t/ha, suggesting that the model’s accuracy is comparable with previous work that used a similar approach (Gizachew et al., 2016).
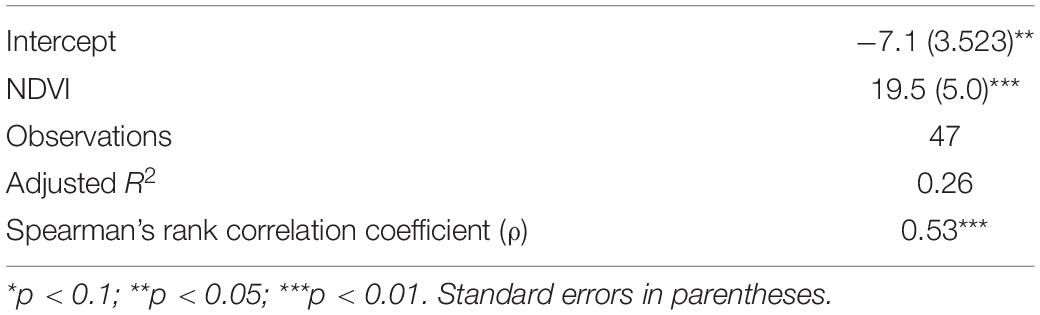
Table 3. Ordinary least squares (OLS) regression results. The dependent variable is the total biomass expressed in tonnes for each 0.1 ha plots regressed on average NDVI for the same plot area.
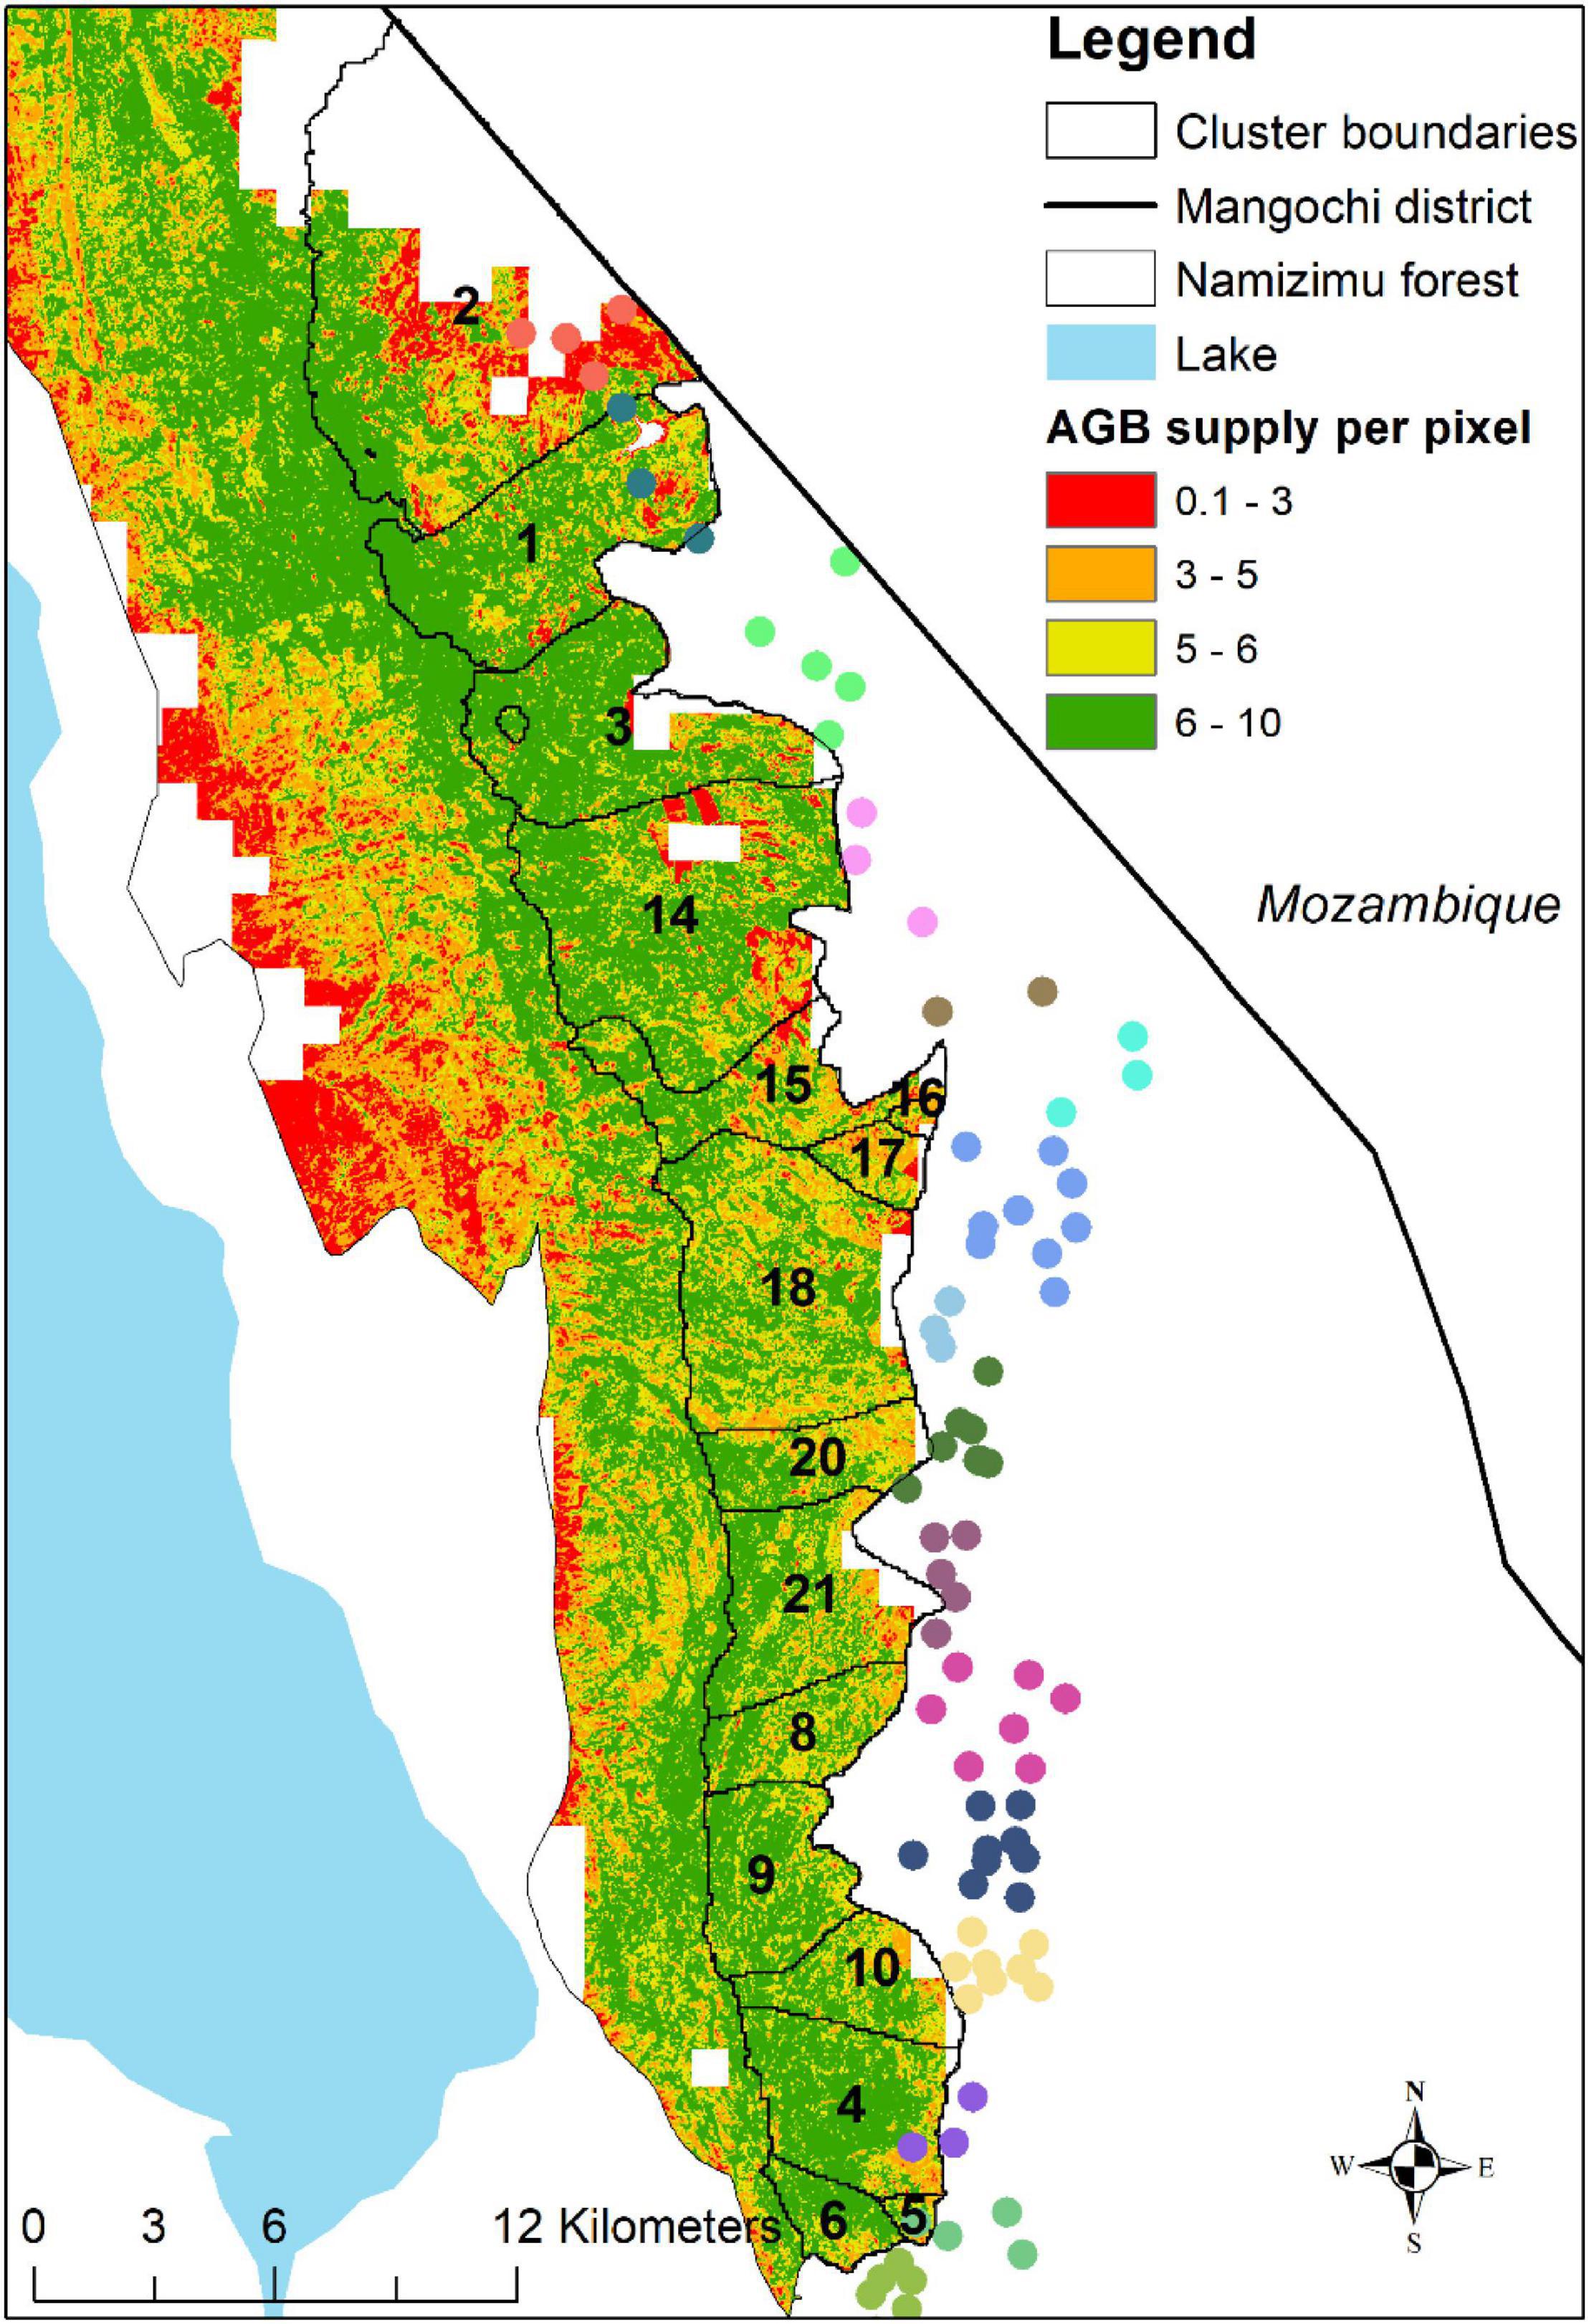
Figure 2. In the figure, we show the results of the potential supply quantification, i.e., the potential biomass that can be extracted from Namizimu forest reserve. The map presents the AGB estimated for each pixel of 30 m × 30 m size (0.09 ha) and therefore the order of magnitude of the estimates differs from the standard measure of biomass expressed in t/ha. The biomass map is overlaid with the boundaries of the modelled co-management blocks. These blocks together form the forest catchment area corresponding to the cluster of villages located on the east side of the forest. Villages of the same colour belong to the same cluster and are allocated one specific co-management block in the forest.
Current Use
The estimated median current consumption of forest products in terms of quantities harvested per household per year is presented in Table 4, along with the relative frequency of households harvesting trees for those products disaggregated at village level. Overall, about three out of every four households collect firewood from Namizimu forest reserve while 13% of our respondents collect poles (Table 4). Tree harvesting for timber and charcoal production is done by 1 and 5% of our sampled households, respectively. The estimated median quantity of dry biomass extracted for firewood is 4.8 tonnes a year, which is very similar to the estimated annual consumption of firewood (4.6 tonnes) for communities living in the surrounding of Chimaliro and Liwonde forest reserve (Jumbe and Angelsen, 2011).
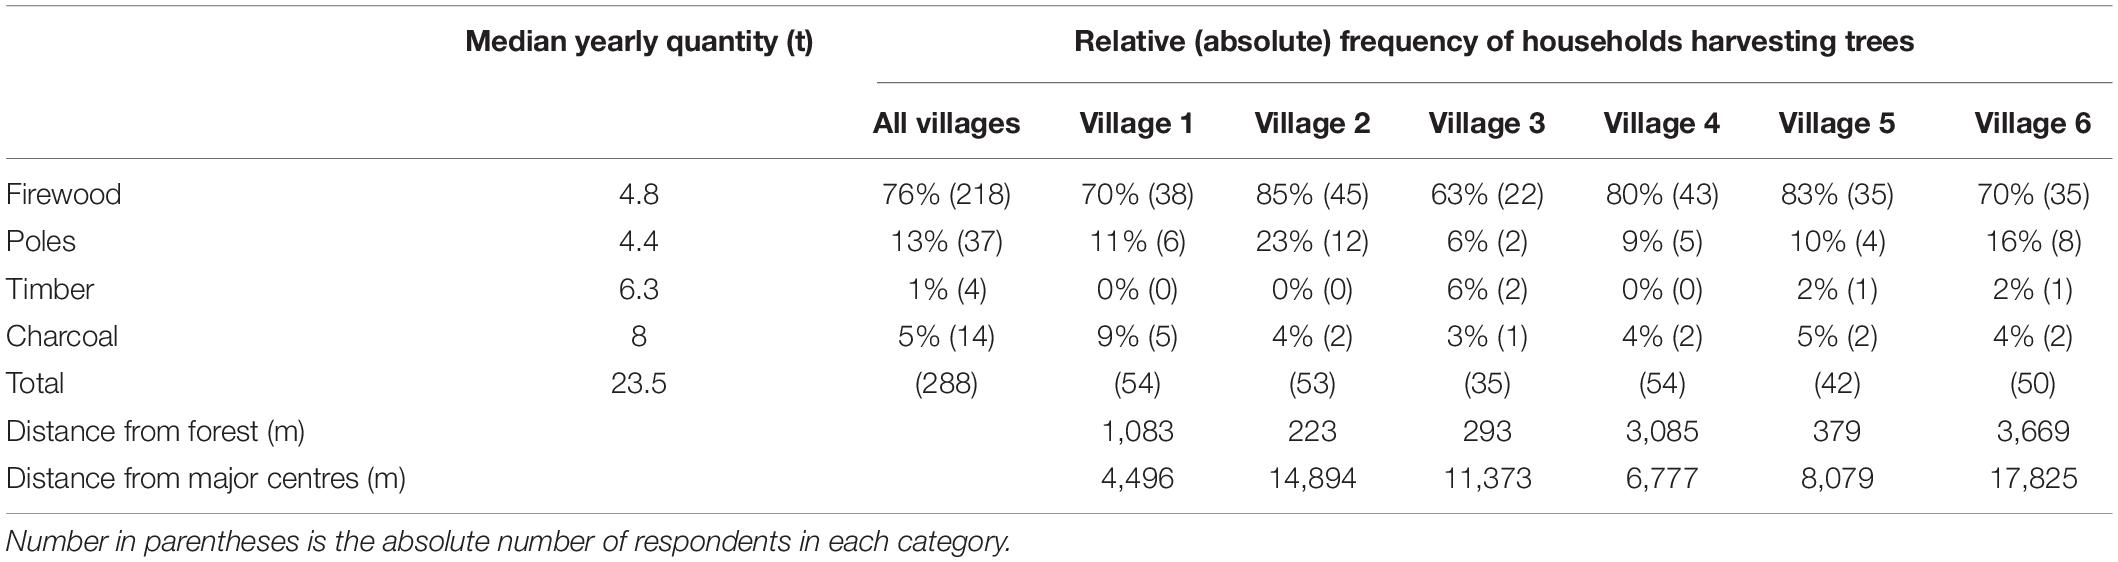
Table 4. Descriptive statistics of current biomass demand disaggregated by village and product.
The forest products collected by the sampled households are used almost exclusively for domestic consumption, firewood and charcoal are used as main energy source while poles and timber are used as construction material. Very few households engage in trade or other income-generating activities using forest products extracted from Namizimu. We further investigated the use of forest products for income-generating activities among the households interviewed and we found that trade and sales of forest products is very limited in the area, where about 20% of the respondents declare to sell firewood for income when needed, while less than 1% sells poles and timber.
Spatial Connection Between Demand and Supply: Village Clusters and Co-management Blocks
The distance-based processing generated 22 village clusters with a cluster composed of five villages on average (SD 2). Six clusters (28 villages) were not allocated a forest harvesting area because their entire harvesting area always overlaid another cluster’s area with a lower cost distance, and therefore were excluded from further analysis. The average distance from the forest edge of the excluded villages was 3,568 m, compared to 1,437 m for the remaining villages and given the importance of accessibility for harvesting (Albers and Robinson, 2013), excluding the six furthest clusters seems reasonable.
The average size of the co-management blocks is 1,984 ha but varies greatly across clusters (SD 1,821 ha – Figure 2 and Table 5). As discussed above, the delineation of co-management areas is negotiated on a case-by-case basis according to multiple criteria, therefore there are no standards against which we can compare our simulated co-management blocks. However, actual co-management policies implemented in Liwonde forest reserve located in southern Malawi (area of 26,991 ha) show similar variability in block forest size ranging from 357 to 2,721 ha. The total above-ground biomass supplied by each co-management block expressed in t/ha ranges between 31.15 and 69.47. The range translated in carbon content (14.64–32.65 tC/ha) is in line with the range of 13–30 tC/ha estimated by Shirima et al. (2011) for a Miombo area in Tanzania and the average of 21.2 tC/ha estimated by Ryan et al. (2011) for a Miombo area in Mozambique.
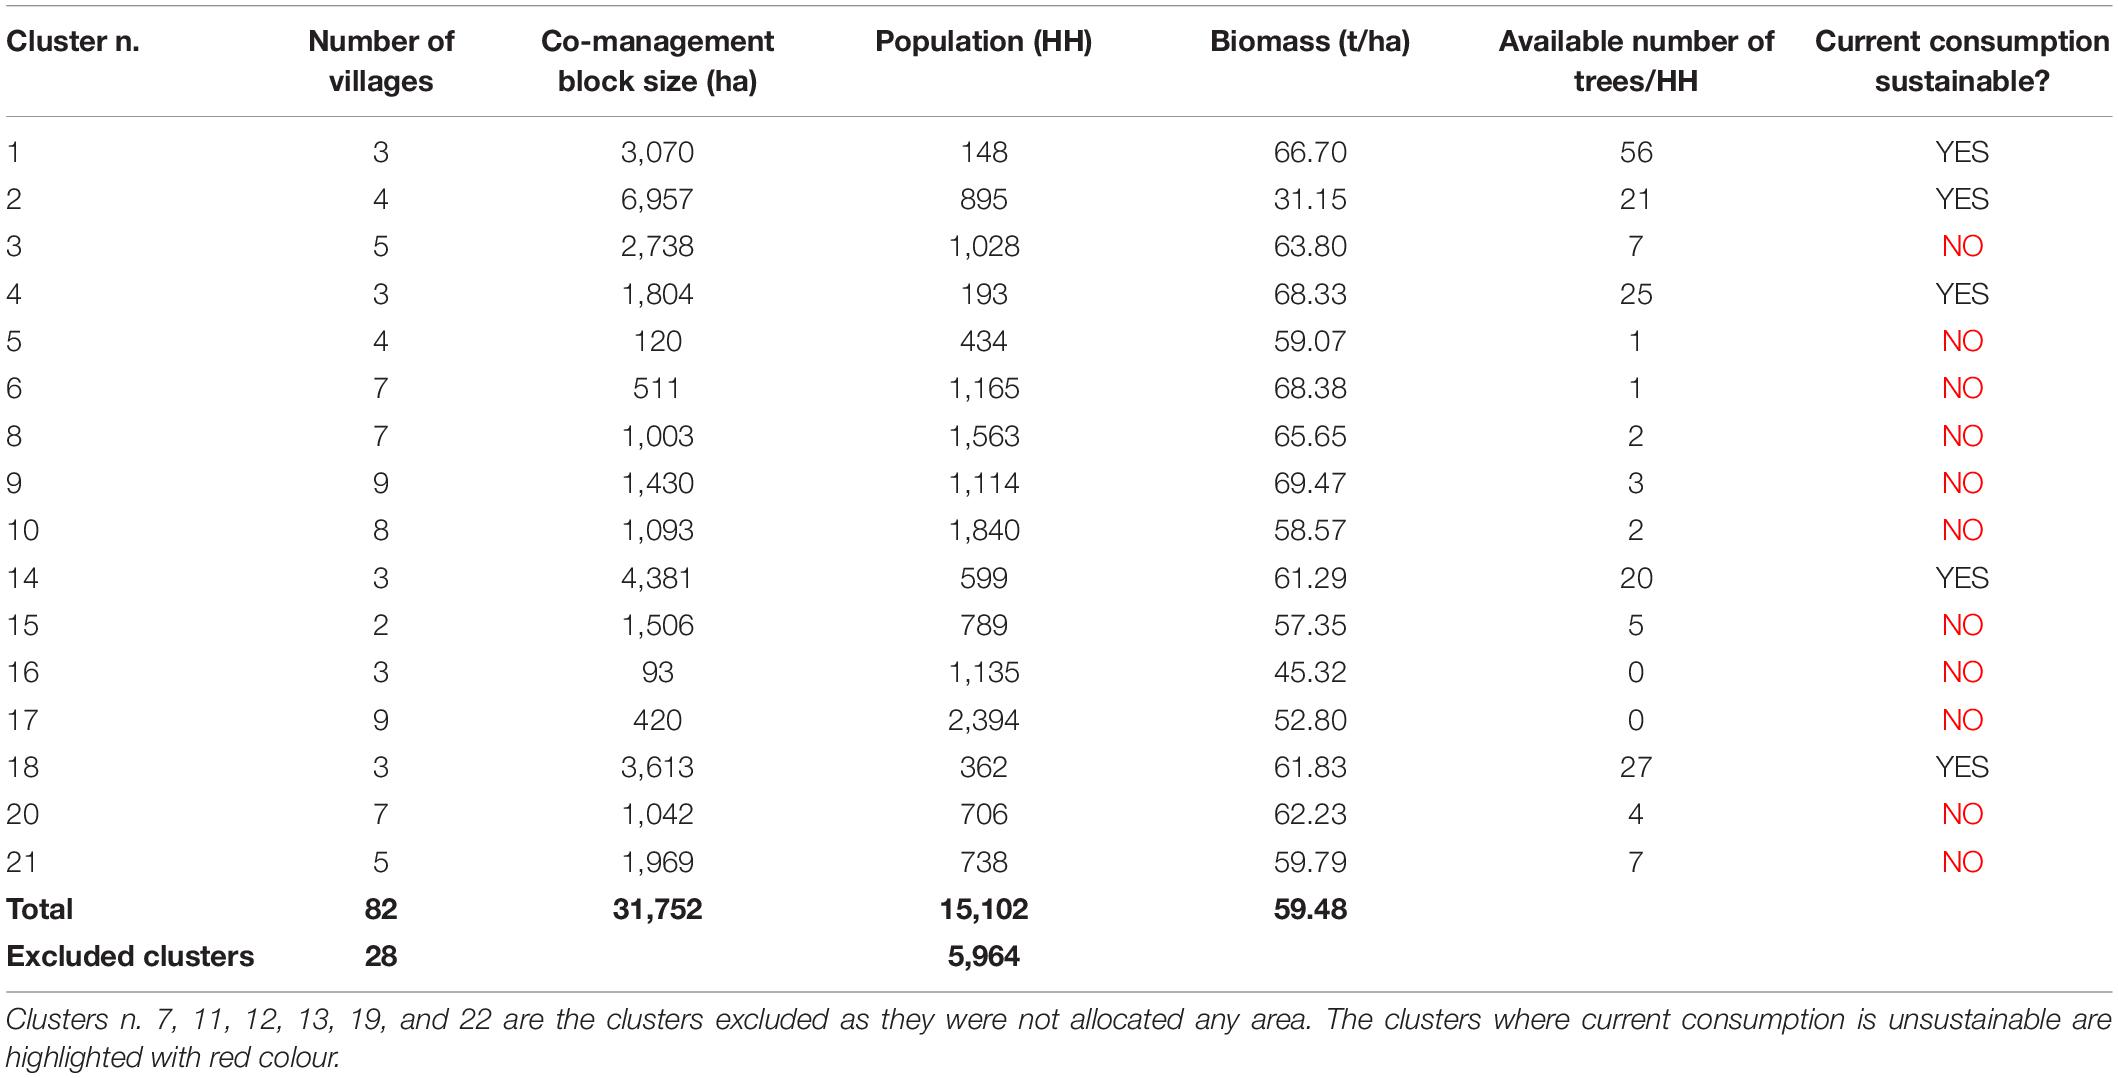
Table 5. Current situation in the base year (2015) for each cluster.
The number of households (HH) assigned to each co-management block is also characterised by great variability ranging from 148 households in cluster n. 1–2,394 households in cluster n. 17. Such spatial variability determines a different initial distribution of forest resources to each household depending on the size and the ecological status of each co-management block. The last column reports the absolute number of trees that can be sustainably harvested by each household according to their co-management block size and shows that there are great inequalities across co-management blocks in the amount of biomass that can be extracted. Specifically, cluster n. 1, 2, 4, 14, and 18 can potentially extract a high quantity of biomass and would certainly be able to satisfy average firewood demand for each household, estimated at 10 trees. The households assigned to the clusters n. 5, 6, 16, and 17 are instead in great disadvantage given the small size of their co-management block. The remaining clusters are also characterised by a low number of trees that could be harvested sustainably by each household implying that not everyone would be able to obtain the current demanded quantities.
Scenario Analysis
Business as Usual Scenario
The current initial stock of biomass is sufficient to cover demand for all clusters, however, the current yearly consumption is higher than the capacity of the forest to re-generate in many clusters. The analysis of changes over time (see Figure 3) shows that the current consumption patterns are unsustainable and that the forest harvesting area would be highly degraded by 2030. The average amount of biomass provided per ha in 2015 is 59.48 t/ha, decreasing to about 31.40 t/ha by 2030, assuming that all households continue harvesting and, when their co-management block is completely degraded, either harvest from a different co-management block or start trading with other areas. Figure 3 shows that the number of blocks that are fully degraded and deforested and do not provide above ground tree biomass, represented as white blocks, increases over time. It further shows that the co-management blocks located in the south area are more prone to degradation due to the higher population density and a lower availability of forest ha per person. In the areas located in the north, the biomass supply is stable over time; due to a lower population density the biomass supply and demand budget is positive, and forest can potentially re-generate.
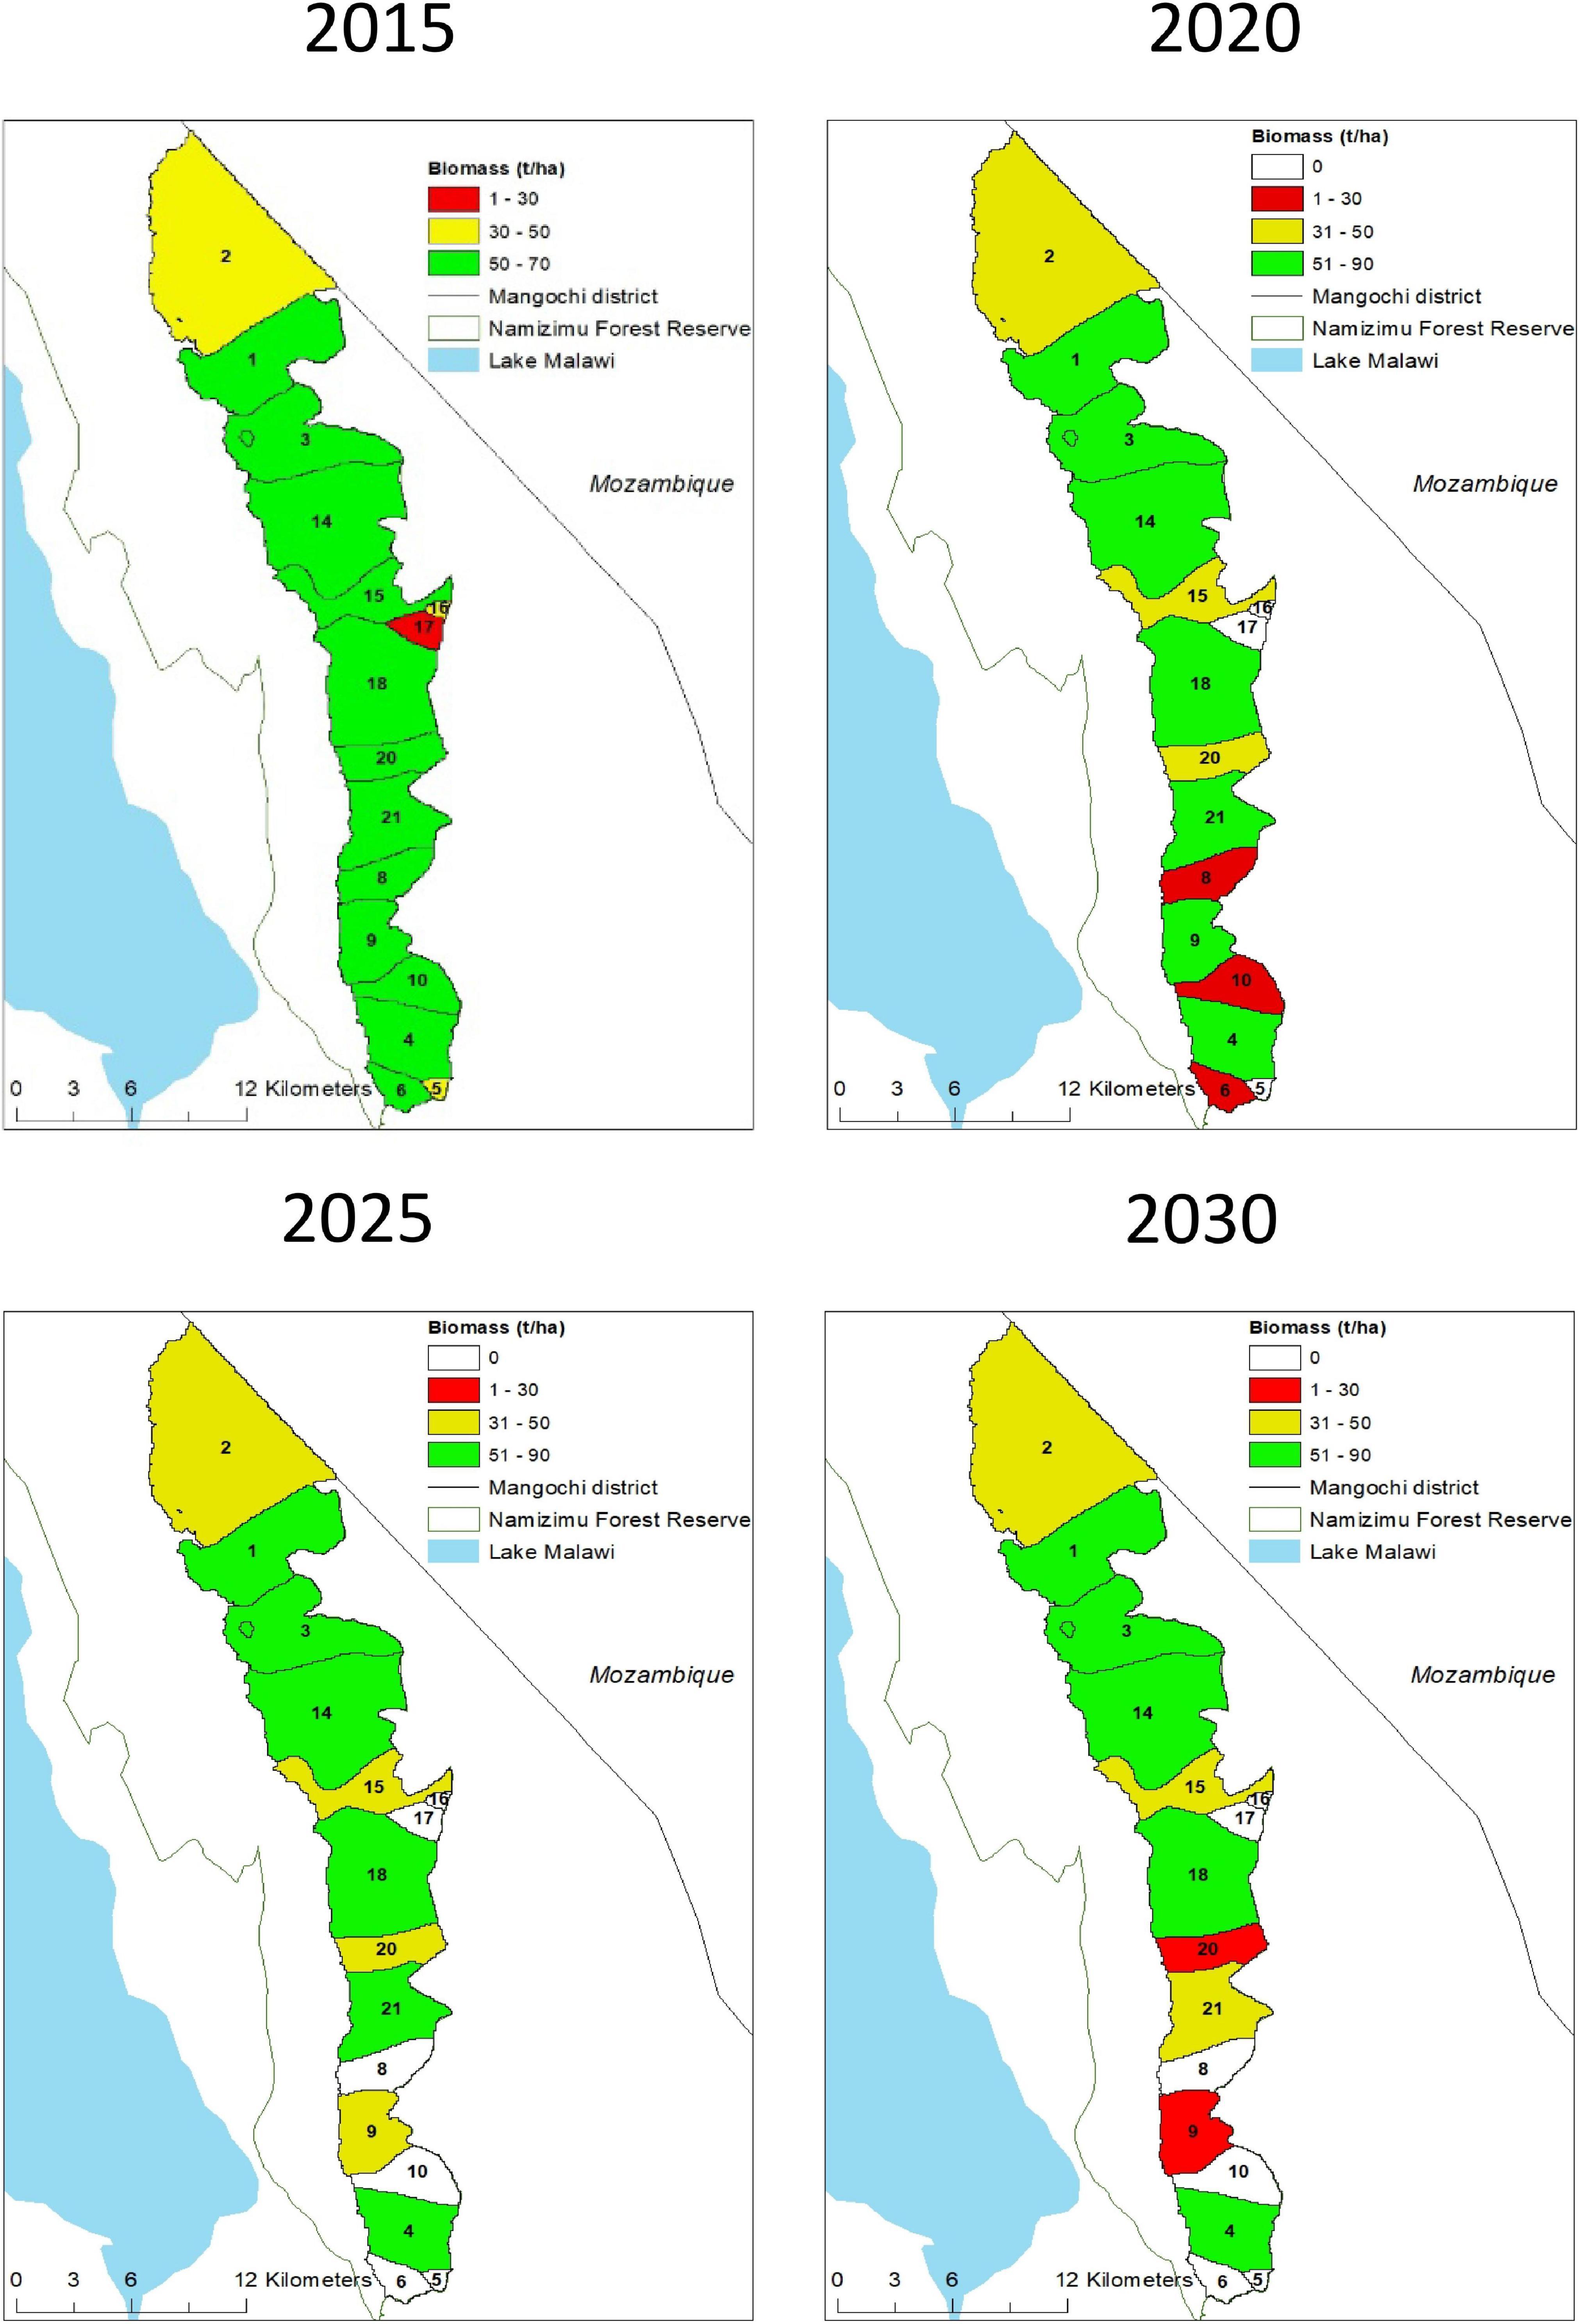
Figure 3. Scenario analysis [business as usual (BAU)].
Co-management Scenario
In Table 6, we present the average distribution of trees between rich and poor households for each scenario presented in Table 2 and the total WTP for the whole forest area in US$3. The scenario that maximises aggregated WTP for the total population is B5, where the rich village households would be allocated about 5 trees, while the poor would get about 4 trees. We also show the total WTP for each social group to provide a monetary measure of welfare trade-offs between the two groups across the different distributional scenarios. The distributional scenario that maximises total welfare (total WTP) is not the same as those scenarios that maximise total WTP for the poor (B2) or the rich group (B9). By measuring welfare with a monetary estimate, WTP, we are able to compare differences among these scenarios and quantify trade-offs. For example, we can verify that implementing scenario B5 produces a loss of welfare of the poor group of about 7% of the maximum welfare that can be obtained with scenario B2, but it produces a gain of 93% in welfare for the rich group compared to the B2 scenario. Hence, moving from B2 scenario to B5 scenario will greatly benefit the welfare of the rich group, while the loss for the poor group would be small in comparison. The gain for the rich group could potentially compensate the loss for the poor group, and therefore from a social welfare perspective overall society is better off with B5 than with B2. However, this type of monetary compensation and transfer would not take place thereby increasing inequality in allocation. Similarly, implementing the distributional scenario that maximise welfare of the rich (scenario B9) produces a loss in welfare of the poor of about 60% compared to the B2 scenarios and a loss of total welfare of about 20%. Implementing a scenario that is strongly in favour of the rich would lead to a reduction of welfare for the poor group which is not compensated by the gain in welfare of the rich group.
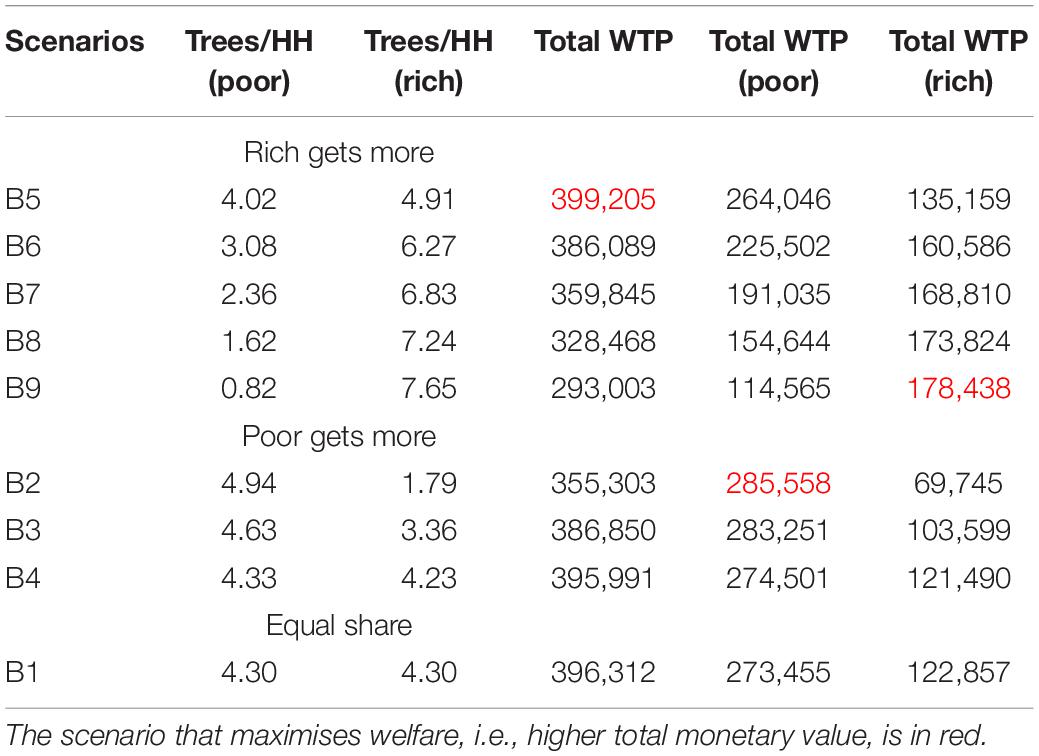
Table 6. Average distribution of trees and total WTP estimates across distributional scenarios.
Moreover, we performed a disaggregated analysis at cluster level to understand the trade-offs across different distributional scenarios when examining them at a more local scale of analysis and therefore considering the differences in ecological endowments for each cluster. Figure 4 shows which distributional scenarios maximise total WTP (blue), WTP of the poor group (red) and WTP of the rich group (green) for each cluster. For the clusters 1, 2, 4, 14, and 18, many scenarios are optimal according to these three criteria, including two scenarios that are considered optimal at aggregate level (B2 and B5). These clusters have a high availability of biomass with an average number of available trees per person of at least 20 trees, where under many distributional rules each village member would be allowed to harvest the maximum number of trees per year (15 trees). For the remaining clusters, where biomass supply is more limited, the B9 scenario is found to maximise total WTP and WTP for the rich group in many cases, while the B2 scenario is found to be optimal for the poor group as at the aggregate level. The figure shows that there is high variability across clusters about what distributional scenarios maximise the three WTP sums. Indeed, the “optimal” distributional scenario depends on the combination of many factors including, among others, the ecological endowment of the forest area examined and the distributional preferences of forest users.
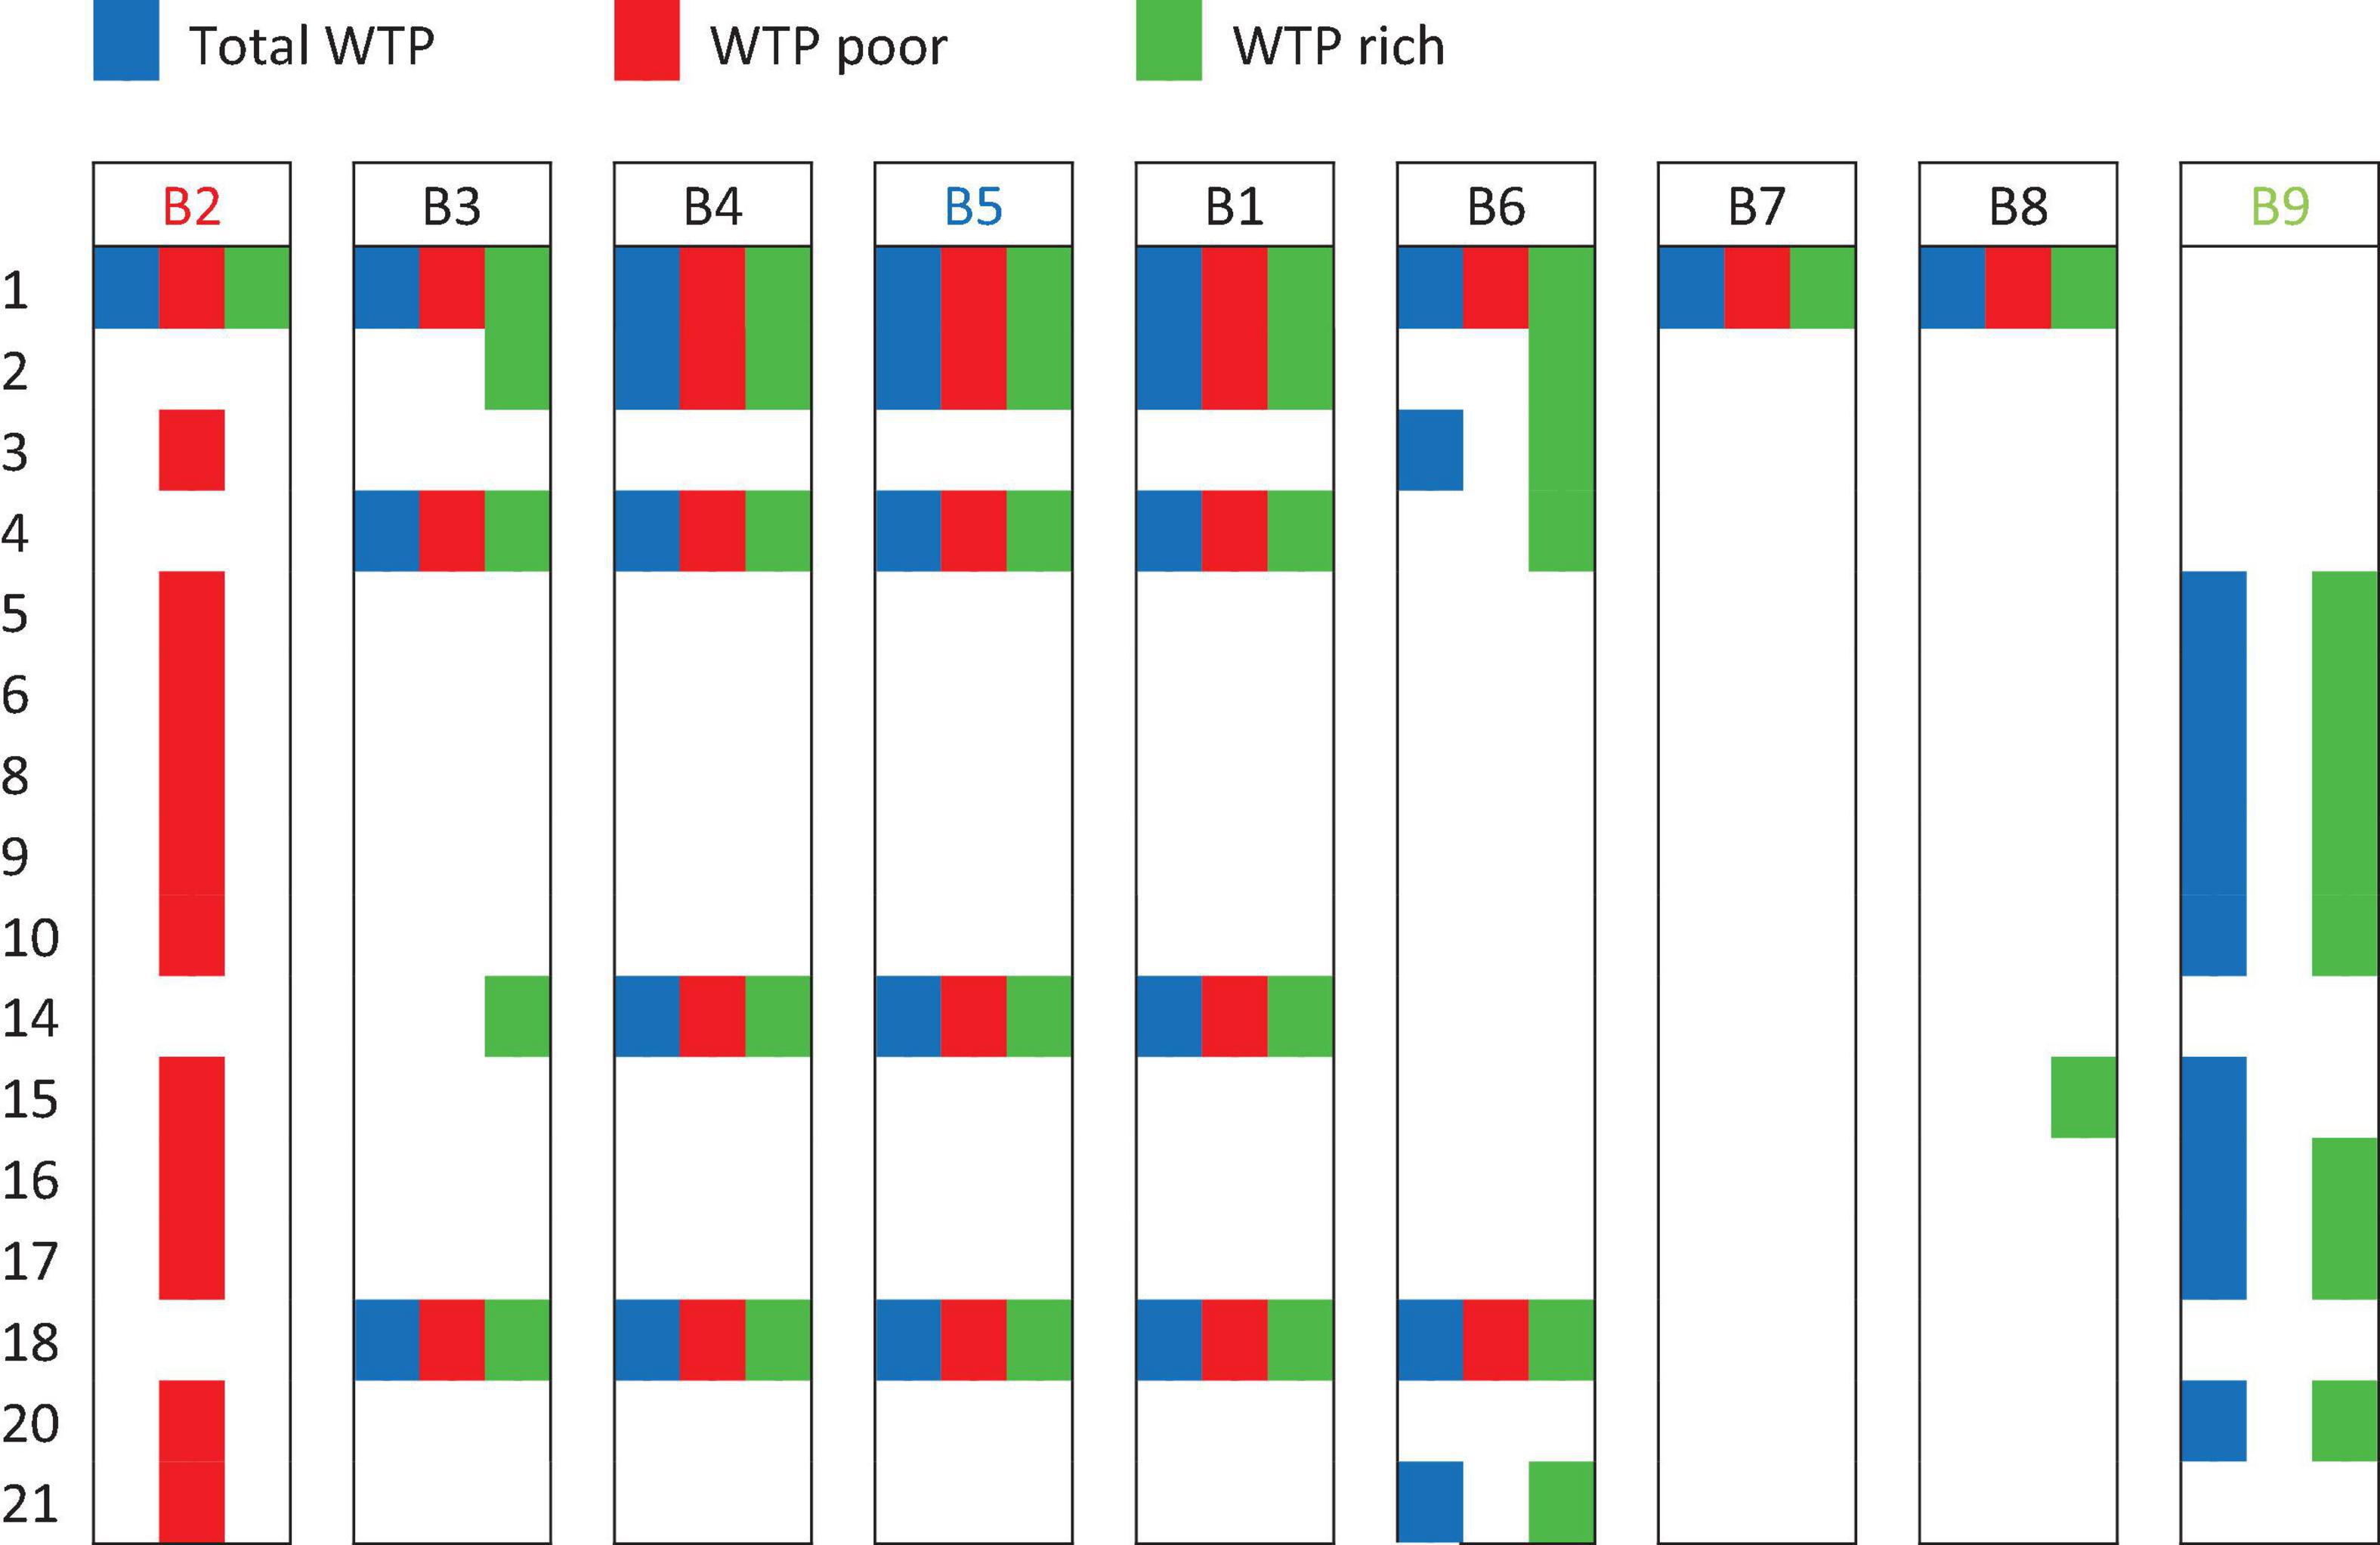
Figure 4. In the figure we show the distributional scenarios that maximise the WTP for the total population, for the poor group and for the rich group for each single cluster. The cluster number is reported on the left, and the cells are coloured if the scenario maximises maximise total WTP (blue), WTP of the poor group (red) and WTP of the rich group (green). Note that scenario B5 maximises total WTP at aggregate level, scenario B2 maximises WTP for the poor group and scenario B9 maximises WTP for the rich group.
In Figure 5 we examine in more detail three clusters which differ in their biomass availability, to assess the welfare trade-offs involved in these three cases: Cluster 2 has a high initial supply of biomass (21 trees per person) while cluster 3 has a medium supply level (7 trees) and cluster 6 a low level (1 tree). Here, the total WTP for both social groups and relative to poor and rich expressed in $ is scaled between 0 and 1 using a minmax normalisation where 1 corresponds to the scenario that maximise WTP while 0 corresponds to the scenario with the lowest WTP possible.
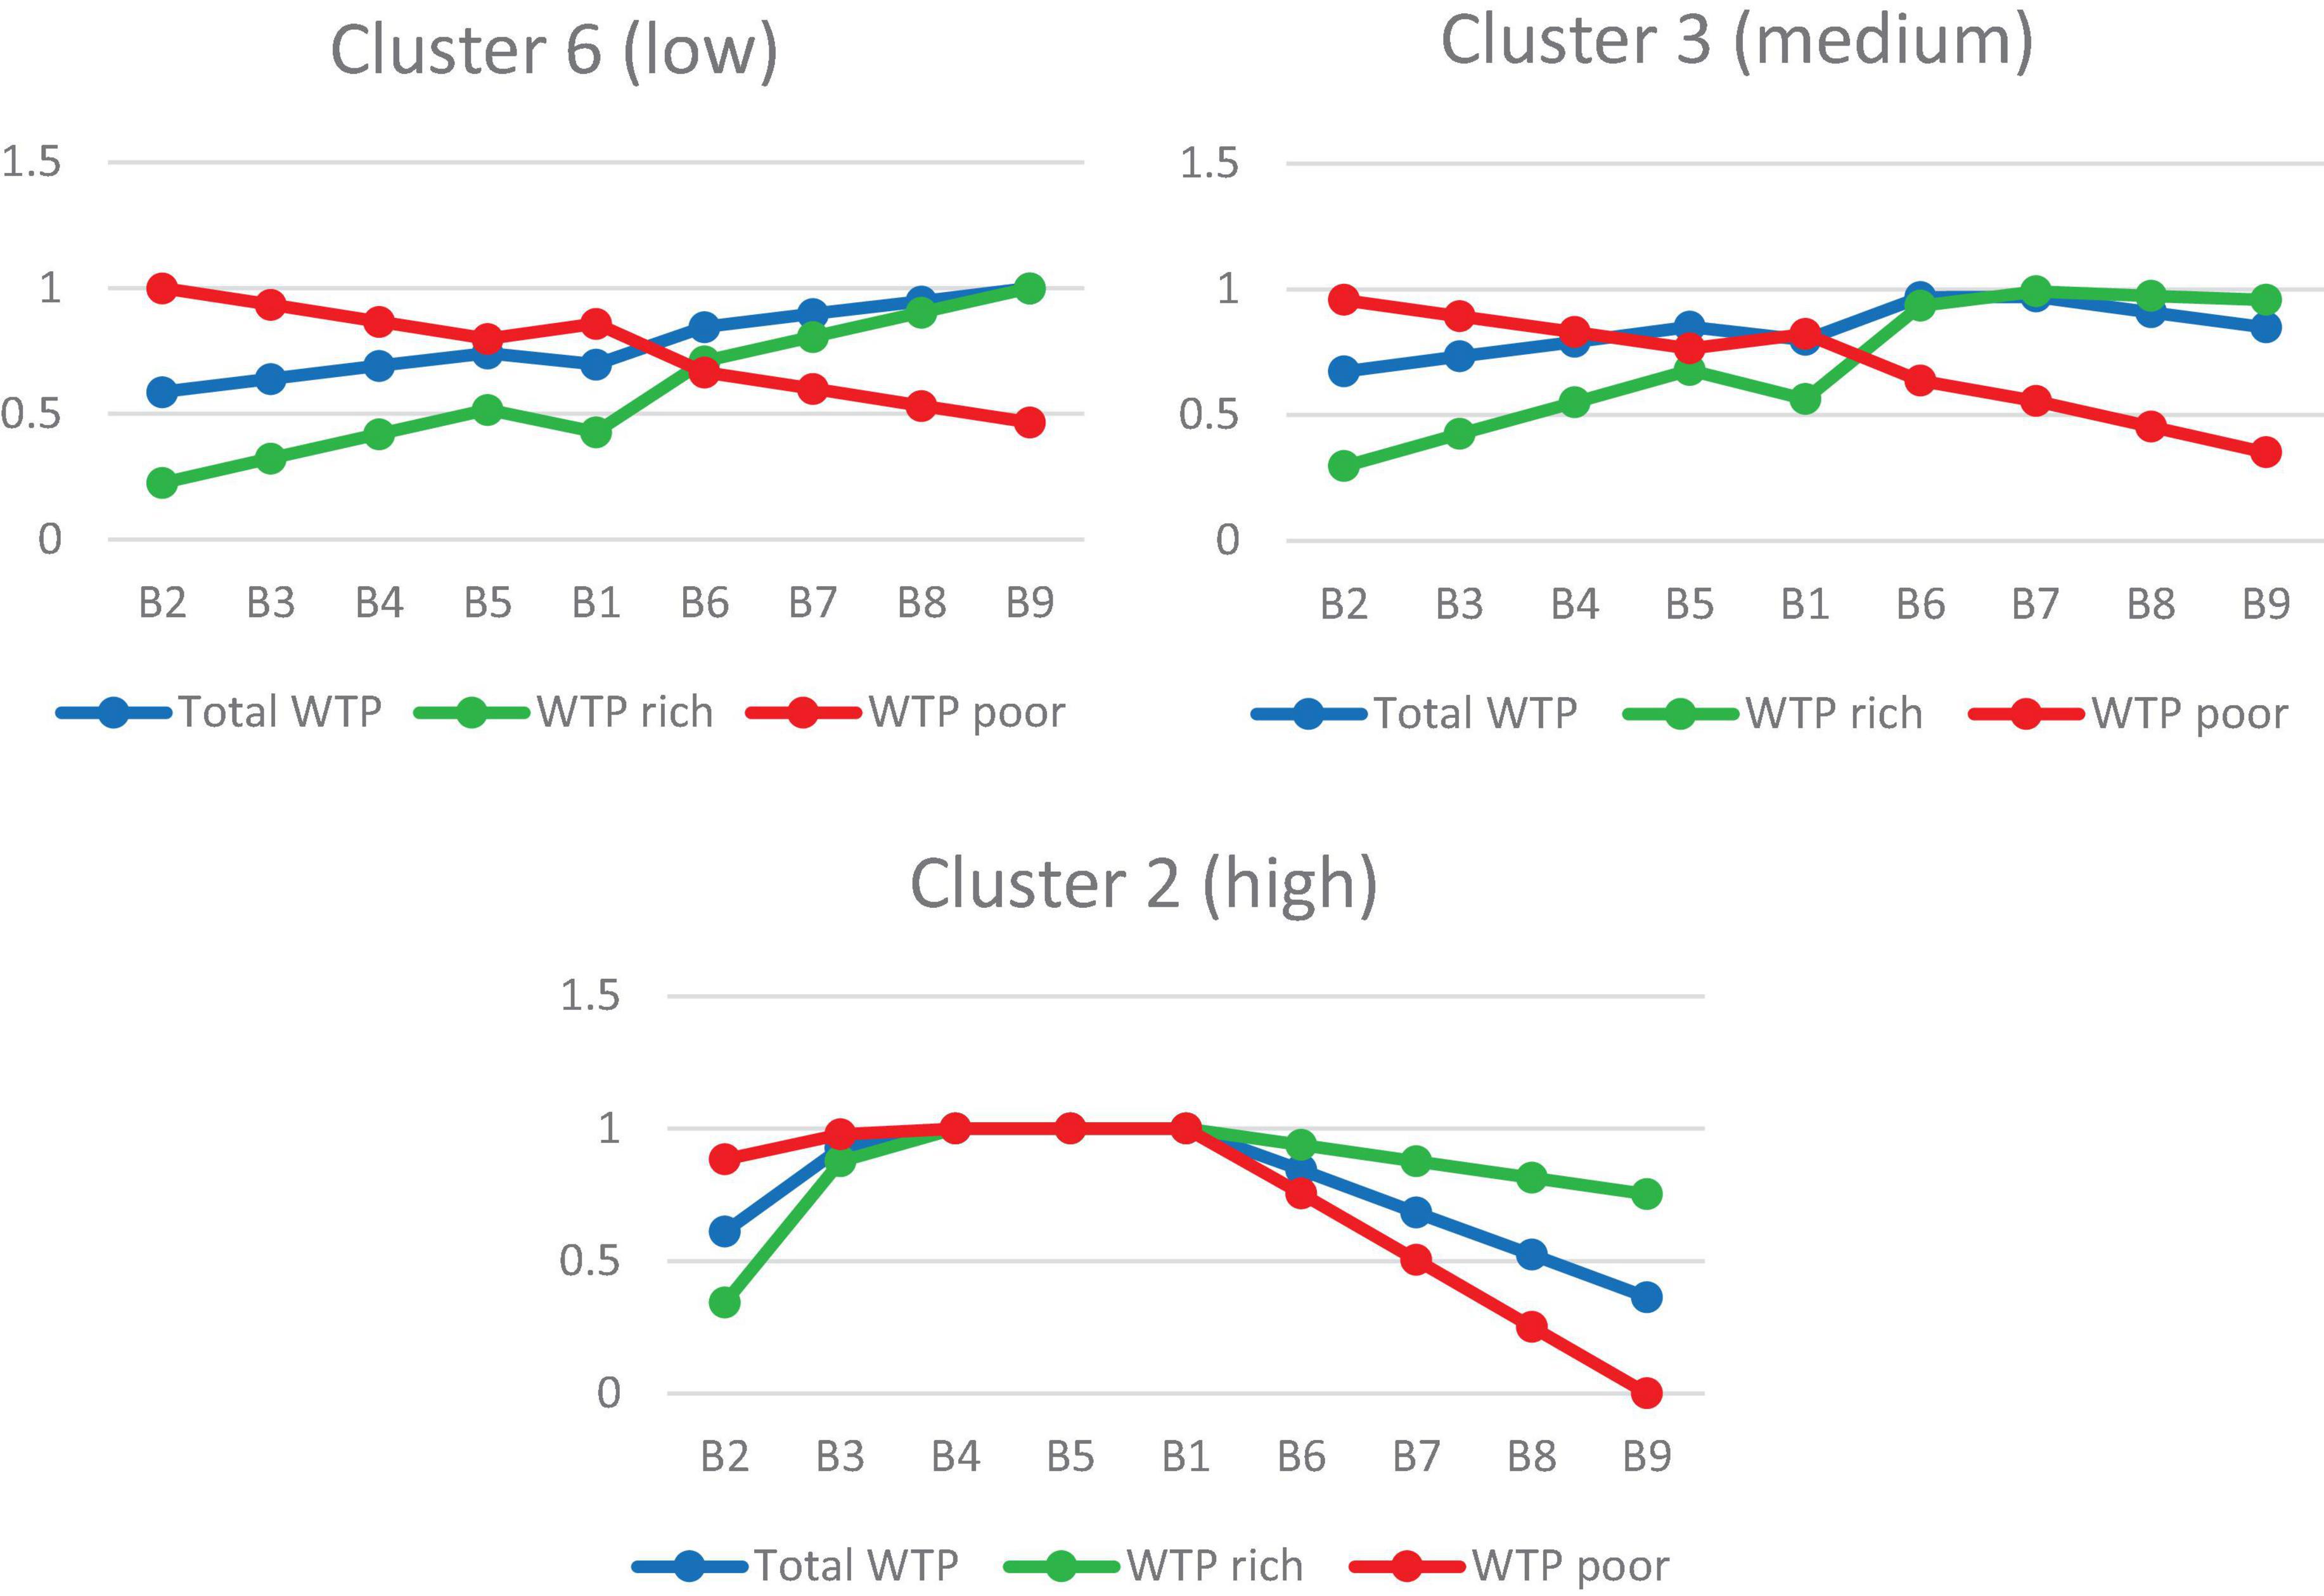
Figure 5. The figure shows minmax normalised WTP values for three selected clusters, n. 2, 3, and 6, to demonstrate how total welfare gains differ across scenarios for clusters with different ecological endowments (low, medium, and high endowment).
Figure 5 shows the mean individual WTP for a poor and a rich village member, i.e., their individual welfare gain, and their total WTP. When there is a high availability of biomass (cluster 2), the scenarios B4 and B5, where the poor group gets more biomass, and B1 (equal share) are all optimal for the total population and for both social groups and therefore trade-offs can be minimised. Yet, choosing a distributional rule which further polarises the distribution of biomass in favour of one of the wealth status groups will also reduce total welfare. For cluster 3 (medium availability of biomass) the optimal scenario in terms of total WTP is the B6 scenario where the rich group gain a higher WTP compared to the poor group but the difference between the two groups is moderate; the B5 scenario minimises this difference but lowers total WTP for the whole population compared to B6. Finally, when total biomass available is low, as in cluster 6, the trade-offs between WTP of the poor and the rich group is the most extreme – as can be seen by the opposite trend of the green and the red line in Figure 5 – and the WTP of one wealth status group can only be maximised at the expense of the other.
Trade-offs are also reduced if biomass is distributed just to the proportion of people that stated to have interest in harvesting specific forest products as elicited in our household survey (Supplementary Appendix 2). We carried out this analysis to simulate alternative management arrangement that may arise. We found that the lower the number of people among which forest products are distributed, the higher the convergence of the three criteria toward one scenario, i.e., trade-offs are minimised.
Discussion
This article proposes a methodological approach for the analysis of normative trade-offs between local welfare and forest conservations objectives in forest ecosystem governance. We contribute to the literature by combining a biophysical assessment of ES potential availability and actual flow with a welfare assessment that integrates the impact of distributional outcomes (Daw et al., 2011; Fisher et al., 2014; Dawson et al., 2017; Chaudhary et al., 2018). We quantified the potential supply of provisioning forest ES, i.e., woody biomass, and link it to the current demand of forest-adjacent communities to identify the amount of ES effectively captured by the population. We then assessed the effect on total welfare of the beneficiaries of different hypothetical distributional scenarios arising from a hypothetical co-management policy. We show that, due to the spatial mismatches between demand and supply, the distribution of provisioning ES to the rural population across the whole harvesting area is unequal in biophysical terms (see Table 5). By coupling biophysical modelling with WTP analysis, we then provide an assessment of total welfare gained by the population across different distributional scenarios of biomass. Our WTP analysis captures the effect of distributional rules on welfare at the aggregate level, i.e., for the total population and the whole forest harvesting area, and at disaggregate level, i.e., for the two wealth status groups and for each cluster.
The biophysical assessment reveals that the current patterns of consumption are ecologically unsustainable and demand for ES exceeds sustainable supply in many co-management blocks leading to forest degradation. The disturbance index shows that the areas closer to human settlements have been highly disturbed during the 2013–2018 period. The comparison of supply and demand shows that the distribution of biomass is unequal across the whole harvesting area (see Table 5) and therefore not all demand can be met whilst guaranteeing that forests would re-generate. We found that only in five co-management blocks, which account for 15% of the total population of forest users, the current stock of biomass would be able to support the estimated current biomass demand. Under the business-as-usual scenarios, the current consumption of forest products is unsustainable in most areas, especially in the southern area of the forest, where the population density is higher.
The WTP analysis shows that the distributional scenario that maximises total societal welfare in monetary terms across the whole harvesting area is the scenario that distributes 40% of biomass to the rich group while the remaining 60% is allocated to the poor group (see Table 6). However, this scenario (B5) does not maximise total WTP for all clusters (see Figure 4). Whilst at the aggregate level an (almost) egalitarian distribution of biomass between poor and rich groups is found to be increasing the welfare for the whole population the most, at disaggregated level by cluster a distribution skewed toward the rich maximises total WTP in many clusters where biomass availability is low. However, forest benefits are especially relevant for the poorest village members, and therefore a policy maker could opt to develop institutional mechanisms that maximise the welfare of the poor group on normative grounds, instead of maximising total welfare. In such situations, our analysis shows that the scenario that maximises WTP for the poor group at aggregate level (B2) produces a total WTP almost equivalent to B5, but it also maximises the difference between welfare of the rich and the poor at the aggregate level (see Figure 5).
The WTP analysis implemented in this paper can be used to examine welfare trade-offs between wealth status groups both at the aggregate and disaggregate level using a single indicator (WTP). Important improvements upon earlier assessments of our methodology is that it considers the contribution to human well-being of the actual ES flow, as opposed to potential, by estimating potential demand and supply and modelling their spatial connection and incorporates spatial heterogeneity in the analysis (Bagstad et al., 2014; La Notte et al., 2017). Moreover, our methodology enables disaggregated assessments which can account for the differential ability of social groups to capture the flow of ES (Daw et al., 2011; Fisher et al., 2014) and evaluate the trade-offs involved in ES governance ex ante instead of evaluating them ex post (Dawson et al., 2017; Chaudhary et al., 2018). As such, our study provides a method for supporting policymakers in choosing the distributional rule that minimise trade-offs between efficiency, i.e., maximising total welfare, and livelihoods objectives.
Our methodology relies on coupling multiple models used to estimate both biophysical and monetary quantities; such estimations required a set of simplifying assumptions. To quantify the biomass available, we relied on remote sensing images, given that we lacked an updated forest inventory dataset with full coverage of the area, but our estimates are characterised by a relative predictive error of about 50% and uncertainty related to measurement errors. Using SAR (synthetic aperture radar) remote sensing technologies, which overcome the problem of clouds, may improve the predictive ability of the regression model used (Mitchell et al., 2017). Furthermore, to link the potential supply and potential demand, we simulated the spatial connectivity through developing an accessibility map which included walking distance weighted by slope. Such accessibility map could be complemented by other factors deemed as relevant for forest products collection if data were available, such as quality of forest area as a proxy of products availability or distance to market and information on possible substitutes which may increase or reduce the likelihood to harvest from the forest reserve (Albers and Robinson, 2013). Finally, we did not calculate confidence intervals of the aggregate welfare measures so we cannot assess whether the welfare measures across scenarios are statistically significantly different.
Conclusion
This article proposes a combination of methodological approaches for the assessment of normative trade-offs between local welfare and forest conservation objectives in forest ecosystem governance. We choose as a case study area Namizimu forest reserve, located in the Mangochi district in Malawi, where community-based management policies may be implemented in the nearer future to pursue sustainable forest management. The analysis shows how the current estimated level of consumption of forest resources from the local population is ecologically unsustainable. We also show how current estimated consumption patterns may be unsustainable in the future, especially in the south part of the forest area where population density is higher.
We then simulated a hypothetical community-based management scenario to evaluate the welfare impacts of this type of policies. In a co-management policy, the ability of the local population to extract forest products from the forest reserve would be capped to a sustainable level to guarantee the ability of the forest to regenerate. In a spatial analysis we assessed the total quantity of forest resources that could be extracted in a sustainable way from the forest reserve when co-management is implemented. The results show marked differences across space due to differences in forest structure and the ability of the population to access the forest area. Such spatial differences in ecological endowments will determine differential impacts of the policy on the welfare of the local population. It is important to take the spatial variation in resource provision into account when determining the distributional rules for allocating forest resources to the forest-adjacent communities.
Finally, we performed a monetary valuation of the welfare impacts of different distributional scenarios under co-management using a stated preference technique. We demonstrated how the results of this monetary valuation can be used to inform decision-making for ex ante valuation of ES governance policies. In this study, we found that the distributional scenario that maximises total societal welfare for the whole forest area examined follows from the distributional rule where the worse-off village members are allocated a slightly higher amount of biomass (60% of the total) while the better-off village members are allocated the remaining 40%, i.e., a pro-poor distributional rule. While the outcomes of such rules for other areas will depend on the local wealth distribution, an important emerging message is that pro-poor distributions are both ecologically sustainable and locally socially acceptable.
Data Availability Statement
The raw data supporting the conclusions of this article will be made available by the authors, without undue reservation.
Ethics Statement
The studies involving human participants were reviewed and approved by the University of Southampton – ERGO number 29625. The patients/participants provided their written informed consent to participate in this study.
Author Contributions
ID, MS, and FE: study conception and design and analysis and interpretation of results. ID: data collection and draft manuscript preparation. HU and MS: support in data collection and coordination of data inputs. HU and CN: data and analysis tools. MS and FE: critical revision for important intellectual content. All authors discussed the results and contributed to the final manuscript.
Funding
This research was supported by the United Kingdom Economic and Social Research Council through a Ph.D. scholarship funding offered by the Doctoral Training Partnership at the University of Southampton. The research was also supported by the project “A framework for individual and shared preferences for ecosystem services trade-offs” (Grant No. FELL-2014-104) of the United Kingdom’s Ecosystem Services for Poverty Alleviation (ESPA) program. The ESPA program was funded by the Department for International Development (DFID), the Economic and Social Research Council (ESRC), and the Natural Environment Research Council (NERC).
Conflict of Interest
The authors declare that the research was conducted in the absence of any commercial or financial relationships that could be construed as a potential conflict of interest.
Publisher’s Note
All claims expressed in this article are solely those of the authors and do not necessarily represent those of their affiliated organizations, or those of the publisher, the editors and the reviewers. Any product that may be evaluated in this article, or claim that may be made by its manufacturer, is not guaranteed or endorsed by the publisher.
Acknowledgments
We thank Silvia Ferrini and Max Kwiek for comments that greatly improved the manuscript, and our colleagues, Willie Sagona, and Tembo Chanyenga from the Forestry Research Institute of Malawi who provided insight and expertise that greatly assisted the research in the field. We also thank Evanz, Lucius, Chakumbira, and Chipo for their great technical assistance during data collection and the study participants for their willingness to participate in the study.
Supplementary Material
The Supplementary Material for this article can be found online at: https://www.frontiersin.org/articles/10.3389/ffgc.2022.780036/full#supplementary-material
Footnotes
- ^ Here, we define CBM to encompass management forms with communities as the sole decision-makers, as well as co-management forms, in which rights and responsibilities divided between communities and other actors, such as national governments (e.g., co-management).
- ^ V = V0e−3s where V is the foot-based speed over the sloping terrain, V0 the base speed of travel over flat terrain (4 km/h in this case) and s is the slope expressed in gradient.
- ^ The adjusted exchange rate is 248.38 MKW = 1 US$ PPP (purchasing power parity) using the PPP conversion factor for private consumption for the year 2018 (World Bank, International Comparison Programme database).
References
Adhikari, S., Kingi, T., and Ganesh, S. (2014). Incentives for community participation in the governance and management of common property resources: the case of community forest management in Nepal. For. Policy Econ. 44, 1–9. doi: 10.1016/j.forpol.2014.04.003
Agrawal, A. (2001). Common property institutions and sustainable governance of resources. World Dev. 29, 1649–1672. doi: 10.1016/s0305-750x(01)00063-8
Agrawal, A., Chhatre, A., and Hardin, R. (2008). Changing governance of the world’s forests. Science 320, 1460–1462. doi: 10.1126/science.1155369
Ala-Hulkko, T., Kotavaara, O., Alahuhta, J., and Hjort, J. (2019). Mapping supply and demand of a provisioning ecosystem service across Europe. Ecol. Indic. 103, 520–529. doi: 10.1371/journal.pone.0112601
Albers, H. J., and Robinson, E. J. Z. (2013). A review of the spatial economics of non-timber forest product extraction: implications for policy. Ecol. Econ. 92, 87–95. doi: 10.1016/j.ecolecon.2012.01.021
Angelsen, A., Jagger, P., Babigumira, R., Belcher, B., Hogarth, N. J., Bauch, S., et al. (2014). Environmental income and rural livelihoods: a global-comparative analysis. World Dev. 64, S12–S28. doi: 10.1016/j.worlddev.2014.03.006
Bagstad, K. J., Johnson, G. W., Voigt, B., and Villa, F. (2013). Spatial dynamics of ecosystem service flows: a comprehensive approach to quantifying actual services. Ecosyst. Serv. 4, 117–125. doi: 10.1016/j.ecoser.2012.07.012
Bagstad, K. J., Villa, F., Batker, D., Harrison-Cox, J., Voigt, B., and Johnson, G. W. (2014). From theoretical to actual ecosystem services: mapping beneficiaries and spatial flows in ecosystem service assessments. Ecol. Soc. 19:64.
Barò, F., Palomo, I., Zulian, G., Vizcaino, P., Haase, D., and Gómez-Baggethun, E. (2016). Mapping ecosystem service capacity, flow and demand for landscape and urban planning: a case study in the Barcelona metropolitan region. Land use Policy 57, 405–417. doi: 10.1016/j.landusepol.2016.06.006
Batjes, N. H. (2008). Mapping soil carbon stocks of Central Africa using SOTER. Geoderma 146, 58–65. doi: 10.1016/j.geoderma.2008.05.006
Baumann, M., Ozdogan, M., Wolter, P. T., Krylov, A., Vladimirova, N., and Radeloff, V. C. (2014). Landsat remote sensing of forest windfall disturbance. Remote Sens. Environ. 143, 171–179. doi: 10.1016/j.rse.2013.12.020
Beck, H. E., McVicar, T. R., van Dijk, A. I. J. M., Schellekens, J., de Jeu, R. A. M., and Bruijnzeel, L. A. (2011). Global evaluation of four AVHRR-NDVI data sets: intercomparison and assessment against Landsat imagery. Remote Sens. Environ. 115, 2547–2563. doi: 10.1016/j.rse.2011.05.012
Bowler, D. E., Buyung-Ali, L. M., Healey, J. R., Jones, J. P. G., Knight, T. M., and Pullin, A. S. (2012). Does community forest management provide global environmental benefits and improve local welfare? Front. Ecol. Environ. 10, 29–36. doi: 10.1890/110040
Burkhard, B., Kroll, F., Nedkov, S., and Müller, F. (2012). Mapping ecosystem service supply, demand and budgets. Ecol. Indic. 21, 17–29. doi: 10.1016/j.ecolind.2011.06.019
Chaplin-Kramer, R., Sharp, R. P., Weil, C., Bennett, E. M., Pascual, U., Arkema, K. K., et al. (2019). Global modeling of nature’s contributions to people. Science 366, 255–258. doi: 10.1126/science.aaw3372
Chaudhary, S., McGregor, A., Houston, D., and Chettri, N. (2018). Environmental justice and ecosystem services: a disaggregated analysis of community access to forest benefits in Nepal. Ecosyst. Serv. 29, 99–115. doi: 10.1016/j.ecoser.2017.10.020
Chilongo, T. (2014). Livelihood strategies and forest reliance in Malawi. For. Trees Livelihoods 23, 188–210. doi: 10.1080/14728028.2014.922449
Chomba, S., Treue, T., and Sinclair, F. (2015). The political economy of forest entitlements: can community based forest management reduce vulnerability at the forest margin? For. Policy Econ. 58, 37–46. doi: 10.1016/j.forpol.2014.11.011
Daw, T., Brown, K., Rosendo, S., and Pomeroy, R. (2011). Applying the ecosystem services concept to poverty alleviation: the need to disaggregate human well-being. Environ. Conserv. 38, 370–379. doi: 10.1017/s0376892911000506
Daw, T. M., Coulthard, S., Cheung, W. W. L., Brown, K., Abunge, C., Galafassi, D., et al. (2015). Evaluating taboo trade-offs in ecosystems services and human well-being. Proc. Natl. Acad. Sci. U.S.A. 112, 6949–6954. doi: 10.1073/pnas.1414900112
Dawson, N. M., Grogan, K., Martin, A., Mertz, O., Pasgaard, M., Rasmussen, L. V., et al. (2017). Environmental justice research shows the importance of social feedbacks in ecosystem service trade-offs. Ecol. Soc. 22:12.
DeFries, R., Achard, F., Brown, S., Herold, M., Murdiyarso, D., Schlamadinger, B., et al. (2007). Earth observations for estimating greenhouse gas emissions from deforestation in developing countries. Environ. Sci. Policy 10, 385–394. doi: 10.1016/j.envsci.2007.01.010
Dreoni, I. (2019). Preferences for Forest Benefits: are Distributive Justice Principles Reflected in Values for Ecosystem Services?. Southampton: University of Southampton.
Egoh, B., Reyers, B., Rouget, M., Richardson, D. M., Le Maitre, D. C., and van Jaarsveld, A. S. (2008). Mapping ecosystem services for planning and management. Agric. Ecosyst. Environ. 127, 135–140.
Egoh, B. N., O’Farrell, P. J., Charef, A., Josephine Gurney, L., Koellner, T., Nibam Abi, H., et al. (2012). An African account of ecosystem service provision: use, threats and policy options for sustainable livelihoods. Ecosyst. Serv. 2, 71–81. doi: 10.1016/j.ecoser.2012.09.004
Egoh, B. N., Reyers, B., Rouget, M., and Richardson, D. M. (2011). Identifying priority areas for ecosystem service management in South African grasslands. J. Environ. Manage. 92, 1642–1650. doi: 10.1016/j.jenvman.2011.01.019
Fisher, J. A., Patenaude, G., Giri, K., Lewis, K., Meir, P., Pinho, P., et al. (2014). Understanding the relationships between ecosystem services and poverty alleviation: a conceptual framework. Ecosyst. Serv. 7, 34–45. doi: 10.1016/j.ecoser.2013.08.002
Fisher, M. (2004). Household welfare and forest dependence in Southern Malawi. Environ. Dev. Econ. 9, 135–154. doi: 10.1017/s1355770x03001219
Fowler, R. J., Paterson, M. S., and Tanimoto, S. L. (1981). Optimal packing and covering in the plane are NP-complete. Inf. Process. Lett. 12, 133–137. doi: 10.1016/0020-0190(81)90111-3
Fox, J. (2016). Applied Regression Analysis and Generalized Linear Models, 3rd Edn. Thousand Oaks, CA: Sage.
Gizachew, B., Solberg, S., Næsset, E., Gobakken, T., Bollandsås, O. M., Breidenbach, J., et al. (2016). Mapping and estimating the total living biomass and carbon in low-biomass woodlands using Landsat 8 CDR data. Carbon Balance Manag. 11:13. doi: 10.1186/s13021-016-0055-8
GoM (1997). Forestry Act. Government of Malawi - Ministry of Mines, Natural Resources and Environmental Affairs. Lilongwe: Malawi Government.
GoM (2001). National Forestry Programme Priorities for Improving Forestry and Livelihoods. Lilongwe: Malawi Government.
Green, E. L., Eigenbrod, F., Schreckenberg, K., Willcock, S., and Wilcock, S. (2016). Modelling tree growth to determine the sustainability of current off-take from miombo woodland: a case study from rural villages in Malawi. Environ. Conserv. 44, 66–73. doi: 10.1017/s0376892916000485
Green, J. M. H., Fisher, B., Green, R. E., Makero, J., Platts, P. J., Robert, N., et al. (2018). Local costs of conservation exceed those borne by the global majority. Glob. Ecol. Conserv. 14:e00385. doi: 10.1016/j.gecco.2018.e00385
Guerry, A. D., Polasky, S., Lubchenco, J., Chaplin-Kramer, R., Daily, G. C., Griffin, R., et al. (2015). Natural capital and ecosystem services informing decisions: from promise to practice. Proc. Natl. Acad. Sci. U.S.A. 112, 7348–7355. doi: 10.1073/pnas.1503751112
Healey, S. P., Cohen, W. B., Zhiqiang, Y., and Krankina, O. N. (2005). Comparison of Tasseled Cap-based Landsat data structures for use in forest disturbance detection. Remote Sens. Environ. 97, 301–310. doi: 10.1016/j.rse.2005.05.009
Jumbe, C. B. L., and Angelsen, A. (2011). Modeling choice of fuelwood source among rural households in Malawi: a multinomial probit analysis. Energy Econ. 33, 732–738. doi: 10.1016/j.eneco.2010.12.011
Kachamba, D. J., Eid, T., and Gobakken, T. (2016). Above- and belowground biomass models for trees in the miombo woodlands of Malawi. Forests 7:38. doi: 10.3390/f7020038
Kamanga, P., Vedeld, P., and Sjaastad, E. (2009). Forest incomes and rural livelihoods in Chiradzulu District, Malawi. Ecol. Econ. 68, 613–624. doi: 10.1016/j.ecolecon.2008.08.018
Kremen, C., Niles, J. O., Dalton, M. G., Daily, G. C., Ehrlich, P. R., Fay, J. P., et al. (2000). Economic incentives for rain forest conservation across scales. Science 288, 1828–1832. doi: 10.1126/science.288.5472.1828
La Notte, A., Maes, J., Dalmazzone, S., Crossman, N. D., Grizzetti, B., and Bidoglio, G. (2017). Physical and monetary ecosystem service accounts for Europe: a case study for in-stream nitrogen retention. Ecosyst. Serv. 23, 18–29. doi: 10.1016/j.ecoser.2016.11.002
Latham, J., Cumani, R., Rosati, I., and Bloise, M. (2014). Global Land Cover SHARE (GLC-SHARE) Database Beta-Release Version 1.0. Rome: FAO, 1–39.
Lautenbach, S., Mupepele, A. C., Dormann, C. F., Lee, H., Schmidt, S., Scholte, S. S. K., et al. (2019). Blind spots in ecosystem services research and challenges for implementation. Reg. Environ. Change 19, 2151–2172. doi: 10.1007/s10113-018-1457-9
Leh, M. D. K., Matlock, M. D., Cummings, E. C., and Nalley, L. L. (2013). Quantifying and mapping multiple ecosystem services change in West Africa. Agric. Ecosyst. Environ. 165, 6–18. doi: 10.1002/eap.1985
Leonard, K., Hopke, P. K., and Rousseeuw, P. J. (1987). Using a Parallel Computer System for Statistical Resampling Methods. Delft: Technische Universiteit Delft.
Liu, P., Jiang, S., Zhao, L., Li, Y., Zhang, P., and Zhang, L. (2017). What are the benefits of strictly protected nature reserves? Rapid assessment of ecosystem service values in Wanglang Nature Reserve, China. Ecosyst. Serv. 26, 70–78. doi: 10.1016/j.ecoser.2017.05.014
Lowore, J. (2003). Miombo Woodlands and Rural Livelihoods in Malawi: An in-Depth Analysis and Critical Review Based on Literature Research. Mzuzu: Mzuzu University.
Luckert, M. K., and Williamson, T. (2005). Should sustained yield be part of sustainable forest management? Can. J. For. Res. 35, 356–364. doi: 10.1139/x04-172
Lund, J. F., and Treue, T. (2008). Are we getting there? Evidence of decentralized forest management from the tanzanian miombo woodlands. World Dev. 36, 2780–2800. doi: 10.1016/j.worlddev.2008.01.014
Mace, G., Schreckenberg, K., and Poudyal, M. (2018). “Ecosystem services for human wellbeing: trade-offs and governance,” in Ecosystem Services and Poverty Alleviation: Trade-Offs and Governance, eds K. Schreckenberg, G. Mace, and M. Poudyal (Abingdon: Routledge), 305–316.
Makungwa, S. (2012). Field Results of the Forest Biomass Survey of the Five Forest Reserves in Central Region of Malawi. Kanagawa: Forest Resource Mapping Project.
Marge (2009). Malawi Biomass Energy Strategy, Consultancy Study for Government of Malawi and EU Partnership Dialogue Facility. Netherlands: Marchéage et Gestion de l’Environnement, 1–107.
Martin, A., Armijos, M. T., Coolsaet, B., Dawson, N., Edwards, G. A. S., Few, R., et al. (2020). Environmental justice and transformations to sustainability. Environ. Sci. Policy Sustain. Dev. 62, 19–30.
McDermott, M., Schreckenberg, K., and Mahanty, S. (2013). Examining equity: a multidimensional framework for assessing equity in payments for ecosystem services. Environ. Sci. Policy 33, 416–427. doi: 10.1016/j.envsci.2012.10.006
Mitchell, A. L., Rosenqvist, A., and Mora, B. (2017). Current remote sensing approaches to monitoring forest degradation in support of countries measurement, reporting and verification (MRV) systems for REDD+. Carbon Balance Manag. 12:9. doi: 10.1186/s13021-017-0078-9
Mutune, J. M., and Lund, J. F. (2016). Unpacking the impacts of ‘participatory’ forestry policies: evidence from Kenya. For. Policy Econ. 69, 45–52. doi: 10.1016/j.forpol.2016.03.004
Neil, C. (2018). Applying Tasselled Cap Transformation to Landsat Time-Series Data for Rapid Forest Degradation Assessment Towards Improving REDD+ Reporting in Data-Deficient Areas. Southampton: University of Southampton.
Ostrom, E., Burger, J., Field, C. B., Norgaard, R. B., and Policansky, D. (1999). Revisiting the commons: local lessons, global challenges. Science 284, 278–282. doi: 10.1126/science.284.5412.278
Otuoma, J., Odera, J., Bodo, E., Ongugo, P., Oeba, V., and Kamondo, B. (2011). Annual allowable cut for merchantable woody species in a community managed forest in western Kenya. For. Ecol. Manage. 262, 2281–2286. doi: 10.1016/j.foreco.2011.08.022
Peh, K. S. H., Balmford, A., Field, R. H., Lamb, A., Birch, J. C., Bradbury, R. B., et al. (2014). Benefits and costs of ecological restoration: rapid assessment of changing ecosystem service values at a U.K. wetland. Ecol. Evol. 4, 3875–3886. doi: 10.1002/ece3.1248
Perman, R., Ma, Y., McGilvray, J., and Common, M. (2003). Natural Resource and Environmental Economics. Upper Saddle River, NJ: Pearson Education.
Persha, L., and Andersson, K. (2014). Elite capture risk and mitigation in decentralized forest governance regimes. Glob. Environ. Change 24, 265–276. doi: 10.1016/j.gloenvcha.2013.12.005
Potschin, M. B., and Haines-Young, R. H. (2011). Ecosystem services: exploring a geographical perspective. Prog. Phys. Geogr. 35, 575–594. doi: 10.1177/0309133311423172
Ryan, C. M., Hill, T., Woollen, E., Ghee, C., Mitchard, E., Cassells, G., et al. (2012). Quantifying small-scale deforestation and forest degradation in African woodlands using radar imagery. Glob. Chang. Biol. 18, 243–257. doi: 10.1111/j.1365-2486.2011.02551.x
Ryan, C. M., Pritchard, R., McNicol, I., Owen, M., Fisher, J. A., and Lehmann, C. (2016). Ecosystem services from Southern African woodlands and their future under global change Citation for published version: ecosystem services from southern African woodlands and their future under global change. Philos. Trans. R. Soc. B Biol. Sci. 371:20150312. doi: 10.1098/rstb.2015.0312
Ryan, C. M., Williams, M., and Grace, J. (2011). Above- and belowground carbon stocks in a miombo woodland landscape of mozambique. Biotropica 43, 423–432. doi: 10.1111/j.1744-7429.2010.00713.x
Schaafsma, M., Eigenbrod, F., Gasparatos, A., Gross-Camp, N., Hutton, C., Nunan, F., et al. (2021). Trade-off decisions in ecosystem management for poverty alleviation. Ecol. Econ. 187:107103. doi: 10.1016/j.ecolecon.2021.107103
Schaafsma, M., Morse-jones, S., Posen, P., Swetnam, R. D., Balmford, A., Bateman, I. J., et al. (2012). Towards transferable functions for extraction of non-timber forest products: a case study on charcoal production in Tanzania. Ecol. Econ. 80, 48–62. doi: 10.1016/j.ecolecon.2012.04.026
Schlosberg, D. (2013). Theorising environmental justice: the expanding sphere of a discourse. Environ. Polit. 22, 37–55. doi: 10.1080/09644016.2013.755387
Shirima, D. D., Munishi, P. K. T., Lewis, S. L., Burgess, N. D., Marshall, A. R., Balmford, A., et al. (2011). Carbon storage, structure and composition of miombo woodlands in Tanzania’s Eastern Arc Mountains. Afr. J. Ecol. 49, 332–342. doi: 10.1111/j.1365-2028.2011.01269.x
Sikor, T., Martin, A., Fisher, J., and He, J. (2014). Toward an empirical analysis of justice in ecosystem governance. Conserv. Lett. 7, 524–532. doi: 10.1111/cobi.12795
Sunderlin, W. D., Dewi, S., Puntodewo, A., Müller, D., Angelsen, A., and Epprecht, M. (2008). Why forests are important for global poverty alleviation: a spatial explanation. Ecol. Soc. 13:24.
Syrbe, R.-U., and Grunewald, K. (2017). Ecosystem service supply and demand – the challenge to balance spatial mismatches. Int. J. Biodivers. Sci. Ecosyst. Serv. Manag. 13, 148–161. doi: 10.3390/ijerph17155309
Syrbe, R. U., and Walz, U. (2012). Spatial indicators for the assessment of ecosystem services: providing, benefiting and connecting areas and landscape metrics. Ecol. Indic. 21, 80–88. doi: 10.1016/j.ecolind.2012.02.013
Tatem, A. J. (2017). WorldPop, open data for spatial demography. Sci. Data 4, 2–5. doi: 10.1038/sdata.2017.4
Uchida, H., and Nelson, A. (eds). (2008). “Agglomeration index: towards a new measure of urban,” in World Development Report Reshaping Economic Geography, Vol. 19, (Oxford: Oxford University Press).
UN DESA (2019). World Population Prospects 2019. New York, NY: United Nations Department of Economic and Social Affairs.
Vallecillo, S., La Notte, A., Zulian, G., Ferrini, S., and Maes, J. (2019). Ecosystem services accounts: valuing the actual flow of nature-based recreation from ecosystems to people. Ecol. Modell. 392, 196–211. doi: 10.1016/j.ecolmodel.2018.09.023
van Wagtendonk, J. W., and Benedict, P. R. (1980). Travel time variation on backcountry trails. J. Leis. Res. 2, 99–106. doi: 10.1080/00222216.1980.11969429
Villamagna, A. M., Angermeier, P. L., and Bennett, E. M. (2013). Capacity, pressure, demand, and flow: a conceptual framework for analyzing ecosystem service provision and delivery. Ecol. Complex. 15, 114–121. doi: 10.1016/j.ecocom.2013.07.004
Wangai, P. W., Burkhard, B., and Muller, F. (2016). A review of studies on ecosystem services in Africa. Int. J. Sustain. Built Environ. 5, 225–245. doi: 10.1080/20964129.2018.1530054
Willemen, L., Crossman, N. D., Quatrini, S., Egoh, B., Kalaba, F. K., Mbilinyi, B., et al. (2018). Identifying ecosystem service hotspots for targeting land degradation neutrality investments in south-eastern Africa. J. Arid Environ. 159, 75–86. doi: 10.1016/j.jaridenv.2017.05.009
Wolff, S., Schulp, C. J. E., and Verburg, P. H. (2015). Mapping ecosystem services demand: a review of current research and future perspectives. Ecol. Indic. 55, 159–171. doi: 10.1016/j.ecolind.2015.03.016
Yadav, B. D., Bigsby, H., and MacDonald, I. (2015). The relative distribution: an alternative approach to evaluate the impact of community level forestry organisations on households. Land use Policy 42, 443–449. doi: 10.1016/j.landusepol.2014.08.019
Keywords: ecosystem services, livelihoods, forest, fairness, environmental justice
Citation: Dreoni I, Utila H, Neil C, Eigenbrod F and Schaafsma M (2022) Assessing the Welfare Impacts of Forest Ecosystem Service Management Policies and Their Distributional Rules. Front. For. Glob. Change 5:780036. doi: 10.3389/ffgc.2022.780036
Received: 20 September 2021; Accepted: 08 March 2022;
Published: 06 May 2022.
Edited by:
Alejandro Lopez-Feldman, University of Gothenburg, SwedenReviewed by:
Guy Chiasson, University of Quebec in Outaouais, CanadaAritta Suwarno, Wageningen University & Research, Netherlands
Copyright © 2022 Dreoni, Utila, Neil, Eigenbrod and Schaafsma. This is an open-access article distributed under the terms of the Creative Commons Attribution License (CC BY). The use, distribution or reproduction in other forums is permitted, provided the original author(s) and the copyright owner(s) are credited and that the original publication in this journal is cited, in accordance with accepted academic practice. No use, distribution or reproduction is permitted which does not comply with these terms.
*Correspondence: Ilda Dreoni, Ilda.Dreoni@soton.ac.uk
†These authors share senior authorship