Beech Bark Disease in an Unmanaged Temperate Forest: Patterns, Predictors, and Impacts on Ecosystem Function
 Rosalyn Kish1
  Patrick M. A. James2
  Rachel O. Mariani1 Jonathan S. Schurman2,3
  Sean C. Thomas2 Emily N. Young1
  Adam R. Martin1*
- 1Department of Physical and Environmental Sciences, University of Toronto Scarborough, Toronto, ON, Canada
- 2Institute of Forestry and Conservation, Daniels Faculty of Architecture, Landscape, and Design, University of Toronto, Toronto, ON, Canada
- 3Department of Forest Ecology, Faculty of Forestry and Wood Sciences, Czech University of Life Sciences, Prague, Czechia
Beech Bark Disease (BBD) is a devastating threat to American beech (Fagus grandifolia), spreading through eastern mixed deciduous forests of North America at unprecedented rates. Understanding how and why some beech trees escape severe BBD effects is important; however, the biotic and abiotic factors that underpin the progression of BBD within unmanaged forests at local scales are not well explored. We surveyed 651 individual beech trees ≥ 10 cm diameter at breast height (DBH) for BBD, in a 13.5-ha unmanaged forest dynamics plot in Ontario, Canada, where >46,000 trees have been identified to species, mapped, and DBH measured at ∼5-year intervals. For each beech tree, BBD severity was ranked on a 5-point severity index, which was then evaluated as a function of tree characteristics including DBH and relative growth rate (RGR). Most beech trees were at either the insect or fungal stage of BBD, with only 22% of beech trees being free of symptoms. Ordinal logistic regression analysis indicated both DBH and RGR were significant predictors of BBD severity. These models, along with both randomization and Moran’s Eigenvector Maps (MEM) analyses, indicated that DBH and RGR and their spatial variation accounted for ∼44.6% of BBD severity in trees. Our MEMs also indicated ∼4.2% of variation in BBD severity was associated with unmeasured spatial variables, which may reflect either the spread of BBD through our study site, or the influence of abiotic variables on BBD severity. At our site, BBD is responsible for at least ∼6.0 Mg C ha–1, or ∼6.5% of the average 92.5 Mg of aboveground biomass C ha–1, transitioning from the live to dead biomass pool. Our study enhances the understanding of the factors predicting the severity of a major forest pathogen in North American temperate forests, assists the integration of BBD severity risk into forest C budget models, and provides insight into how large-scale forest inventories can inform screening for pest or pathogen resistance in trees.
Introduction
Beech bark disease (BBD) is drastically altering the structure and function of eastern North American forests dominated by American beech (Fagus grandifolia Ehrh.), one of the most prominent hardwood species in eastern mixed deciduous forests (Mulder et al., 2020). As a shade-tolerant and long-lived hardwood species that grows up to 30 m high, beech trees sequester significant amounts of carbon (C) in their biomass, which is stored in live trees for up to 300–400 years (Busby and Canham, 2011; Mulder et al., 2020). The current geographic range of American beech, and therefore the potential range of BBD, stretches from Nova Scotia, Canada, southward to northern Florida, westward to eastern Texas, and north to central Ontario (Cale et al., 2017).
Beech bark disease is an insect-fungal complex that is spread via both the non-native invasive beech scale insect Cryptococcus fagisuga Lind. (Hemiptera, Eriococcidae; previously Cryptococcus fagi) (Cale et al., 2017; Mulder et al., 2020), as well as the North American native scale insect Xylococculus betulae Pergande (Wiggins et al., 2004). These scale species instigate infection of parasitic fungi Neonectria ditissima and N. faginata (Ascomycetes) that ultimately kill beech trees by infecting and necrotizing cambial and phloem tissue (reviewed by Cale et al., 2017). The non-native beech scale insect C. fagisuga was introduced into North American forests inadvertently through the importation of ornamental European beech trees (Fagus sylvatica L.), with the primary point of entry identified as the Halifax Public Gardens in the late 1890s (Houston, 1994; Mulder et al., 2020). The non-native beech scale insect (C. fagisuga) was first officially reported on American beech trees in Bedford, Nova Scotia in 1911, and has since expanded its range throughout eastern North America (Houston, 1994).
Beech bark disease has demonstrated an epiphytotic spread throughout North America, with historical maps suggesting the beech scale has been spreading at a rate of 14.7–16.0 km year–1 (Morin et al., 2007; Evans and Finkral, 2010), though these rates are considered conservative and do not include stochastic jumps (Stephanson and Coe, 2017). Larvae of both scale insect species have been recorded dispersing passively downwind from infested trees, with dispersal distances being proportional to both wind speed and the height of scale insects on the tree. For example, with a mean wind speed of < 1 m s–1, larvae disperse an average distance of ∼10 m (Houston, 1994), though ∼1% of the larvae caught in airstreams above forest canopies disperse longer distances for a given wind speed (Houston, 1994). Owing to these dispersal dynamics, current projections predict that BBD will spread throughout the entire beech range by 2025 (Stephanson and Coe, 2017), and there is no evidence suggesting the spread rate of BBD will slow. Indeed, BBD infection rates for all beech across North America has recently been estimated at 80–95% (Stephanson and Coe, 2017).
To complete its reproductive cycle, beech scale bores into the living tissues of the periderm on the host tree to extract sap and other protoplasmic substances, resulting in cell puncture, shrinkage, and ultimately cell death (Ehrlich, 1934; Mulder et al., 2020). This rupturing of the periderm first compromises tree bark, enabling fungal pathogens to infect the periderm of the tree ∼1–3 years after insect infection, though sometimes this process is longer (Ehrlich, 1934). The parasitic fungi N. ditissima and N. faginata then advance further into the cortex, phloem, cambium, and sapwood, where vascular conductance of water and nutrients, as well as the storage of non-structural C-based compounds, is obstructed, ultimately resulting in tree mortality as early as 1 year after fungal establishment (Ehrlich, 1934). Symptoms of BBD fungal infection include foliage and branch senescence, and large areas of stem-bark cracking, and cankering, with bark eventually falling away (Ehrlich, 1934). As this process progresses, definitive symptoms emerge at each stage of BBD severity (described in the Methods below).
At the forest level, there are three recognized phases of BBD: (1) the “advancing front,” which describes areas where scale insect populations have recently invaded, but mass mortality of beech trees has not yet occurred; (2) the “killing front,” which describes areas where tree mortality has begun due to Neonectria fungi establishment following heavy and widespread scale insect infestations (up to 270 scale insects cm–2 bark; typically 2–5 years after the scale insect appears, but sometimes as long as 20 years); and (3) the “aftermath” zone, which includes areas where the scale insect and Neonectria fungi have become endemic (up to 70 scale insects cm–2 bark), and forest structure and composition has changed due to death or morbidity of canopy-dominant beech trees, as well as the establishment of root-sprout beech thickets. In “aftermath” stage stands, only ∼1–3% of beech trees are scale-free or, alternatively, BBD-resistant (Houston, 1994; McGee, 2000; Morin et al., 2007; Cale et al., 2017; Stephanson and Coe, 2017; Mulder et al., 2020). These different stages provide a conceptual framework for understanding BBD, yet our understanding of how they map on to changes in forest ecosystem function is less well resolved. Specifically, few studies have quantified the time course of C transfers from the live to necromass pools in BBD-infected unmanaged forests, particularly owing to a lack of data on C dynamics in the early stages of BBD infection.
Within a given forest stand, beech trees differ in susceptibility to BBD due to differences in tree-level characteristics, including intraspecific variation in bark chemistry and tree nutrient status. Studies suggest that probability of BBD infection and its severity due to N. ditissima are predicted by bark concentrations of P and isorhamnetin (a flavonoid involved in tree resistance to biotic agents), while N. faginata infection and severity is correlated with low concentrations of bark P and catechin, another defensive flavonoid (Cale et al., 2015). Greater bark nitrogen, amino acid, and total amino nitrogen concentrations are associated with increased susceptibility to scale infection (Wargo, 1988). Soil nutrient availability likely plays a role in moderating these relationships between stem chemistry and BBD severity, such that N, P, or other base cation deficiencies may increase BBD severity (Perrin and Garbaye, 1984).
These tree-level chemistry characteristics vary as a function of tree diameter and growth rates, which are therefore expected to be correlated with BBD severity within a given site or stand. Specifically, owing to size-dependent variation in tissue chemistry, BBD severity tends to increase with increasing tree diameter in temperate forests of eastern North America (Ehrlich, 1934; Houston, 1994; Griffin et al., 2003; Wiggins et al., 2004; Stephanson and Coe, 2017; Mulder et al., 2020). Tree growth rate is expected to be negatively correlated with BBD severity, as smaller trees with higher growth rates are better able to maintain stem physiological functioning despite scale and Neonectria infection.
While there are likely multiple interacting drivers of BBD severity within a forest site or stand, few studies have evaluated the relative importance of these drivers simultaneously, particularly in unmanaged forests. Here, we seek to address this gap by modeling the determinants of BBD incidence and severity in all beech trees ≥ 10 cm DBH in a large-scale (13.5 ha) mixed temperate forest plot, located in the Great Lakes-St. Lawrence Forest region of Ontario, Canada. We specifically address the following three questions: (1) Do individual-tree characteristics (e.g., tree diameter and relative growth rates) predict the occurrence and severity of BBD? (2) Is there a spatial pattern in BBD severity at the scale of this forest plot? (3) What are the estimated C fluxes associated with tree mortality due to BBD?
Materials and Methods
The Haliburton Forest Dynamics Plot and the Forest Global Earth Observatory Network
Our study took place in the Haliburton Forest Dynamics Plot (HFDP), located in the Haliburton Forest and Wild Life Reserve Ltd., in Ontario, Canada (43° 130′ N, 78° 350′ W; Figure 1A and Supplementary Figure 1). The HFDP is a large-scale forest inventory plot that is part of the Smithsonian’s Forest Global Earth Observatory (ForestGEO), a network of standardized large-scale forest inventory plots where every tree ≥ 1 cm diameter at breast height (DBH) is measured, mapped, and identified to species (Davies et al., 2021). The 71 forest plots within ForestGEO are distributed globally, range in size from 4 to 50 ha (with an average size of 26 ha) and are situated across a wide range of environmental conditions spanning the ever-wet tropics to arid and boreal climates (Davies et al., 2021). Within the ForestGEO network, the HFDP is representative of late-seral northern-temperate forests of the Great Lakes-St. Lawrence region, and is one of only two ForestGEO dynamics plots in Canada (Schurman, 2016). To date, the trees in the HFDP have been censused three times in 2007, 2011, and 2014.
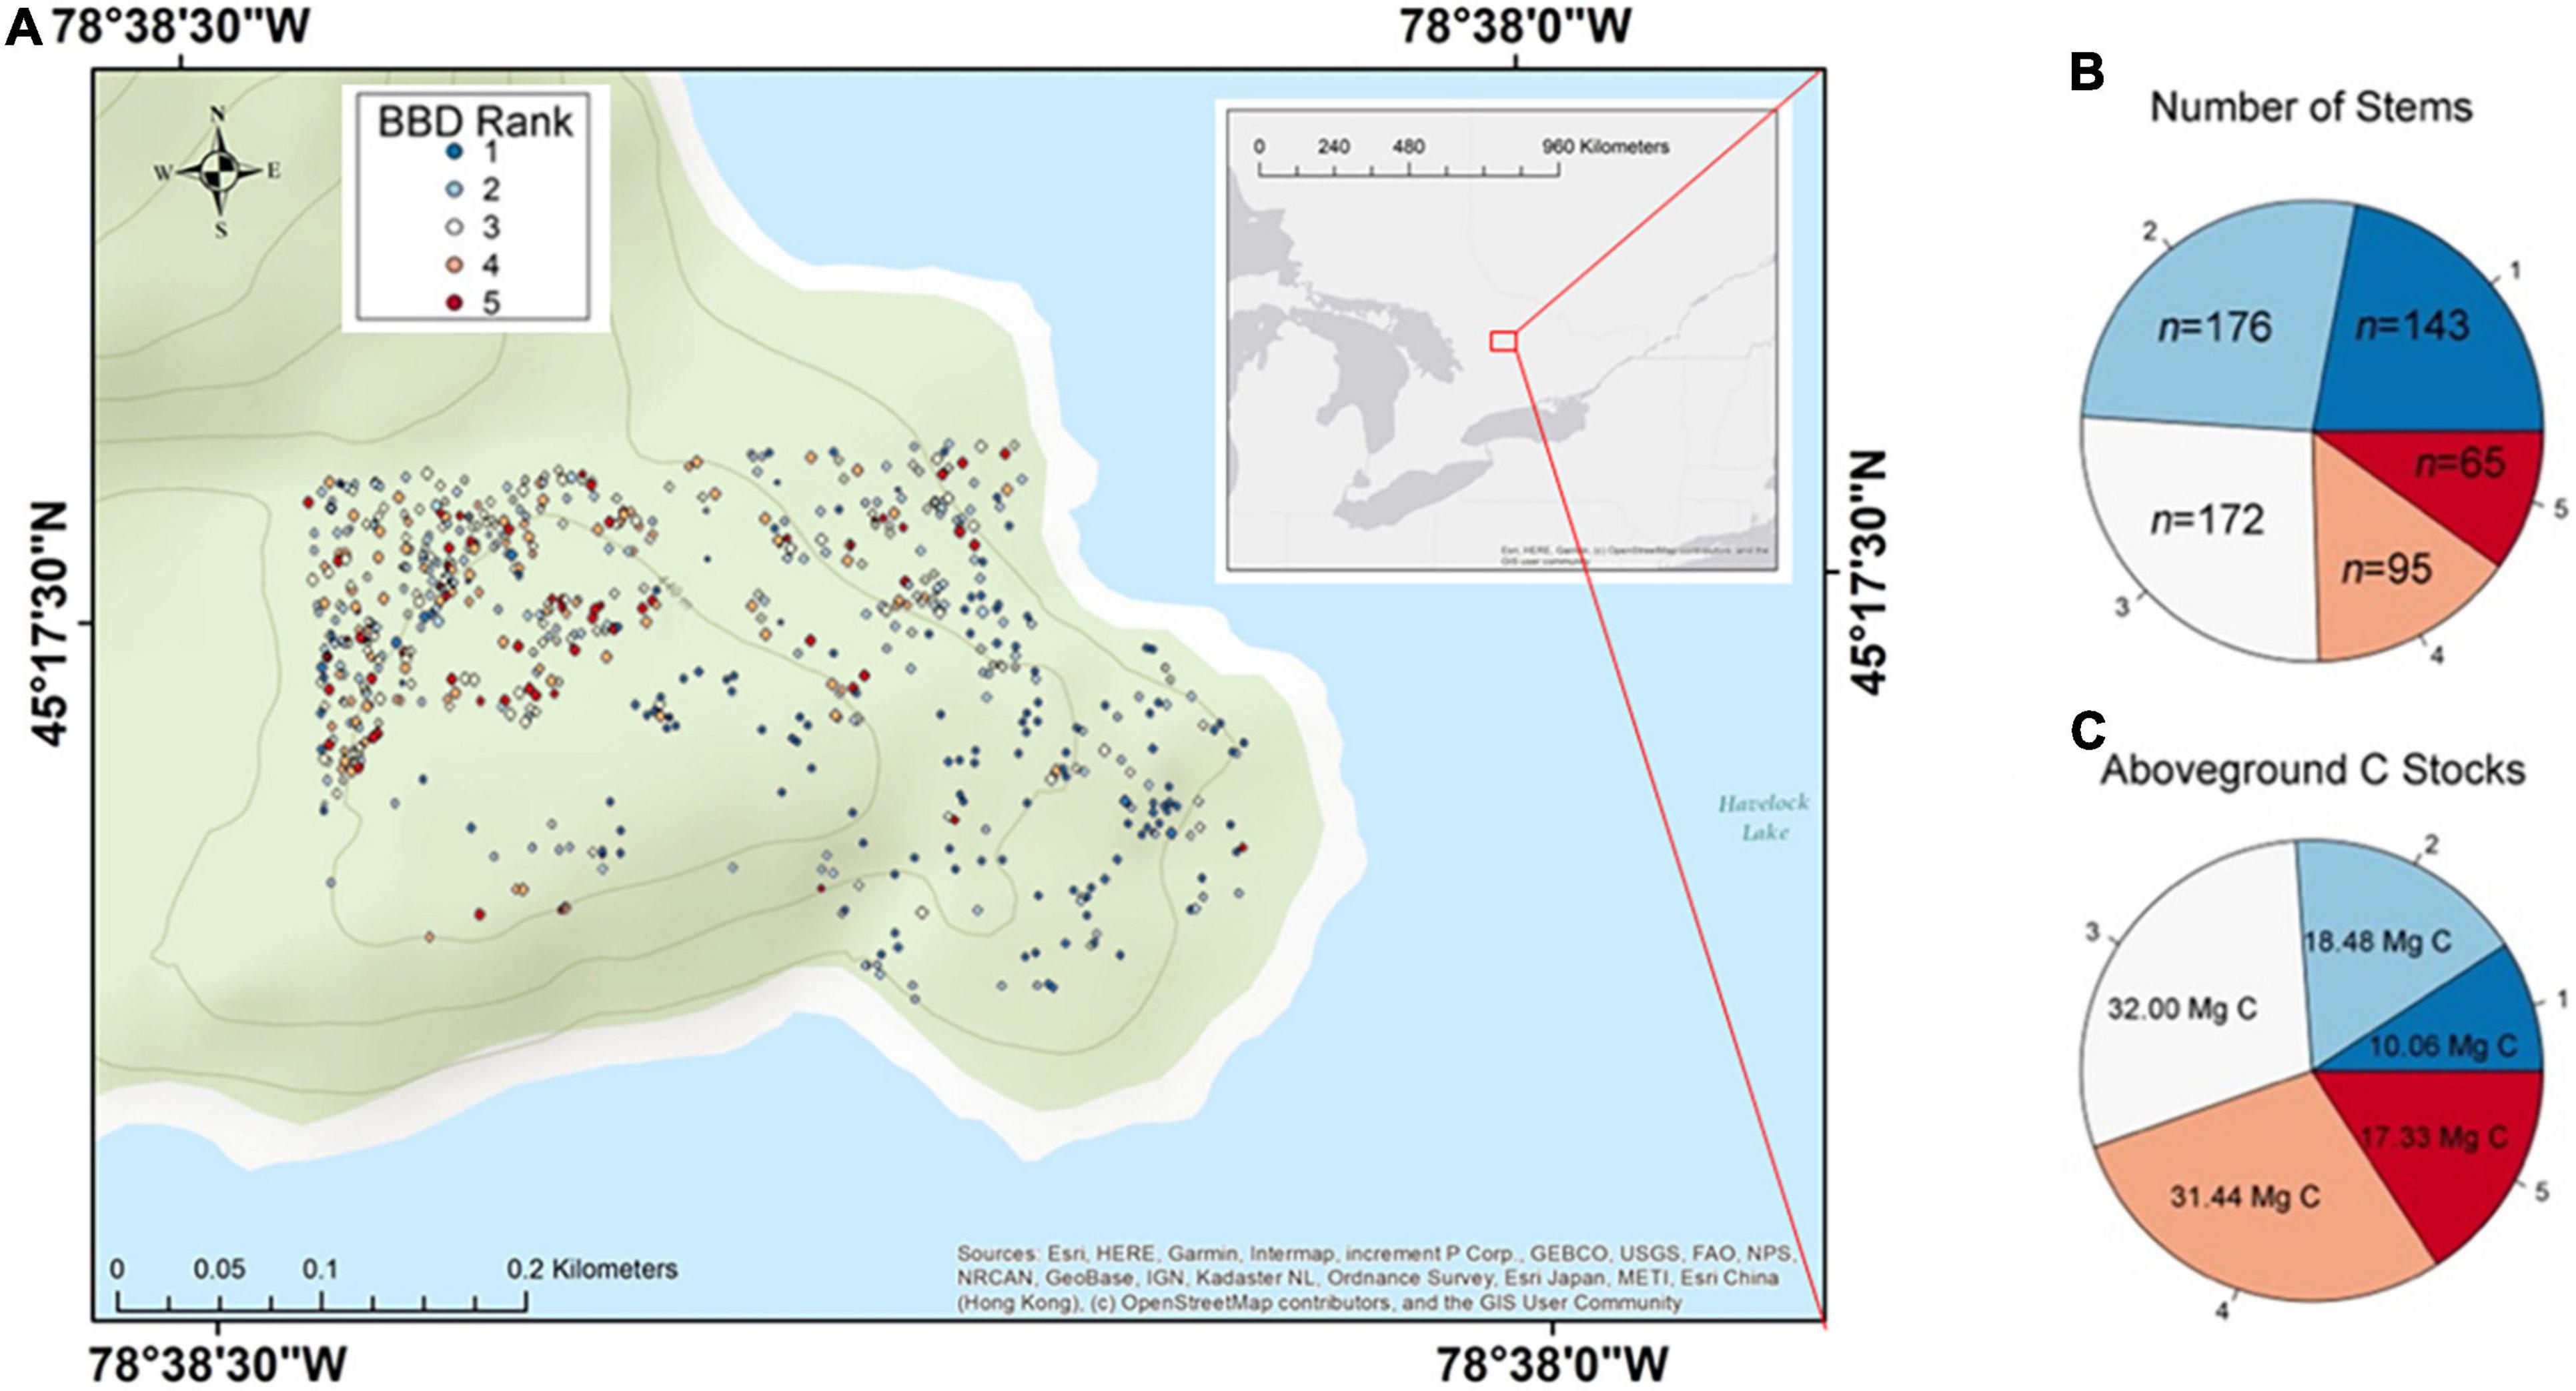
Figure 1. Spread of beech bark disease (BBD) throughout the Haliburton Forest Dynamics Plot. Panel (A) shows the site and locations of all beech trees included in study over a topographic map. An overview map defining the location of the study site within the larger context of North America is also provided in Supplementary Figure 1. Panel (B) displays the number of stems that belong to any given BBD symptom ranking. Panel (C) displays the amount of carbon (C) estimated to be associated within each BBD symptom ranking.
The HFDP is situated in an unmanaged area within the larger Haliburton Forest and Wild Life Reserve. The region receives an average of 1,070 mm of rainfall per year, and experiences mean annual temperatures of 5.0°C. The plot contains ∼46,339 trees ≥ 1 cm DBH across 30 species, over a total area of 13.5 ha (Schurman, 2016; Davies et al., 2021). The southern and eastern edges of the HFDP are surrounded by Havelock Lake, and elevation generally increases moving inland (north/west) from the lake margin (Figure 1A). The elevation of the HFDP ranges from 413 to 454 m a.s.l, with an average of 434 m a.s.l (Schurman, 2016; Davies et al., 2021). Based on existing modeling data (Cale et al., 2017), BBD was first observed in this region in ∼2009, providing an opportunity to explore BBD dynamics in both a recently infected and unmanaged forest location.
The interior plateau of the HFDP is dominated by Acer saccharum (L.), which is the most common species, followed by Fagus grandifolia (Ehrh.)— the focus of our research here—Betula alleghaniensis (Britt.), and Tsuga canadensis (L.). The lake margins of the HFDP are dominated by conifers including T. canadensis, Abies balsamea (L.), and Thuja occidentalis (L.), and Betula cordifolia (Regel). Other common species include conifers Picea mariana (Mill.) and Pinus strobus (L.), and hardwood species Acer rubrum (L.), Acer pensylvanicum (L.), Prunus serotina (Ehrh.), Quercus rubra (L.), and Ostrya virginiana (Mill.) (Schurman, 2016).
Beech Bark Disease Surveys
To capture the progression of BBD over the past ∼10 years, in June–August of 2021 we sampled all beech trees in the HFDP that were ≥ 10 cm DBH (n = 651). We used census information from previous plot sampling to locate each tree and then measured multiple tree characteristics. Tree height (H) was measured using a TruPulse 200L Laser Rangefinder and digital clinometer, measured to 10 cm precision and taken as the average of three height measurements. Crown exposure index (Cexp) of individual beech trees was assessed using the 5-rank system adapted from Dawkins and Field (1978). This ranking system [verbatim from Arellano et al. (2020)], is as follows: “1 = no direct light, the crown receives only light filtered through the crowns of other trees; 2 = lateral light, < 10% of the vertical project of the crown exposed to vertical light, but the crown receives some lateral light; 3 = some overhead light, 10–90% of the vertical projection of the crown is exposed to vertical light; 4 = full overhead light, ≥ 90% of the vertical projection of the crown exposed to vertical light; 5 = tree leaves completely exposed to vertical light and to lateral light within the 90° inverted cone encompassing the crown.” Tree DBH was measured using a diameter tape at marked points of measurement from previous censuses, from which we calculated relative growth rates (RGR) as:
where DBH2 represents tree DBH measured during our survey in 2021, DBH1 represents DBH in the 2007 HFDP census, and Δt represents the time of the growth interval (14 years) (Hoffmann and Poorter, 2002). This equation was used in order to account for temporal changes in variance of growth across plants that exists within a sample population, which are especially likely in studies where plant growth is measured over long time periods and across large sample sizes (Hoffmann and Poorter, 2002).
All 651 trees were assessed for BBD severity using a standardized 5-point ranking system established by Griffin et al. (2003). This ranking system (verbatim) is as follows: “1 = Very little or no sign of either causal agent (Cryptococcus or Neonectria); 2 = Cryptococcus present; bark beginning to crack; tree still shows vigor; canopy at least 75% intact; 3 = Bark heavily cracked; significant cankering from Neonectria colonies; some crown damage or limb loss; canopy 25–75% intact; 4 = Bark severely cracked; large girdling cankers; significant crown loss or snag; 5 = Dead from BBD” (Griffin et al., 2003). All BBD rankings were made by the same primary observer (R. Kish), and confirmed by two additional researchers (R. Mariani, E. Young). To further ensure consistency in rankings and provide additional data quality checks, the first 331 beech trees evaluated in our survey were re-evaluated for BBD, DBH, and H following a complete set of 651 observations.
Statistical Analysis – Correlates of Beech Bark Disease Severity
We first sought to identify the tree characteristics that are correlated with BBD severity. This entailed using a principal components analysis (PCA) implemented in the “vegan” R package (Oksanen et al., 2020) to summarize differences among trees based on four tree-level measurements including DBH, RGR, H, and Cexp, as well as Pearson correlation tests. Based on these procedures, we selected a reduced set of variables that may predict BBD, which were largely unrelated in multivariate or bivariate analyses (Supplementary Table 1 and Supplementary Figures 2, 3). Based on these analyses, DBH and RGR were identified as potential independent predictors of BBD for further evaluation. While both DBH and RGR were included as potential predictors in our model of BBD severity, the question of whether these metrics are the causes of consequences of BBD infection cannot be answered using our data. Instead, in building these models and testing these predictors, we sought to better understand the main correlates of BBD severity. Although H and Cexp were also potential candidates for further evaluation (specifically in lieu of DBH), we chose to retain DBH since this metric is most widely reported and measured in forest inventories (Busby and Canham, 2011).
Since BBD was evaluated on a semi-quantitative ordinal scale, we used an ordinal logistic regression to identify significant correlates of BBD. Specifically, we used the “polr” function in the “MASS” R package (Ripley et al., 2021), to parameterize an ordinal logistic regression model that predicts the probability of observing BBD rankings as a function of DBH and RGR. Statistical significance of the terms in this model were assessed through analysis of variance (ANOVA), and the prediction accuracy was assessed by calculating a confusion matrix of expected vs. predicted BBD rank values. We then used a χ2 test to evaluate if our confusion matrix differed significantly from a random prediction accuracy expectation. The effects of DBH and RGR on BBD severity were plotted using the “effects” R package (Fox et al., 2020).
Statistical Analysis – Beech Bark Disease Model Validation
We used a randomization approach to evaluate the robustness of our ordinal logistic regression in predicting BBD severity. This procedure entailed first selecting a subset of n = 456 training datapoints from our dataset (equivalent to ∼70% of our entire n = 651 dataset) through random selection without replacement. Then, on this training dataset of n = 456, we parameterized an ordinal logistic regression model with DBH and RGR as predictor variables, and BBD severity as the response variable. The ordinal logistic regression model fit to the training data was then applied to predict BBD severity in the validation dataset (i.e., the remaining ∼30% of the dataset following the randomization, where n = 195). A confusion matrix of observed vs. expected BBD severity values in each of the validation datasets was then generated, and the proportion of correct BBD predictions for both the entire validation dataset (inclusive of all BBD groups), and each individual BBD ranking class was calculated. This entire procedure was replicated 999 times.
Based on these datasets (where n = 999 individual confusion matrices), we then used one-sided t-tests to evaluate if the prediction accuracy for all BBD groups combined, and each BBD group individually, differed significantly from a random expectation of μ = 20%. This 20% value was chosen to correspond to a null expectation of there being a 20% likelihood (i.e., 1 out of 5 possibilities) that the correct BBD group is predicted by chance alone. Differences in prediction accuracy across BBD ranking classes were further evaluated using ANOVA coupled with a Tukey’s Honestly Significant Difference (HSD) post-hoc test, and were visualized using violin plots in the “ggplot2” R package (Wickham et al., 2021).
Statistical Analysis – Spatial Patterns in Beech Bark Disease Severity
We integrated spatial information into our analysis to test if unmeasured spatial variables (i.e., those not included in our ordinal logistic regression analysis and validation) independently explained BBD severity in our dataset. This was done using Moran’s Eigenvector Maps (MEMS) (Dray et al., 2021) to first generate a distance matrix for all n = 651 trees in our dataset, based on their north-south and east-west coordinates (both of which were measured in meters (m) from the north-westernmost corner of the HFDP), using the “dist” R function. We then used the “spantree” function in the “vegan” R package (Oksanen et al., 2020) to find the minimum distance tree that spans all points, and our distance matrix was truncated based on the minimum spanning value (equal to 46.8 m in our dataset).
We then performed a Principal Coordinates Analysis (PCoA) on this truncated MEM distance matrix. Since we were interested only in the spatially contagious process of BBD infection and spread, we extracted and used only the positive eigenvectors (i.e., the first 346 in our case) in our MEM analysis. These positive eigenvectors from our MEM were then used as predictors of BBD severity in a Redundancy Analysis (RDA) implemented in the “rda” function of the “vegan” R package (Oksanen et al., 2020). The statistical significance of each of the 346 eigenvectors included in our RDA—and therefore the statistical significance of spatial patterns in BBD severity—was evaluated through a permutation analysis of variance (PerMANOVA, with 999 replicates) implemented with the “anova.cca” function in the “vegan” R package (Oksanen et al., 2020). The proportion of variation in BBD severity rankings associated with spatial variation (i.e., all 346 positive eigenvectors) was quantified using the “RsquareAdj” function in the “vegan” R package (Oksanen et al., 2020).
We then used a forward selection procedure implemented in the “forward.sel” function in the “adespatial” R package (Dray et al., 2021), to identify a reduced suite of MEM eigenvectors that are the strongest contributors to spatial patterns in BBD severity. Of the 346 positive eigenvectors derived from our MEM, five were identified as statistically significant contributors to spatial patterns in BBD severity (F ≥ 17.0, p < 0.001 in all five cases, as per the RDA and PerMANOVA). The proportion of variation in BBD explained by this reduced RDA was re-calculated, as described above. Finally, we used variance partitioning to quantify the proportion of variance in BBD severity rankings that was explained by spatial variables alone (as represented by our five forward-selected MEM eigenvectors), tree-level characteristics in our original ordinal logistic regression model (i.e., DBH and RGR), or the interaction between spatial- and tree-level variables. Variance partitioning was implemented in the “varpart” function in the “vegan” R package (Oksanen et al., 2020).
Carbon Flux Estimations
The estimated carbon (C) transferring from the live-to the dead- pool as a result of BBD was estimated using allometric equations for Canadian tree species published by Lambert et al. (2005). Specifically, we used species-specific allometric equations for beech in Canada that employed DBH and H values (Table 4 in Lambert et al., 2005), to derive aboveground biomass (AGB, in kg) estimates in wood (AGBwood), bark (AGBbark), and branches (AGBbranches) as follows:
where β corresponds to model coefficients for wood (βwoodi), bark (βbarki), and branches (βbranchesi); in these models i = 1, 2, or 3, corresponds to the model intercept, DBH coefficient, and H coefficient, respectively.
Total tree AGB for live stems was calculated as the sum of Equations 2–4, while AGB for recently dead trees without crowns or any branches (i.e., snags) was calculated as the sum of Equations 2–3. All AGB values were converted to tree-level C estimates (also in kg) using species- and tissue-specific wood C fractions, taken from a Global Wood Carbon Database (Martin et al., 2018). Specifically, we extracted C fractions for beech wood (48.5%; the average of heart- and sapwood values), bark (47.3%), and branches (47.9%); these wood C fractions were based on beech trees sampled for wood C in the Haliburton Forest (Martin et al., 2015). Values of C estimates and potential losses due to BBD were expressed as a percentage of total aboveground C calculated across the entire 13.5 ha HFDP, with the AGB and wood C of all other species in the plot estimated with species-specific parameters in Equations 2–4 (also from Lambert et al., 2005), and species-specific wood C fractions (Martin et al., 2015, 2018).
Results
The majority of beech trees in our site showed evidence of infection by both insect and fungal BBD agents, with 332 of the 651 trees expressing BBD rankings ≥ 3 which entails a combination of cracked bark, Neonectria-induced cankering, and/ or crown damage (Figures 1A,B). Of all trees ≥ 30 cm DBH, 52% (124 of 237 trees) had either severe BBD symptoms with a ranking of 4, or were in fact killed by BBD (ranking 5; Figure 2B). Only 22% of beech trees in the HFDP (143 of 651 trees total) had a BBD severity ranking of 1 and were therefore mostly free of scale insect and Neonectria colonies. Of these 143 trees, the majority (112 trees) fell within smaller tree size classes (i.e., DBH ≤ 20 cm).
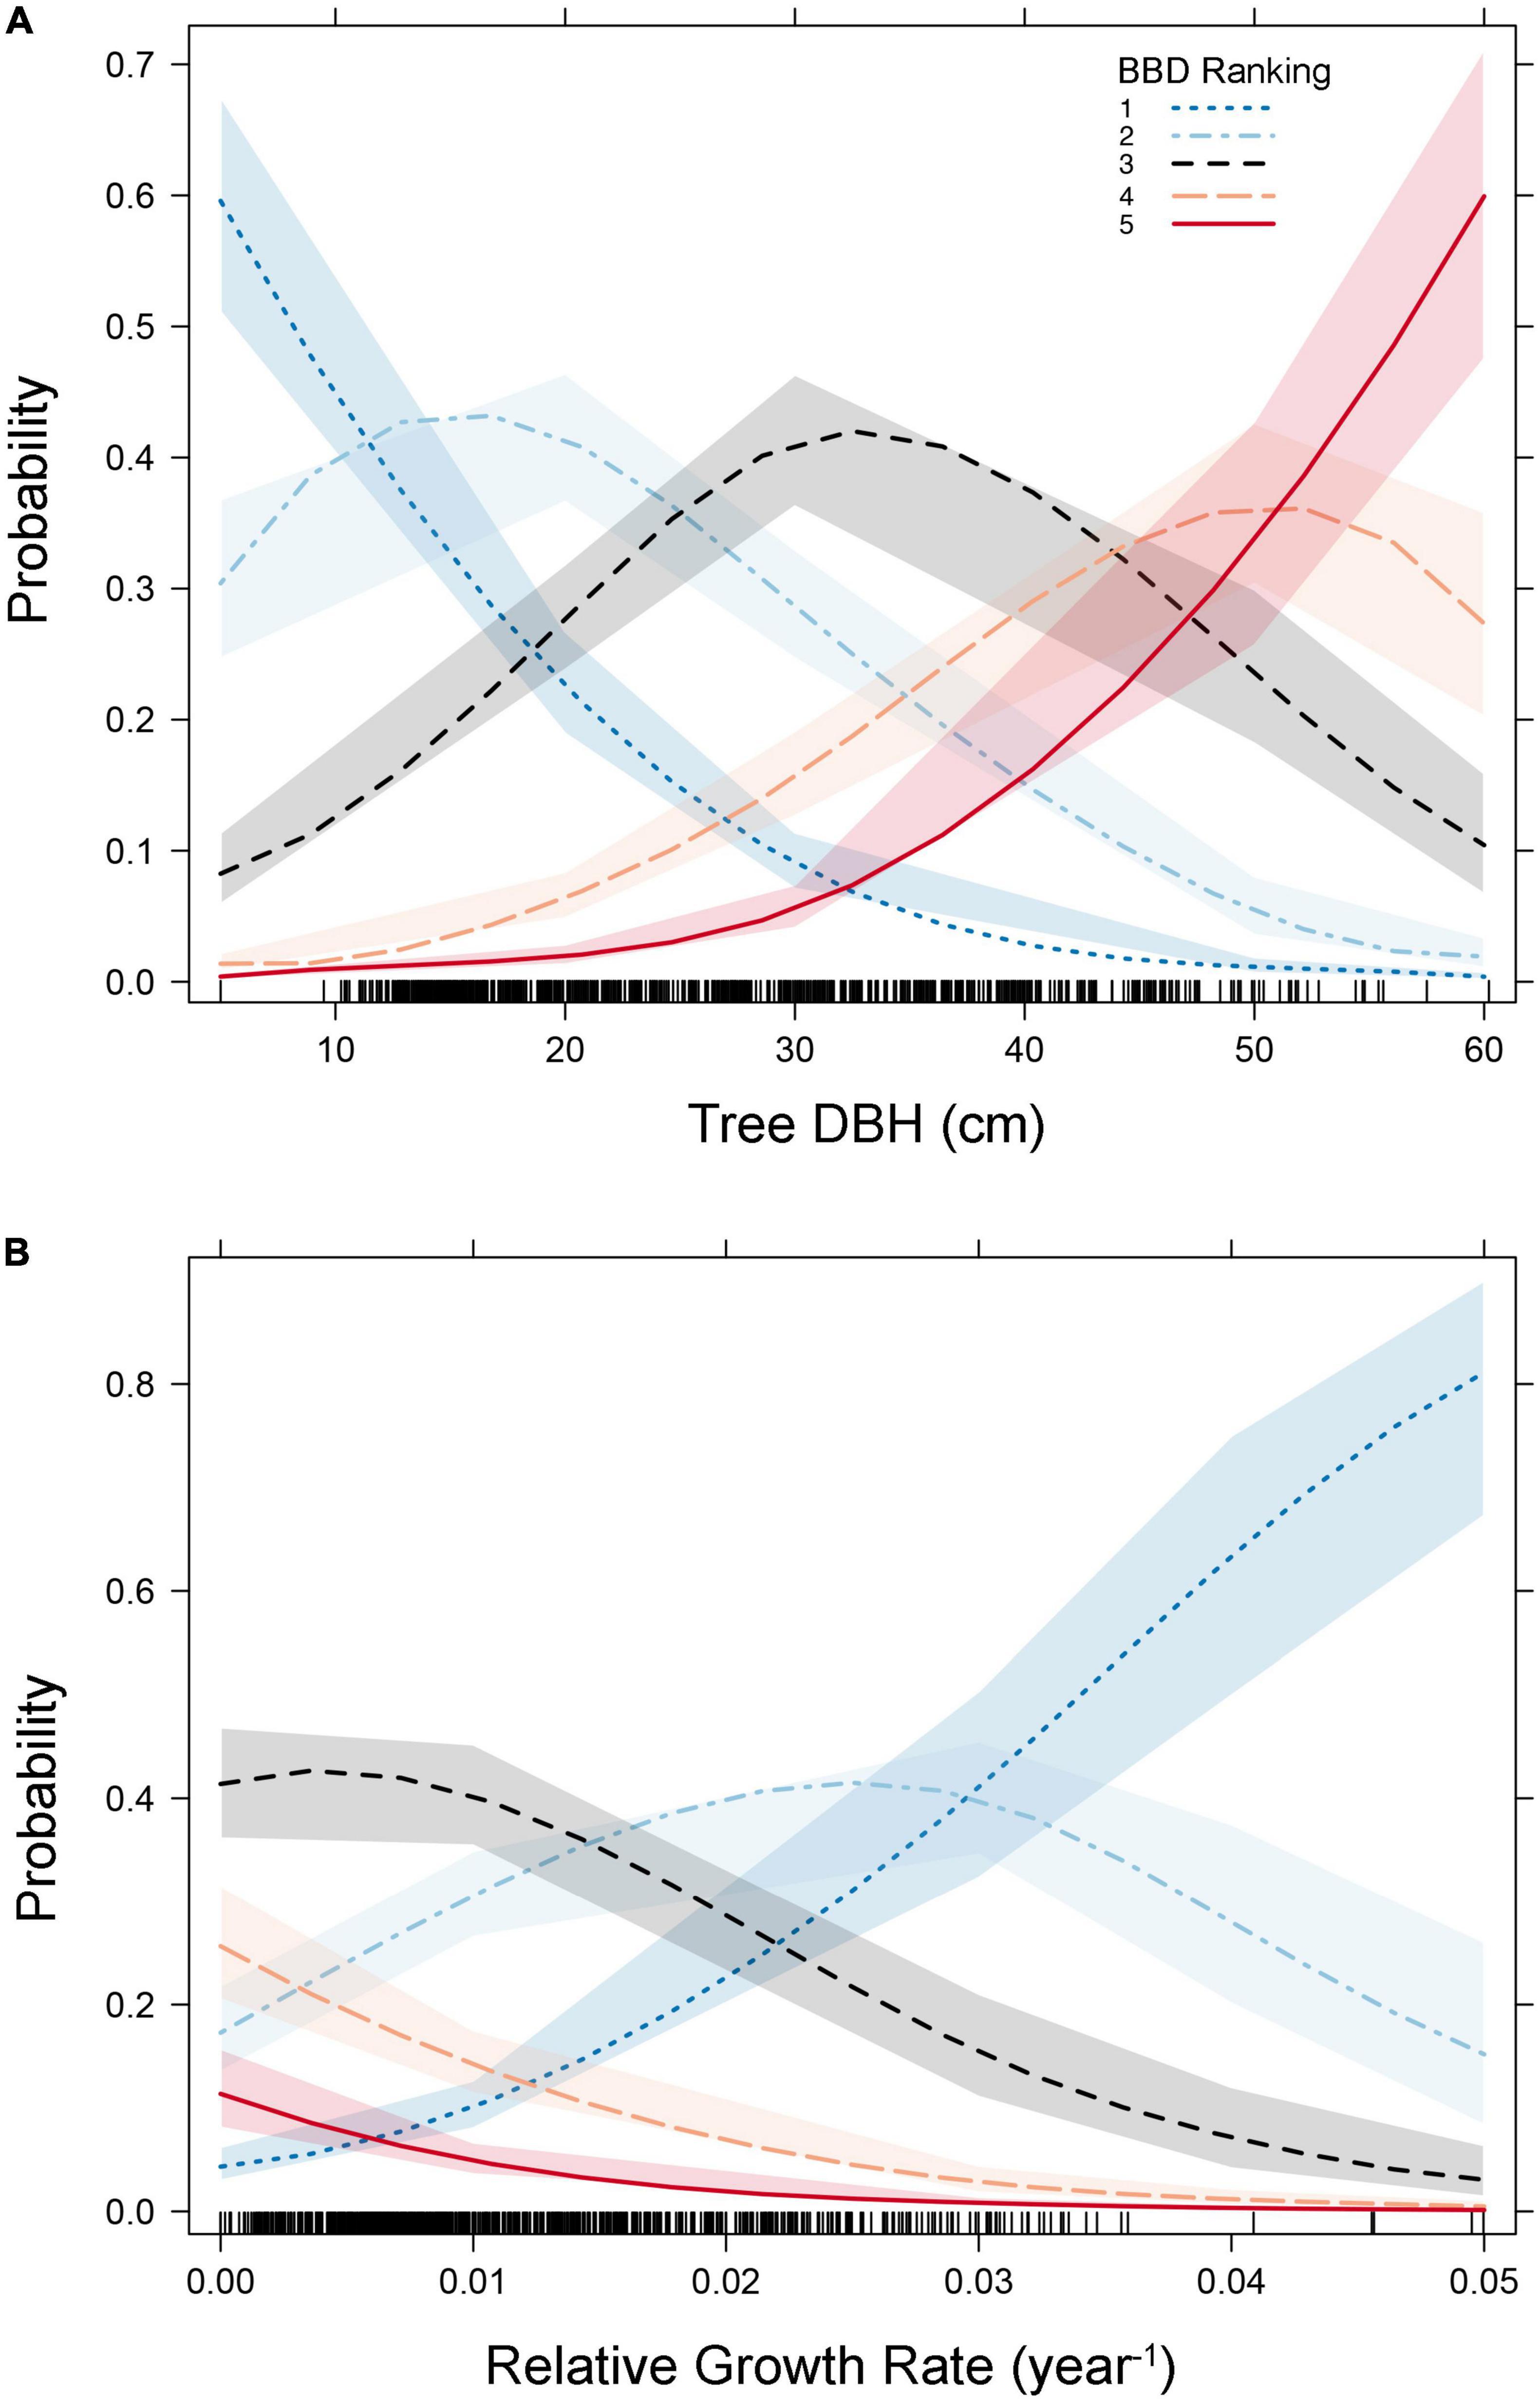
Figure 2. Plots predicting the probability of beech bark disease (BBD) symptom rankings as a function of tree- diameter at breast height (DBH) [Panel (A)] and relative growth rate [Panel (B)]. Variables included in our ordinal logistic regression model are presented here (as per Table 1 and Supplementary Table 1). Shaded areas represent the 95% confidence intervals surrounding predicted probabilities, and the rug plots along the x-axis show the distribution of the data points (i.e., trees) along the values of the independent axis.
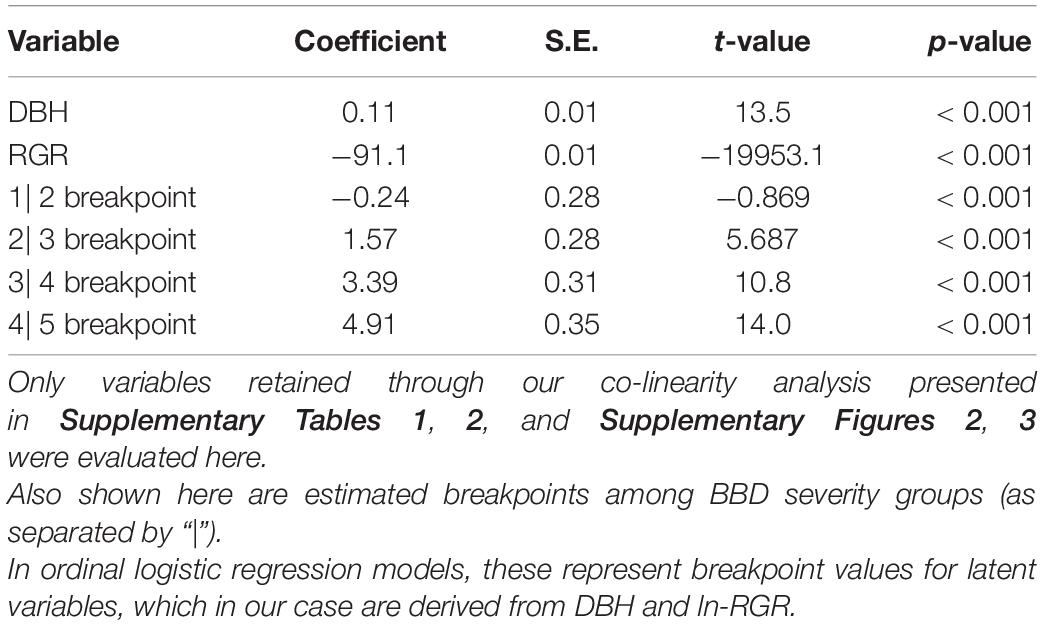
Table 1. Parameters of an ordinal logistic regression model predicting beech bark disease (BBD) severity as a function of tree diameter (DBH) and relative growth rate (RGR).
Tree- and Forest-Level Characteristics of Beech Bark Disease
Our ordinal logistic regression model indicated that as DBH increases, so does the probability of experiencing advanced BBD symptoms (DBH coefficient = 0.11 ± 0.01, p < 0.001, Table 1). For every 1 cm increase in DBH the odds of being ranked in a higher BBD severity group (or proportional odds ratio) is multiplied by 1.114 (95% C.I. = 1.097–1.132). Trees with DBH values ≤ 15 cm showed the highest probability (∼0.7) of experiencing minimal BBD symptoms (i.e., BBD ranking of 1), while trees with DBH ≥ 50 cm expressed the highest probability (∼0.7) of having been killed by BBD (i.e., ranking of 5; Figure 2A).
Tree RGR also had a strong and statistically significant influence on BBD severity (RGR coefficient = −91.1 ± 10.3, p < 0.001, Table 1), though in this case, as RGR increases, so does the likelihood of finding a beech tree with minimal BBD symptoms (Figure 2B). Trees with low RGR values were those most likely to experience medium BBD symptoms where the scale infestation is well established, but the Neonectria have not yet begun impacting the bark substantially (i.e., BBD ranking of 3; Figure 2B). Alternatively, mild BBD symptoms (i.e., BBD ranking of 2) were most probable in trees with high RGR of 0.03–0.05 year–1 (Figure 2B).
Beech Bark Disease Model Accuracy and Validation
The ordinal logistic regression model including DBH and RGR accurately predicted BBD severity in 42.9% of all 651 trees, which was statistically more accurate than expected by chance alone (χ2 = 407.3, p < 0.001; Supplementary Table 2). When an ordinal logistic regression model including DBH and RGR was fit and applied to resampled datasets, our randomization procedure indicated a comparable, albeit slightly lower, prediction accuracy across all BBD groups (mean prediction accuracy across all groups = 42.5 ± 3.1% (s.d.), range of accuracy = 32.3–53.3%; Table 2 and Figure 3).
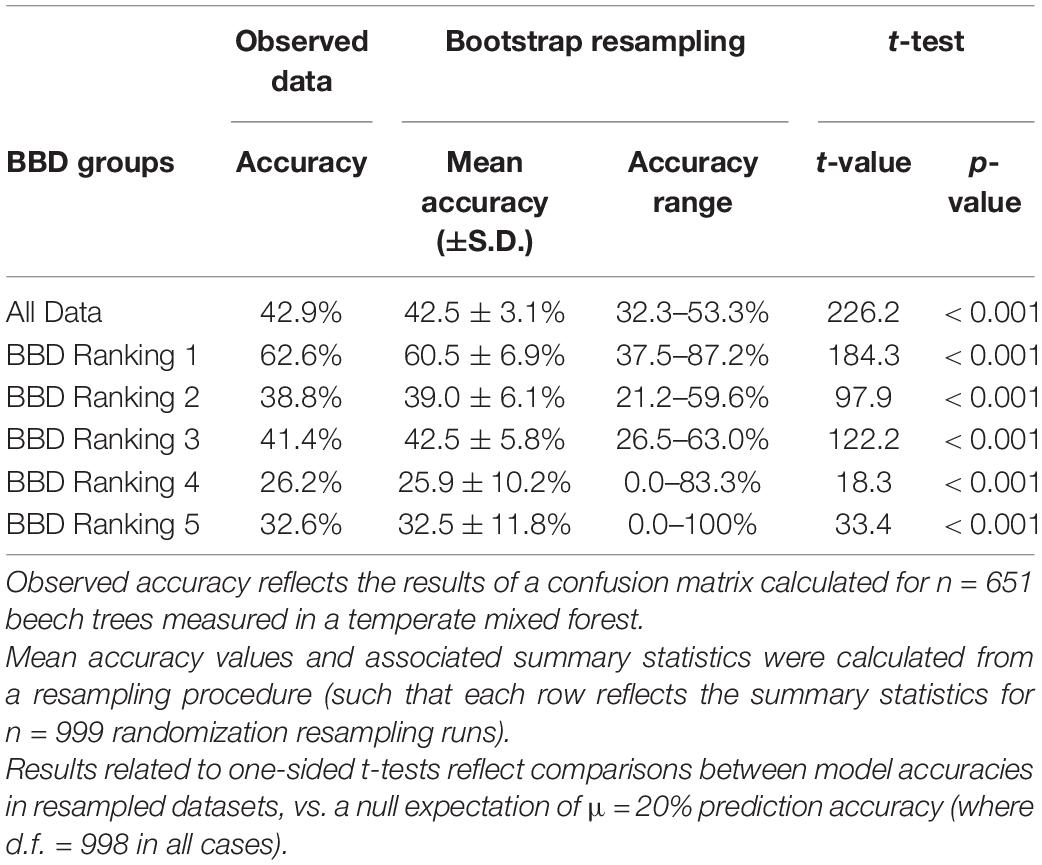
Table 2. Summary of the accuracy of an ordinal logistic regression model including tree diameter (DBH) and relative growth rate (RGR) in predicting BBD severity ranking in beech trees.
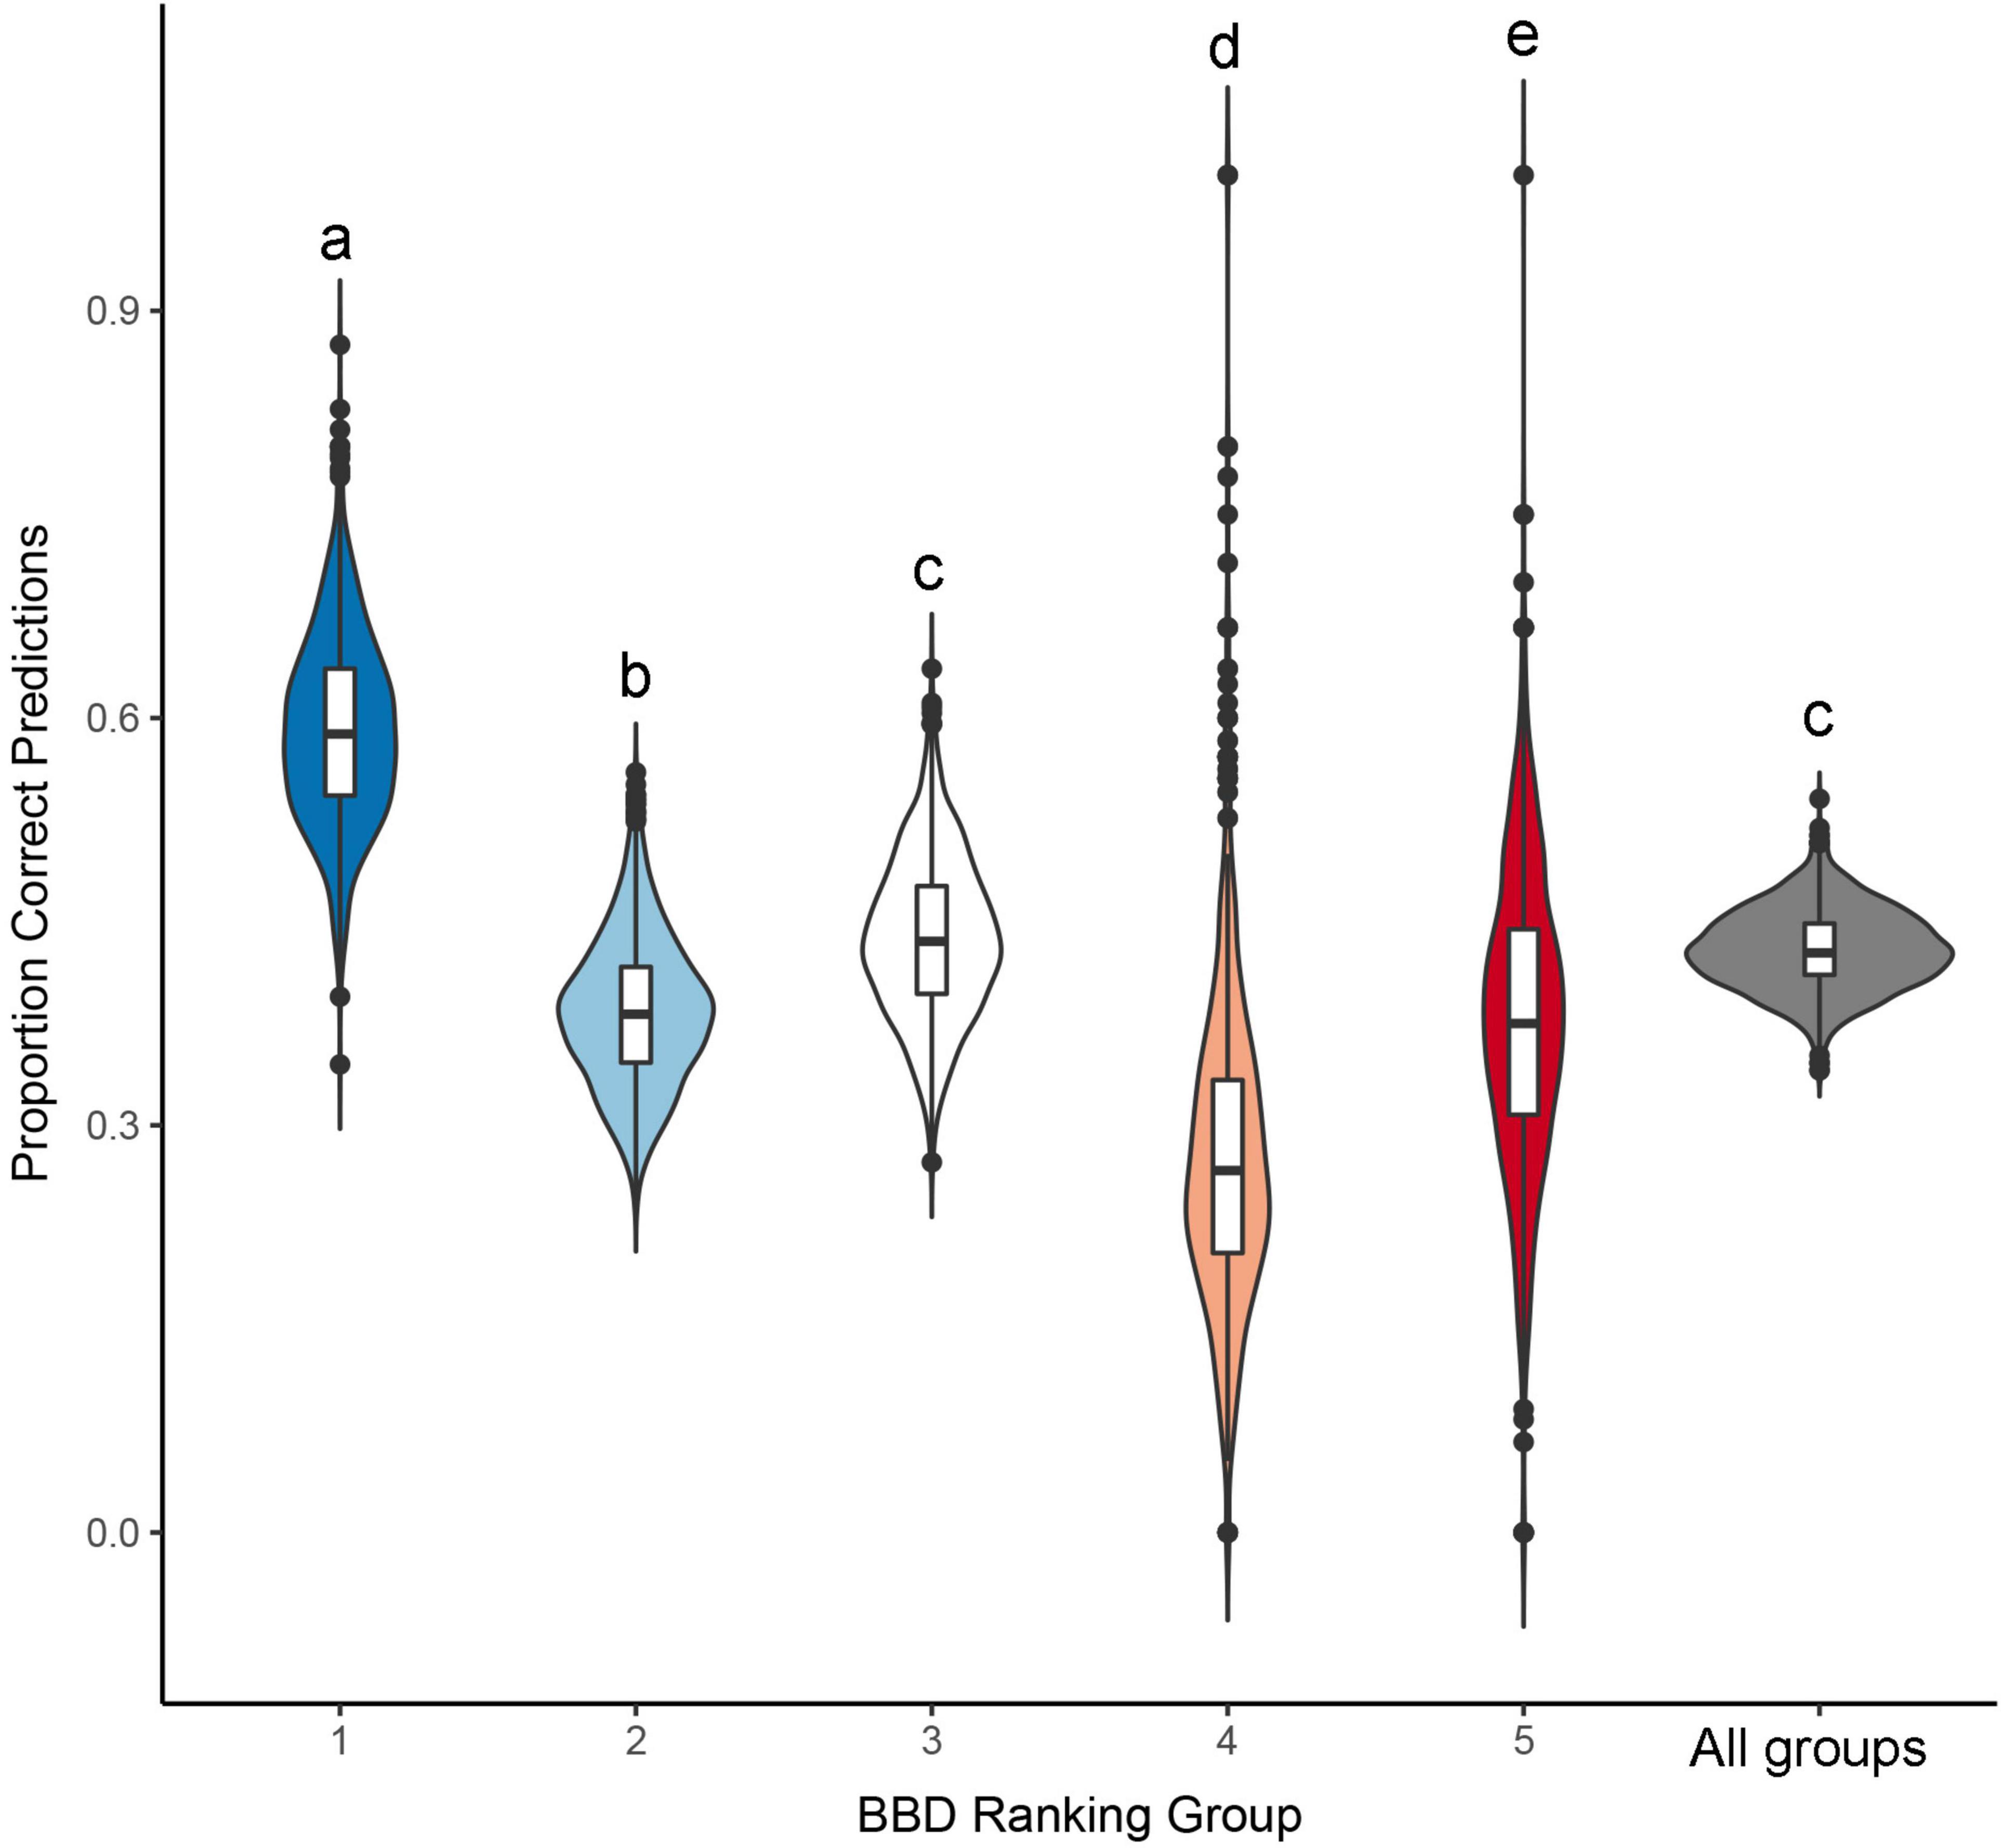
Figure 3. Proportion of correct predictions derived from an ordinal logistic regression model, predicting beech bark disease (BBD) severity as a function of tree diameter and relative growth rate. Distributions presented here were derived from a randomization procedure, that predicted BBD severity based on a model fit to a training dataset (n = 491 randomly selected points) which was then used to predict BBD severity in a validation data (the remaining n = 160 points). Central horizontal line in each violin represents the median prediction accuracy within individual BBD severity groups, or across all groups considered together, and the length of the vertical lines represent the interquartile range of these distributions. Different letters above each distribution denote statistically significant differences (p < 0.05), as per a Tukey’s HSD post-hoc test.
Our resampling procedure indicated that model prediction accuracy differed significantly across BBD ranking groups (ANOVA F5,5986 = 2203, p < 0.001, Tukey HSD p < 0.001 for all but one comparison: Figure 3). Prediction accuracy was highest for BBD ranking 1 where observed prediction accuracy was 62.6%, a value closely approximating the mean prediction accuracy of 60.5 ± 6.9% (s.d.) derived through our resampling procedure (range = 37.5–87.2%, Figure 3). Our model showed lower prediction success in BBD rankings 2 through 5 (range of accuracy = 26.2–41.4%, Table 2), with differences among groups being statistically significant (Tukey HSD p < 0.001; Figure 3). For BBD rankings 2 through 5, observed model prediction accuracy was within 1.1% the mean group accuracy calculated through resampling (Table 2). BBD rankings 4 and 5 were the most variable in terms of the average model prediction accuracy values gleaned from the randomization analysis (Figure 3). However, in all our datasets and subsets, a model including DBH and RGR predicted BBD rankings at rates that were significantly greater than expected by chance alone (i.e., a 1 in 5 chance of a correct prediction; t998 ≥ 18.3, p < 0.001; Table 2).
Spatial Patterns of Beech Bark Disease
We detected evidence of a spatial signature in BBD severity rankings within our study site, with spatial location explaining 18.3% of the variation in BBD severity rankings (PerMANOVA on our initial RDA F346,304 = 1.4, p < 0.001). However, our forward selection procedure indicated that the spatial pattern in BBD severity was well described by a subset of five MEM eigenvectors, all of which were independently significantly correlated with BBD severity (PerMANOVA on the reduced RDA F5,645 = 27.3, p < 0.001, such that p < 0.001 for all five eigenfunctions). This reduced set of five MEM eigenvectors explained the majority (adjusted r2 = 16.8%) of the overall spatial pattern in BBD severity (Figure 4).
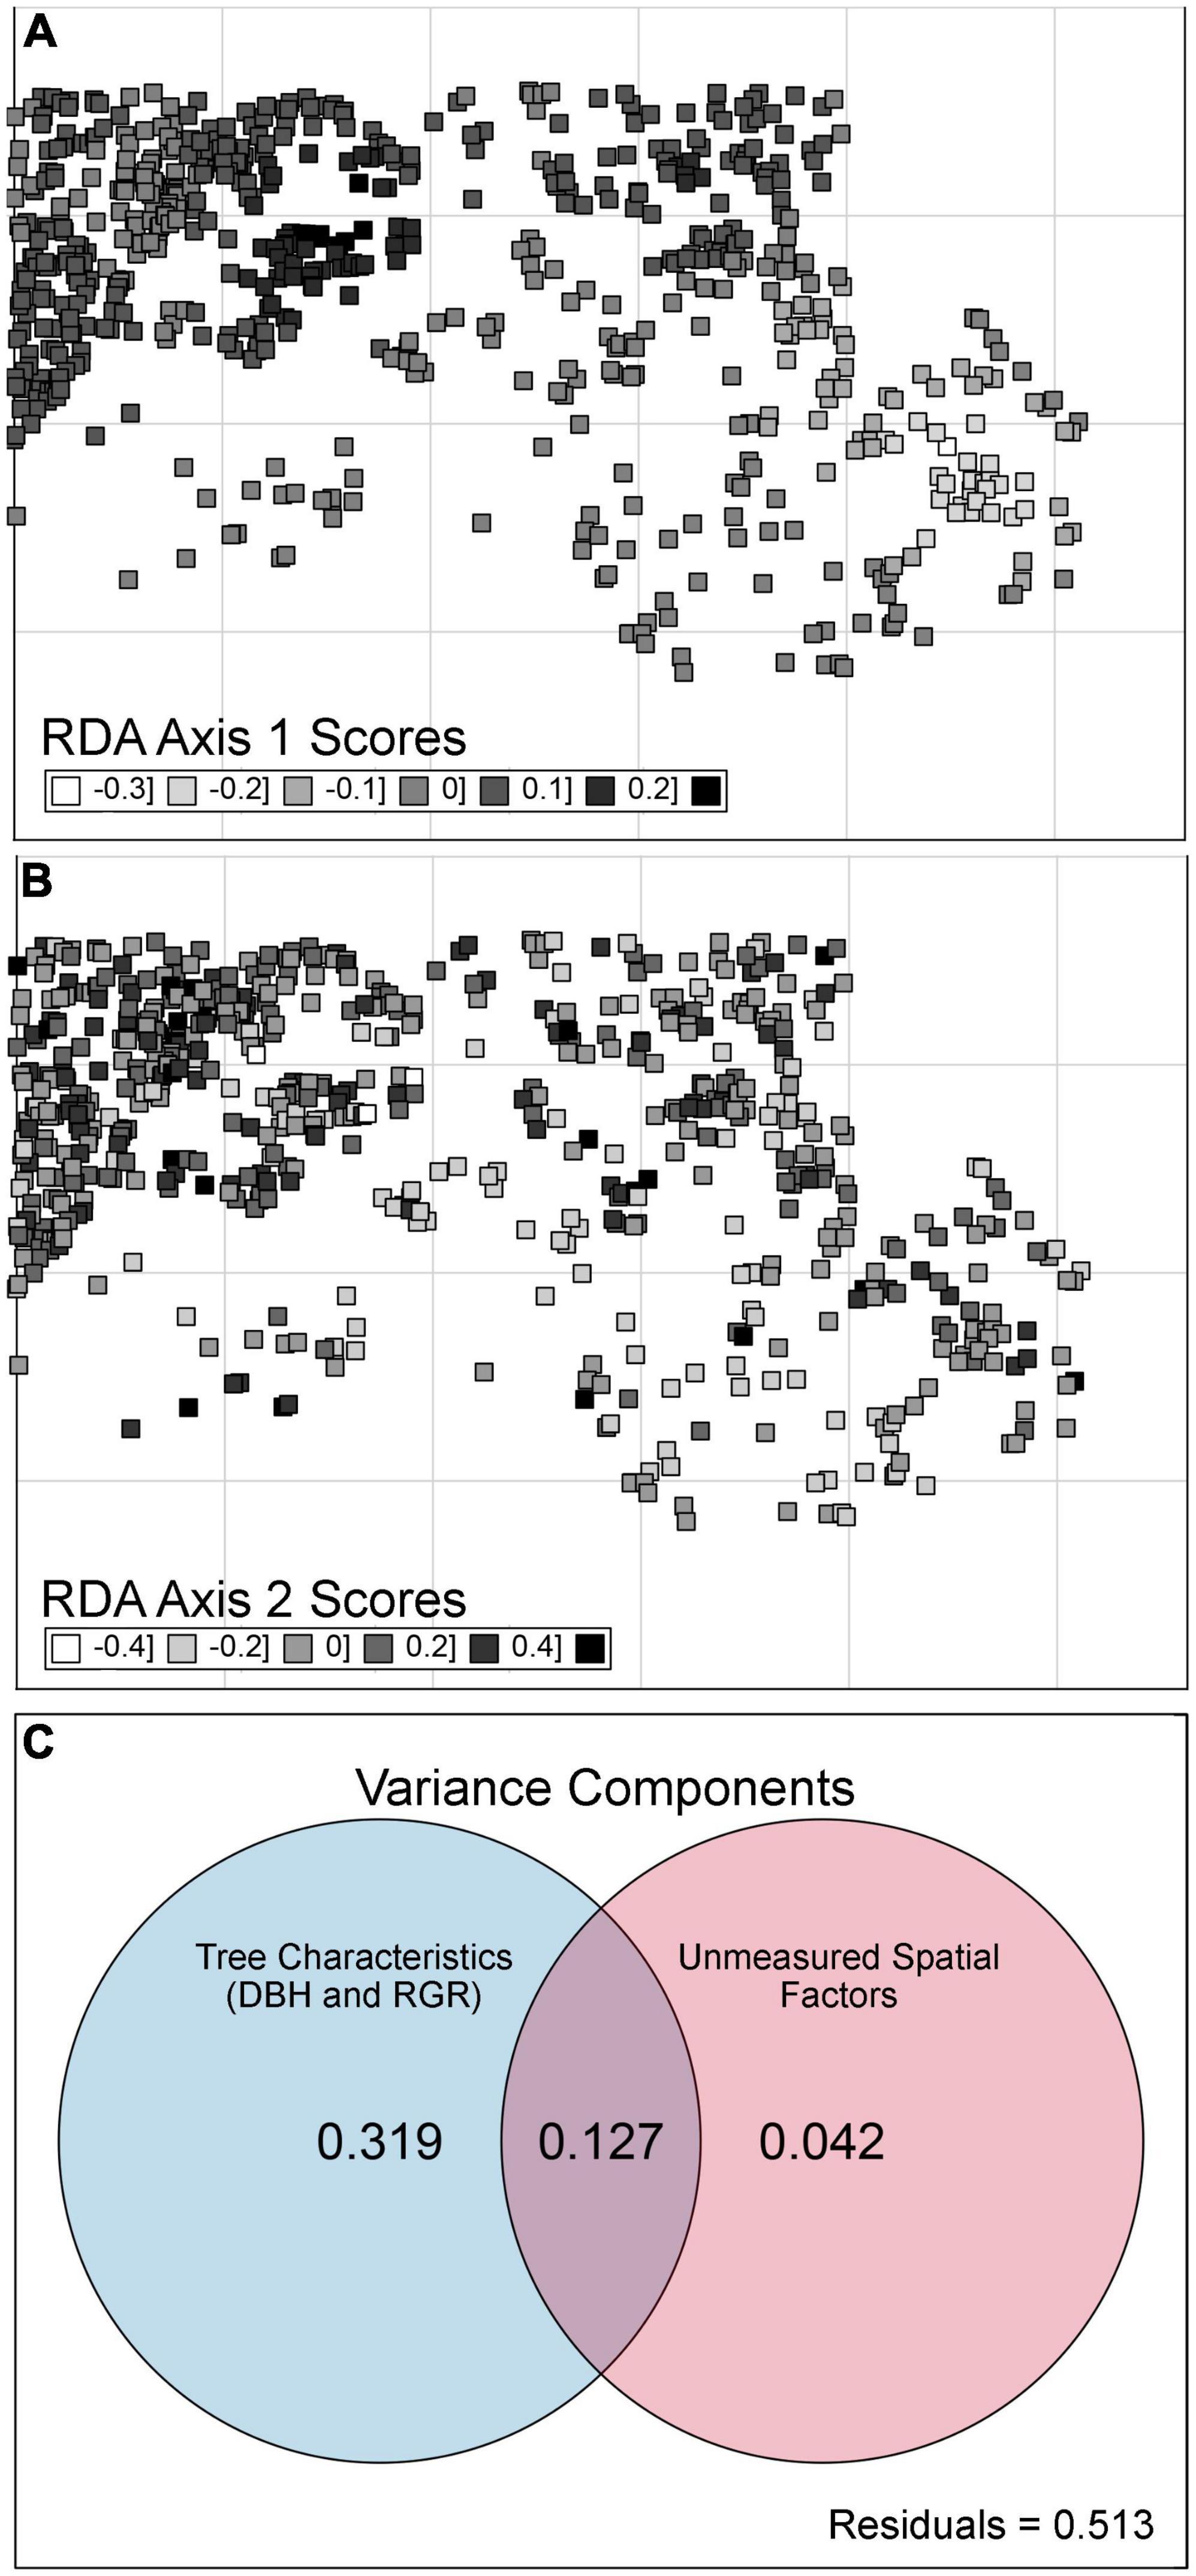
Figure 4. Spatial patterns and variance partitioning analyses for beech bark disease (BBD) severity rankings across a temperate forest site. Spatial patterns in BBD are presented as the first [Panel (A)] and second [Panel (B)] axes for a constrained principal components analysis (CCA), evaluating BBD severity as a function of five statistically significant eigenfunctions retained through a forward stepwise selection process (where adjusted r2 of CCA = 16.8%). While five eigenfunctions were retained, following a gradient of fine to coarse scale structure, only two are shown here. The Venn Diagram [Panel (C)] shows the unique and shared proportions of variation in BBD severity rankings captured by the tree-level characteristics [tree diameter (DBH) and relative growth rate (RGR)] (presented in Figure 2; blue circle), as well as spatial structure as per Moran’s Eignevector Maps [MEMs presented in Panels (A,B), red circle]. Although five MEMs were retained, they contributed little additional unique explanatory power to the overall model of BBD severity.
However, variance partitioning indicated that when accounting for DBH and RGR, unmeasured spatial variables independently explained only 4.2% of the variation in BBD severity rankings (Figure 4C). Alternatively, DBH and RGR cumulatively accounted for 31.9% of the variance in BBD severity, while the interaction between spatial factors (i.e., MEM eigenvectors) and tree characteristics accounted for an additional 12.7% of the variation (Figure 4C). Therefore, we are confident that in our study site the overall spatial variation in BBD severity is related to spatial variation in DBH and RGR.
Estimated C Fluxes Associated With Beech Bark Disease
The entire 13.5-ha HFDP is estimated to store a total of 1,249.0 Mg C in AGB, equating to ∼92.5 Mg C ha–1 (see also Chisholm et al., 2013 for additional analyses on AGB and C stocks in the HDFP). The 508 trees expressing any BBD symptoms (i.e., ranking 2–5) accounted for 78% of the total beech stems in our study site, equal to ∼0.35% of the total 46,204 stems in the HFDP. These 508 trees also account for 90.8% of total C stored in beech AGB throughout our site, such that beech trees with BBD rankings 2–5 account for 99.3 Mg C from a total beech aboveground C stock of 109.3 Mg (Figure 1C).
At our site, effectively 17.3 Mg C (1.3 Mg C ha–1) has already transitioned from the live to dead C pool due to BBD-induced death, as per 65 trees with a BBD ranking of 5 (Figures 1B,C). Of these 65 dead trees, 77% (50 trees total) were large with DBH ≥ 30 cm. The 95 beech trees assigned a BBD ranking of 4 account for an estimated 31.4 Mg C, of which 78% were ≥ 30 cm DBH. Together, these 160 trees in BBD severity ranking categories of 4 and 5 are strongly skewed toward the north-western region of our study site (Figure 1A). These interior forest subplots are therefore likely to experience the largest transitions of C from live- to dead pools associated with BBD-induced mortality.
Discussion
Tree-Level Predictors of Beech Bark Disease Severity
In the late-seral mixed temperate forest of the HFDP the severity of BBD is heterogeneous among trees, and there is a set of tree-level characteristics that predict BBD severity. Trees with lower DBH and higher RGR experienced the least severe symptoms of BBD in our site (Figure 2). Specifically, every 1 cm increase in tree DBH was associated with a 1.1% increase in the likelihood of moving to a higher BBD severity ranking. In our ordinal logistic regression model with both DBH and RGR as predictors (Table 1), breakpoints among BBD severity groups are estimated for latent variables (i.e., an unobserved variable derived from both DBH and RGR together), making interpretation of these breakpoints difficult. However, our data demonstrates a clear trend of increasing mean DBH across BBD severity groups 1–5 with mean DBH equaling 18.2 ± 7.4 (s.d.), 21.8 ± 7.9, 28.1 ± 9.4, 37.5 ± 10.4, and 36.9 ± 11.6 cm, respectively (ANOVA F1,649 = 367.4, p < 0.001; Supplementary Figure 4). At the same time, trees falling into higher BBD classes demonstrated lower RGRs, with mean values of 0.019, 0.015, 0.011, 0.009, and 0.004 y–1 in BBD groups 1–5, respectively (ANOVA F1,649 = 201.3, p < 0.001; data not shown). Since we did not necessarily capture the initial times of scale insect infestation or fungal infection for all beech trees in our site (i.e., those in BBD categories 3–5), it is difficult to discern if lower RGR is a cause or consequence of higher severity rankings. Quantifying growth across of trees with known or approximated dates of infection using dendrochronological data would be a key avenue for resolving this uncertainty.
Taken together, our findings are consistent with studies showing that smaller trees with faster growth rates are able to avoid succumbing to severe BBD infection, due to their ability to repair bark damage from the beech scale insect, maintain stem physiological functioning despite Neonectria infections, and synthesize secondary defensive compounds (Houston, 1994; Cale et al., 2015, 2017). Yet literature suggests this resistance pathway may not be permanent: as the growth rate of small trees declines either due to size-dependent growth trajectories or BBD impacts, the accumulation of cankers and girdling will likely further slow tree growth, eventually killing trees prematurely (Morin et al., 2007). Future censuses at HFDP, when integrated with our BBD assessments here, are therefore well suited to quantify the influence of BBD severity on beech survival, growth, mortality, and ultimately screen for BBD resistance.
In addition to elucidating the tree-level factors that predict disease severity, our study points to the important role forest inventory datasets and permanent plot networks (Busby and Canham, 2011; Davies et al., 2021) can play in potentially screening for pest or pathogen resistance. For instance, researchers have found that beech scale infestations—the first stage of a BBD-induced mortality trajectory—occurs on living trees ranging up to at least 35 cm in size (reviewed by Cale et al., 2017). In our survey we observed seven beech trees > 35 cm DBH, ranging in size from 36.7 to 55.4 cm, that were free of any BBD symptoms (i.e., BBD severity ranking of 1). Five of these trees are situated in the north-western portion of the HFDP, where trees with greater BBD severity are otherwise quite common (Figure 1A). These trees arguably represent an ideal starting point for evaluating the genetic basis and/or physiological mechanisms of scale and/or Neonectria resistance. Doing so would complement existing literature exploring BBD resistance, which to date has largely focused on understanding genetic resistance to scale infestations in managed forests (Cale et al., 2017). Resistance to BBD is heritable (Koch et al., 2010), and related to a single locus on the genome of the European beech (Ćalić et al., 2017). This gene has been found on chromosome 5, which encodes an mRNA for a metallothionein-like protein, cultivating resistance to the beech scale through coordination of metal atoms (Ćalić et al., 2017). This locus, along with the presence of naturally genetically resistant American beech trees, offers a promising trajectory for applied breeding, conservation, and restoration programs to combat BBD in eastern North American forests.
Spatial Patterns in Beech Bark Disease Severity
While we detected a statistically significant spatial pattern in BBD severity, as per statistically significant MEM eigenvectors (Figure 4), these spatial patterns were largely intertwined with spatial variability in DBH and RGR. Spatial location, DBH, and RGR, accounted for 48.8% of the variability in BBD severity across the forest (Figure 4C). The north-western portion of the HFDP continues to experience the severest BBD, likely due to the higher number of large DBH and slow-growing trees. Our MEMs found that unmeasured spatial variables accounted for only 4.2% of the variation in BBD severity. This relatively small proportion of variation in BBD severity (relative to tree-level characteristics) may be related to spatial variation in abiotic variables that predict BBD severity.
Topographic characteristics including aspect, elevation, and slope have been shown to be correlated with BBD severity through their influence on soil water drainage and moisture retention (Ehrlich, 1934; Griffin et al., 2003; Wiggins et al., 2004). More specifically, Ehrlich (1934) found that BBD severity increases with slope, Houston (1994) found beech trees growing on south-facing and well-drained slopes were nearly free from BBD infestation and related stem defects, and Mulder et al. (2020) found that the beech scale tended to colonize the northern side on individual trees within pockets of moderate moisture. To explore these possibilities, we executed a confirmatory analysis that included 10 forest plot-scale variables measured within each 20-by-20 m subplot in the HFDP, including elevation, slope, aspect, topographic index, ground water content, maximum tree height, functional dispersion, and community-weighted mean leaf nitrogen concentrations, leaf mass per area, and wood specific gravity. All plot-level variables were derived from Schurman (2016). Following a step-wise selection procedure, only one of these variables (i.e., aspect) was retained as a predictor in our ordinal logistic regression model. However, including aspect in our model increased BBD severity prediction accuracy to 44.2, vs. 42.9% in our model containing DBH and RGR alone (i.e., the model presented in Table 1). Including aspect as a predictor variable in our MEM variance partitioning analysis, also reduced the variation in BBD severity associated with unmeasured spatial factors from 4.2% (presented in Figure 4) to 3.7%. Therefore, aspect does account for a small proportion of BBD severity in our site, but in sum, the inclusion of 10 local plot-scale variables resulted in a negligible increase in BBD prediction accuracy.
Alternatively then, the 4.2% of the variation in BBD severity explained by unmeasured spatial factors, may reflect the invasion trajectory of BBD from inland areas toward the shoreline (Figure 1A). This hypothesis, coupled with regional arrival dates for BBD estimated as recent as 2000-10—dates that are among the most recent within BBDs spread across Canada—suggests that the HFDP may be existing with a number of the BBD stages described by Shigo (1972) and reviewed by Cale et al. (2017). Northern and western regions of our study site show characteristics of the “killing front” (i.e., heavy incidence of scale, Neonectria, and beech mortality), while the southern and eastern extents of the HFDP agree with descriptions of the “advance front” (i.e., light to moderate incidence of scale, absent or light incidence of Neonectria, and minimal to no elevated beech mortality). Within the “killing front,” studies have found 50% mortality of mature beech within 10 years, though mortality rates high as 61–81% over only 7 years have been reported (reviewed by Cale et al., 2017).
Impacts of Beech Bark Disease on Forest Structure and Function
Beech bark disease is anticipated to significantly increase the amount of large dead wood decomposing in the forests of the Great Lakes-St. Lawrence region. In our site, the 160 trees with severe BBD symptoms (i.e., ranking 4 or 5) account for ∼25% of the total beech stems in the HFDP and are associated with ∼45% of the total aboveground C stored in all adult beech trees (Figures 1B,C). These 160 trees are anticipated to die within 1–8 years. It is also likely that the 172 stems with a BBD ranking of 3 will progress through subsequent BBD severity stages, ultimately dying from BBD within the next 30–50 years. In sum, at our site a total estimated 80.8 Mg C (i.e., trees with BBD rankings ≥ 3; Figure 1C) will transition from the live C pool to woody necromass within the next 50 years. This equates to ∼6.0 Mg C ha–1, or ∼6.5% of the average 92.5 Mg C ha–1 across the entire HFDP, shifting from the live to dead C pool. We anticipate then that BBD will emerge as one of the primary mortality agents influencing the structure and functioning of the HFDP ecosystem. A formal diagnosis of tree mortality agents across our plot (e.g., Martin et al., 2014) coupled with analyses of detailed tree demographic and neighborhood data (e.g., Gonzalez-Akre et al., 2016) are needed to confirm this expectation.
Biomass C losses due to BBD may be offset by the regeneration of small beech saplings that sprout following tree mortality. Being capable of reproducing vegetatively as well as sexually, beech commonly forms “beech thickets” that develop from the roots of parent trees following mortality (Giencke et al., 2014). Clonal sprouts grow from wounded roots of dying parent trees, occupying space and therefore arresting the establishment of other tree species, and reducing diversity in certain other organismal functional groups including plant ground cover (Cale et al., 2013). While beech thickets are likely to alter tree regeneration dynamics, surprisingly their emergence and persistence may lead to only marginal changes in total beech biomass and C, though findings in the literature are mixed. Forrester et al. (2003) found total AGB of beech trees to only decrease from 59 Mg ha–1 in 1985 to 58 Mg ha–1 in 2000, and the total beech basal area remained stable at 9 m2 ha–1 following BBD infection and mortality in a northern hardwood forest in New York, United States. In contrast, Busby and Canham (2011) found that the maximum beech sapling biomass observed in a forest plot in Maine was 25.5 Mg ha–1 compared to a “typical” forest stand with > 100 Mg ha–1. This result indicates that beech biomass in an “aftermath” stage forest may be only ∼25% of that in a mature uninfected forest. Moreover, few studies have included analyses of the soil C effluxes, which have been found to largely spike at the early onset of BBD in the Haliburton Forest region (Geddes et al., 2014) and then decrease after the death of beech trees (Hancock et al., 2008).
There are also additional ecological impacts of BBD beyond C fluxes, including a decline in mast production relied on by forest fauna (McLaughlin et al., 1994; Bergeron et al., 2011; Jensen et al., 2012). Similarly, BBD will increase dead log biomass and the number of standing snags from beech trees. These changes are likely to be accompanied by substantial increases in standing and downed coarse woody debris volumes, which may enhance landscape-scale wildlife habitat provisioning (McGee, 2000; Morin et al., 2007). Wildlife and insect populations may thus show dynamic changes though the “killing front” and “aftermath” stages, though studies to date have found little effect on biodiversity (Cale et al., 2013).
Conclusion
Our study contributes to an understanding of the extent and factors predicting BBD severity in unmanaged temperate forest ecosystems, complimenting the extensive work on BBD that, to date, has largely focused on BBD spread and resistance in managed systems (e.g., see Figure 4 in Cale et al., 2017). Our BBD survey confirms that BBD is now endemic to our study region, and aligns closely with reports that the disease arrived in this region in the 2000s (Cale et al., 2017). In finding that DBH is a strong predictor of BBD severity, our findings also support integrating BBD mortality and decline functions into forest C budget models, particularly those that rely on forest inventory and DBH data (Kurz et al., 2009). Finally, while certain implications of BBD on forest function are clear—including a loss of ∼6.0 Mg C ha–1 on average across our site—longer term impacts (i.e., those unfolding over the next 10–50 years) of BBD on forest structure, function, and composition require monitoring of our site throughout the “killing front” and “aftermath” phases. Indeed, research showing that beech thickets represent a reservoir of BBD which can trigger “secondary killing fronts,” suggests that BBD and beech regeneration dynamics will strongly influence ecosystem functioning in unmanaged temperate forests for decades.
Data Availability Statement
The raw data supporting the conclusions of this article will be made available by the authors, without undue reservation.
Author Contributions
RK conceived the study, led data collection and analysis, and wrote the manuscript. AM conceived the study, led data analysis, and wrote the manuscript. RM and EY assisted in field data collection and data management and edited the manuscript. JS contributed census and forest plot-level biotic and abiotic data from the HFDP and edited the manuscript. PJ contributed to data analysis and edited the manuscript. ST contributed in the census data from the HFDP, contributed to the data analysis, and edited the manuscript. All authors contributed to the article and approved the submitted version.
Funding
This research was supported by a Discovery Grant from the Natural Sciences and Engineering Research Council of Canada (NSERC), as well as a University of Toronto Connaught New Researcher Award, to A. R. Martin.
Conflict of Interest
The authors declare that the research was conducted in the absence of any commercial or financial relationships that could be construed as a potential conflict of interest.
Publisher’s Note
All claims expressed in this article are solely those of the authors and do not necessarily represent those of their affiliated organizations, or those of the publisher, the editors and the reviewers. Any product that may be evaluated in this article, or claim that may be made by its manufacturer, is not guaranteed or endorsed by the publisher.
Acknowledgments
We would like to acknowledge Adam Gorgolewski at the Haliburton Forest and Wild Life Reserve for assistance with logistics conducting this research.
Supplementary Material
The Supplementary Material for this article can be found online at: https://www.frontiersin.org/articles/10.3389/ffgc.2022.831663/full#supplementary-material
References
Arellano, G., Zuleta, D., Davies, S. J., and Wulf, M. (2020). Tree death and damage: a standardized protocol for frequent surveys in tropical forests. J. Veg. Sci. 32:e12981.
Bergeron, R., Reale, D., Humphries, M. M., and Garant, D. (2011). Anticipation and tracking of pulsed resources drive population dynamics in eastern chipmunks. Ecology 92, 2027–2034.
Busby, P. E., and Canham, C. D. (2011). An exotic insect and pathogen disease complex reduces aboveground tree biomass in temperate forests of eastern North America. Can. J. For. Res. 41, 401–411. doi: 10.1139/x10-213
Cale, J. A., Garrison-Johnston, M. T., Teale, S. A., and Castello, J. D. (2017). Beech bark disease in North America: over a century of research revisited. For. Ecol. Manage. 394, 86–103. doi: 10.1016/j.foreco.2017.03.031
Cale, J. A., Mcnulty, S. A., Teale, S. A., and Castello, J. D. (2013). The impact of beech thickets on biodiversity. Biol. Invasions 15, 699–706. doi: 10.1007/s10530-012-0319-5
Cale, J. A., Teale, S. A., Johnston, M. T., Boyer, G. L., Perri, K. A., and Castello, J. D. (2015). New ecological and physiological dimensions of beech bark disease development in aftermath forests. For. Ecol. Manage. 336, 99–108. doi: 10.1016/j.foreco.2014.10.019
Ćalić, I., Koch, J., Carey, D., Addo-Quaye, C., Carlson, J. E., and Neale, D. B. (2017). Genome-wide association study identifies a major gene for beech bark disease resistance in American beech (Fagus grandifolia Ehrh.). BMC Genom. 18:547. doi: 10.1186/s12864-017-3931-z
Chisholm, R. A., Muller-Landau, H. C., Abdul Rahman, K., Bebber, D. P., Bin, Y., Bohlman, S. A., et al. (2013). Scale-dependent relationships between tree species richness and ecosystem function in forests. J. Ecol. 101, 1214–1224. doi: 10.1111/ele.13330
Davies, S. J., Abiem, I., Abu Salim, K., Aguilar, S., Allen, D., Alonso, A., et al. (2021). ForestGEO: understanding forest diversity and dynamics through a global observatory network. Biol. Conserv. 253:108907.
Dawkins, H. C., and Field, D. R. B. (1978). A Long-term Surveillance System for British Woodland Vegetation. C.F.I. Occasional Papers no.1. Oxford: Commenwealth Forestry Institute.
Dray, S., Bauman, D., Blanchet, G., Borcard, D., Clappe, S., Guenard, G., et al. (2021). Package ‘adespatial’: Multivariate Multiscale Spatial Analysis. Available online at: https://cran.r-project.org/web/packages/adespatial/adespatial.pdf [accessed on April 7, 2021].
Ehrlich, J. (1934). The beech bark disease: a Nectria disease of Fagus, following Cryptococcus Fagi (Baer.). Can. J. Res. 10, 593–692. doi: 10.1139/cjr34-070
Evans, A. M., and Finkral, A. J. (2010). A new look at spread rates of exotic diseases in North American forests. For. Sci. 56, 453–459.
Forrester, J. A., Mcgee, G. G., and Mitchell, M. J. (2003). Effects of beech bark disease on aboveground biomass and species composition in a mature northern hardwood forest, 1985 to 2000. J. Torrey Bot. Soc. 130, 70–78. doi: 10.2307/3557531
Fox, J., Weisberg, S., Price, B., Friendly, M., Hong, J., Andersen, R., et al. (2020). Package ‘effects’: Effect Displays for Linear, Generalized Linear, and Other Models. Available online at: https://CRAN.R-project.org/package=effects [accessed on January 06, 2022].
Geddes, J. A., Murphy, J. G., Schurman, J., Petroff, A., and Thomas, S. C. (2014). Net ecosystem exchange of an uneven-aged managed forest in central Ontario, and the impact of a spring heat wave event. Agric. For. Meteorol. 19, 105–115. doi: 10.1016/j.agrformet.2014.08.008
Giencke, L. M., Dovčiak, M., Mountrakis, G., Cale, J. A., and Mitchell, M. J. (2014). Beech bark disease: spatial patterns of thicket formation and disease spread in an aftermath forest in the northeastern United States. Can. J. For. Res. 44, 1042–1050. doi: 10.1139/cjfr-2014-0038
Gonzalez-Akre, E., Meakem, V., Eng, C. Y., Tepley, A. J., Bourg, N. A., Mcshea, W., et al. (2016). Patterns of tree mortality in a temperate deciduous forest derived from a large forest dynamics plot. Ecosphere 7:e01595.
Griffin, J. M., Lovett, G. M., Arthur, M. A., and Weathers, K. C. (2003). The distribution and severity of beech bark disease in the Catskill Mountains, NY. Can. J. For. Res. 33, 1754–1760. doi: 10.1139/x03-093
Hancock, J. E., Arthur, M. A., Weathers, K. C., and Lovett, G. M. (2008). Carbon cycling along a gradient of beech bark disease impact in the Catskill Mountains, New York. Can. J. For. Res. 38, 1267–1274. doi: 10.1139/x07-228
Hoffmann, W. A., and Poorter, H. (2002). Avoiding bias in calculations of relative growth rate. Ann. Bot. 90, 37–42. doi: 10.1093/aob/mcf140
Houston, D. R. (1994). Major new tree disease epidemics: beech bark disease. Annu. Rev. Phytopathol. 32, 75–87. doi: 10.1146/annurev.py.32.090194.000451
Jensen, P. G., Demers, C. L., Mcnulty, S. A., Jakubas, W. J., and Humphries, M. M. (2012). Marten and fisher responses to fluctuations in prey populations and mast crops in the northern hardwood forest. J. Wildlife Manage. 76, 489–502. doi: 10.1002/jwmg.322
Koch, J. L., Carey, D. W., Mason, M. E., and Nelson, C. D. (2010). Assessment of beech scale resistance in full-and half-sibling American beech families. Can. J. For. Res. 40, 265–272. doi: 10.1139/x09-189
Kurz, W., Dymond, C., White, T., Stinson, G., Shaw, C., Rampley, G., et al. (2009). CBM-CFS3: a model of carbon-dynamics in forestry and land-use change implementing IPCC standards. Ecol. Model. 220, 480–504. doi: 10.1016/j.ecolmodel.2008.10.018
Lambert, M. C., Ung, C. H., and Raulier, F. (2005). Canadian national tree aboveground biomass equations. Can. J. For. Res. 35, 1996–2018. doi: 10.1139/x05-112
Martin, A. R., Caspersen, J. P., Fuller, M. M., Jones, T. A., and Thomas, S. C. (2014). Temporal dynamics and causes of postharvest mortality in a selection-managed tolerant hardwood forest. For. Ecol. Manage. 314, 183–192. doi: 10.1016/j.foreco.2013.11.032
Martin, A. R., Doraisami, M., and Thomas, S. C. (2018). Global patterns in wood carbon concentration across the world’s trees and forests. Nat. Geosci. 11, 915–920. doi: 10.1038/s41561-018-0246-x
Martin, A. R., Gezahegn, S., and Thomas, S. C. (2015). Variation in carbon and nitrogen concentration among major woody tissue types in temperate trees. Can. J. For. Res. 45, 744–757. doi: 10.1139/cjfr-2015-0024
McGee, G. G. (2000). The contribution of beech bark disease-induced mortality to coarse woody debris loads in northern hardwood stands of Adirondack Park, New York, U.S.A. Can. J. For. Res. 30, 1453–1462. doi: 10.1139/x00-053
McLaughlin, C. R., Matula, G. J. J., and O’connor, R. J. (1994). “Synchronous reproduction by Maine black bears,” in Proceedings of the International Association for Bear Research and Management, Missoula, MT, 471–479. doi: 10.2307/3872735
Morin, R. S., Liebhold, A. M., Tobin, P. C., Gottschalk, K. W., and Luzader, E. (2007). Spread of beech bark disease in the eastern United States and its relationship to regional forest composition. Can. J. For. Res. 37, 726–736. doi: 10.1139/x06-281
Mulder, O., Sleith, R., Mulder, K., and Coe, N. R. (2020). A Bayesian analysis of topographic influences on the presence and severity of beech bark disease. For. Ecol. Manage. 472, 1–9.
Oksanen, J., Blanchet, F. G., Friendly, M., Kindt, R., Legendre, P., Mcglinn, D., et al. (2020). Package ‘vegan’: Community Ecology Package. Available online at: https://cran.r-project.org/web/packages/vegan/vegan.pdf [accessed on November 28, 2020]
Perrin, R., and Garbaye, J. (1984). Influence de la nutrition du hetre (Fagus sylvatica L.) sur la sensibilite au chancre provoque par Necria ditissima Tul. Ann. Sci. For. 41, 449–460. doi: 10.1051/forest:19840405
Ripley, B., Venables, B., Bates, D. M., Hornik, K., Gebhardt, A., and Firth, D. (2021). Package ‘MASS’: Support Functions and Datasets for Venables and Ripley’s MASS. Available online at: https://cran.r-project.org/web/packages/MASS/MASS.pdf [accessed on March 23, 2022]
Schurman, J. (2016). From Plant Properties to Forest Function in Temperate Mixed Angiosperm-Conifer Old Growth. Dissertation. Toronto, ON: University of Toronto.
Stephanson, C. A., and Coe, N. R. (2017). Impacts of beech bark disease and climate change on American beech. Forests 8:155. doi: 10.3390/f8050155
Wargo, P. M. (1988). Amino nitrogen and phenolic constituents of bark of American beech, Fagus grandifolia, and infestation by beech scale, Cryptococcus fagisuga. Eur. J. For. Pathol. 18, 279–290. doi: 10.1111/j.1439-0329.1988.tb00215.x
Wickham, H., Chang, W., Henry, L., Pedersen, T. L., Takahashi, K., Wilke, C., et al. (2021). Package ‘ggplot2’: Create Elegant Data Visualisations Using the Grammar of Graphics. Available online at: https://cran.r-project.org/web/packages/ggplot2/ggplot2.pdf [accessed on June 25, 2021]
Wiggins, G. J., Grant, J. F., Windham, M. T., Vance, R. A., Rutherford, B., Klein, R., et al. (2004). Associations between causal agents of the beech bark disease complex [Crytococcus fagisuga (Homoptera: Cryptococcidae) and Nectria spp.] in the Great Smoky Mountains National Park. Environ. Entomol. 33, 1274–1281. doi: 10.1603/0046-225x-33.5.1274
Keywords: Fagus grandifolia, Neonectria, Cryptococcus, beech bark disease, invasive species, forest carbon, forest pathology
Citation: Kish R, James PMA, Mariani RO, Schurman JS, Thomas SC, Young EN and Martin AR (2022) Beech Bark Disease in an Unmanaged Temperate Forest: Patterns, Predictors, and Impacts on Ecosystem Function. Front. For. Glob. Change 5:831663. doi: 10.3389/ffgc.2022.831663
Received: 08 December 2021; Accepted: 27 March 2022;
Published: 03 May 2022.
Edited by:
Wil De Jong, Kyoto University, JapanReviewed by:
Matija Klopčič, University of Ljubljana, SloveniaRomà Ogaya, Ecological and Forestry Applications Research Center (CREAF), Spain
Copyright © 2022 Kish, James, Mariani, Schurman, Thomas, Young and Martin. This is an open-access article distributed under the terms of the Creative Commons Attribution License (CC BY). The use, distribution or reproduction in other forums is permitted, provided the original author(s) and the copyright owner(s) are credited and that the original publication in this journal is cited, in accordance with accepted academic practice. No use, distribution or reproduction is permitted which does not comply with these terms.
*Correspondence: Adam R. Martin, adam.martin@utoronto.ca