Soil moisture and micrometeorological differences across reference and thinned stands during extremes of precipitation, southern Cascade Range
 Kyle Hardage1†
  Shawn J. Wheelock1,2*
  Rowan Gaffney3† Theresa O’Halloran3† Benjamin Serpa3†
  Gordon Grant4
  Michelle Coppoletta5 Adam Csank6
  Christina Tague7 Matthew Staudacher8
  Scott Tyler3
- 1Lassen National Forest, U.S. Department of Agriculture Forest Service, Fall River Mills, CA, United States
- 2Department of Hydrology and Atmospheric Science, University of Arizona, Tucson, AZ, United States
- 3Department of Geological Sciences and Engineering, University of Nevada, Reno, NV, United States
- 4Pacific Northwest Research Station, U.S. Department of Agriculture Forest Service, Corvallis, OR, United States
- 5Sierra Cascade Province Ecology Program, U.S. Department of Agriculture Forest Service, Quincy, CA, United States
- 6Department of Geography, University of Nevada, Reno, NV, United States
- 7Bren School of Environmental Science and Management, University of California, Santa Barbara, Santa Barbara, CA, United States
- 8Idaho Panhandle National Forest, U.S. Department of Agriculture Forest Service, Coeur d’Alene, ID, United States
Modern forest management generally relies on thinning treatments to reduce fuels and mitigate the threat of catastrophic wildfire. They have also been proposed as a tool to augment downstream flows by reducing evapotranspiration. Warming climates are causing many forests to transition from snow-dominated to rain-dominated precipitation regimes—in which water stores are depleted earlier in the summer. However, there are relatively few studies of these systems that directly measure the hydrologic impacts of such treatments during and following snow-free winters. This work compares the below-canopy meteorological and subsurface hydrologic differences between two thinning prescriptions and an unaltered Control during periods of extreme drought and near-record precipitation (with little snow). The field site was within a coniferous forest in the rain-snow transition zone of the southern Cascades, near the Sierra Nevada Range of California. Both thinning-prescriptions had a modest and predictable impact on below-canopy meteorology, which included their causing lower nighttime minimum temperatures in the critical summer months and higher wind speeds. Relative to the Control, both treatments affected soil moisture storage by delaying its annual decline and increasing its minimum value by the end of the season. The onset of soil moisture depletion was strongly tied to the magnitude of winter precipitation. In dry years, it began much earlier within the dense Control stand than in the treated ones, and, without snow, soil moisture was not replenished in the late spring. During high precipitation years, the storage capacity was topped off for all three stands, which resulted in similar timing of moisture decline across them, later in the season. The two thinning prescriptions increased stores through the height of summer (in wet and drought years). Finally, the basal area increment (BAI) of the remaining trees rose in both, suggesting they used the excess moisture to support rapid growth.
Introduction
In the rapidly drying American West, private landowners and land management agencies alike are increasingly grappling with drought-stressed forests and struggling to mitigate the effects of widespread insect infestations, disease, rapid accumulation of dry fuels–and ultimately, catastrophic wildfire. Even as these scourges are ravaging forests, municipalities, agriculture, and other users are reaching ever farther in their quest for economically viable sources of water.
In this age of megafires, any practical discussion of forest management must also reckon with wildfire hazard considerations, evinced by the Dixie Fire of 2021 (389,837 hectares burned), the second largest fire in California State History, which is eclipsed only by the August Complex of 2020 (417,898 hectares). Current estimates suggest that, since 1984, climate change has nearly doubled the total acreage burned across the western U.S. (Abatzoglou and Williams, 2016). Many of these fires occur during periods of prolonged regional drought when trees are incredibly water stressed (Westerling et al., 2006; Dennison et al., 2014).
This sense of crisis has brought a renewed focus on forest health and wildfire risk mitigation strategies. Prominent among these is forest thinning, which removes small-diameter trees and mid-size canopy trees to reduce forest density and fuel loads, while also promoting the growth of larger trees that are more resistant to fire, insects, disease, and drought (Agee and Skinner, 2005). Thinning has been shown to:
1. Reduce fire severity and crown scorch in historically frequent-fire forest types (e.g., Pollet and Omi, 2002; Stephens et al., 2009; Prichard et al., 2010);
2. Improve overall forest resistance to mortality due to insects and disease (e.g., Collins et al., 2014; Hood et al., 2016);
3. Increase water availability for residual vegetation (e.g., Phillips et al., 2016; Tague and Moritz, 2019); and
4. Burgeon carbon sequestration (e.g., Hurteau and North, 2010), although this point has been challenged (Campbell et al., 2012).
Accounting for these and other benefits, broad-scale analyses have suggested that 9.7 million hectares of western forest lands could potentially benefit from thinning (Skog et al., 2006).
At the same time, water users, such as urban and agricultural interests, are feverishly seeking additional sources. One potential method for increasing the available supply is through thinning forests using treatments that have been designed specifically to reduce their water consumption and deliver the balance to downstream users. The idea has broad appeal: it would provide sorely needed funding for active forest management and fuel reduction in overstocked and diseased stands—thereby reducing fire risk—and provide water for ever-growing, thirsty cities.
The idea that streamflow could be enhanced through forest manipulations has a rich history in the western U.S. Early efforts (predominately in the Rocky Mountains) experimented with copious treatment strategies, ranging from thinning and the opening of small patches all the way up to commercial-scale clearcutting (e.g., Ponce and Meiman, 1983; Troendle, 1983; Troendle and King, 1987; Troendle et al., 2001). Results, however, were equivocal and differed widely depending on geography, vegetation type, local conditions, and climate (e.g., Harr, 1983).
Recent reviews have found that, particularly for forests in semi-arid and Mediterranean climates, compensating mechanisms (e.g., increased understory growth, surface evaporation, and transpiration in the remaining trees) can eliminate or substantially reduce any increases in streamflow or groundwater recharge associated with moderate forest density reduction (e.g., Tague et al., 2019). Moreover, any gains are often predicted to be short-lived as vegetation recovers (e.g., Keppeler and Ziemer, 1990; Tague et al., 2019) and to vary substantially with local climate, topography, and geology (Burke et al., 2021). Multi-year efforts that measure differences in fluxes during regrowth (following treatment) are particularly rare (Tague et al., 2019). These reviews highlight the need for additional studies to characterize hydrologic effects across a broad range of site conditions.
Previous work in the mountains of the western U.S. has shown that reducing the tree density alters both snow accumulation and melt (Lundquist et al., 2013; Dickerson-Lange et al., 2015; Currier and Lundquist, 2018; Boisramé et al., 2019). However, many of the forested elevations in the Cascade and Sierra Nevada Ranges are transitioning to warmer conditions and are becoming rain-dominated rather than seasonal snowpack systems (e.g., Harpold et al., 2014; Hatchett et al., 2017). Importantly, the impacts of various management practices on the hydrology of these forests has not been examined in detail.
An opportunity to investigate these questions arose in 2011, with the funding of the Burney–Hat Creek Basins Collaborative Forest Landscape Restoration (CFLR) Project (Basins Project; USDA Forest Service, Lassen National Forest, 2011). In accordance with the CFLR monitoring mandate (Omnibus Public Land Management Act of 2009, 2009), Lassen National Forest and its partners in the Burney–Hat Creek Community Forest and Watershed Group resolved to explore the feasibility of this approach—thinning to augment streamflow—for the mixed-conifer forests of the southern Cascades. However, a more fundamental question needed to be answered first: Which forest management tools retain water most effectively in such landscapes (e.g., Grant et al., 2013)? The more basic nature of this inquiry also allows insights gleaned from this work to help address urgent questions of forest health, wildfire risk, downstream water supply, and the vigor of entire ecosystems.
This project involved instrumenting coniferous stands that had recently been treated with partial-thinning and near-complete-removal silvicultural prescriptions. Since this was a monitoring study, spatial resolution was deliberately exchanged for longevity (with only limited spatial sampling). This design decision proved to be fortuitous since it allowed data to be collected throughout the warm temperature 2012 to 2015 drought—which had dramatic and deleterious impacts on much of California, the near-record precipitation and flooding of 2017, and their aftermath in 2018 and 2019.
During the study period, the site’s precipitation regime also changed from snow-dominated to rain-dominated (with only occasional snow and no spring snowpack). One benefit of this snow drought (e.g., Harpold et al., 2017) was that the effects of forest management on snow processes were essentially eliminated, making these stands representative of many warming western forests that are experiencing similar shifts (Siirila-Woodburn et al., 2021).
One of the initial steps was to create a conceptual model at the stand scale of how removing live trees would affect the fundamental fluxes of water and energy for both prescriptions (Figure 1).
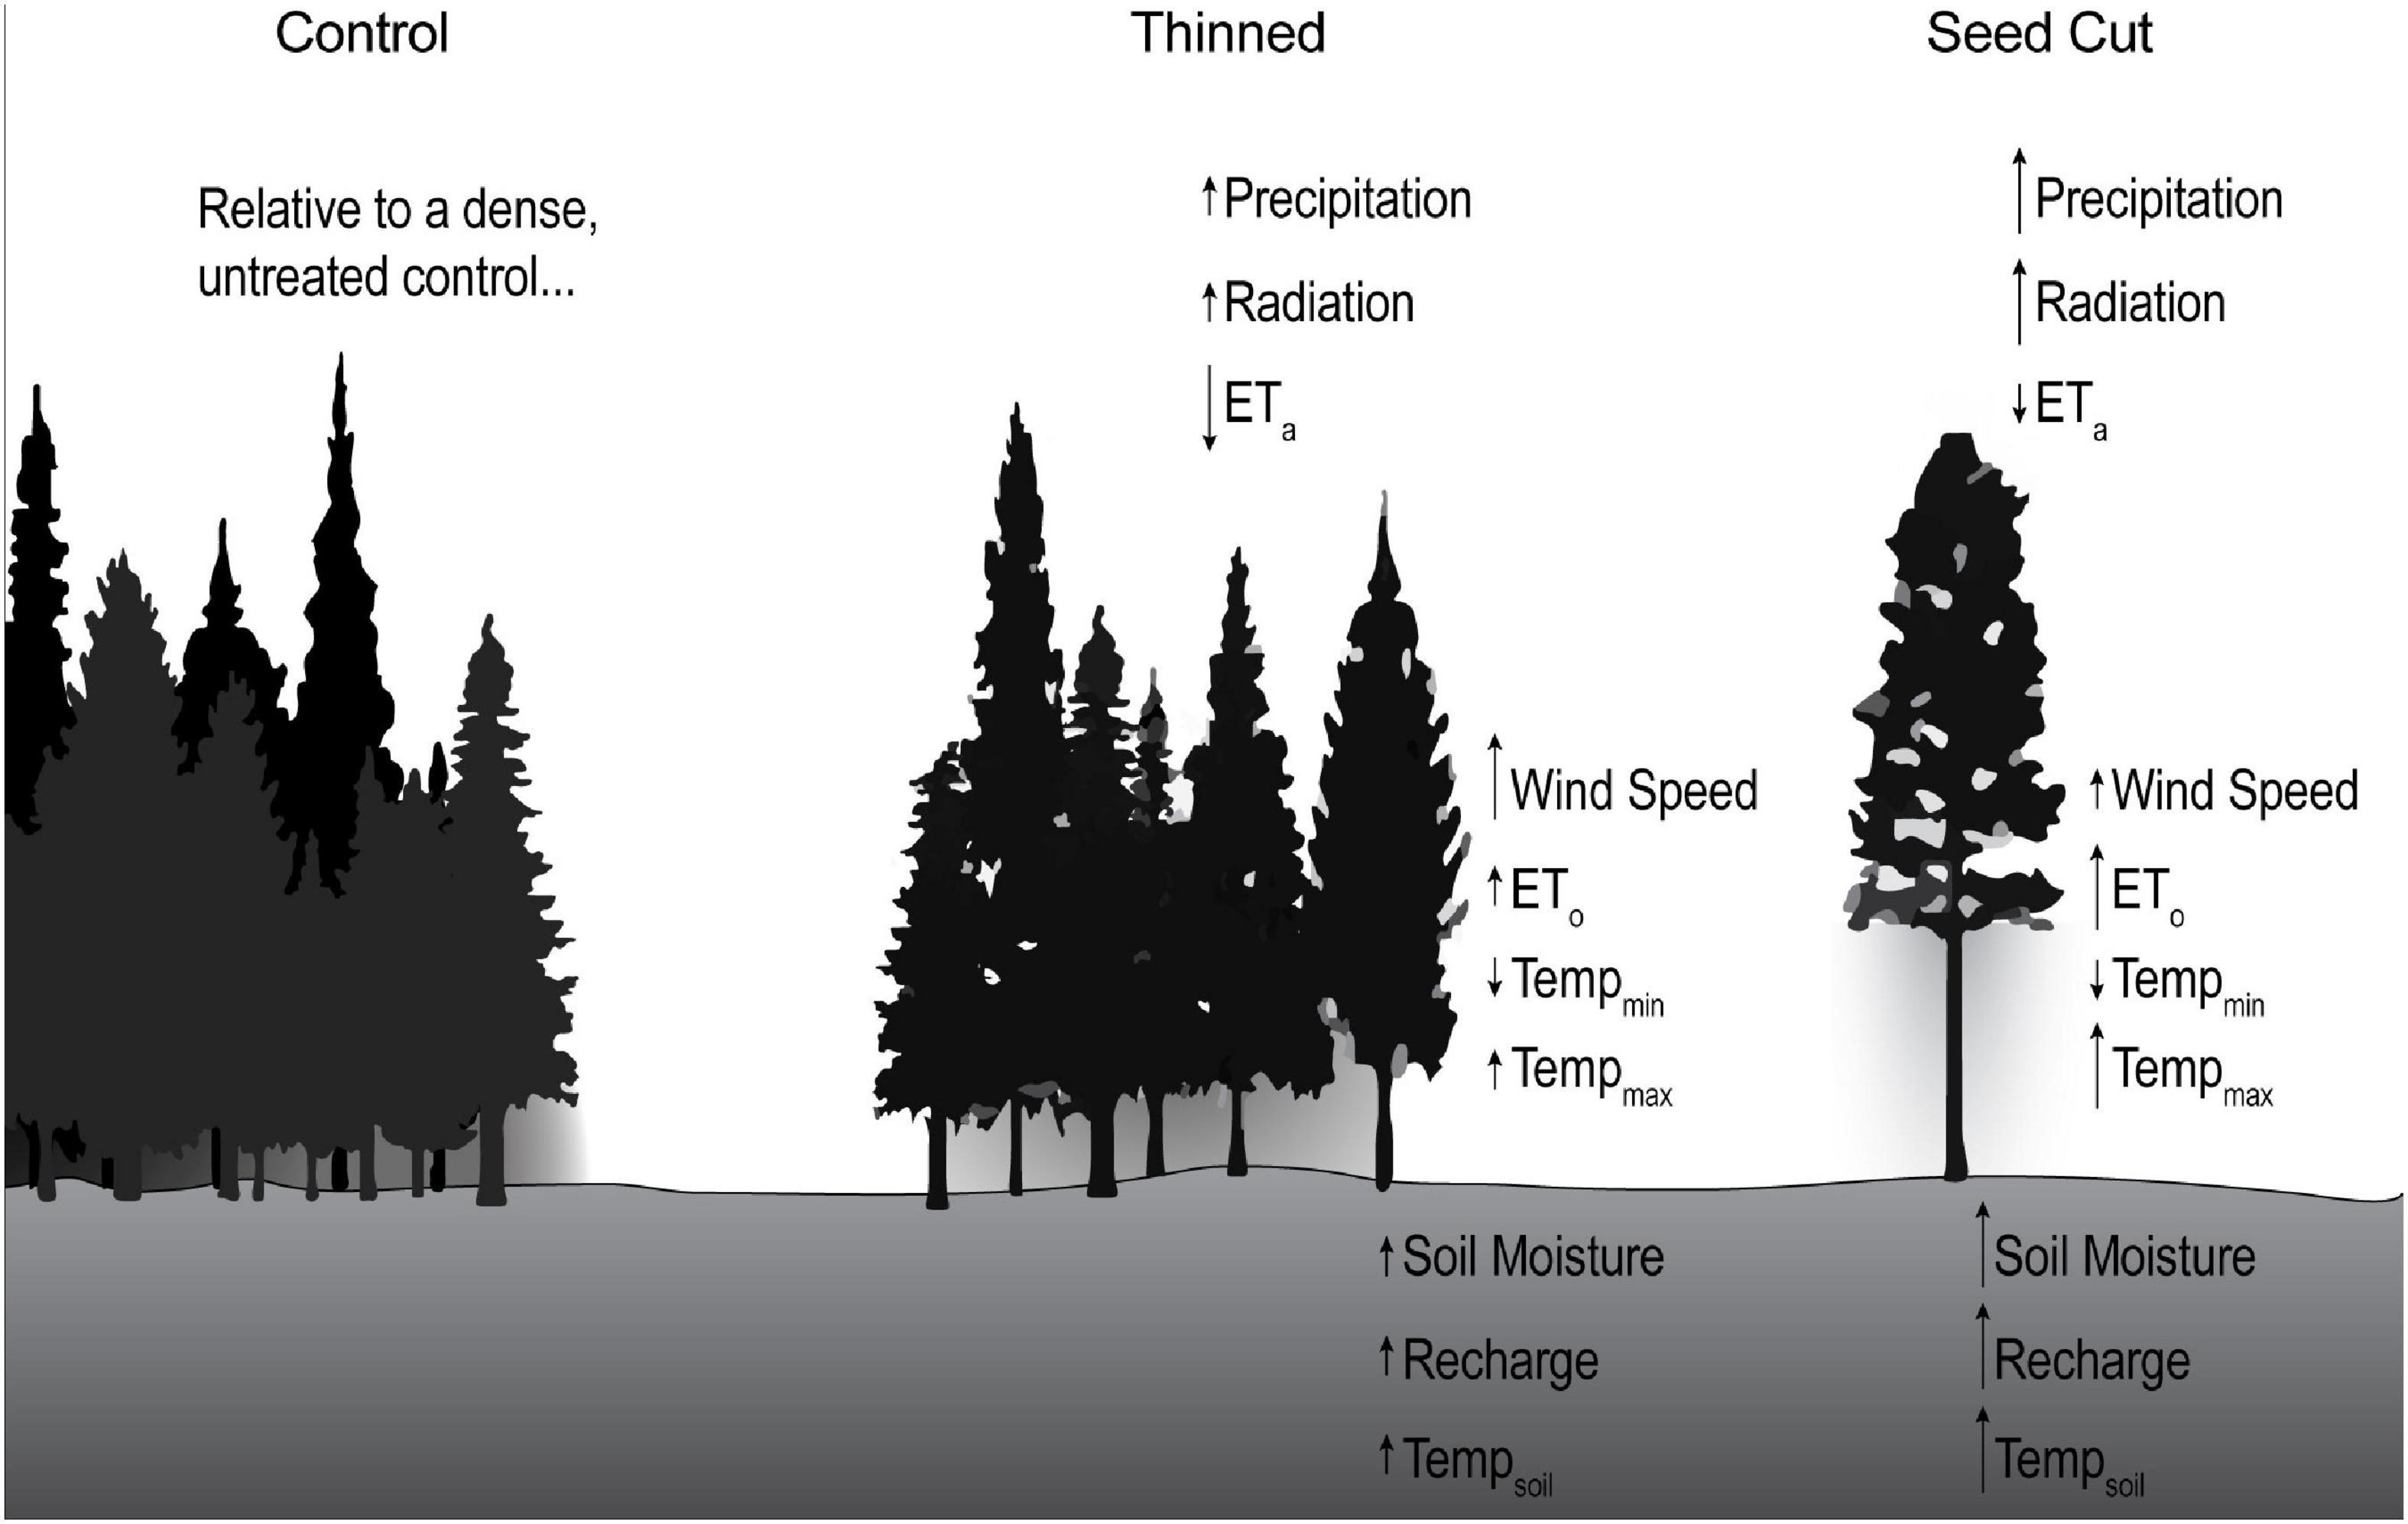
Figure 1. Conceptual diagram of the relative change in water balance components in treated stands compared to a dense, untreated forest. The untreated forest serves as the Control, and the treated stands include a modestly and uniformly thinned forest (Thinned) and nearly-cleared forest patch with sparse seed trees (Seed Cut). Arrows indicate change in direction and magnitude of parameters relative to the Control, as observed in this study, except for actual evapotranspiration (ETa), precipitation, and recharge which were not measured and are based on expected behavior. As thinning intensifies, ETa is expected to decrease (fewer trees transpiring) and recharge is expected to increase (more precipitation reaching the forest floor). In contrast, reference evapotranspiration (ETo) at 2 m above the forest floor may increase due to increased shortwave radiation and wind reaching the ground. Treatments also affect minimum (Tempmin) and maximum (Tempmax) air temperature, and the greatest change was observed in minimum temperatures at nighttime. Soil temperature similarly increased (Tempsoil) in the Thinned and Seed Cut treatments where fewer trees shaded the ground.
Compared to denser, untreated stands (unmanaged or due to be thinned), it was expected that:
∘ Thinned stands would have:
1. Less leaf interception, thus more precipitation that reaches the forest floor;
2. Less canopy transpiration;
3. Potentially higher soil and litter evaporation due to increased solar radiation and higher wind velocities; and
4. Cooler nighttime minimum temperatures.
∘ Nearly cleared stands would have:
1. The greatest forest floor precipitation and recharge inputs;
2. Higher levels of potential evapotranspiration at the forest floor, even as understory vegetation becomes established;
3. Increased end-of-season soil moisture storage; and
4. The highest wind velocities and coolest nighttime minimum temperatures.
In general, the highest soil moisture levels were anticipated to be in the nearly cleared areas because there are few large trees that are able to tap water deep below the surface (even though soil evaporation and herbaceous plant transpiration may be the greatest here as well). However, in terms of wildfire hazard reduction, a potential negative consequence of nearly cleared patches is that they also cause shallow soils and forest litter to dry more rapidly. While deeper soil moisture may be preserved well into the fire season, the enhanced desiccation of the litter layer increases the probability of spotting firebrands causing an ignition—which is a primary method of spread. The net effect of these treatments on soil moisture will, therefore, reflect a complex interplay among many different factors, some of which operate in opposing directions, and vary with season and antecedent conditions.
While this conceptual framework provides first-order hypotheses about the expected relative magnitude and direction of changes, there are substantial uncertainties. As noted above, previous field and model-based studies have shown considerable cross-site variation in the amount of additional water that was returned to the atmosphere via surface evaporation and the transpiration of the remaining trees and understory.
Site description and methodology
A small, relatively homogeneous forest stand (in both species composition and physiography) was instrumented after the recent implementation of two common forest management strategies: selective thinning and near-complete tree removal in mid-size (< 1 ha) openings. The two silvicultural prescriptions used at the site were:
∘ Thinning: Designed to create a forest structure that is similar to the observed historical pattern of species and density. It involves removing smaller trees around large diameter overstory ones and preserving ∼15% of the area in an unharvested state (e.g., retention islands).
∘ Seed Cut: Intended to promote ponderosa pines that which are shade intolerant. Within 1–2-hectare-size patches, all trees—excepting 4–8 ponderosa pines per hectare that are greater than 0.75-meter diameter at breast height (DBH)— are removed. Those that are left uncut provide seed for forest regeneration, and the openings can also be planted with new seedlings of the desired species composition. Importantly, Seed Cuts are not readily comparable to expansive clear-cuts, which can generally be as large as 8 ha in California (California Department of Forestry and Fire Protection [CAL FIRE], 2022) and 48 ha in Oregon (Oregon Department of Forestry [ODF], 2021). Visually, they closely resemble a patch clearing with a few solitary trees.
A stand that had not been modified recently served as a control for reference (Figure 1). For simplicity, the terms Thinned, Seed Cut, and Control, respectively, are used for these three treatments. Over a period of approximately seven years (2013–2019), the following variables were monitored:
∘ Air Temperature;
∘ Relative Humidity;
∘ Shortwave Radiation;
∘ Snowfall;
∘ Soil Moisture and Soil Temperature;
∘ Understory Density; and
∘ Wind Speed and Direction
In addition, dendrochronological techniques were used to evaluate the differences in how sets of trees responded to treatment.
Geology and climate
The study area is within the Hat Creek Basin of Lassen National Forest (40.6o N, 121.5o W), in northeastern California. The physiography of the region has been shaped by recent volcanism and is located at the southern extent of the Cascade Volcanic Province. The stands that were monitored (elevation 1640 to 1660 m) are part of a mixed conifer forest, which is dominated by white fir (Abies concolor) and ponderosa pine (Pinus ponderosa). The average annual precipitation over the 56-year record is 1053 mm, as measured at a long-term weather station (Manzanita Lake) 7 km west of the project and ∼130 m higher in elevation. The precipitation regime is winter-dominated and, historically, moisture has primarily been received as snow. However, since monitoring began in 2013, the site has undergone a shift to being rain-dominated and snow cover has never been continuous through the cold months—consistent with other locales in the Cascades and Sierra Nevada at similar elevations (e.g., Hatchett et al., 2017). Since this change was not anticipated at the outset—and the remoteness of the location precluded the installation and maintenance of heated rain gauges—precipitation was not continuously measured. Therefore, the adjacent Manzanita Lake meteorological record was used as a substitute (Figure 2B).
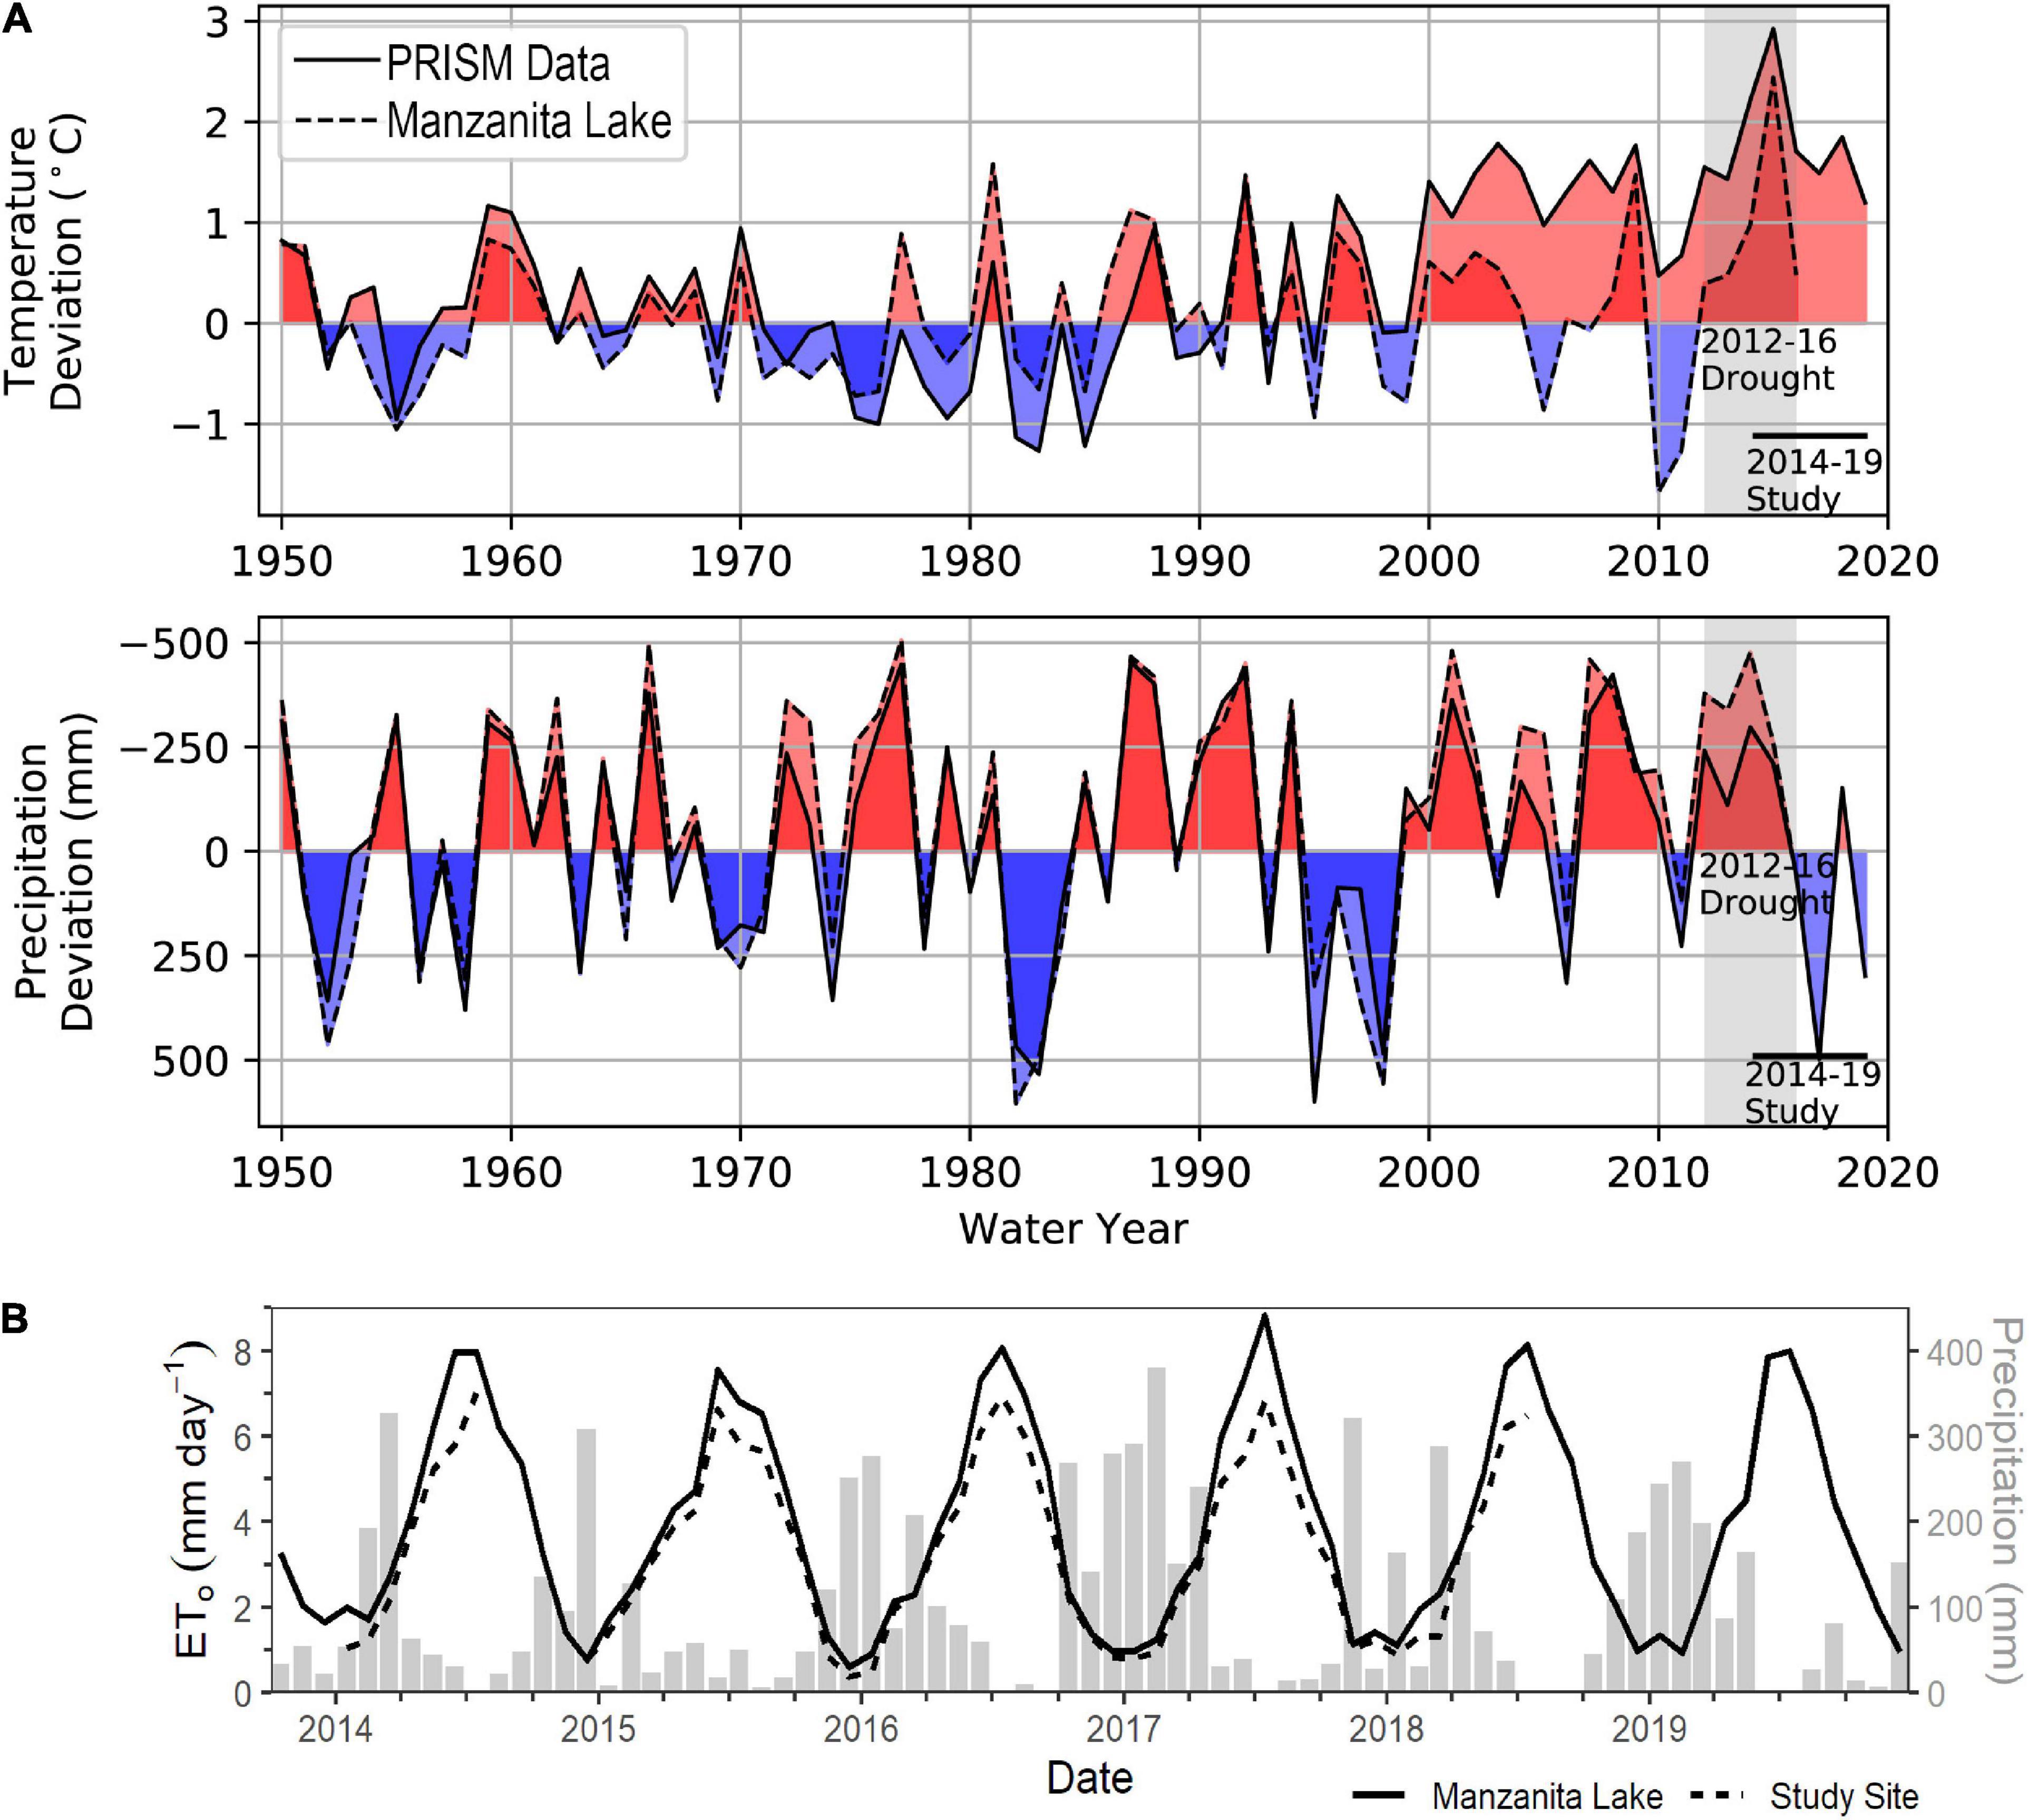
Figure 2. (A) Water year (October–September) deviation of air temperature and precipitation from the 1949–1999 long-term average. Manzanita Lake data were from (station ID: USC00045311, located approximately 7 km west of the study site (40o 32′, 122o 34′). The PRISM data were derived from the monthly, 4 km spatial resolution data product AN81m. (B) Monthly potential evapotranspiration for Manzanita Lake and the study site (lines), plotted with monthly precipitation (bars) at Manzanita Lake for the study period (2014–2019). Note the different legend symbols between (A,B).
In addition, the study period was coincident with both significantly below-average and significantly above-average precipitation years. This stretch of drought (2012–2015) and recovery (2017) impacted all of California and the western U.S., but was not as profound at this northern latitude as it was in the southern and central portions of the state. Throughout the Sierra Nevada, its severity was exacerbated by significant increases in maximum daily temperatures (AghaKouchak et al., 2014). Figure 2A displays the annual (by Water Year [WY]—October to September) precipitation and temperature deviation recorded at the Manzanita Lake station. Due to there being missing observations in those data (starting in 2008), gridded values generated by the Parameter-elevation Regressions on Independent Slopes Model (PRISM) (PRISM Climate Group, 2019) are also displayed as a secondary source. Both datasets in Figure 2 document that there was/were: (1) generally warm conditions after the year 2000, (2) four consecutive years of well-below-average precipitation and historically anomalous, warm temperatures in the region at the beginning of site monitoring in 2013, (3) an unusually wet winter in 2017, and (4) average precipitation in 2018 and 2019. Of additional interest is that temperatures remained elevated after the drought ended.
The region is underlain by young (< 3.5 Ma age) volcanic rocks, which are primarily highly fractured andesite, with adjacent areas of basalts, dacites, and rhyolites (Clynne and Muffler, 2010). The Basaltic Andesite of Red Mountain, a fractured lava, underlies the entire study area (Clynne and Muffler, 2010). The soils were classified as the Yallani family (USDA Forest Service Pacific Southwest Region, 1994), with the following horizons and average depths:
| ∘ | [0–20 cm] | A | Brown to Dark Brown | Gravelly Fine Sandy Loam | |
| ∘ | [20–60 cm] | Bw | Brown to Dark Brown | Gravelly Fine Sandy Loam | |
| ∘ | [60–100 cm] | BC | Dark Yellowish-brown | Very Gravelly Fine Sandy Loam | |
| ∘ | [100–150 cm] | C | Dark Yellowish-brown | Gravelly Sandy Loam |
Soil depths range from zero at small outcrops to greater than a meter. They are extremely well drained, which accounts for the limited overland flow and paucity of drainage channels. The primary outflow of the catchment is through groundwater-supported springs, located ∼10 km east of the project area (Serpa, 2020). They discharge ∼3 m3 s–1 and, during dry periods, often provide the majority of the flow in Hat Creek. However, the spatial extent of catchments within the Lassen Volcanic Center is difficult to estimate due to the complex geology and potential for subsurface flow across topographic divides (Rose and Davisson, 1996; Rose et al., 1996).
Forest structure
One of the overall land-management goals of Lassen National Forest is to restore stands, as closely as practicable, to their historical conditions. These include their having variable overstory canopy cover, lower densities of trees, and a dominance of fire-resistant tree species (USDA Forest Service, Pacific Southwest Region, 2004). At this specific location, the Forest was seeking to boost both the overall population and relative abundance of ponderosa pine (USDA Forest Service, Lassen National Forest, 2008). Thinning was done in the summer of 2011 as part of the Panner Timber Sale, under the North 49 Environmental Impact Statement (EIS) (USDA Forest Service, Lassen National Forest, 2008). These stands are shown both before (2010; Figure 3A) and after (2012; Figure 3B) harvest. The distribution of the Seed Cut, Thinned, and Control areas is readily visible (Figure 3B). Figure 3C presents the underlying topography.
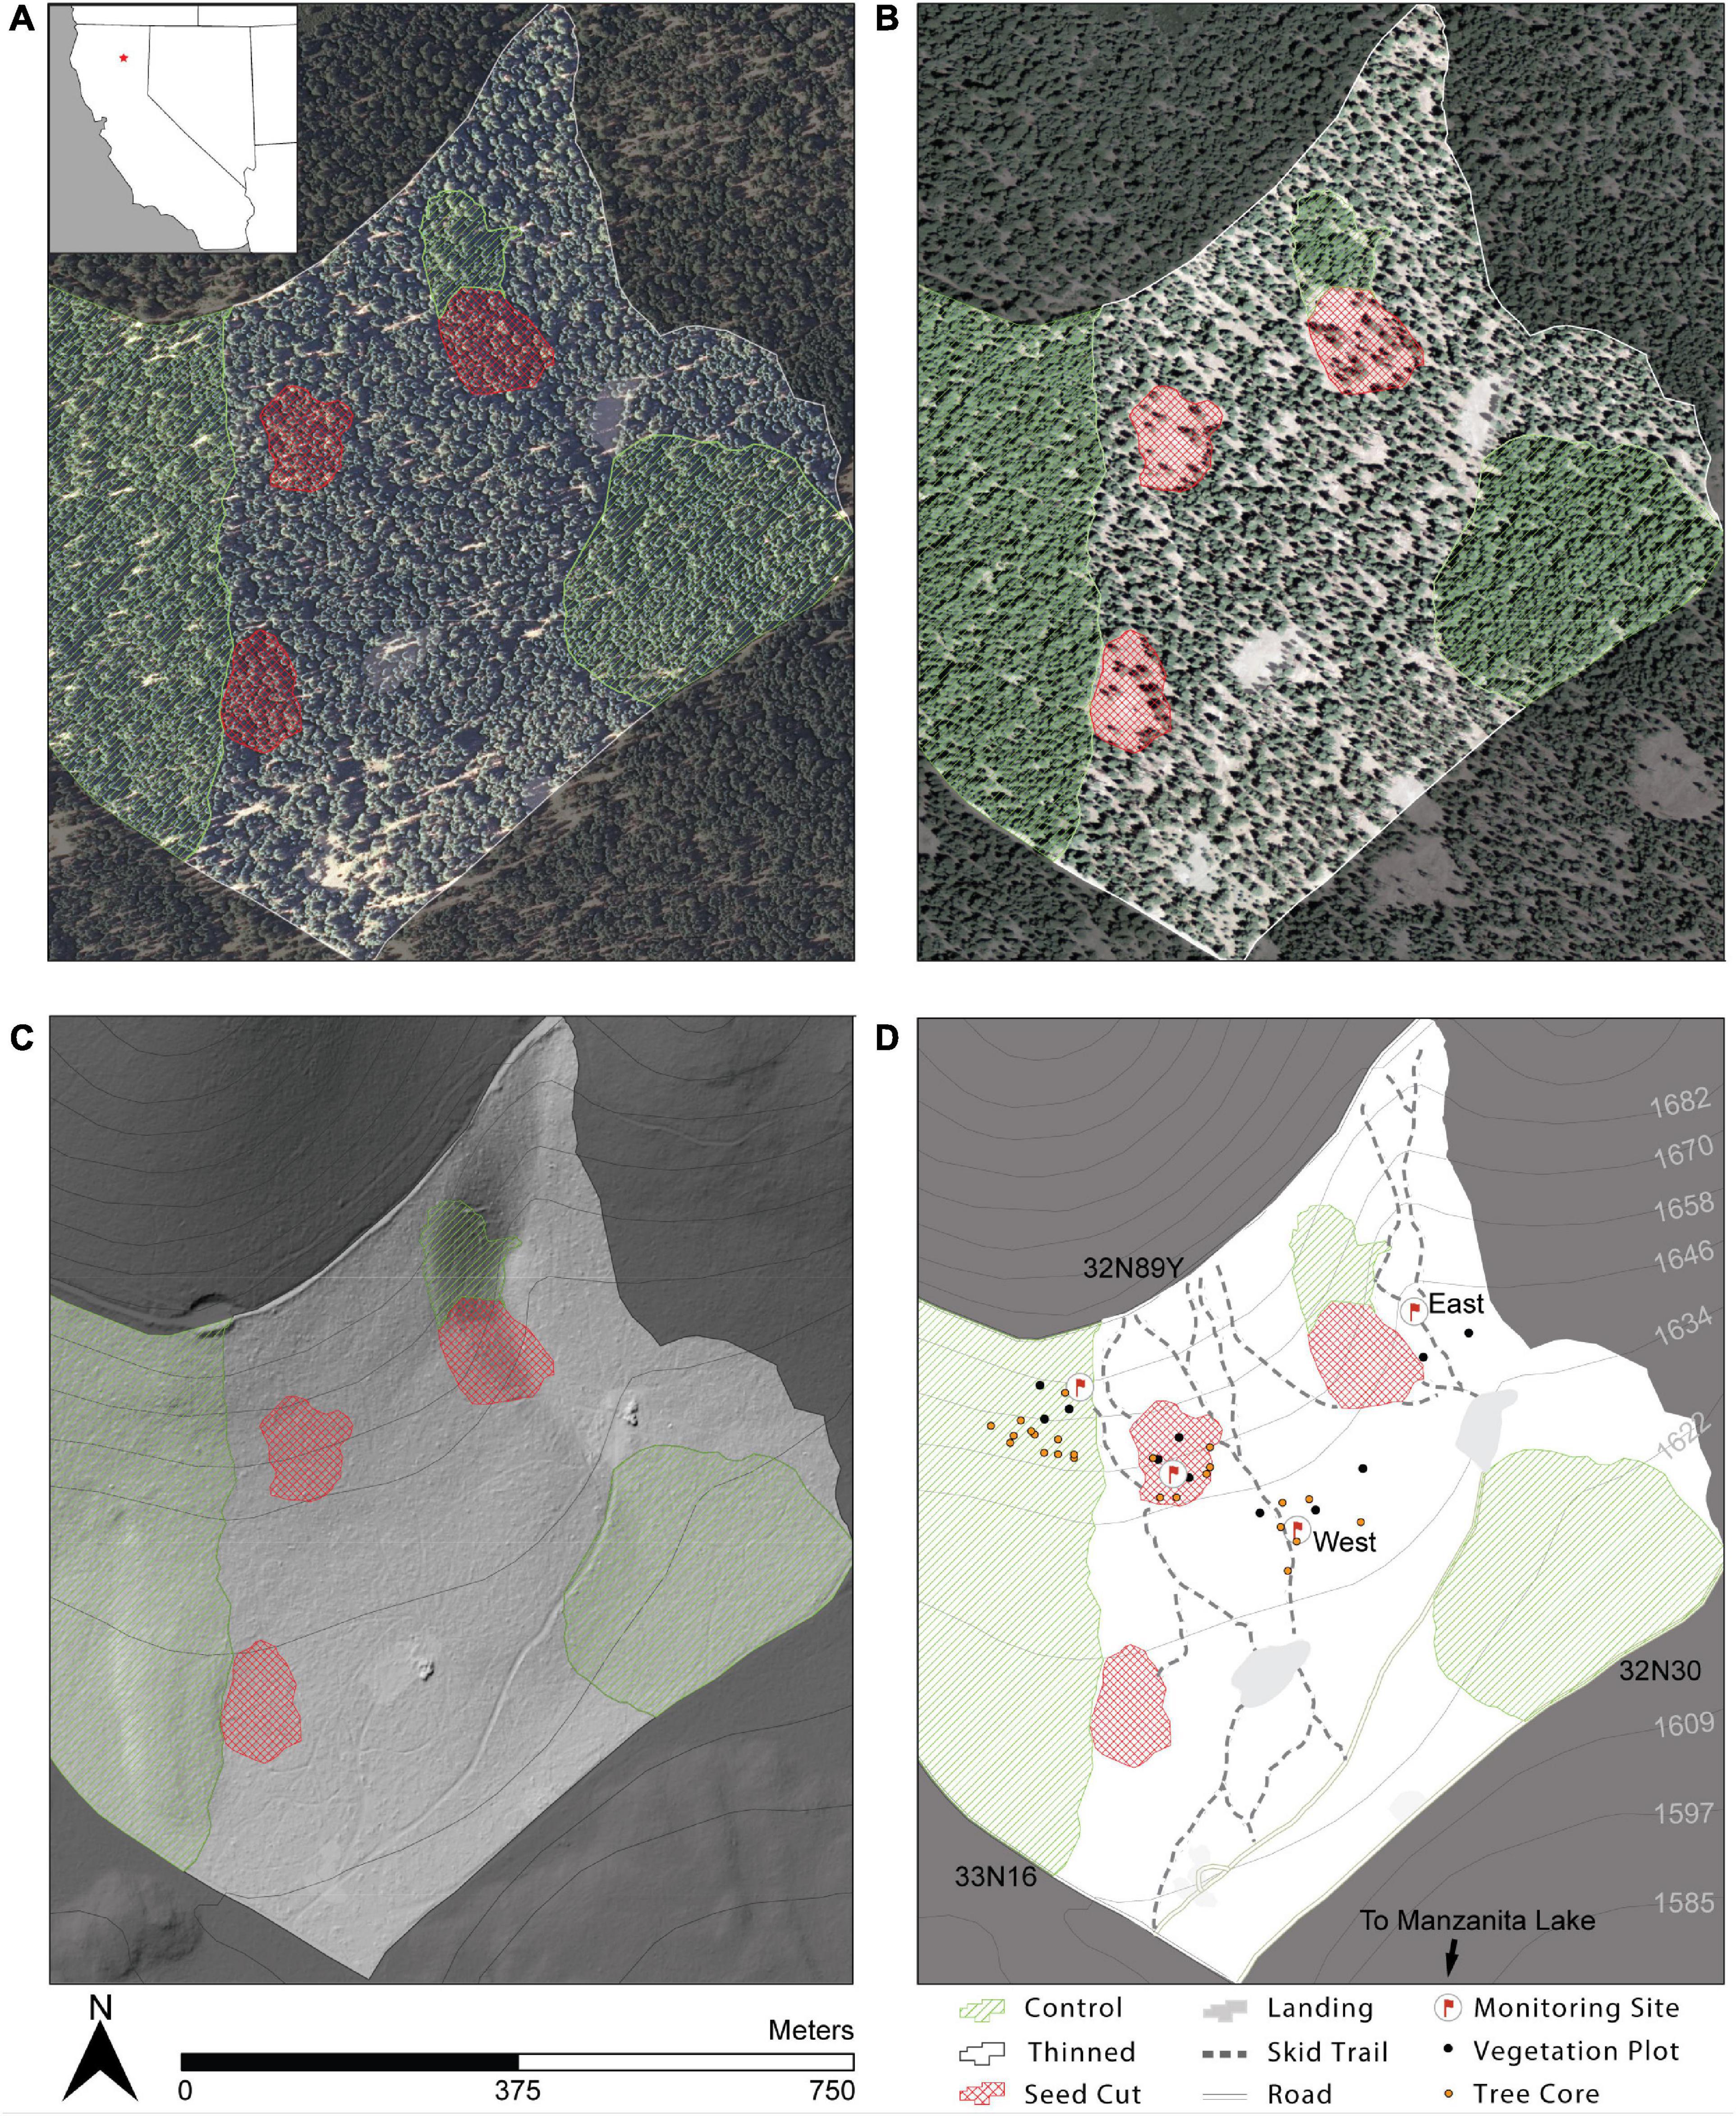
Figure 3. Unit 321 of the Panner Timber Sale (40.6° N, 121.5° W), both (A) before (Aug 4, 2010) and (B) after (July 3, 2012) the 2011 timber harvest [National Agricultural Imagery Program (NAIP), Manzanita Lake NE Digital Orthophoto Quarter Quadrangle (DOQQ), published by USDA Farm Service Agency Aerial Photography Field Office, Salt Lake City UT]. (C) One-meter LiDAR bare Earth DEM hillshade showing site topography (Burney–Hat Creek Basins CFLR Project Data, Lassen National Forest; acquired 2015). (D) Locations of stand treatments, forest infrastructure, study instrumentation, and vegetation plot sites. West and East locations of the Thinned monitoring sites are labeled (all discussion in the text refers to the West site unless Thinned-East is specified). Contour interval is 12.19 meters, and displayed elevations are rounded to the nearest meter. Public Land Survey System (PLSS): T: 32 N, R: 4 E, S: 20 and 29, Mount Diablo Meridian. Hat Creek Ranger District, Lassen National Forest; Shasta County, California, United States.
Following treatment, four meteorological and soil moisture monitoring sites were established: two in the Thinned (Thinned-West and Thinned-East) and one each in the Seed Cut and the unaltered Control (Figure 3D). Unless otherwise stated, Thinned refers to the Thinned-West site, where most of the data were collected and whose slope and aspect are nearly identical to the others. Each monitoring site was as centrally located within its associated treatment stand as was feasible.
To quantify differences in forest structure, 12 forest plots were established across the three stands (Figure 3D). Vegetation data were collected in 2014 (three years after treatment) using the U.S. Forest Service Common Stand Exam Protocol (USDA Forest Service, 2014), which included measurements of tree size and density, composition, overstory canopy, understory plant cover, and ground cover. Comparisons of forest variables among treatments were made with a one-way analysis of variance (ANOVA) and differences between treatments were tested using a post hoc Tukey’s test. Variables were square root transformed to meet ANOVA assumptions of normality and homoscedasticity. All analyses of forest stand conditions were conducted in JMP®, Version 11.2 (SAS Institute Inc., Cary, NC).
Below-canopy meteorology
At each monitoring site (Seed Cut: n = 1; Thinned: n = 2; Control: n = 1), climate and soil moisture were continuously collected using a wireless, self-organizing nodal network. Each node consisted of a wireless meteorological station (eKo PRO Series ES2000 Memsic, Inc.; Andover, MA) that recorded wind speed (0.5–89 ± 0.1 m s–1) and direction (0–359 ± 1°), relative humidity (0–100 ± 1%), barometric pressure (880–1080 ± 0.1 mbar), incoming solar radiation (0–1800 ± 1 W m–2), and air temperature (−40–60 ± 0.5oC), as well as soil moisture loggers at four depths (see the Soil Moisture section). Values in parenthesis refer to range and resolution, respectively.
Data points outside of the range of each sensor were removed, and in the case of wind speed, values below the minimum resolution (0.5 m s–1) were set to 0.0 m s–1. All meteorological instrumentation was located two meters above the forest floor, and therefore took below-canopy measurements. The 15-min data were averaged to daily (24-h) timesteps, with the exception of solar radiation, which was expressed as a daily cumulative sum in megajoules.
Vapor pressure deficit (VPD) was determined using the daily average of temperature and relative humidity. Daily reference evapotranspiration (ETo) was calculated per treatment using the Penman-Monteith equation with daily VPD, temperature, and wind speed (as recorded at each station). However, since the canopy-top shortwave radiation value for all three was best represented by that of the Seed Cut, it was used exclusively. Mean monthly ETo was computed by taking the mean of daily ETo (Allen et al., 1998). Small tipping bucket rain gauges were deployed at each monitoring site but quickly filled with debris, which precluded consistent acquisition of data. A qualitative assessment of snowpack was made at each one by using a time lapse cameras that were aimed at graduated snow stakes (in tenths of a foot). A photo was taken every 4 h, and snow depth was taken to be the distance from the top of the pack to the nearest hatch mark (and converted in to centimeters).
Soil moisture
Adjacent to each meteorological station, in a single augured hole, soil moisture content sensors (eS1110 Decagon EC-5, Campbell Scientific, Logan, UT) were installed horizontally, with one at each depth of 15, 30, 50, and 100 cm. Their stated accuracy was 2%, with a resolution of 0.25% volumetric water content (Decagon Devices, Inc.). Each sensor was surrounded by a small (∼2 cm deep) layer of sieved (< 2 mm) soil from the same depth.
The soil texture at each sensor depth (in all boreholes) was estimated by using laser particle size analysis for the size fraction below 2 mm (Gaffney, 2016). Above 15 cm, soils were loam with pine needle duff. Below that point, they were all similar and ranged from loam (n = 3) to silt loam (n = 1). This is likely because: (1) the primary soil-forming process was in situ weathering of the same parent material (Red Mountain Andesitic Basalt) and (2) the stands had similar slopes and aspect. Bedrock was not encountered in any of the soil borings.
High frequency excursions that greatly exceeded the soil porosity (values > 50% volumetric water content) were rejected as being outliers. A weighted average by depth from the 30, 50, and 100 cm data was calculated to serve as an integrated soil moisture storage metric (referred to by that name). In late 2018 and 2019, the 100 cm sensor in the Control was not functional. Its value was, therefore, approximated by using linear least squares regression between the 50 and 100 cm depths (R2 = 0.99) on the data that were available from it. The lag in the soil moisture recession between each monitoring site was determined by taking the difference between the dates when each one reached the same value, rounded to the nearest 0.5 cm (e.g., 27, 26.5, 26, etc.).
All analyses of micrometeorological and soil moisture data were conducted in R Software v.4.0.3 (R Core Team, 2020) using the Tidyverse Package v.1.3.0 (Wickham et al., 2019). A non-parametric Kruskal-Wallis rank sum test with a pairwise-Wilcoxon post hoc test with Holm correction was used.
Tree basal area increment
In September 2019, 24 ponderosa pines were sampled from each stand (Seed Cut: n = 6; Thinned: n = 6; Control: n = 12; Figure 3D). They were selected based on their proximity to monitoring sites, DBH (> 64 cm), and health. Two opposing cores were collected from each one, 1.3 m above the ground. These were extracted by using a 5 mm (n = 30) and a 12 mm (n = 18) increment borer. Specimens were mounted, sanded until the cellular structure was visible through a binocular microscope, and then scanned at 2,400 dpi with an Epson platform scanner. Ring widths were measured to the nearest 0.001 mm using CooRecorder v7.8 (Cybis Elektronik & Data AB, Saltsjöbaden, Sweden). All cores were crossdated by assigning calendar years to each ring and matching growth patterns visually using the list method (Yamaguchi, 1991). Their common interval was from 1891 to 2019. The mean correlation of individual series to the aggregate of all other series was 0.52 (Stokes and Smiley, 1968).
Basal area increment (BAI) was calculated from ring widths and tree diameter inside the bark, as implemented in the BAI.out() function of the dplR package (Bunn, 2008), and are reported for each treatment with the standard error.
Results
Forest structure
As expected, the three stands exhibited significant differences in forest structural attributes (Table 1). Tree density was significantly greater in the unaltered Control (p < 0.001), which had an average number of trees per hectare (mean = 1099 trees ha–1) that was more than seven times greater than that of the Thinned stand (mean = 144 trees ha–1). Differences in density between the three were predominantly due to the abundance of trees in the small (3–15 cm DBH) and intermediate (15–28 cm DBH) size classes within the Control. In the Seed Cut, the randomly placed forest plots did not include any trees at all. Post-treatment imagery, however, showed that the density was about 4–8 trees ha–1 (Figure 3B).
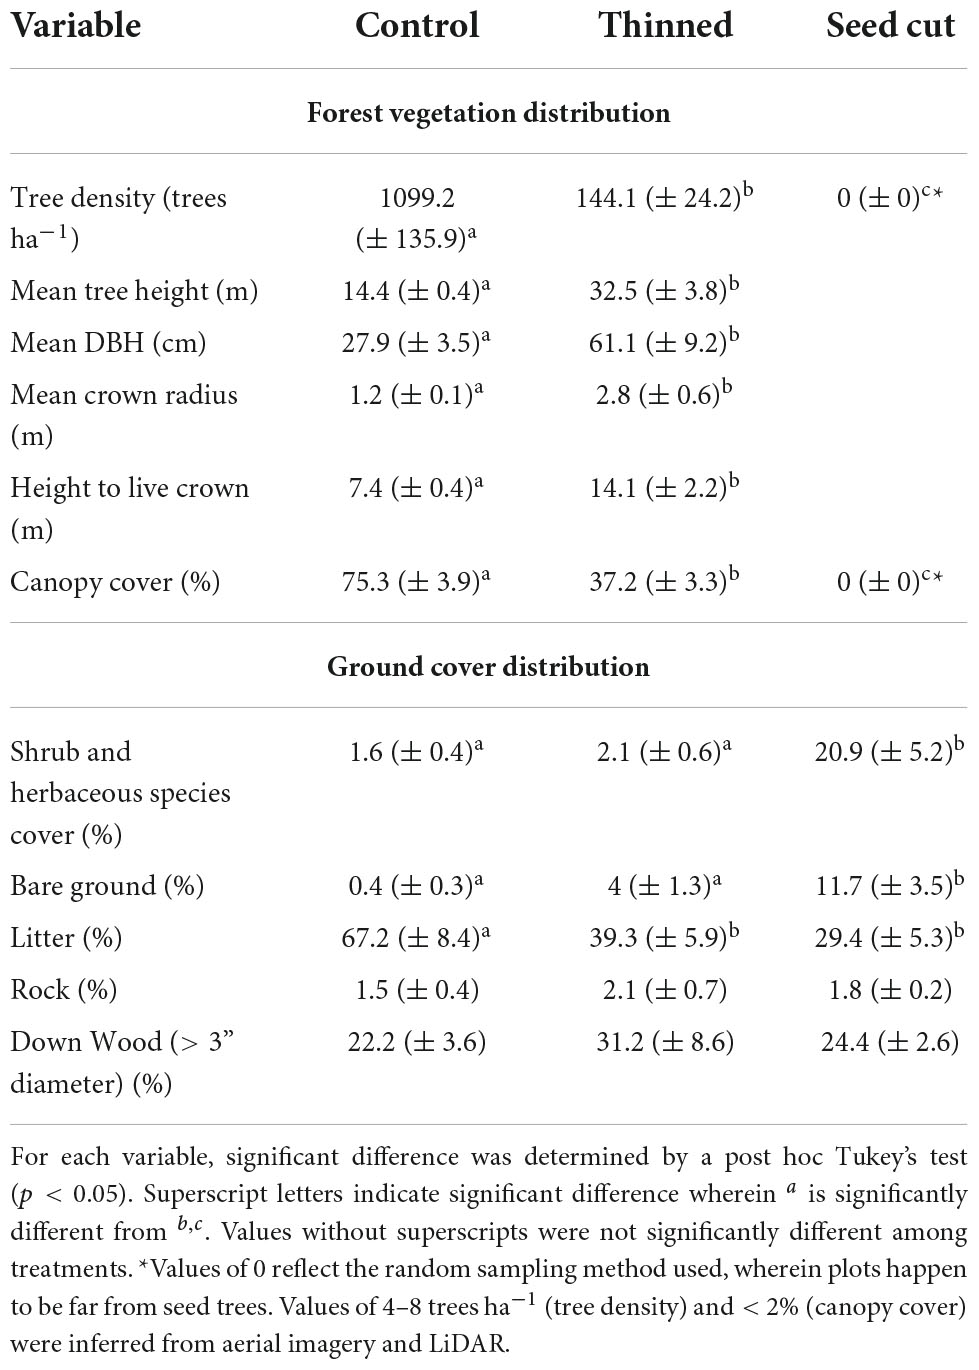
Table 1. Summary of forest structure metrics by stand.
The average canopy cover in the Control plots was more than twice that in the Thinned plots. Likewise, in the high-light environment of the Seed Cut, a significantly greater percentage of the plots were covered by herbaceous plants and shrubs (mean 20.9%) than those in the Thinned (2.1%) or Control (1.6%) stands (Table 1). They also had the highest percentage of exposed bare ground (11.7%), whereas the ones in the Control had the highest litter cover (67.0%). The dramatically lower canopy cover and density in the Thinned and Seed Cut strongly influenced their below-canopy climate and soil moisture. As with tree density, the random plots within the Seed Cut were such that they had 0% canopy cover. LiDAR-based data products yielded a canopy closure of <2%, which is consistent with a seed cut prescription.
Below-canopy meteorology
Monthly averages of all meteorological parameters were used for comparisons (Table 2). Since the monitoring sites are fairly close to each other and the spatial extent of the treatments is modest, conditions at each stand may not be mutually independent (particularly for wind speed and direction). However, since this was an actual unit of a USFS commercial timber sale, their size and other properties represent standard practice. Thus, the differences observed in this study are likely to occur at the field scale.
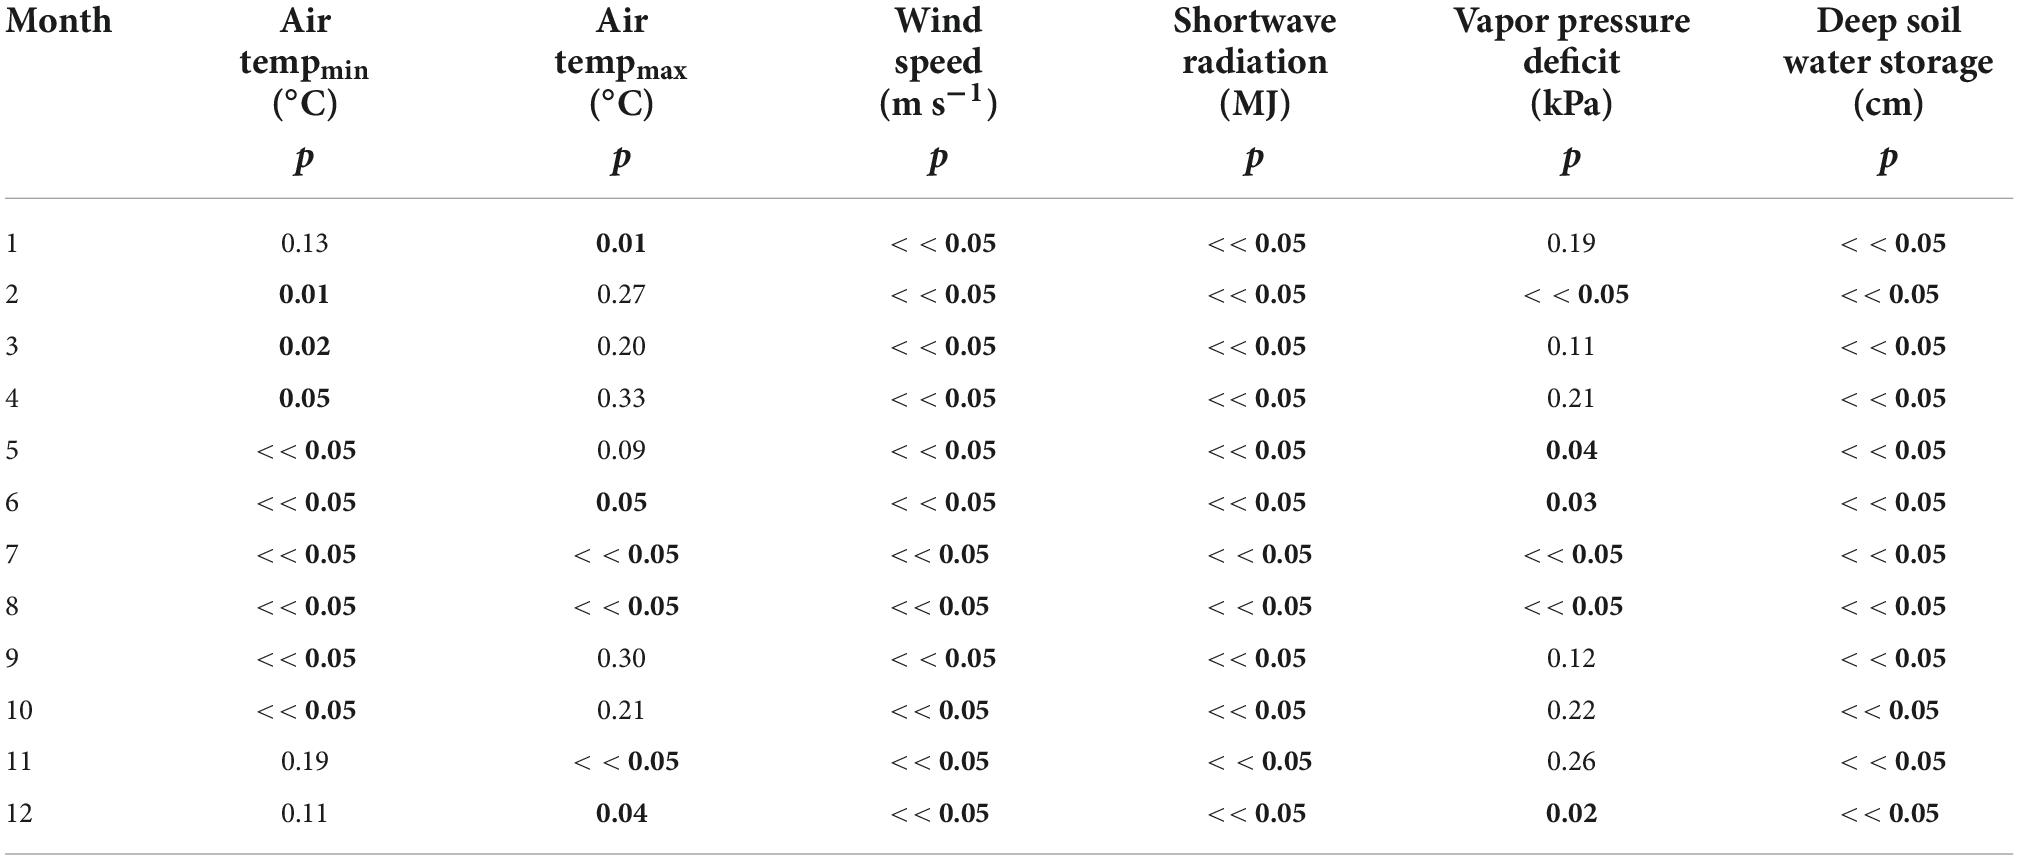
Table 2. Kruskal–Wallis p value among monitoring sites, significant at 0.05 (bold).
Monthly average temperature minimums (i.e., nighttime) were slightly below freezing in the winter (Figure 4A). They were also significantly warmer in the Control during most of the year (February–October) than they were in the Thinned and Seed Cut—which were not significantly different from one another (Figure 4A and Table 3). Differences between the Control and the treated sites were the greatest during the summer and fall, when minimum temperatures in the Control ranged from being 1.80°C higher in June to as much as 2.37°C higher in September (Figure 4A).
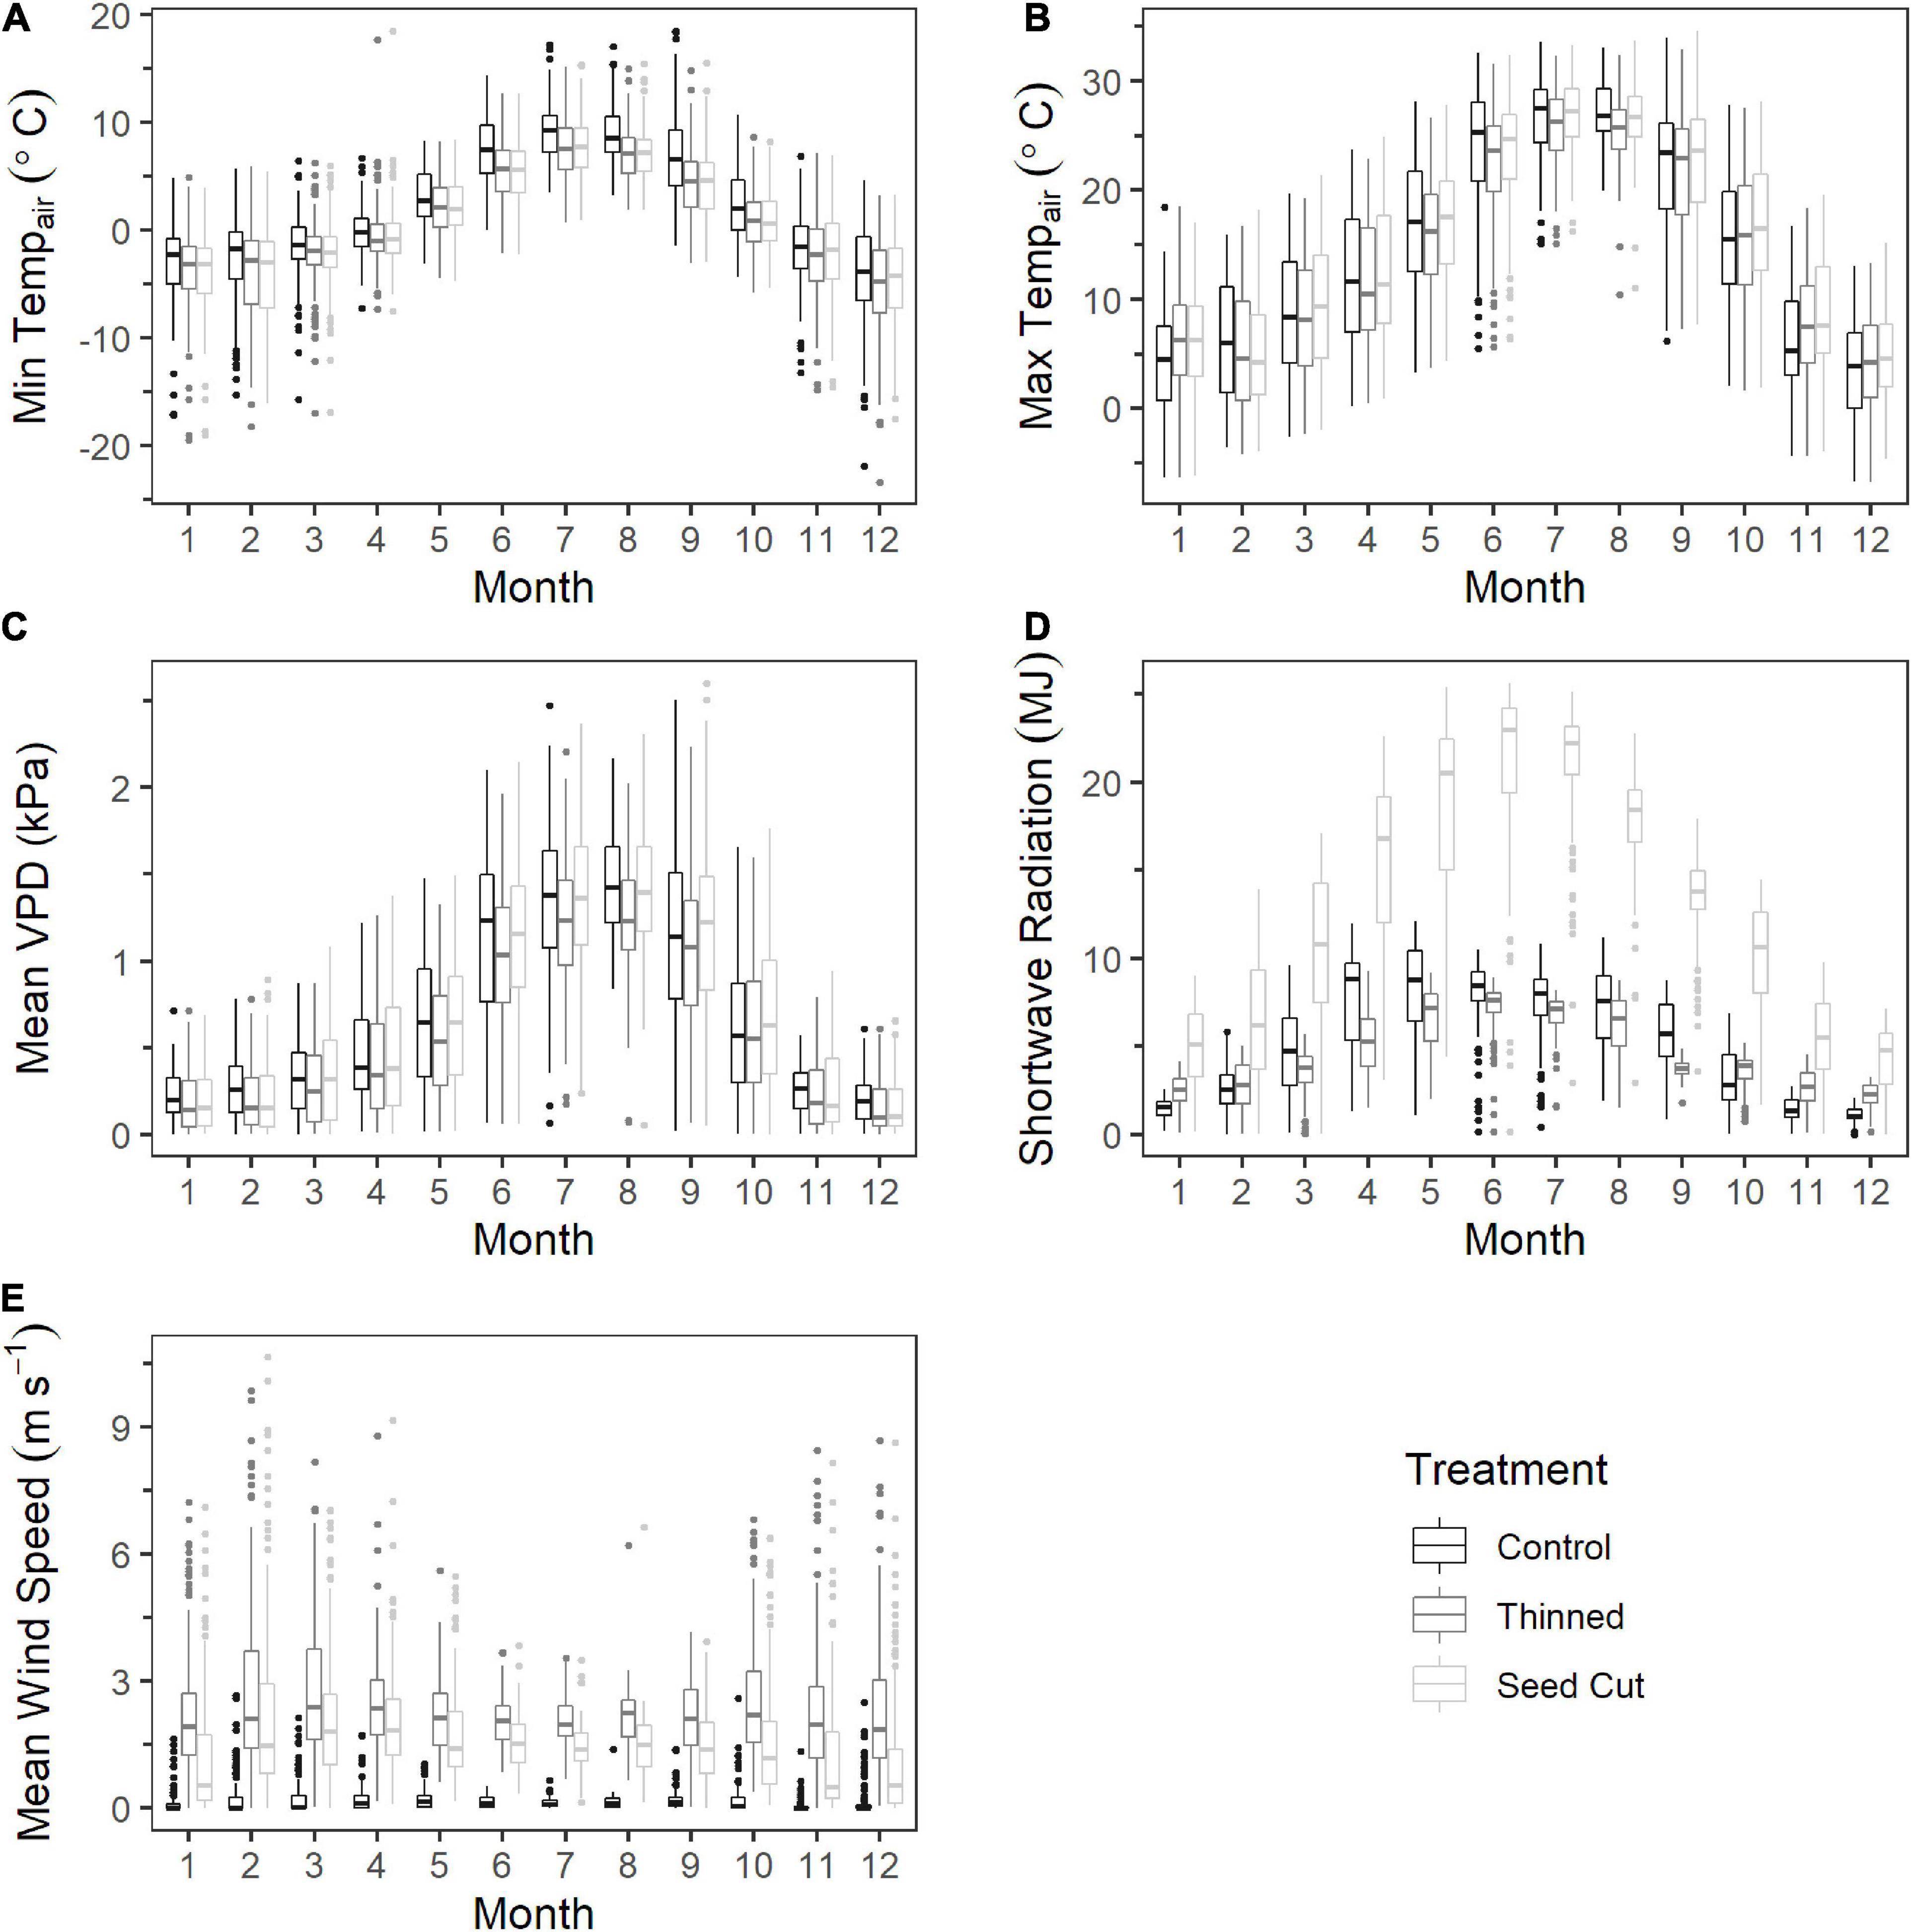
Figure 4. Meanmonthly micrometeorological data derived from daily (24-h) averages at the three monitoring sites. Note variation in y-axis scales. (A) Nighttime minimum air temperature. (B) Daytime maximum air temperature. (C) Mean vapor pressure deficit (VPD) calculated from paired temperature and relative humidity. (D) Cumulative flux of shortwave radiation. (E) Mean wind speed. Plotted points represent data 1.5 times the interquartile range. Median values are given in Table 3.
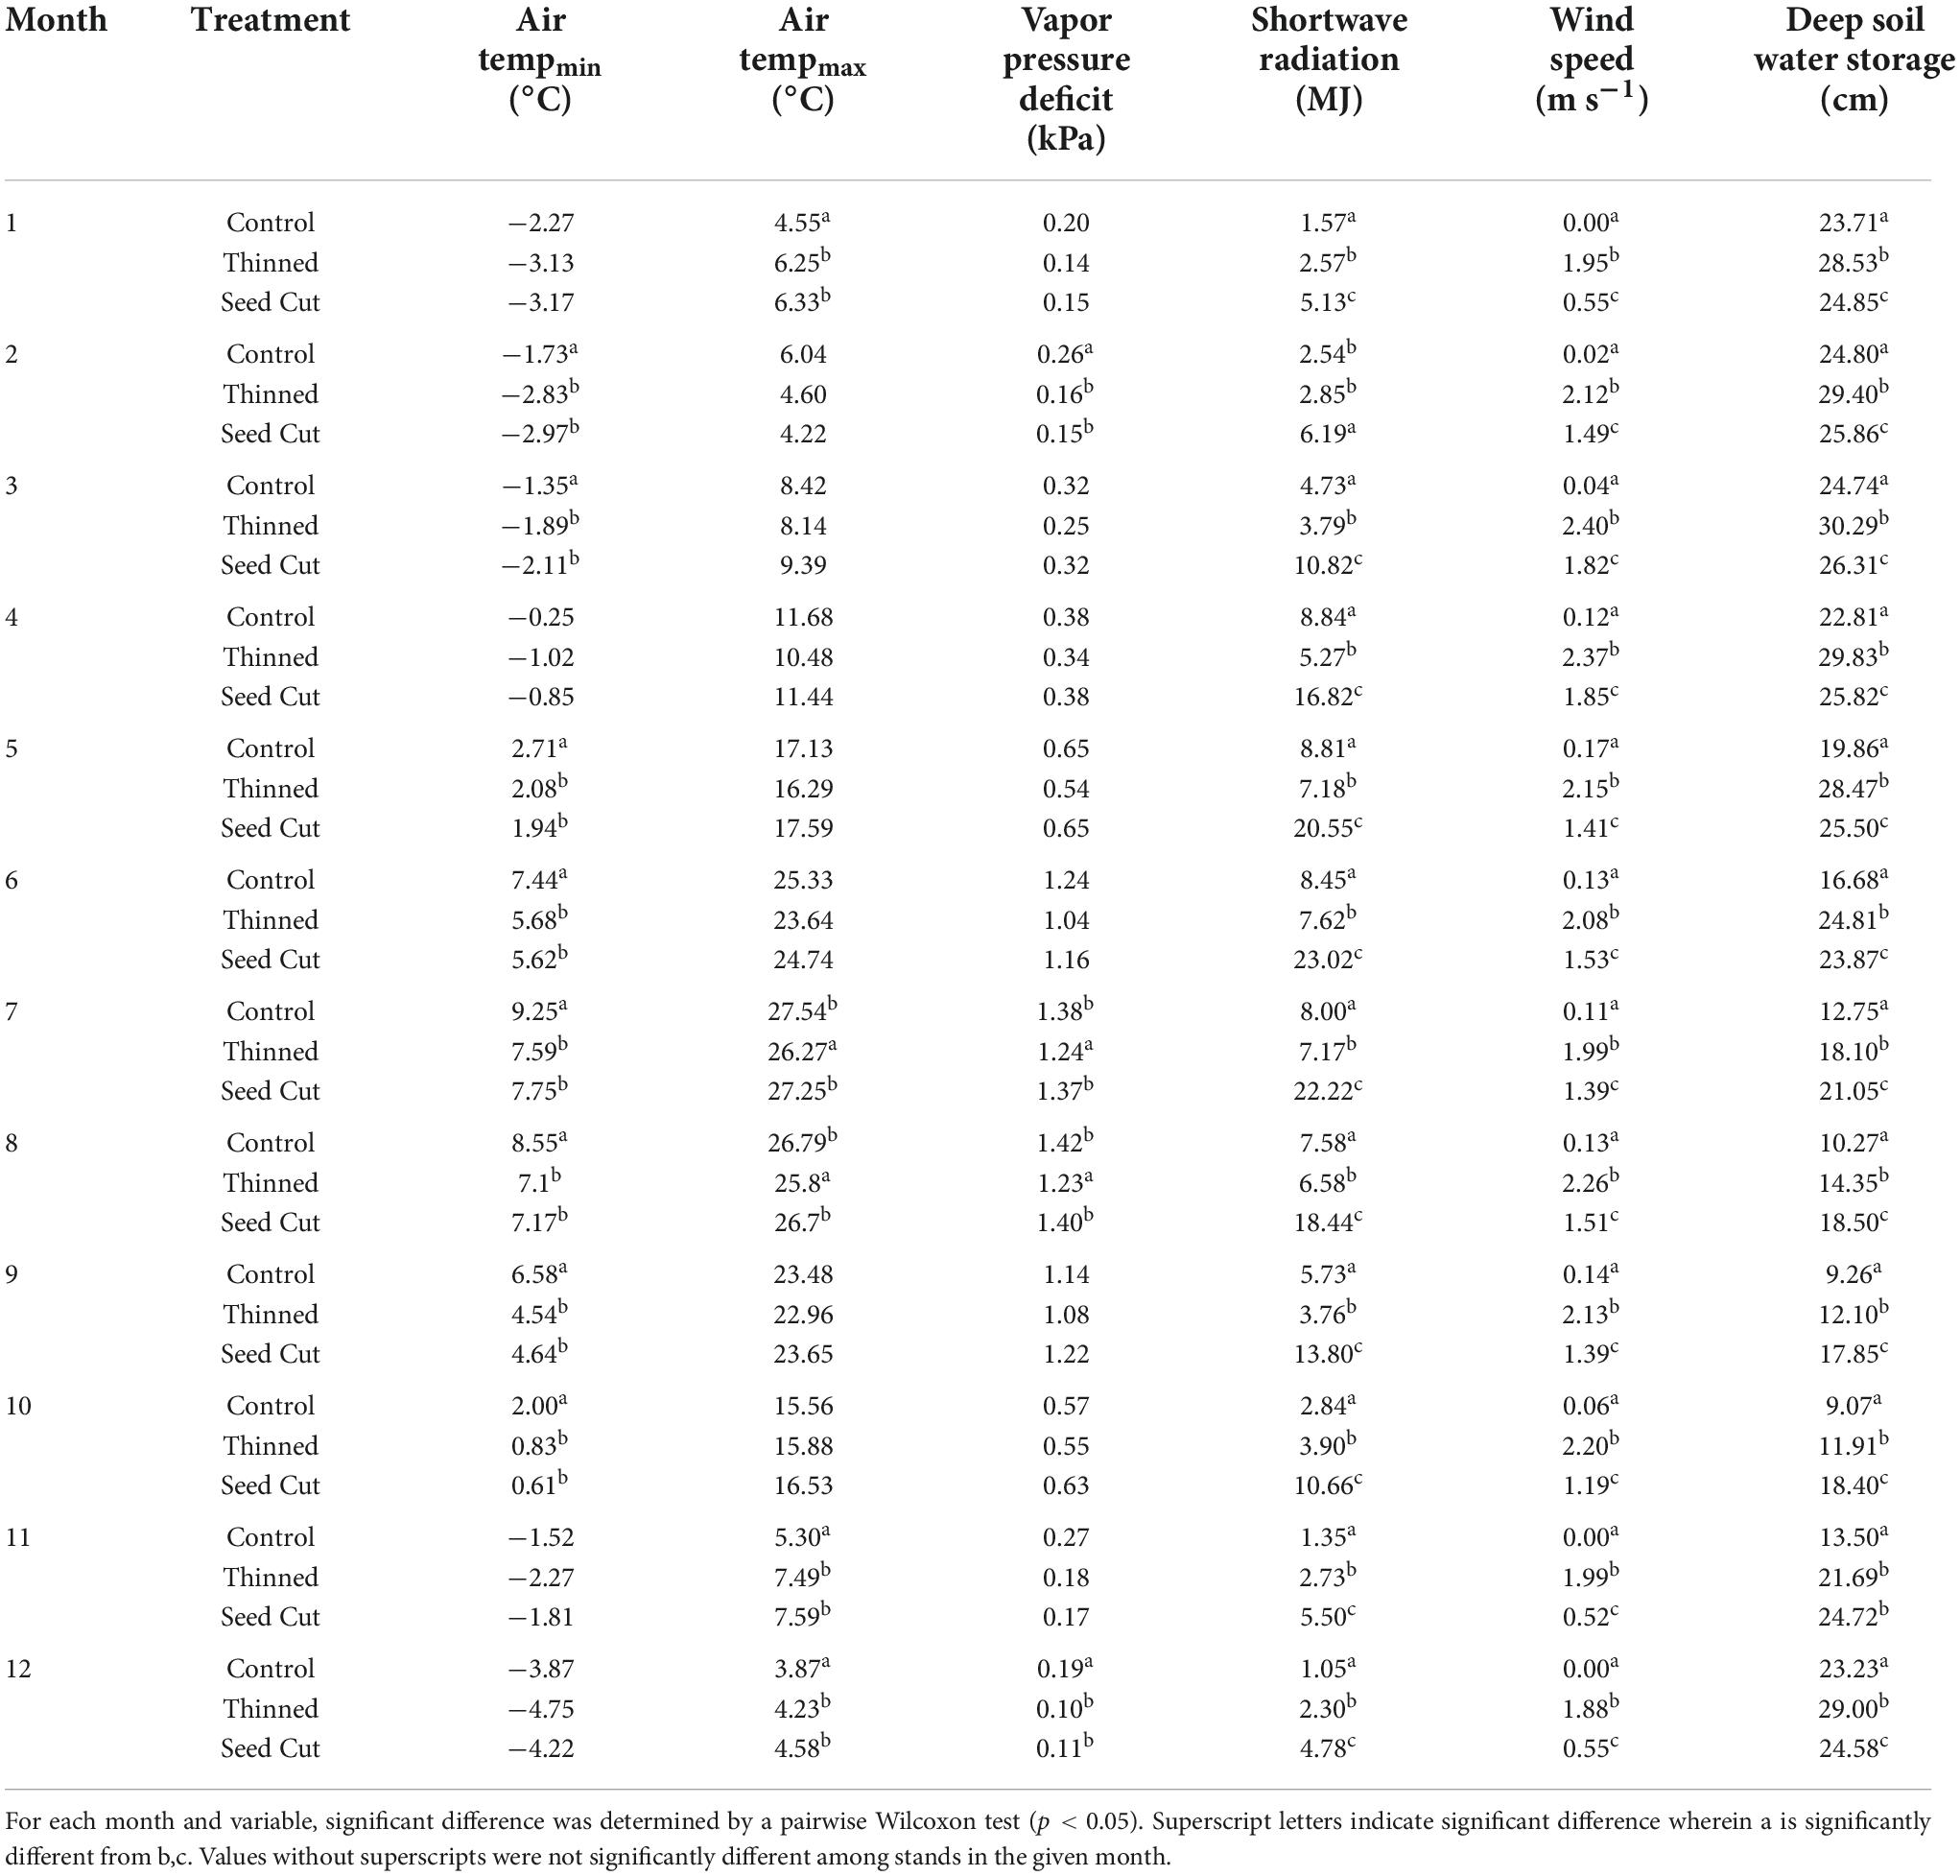
Table 3. Median monthly parameter values at monitoring sites.
The average daytime maximum temperatures also document the relatively warm winters (> 0.0 o C). Monthly mean daily maxima were significantly warmer in the Thinned and Seed Cut sites in the winter months, whereas the Control site typically showed ones that were 1–3°C cooler during the daytime (Figure 4B). In contrast, there was generally no significant difference between them in the Thinned and Seed Cut, except for the during summer months of July and August (Table 3).
The VPD reached its maximum for all monitoring sites in mid/late summer, coincident with the timing of the greatest annual differences in air temperature and minimum soil moisture storage (discussed below). It rapidly declined in October and November, consistent with the onset of seasonal precipitation. Differences in VPD between monitoring sites were generally small (<< 1 kPa). However, for most of the year, it was the highest at the Control site and was significantly greater than the other two treatments during several summer months (Figure 4C and Table 3).
There were significant differences in incoming shortwave radiation amongst the sites (Table 2). The near-complete removal of trees in the Seed Cut treatment significantly increased the median shortwave radiation flux at the forest floor in all months (Figure 4D and Table 2). During most of the year, it received almost twice as much solar radiation as the Thinned and Control sites. Only in January did the shortwave radiation dip, which was due, in part, to the sensor being shaded by trees at the edge of the Thinned treatment.
During the winter the Thinned site received significantly more shortwave radiation than the Control site did (Table 3). Surprisingly, it also showed equal or lower levels relative to the Control during the spring and summer (Figure 4D), although this is likely an artifact caused by the location of the Control monitoring station. It was situated beneath a small, anomalous opening in the canopy (chosen to allow better solar charging of the meteorological instruments, while minimizing cable length), which let direct sunlight reach the pyranometer when sun angles were high (i.e., in the summer). This likely caused it to receive more shortwave radiation than the surrounding thick forest did. During winter months with lower sun angles, the denser canopy of the Control generally shaded the monitoring site and shortwave radiation was reduced, compared to the Thinned.
Wind speeds (measured 2 m above the forest floor) also showed significant differences among the monitoring sites (Table 2). In all months, the average at the Control site was much lower than that of either the Thinned or Seed Cut sites and was often below the minimum reported measurable value of the sensors (0.5 m s–1). In contrast, at the Thinned and Seed Cut sites, it was between 1 and 2 m s–1. The high tree density in the Control corresponded to significantly lower wind speeds relative to those measured in the treated stands (Figure 4E; Table 2).
The similarity in wind speeds between the Thinned and Seed Cut sites may be influenced by (1) minimal understory and/or a large distance (14 m; Table 1) from the forest floor to the base of the canopy in the Thinned stand, (2) a small fetch within the Seed Cut area (∼0.8 ha), and/or (3) the Thinned monitoring site being located ∼150 m from the Seed Cut site. Analysis also suggested that there was a slight difference in the predominant wind directions, despite the proximity of the two (less than 150 m apart) and their similar slope and aspect. At the Thinned site, the winds were mostly from the southwest (the expected direction for this region), while at the Seed Cut site, they primarily came from the south and southeast.
Snow was rarely a component of the total precipitation in most years and typically lasted for less than a week. The one exception was Water Year 2017, which produced snow-covered conditions for a short portion of the winter in late February and early March. The maximum snow depths for each monitoring site at this time were: Seed Cut = 53 cm, Thinned = 25 cm, and Control = 14 cm. While these results are generally consistent with previous work in maritime snow-dominated forests in which thinning was found to increase the amount of snow that reached the forest floor (e.g., Musselman et al., 2008), no conclusions can be made from these limited observations. They are included only to show that the wet winter of 2017 recorded at Manzanita Lake (Figure 2B) was visually apparent in the study area.
Soil moisture
In most field areas, assessing soil moisture dynamics is challenging because of soil heterogeneities. While they were minimized to the extent practicable, due to the limited spatial replication of moisture probes, this analysis focused on integrative measures and end-point measurements, which are less susceptible to the influence of spatial variabilities than mid-range water potentials—and it only drew broad conclusions.
Soil textural heterogeneities will usually cause much larger soil moisture spatial variabilities in mid-range water potentials than at either the wet or dry end of the retention curve (Vereecken et al., 2007). When soils dry, the spatial variance in their volumetric moisture content will grow and then begin to decline again as the process continues. In contrast, field saturated values generally show only small variations (for similar soil textures), just as with end of season, or even wilting point, contents.
Soil moisture at all depths rapidly responded to winter rains, and typically reached maximum water content in early December of each year. Figure 5A shows the time series of integrated storage over the six winter and summer seasons for each monitoring site. Gaps in the record represent periods when two or more of the sensors failed (usually from animal damage). Individual rainstorms through the winter can be readily seen as short duration spikes in water content (Figure 5A).
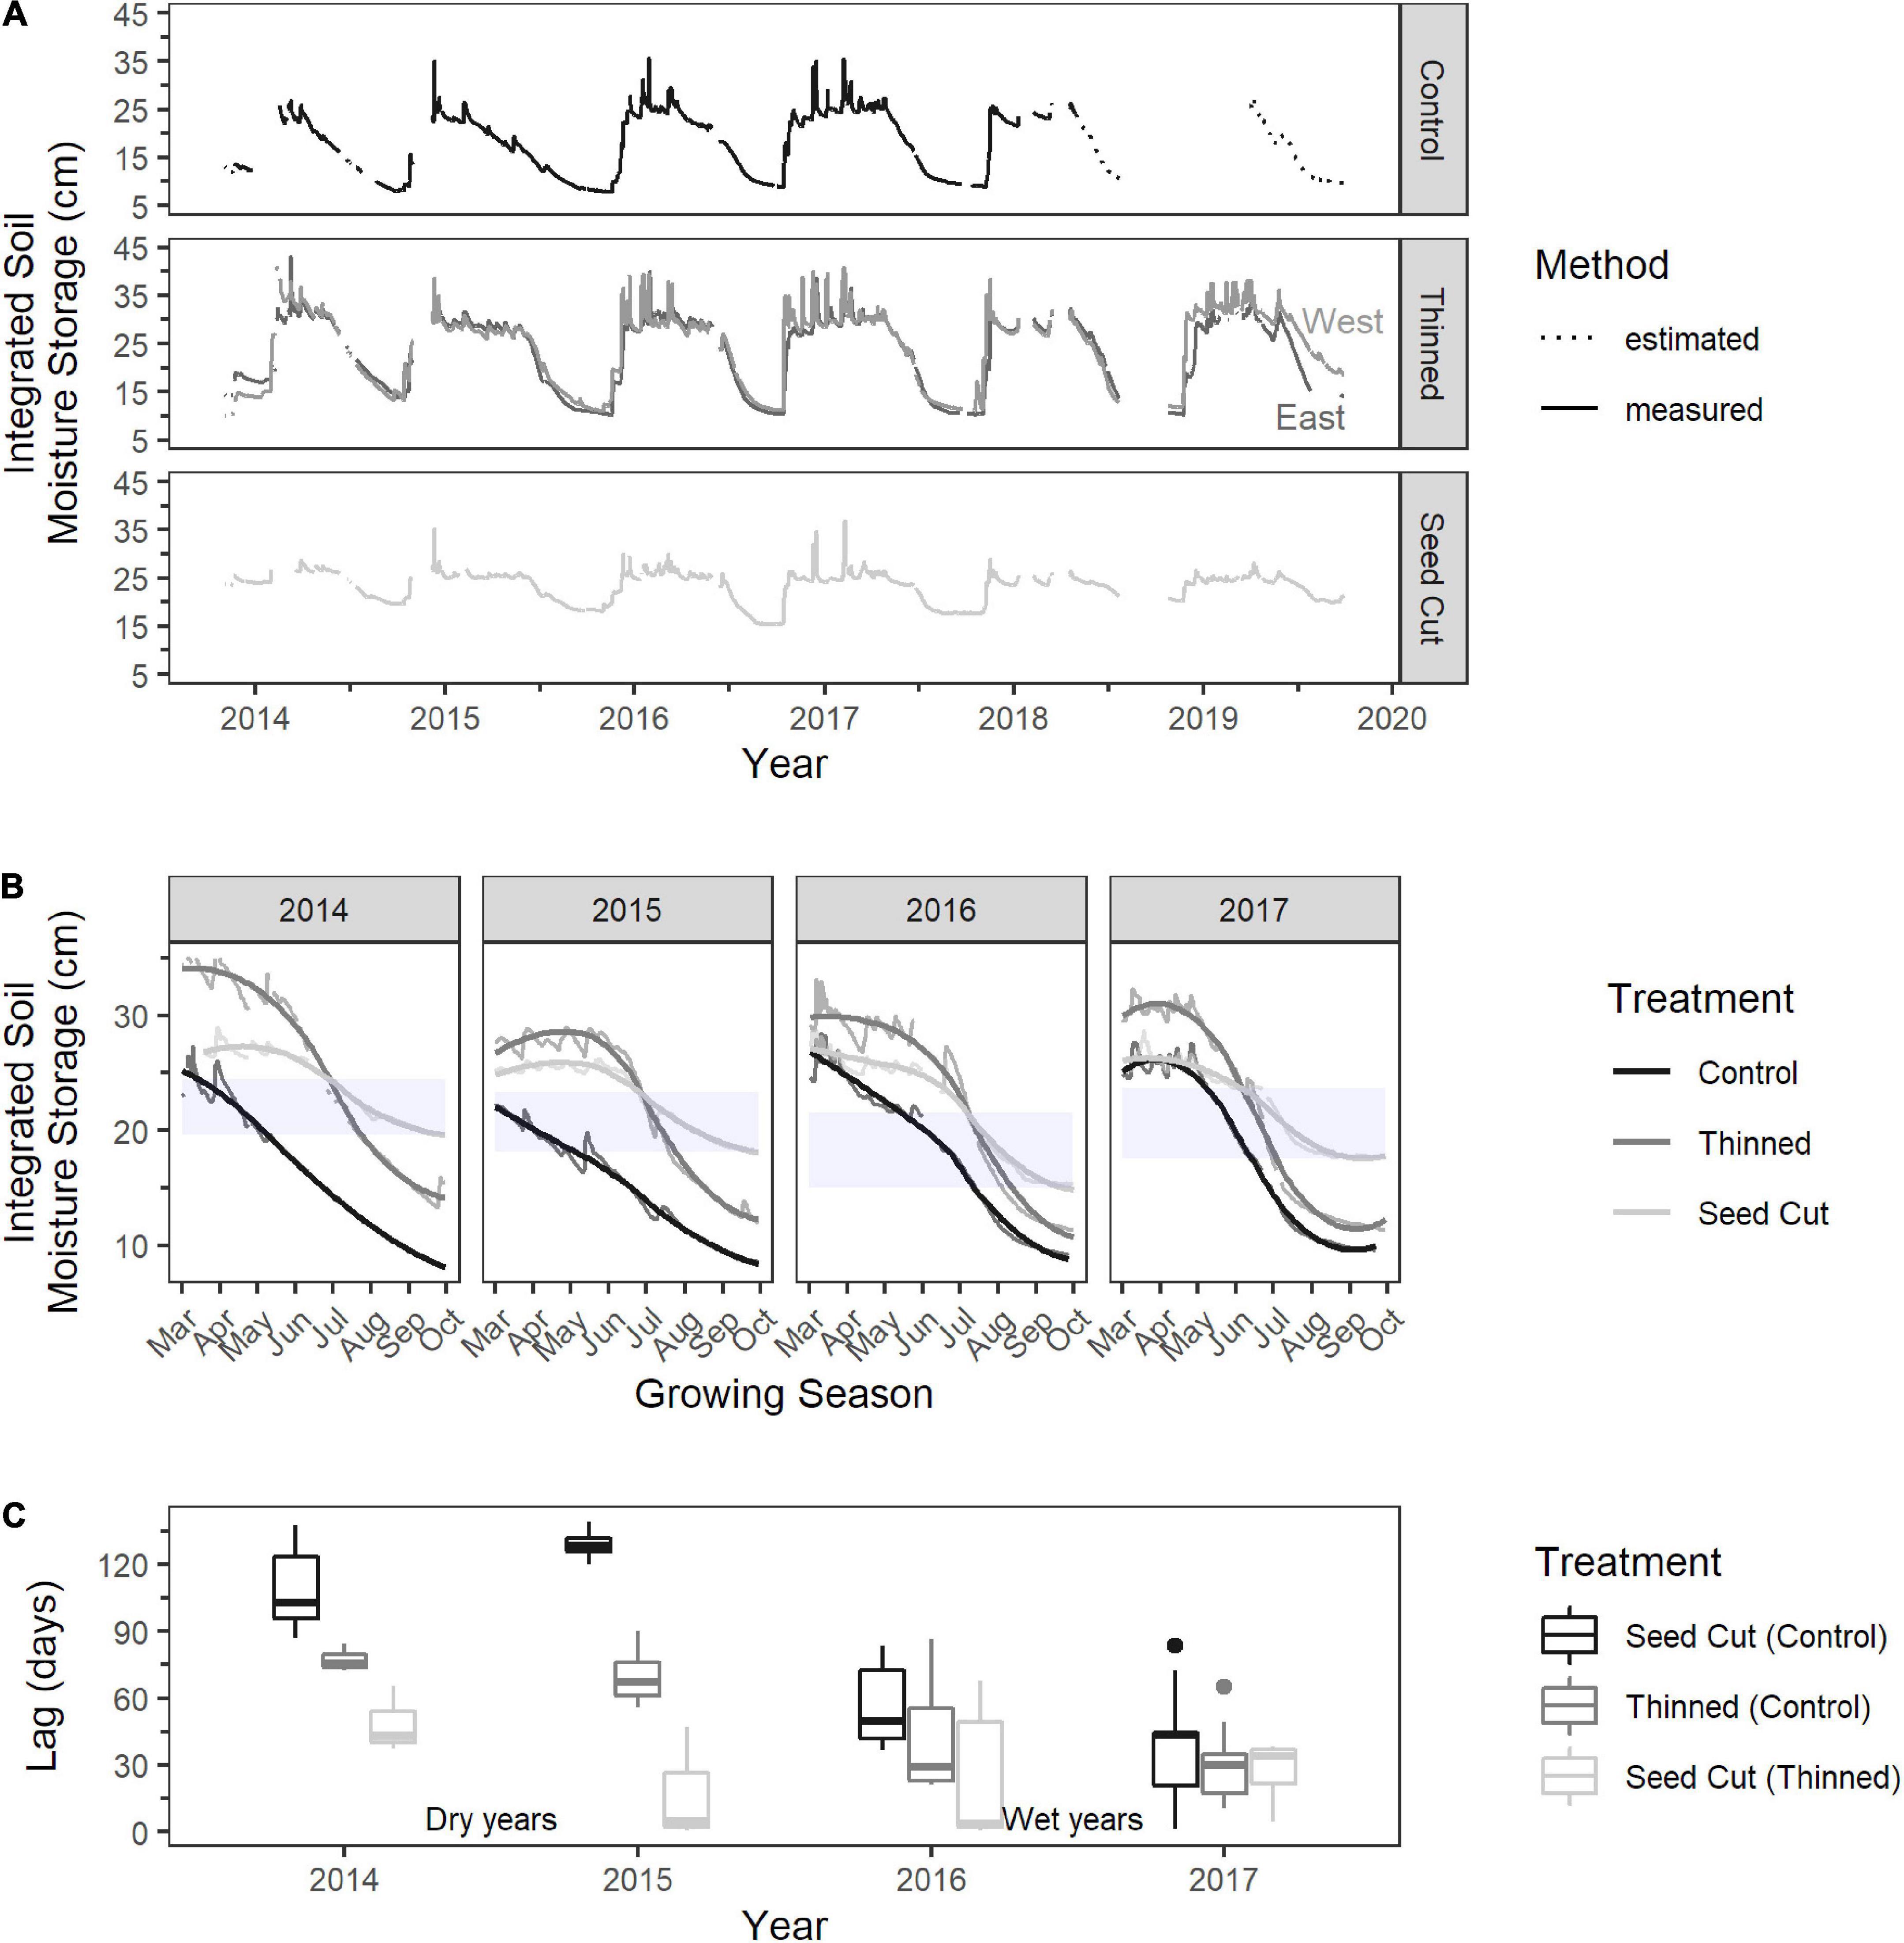
Figure 5. (A) Integrated soil moisture storage calculated as a depth-weighted average of sensors at 30, 50, and 100 cm below ground surface in each stand. Estimated values were derived from linear regression of the 50 and 100 cm sensors. (B) Differences in soil moisture depletion during the growing season between dry (2014, 2015) and wet (2016, 2017) water years. Data are the same as in A, but overlain with a LOESS locally weighted smoothing function. Shaded rectangles indicate the region used to calculate lag in (C). (C) Lag time in days of the treatment to achieve the same moisture values as (Control) or (Thinned). Here, “same” is defined as the nearest 0.5 value in the shaded region and results in a distribution of lags, which are visualized as boxplots. Mean lag (thick horizontal bar) was used in the text to describe differences in soil moisture recession (e.g., in 2015, Seed Cut soil moisture depletion lags Control depletion by about 120 days, while in 2017 the lag was about 40 days). Boxplots are staggered in each year for clarity.
The maximum storage in the upper 100 cm was similar across all three monitoring sites (approximately 25 cm of water), although the Thinned-West site consistently had ∼5 cm greater maximum storage than even the Seed Cut site. Since the Thinned Treatment area should have more interception than the Seed Cut, it would be expected to have an intermediate maximum storage capacity rather than being greater—if storage were only controlled by precipitation. These differences are, therefore, likely related to small variations in soil texture between the monitoring sites (Gaffney, 2016). This finding, that the maximum stored water is similar across treatments, is consistent with previous work. The differences in soil moisture storage measured by Young et al. (2012) in similar thinning treatments on an adjacent forest were also small and had inconsistent trends.
In contrast, soil moisture minima were quite different across the three of them (Figure 5A). The end-of-season water storage at the Seed Cut site ranged from 15 to 20 cm, or 15–20% by volume, while at the Control, it varied from 7–9 cm, or 7–9%. Whereas at the Thinned site, it was intermediate between the other two, at ∼11 cm, or 11% by volume. While this is a small difference, the ranking of end of season soil moisture was consistent across all years and precipitation regimes. Every year, the Control reached the lowest stored water volume.
The onset of soil moisture recession varied both by treatment and water year (Figure 5B). During dry years (WYs 2014 and 2015), it was occurring in the Control site through most of the winter months, while at the Thinned and Seed Cut sites, it only began in late spring. However, in wet years (for example, WY 2017), it started concurrently in the late spring at all three sites. These differences are apparent in the lag times observed for the monitoring sites in the treated areas to achieve the same integrated soil moisture values that the Control had earlier in the season (Figure 5C).
During dry years (WYs 2014 and 2015), the Thinned and Seed Cut sites attained given soil moisture values 60 and 100 days later than the Control, respectively (Figure 5C). In wet years, they all generally reached similar levels about 30 to 40 days after the onset of recession (late March).
Tree basal area increment
As a result of the complex interplay between climate, light, moisture, and nutrient availability, the mean BAI of each studied stand changed considerably over the common time interval of 1891 to 2000. In addition to previous rounds of thinning, the forest may have also been impacted by wildfire, insects, and/or disease (White, 2022). Therefore, only data from the year 2000 onward are presented—when the climate and all forest management activities are well documented and stand structure is known not to have been altered appreciably. (However, the full BAI dataset is available online).
Between 2000 and 2010, the trees in all three stands had similar BAIs: approximately 2,500 mm2 per year (Figure 6). This period was generally warmer than the long-term average. While 2006 was a wet year (Figure 2A), its influence does not appear to be reflected in the collected cores (Figure 6). In the decade after timber was removed, from 2010 to 2019, annual increases in BAI diverged. In the Control, it remained at around 2,500 mm2 per year. Whereas in the treated areas, it ranged between ∼4,000 to ∼6,000 mm2 per year in the Thinned stand and ∼6,000 to ∼8,000 mm2 per year in the Seed Cut (Figure 6). As with the pre-treatment decade, the post-treatment one was also warmer than average and had an exceptionally wet year (2017; Figure 2A).
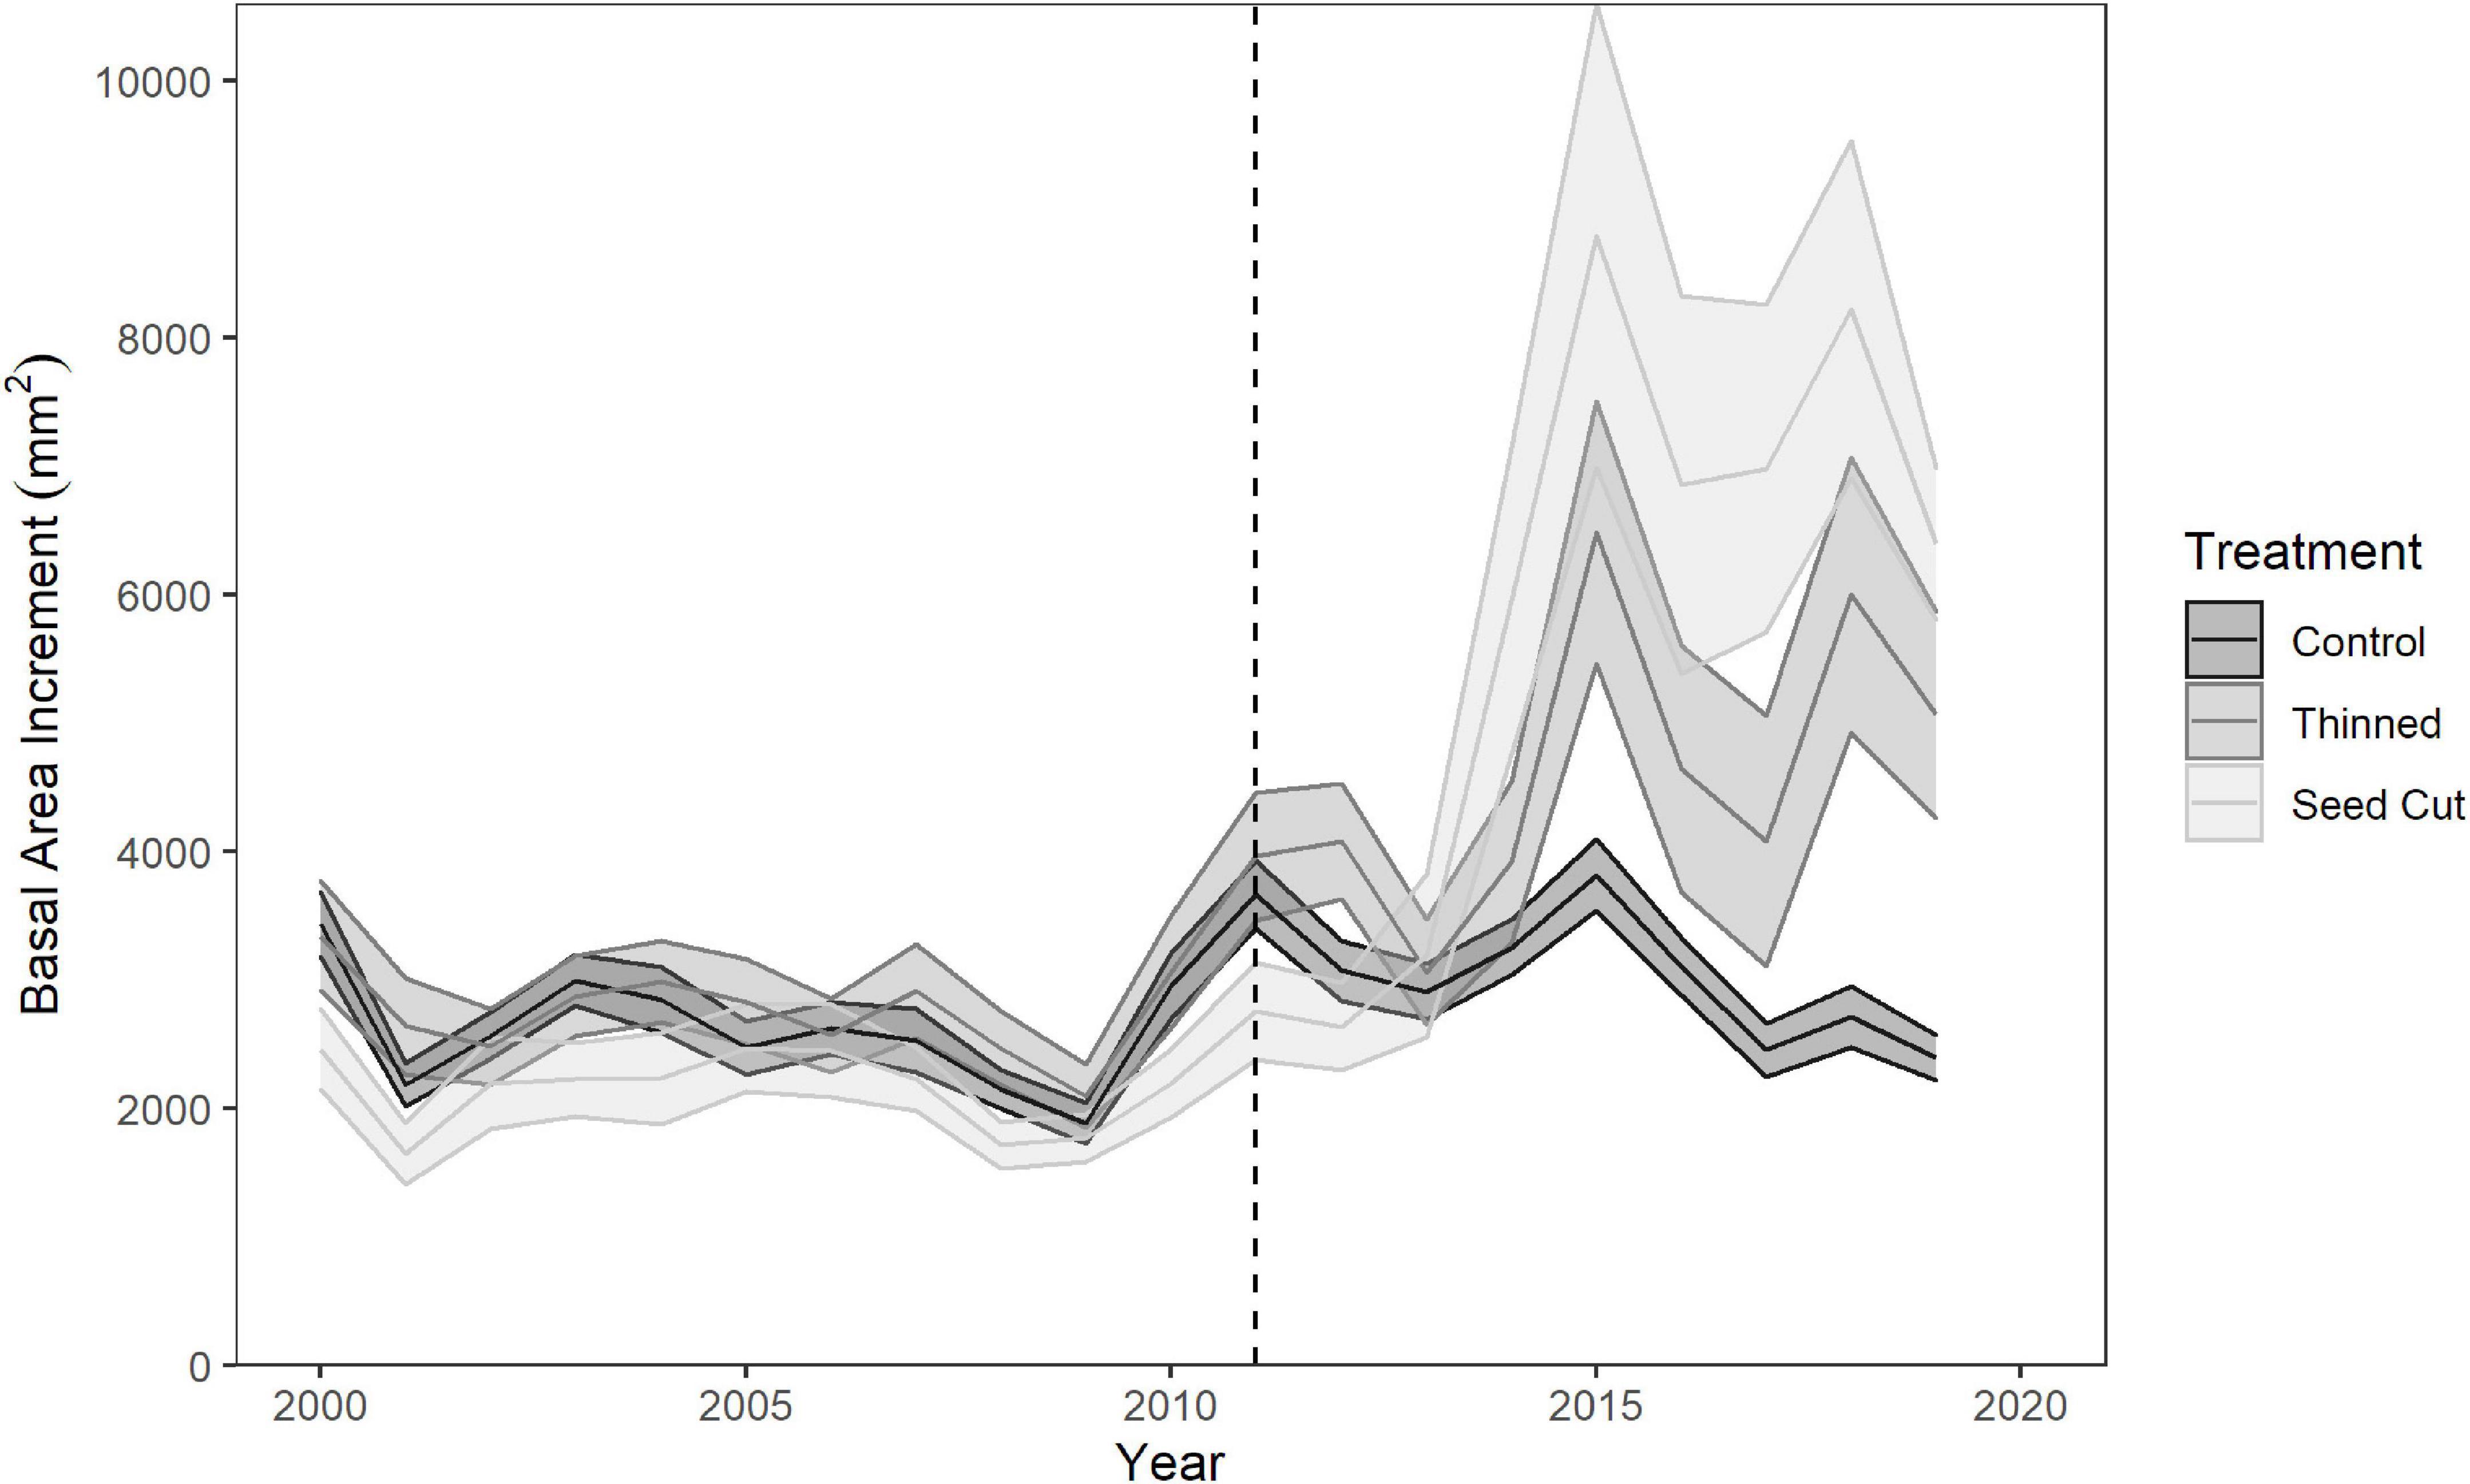
Figure 6. Growth measured as mean basal area increment (BAI) of trees in each stand for the approximate decades before and after thinning prescriptions were implemented (2011, dashed line). Bands represent the standard error for each stand (number of samples are Control = 12, Thinned = 6, Seed Cut = 6).
Even though there were climatic extremes from 2015 to 2017 (the peak of the drought to near-record precipitation) that may be superimposed on the rate of BAI growth, the fact that it was similar both in the decades before and after treatment (Figure 2A) suggests that it alone does not account for the patterns that were seen in the cores. In addition, BAI values rose the most dramatically in the Thinned and Seed Cut stands two to three years after treatment—which is consistent with the timescale for tree roots to access newly available moisture and nutrients during the growing season (Moore et al., 2008). These observations comport with those seen in ponderosa pine stands elsewhere (e.g., Moore et al., 2008) and suggest that the implementation of the density reduction prescriptions in 2011 caused an increase in BAI.
Discussion
As the rapidly changing climate alters disturbance regimes, it is critical for land managers to understand how forest structure modifications can influence below-canopy climate, water storage, and soil moisture availability. The proximity and comparability of stands that were treated with two common thinning prescriptions and a control allowed both the conceptual model (presented in Figure 1) and the local hydrologic effects of this precipitation regime transition to be directly evaluated. While most of these datasets describe conditions specifically at a monitoring site, the differences in BAI across the stands suggest that the stations are generally representative of their associated treatment area. The meteorological and soil moisture findings are not only concordant with expectations, but also demonstrated that some environmental parameters (e.g., wind speed and radiation) are more sensitive to thinning treatments than others. This provides a novel insight into how key hydrologic processes respond to forest management in years with precipitation extremes.
Below-canopy meteorology: General
Both prescriptions caused subtle, yet statistically significant, differences in below-canopy meteorology that follow what one would predict from energy budget considerations alone (Table 2). For instance, compared to the unaltered Control, the Thinned and Seed Cut sites had higher daily maximum temperatures during the winter months, typically 1–3 oC warmer, which is consistent with differences in forest structure between treatments (Table 1). Dense canopies, like those found in the Control, have been shown to limit the amount of solar radiation that reaches the forest floor (Ma et al., 2010). In contrast, there was generally no significant difference between the maximum temperatures in the Thinned and Seed Cut.
Minimum (nighttime) monthly temperatures were significantly warmer in the Control compared to the Seed Cut and Thinned, which was likely due to there being (1) higher below-canopy longwave radiation, (2) less access to night sky radiation (Lundquist et al., 2013), and (3) decreased canopy ventilation. These warmer nighttime lows increased the VPD in the Control and, therefore, could potentially cause additional evaporation (and possibly nighttime transpiration) and soil moisture depletion.
However, large differences in tree densities may not translate into correspondingly greater changes in key meteorological conditions. For example, in almost all months, the Seed Cut received significantly more (up to two times) incoming solar radiation than the others. Yet in the winter months, while the Thinned stand did receive more shortwave radiation than the Control, as would be expected, the difference between them was small. This suggests that, even though tree density and canopy cover were much greater in the Control plots than in the Thinned ones (Table 1), at the stand scale, the total shading was similar. This can be verified by looking at the canopy closure (as opposed to canopy cover) of the Thinned stand, which ranged from 90–100% (O’Halloran, 2018).
Thus, while tree density has been shown to have an impact on canopy temperatures, the silvicultural prescription used for the Thinned stand did not have an appreciable impact on forest floor shading. Importantly, since forest litter would not be subject to as much drying, this treatment is likely to reduce the risk of wildfire.
The moisture content of dead and down fuels is also strongly controlled by the amount and timing of precipitation. However, since precipitation, canopy throughfall, and stemflow were not successfully measured, their effect on vegetation cannot be determined. Accurate recording of interception would require a spatially dense sampling network in each treatment for multiple storm events (Crockford and Richardson, 2000). Previous studies also suggest that throughfall will generally increase with the degree of thinning (Simonin et al., 2007; Molina and del Campo, 2012), although tree species and rainfall intensity can significantly alter this relationship.
Increasing rainfall intensity and duration will typically reduce the relative magnitude of interception, and higher tree basal areas will likely increase the importance of stemflow. Lassen National Forest is subject to long duration, moderate intensity winter rainfall, thus interception losses will probably be less controlled by stand density and compensated for by stemflow in the thicker canopies. Since the effects of interception and stemflow in this study were not well constrained and have a significant impact on fuel ignitability, this is an urgent, open research question for the Southern Cascades region.
Below-canopy meteorology: Wind
Lower wind speeds in dense stands have been shown to greatly reduce both wind penetration and the efficiency of ventilation, which results in higher winter temperatures (Chen et al., 1995; Klein et al., 2021). In the Control, the abundance of small and intermediate trees in the understory, as well as the lower height to live crown (Table 1), caused wind speeds to be lower than in areas that were harvested. However, the difference between the Thinned and Seed Cut was less than might be expected (Figure 4E; Table 3). It was initially assumed that the presence of some trees around the Thinned site would result in it having lower wind speeds than the Seed Cut, which effectively had no trees below-canopy (where wind speed was measured). Surprisingly, it was slightly, but still significantly, lower in the Seed Cut than in the Thinned stand.
Other studies (e.g., Kane, 2021) have attributed low wind speeds in relatively open stands to slight topographic differences between study areas and the inability of instruments to detect low speeds. In this monitoring project, the meteorological stations were close enough to each other that their topographies were similar (confirmed by LiDAR altimetry, see Figure 3C) and laboratory testing of the anemometers ruled out the possibility of inconsistencies in their calibration. Therefore, the observed variations may be the result of local fetch controls on boundary layer turbulence. Edge effects from the Seed Cut may have induced a vertical component to the wind vector (unresolvable by the horizontally mounted cup anemometers). While the differences were small (∼0.5 m s–1), the data suggest that, at a local scale, the clearing prescription studied (< 1-hectare seed cut) may have a minor impact on wind speed and direction.
Soil moisture and tree growth
The integrated soil moisture storage timeseries for all four monitoring stations (the three that have been discussed thus far plus Thinned-East) showed similar maximum water storage patterns (Figure 5A). In all cases, it was high (ranging from 25 to 30 cm) prior to the onset of recession. The average annual precipitation was ∼100 cm and, even with expected loses to interception, there was more than sufficient infiltration to bring the soils up to full storage capacity during each winter, across all treatments. Since there was only minimal evidence of overland flow, and almost all the annual precipitation comes during the winter (when transpiration and evaporation are much less influential than during the summer), once the integrated soil moisture storage is filled (∼25–30 cm), the remaining precipitation most likely infiltrates below 100 cm.
While hydrologic models have consistently predicted that changes in vegetation density would have a significant effect on soil moisture (e.g., Rodríguez-Iturbe and Porporato, 2007), few direct field measurements have captured this behavior. In these stands, the degree of depletion at the end of the summer was strongly influenced by treatment. The amount of moisture remaining at the end of the season was always the greatest in the Seed Cut and least (driest) in the Control. Whereas in the Thinned, it was close to, but still more than, that of the unthinned forest. The same pattern was seen in Thinned-East (Figure 5A), despite it having a different slope and aspect (Figure 3C). In the Seed Cut, the magnitude of this difference is much greater than that which was observed in maximum storage.
Soil moisture patterns demonstrated that stand density is a control on end-of-season storage. Since the moisture recession characteristics of the Thinned and Control sites are more similar to each other later in the summer, the relationship between them does not appear to be linear (Figures 5A,B). In contrast, the Seed Cut retained almost twice as much moisture in the upper 100 cm as the others. This suggests that the remaining trees in the Thinned stand are still able to access and utilize almost all of the water available at this depth range through their roots, either via existing overlaps or new growth. Additionally, it is worth noting that multiple ecophysiologal studies have found evidence of trees exchanging water with other trees in moisture limited environments (Klein et al., 2016; Cabal et al., 2020).
The near-complete absence of trees in the Seed Cut, on the other hand, causes additional moisture to be retained in the upper 100 cm. This observed increase in late season storage from clearing is consistent with the fire impact models of both Boisramé et al. (2019) and Stephens et al. (2021). Furthermore, the similarity of apparent water use of the Thinned and Control stands is also concordant with many studies that have shown increased water use and growth in remaining trees following thinning, particularly in Mediterranean (winter wet, summer dry) climates (Clark et al., 2016; Hahm et al., 2019, Tague et al., 2019). This is readily apparent in the increase in BAI that both treated stands experienced two to three years after thinning (Figure 6).
During wet years (WYs 2016 and 2017), the scale and timing of soil moisture recession in all three stands were similar (Figures 5B,C). In the winter and spring, any soil moisture lost to evapotranspiration and/or gravity drainage was soon replenished by abundant rainfall, topping off the upper 100 cm. Since: (1) evapotranspirative demands were insufficient to overwhelm infiltration, (2) there was always more precipitation than the soil could store, and (3) negligible overland flow occurred, the balance would soak in and replenish deep soil moisture storage and/or the aquifer(s). Given that the Control and Thinned stands reached minimum soil moisture storage at approximately the same time, the large trees that remained after thinning transpired at higher rates than the numerous smaller trees in the Control, consistent with the findings of Tsamir et al. (2019). With wider spacing, these trees also benefited from the additional sunlight. Therefore, in spite of the dramatic differences in their densities, the Thinned and Control had approximately the same annual transpiration from the upper meter of soil.
In contrast, during drought years (WYs 2014 and 2015), forest density was an important factor in soil moisture retention. The Control, with its numerous trees, would have both higher transpiration and likely more interception than the other two treated areas. There was not enough precipitation and infiltration to overcome the trees’ transpiration demands, and thus soil moisture storage began to decline much earlier in the season (Figure 5B). Whereas at the Thinned and Seed Cut sites, soils remained at full storage through the winter, and any infiltration events would have caused deep drainage. Said another way, the trees in the Control used the stored water early and, when it was not replenished by winter rains or spring snowmelt, rapidly exhausted the supply. Importantly, fuel moisture tracks soil moisture. Although the available water was fully depleted by the end of the summer in the harvested areas as well (in all years), they both retained moisture longer through the summer in dry years (Figure 5C)—which reduces wildfire risk during the most dangerous part of the season.
Like many mid-elevation forests in the Cascades and Sierra Nevada, this area has experienced a noticeable shift in its precipitation regime, and instead of maintaining a consistent seasonal snowpack (even in dry years), it now almost exclusively receives rain. Most of the water then immediately infiltrated through the coarse volcanic soils. During dry spring seasons, the snowpack served as a supplemental storage reservoir that was available to top off soil moisture reserves, even in the dense Control. This effectively reset the recession curve, as exemplified by the stores being at full capacity in March and April in 2017 (Figure 5B), which was the only year with appreciable snow during the study.
As a result of this transition, snow is now absent during the critical onset of transpiration. This, in turn, caused soil moisture to decline earlier and faster, which placed the trees under greater stress during the hottest part of the summer (July–September). While this result may be site specific, it suggests that such treatments would benefit many forests by delaying the onset of near surface drying and water stress—thereby lowering fire risk—in regions that never had seasonal snowpacks as well as in places in which a warming climate is reducing or eliminating them.
It is important to recognize that soil moisture storage deeper than the 100 cm profiles that were reported on here is likely to also be a valuable resource in all years. Depletion in the upper zone ranged from < 10 cm in the Seed Cut to as much as 25 cm in the Control (Figure 5A). Indeed, the greatest increase in BAI for the trees measured in Seed Cut (and Thinned) was in 2015 (Figure 6), at the peak of the drought (Figure 2A), which indicates that there was substantial growth despite the low precipitation.
Transpiration in California’s Sierra Nevada, Coast, and Cascade Ranges is likely supplemented from water storage deeper in the soil profile (Bales et al., 2011a,b), and potentially from within fractured bedrock, which appears to be the case here. Nonetheless, near-surface depletion of soil moisture does have a major impact on forest health, soil biogeochemical cycling and microbial processes (e.g., Curiel Yuste et al., 2007), and resilience in the face of future disturbance (e.g., wildfire, insects, disease, etc.). Therefore, characterizing the shifts in soil moisture storage within the upper 100 cm in response to forest and fuels reduction treatments is a critical part of understanding how active management effects forest health and ecosystem services.
These results documented the importance of soil storage capacity, precipitation form (rain or snow), and the behavior of the Critical Zone (e.g., Grant and Dietrich, 2017) in controlling recharge and runoff in forests transitioning from snow to rain within the Basins Project area. In Mediterranean regions, Hahm et al. (2019) noted that for soils with low storage capacities (only), the forest was not sensitive to variations in annual precipitation. Likewise, in a modeling study of the Sierra Nevada, Tague and Moritz (2019) showed that the magnitude of the impact of thinning on evapotranspiration and post-implementation ET recovery was highly sensitive to soil moisture storage capacity, (and maximally so when it was in the intermediate range).
In these stands, soils are not shallow, and the underlying bedrock is very permeable. Additional water gained from thinning can, therefore, augment the subsurface groundwater system and would eventually either supplement stream baseflow lower in the watershed or be used for future evapotranspiration (if it is accessible by roots). Whereas in thin soils with limited storage, water gained from thinning may not be retained in the soil profile and would run off the landscape, thereby increasing winter storm flows in downstream rivers.
This suggests that managing the forest in order to improve resilience, as well as enhancing summer baseflows, would be the most effective in catchments with large storage capacities (e.g., well-drained deep soils with gently sloping topography) and may have detrimental effects (e.g., increased winter storm flows) in steep and poorly drained catchments.
An additional consideration in designing thinning treatments that may enhance flows is the potential for hydraulic lift to draw any newly available water that is deeper in the profile up to the top meter. It would then be utilized by vegetation rather than becoming available to augment downstream supply. During the dry season in a highly permeable landscape, one study showed that pine species with deep roots were able to generate hydraulic lift (Filella and Peñuelas, 2003). However, since the phenomenon is only observable when there are just a few meters between a tree and the soil moisture probes (Horton and Hart, 1998), which was not the case here, future research is needed to determine how much of a role it plays in the volcanic landscapes of the southern Cascades.
Seed cut treatment
Several additional observations were made regarding the long-term hydrologic behavior of the Seed Cut treatment. In every year of the study, its end-of-season soil moisture storage was always the greatest, which suggests that the remaining (seed) trees should be less water stressed.
However, at first glance, it was surprising that they did not first fully deplete the reserves in the upper 100 cm. This is likely due to the soil moisture monitoring node being ∼30 m from the closest seed tree, at a spot that may not represent the conditions within its root zone. The few perduring trees may still be at a higher risk for late season water stress since they are subjected to much greater vapor pressure deficits during the late summer (Figure 4C). This could lead to their experiencing higher potential transpiration demands than trees in the same size class would under a thinning prescription. Studies in other areas with Mediterranean climates have shown similar increases in transpiration due to elevated solar radiation, even in locations that would not traditionally be classified as being radiation limited (Tsamir et al., 2019). Hydraulic lift may also support young trees growing in the clearings, but more work is needed to assess these effects in this region.
These results also raise an important wildfire hazard consideration: While the higher evaporative potential after seed cut clearing does not affect integrated soil moisture appreciably, in many situations, it could cause surface fuels to dry out more rapidly. This would, in turn, increase both the risk of an ignition and the rate of spread of wildfire across the open patch.
Finally, the magnitude of the end-of-season soil moisture storage in the Seed Cut declined (Figure 5A) from ∼20 cm in 2014 to 15 cm in 2016. This indicates that there was an increase in soil moisture uptake over time, which then stabilized, or even rose slightly, in 2017. During this same period, understory growth in the Seed Cut accelerated, particularly with the planting of pine seedlings in 2013. This occurred throughout the treated area, including adjacent to the soil moisture monitoring station, and this vegetation is now likely accessing the additional available water. However, in the wet year of 2017, the understory transpiration demand appeared to have been well met, which resulted in the slight rebound of end-of-year storage.
Conclusions
The Basins Project monitored micrometeorology and soil moisture in thinned and nearly cleared mixed-conifer stands that were transitioning from being snow-dominated to rain-dominated in Lassen National Forest, at the southernmost extent of the Cascades, California, USA. While the spatial breadth and sampling replication were both limited, the observations did comport with the initial conceptual model and results were consistent with previous work, which has repeatedly documented differences between forest treatments. The study spanned seven years—across extreme drought (2015) and near-record precipitation (2017)—conditions that are predicted to become more prevalent in the future throughout the western U.S. and world.
Key findings include:
(1) With the exception of shortwave radiation reaching the forest floor, the difference in the magnitude of the changes between the patch-like seed cut and thinning prescriptions was relatively small. Under this new, rain-dominated precipitation regime, reducing tree density to ∼15% of Control had largely the same impact on micrometeorology as reducing it to less than 2%. This result raises the intriguing possibility that the hydrology and micrometeorology of southern Cascades coniferous forests may not necessarily vary in proportion to changes in stand density.
(2) Both active forest management and climate were shown to influence soil moisture storage and depletion behavior. Despite the dramatic differences in tree density between the Thinned and Control stands, the amount of soil moisture that remained in each at the end of the summer in the upper 100 cm was very similar. Removing almost all of the remaining trees, however, caused soil moisture to increase substantially.
(3) The onset of soil moisture decline appears to be governed by annual precipitation as well as stand density. During the early drought years, in which there was not enough winter precipitation to maintain soil moisture reserves, without the additional storage capacity provided by a seasonal snowpack, depletion began much earlier in the Control than in the thinned areas.
(4) The near-complete removal of trees in mid-size (< 1 ha) openings can cause—over the period of this study—increases in integrated soil moisture storage through the height of summer. However, the remaining trees take advantage of this increase in available water within a few seasons to grow and increase the basal area of sapwood.
On Lassen National Forest, forest thinning prescriptions that are designed to reduce interception and transpiration in snow-dominated landscapes may also help retain moisture in those that are transitioning to rain. In cases where the soil and aquifer can provide sufficient storage to absorb and hold winter rains, water that would have been consumed by those processes is instead available to delay the onset of soil moisture recession—thereby both reducing the risk of wildfire and benefitting the ecosystem as a whole.
Although these conclusions are specific to this location and do not allow generalization, the site is representative of substantial portions of the southern Cascades in which recent volcanism dominates the landscape, soil development, and surface/subsurface hydrology. These watersheds are typified by high infiltration rates, large soil moisture storage reservoirs, and significant groundwater storage.
Furthermore, the reduction and elimination of snowpacks across this region considerably decreases the storage capacity of catchments, and thus removes an important reservoir from the Critical Zone. Without snowpack, soil moisture reserves are less likely to be replenished for the growing season and, during dry years, begin declining earlier. Dense forest stands would then experience water stress, desiccate, and become prone to igniting earlier as well.
This study has successfully shown that forest thinning can be effectively used to enhance summer soil moisture storage in the Basins Project area. Additional work is needed to generalize these findings and characterize the effects (or lack thereof) of such treatments on downstream flows.
Data availability statement
The datasets presented in this article are available from online repositories. The micrometeriological data are at the CUAHSI Water Data Services Portal (http://hiscentral.cuahsi.org/pub_network.aspx?n=5672) under the site location Lassen CFLRP Hydrologic Monitoring. The tree-ring data are housed at the DendroEcological Network (DEN; https://www.uvm.edu/femc/dendro).
Author contributions
SW, MS, GG, CT, and ST contributed to the conception, design, and funding of the study. RG, TO’H, AC, and BS performed field work and analysis of the meteorological, soil moisture, and tree ring data. MC and KH performed the statistical analyses, quality control, and the visualization of the forest vegetation and soil moisture datasets. BS, ST, SW, and KH contributed to initial drafts. All authors participated in the manuscript revisions and read/approved the submitted version.
Funding
This work was based on monitoring conducted as a part of the Burney–Hat Creek Basins Collaborative Forest Landscape Restoration (CFLR) Project (Basins Project) of the U.S. Forest Service, located on the Hat Creek Ranger District of Lassen National Forest. The University of Nevada Reno’s Graduate Program of Hydrologic Sciences provided additional support. Instrumentation was provided by the Centers for Transformative Environmental Monitoring Programs (CTEMPs) under NSF EAR-1440596 and Peter Hartsough at the University of California, Davis.
Acknowledgments
The authors are grateful to the field support and/or technical expertise of Chris Sladek and Chris Kratt of the University of Nevada, Reno, as well as Jacob Martin, Doug Peters, Carol Thornton, Greg Mayer, Frank Heide, and Crew 3 of Lassen N.F. Throughout this 11-year endeavor, David Young, of the USFS Pacific Southwest Regional Office, has kindly offered important guidance. Near the end of this work, Robin Wall assumed leadership over the Hat Creek District. She graciously continued to support this project, even with countless competing priorities. Never was this more on display than during the dark aftermath of the Dixie Fire (which came within several miles of the site). This study may never have happened if it were not for the enthusiastic support of Todd Sloat, of the Fall River Resource Conservation District (RCD). The Basins Project itself was born from the dedication and intense effort of the Burney-Hat Creek Community Forest and Watershed Group, of which Lassen N.F. is a founding member. The team is indebted to former Hat Creek District Ranger Kit T. Mullen for both her broad instructions to author SW to find an important question that the Basins Project could address through its monitoring and her support through its design and development. Finally, two reviewers and editor contributed significantly to the quality of this manuscript by their detailed comments and challenging feedback—thank you. SW dedicates his efforts to the memory of H. Jay Melosh, formerly of the University of Arizona Lunar and Planetary Laboratory, who passed on in 2020. Even though he was a member of the National Academy of Sciences, frequently had film crews in his office, and even had an asteroid named in his honor (8216 Melosh; NASA Jet Propulsion Laboratory, 2022), he always made time for SW and didn’t hesitate when SW asked him to join his committee. The value of the solar “constant” has just gone down.
Conflict of interest
Author TO’H is currently employed by Environmental Planning Solutions, Inc.
The remaining authors declare that the research was conducted in the absence of any commercial or financial relationships that could be construed as a potential conflict of interest.
Publisher’s note
All claims expressed in this article are solely those of the authors and do not necessarily represent those of their affiliated organizations, or those of the publisher, the editors and the reviewers. Any product that may be evaluated in this article, or claim that may be made by its manufacturer, is not guaranteed or endorsed by the publisher.
References
Abatzoglou, J. T., and Williams, A. P. (2016). Impact of anthropogenic climate change on wildfire across western US forests. PNAS 113, 11770–11775. doi: 10.1073/pnas.1607171113
Agee, J. K., and Skinner, C. N. (2005). Basic principles of forest fuel reduction treatments. For. Ecol. Manag. 211, 83–96. doi: 10.1016/j.foreco.2005.01.034
AghaKouchak, A., Cheng, L., Mazdiyasni, O., and Farahmand, A. (2014). Global warming and changes in risk of concurrent climate extremes: Insights from the 2014 California drought. Geophys. Res. Lett. 41, 8847–8852. doi: 10.1002/2014GL062308
Allen, R. G., Pereira, L. S., Raes, D., and Smith, M. (1998). FAO Irrigation and drainage paper No. 56. Rome: Food and Agriculture Organization of the United Nations.
Bales, R. C., Battles, J. J., Chen, Y., Conklin, M. H., Holst, E., O’Hara, K. L., et al. (2011a). Forests and water in the Sierra Nevada: Sierra Nevada watershed ecosystem enhancement project. Merced, CA: Sierra Nevada Research Institute.
Bales, R. C., Hopmans, J. W., O’Geen, A. T., Meadows, M., Hartsough, P. C., Kirchner, P., et al. (2011b). Soil moisture response to snowmelt and rainfall in a Sierra Nevada mixed conifer forest. Vadose Zone J. 10, 786–799. doi: 10.2136/vzj2011.0001
Boisramé, G. F. S., Thompson, S. E., Tague, C., and Stephens, S. L. (2019). Restoring a natural fire regime alters the water balance of a Sierra Nevada catchment. Water Resour. Res. 55, 5751–5769. doi: 10.1029/2018WR024098
Bunn, A. G. (2008). A dendrochronology program library in R (dplR). Dendrochronologia 26, 115–124. doi: 10.1016/j.dendro.2008.01.002
Burke, W. D., Tague, C., Kennedy, M. C., and Moritz, M. A. (2021). Understanding How Fuel Treatments Interact with Climate and Biophysical Setting to Affect Fire, Water, and Forest Health: A Process-Based Modeling Approach. Front. For. Glob. Change 3:591162. doi: 10.3389/ffgc.2020.591162
Cabal, C., Martínez-García, R., de Castro Aguilar, A., Valladares, F., and Pacala, S. W. (2020). The exploitative segregation of plant roots. Science 370, 1197–1199. doi: 10.1126/science.aba9877
California Department of Forestry and Fire Protection [CAL FIRE], (2022). California Forest Practice Rules 2022. Available online at: https://bof.fire.ca.gov/media/y5rfw50b/2022-fpr-and-fpa_ada.pdf (accessed July 15, 2022).
Campbell, J. L., Harmon, M. E., and Mitchell, S. R. (2012). Can fuel-reduction treatments really increase forest carbon storage in the western US by reducing future fire emissions? Front. Ecol. Enviro. 10:83–90. doi: 10.1890/110057
Chen, J., Franklin, J. F., and Spies, T. A. (1995). Growing-season microclimatic gradients from clearcut edges into old-growth Douglas-fir forests. Ecol. Appl. 5, 74–86. doi: 10.2307/1942053
Clark, J. S., Iverson, L., Woodall, C. W., Allen, C. D., Bell, D. M., Bragg, D. C., et al. (2016). The impacts of increasing drought on forest dynamics, structure, and biodiversity in the United States. Glob. Change Biol. 22, 2329–2352. doi: 10.1111/gcb.13160
Clynne, M. A., and Muffler, L. J. P. (2010). Geologic map of Lassen Volcanic National Park and vicinity, California. Reston, VA: U.S. Geological Survey Scientific Investigations. doi: 10.3133/sim2899
Collins, B. M., Das, A. J., Battles, J. J., Fry, D. L., Krasnow, K. D., and Stephens, S. L. (2014). Beyond reducing fire hazard: Fuel treatment impacts on overstory tree survival. Ecol. Appl. 24, 1879–1886. doi: 10.1890/14-0971.1
Crockford, R. H., and Richardson, D. P. (2000). Partitioning of rainfall into throughfall, stemflow and interception: Effect of forest type, ground cover and climate. Hydrol. Process. 14, 2903–2920. doi: 10.1002/1099-1085(200011/12)14:16/17<2903::AID-HYP126>3.0.CO;2-6
Curiel Yuste, J., Baldocchi, D. D., Gershenson, A., Goldstein, A., Misson, L., and Wong, S. (2007). Microbial soil respiration and its dependency on carbon inputs, soil temperature and moisture. Glob. Change Biol. 13, 2018–2035. doi: 10.1111/j.1365-2486.2007.01415.x
Currier, W. R., and Lundquist, J. D. (2018). Snow Depth Variability at the Forest Edge in Multiple Climates in the Western United States. Water Resour. Res. 54, 8756–8773. doi: 10.1029/2018WR022553
Dennison, P. E., Brewer, S. C., Arnold, J. D., and Moritz, M. A. (2014). Large wildfire trends in the western United States, 1984–2011. Geophys. Res. Lett. 41, 2928–2933. doi: 10.1002/2014GL059576
Dickerson-Lange, S. E., Lutz, J. A., Martin, K. A., Raleigh, M. S., Gersonde, R., and Lundquist, J. D. (2015). Evaluating observational methods to quantify snow duration under diverse forest canopies. Water Resour. Res. 51, 1203–1224. doi: 10.1002/2014WR015744
Filella, I., and Peñuelas, J. (2003). Indications of hydraulic lift by Pinus halepensis and its effects on the water relations of neighbour shrubs. Biol. Plant 47, 209–214. doi: 10.1023/B:BIOP.0000022253.08474.fd
Gaffney, R. (2016). Susceptibility of Headwater Catchment Hydrology to Persistent Droughts and Forest Structure Modification – A Plot to Catchment Scale Analysis. Master thesis, Nevada: University of Nevada. Reno. Available online at: http://hdl.handle.net/11714/2320
Grant, G. E., and Dietrich, W. E. (2017). The frontier beneath our feet. Water Resourc. Res. 53, 2605–2609. doi: 10.1002/2017WR020835
Grant, G. E., Tague, C. L., and Allen, C. D. (2013). Watering the forest for the trees: An emerging priority for managing water in forest landscapes. Front. Ecol. Enviro. 11:314–321. doi: 10.1890/120209
Hahm, W. J., Dralle, D. N., Rempe, D. M., Bryk, A. B., Thompson, S. E., Dawson, T. E., et al. (2019). Low subsurface water storage capacity relative to annual rainfall decouples Mediterranean plant productivity and water use from rainfall variability. Geophys. Res. Lett. 46, 6544–6553. doi: 10.1029/2019GL083294
Harpold, A. A., Dettinger, M., and Rajagopal, S. (2017). Defining snow drought and why it matters. Eos Trans. Am. Geophys. Union 98, 15–17. doi: 10.1029/2017EO068775
Harpold, A. A., Molotch, N. P., Musselman, K. N., Bales, R. C., Kirchner, P. B., Lityak, M., et al. (2014). Soil moisture response to snowmelt timing in mixed conifer subalpine forests. Hydrol. Process. 29, 2782–2798. doi: 10.1002/hyp.10400
Harr, R. D. (1983). Potential for augmenting water yield through forest practices in western Washington and western Oregon. J. Am. Water Resour. Assoc. 19, 383–393. doi: 10.1111/j.1752-1688.1983.tb04595.x
Hatchett, B. J., Daudert, B., Garner, C. B., Oakley, N. S., Putnam, A. E., and White, A. B. (2017). Winter Snow Level Rise in the Northern Sierra Nevada from 2008 to 2017. Water 9:899. doi: 10.3390/w9110899
Hood, S. M., Baker, S., and Sala, A. (2016). Fortifying the forest: Thinning and burning increase resistance to a bark beetle outbreak and promote forest resilience. Ecol. Appl. 26, 1984–2000. doi: 10.1002/eap.1363
Horton, J. L., and Hart, S. C. (1998). Hydraulic lift: A potentially important ecosystem process. Trends Ecol. Evol. 13, 232–235. doi: 10.1016/S0169-5347(98)01328-7
Hurteau, M. D., and North, M. (2010). Carbon recovery rates following different wildfire risk mitigation treatments. For. Ecol. Manag. 260, 930–937. doi: 10.1016/j.foreco.2010.06.015
Kane, J. M. (2021). Stand conditions alter seasonal microclimate and dead fuel moisture in a Northwestern California oak woodland. Agric. For. Meteorol. 308–309:108602. doi: 10.1016/j.agrformet.2021.108602
Keppeler, E. T., and Ziemer, R. R. (1990). Logging effects on streamflow: Water yield and summer low flows at Caspar Creek in northwestern California. Water Resour. Res. 26, 1669–1679. doi: 10.1029/WR026i007p01669
Klein, M., Garvelmann, J., and Förster, K. (2021). Revisiting Forest Effects on Winter Air Temperature and Wind Speed—New Open Data and Transfer Functions. Atmosphere 12:710. doi: 10.3390/atmos12060710
Klein, T., Siegwolf, R. T., and Körner, C. (2016). Belowground carbon trade among tall trees in a temperate forest. Science 352, 342–344. doi: 10.1126/science.aad6188
Lundquist, J. D., Dickerson-Lang, S. E., Lutz, J. A., and Cristea, N. C. (2013). Lower forest density enhances snow retention in regions with warmer winters: A global framework developed from plot-scale observations and modeling. Water Resour. Res. 49, 6356–6370. doi: 10.1002/wrcr.20504
Ma, S., Concilio, A., Oakley, B., North, M., and Chen, J. (2010). Spatial variability in microclimate in a mixed-conifer forest before and after thinning and burning treatments. For. Ecol. Manag. 259, 904–915. doi: 10.1016/j.foreco.2009.11.030
Molina, A. J., and del Campo, A. D. (2012). The effects of experimental thinning on throughfall and stemflow: A contribution towards hydrology-oriented silviculture in Aleppo pine plantations. For. Ecol. Manag. 269, 206–213. doi: 10.1016/j.foreco.2011.12.037
Moore, M. M., Covington, W. W., Fulé, P. Z., Hart, S. C., and Kolb, T. E. (2008). “Ecological Restoration Experiments (1992–2007) at the G. A. Pearson Natural Area, Fort Valley Experimental Forest,” in Proceedings of the Fort Valley Experimental Forest—A Century of Research 1908–2008, eds S. D. Olberding and M. M. Moore (Fort Collins, CO: Rocky Mountain Research Station), 282.
Musselman, K., Molotch, N. P., and Brooks, P. D. (2008). Effects of vegetation on snow accumulation and ablation in a mid-latitude sub-alpine forest. Hydrol. Process. 22, 2767–2776. doi: 10.1002/hyp.7050
NASA Jet Propulsion Laboratory (2022). Small-Body Database Lookup: 8216 Melosh (1995 FX14). Available online at: https://ssd.jpl.nasa.gov/tools/sbdb_lookup.html#/?sstr=8216 (accessed on May 19, 2022).
O’Halloran, T. (2018). Impacts of Forest Management on Hydrologic Processes. Master thesis, Nevada: University of Nevada. Reno. Available online at: http://hdl.handle.net/11714/4864
Omnibus Public Land Management Act of 2009 (2009). Public law 111 – 11 – Omnibus public land management act of 2009 H.R. 146, $4003. Washington, DC: U.S. Government Publishing Office.
Oregon Department of Forestry [ODF] (2021). Forest Practice Administrative Rules and Forest Practices Act, Ch. 629, Forest Practices Administration. Availavle online at: https://www.oregon.gov/odf/Documents/workingforests/fpa-rule-book-2021.pdf (accessed July 15, 2022).
Phillips, R. P., Ibanez, I., D’Orangeville, L., Hanson, P. J., Ryan, M. G., and McDowell, N. G. (2016). A belowground perspective on the drought sensitivity of forests: Towards improved understanding and simulation. For. Ecol. Manag. 380, 309–320. doi: 10.1016/j.foreco.2016.08.043
Pollet, J., and Omi, P. N. (2002). Effect of thinning and prescribed burning on crown fire severity in ponderosa pine forests. Int. J. Wildl. Fire 11, 1–10. doi: 10.1071/WF01045
Ponce, S. L., and Meiman, J. R. (1983). Water yield augmentation through forest and range management-issues for the future. J. Am. Water Resour. Assoc. 19, 415–419. doi: 10.1111/j.1752-1688.1983.tb04598.x
Prichard, S. J., Peterson, D. L., and Jacobson, K. (2010). Fuel treatments reduce the severity of wildfire effects in dry mixed conifer forest, Washington, USA. Can. J. For. Res. 40, 1615–1626. doi: 10.1139/X10-109
PRISM Climate Group (2019). PRISM Climate Data. Available online at: http://prism.oregonstate.edu, (accessed on February 9, 2019).
R Core Team (2020). R: A language and environment for statistical computing. Vienna: R Foundation for Statistical Computing.
Rodríguez-Iturbe, I., and Porporato, A. (2007). Ecohydrology of water-controlled ecosystems: Soil moisture and plant dynamics. Cambridge: Cambridge University Press.
Rose, T. P., and Davisson, M. L. (1996). Radiocarbon in hydrologic systems containing dissolved magmatic carbon dioxide. Science 273, 1367–1370. doi: 10.1126/science.273.5280.1367
Rose, T. P., Davisson, M. L., and Criss, R. E. (1996). Isotope hydrology of voluminous cold springs in fractured rock from an active volcanic region, northeastern California. J. Hydrol. 179, 207–236. doi: 10.1016/0022-1694(95)02832-3
Serpa, B. (2020). Impacts Of Forest Thinning on Ecohydrological Processes in The Soil-Tree-Atmosphere Continuum – A Plot Scale Analysis. Master thesis., Nevada: University of Nevada. Reno. Available online at: http://hdl.handle.net/11714/7571
Siirila-Woodburn, E. R., Rhoades, A. M., Hatchett, B. J., Huning, L. S., Szinai, J., Tague, C., et al. (2021). A low-to-no snow future and its impacts on water resources in the western United States. Nat. Rev. Earth Environ. 2, 800–819. doi: 10.1038/s43017-021-00219-y
Simonin, K., Kolb, T. E., Montes-Helu, M., and Koch, G. W. (2007). The influence of thinning on components of stand water balance in a ponderosa pine forest stand during and after extreme drought. Agric. For. Meteorol. 143, 266–276. doi: 10.1016/j.agrformet.2007.01.003
Skog, K. E., Barbour, R. J., Abt, K. L., Bilek, E. T., Burch, F., Fight, R. D., et al. (2006). “Evaluation of silvicultural treatments and biomass use for reducing fire hazard in western states,” in Research Paper FPL-RP-634, (Madison, WI: US Department of Agriculture), 29. doi: 10.2737/FPL-RP-634
Stephens, S. L., Moghaddas, J. J., Edminster, C., Fiedler, C. E., Haase, S., Harrington, M., et al. (2009). Fire treatment effects on vegetation structure, fuels, and potential fire severity in western US forests. Ecol. Appl. 19, 305–320. doi: 10.1890/07-1755.1
Stephens, S. L., Thompos, S., Boisrame, G., Collins, G., Ponisio, L., and Rakhmatulina, R. (2021). Fire, water, and biodiversity in the Sierra Nevada: A possible triple win. Environ. Res. Commun. 3:081004. doi: 10.1088/2515-7620/ac17e2
Stokes, M. A., and Smiley, T. L. (1968). An introduction to tree-ring dating. Chicago: University of Chicago Press.
Tague, C. L., Moritz, M., and Hanan, E. (2019). The changing water cycle: The eco-hydrologic impacts of forest density reduction in Mediterranean (seasonally dry) regions. Wiley Interdiscip. Rev. Water 6:e1350. doi: 10.1002/wat2.1350
Tague, C. L., and Moritz, M. A. (2019). Plant accessible water storage capacity and tree-scale root interactions determine how forest density reductions alter forest water use and productivity. Front. For. Glob. Change 2:36. doi: 10.3389/ffgc.2019.00036
Troendle, C. A. (1983). The potential for water yield augmentation from forest management in the Rocky Mountain Region. J. Am. Water Resour. Assoc. 19, 359–373. doi: 10.1111/j.1752-1688.1983.tb04593.x
Troendle, C. A., and King, R. M. (1987). The effect of partial and clearcutting on streamflow at Deadhorse Creek. Colorado. J. Hydrol. 90, 145–157. doi: 10.1016/0022-1694(87)90177-6
Troendle, C. A., Wilcox, M. S., Bevenger, G. S., and Porth, L. S. (2001). The Coon Creek water yield augmentation project: Implementation of timber harvesting technology to increase streamflow. For. Ecol. Manag. 143, 179–187. doi: 10.1016/S0378-1127(00)00516-8
Tsamir, M., Gottlieb, S., Preisler, Y., Rotenberg, E., Tatarinov, F., Yakir, D., et al. (2019). Stand density effects on carbon and water fluxes in a semi-arid forest, from leaf to stand-scale. For. Ecol. Manag. 453:117573. doi: 10.1016/j.foreco.2019.117573
USDA Forest Service, Pacific Southwest Region (1994). Soil Survey of Lassen National Forest Area, California. Vallejo, CA: USDA Forest Service. Available online at: https://www.nrcs.usda.gov/Internet/FSE_MANUSCRIPTS/california/lassenNFCA1982/lassenNFCA1982-I.pdf (accessed September 30, 2022).
USDA Forest Service, Pacific Southwest Region (2004). Sierra Nevada Forest Plan Amendment, Final Supplemental Environmental Impact Statement (FSEIS). Vallejo, CA: USDA Forest Service. Available online at: https://www.fs.usda.gov/detail/r5/landmanagement/planning/?cid=STELPRDB5349922 (accessed September 30, 2022).
USDA Forest Service, Lassen National Forest (2008). North 49 Forest Health Recovery Project Final Environmental Impact Statement (FEIS). Susanville, CA: USDA Forest Service. Available online at: https://data.fs2c.usda.gov/nepaweb/nepa_project_exp.php?project=15487 (accessed September 30, 2022).
USDA Forest Service, Lassen National Forest (2011). Burney–Hat Creek Basins Project: A Collaborative Forest Landscape Restoration Program Proposal. Susanville, CA: USDA Forest Service. Available online at: https://studylib.net/doc/10420138/burney-hat-creek-basins-project%E2%80%93a-collaborative-forest-l (accessed September 30, 2022).
USDA Forest Service (2014). Common stand exam field guide. Natural resource information system: Field sampled vegetation. Washington, DC: USDA Forest Service. Available online at: https://www.fs.usda.gov/nrm/fsveg/index.shtml (accessed September 30, 2022).
Vereecken, H., Kasteel, R., Vanderborght, J., and Harter, T. (2007). Upscaling hydraulic properties and soil water flow processes in heterogeneous soils: A review. Vadose Zone J. 6, 1–28. doi: 10.2136/vzj2006.0055
Westerling, A. L., Hidalgo, H. G., Cayan, D. R., and Swetnam, T. W. (2006). Warming and earlier spring increase western US forest wildfire activity. Science 313, 940–943. doi: 10.1126/science.1128834
White, P. (2022). Former District Culturist for Hat Creek Ranger District, Lassen National Forest Personal communication—email to S.J. Wheelock documenting recollections of timber sale reports from historical files and District activities during his tenure. personal communication.
Wickham, H., Averick, M., Bryan, J., Chang, W., McGowan, L., François, R., et al. (2019). Welcome to the tidyverse. J. Open Source Softw. 4:1686.
Yamaguchi, D. K. (1991). A simple method for cross-dating increment cores from living trees. Can. J. For. Res. 21, 414–416. doi: 10.1139/x91-053
Young, D., Dillingham, C., and Zhang, J. (2012). HFQLG Soil Moisture Monitoring–August 2009 to September 2012. Available online at: https://nanopdf.com/download/hfqlg-soil-moisture-monitoring-aug-2009-to-sep-2012_pdf (accessed September 30, 2022).
Keywords: forest management, climate change, soil moisture, thinning, California (United States), drought, wildfire risk, fuels reduction
Citation: Hardage K, Wheelock SJ, Gaffney R, O’Halloran T, Serpa B, Grant G, Coppoletta M, Csank A, Tague C, Staudacher M and Tyler S (2022) Soil moisture and micrometeorological differences across reference and thinned stands during extremes of precipitation, southern Cascade Range. Front. For. Glob. Change 5:898998. doi: 10.3389/ffgc.2022.898998
Received: 18 March 2022; Accepted: 24 August 2022;
Published: 28 October 2022.
Edited by:
Charles Rhett Jackson, University of Georgia, United StatesReviewed by:
Taehee Hwang, Indiana University Bloomington, United StatesOsbert Jianxin Sun, Beijing Forestry University, China
Copyright © 2022 Hardage, Wheelock, Gaffney, O’Halloran, Serpa, Grant, Coppoletta, Csank, Tague, Staudacher and Tyler. This is an open-access article distributed under the terms of the Creative Commons Attribution License (CC BY). The use, distribution or reproduction in other forums is permitted, provided the original author(s) and the copyright owner(s) are credited and that the original publication in this journal is cited, in accordance with accepted academic practice. No use, distribution or reproduction is permitted which does not comply with these terms.
*Correspondence: Shawn J. Wheelock, shawn.wheelock@usda.gov
†Present addresses: Kyle Hardage, Department of Water Resources, Sacramento, CA, United States; Rowan Gaffney, UNAVCO, Boulder, CO, United States; Theresa O’Halloran, Environmental Management and Planning Solutions, Inc., Reno, NV, United States; Benjamin Serpa, Yavapai County Flood Control District, Prescott, AZ, United States