Drone microrelief analysis to predict the presence of naturally regenerated seedlings
 Tereza Hüttnerová
 Robert Muscarella
 Peter Surový
- 1Faculty of Forestry and Wood Sciences, Czech University of Life Sciences Prague, Prague, Czechia
- 2Department of Plant Ecology and Evolution, Evolutionary Biology Center, Uppsala University, Uppsala, Sweden
Three-dimensional (3D) mapping and unmanned aerial vehicles (UAVs) are essential components of the future development of forestry technology. Regeneration of forest stands must be ensured according to the law in the required quality and species composition. Forest management focuses on the optimization of economic costs and quality-assured seedlings. Predicting the suitability of the plots’ environment for natural forest regeneration can contribute to better strategic planning and save time and money by reducing manual work. Although the savings may be considered negligible on small forested plots, they are significant for large cleared areas, such as those harvested after large beetle infestations or strong windstorms, which are increasingly common in European forests. We present a methodology based on spatial analysis and 3D mapping to study the microrelief and surrounding of recently cleared areas. We collected data on four plots in the spring and autumn of a single year after the harvest of four Norway spruce [Picea abies (L.) Karst.] stands near Radlice, Czechia using a multirotor Phantom 4 Pro UAV with a red, green, blue (RGB) camera. We used RGB imagery to compute microrelief data at a very high spatial resolution and the surrounding forest stands after harvesting. We used the microrelief data to estimate the amount of water accumulation and incoming solar radiation across the sites. Based on presence data of newly-established seedlings, we used linear mixed effects models to create a suitability map for each site. Model variables included topographic wetness index, solar area radiation, fencing, type of soil preparation, and distance to the nearest mature forest edge. The topographic wetness index and fencing had strong positive influence on seedling establishment, while solar radiation had a negative influence. Our proposed methodology could be used to predict spontaneous regeneration on cleared harvest areas, or it can estimate how much area is suitable for regeneration, which can lead to important investment decisions.
1 Introduction
Forests are among the most valuable terrestrial ecosystems, but they are also highly susceptible to potential threats and damage. For example, the long lifespan of trees means that they are unable to quickly adapt to damaging human practices and natural disturbances related to climate change. It is predicted that Europe’s forests will experience an increase in the occurrence of storms, fires, and insect pests (Seidl et al., 2014; European Commission and Joint Research Centre, 2020; Huo et al., 2021). The primary consequences may include the reduced resistance of forest ecosystems and associated communities and processes, and also a depleted and less predictable wood supply. Predicting natural responses to these changes and responding in a timely manner will be critical to help sustain the many benefits provided by forest ecosystems. Therefore, it is essential to restore quality forest habitats in a timely and efficient manner. To maximize regeneration efforts, it is advisable to minimize seedling death or failure during the early establishment phases of reforestation. Typically, manual treatment of entire areas is conducted to re-establish trees, but this is physical, time-consuming, and financially costly.
The forest regeneration plan must follow the binding decrees and reflect the prescribed standards. The minimum number of trees must be preserved in individual areas, which Decree No. 456/2021 Coll determines. In the framework of regeneration, forest management is guided by a target management set of stands, in which are determined by different forest stands with similar or the same climatic and soil conditions (Sequens, 2007). Natural regeneration of forest stands can be an effective, cost-efficient means to reforest disturbed stands, but it is highly variable and dependent on several factors, including seed availability, browsing pressure, and other site-specific factors, such as soil type, aspect, and slope, which affect microsite quality (Hanssen, 2003; Březina and Dobrovolný, 2011; Çalışkan et al., 2014; Vacek et al., 2014). The identification of potential areas of natural regeneration through environmental suitability analysis can improve the efficiency of site preparation and afforestation needs, and reduce associated costs.
The cost effectiveness of unmanned aerial vehicles (UAVs) for mapping forest stand characteristics allows for an innovative approach to quickly evaluate relatively small areas (100 s of sq. km) with high spatial resolution. Multirotor UAVs can carry various types of sensors weighing several kilograms, and they have excellent maneuverability, including the benefit of a vertical take-off and landing, which is important in a forest environment. A limiting factor with the multirotor UAVs can be that increased sensor weights reduce operating time, thus leading to a smaller mapping area.
The light detection and ranging (LiDAR) sensor can accurately map vertical forest canopy structure, including the tree canopy, the ground below the trees, and the space between canopy and ground (Brede et al., 2017; Wieser et al., 2017). A hyperspectral camera is used for species classification (Hycza et al., 2018; Tusa et al., 2019). Multispectral cameras can help evaluate the health status of forest stands through vegetation indices (Klouček et al., 2019; Junttila et al., 2022). A financially inexpensive option is cameras with RGB channels that can monitor the area in the visible spectrum. Using the structure-from-motion (SfM) metric, a very accurate 3D terrain model can be created. Information on topographic variables (digital elevation model, slope, and aspect) and other metrics, such as solar radiation and topographic wetness index, can be obtained from high resolution 3D models, all of which can be compiled to provide valuable information for species distribution models (SDMs).
Species distribution models evaluate the relationship between environmental variables and presence data on occurrence (or occurrence and absence data; Franklin and Miller, 2009; Franklin, 2010). Algorithms for SDMs are diverse and depend on the types of occurrence data, the range and quality of environmental variables, and study objectives. Algorithms are based on the extrapolation of values from environment variables in the places where the species occurs. These models have been used for predicting species distributions and richness, evaluating the correlation of environmental variables and occurrence data, and the dispersal of species to other areas (Wollan et al., 2008; Elith et al., 2011; Falk and Mellert, 2011). To predict the occurrence of a species or determine the suitability of a habitat for any given species, it is necessary to know terrain variables and predictors that affect growth, which are primarily influenced by water and solar radiation.
Solar radiation has a significant impact on site water balance through heating water, soil medium, evapotranspiration, melting snow, and ice, and, thus, it also has a strong influence on the establishment and presence of vegetation (Guisan and Zimmermann, 2000; Meentemeyer et al., 2001; Brang et al., 2005; Lebourgeois, 2007; Piedallu and Gégout, 2007). Solar radiation can be measured using ground meteorological stations and then the data can be interpolated for the given data area (Thornton et al., 2000; Piedallu and Gégout, 2007), although the limited number of point measurements cannot sufficiently characterize the terrain variability, and there is a significant distortion of solar radiation maps (Fu and Rich, 2002). Geographic information system (GIS) tools can more accurately map incident solar radiation because they work with the detailed morphology of the terrain, and they can also include the degree of cloud cover in the calculation (Zhu, 2016).
We hypothesized that features of the terrain relief, soil treatment, and fencing would influence the presence of naturally occurring seedlings. We assumed that areas with appropriate levels of soil moisture and sunlight would increase the probability of occurrence, and that fencing would have a positive effect on survival due to the protection of vegetation from browsing by deer. However, areas of excessive moisture can reduce the number of seedlings. The main objectives of this research were (1) to create terrain models based on the Structure from motion metric and to perform raster analyses of water accumulation and solar potential, and (2) to evaluate which factors influence the presence of naturally regenerated seedlings based on data obtained from a UAV. We assessed the correlation between vegetation establishment and microsite conditions to identify areas that would require limited intervention (e.g., no site preparation) to reforest.
We asked the following specific research questions:
1. Can a drone with an RGB camera provide accurate enough micro-relief information based on Structure from Motion metrics?
2. Is it possible to evaluate the importance of predictors for evaluating naturally regenerated trees based on a generalized linear mixed-effects model?
2 Materials and methods
2.1 Study area
The study area, Kamenný vrch (456 m above sea level), is located near Radlice, Kolín district, Czech Republic (Figure 1); the forested area is used for forestry research and education. Four plots with a size of 0.74–1.32 ha were selected for treatment and their overstories, dominated by Norway spruce [Picea abies (L.) Karst.], were felled in early 2021. Natural regeneration of the forest without planting was monitored in these plots (Figure 2). Plots no. 1 and no. 4 have a target management set of stands of 43—Acid habitats of medium positions, and plots no. 2 and no. 3 have a target management set of stands of 45—Nutritional habitats of medium positions.
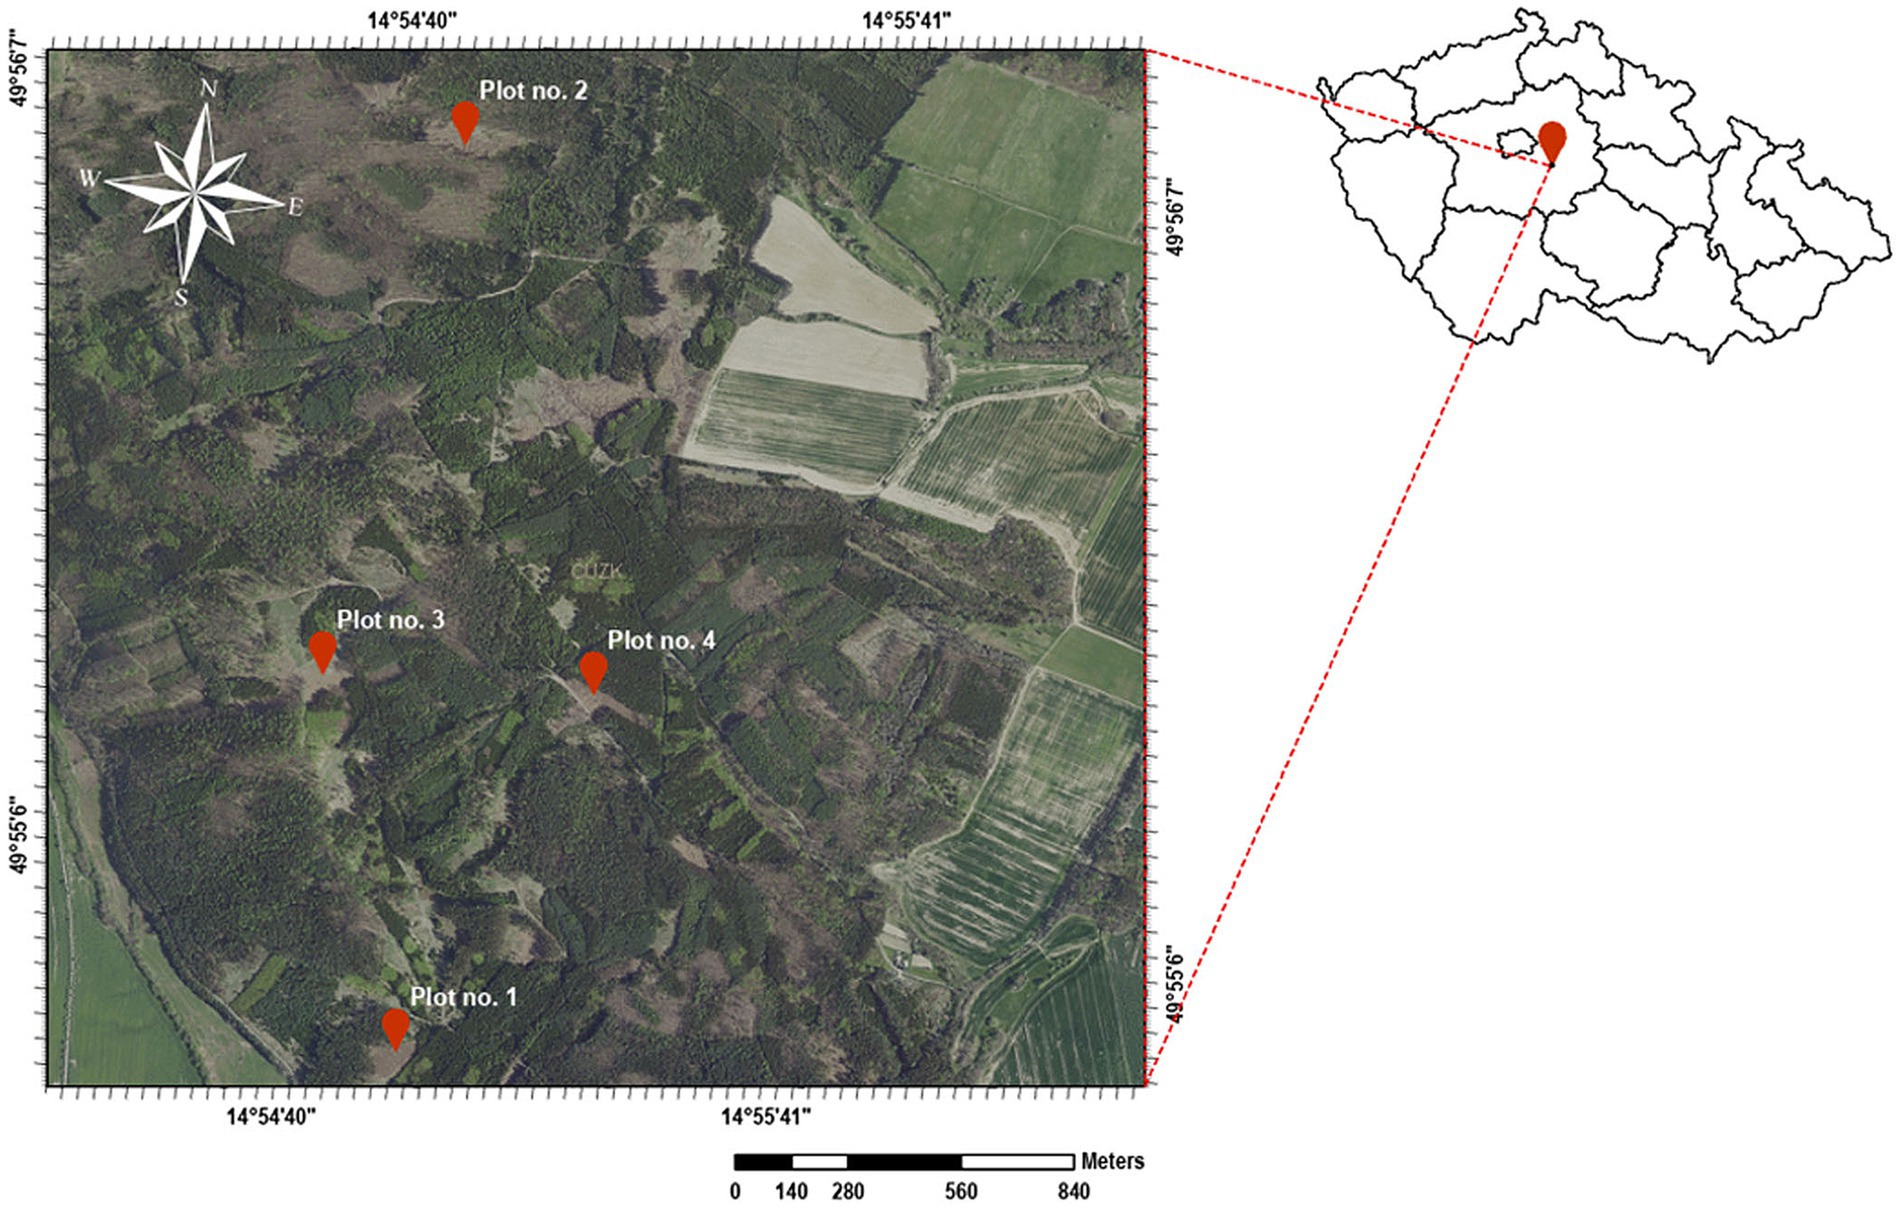
Figure 1. Study area near Radlice, Kolín district, Czech Republic displaying felled plots were left to regenerate naturally; Data source: Czech Office for Surveying, Mapping, and Cadastre.
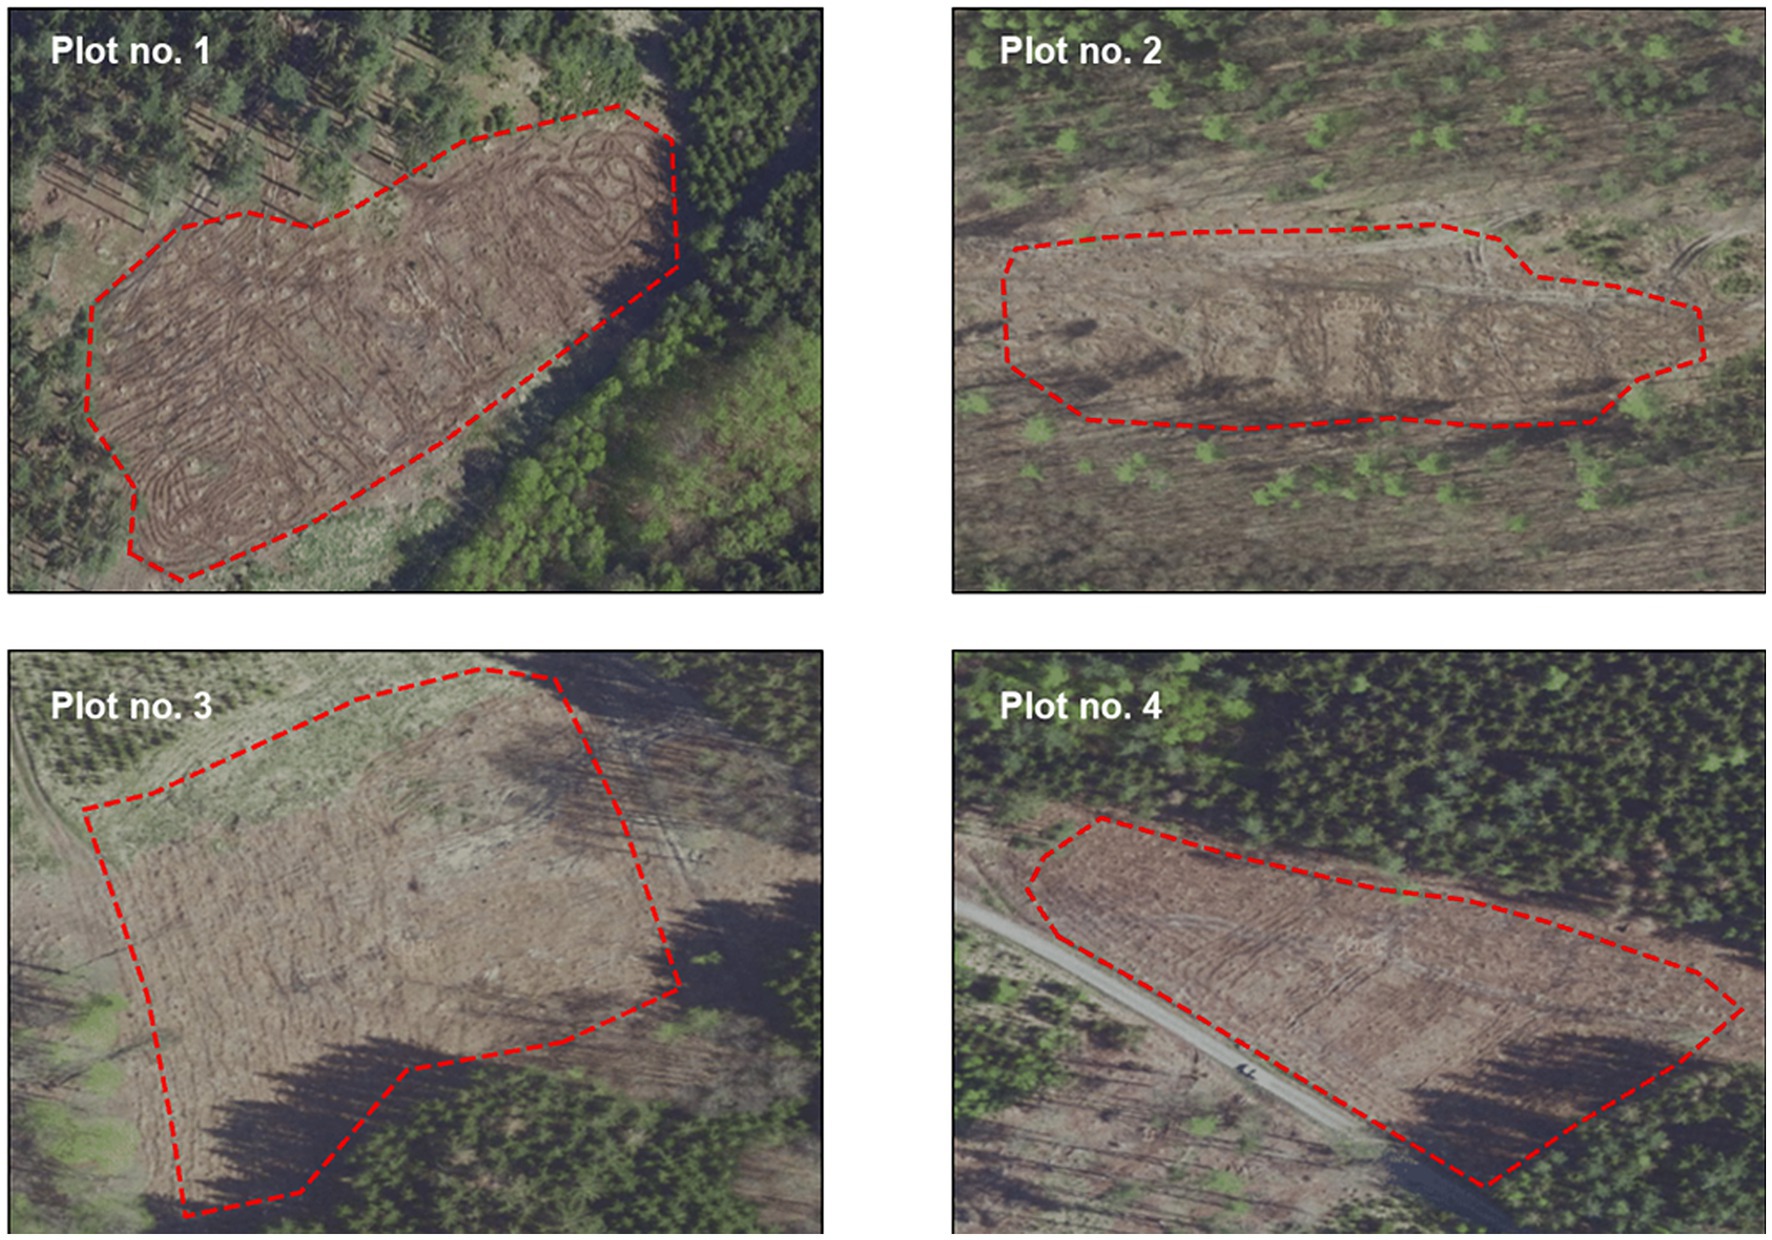
Figure 2. Individual plots shown after felling in 2021, harvesting took place at the end of 2020; data source: Czech Office for Surveying, Mapping, and Cadastre.
Based on the target management set of stands, the planned restoration for plot no. 1 was as follows: Norway spruce 50%, European beech [Fagus sylvatica (L.)] 35%, European larch [Larix decidua (Mill.)] 10%, and largeleaf linden [Tilia platyphyllos (Scop.)] 5%; for plot no. 2: Norway spruce 65%, European beech 35%; for plot no. 3: Norway spruce 65%, European beech 35%, for plot no. 4: Norway spruce 65% and European beech 35%. For all plots, it is recommended to have a minimum of 35% improving and stabilizing species.
The species representation was determined based on experimental circular plots, where the percentage of individual species was determined. In plots no. 1 and no. 4 (CHS 43), a slightly predominant species composition of Norway spruce (40%) was recorded, followed by European larch 38%, European white birch [Betula pendula (Roth)] 4%, European aspen [Populus tremula (L.)] 2% and others 15%: Scots pine [Pinus sylvestris (L.)], European beech, English oak [Quercus robur (L.)], durmast oak [Quercus petraea (Mattuschka) Liebl.], littleleaf linden [Tilia cordata (Mill.)], largeleaf linden, European hornbeam [Carpinus betulus (L.)], goat willow [Salix caprea (L.)]. Plots no. 2 and no. 3 (CHS 45) were dominated by Norway spruce 74%, European aspen 2%, European larch 2%, and others 23% Scots pine, European beech, English oak, durmast oak, littleleaf linden, largeleaf linden, European hornbeam, and goat willow. Most of the naturally regenerated trees were 1-year-old, with the exception of soliters (up to 1%) that remained after harvesting.
The most regenerated tree species in the plots is Norway spruce, a intermediately shade-intolerant species when young but becomes more shade-tolerant as it matures and it requires regular moisture, especially during its early years of growth (Lebourgeois et al., 2010; Lévesque et al., 2013; Yang et al., 2020). Adequate water availability is crucial for its establishment and initial development; later, it has a higher tolerance to summer drought stress (Battipaglia et al., 2009). Norway spruce competes well with other tree species in mixed forests but can also form pure stands under suitable conditions. It reproduces by seeds, which are typically dispersed by wind (Caudullo et al., 2016).
In plots 1 and 4, European larch is also represented on a larger scale, which is relatively shade-intolerant (Ellenberg, 2009; Fellner et al., 2016). It prefers full sunlight for optimal growth and development. European larch requires adequate moisture, it does well in areas with moderate to high precipitation but can also tolerate periods of drought once established. It can grow in mixed forests alongside other tree species or form pure stands. It is often found in association with other coniferous and broadleaf trees in mid-to-high altitudes (Lévesque et al., 2013). European larch reproduces by seeds, with cones that disperse the seeds (Da Ronch et al., 2016).
Detailed characterization of research plots is written in Table 1.
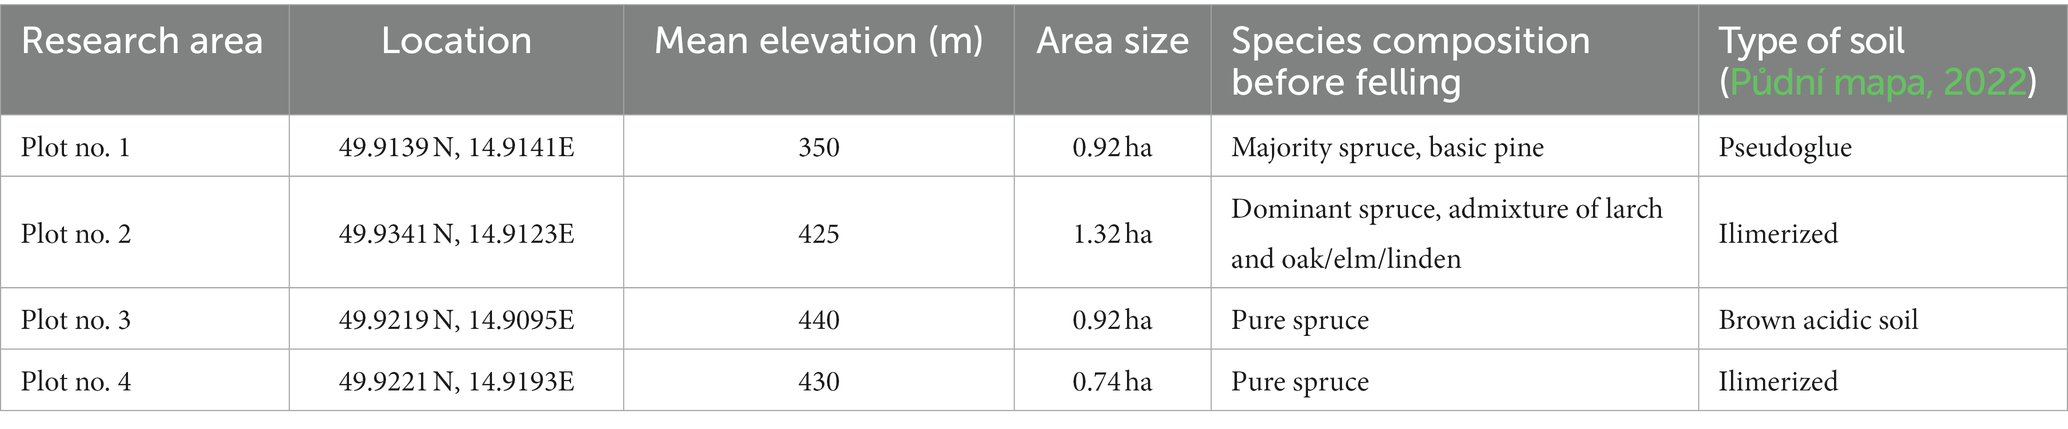
Table 1. Descriptive characteristics of individual plots (ÚHÚL, 2022).
The mean annual temperature of the study area in 2021 was 8.7°C; the long-term average temperatures in the Central Bohemian Region and Prague is 9°C (Czech Hydrometeorological Institute, 2022). The maximum temperature, 19°C, was recorded in July, and the minimum temperature, −0.3°C, was recorded in January and February. The mean annual precipitation in 2021 was 627 mm, whereas the long-term average in the region is 583 mm (Czech Hydrometeorological Institute, 2022).
The forest stands were harvested due to natural disturbance (bark beetle infestation) at the beginning of 2021; in the spring of 2021, the first data collection took place with a UAV to evaluate the state of the microrelief, determine the topographic wetness index and solar radiation. At the end of 2021, a second collection was carried out, during which the regenerated seedlings were evaluated, and the remaining predictors determined. After harvesting, all plots were subdivided for alternative treatments (refer to Figure 3). The plot was subdivided into halves by a narrow strip (D; 2 m) that was neither fenced nor treated in any manner. One half of the plot was fenced (E, F, G), while the other half (A, B, C) was left unfenced to evaluate the effects of ungulate browsing. For areas A and E, branches were cleared away and the soil was actively prepared with slow-moving single-disk soil cutters. For areas B and F, only larger branches were cleared with no soil treatments. For areas C and G, the soil was prepared with a plow. Plow (mostly plowing plate with 12 teeth) is used in interaction with the agricultural tractor and there is the possibility of adjusting the tilting of the plate from 20 to 45°. Slow-moving single-disk soil cutters are intended for strip soil preparation for reforestation with strong disturbance and calamity areas.
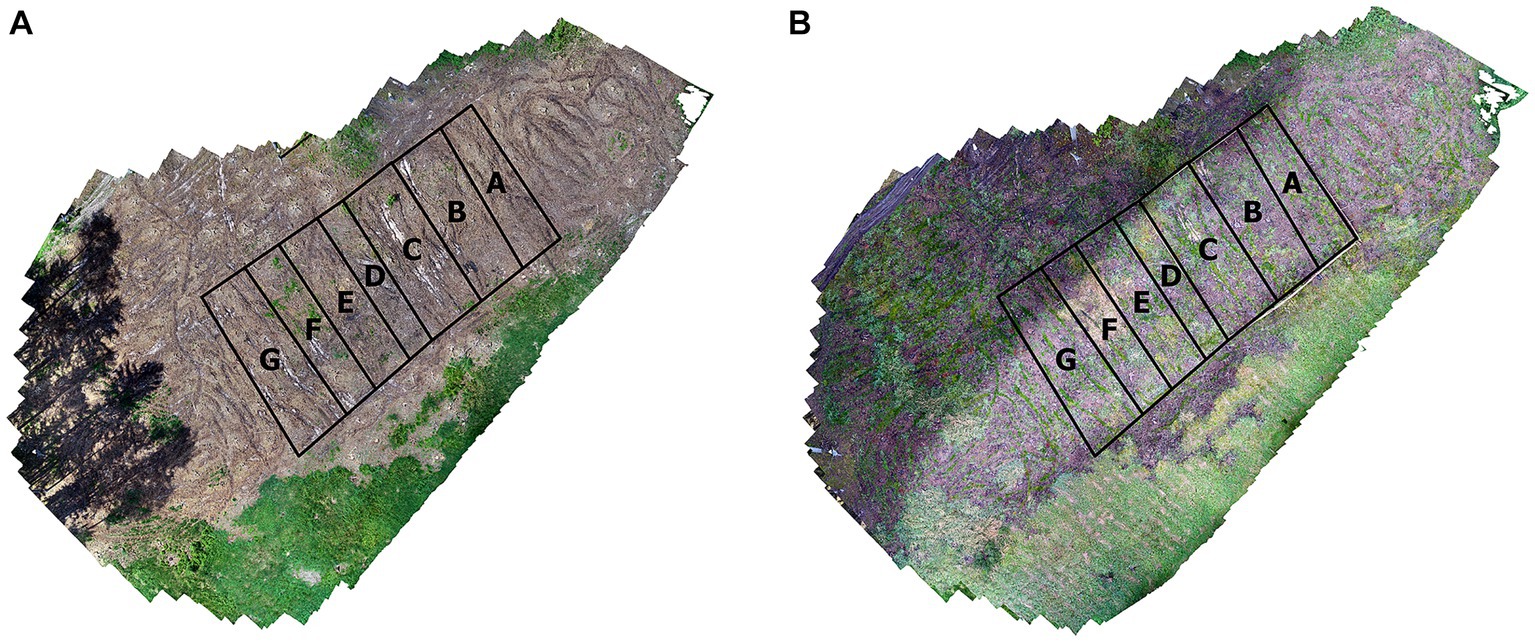
Figure 3. Schematic of the post-harvesting preparation of soil, left image spring 2021 (A), right image spring 2022 (B).
2.2 Data acquisition
To acquire natural regeneration data for each plot, we used a multirotor DJI Phantom 4 Pro (©2022 SZ DJI Technology Co., Ltd., Shenzhen, China) with an integrated 20 megapixel RGB camera with the following parameters: lens: FOV 84° 8.8/24 mm (35 mm format equivalent) f/2.8–f/11 auto focus at 1 m—∞, physical pixel size of 4,096 μm × 2,160 μm, focal length of 8.8/24 mm, and 1″ CMOS.
The proposed method requires very high spatial resolution to evaluate the microrelief and natural regeneration of forest stands. We used a multirotor UAV for data collection because of its high maneuverability, although flight time was limited to about 30 min (Pajares, 2015; Burgués and Marco, 2020). Data were acquired in 2021, once in the spring and again during autumn. For each plot, two flights were conducted; one at 15 m above the ground using hovering and capture mode to collect data on the microrelief, and a second flight at 110 m above the ground for capturing a broader of the plot and the surrounding areas.
Flight missions were planned in the application DJI Ground Station Pro (©2022 SZ DJI Technology Co., Ltd.: Shenzhen, China) with the following parameters:
1. Low flight: Front Overlap Ratio: 85%, Side Overlap Ratio: 85%, Flight Speed: 5.0 m/s, Height above the ground: 15 m, Accuracy: 0.4 cm/pix, and Capture Mode: Hover and Capture at a Point (Figure 4A).
2. High flight: Front Overlap Ratio: 85%, Side Overlap Ratio: 85%, Flight Speed: 8.8 m/s, Height above the ground: 110 m, Accuracy: 0.4 cm/pix, and Capture Mode: Capture without hovering (Figure 4B).
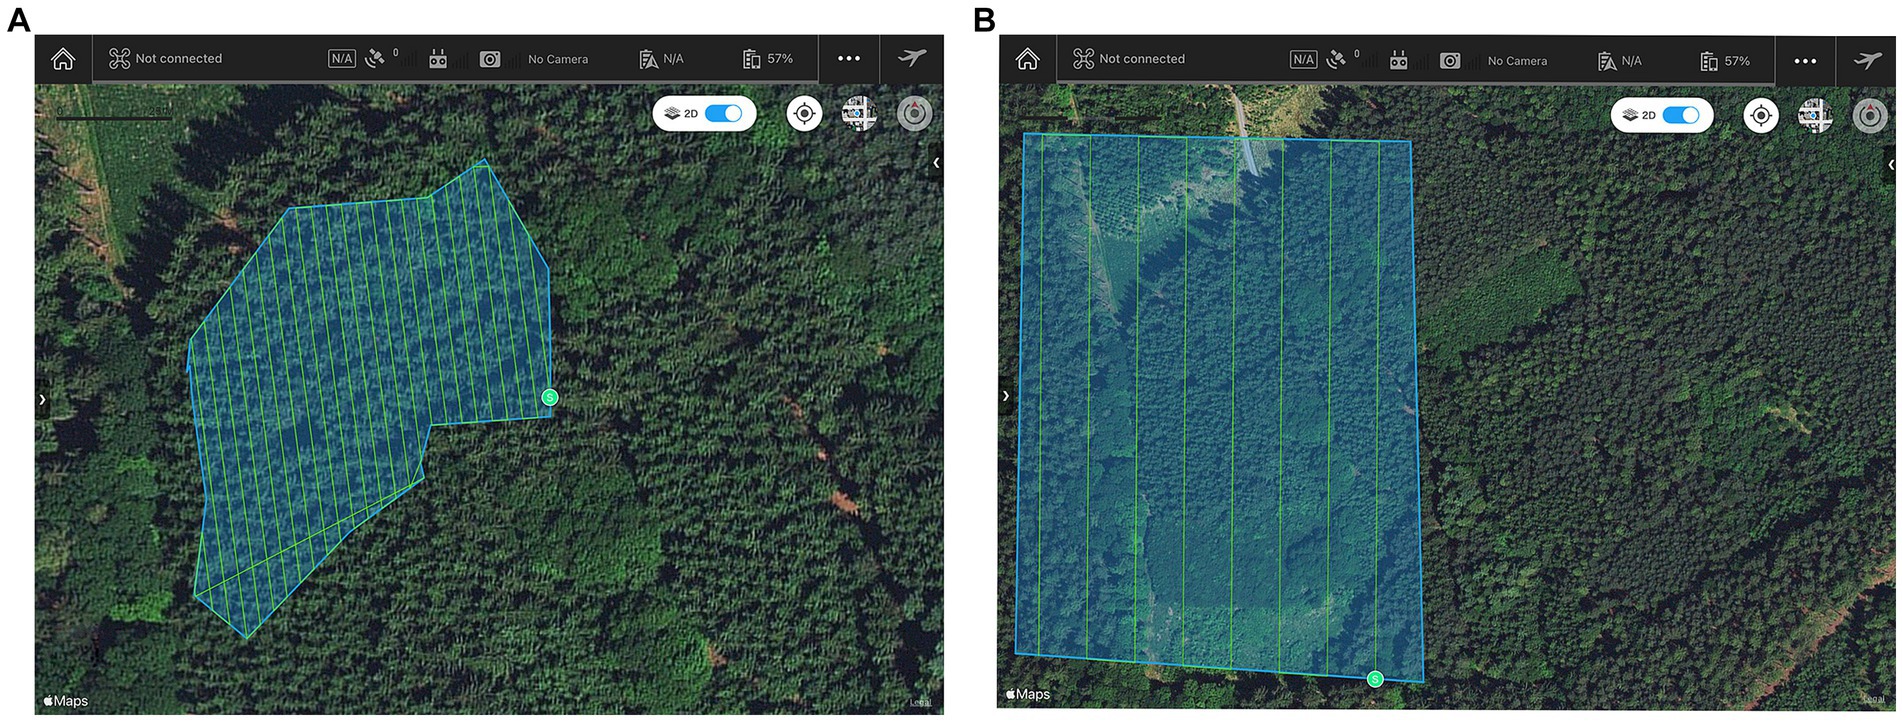
Figure 4. Flight mission in plot no. 3 at a height of 15 m (A) and a height of 110 m (B).
2.3 Data processing and statistical analyses
The data were initially processed using structure-from-motion (SfM) in the Agisoft Metashape software (©2022 Agisoft, LLC, St. Petersburg, Russia) to create a point cloud, a dense cloud, 3D maps, and a digital surface model (DSM). Properties was set to alignment: medium, medium-quality dense cloud. Accuracy of align photos was medium, key points 40,000, tie points 4,000 with generic preselection, reference preselection, and reset current alignment chosen. Dense Cloud was built in medium quality with Mild Depth Filtering. The DSM was created in coordinate system WGS 84 (EPSG: 4326), and an orthomosaic was created from the DSM surface using the blending mode Mosaic. We then manually specified the position of the images using markers (8 on each plot) uniformly distributed throughout the area to increase the precision of the models to the order of centimeters (Figure 5).
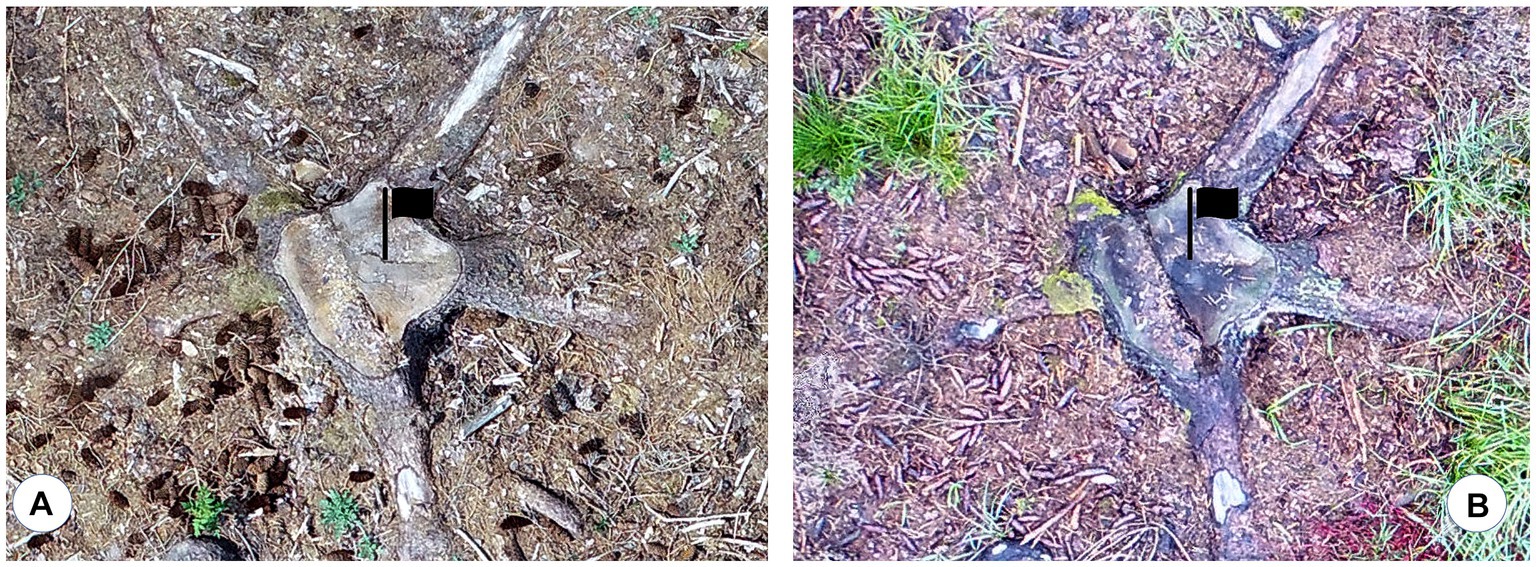
Figure 5. Manually-created marker points with which we refined the positions of the images: left plate is spring 2021 (A), right plate is spring 2022 (B).
We then analyzed the data using the spatial and hydrology analytical tools in ArcGIS Pro 2.8.3 (©2022 ESRI Inc., Redlands, CA, United States). Water accumulation was determined at the level of microrelief, as represented by the calculated topographic wetness index (TWI; Figure 6).
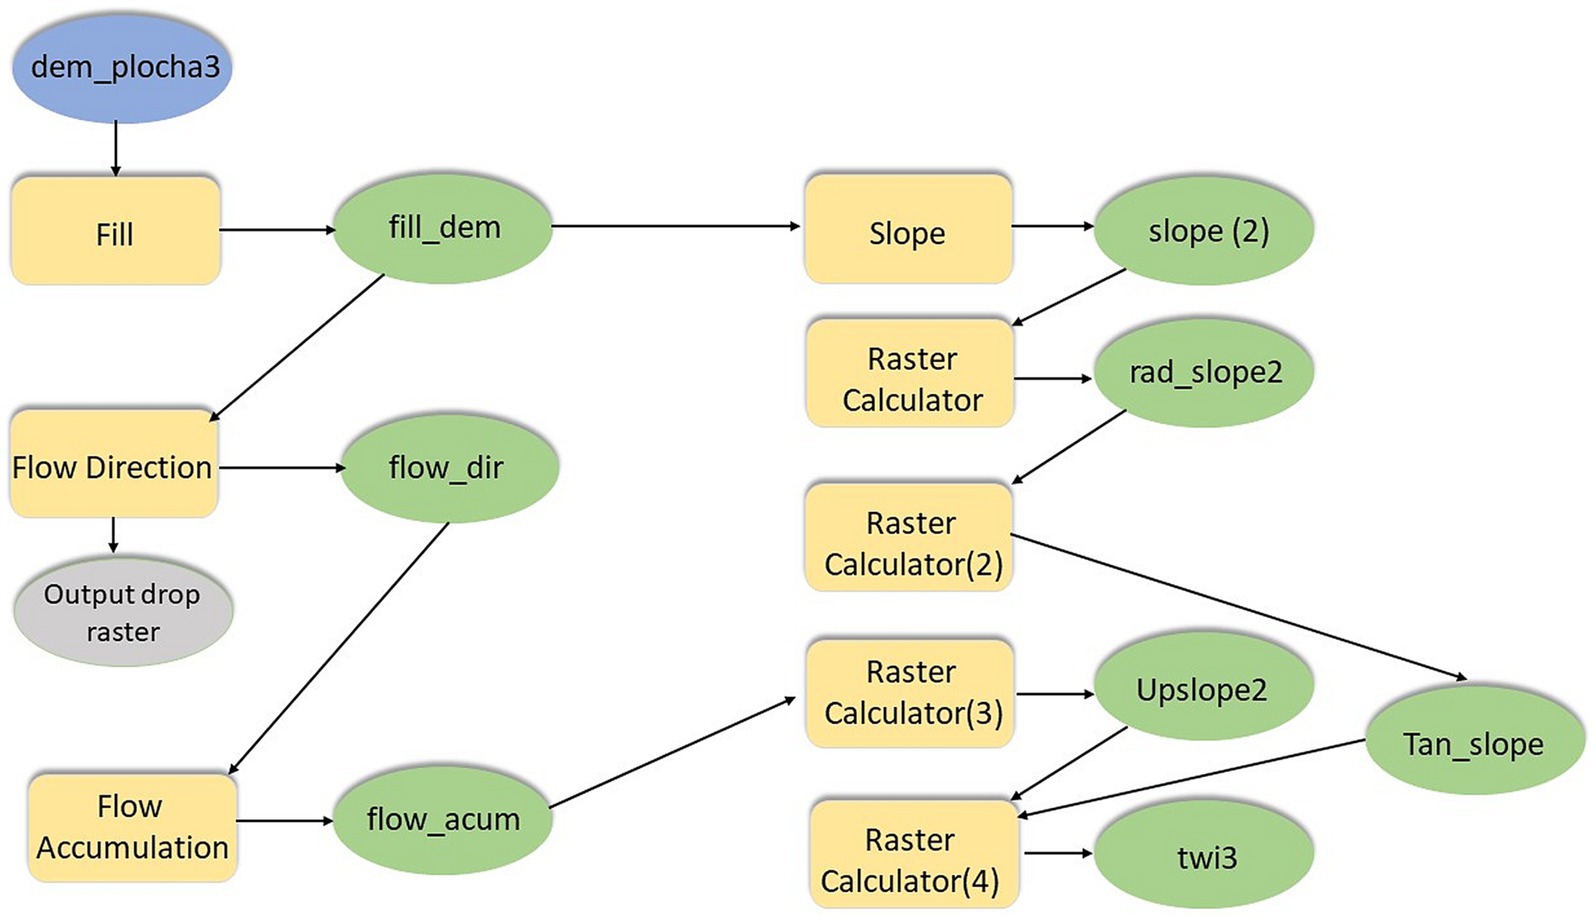
Figure 6. Schema for calculation of the topographic wetness index.
The TWI metric was calculated using a multistep process based on a combination of the estimated slope angle and the raster map to evaluate upslope areas for calculating flow accumulation. Using ArcGIS Pro, the digital terrain model was initially modified with the Fill function. Subsequently, a raster of the water flow direction in the given area was calculated using Flow Direction. The calculated Flow Accumulation raster represented the number of cells through which water flows. The Slope was then determined from the digital model of the terrain with degrees were chosen as the unit of measure. TThe Slope was then expressed in radians by the following formula (Equation 1) in the Raster Calculator:
The slope tangent was then calculated by Equation 2:
Raster flow accumulation was rescaled according to the resolution of the raster and to avoid zeros values (Equation 3):
In the final step, TWI was calculated using the following formula (Equation 4) in the raster calculator:
TWI values typically range from 3 to 30. To avoid undefined areas due to zero values for flow accumulation or zero slope, Equation 5 was used:
The resultant value (0.00565) corresponds to a plane and slope close to zero.
Solar radiation was calculated using the Area Solar Radiation function from the Spatial Analyst tool. The raster of potential exposure was used to determine suitability for various light-demanding or shade-bearing species. Plot No. 1 is on a gentle slope with southwest exposure, Plot No. 2 is on a level to steep slope with west exposure, Plot No. 3 is on a gentle to steep slope with southeast exposure, and Plot No. 4 is on a gentle slope with southeast exposure.
Presence data of naturally-regenerated seedlings were determined manually based on orthomosaics. Automatic classification was not an effective approach in this case because the presence data (i.e., number of seedlings) was rather sparse and insufficient to create training sets for the classification model. We created a vector polygon layer delineating the various treatment areas based on accurate orthomosaics. Furthermore, a vector point layer was created in which records of the presence of recovered seedlings were stored. We generated absence points (2,000 per plot) using the randomPoints function of the dismo (Hijmans et al., 2023) package in R Studio software (Figure 7).
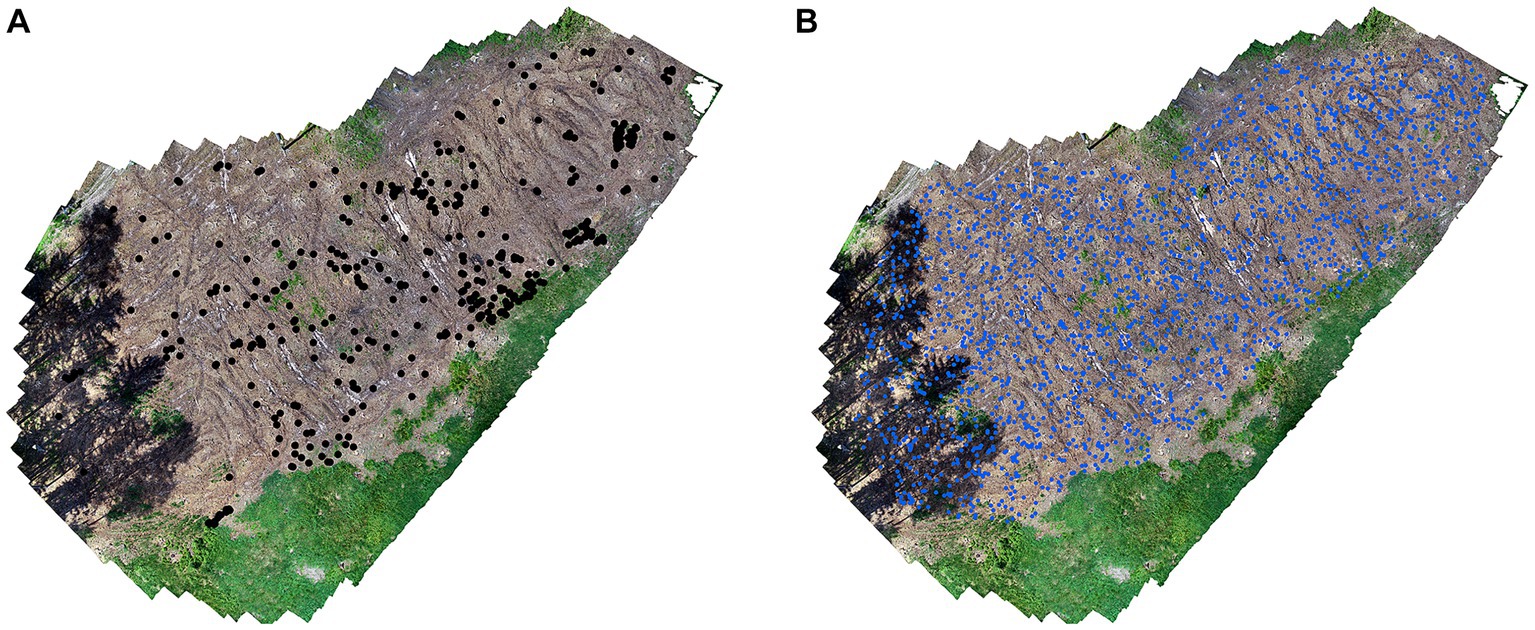
Figure 7. On left image (A) presence data and on right image (B) absence in plot no. 1.
We then used the extract function (raster package, software R Studio) to obtain for each presence-absence point a value from the topographic wetness index raster and from the solar radiance raster. Based on the spatial location of each point (function Extract Values to Points, ArcGIS Pro), we were able to assign fencing (Fence; binary) and soil treatments (Soil; single-disk, none, plow) and the distance to the nearest forest edge (Dist_m; linear measure in meters).
We used the R Studio and ArcGIS Pro software’s for all data analysis. We fit a generalized linear mixed-effects model with binomial errors and a logit link function using the “glmer” function from the lme4 package (Bates et al., 2023). We included random intercepts for each of the four study plots to account for predictors that may have different ranges of values across different plots (Zuur et al., 2009; Harrison et al., 2018).
We used the following model formula (Equation 6):
The presence/absence of seedlings, Y, is a function of the relative effects of the various predictors. In addition to the treatment factors (Dist_m, Fence, Soil), we also included water accumulation and potential sunlight exposure; normalizing these values transforms their means to 0 and all values within 1 SD of the mean. Raster values of potential water accumulation (TWI) were represented in the model in their scaled forms of TWI (scale_twi) and it squared value (TWI2; scale_twi2). Scaled raster values of potential sunlight exposure (scale_solar) for all plots were also included. Fixed effects in this model are Dist_m, Fence, Soil, scale_twi, scale_solar, and scale_twi2 and the random effect in this model is (1|Plot).
3 Results
We determined that a UAV equipped with an RGB camera can acquire very high-resolution terrain information, which can be incorporated into a species distribution model to determine the suitability of the local environment with a higher probability of survival for various tree species. The most important predictors in our model included a topographic wetness index, solar radiation, and fencing. Soil treatments and distance to the forest edges were less important to the establishment of naturally-regenerated seedlings. The GLMM was based on 9,508 observations of seedlings across the four plots. The strongest effects variables from the model were fencing, topographic wetness index, and solar radiation. The estimates of the model fixed effects are included in Table 2.
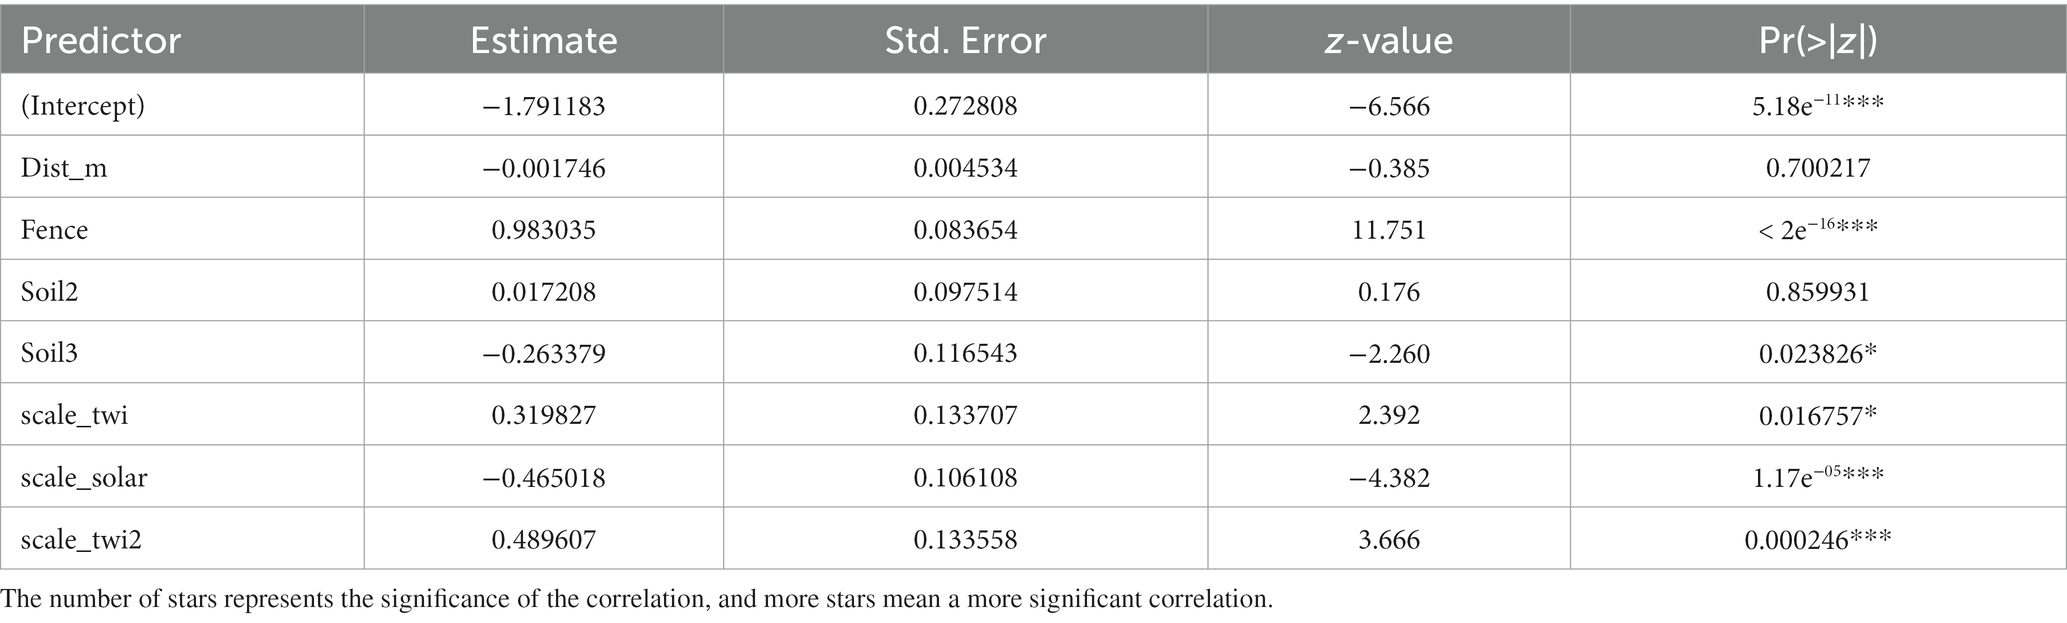
Table 2. Output data from the glmer model used for data evaluation.
The scaled residuals indicate how well the model fit the data. The values ranged from −0.9662 to 3.9978. Residuals close to zero suggest a good fit, while extreme values may indicate model inadequacy or influential outliers. The estimated variance of the random intercept for Plot was 0.2524, and the corresponding standard deviation was 0.5024.
The presence of fencing had a positive effect on the probability of the occurrence of naturally-regenerated seedlings with a coefficient of 0.983, as it protects against unwanted browsing from forest animals or driving by heavy machinery. Fencing serves as a barrier against external degrading factors. The presence of water is directly an essential component for the growth of all vegetation, the topographic wetness index (0.489) had a positive impact on the probability of occurrence of seedlings. So, the more water the microrelief captured, the better it was for regenerated seedlings; no places with excess water were found in the research plots, which negatively affected the growth. In our research, soil treatment after felling had no significant effect, specifically, Soil2 (type no. 2; larger branches were cleared and no soil treatment) only marginally increased the odds of occurrence (0.017), and Soil3 (type no. 3; larger branches were cleared and treatment by a plow) had a negative impact on the seedling establishment (−0.263).
The size of the deforested areas was small (< 2 ha), but even so, we verified the influence of the edge effect and the ability of seedlings to spread, the distance of the point from the edge of the forest stand had a slightly negative impact (−0.002). Sunlight had a strong negative effect on the presence of regenerated seedlings; this result will be justified by the excessive impact of light radiation on the plots, and for the seedlings were more suited to locations in the shade (−0.465). The most statistically significant predictors were fencing, solar radiation, and topographic wetness index. The graphically represented predicted probabilities of individual variables are presented in Appendix 1.
Figure 8 presents a prediction map for each of the four plot areas. Points with higher values have a higher predicted probability of the presence of seedlings at that location. Furthermore, the model suggests a higher degree of confidence that the location is more suitable for the presence of seedlings. In contrast, points with lower values have a lower predicted probability of the presence of seedlings, and the model has less confidence that seedlings would be present at that location. Prediction maps showed that the most suitable areas/areas with higher probability of survival were inside the fence and also closer to the edge of the study area where shading by mature surrounding trees and lower levels of solar radiation occurred, solar was noted as a significant predictor of the model. Figure shows all investigated points of presence-absence of naturally regenerated trees, each point on the map identifying the suitability of the location. It can be seen from the individual sub-maps that the more suitable locations are located inside the fences (points with a higher probability of survival are shown in yellow; these areas have a rectangular character that reflects the areas built by the fences). Solar radiation and topographic wetness index cannot be visually derived well from raster data because these input raster variables contain high spatial resolution pixel information.
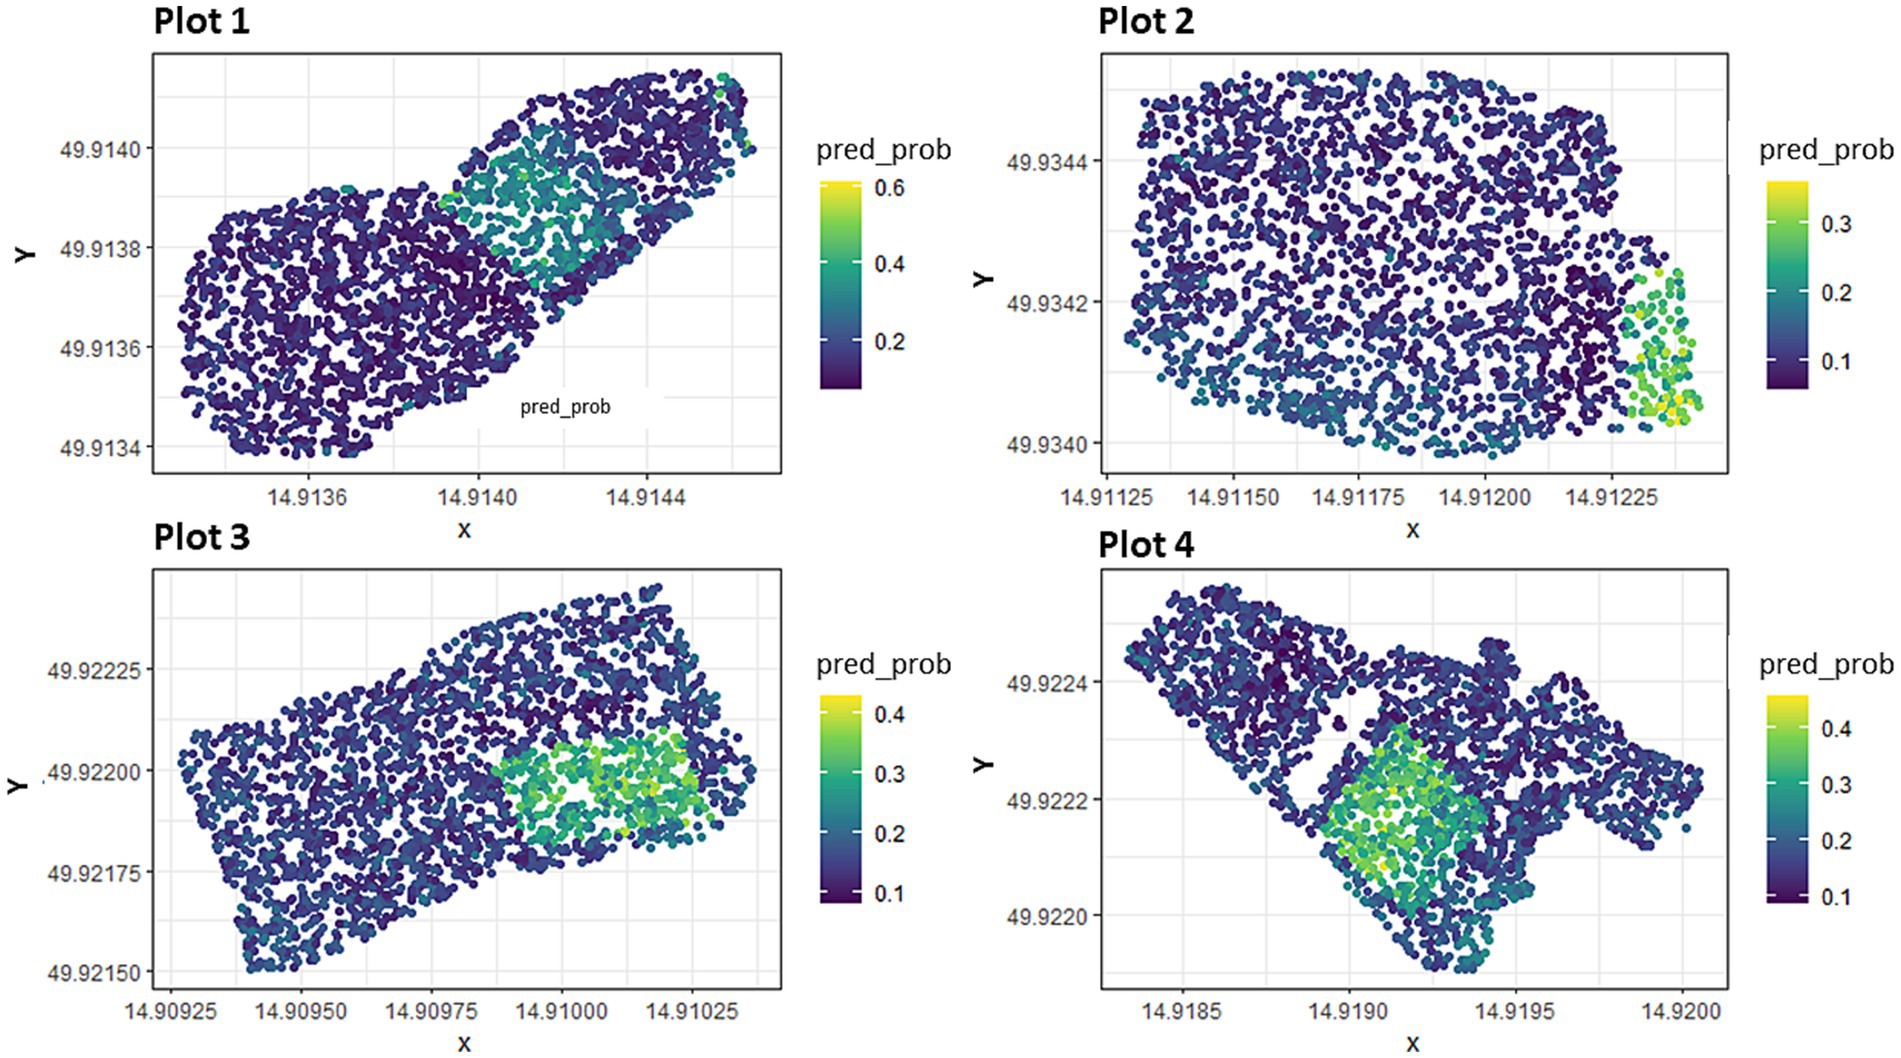
Figure 8. Prediction maps of the probability of occurrence for plots.
4 Discussion
Conducting data collection at two different times of the year, spring and autumn, enabled us to monitor vegetation development in deforested areas. Our results suggest the practical applicability of this approach for further use. Using the data collection and analysis as outlined in this work, it is possible to accurately identify areas suitable for regeneration. This approach can be particularly helpful for managers across large areas that have experienced intensive disturbances. This methodology could be used as an important basis for foresters when deciding on a restoration plan for several reasons. First, it is possible to predict how sufficient natural regeneration will be on a given site, thus avoiding unnecessary economic costs of artificial planting (seed, human capacity) on areas where it is not needed. If, based on the analysis, it is found that natural regeneration will not be sufficient and artificial regeneration is needed in some places, it would be advisable to again follow this methodology and direct artificial planting to places where water will accumulate. It would be appropriate to follow up this study with more extended monitoring and to evaluate the regeneration over a longer time horizon. In the future, it would be appreciated to focus on automatically detecting regenerated trees, including determining the height of individual trees and deriving their volume using Structure from Motion metrics.
4.1 Protection of fencing from browsing
The negative effects of browsing by deer on seedlings has been demonstrated in several studies (Castleberry et al., 2000; Rooney, 2009), and fencing has proven to have a positive effect on tree seedling survival and growth (Vercauteren et al., 2006; Vacek et al., 2014). However, the effects of fencing are not consistent across all settings, and positive changes may only become apparent over longer time horizons (Bernard et al., 2017).
Our results show that fencing had a positive effect on regenerated seedlings. However, a longer period of observation would be appropriate to confirm this statement. In some cases, deer populations reduce the effects of one species and, conversely, they influence the success of other species; for example, Bernard et al. (2017) observed the decline of silver fir (Abies alba Mill.) and, conversely, the increase of Norway spruce [Picea abies (L.) Karst.] was recorded. In a study by Vacek et al. (2014), they studied the natural regeneration of a mixed-species forest, including fir (Abies), maple (Acer), hornbeam (Carpinus betulus L.), rowan (Sorbus), beech (Fagus sylvatica L.), and Norway spruce, on plots with and without fencing; areas with fencing were found to have sufficient natural regeneration, but in areas with no fencing, they observed significant deaths or damage to seedlings, with the most significant damage to Abies and Acer species.
A long-term experiment by Rooney (2009) followed the effects of fencing for a 16-year period, and they observed 83% relative coverage of grass and sedge species (Poaceae and Cyperaceae spp.) in areas without fencing; in contrast, areas with fencing had relative coverage of the same species at less than 10%. According to Parker et al. (2020), the density of seedlings was not affected in the first 10 years of their study, but the height of the seedlings was reduced, and the horizontal and vertical structure of the forest was changed due to the effects of the browsing. Parker et al. (2020) recorded a higher coverage of forbs, ferns, huckleberry, and blueberry in unfenced areas.
4.2 Solar radiation
Our results suggested that sunlight exposure had a negative effect on the establishment of seedlings; areas with high exposure to sunlight do not appear to be suitable habitats for restoration. In a study by Strand et al. (2006), they investigated the influence of sunlight and the competition between pine (Pinus) trees. No correlation was found between the height of the trees and the amount of light, but a negative correlation was recorded between tree height and its nearest shelter tree. The soil was sandy with low nitrogen content. Therefore, it will be the rationale of results for the competitive struggle of the roots for minerals. Reduced solar radiation (shade/semi-shade) minimizes moisture loss from the soil and thus may influence competing vegetation.
Promis et al. (2010) investigated the growth of Nothofagus betuloides (Mirb.) Oerst. seedlings in small-scale deforested areas under different intensities of solar radiation, and they found that shading by mature vegetation did not affect seedling growth compared to seedlings grown under open conditions. The seedlings were tolerant of long-term shading and thus they could be sustainably managed in the southern Chilean old-growth Nothofagus forests using a selective harvesting system. However, in Patagonian forests, Rago et al. (2021) demonstrated the negative, linear relationship between diffuse radiation and forest canopy cover and basal area; some seedling groups exhibited a significant response to the amount of diffuse radiation, thus pine plantations affected the vegetation in the understories.
In the study (Örlander, 1993) increased mortality of 2-year-old cuttings of Norway spruce was demonstrated at high solar irradiation of surfaces in interaction with low temperatures below the freezing point; half-shade habitats appear to be the most suitable for restoration. On the contrary, a higher density of oak seedlings (Quercus petraea [Mattuschka] Liebl.) was correlated with higher solar radiation (Kuehne et al., 2020). The ideal solar conditions for the natural regeneration of oak have not been unequivocally researched and therefore depend on several other factors—soil pH, presence of iron in the soil, basal area, and species composition of the overstory (Březina and Dobrovolný, 2011; Annighöfer et al., 2015; Kuehne et al., 2020).
4.3 Soil moisture
In studying surface moisture and understanding its distribution, it is necessary to explore various explanatory variables, collect relevant data, and determine the influence of the most important factors. The intensity and extent of dry areas have increased over the past few decades (McCarthy and Intergovernmental Panel on Climate Change, 2001; Dai et al., 2004; Amani et al., 2017). For sufficient soil moisture, precipitation is the main factor (Tromp-van Meerveld and McDonnell, 2006; Molina-Moral et al., 2022), however, microrelief across sites and amount of vegetation on the sites also have a large impact on soil moisture. Soil moisture can be used as a direct indicator to determine the degree of soil drying, or it can be predicted using indirect indicators. Our study focused on the analysis of microrelief, which was used to create a topographic wetness index in a GIS environment; the index allows users to identify places with a higher probability of water accumulation based on the relief of the terrain.
In a study by Amani et al. (2017), they used a new indicator to assess the landscape, namely the Temperature-Vegetation-Soil Moisture Dryness Index; which combines the values of land surface temperature, perpendicular vegetation index and soil moisture, this index correlated very well with the values measured in the field. The issue of drought is a complex problem and the use of indices combining several critical input factors will be desirable for its understanding and prediction.
4.4 Preparation of soil
In our research, the mechanical soil preparation treatments did not significantly improve the establishment of tree seedlings. More pronounced differences could be observed in the longer term with the increasing number of weeds that could compete more with seedlings. Mechanical preparation can be useful to remove weeds and provide sufficient space for seedlings to grow, but intensive preparation can reduce the quality of the soil and deteriorate its properties for seedling growth. This predictor was insignificant, so we do not elaborate on the discussion further.
4.5 Distance to the edge
The distance of the seedling to the edge may have potentially improved seedling establishment near mature forest edges. In our study, this predictor has a low impact on the presence of seedlings, perhaps because of the relatively small size of the areas (< 2 ha), which would suggest that the dispersal of the seeds from the surrounding mature trees was sufficient. Seed dispersal is limited to a maximal distance of one or two times the height of the mature forest stands of Norway spruces (Hanssen, 2003).
5 Conclusion
In this study, we focused on evaluating the presence of seedlings. Based on the research questions, we find out that a passive camera with R, G, and B spectral resolution can provide terrain models in a very high spatial resolution if the data collection is taken at a low height level and with the Hover and Capture Mode. Using GIS analyses and a species distribution model, seeding areas were identified as the most significant predictors: fencing, topographic wetness index, and solar radiation. Fencing and a higher probability of water accumulation positively influenced the presence of seedlings, while solar radiation had a negative effect on the establishment of new seedlings. Given the dynamic changes many ecosystems are experiencing related to changing climates, forest managers will need efficient and effective tools to address the demand for reforestation and restoration, and our proposed methodology offers a means to quickly and efficiently identify areas favorable for tree seedling establishment.
The presented methodology offers a quick and efficient assessment of natural regeneration in deforested areas; this prediction could serve as a basis for determining the rate of natural regeneration and for reducing the economic intensity of artificial afforestation.
Data availability statement
The raw data supporting the conclusions of this article will be made available by the authors, without undue reservation.
Author contributions
TH: Data curation, Funding acquisition, Investigation, Methodology, Project administration, Writing – original draft, Formal Analysis, Resources, Software, Visualization. RM: Conceptualization, Software, Writing – review & editing. PS: Conceptualization, Supervision, Writing – review & editing, Methodology.
Funding
The author(s) declare financial support was received for the research, authorship, and/or publication of this article. This research was funded by Czech University of Life Sciences, Faculty of Forestry and Wood Sciences IGA/A_21_18 and by “Ministry of Agriculture of the Czech Republic, grant number QK21010435.”
Conflict of interest
The authors declare that the research was conducted in the absence of any commercial or financial relationships that could be construed as a potential conflict of interest.
Publisher’s note
All claims expressed in this article are solely those of the authors and do not necessarily represent those of their affiliated organizations, or those of the publisher, the editors and the reviewers. Any product that may be evaluated in this article, or claim that may be made by its manufacturer, is not guaranteed or endorsed by the publisher.
Supplementary material
The Supplementary material for this article can be found online at: https://www.frontiersin.org/articles/10.3389/ffgc.2023.1329675/full#supplementary-material
References
Amani, M., Salehi, B., Mahdavi, S., Masjedi, A., and Dehnavi, S. (2017). Temperature-vegetation-soil moisture dryness index (TVMDI). Remote Sens. Environ. 197, 1–14. doi: 10.1016/j.rse.2017.05.026
Annighöfer, P., Beckschäfer, P., Vor, T., and Ammer, C. (2015). Regeneration patterns of European oak species (Quercus petraea (Matt.) Liebl., Quercus robur L.) in dependence of environment and neighborhood. PLoS One 10:e0134935. doi: 10.1371/journal.pone.0134935
Bates, D., Maechler, M., Bolker, B., Walker, S., Christensen, R. H. B., Singmann, H, et al. (2023). lme4: Linear mixed-effects models using “Eigen” and S4. Available at: https://cran.r-project.org/web/packages/lme4/index.html (Accessed October 21, 2023).
Battipaglia, G., Saurer, M., Cherubini, P., Siegwolf, R. T. W., and Cotrufo, M. F. (2009). Tree rings indicate different drought resistance of a native (Abies alba mill.) and a nonnative (Picea abies (L.) karst.) species co-occurring at a dry site in southern Italy. For. Ecol. Manag. 257, 820–828. doi: 10.1016/j.foreco.2008.10.015
Bernard, M., Boulanger, V., Dupouey, J.-L., Laurent, L., Montpied, P., Morin, X., et al. (2017). Deer browsing promotes Norway spruce at the expense of silver fir in the forest regeneration phase. For. Ecol. Manag. 400, 269–277. doi: 10.1016/j.foreco.2017.05.040
Brang, P., von Felten, S., and Wagner, S. (2005). Morning, noon, or afternoon: does timing of direct radiation influence the growth of Picea abies seedlings in mountain forests? Ann. For. Sci. 62, 697–705. doi: 10.1051/forest:2005058
Brede, B., Lau, A., Bartholomeus, H., and Kooistra, L. (2017). Comparing RIEGL RiCOPTER UAV LiDAR derived canopy height and DBH with terrestrial LiDAR. Sensors 17:2371. doi: 10.3390/s17102371
Březina, I., and Dobrovolný, L. (2011). Natural regeneration of sessile oak under different light conditions. J. For. Sci. 57, 359–368. doi: 10.17221/12/2011-JFS
Burgués, J., and Marco, S. (2020). Environmental chemical sensing using small drones: a review. Sci. Total Environ. 748:141172. doi: 10.1016/j.scitotenv.2020.141172
Çalışkan, A., Güney, H. S., and Çalışkan, S. (2014). Effects of different soil preparation techniques on the Anatolian black pine (Pinus nigra Arnold subsp. pallasiana (lamb.) Holmboe) regeneration. J. Fac. Istanbul 64:56. doi: 10.17099/jffiu.74421
Castleberry, S. B., Ford, W. M., Miller, K. V., and Smith, W. P. (2000). Influences of herbivory and canopy opening size on forest regeneration in a southern bottomland hardwood forest. For. Ecol. Manag. 131, 57–64. doi: 10.1016/S0378-1127(99)00200-5
Caudullo, G., Tinner, W., and de Rigo, D. (2016). Picea abies in Europe: Distribution, habitat, usage and threats. Publication Office of the European Union 2016, Luxembourg.
Czech Hydrometeorological Institute (2022). Historical data: weather: maps of climate characteristics. Czech Hydrometeorological institute. Available at: https://www.chmi.cz/historicka-data/pocasi/mapy-charakteristik-klimatu (Accessed November 18, 2022).
Da Ronch, F., Caudullo, G., Tinner, W., and de Rigo, D. (2016). Larix decidua and other larches in Europe: Distribution, habitat, usage and threats. Publication Office of the European Union 2016, Luxembourg.
Dai, A., Trenberth, K. E., and Qian, T. (2004). A global dataset of palmer drought severity index for 1870–2002: relationship with soil moisture and effects of surface warming. J. Hydrometeorol. 5, 1117–1130. doi: 10.1175/JHM-386.1
Elith, J., Phillips, S. J., Hastie, T., Dudík, M., Chee, Y. E., and Yates, C. J. (2011). A statistical explanation of MaxEnt for ecologists: statistical explanation of MaxEnt. Divers. Distrib. 17, 43–57. doi: 10.1111/j.1472-4642.2010.00725.x
European Commission and Joint Research Centre (2020). Vulnerability of European forests to natural disturbances: JRC PESETA IV project: Task 12. LU: Publications Office Available at: https://data.europa.eu/doi/10.2760/736558 (Accessed January 31, 2023).
Falk, W., and Mellert, K. H. (2011). Species distribution models as a tool for forest management planning under climate change: risk evaluation of Abies alba in Bavaria: species distribution models as a tool for forest management planning. J. Veg. Sci. 22, 621–634. doi: 10.1111/j.1654-1103.2011.01294.x
Fellner, H., Dirnberger, G. F., and Sterba, H. (2016). Specific leaf area of European larch (Larix decidua mill.). Trees 30, 1237–1244. doi: 10.1007/s00468-016-1361-1
Franklin, J. (2010). Moving beyond static species distribution models in support of conservation biogeography: moving beyond static species distribution models. Divers. Distrib. 16, 321–330. doi: 10.1111/j.1472-4642.2010.00641.x
Franklin, J., and Miller, J. A. (2009). Mapping Species Distributions: Spatial Inference and Prediction. Cambridge; New York: Cambridge University Press
Fu, P., and Rich, P. M. (2002). A geometric solar radiation model with applications in agriculture and forestry. Comput. Electron. Agric. 37, 25–35. doi: 10.1016/S0168-1699(02)00115-1
Guisan, A., and Zimmermann, N. E. (2000). Predictive habitat distribution models in ecology. Ecol. Model. 135, 147–186. doi: 10.1016/S0304-3800(00)00354-9
Hanssen, K. H. (2003). Natural regeneration of Picea abies on small clear-cuts in SE Norway. For. Ecol. Manag. 180, 199–213. doi: 10.1016/S0378-1127(02)00610-2
Harrison, X. A., Donaldson, L., Correa-Cano, M. E., Evans, J., Fisher, D. N., Goodwin, C. E. D., et al. (2018). A brief introduction to mixed effects modelling and multi-model inference in ecology. PeerJ 6:e4794. doi: 10.7717/peerj.4794
Hijmans, R. J., Phillips, S., and Elith, J. L. and (2023). Dismo: Species distribution modeling. Available at: https://cran.r-project.org/web/packages/dismo/index.html (Accessed October 21, 2023).
Huo, L., Persson, H. J., and Lindberg, E. (2021). Early detection of forest stress from European spruce bark beetle attack, and a new vegetation index: normalized distance red & SWIR (NDRS). Remote Sens. Environ. 255:112240. doi: 10.1016/j.rse.2020.112240
Hycza, T., Stereńczak, K., and Bałazy, R. (2018). Potential use of hyperspectral data to classify forest tree species. N.Z. J. For. Sci. 48, 1–13. doi: 10.1186/s40490-018-0123-9
Junttila, S., Näsi, R., Koivumäki, N., Imangholiloo, M., Saarinen, N., Raisio, J., et al. (2022). Multispectral imagery provides benefits for mapping spruce tree decline due to bark beetle infestation when acquired late in the season. Remote Sens. 14:909. doi: 10.3390/rs14040909
Klouček, T., Komárek, J., Surový, P., Hrach, K., Janata, P., and Vašíček, B. (2019). The use of UAV mounted sensors for precise detection of bark beetle infestation. Remote Sens. 11:1561. doi: 10.3390/rs11131561
Kuehne, C., Pyttel, P., Modrow, T., Kohnle, U., and Bauhus, J. (2020). Seedling development and regeneration success after 10 years following group selection harvesting in a sessile oak (Quercus petraea [Mattuschka] Liebl.) stand. Ann. For. Sci. 77:71. doi: 10.1007/s13595-020-00972-y
Lebourgeois, F. (2007). Climatic signal in annual growth variation of silver fir (Abies alba mill.) and spruce (Picea abies karst.) from the French permanent plot network (RENECOFOR). Ann. For. Sci. 64, 333–343. doi: 10.1051/forest:2007010
Lebourgeois, F., Rathgeber, C. B. K., and Ulrich, E. (2010). Sensitivity of French temperate coniferous forests to climate variability and extreme events (Abies alba, Picea abies and Pinus sylvestris). J. Veg. Sci. 21, 364–376. doi: 10.1111/j.1654-1103.2009.01148.x
Lévesque, M., Saurer, M., Siegwolf, R., Eilmann, B., Brang, P., Bugmann, H., et al. (2013). Drought response of five conifer species under contrasting water availability suggests high vulnerability of Norway spruce and European larch. Glob. Chang. Biol. 19, 3184–3199. doi: 10.1111/gcb.12268
J. J. McCarthy, and Intergovernmental Panel on Climate Change (eds.) (2001). Climate change 2001: Impacts, adaptation, and vulnerability: Contribution of working group II to the third assessment report of the intergovernmental panel on climate change. Cambridge, UK; New York: Cambridge University Press.
Meentemeyer, R. K., Moody, A., and Franklin, J. (2001). Landscape-scale patterns of shrub-species abundance in California chaparral. Plant Ecol. 156, 19–41. doi: 10.1023/A:1011944805738
Molina-Moral, J. C., Moriana-Elvira, A., and Pérez-Latorre, F. J. (2022). Estimation of the water Reserve in the Soil Using GIS and its application in irrigated olive groves in Jaen, (Spain). Agronomy 12:2188. doi: 10.3390/agronomy12092188
Örlander, G. (1993). Shading reduces both visible and invisible frost damage to Norway spruce seedlings in the field. Forestry 66, 27–36. doi: 10.1093/forestry/66.1.27
Pajares, G. (2015). Overview and current status of remote sensing applications based on unmanned aerial vehicles (UAVs). Photogram. Engng. Rem. Sens. 81, 281–330. doi: 10.14358/PERS.81.4.281
Parker, H. A., Larkin, J. T., Heggenstaller, D., Duchamp, J., Tyree, M. C., Rushing, C. S., et al. (2020). Evaluating the impacts of white-tailed deer (Odocoileus virginianus) browsing on vegetation in fenced and unfenced timber harvests. For. Ecol. Manag. 473:118326. doi: 10.1016/j.foreco.2020.118326
Piedallu, C., and Gégout, J.-C. (2007). Multiscale computation of solar radiation for predictive vegetation modelling. Ann. For. Sci. 64, 899–909. doi: 10.1051/forest:2007072
Promis, A., Gärtner, S., Reif, A., and Cruz, G. (2010). Effects of natural small-scale disturbances on below-canopy solar radiation and regeneration patterns in an old-growth Nothofagus betuloides forest in Tierra del Fuego, Chile. Allgem. Forst Jagdzeit. 181, 53–64.
Půdní mapa (2022). Půdní mapa 1: 50 000. Available at: https://mapy.geology.cz/pudy/ (Accessed November 18, 2022).
Rago, M. M., Urretavizcaya, M. F., and Defossé, G. E. (2021). Relationships among forest structure, solar radiation, and plant community in ponderosa pine plantations in the Patagonian steppe. For. Ecol. Manag. 502:119749. doi: 10.1016/j.foreco.2021.119749
Rooney, T. P. (2009). High white-tailed deer densities benefit graminoids and contribute to biotic homogenization of forest ground-layer vegetation. Plant Ecol. 202, 103–111. doi: 10.1007/s11258-008-9489-8
Seidl, R., Schelhaas, M.-J., Rammer, W., and Verkerk, P. J. (2014). Increasing forest disturbances in Europe and their impact on carbon storage. Nat. Clim. Chang. 4, 806–810. doi: 10.1038/nclimate2318
Sequens, J. (2007). Hospodářská úprava lesů Souhrn. Available at: https://katedry.czu.cz/storage/3844_Souhrn_HUL.pdf.
Strand, M., Löfvenius, M. O., Bergsten, U., Lundmark, T., and Rosvall, O. (2006). Height growth of planted conifer seedlings in relation to solar radiation and position in scots pine shelterwood. For. Ecol. Manag. 224, 258–265. doi: 10.1016/j.foreco.2005.12.038
Thornton, P. E., Hasenauer, H., and White, M. A. (2000). Simultaneous estimation of daily solar radiation and humidity from observed temperature and precipitation: an application over complex terrain in Austria. Agric. For. Meteorol. 104, 255–271. doi: 10.1016/S0168-1923(00)00170-2
Tromp-van Meerveld, H. J., and McDonnell, J. J. (2006). On the interrelations between topography, soil depth, soil moisture, transpiration rates and species distribution at the hillslope scale. Adv. Water Resour. 29, 293–310. doi: 10.1016/j.advwatres.2005.02.016
Tusa, E., Laybros, A., Monnet, J.-M., Dalla Mura, M., Barré, J.-B., Vincent, G., et al. (2019). “Fusion of hyperspectral imaging and LiDAR for forest monitoring” in Data Handling in Science and Technology (Amsterdam, The Netherlands: Elsevier), 281–303.
ÚHÚL (2022). Informace o lesním hospodářství. Available at: https://geoportal.uhul.cz/mapy/mapylhpovyst.html (Accessed November 18, 2022).
Vacek, Z., Vacek, S., Bílek, L., Král, J., Remeš, J., Bulušek, D., et al. (2014). Ungulate impact on natural regeneration in spruce-beech-fir stands in Černý důl nature Reserve in the Orlické Hory Mountains, case study from central Sudetes. Forests 5, 2929–2946. doi: 10.3390/f5112929
Vercauteren, K. C., Lavelle, M. J., and Hygnstrom, S. (2006). Fences and deer-damage management: a review of designs and efficacy. Wildl. Soc. Bull. 34, 191–200. doi: 10.2193/0091-7648(2006)34[191:FADMAR]2.0.CO;2
Wieser, M., Mandlburger, G., Hollaus, M., Otepka, J., Glira, P., and Pfeifer, N. (2017). A case study of UAS borne laser scanning for measurement of tree stem diameter. Remote Sens. 9:1154. doi: 10.3390/rs9111154
Wollan, A. K., Bakkestuen, V., Kauserud, H., Gulden, G., Halvorsen, R., and Svenning, J.-C. (2008). Modelling and predicting fungal distribution patterns using herbarium data. J. Biogeogr. 35, 2298–2310. doi: 10.1111/j.1365-2699.2008.01965.x
Yang, Q., Blanco, N. E., Hermida-Carrera, C., Lehotai, N., Hurry, V., and Strand, Å. (2020). Two dominant boreal conifers use contrasting mechanisms to reactivate photosynthesis in the spring. Nat. Commun. 11:128. doi: 10.1038/s41467-019-13954-0
Zhu, X. (2016). GIS for Environmental Applications: A Practical Approach. London; New York, NY: Routledge
Keywords: unmanned aerial vehicle, clearing cut, 3D maps, spatial analysis, natural regeneration, forest monitoring, soil moisture
Citation: Hüttnerová T, Muscarella R and Surový P (2024) Drone microrelief analysis to predict the presence of naturally regenerated seedlings. Front. For. Glob. Change. 6:1329675. doi: 10.3389/ffgc.2023.1329675
Edited by:
Yashwant Singh Rawat, Federal Technical and Vocational Education and Training Institute (FTVETI), EthiopiaReviewed by:
Maciej Pach, University of Agriculture in Krakow, PolandSergio Espinoza, Catholic University of the Maule, Chile
Copyright © 2024 Hüttnerová, Muscarella and Surový. This is an open-access article distributed under the terms of the Creative Commons Attribution License (CC BY). The use, distribution or reproduction in other forums is permitted, provided the original author(s) and the copyright owner(s) are credited and that the original publication in this journal is cited, in accordance with accepted academic practice. No use, distribution or reproduction is permitted which does not comply with these terms.
*Correspondence: Tereza Hüttnerová, huttnerovat@fld.czu.cz