Spatiotemporal pattern of landscape ecological risk in the Yangtze River Basin and its influence on NPP
 Lu Jia
 Kunxia Yu
 Zhanbin Li
 Peng Li
 Peijuan Cong2
 - 1State Key Laboratory of Eco-Hydraulics in the Northwest Arid Region of China, Xi'an University of Technology, Xi'an, Shaanxi, China
- 2Monitoring Center of Soil and Water Conservation, Ministry of Water Resources, Beijing, China
The rapid development of the social economy and the continuous change in land use have greatly altered the ecological risk of the regional landscape. This study focused on the Yangtze River Basin in China and aimed to examine the temporal and spatial variation characteristics of landscape ecological risk (LER) over a period of 34 years (1982–2015), after determining the optimal sub-watershed scale. Based on the conditional probability framework, the non-linear response of NPP to LER was revealed. Finally, the primary driving factors of LER were explored, and additional potential causes for changes in NPP were discussed. The study findings indicated that the mean annual LER of the Yangtze River Basin exhibited a spatial distribution characterized by high values observed in the western regions and low values in the eastern regions at the optimal sub-basin scale. Specifically, 30.56 and 22.22% of the sub-basins demonstrated a significant upward and downward trend in annual LER, respectively (P < 0.05). The spatial distribution pattern of the mean annual NPP demonstrated high values in the middle region and low values in the western area, with annual NPP significantly increasing in 94.44% of the sub-basins (P < 0.05). The relationship between annual NPP and annual LER was found to be non-linear, indicating that higher annual LER results in a higher probability of median and high values of annual NPP from the perspective of watershed average. Furthermore, climate factors emerged as the main influencing factor of the NPP. Based on these discoveries, upcoming endeavors should concentrate on optimizing landscape formations and executing a judicious distribution of plant species.
1 Introduction
The rapid acceleration of human civilization fosters urbanization, causing alterations in the underlying surface, like land use practices. Concurrently, the population is undergoing rapid expansion, exacerbating the conflict between humans and the land. Consequently, ecological risk progressively inhibits the sustainable development of the social economy (Landis and Wiegers, 2007; Paukert et al., 2011; Xie et al., 2020; Lal et al., 2021; Ren and Cao, 2022). Ecological risk assessment serves as an effective tool for ecological risk management, defined as the probability of ecosystem degradation in response to external disturbances (Gong et al., 2015; Lin et al., 2019). Given that landscapes consist of a heterogeneous mosaic of human activities and ecological processes, the assessment of LER can effectively capture the spatial and temporal heterogeneity as well as the scale effect of ecosystem structure and ecological processes (Li and Zhou, 2015; Cao et al., 2018; Lin et al., 2019; Li et al., 2023). Consequently, LER assessment represents the forefront of ecological risk assessment research. Evaluating LER not only enables us to understand changes in landscape structure but also reflects alterations in ecological processes.
LER assessment is heavily dependent on the principles of landscape ecology theory and employs different landscape pattern indices for the creation of LER indices, which are used for its evaluation purposes (Wang et al., 2021a,b; Zhang et al., 2021; Ran et al., 2022; Zhao et al., 2022; Li et al., 2023). In this particular domain, a multitude of scholars have made noteworthy contributions throughout the past few decades. For instance, Ren and Cao (2022) analyzed the LER within Liaoning Province in China, revealing a relatively elevated LER for the Liaoning River, and the ecological environment should be protected while developing the economy. The study conducted by Li et al. (2020) in Beijing exhibited that extra-high LER were primarily concentrated in the northeastern and southeastern regions of the city center. Additionally, the presence of traffic roads and other infrastructure projects played a significant role in generating disturbances within the landscape, subsequently augmenting LER (Lin et al., 2019). In a similar study, Wang et al. (2020a) documented that in the central Himalayas' Koshi River Basin, the area of ecological deterioration progressively expanded with an increase in slope inclination. Furthermore, in multiple areas across China, such as the Gansu Province's Baishuijiang National Nature Reserve, the Fujian Delta region, the Yangtze River Economic Belt, and the Xi'an Metropolitan Area, extensive examinations and investigations have taken place regarding alterations in LER (Wang et al., 2021a,b; Ran et al., 2022; Zhang et al., 2022a,c). Experts have not only investigated the characteristics of spatial and temporal variations in LER but also have analyzed the factors that drive its transformations. For instance, in Liaoning Province, the temperature and per capita GDP were recognized as the primary elements that impact LER (Ren and Cao, 2022). The investigation has uncovered that intensified human actions constitute the primary driver for the amplified LER within the Koshi River Basin (Wang et al., 2020a). Although researchers have extensively delved into the phenomenon of LER, insufficient scrutiny has been devoted to investigating the correlation between such risk and the functionalities of ecosystem services. This research gap, specifically with a focus on continuous long-term data, needs to be addressed promptly.
NPP is an essential ecosystem service associated with the growth of carbon sinks in terrestrial ecosystems. It has gained significant attention in the realm of ecosystem services research (Erb et al., 2016; Zhao et al., 2020; Wei et al., 2022). In the Qinghai alpine ecosystem of China, NPP held great significance in terms of water-related ecosystem services and was widely regarded as a key indicator of ecosystem quality (Hao et al., 2022). Past investigations concerning NPP predominantly concentrated on exploring its connection with various ecosystem services, primarily employing linear correlation analysis techniques (Chen et al., 2023; Ma et al., 2023). However, uncovering the non-linear connections between different factors in intricate systems poses a significant difficulty. Hence, there is a need to establish a new non-linear framework. Given that the Yangtze River Basin is an economically significant region in China, studying the changes in NPP, particularly in the context of carbon neutrality, holds great importance (Yang et al., 2021). Studying the changes in NPP held immense importance, particularly considering the concept of carbon neutrality (Ouyang et al., 2021). By examining the spatial and temporal variations in LER within the Yangtze River Basin and investigating the non-linear reaction of NPP to LER, it is possible to enhance the preservation of the ecological environment in this region. Moreover, these findings can aid in optimizing the landscape pattern while promoting economic development.
Hence, the primary objectives of this study are (1) examining the spatiotemporal patterns of LER in the Yangtze River Basin over an extended period, (2) quantifying the non-linear relationship between NPP and LER using conditional probability, and (3) investigating the key drivers of LER alteration and additional factors impacting NPP alterations.
2 Study area and data
2.1 Yangtze River Basin
The Yangtze River originates from the Tanggula Mountains on the Qinghai Tibet Plateau and spans three major regions of western, central, and eastern China. The river passes through 11 provinces and cities before reaching the East China Sea. The watershed area of the Yangtze River is ~1.8 million km2, with elevation changes ranging from −67 to 6,486 m. Geographically, it is located between 24 ° N-34 °N and 90 ° E-122 ° E (Figure 1). The basin is characterized by abundant precipitation and a warm climate. It has a subtropical monsoon climate, with a mean annual precipitation of ~1,122 mm. The distribution of precipitation is uneven throughout the year, with 60% concentrated in the summer. This region is of great importance for population and industrial concentration in China, contributing significantly to the country's GDP. However, it also faces challenges due to its relatively fragile ecological environment (Yang et al., 2021).
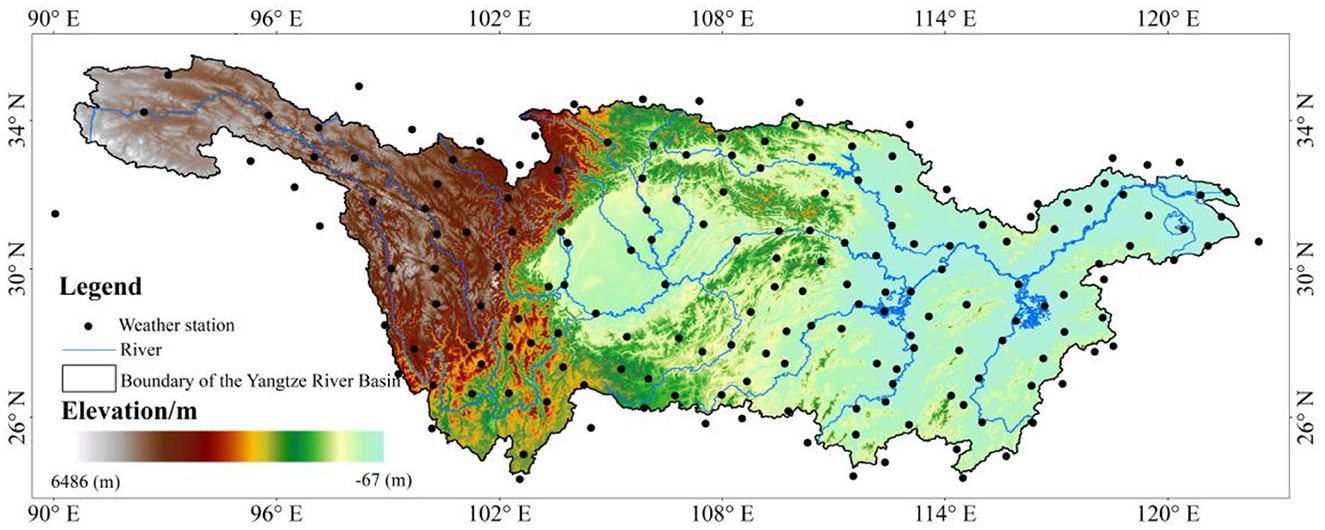
Figure 1. Location of the study area.
2.2 Study data
Liu et al. (2020) provided land use raster data for a continuous period of 34 years, spanning from 1982 to 2015, at a spatial resolution of 5,000 m (https://essd.copernicus.org/). The Digital Elevation Model (DEM) data, acquired from the Institute of Geographical Science and Resources, Chinese Academy of Sciences, had a spatial resolution of 250 m (http://www.resdc.cn/). Furthermore, Yu et al. (2018) compiled NPP raster data at 8-day intervals, covering the period from 1981 to 2018, with a spatial resolution of 5,000 m (http://www.geodata.cn/). After projection conversion and summation calculation, the annual NPP raster data from 1982 to 2015 were obtained, which was consistent with the projection and resolution of the land use raster data. Moreover, we gathered raster data for GDP spanning the years 1992 to 2015 with a spatial resolution of 1,000 m (Chen et al., 2022), NDVI raster data covering the years 1982 to 2015 with a spatial resolution of 5,000 m (https://daac.ornl.gov/), and POP raster data for the period 2000–2015 with a spatial resolution of 0.0083° (Dobson et al., 2000). The raster data for precipitation, minimum temperature, and maximum temperature were obtained from the Climate Research Unit (CRU; https://crudata.uea.ac.uk/cru/data/hrg/) at the National Center for Atmospheric Sciences (NCAS), located in the United Kingdom. All raster data, after calculation and projection conversion, maintained the same projection coordinates as land use data. Additionally, the daily sunshine hours of 178 meteorological stations located within and around the Yangtze River Basin during the same period were gathered from the National Meteorological Information Center's website (http://data.cma.cn/).
3 Methodology
3.1 Landscape ecological risk index
Based on the concept of landscape ecology, the LER index is commonly employed to depict alterations in landscape structure and ecological risk. Typically, it is constructed by utilizing landscape pattern indices that serve as indicators of ecological degradation (Wang et al., 2021a,b; Zhang et al., 2021; Ran et al., 2022). In the present investigation, the landscape disturbance index and landscape vulnerability index were chosen to compute the LER index. The precise formula for calculating this index is shown in Equations (1–5) as follows:
where ERIk stands for the LER index of the k-th watershed; Ak denotes the area of the k-th watershed, km2; Ak, i represents the area of the i-th landscape in the k-th watershed, km2; m is the number of landscape types; Dk, i represents the landscape disturbance index of the i-th landscape in the k-th watershed; Vk, i is the landscape vulnerability index of the i-th landscape in the k-th watershed; Fk, i represents the landscape fragmentation index of the i-th landscape in the k-th watershed; Sk, i represents the landscape separation index of the i-th landscape in the k-th watershed; FDk, i denotes the landscape fractal dimension of the i-type landscape in the k-th watershed; nk, i represents the number of patches of the i-th landscape in the k-th watershed; Pk, i denotes the perimeter of the i-th landscape in the k-th watershed, km; and a, b, and c are weight coefficients of usually 0.5, 0.3, and 0.2.
The landscape vulnerability index is capable of depicting the landscape ecosystem's susceptibility to external disruptions. The ecosystem becomes increasingly unstable as its value increases. Typically, it is determined through the analysis of land use data. In this particular study, a value of 4 was assigned to cultivated land and 2 to forest land. Grassland and shrubs were given a value of 3, while other types of land use were assigned a value of 6, to carry out the normalization process. By doing so, the landscape vulnerability index Vk, i for each watershed can be derived for every landscape type.
The LER has a scale effect on the calculation unit, and the calculation unit of different sizes will cause a change in the landscape pattern index. In this study, LER was calculated at the sub-watershed scale. To select the best sub-watershed scale, using ArcGIS software, 18 different thresholds in flow accumulation values for channelization, from 105 to 106 with an interval of 5 × 10⁴, were set to extract sub-watersheds of different scales, numbered from scale 1 to scale 18, and the technical roadmap of this study is shown in Figure 2.
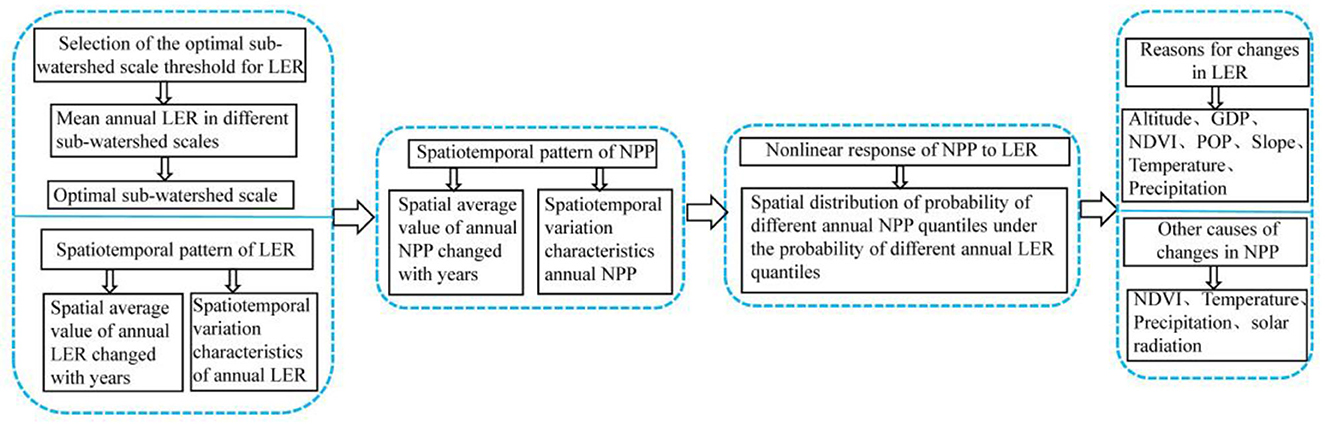
Figure 2. Technical roadmap for this study.
3.2 Conditional probability framework
The probability framework of the condition is employed to evaluate the non-linear reaction of NPP to LER through the utilization of the marginal distribution function and copula function, taking into consideration the aspect of probability (Fang et al., 2019; Guo et al., 2021). The specific formula is shown in Equation (6):
where x and y refer to the LER and NPP, respectively; FX(x) and FY(y) are the optimal marginal distribution functions of LER and NPP, respectively; in this study, there are four alternative marginal distribution functions, namely, generalized logistic distribution (GLO), Pearson III type distribution (PE3), Gumbel distribution (GUM), and generalized extreme value distribution (GEV). The marginal distribution function with the minimum RMSE is selected as the optimal marginal distribution function for the variable; P(Y ≤ y|X ≤ x) indicates the conditional probability, and the larger the value, the more sensitive y is to x; C[FX(x), FY(y)] is the joint distribution; and the copula function is used as the joint distribution function connecting two marginal distributions; there are three types of copula functions as candidates, namely, Frank copula, Gumbel copula, and Clayton copula. The optimal copula function for the two random variables is determined by selecting the copula function with the smallest AIC through the calculation of AIC for each copula function.
3.3 Trend, change point test, and geographic detector
The Mann-Kendall (MK) trend test and the Pettitt test are used in this study to identify trends and change points in various time series variables (Mann, 1945; Kendall, 1975; Pettitt, 1979). The evaluation of the interaction among the driving forces of LER was conducted using the geographic detector's interactive detector developed by Wang and Xu (2017) and Song et al. (2020). The interaction among multiple factors is categorized into five types, namely, bivariate enhancement, non-linear enhancement, univariate weakening, non-linear weakening, and independence. An increased q value in the factor detector indicates a stronger influence of the driving factors on the LER. The calculation formula for this specific analysis is shown in Equation (7):
where h = 1, 2,...; L is the number of variables; Nh and N are the number of samples of class h and the whole region, respectively; and and σ2 are the variances of landscape ecological risk of class h and the whole region, respectively.
3.4 Solar radiation calculation
Ångström–Prescott model is extensively employed for the estimation of solar radiation (Liu et al., 2012). The formula used to compute solar radiation is provided in Equation (8):
where Rs represents solar radiation, MJ/(m2·day); Ra represents extraterrestrial solar radiation, MJ/(m2·day); n is the sunshine hours, h; N is the theoretical maximum sunshine hours, h; and a and b are parameters, with values of 0.25 and 0.50, respectively. By summing the daily solar radiation, annual solar radiation can be obtained. Moreover, kriging interpolation can be used to obtain solar radiation grid data with the same resolution as NPP.
4 Results and analysis
4.1 Selection of the optimal sub-watershed scale threshold for LER
According to Figure 3, the spatial arrangement of the mean annual LER was showcased across different sub-watershed scales between 1982 and 2015. In the Yangtze River Basin, the mean annual LER demonstrated a distinct pattern with elevated values in both the western and eastern regions, with a range of 0–0.24 across different sub-watershed scales. Moreover, the impact of scale on ecological risk was evident, particularly at smaller sub-watershed scales, where the disparities in spatial distribution of the mean annual LER were more pronounced. As the scale of the sub-watershed increased, the distribution pattern of LER in the Yangtze River Basin gradually became more consistent. The pattern of high risk in the west and low risk in the east, and high risk in the south and low risk in the north, became increasingly evident and stable for the mean annual LER. As the sub-watershed scale increased, the average spatial value of the mean annual LER initially decreased and then increased (Figure 4). This confirmed that there was an optimal threshold that made the LER not to increase with the change of scale, that is, the scale 11, including 36 sub-basins in the Yangtze River Basin.
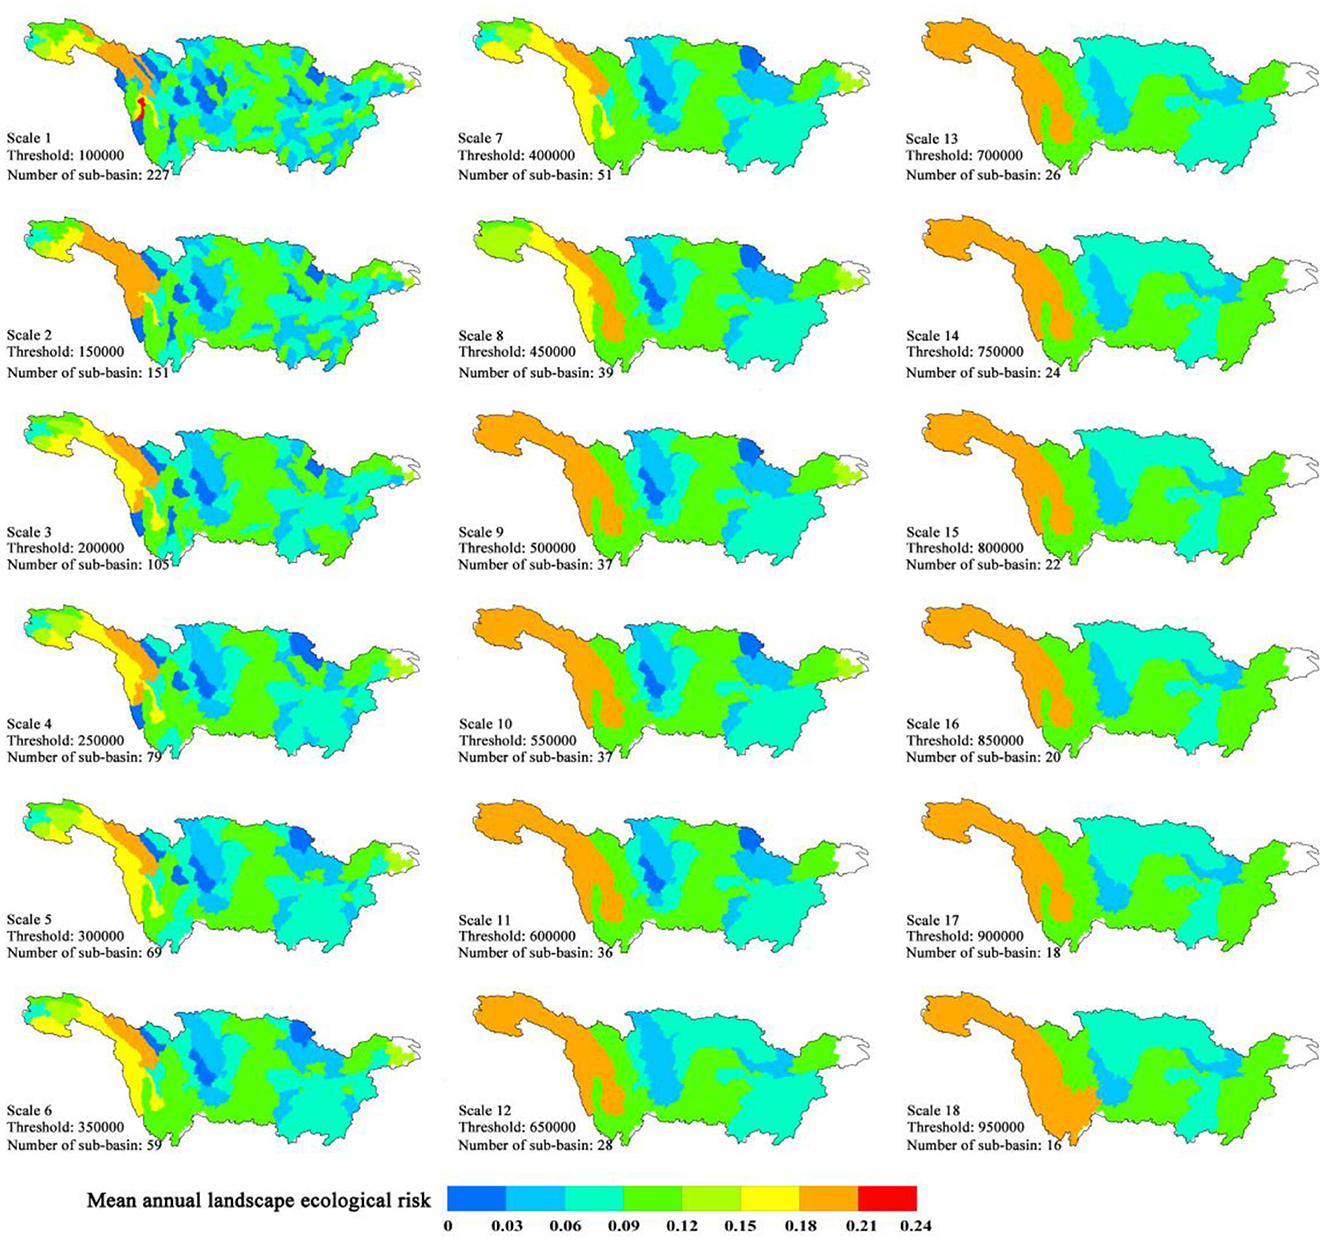
Figure 3. Spatial distribution of mean annual landscape ecological risk in different sub-watershed scales.
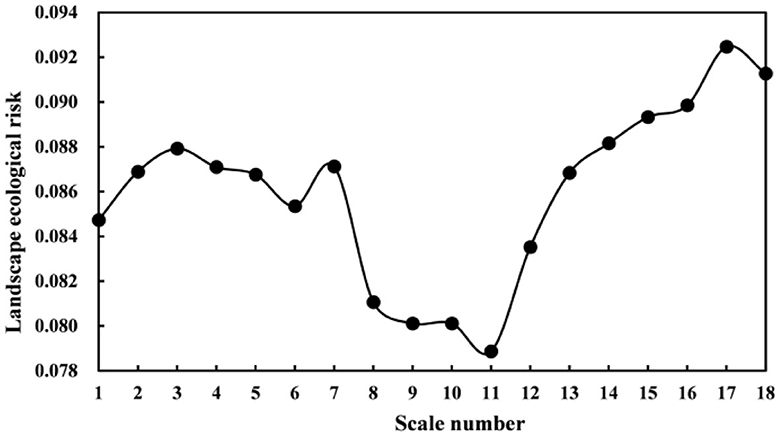
Figure 4. Spatial average value of mean annual landscape ecological risk in different sub-watershed scales.
4.2 Spatiotemporal pattern of LER
Following the establishment of the most suitable sub-watershed size, an examination of the spatial and temporal patterns of annual LER within the sub-watershed was conducted in the Yangtze River Basin (Figures 5, 6). There was a slight decreasing trend in the inter-annual changes of the spatial average value of annual LER with the obvious fluctuation changes, and only 20.59% of the data points were in the 95% confidence interval of the regression equation with R2 only 0.02 (Figure 5). Of the 36 sub-watersheds, ~30.56% exhibited a notable rise in annual LER, while 22.22% experienced a significant decline (P < 0.05). Specifically, the southern and northeastern regions of the Yangtze River Basin saw a predominant increase in the annual LER, whereas the western, eastern, and southeastern areas observed a marked decrease (Figure 6A; P < 0.05). The Pettitt test indicated that 47.22% of the 36 sub-watersheds had significant change points in the annual LER in the Yangtze River Basin, appearing from 1988 to 2001, which were basically consistent with the spatial distribution of sub-watersheds with significant changes in annual LER (Figure 6B; P < 0.05).
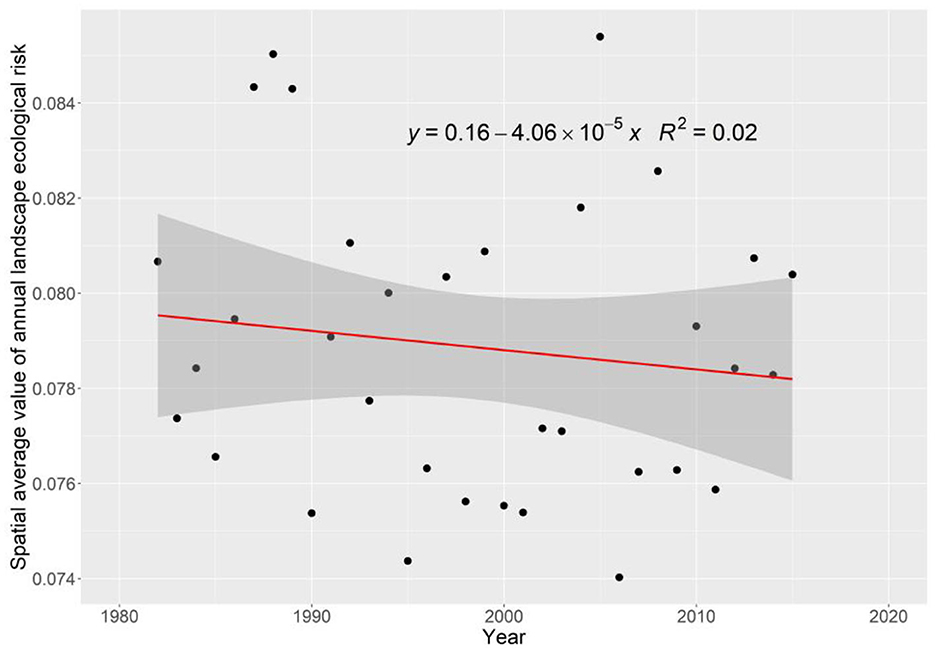
Figure 5. Spatial average value of annual landscape ecological risk changed with the years.
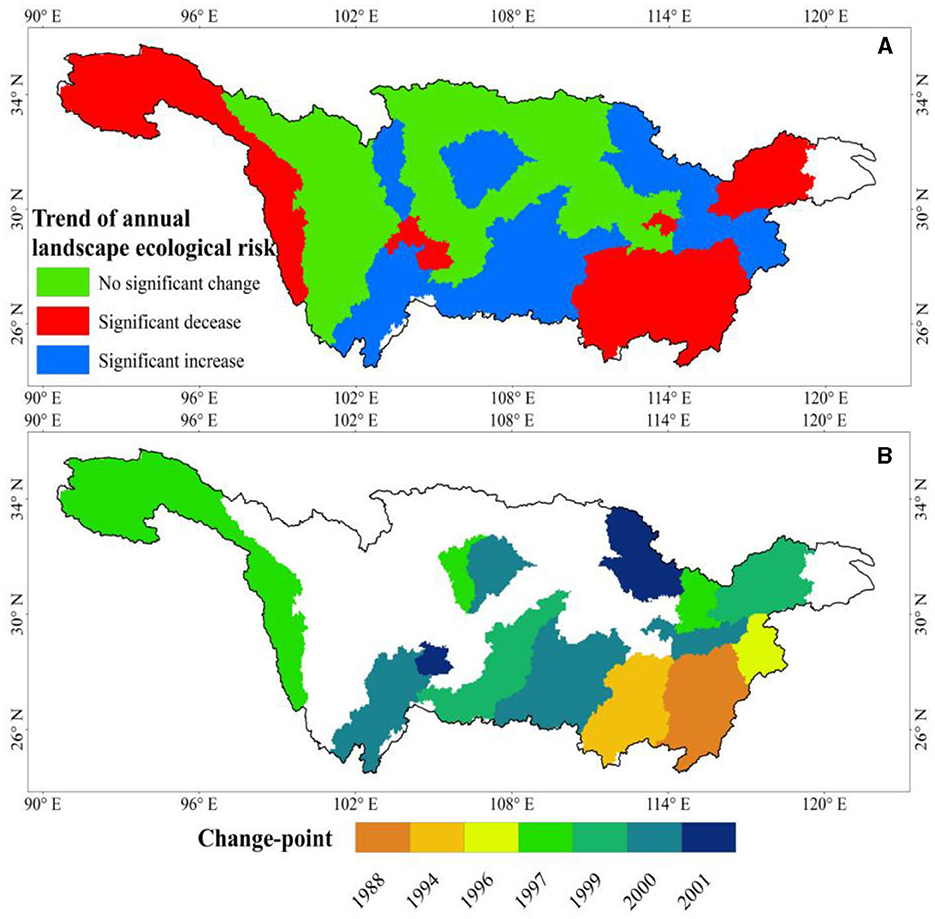
Figure 6. (A, B) Spatiotemporal variation characteristics of annual landscape ecological risk.
4.3 Spatiotemporal pattern of NPP
Figures 7, 8 display the variations in annual NPP over time and space. The average spatial value of annual NPP exhibited a noticeable upward trend as the years progressed, and 47.06% of the data points were in the 95% confidence interval of the regression equation, with R2 only 0.58 (Figure 7). Analyzing the sub-basins individually, we observe a wide range in mean annual NPP, ranging from 137.79 to 845.51 gC·m−2. This distribution pattern reveals higher values in the eastern regions and lower values in the western regions (Figure 8A). Moreover, a significant increase in annual NPP was observed in 94.44% of the 36 sub-basins from 1982 to 2015, providing strong evidence of the overall growth trend (Figure 8B; P < 0.05). The annual NPP of 86.11% of the sub-basins had significant change points, which mainly occurred between 1996 and 2000 (Figure 8C; P < 0.05). The northern and northeastern parts of the Yangtze River Basin experienced the earliest mutation in annual NPP among the sub-basins. Subsequently, the southern region encountered the mutation, while the source region of the Yangtze River had the most delayed occurrence.
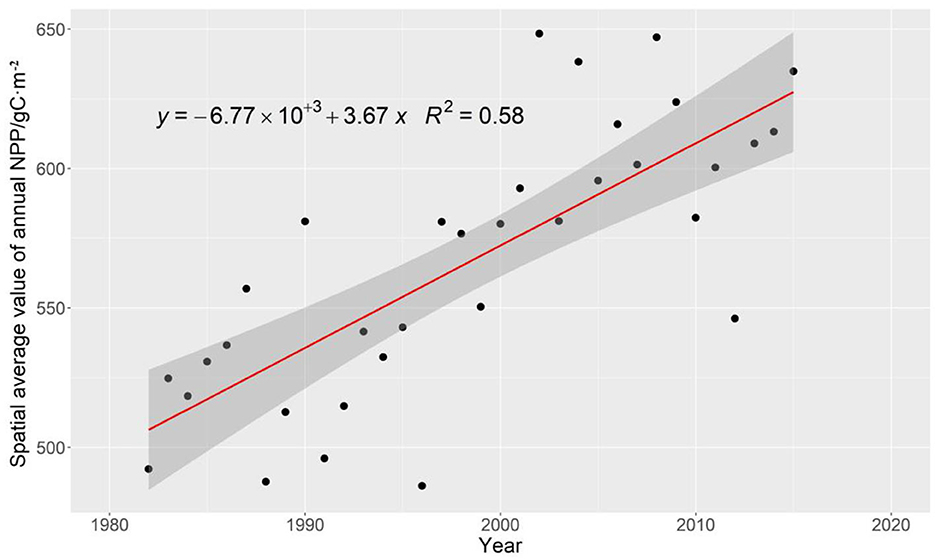
Figure 7. Spatial average value of annual NPP changed with the years.
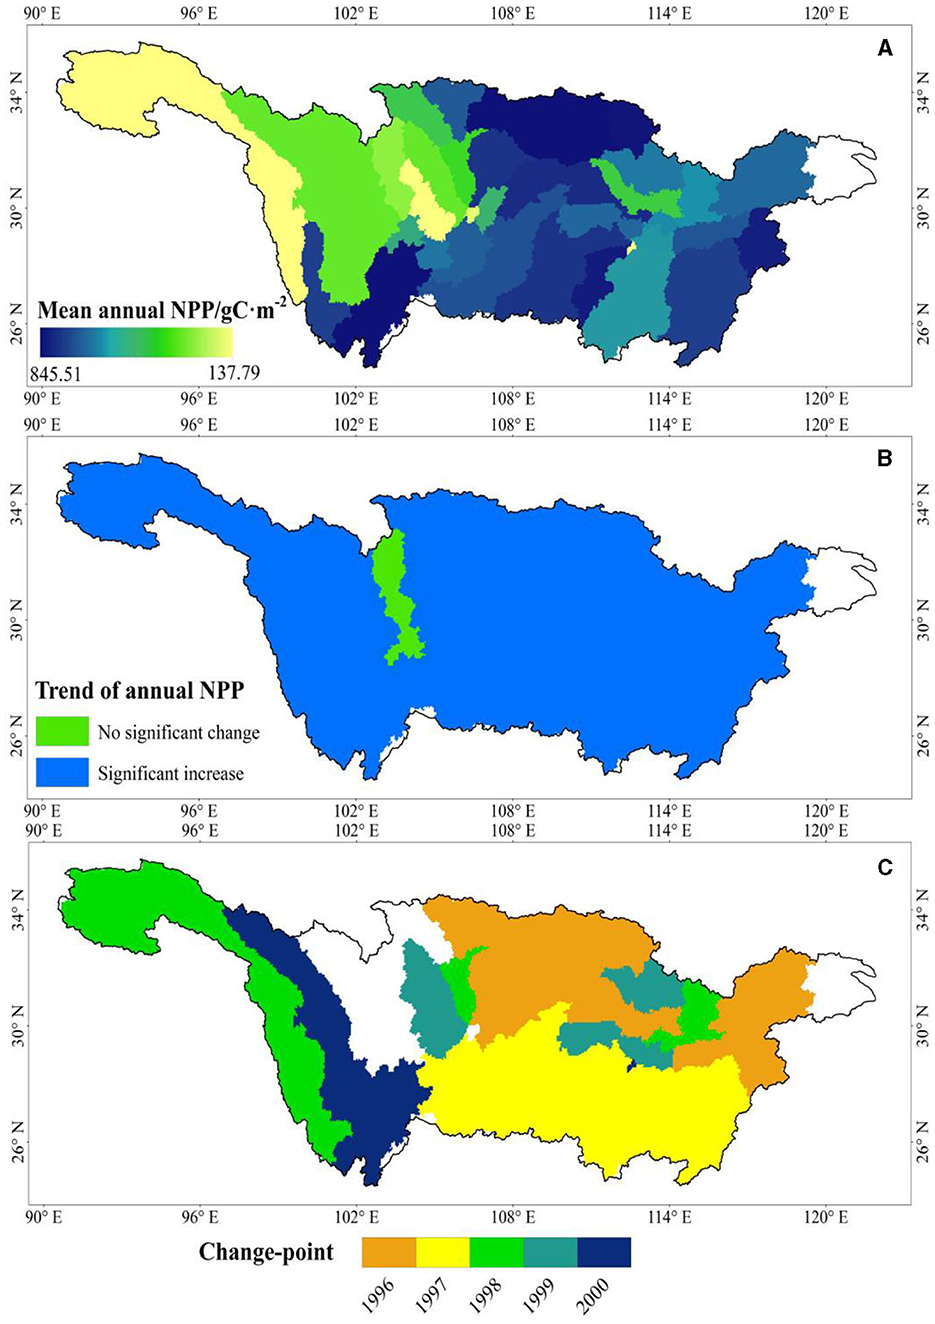
Figure 8. (A–C) Spatiotemporal variation characteristics of annual NPP.
4.4 Non-linear response of NPP to LER
Under the conditional probability framework, the spatial distribution of the non-linear response of the annual NPP to the annual LER was quantified, as shown in Figure 9. Considering the entirety of the Yangtze River Basin, the likelihood of annual NPP occurrence was significantly high in the middle region compared to other regions, regardless of the prevailing circumstances. In the central region of the Yangtze River Basin, the annual NPP decreased with the increase in annual LER. Furthermore, the annual NPP 25% quantile decreased with the increase in annual LER. When the annual LER increased from the 25% quantile to the 75% quantile, the watershed average probability of annual NPP decreased from 0.23 to 0.21. This indicated that the augmentation of annual LER led to an increase in probability in both the median and high values of annual NPP, as observed from the average value of the basin. However, as annual LER increased, the probability of annual NPP at the 50 and 75% quantiles increased slightly. For example, when annual LER increased from the 25% quantile to the 75% quantile, the watershed average probability of the 75% quantile annual NPP increased from 0.70 to 0.77. The preceding analysis further validated the non-linear relationship between annual NPP and annual LER, affirming the differences in the alteration pattern of annual NPP as a consequence of variations in annual LER.
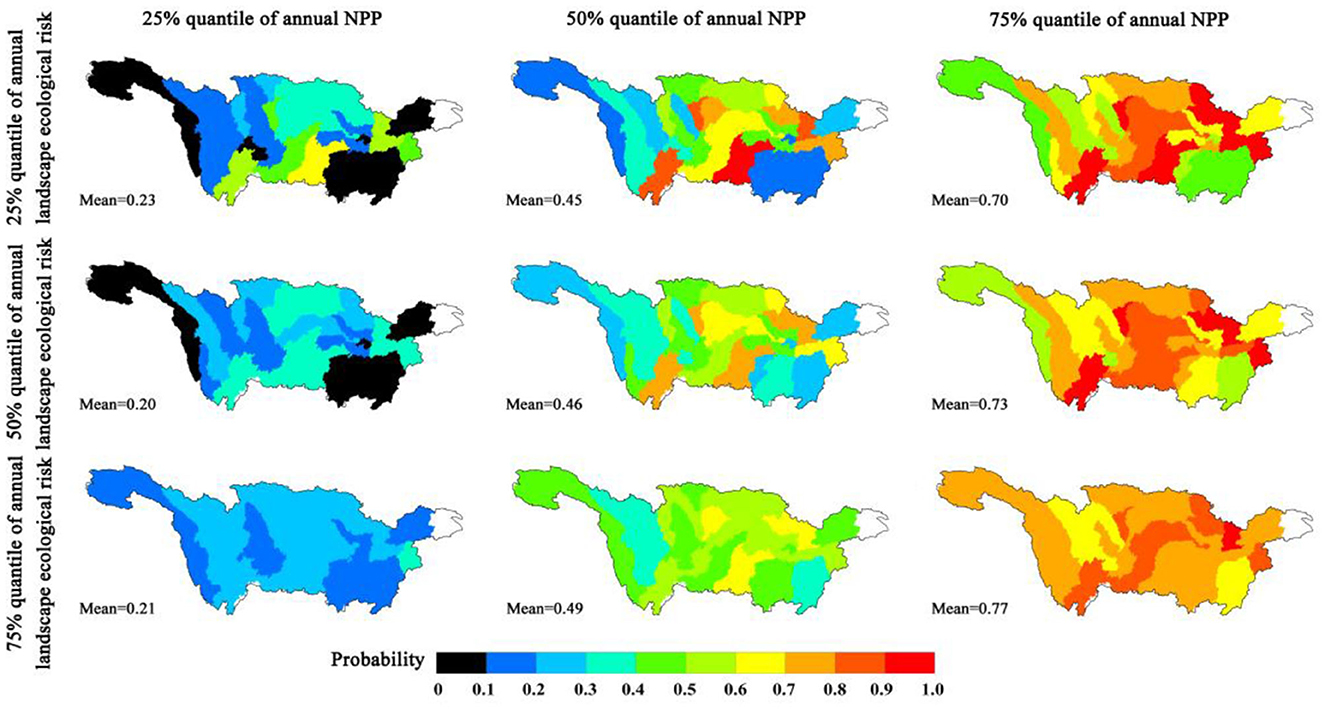
Figure 9. Spatial distribution of the probability of different annual NPP quantiles under the probability of different annual landscape ecological risk quantiles.
5 Discussion
5.1 Reasons for changes in LER
Assessment of LER was contingent upon the alteration of landscape structure and ecological degradation, which could be influenced by various factors (Wang et al., 2021a,b; Zhang et al., 2021; Ran et al., 2022). It was imperative to quantify the determinants driving LER in order to comprehend its dynamic progression. Previous studies have extensively investigated this aspect, taking into account indices such as NDVI, GPD, and POP (Karimian et al., 2022). This study primarily focused on the impacts of seven factors on LER, encompassing three aspects: climate, altitude, GDP, NDVI, precipitation, POP, slope, and temperature, as well as natural conditions of the surface and social economy.
According to the geodetector's factor analysis on the mean annual scale in the Yangtze River Basin, the altitude had the greatest impact on the LER, with the q-value reaching 0.45 (P = 0.16), followed by slope, NDVI, precipitation, POP, GDP, and temperature (Table 1). These findings highlighted that natural environmental factors played a significant role in changes in LER within the Yangtze River Basin on a mean annual scale. In addition, studies have shown that LER in the Lake Shengjin wetland in the lower reaches of the Yangtze River is influenced by seasonal changes (Zhu et al., 2020). Notably, the Dongjiang River Basin study by Karimian et al. (2022) reported that POP held the greatest influence on LER, with altitude following closely behind. Similarly, Ren and Cao (2022) highlighted temperature and per capita GDP as the primary influencers on LER in Liaoning Province. Chen et al.'s (2020) study in Shanghai, located in the Yangtze River Basin, found that land use change was the cause of LER changes. These studies indicated that human activity factors may be an important factor leading to changes in LER at the local regional scale, especially in urban areas. However, at a larger watershed scale, natural environmental factors were still the main factor that should lead to changes in LER.

Table 1. Results of factor detection.
Additionally, it had also been demonstrated by the investigation that human activities were responsible for the principal origin of such elevated ecological risk, and in light of this, the governing body needed to enhance their regulation of risk by substantially diminishing human activities, such as rapid urbanization and road expansion (Che et al., 2023). This intervention was vital for safeguarding the ecological integrity of this crucial area situated in the Qinghai-Tibet Plateau (Liang and Song, 2022). Zhang et al.'s (2023) study further pointed out that implementing risk zoning control was a necessary means in Hunan Province in the Yangtze River Basin. The findings from the interactive analysis indicated that the interaction impact of altitude and GDP, altitude and temperature, GDP and slope, GDP and temperature, and precipitation and temperature on LER weakened, whereas the interaction effects of other factors on LER enhanced (Table 2). These results validated the susceptibility of the Yangtze River Basin's LER to various interacting factors, and the impact of different factors on LER presents a complex relationship, emphasizing the urgent need for enhanced ecological environment protection in the region.
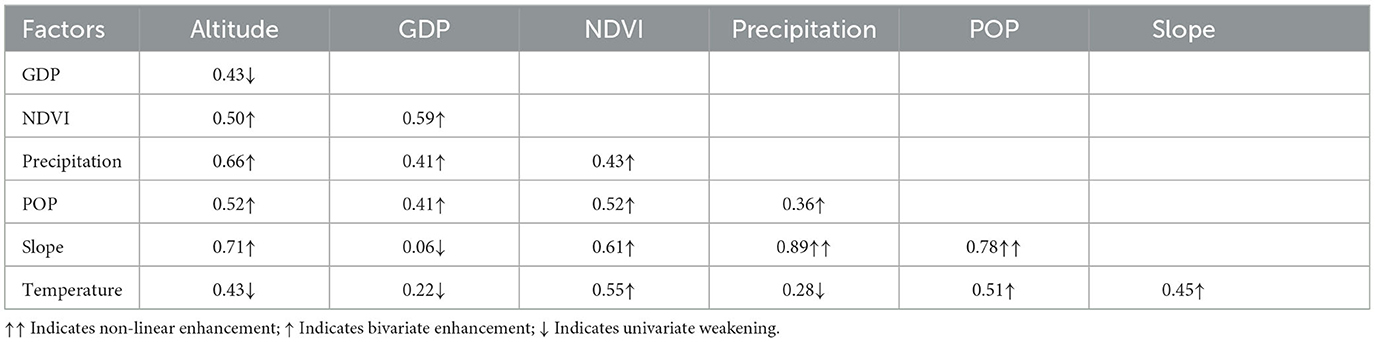
Table 2. Results of interactive detection.
5.2 Other causes of changes in NPP
After accounting for its own consumption, NPP denotes the capacity of vegetation to sequester carbon dioxide by means of photosynthesis (Erb et al., 2016; Zhao et al., 2020; Wei et al., 2022). Wang et al.'s (2021a,b) research indicated that the overall NPP in the Yangtze River Basin was increasing, with the upstream increasing at the fastest rate, while the areas where NPP decreased were mainly concentrated in cities and their surrounding areas. It can be affected by many factors outside the landscape pattern, such as solar radiation, precipitation, vegetation coverage, and so on. In the classical CASA model, a remote sensing model for NPP inversion, these factors were considered, and even more (Potter et al., 1993; Zhang et al., 2022b; Mu et al., 2023). Here, we examined the impact of solar radiation and NDVI on changes in NPP within the Yangtze River Basin.
According to the analysis conducted by MK, it had been found that a mere 4.81% of the region, where the annual precipitation exhibited a noticeable increase, was primarily concentrated in the source area of the Yangtze River, and on the other hand, a significant rise in annual temperature was observed in 85.29% of the area (Figures 10A, B; P < 0.05). It should be noted that only 2.65% of the regions displayed a substantial positive correlation between annual precipitation and annual NPP, while 8.15% exhibited a notable negative correlation (Figure 10E; P < 0.05). Similarly, a substantial positive correlation was observed in 35.27% of the areas between annual temperature and annual NPP, whereas a significant negative correlation was found in 2.08% of the regions (Figure 10F; P < 0.05). From the aforementioned analysis, it can be inferred that climate variables, particularly precipitation and temperature, had a significant impact on the variations in NPP. Moreover, it was important to highlight that the effects of temperature were more widespread throughout the Yangtze River Basin (P < 0.05).
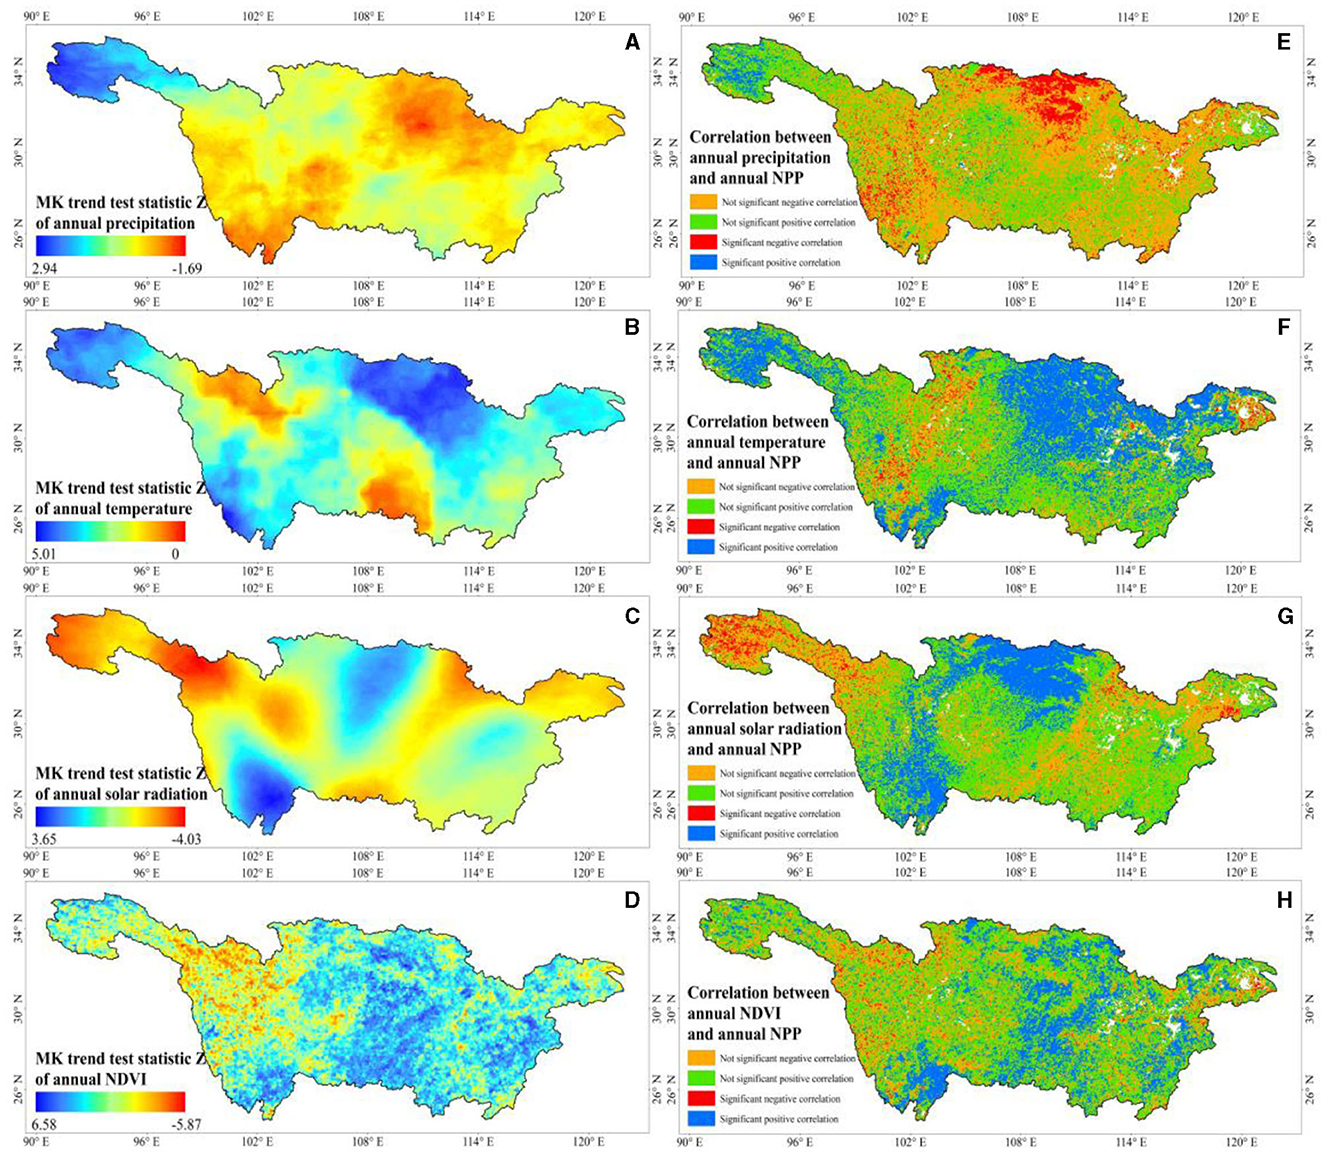
Figure 10. Trend of annual precipitation (A), annual temperature (B), annual solar radiation (C), annual NDVI (D), and their correlation with NPP (E–H), respectively.
Based on the MK trend analysis, it could be observed that ~6.49 and 20.01% of the total solar radiation area in the Yangtze River Basin exhibited noteworthy increasing and decreasing trends, respectively (Figure 10C; P < 0.05). Specifically, the regions experiencing a significant reduction in solar radiation were predominantly located in the source zone of the Yangtze River (P < 0.05). Conversely, the areas displaying a significant upsurge in solar radiation were mainly concentrated in the northern and southwestern parts of the Yangtze River Basin (P < 0.05). It was noteworthy to mention that there existed a substantial positive correlation between the annual solar radiation and the annual NPP in ~19.96% of the analyzed area, which areas primarily corresponded to regions where there was a noteworthy increase in the annual solar radiation (Figure 10G; P < 0.05). Conversely, in about 3.06% of the examined area, the annual solar radiation exhibited a notable negative correlation with the annual NPP, which was primarily observed in areas where the annual solar radiation witnessed a significant decrease (P < 0.05).
Moreover, the Yangtze River Basin experienced substantial alterations in the area covered by the annual NDVI. Specifically, 46.08% of this region displayed a notable surge, while 8.07% witnessed a significant decline (Figure 10D; P < 0.05). Within the areas where annual NDVI decreased, there was a predominant concentration near the source region of the Yangtze River. Conversely, the sections where annual NDVI increased were primarily concentrated in the middle of the Yangtze River Basin (P < 0.05). A significant positive correlation between annual NDVI and annual NPP was observed in 21.45% of the areas, whereas 2.01% of the areas exhibited a significant negative correlation (Figure 10H; P < 0.05). The distribution of these areas is generally aligned with the regions showing significant increases and decreases in annual NDVI. These findings provided additional evidence supporting the influence of changes in solar radiation and NDVI on NPP changes in the Yangtze River Basin, which suggested that higher solar radiation and NDVI values are favorable for increased NPP.
To summarize, in the Yangtze River Basin, alterations in NPP were primarily influenced by various factors, including precipitation, temperature, solar radiation, and NDVI. It was evident that climate factors played a crucial role in driving the changes observed in NPP within this region. The findings from Yang et al.'s (2021) study additionally supported the idea that both land use and climate change collectively contributed to the variations in NPP within the Yangtze River Basin, with climate change being the overarching determinant. Xu et al. (2023) had shown at the vegetation ecosystem level that climate change was the main driving force behind NPP changes. Besides solar radiation, NDVI, precipitation, and temperature, the alteration of topographic elements equally played a significant role in influencing the variations in vegetation and NPP (Peng et al., 2012; Xu et al., 2018; Wang et al., 2020b). Particularly for the arid valley region, topographical factors exerted the most prominent influence on NPP (Zhou et al., 2021). Hence, in the forthcoming period, it is imperative to exploit the carbon sink potential of terrestrial ecosystems in the Yangtze River Basin and capitalize on the local solar resources to optimize the landscape pattern wisely and significantly allocate vegetation types (Wu et al., 2023). In addition, future research should also strengthen research on soil carbon sinks (Cheng et al., 2023).
6 Conclusion
The assessment of LER and NPP plays a vital role in understanding the regional landscape structure, ecological processes, and carbon sink capacity of terrestrial ecosystems. In the context of ongoing global climate change, the evaluation of temporal and spatial variations in LER and its influence on NPP holds significant importance. In this investigation, we utilized the Yangtze River Basin in China as a case study to examine the spatiotemporal changes in LER and the non-linear impact it had on NPP. The study found that scale effects were observed in the changes in LER in the Yangtze River Basin. The spatial distribution of mean annual LER within the Yangtze River Basin exhibited a characteristic pattern of being high in the western region and low in the eastern region. Approximately 30.56% of sub-basins showed a significant increase in annual LER, while 22.22% of sub-basins exhibited a significant decrease trend (P < 0.05). The spatial distribution pattern of the mean annual NPP exhibited high values in the middle regions and low values in the western regions. Moreover, the spatial average value of annual NPP showed a significant increase from 1982 to 2015 (R2 = 0.58). A significant increase in annual NPP was testified in 94.44% of the sub-basins, with most sub-basins experiencing significant change points in annual NPP (P < 0.05). The relationship between annual NPP and LER exhibited a non-linear pattern; an increase in annual LER could lead to an increase in probability in both the median and high values of annual NPP. Climate factors played a pivotal role in driving changes in NPP within the same region.
Although this study revealed the non-linear relationship between LER and NPP, further research is necessary to explore the mechanism of this non-linear relationship. Furthermore, ecological risk management can be effectively carried out by dividing ecological zones. It is crucial to adopt a rational allocation of plant species, optimize landscape patterns, and maximize the utilization of solar resources to enhance carbon sinks in terrestrial vegetation in the future.
Data availability statement
Publicly available datasets were analyzed in this study. This data can be found at: https://essd.copernicus.org; http://www.resdc.cn/; https://daac.ornl.gov/; https://crudata.uea.ac.uk/cru/data/hrg/; http://www.geodata.cn/; and http://data.cma.cn/.
Author contributions
LJ: Data curation, Methodology, Writing – original draft, Writing – review & editing. KY: Conceptualization, Investigation, Supervision, Writing – review & editing. ZL: Conceptualization, Writing – review & editing. PL: Supervision, Writing – review & editing. PC: Writing – review & editing. BL: Supervision, Writing – review & editing.
Funding
The author(s) declare financial support was received for the research, authorship, and/or publication of this article. This study was supported by the National Natural Science Foundation of China (Nos. U2040208 and 52079104) and the Key Research and Development Program of Shaanxi Province (2023-ZDLSF-60).
Conflict of interest
The authors declare that the research was conducted in the absence of any commercial or financial relationships that could be construed as a potential conflict of interest.
Publisher's note
All claims expressed in this article are solely those of the authors and do not necessarily represent those of their affiliated organizations, or those of the publisher, the editors and the reviewers. Any product that may be evaluated in this article, or claim that may be made by its manufacturer, is not guaranteed or endorsed by the publisher.
References
Cao, Q. W., Zhang, X. W., Ma, H. K., and Wu, J. (2018). Review of landscape ecological risk and an assessment framework based on ecological services: ESRISK. Acta Geogr. Sin. 73, 843–855. doi: 10.11821/dlxb201805005
Che, M. L., Yang, F., Sun, J., Zhang, C., and Zhang, J. (2023). Influence of road network expansion on the landscape ecological risk in the Yangtze River Delta region over the past two decades. Ecol. Indicat. 156, 111178. doi: 10.1016/j.ecolind.2023.111178
Chen, J. D., Gao, M., Cheng, S. L., Hou, W., Song, M., Liu, X., et al. (2022). Global 1 km × 1 km gridded revised real gross domestic product and electricity consumption during 1992–2019 based on calibrated nighttime light data. Sci. Data 9, 202. doi: 10.1038/s41597-022-01322-5
Chen, S. S., Ma, M. H., Wu, S. J., Tang, Q., and Wen, Z. (2023). Topography intensifies variations in the effect of human activities on forest NPP across altitude and slope gradients. Environ. Dev. 45, 100826. doi: 10.1016/j.envdev.2023.100826
Chen, Y., Chen, X., and Li, J. (2020). Ecological risk assessment based on spatial-temporal evolution of land use in Shanghai. Jiangsu J. Agri. Sci. 36, 613–619. doi: 10.3969/j.issn.1000-4440.2020.03.012
Cheng, Y. T., Xu, G. C., Wang, X. K., Li, P., Dang, X., Jiang, W., et al. (2023). Contribution of soil aggregate particle size to organic carbon and the effect of land use on its distribution in a typical small watershed on Loess Plateau, China. Ecol. Indicat. 155, 110988. doi: 10.1016/j.ecolind.2023.110988
Dobson, J. E., Bright, E. A., Coleman, P. R., Durfee, R. C., and Worley, B. A. (2000). LandScan: a global population database for estimating populations at risk. Photogram. Eng. Remote Sens. 66, 849–857.
Erb, K. H., Fetzel, T., Plutzar, C., Kastner, T., Lauk, C., Mayer, A., et al. (2016). Biomass turnover time in terrestrial ecosystems halved by land use. Nat. Geosci. 9, 674–678. doi: 10.1038/ngeo2782
Fang, W., Huang, S. Z., Huang, Q., Huang, G., Wang, H., Leng, G., et al. (2019). Bivariate probabilistic quantification of drought impacts on terrestrial vegetation dynamics in mainland China. J. Hydrol. 577, 123980. doi: 10.1016/j.jhydrol.2019.123980
Gong, J., Yang, J. X., and Tang, W. W. (2015). Spatially explicit landscape-level ecological risks induced by land use and land cover change in a national ecologically representative region in China. Int. J. Environ. Res. Publ. Health 12, 14192–14215. doi: 10.3390/ijerph121114192
Guo, Y., Huang, Q., Huang, S. Z., Leng, G., Zheng, X., Fang, W., et al. (2021). Elucidating the effects of mega reservoir on watershed drought tolerance based on a drought propagation analytical method. J. Hydrol. 598, 125738. doi: 10.1016/j.jhydrol.2020.125738
Hao, R. F., Yu, D. Y., Huang, T., Li, S., and Qiao, J. (2022). NPP plays a constraining role on water-related ecosystem services in an alpine ecosystem of Qinghai, China. Ecol. Indicat. 138, 108846. doi: 10.1016/j.ecolind.2022.108846
Karimian, H., Zou, W. M., Chen, Y. L., Xia, J., and Wang, Z. (2022). Landscape ecological risk assessment and driving factor analysis in Dongjiang river watershed. Chemosphere 307, 135835. doi: 10.1016/j.chemosphere.2022.135835
Lal, P., Shekhar, A., and Kumar, A. (2021). Quantifying temperature and precipitation change caused by land cover change: a case study of India using the WRF model. Front. Environ. Sci. 9, 766328. doi: 10.3389/fenvs.2021.766328
Landis, W. G., and Wiegers, J. K. (2007). Ten years of the relative risk model and regional scale ecological risk assessment. Hum. Ecol. Risk Assess. 13, 25–38. doi: 10.1080/10807030601107536
Li, J., and Zhou, Z. X. (2015). Coupled analysis on landscape pattern and hydrological processes in Yanhe watershed of China. Sci. Tot. Environ. 505, 927–938. doi: 10.1016/j.scitotenv.2014.10.068
Li, T., Luo, W., Yang, B., Huang, M., Shuai, S., Cheng, C., et al. (2023). Evaluation of landscape ecological risk in key ecological functional zone of South-to-North Water Diversion Project, China. Ecol. Indicat. 147, 109934. doi: 10.1016/j.ecolind.2023.109934
Li, W. J., Wang, Y., Xie, S. Y., Sun, R., and Cheng, X. (2020). Impacts of landscape multifunctionality change on landscape ecological risk in a megacity, China: a case study of Beijing. Ecol. Indicat. 117, 106681. doi: 10.1016/j.ecolind.2020.106681
Liang, Y., and Song, W. (2022). Integrating potential ecosystem services losses into ecological risk assessment of land use changes: a case study on the Qinghai-Tibet Plateau. J. Environ. Manag. 318, 115607. doi: 10.1016/j.jenvman.2022.115607
Lin, Y. Y., Hu, X. S., Zheng, X. X., Hou, X., Zhang, Z., Zhou, X., et al. (2019). Spatial variations in the relationships between road network and landscape ecological risks in the highest forest coverage region of China. Ecol. Indicat. 96, 392–403. doi: 10.1016/j.ecolind.2018.09.016
Liu, C. M., Zhang, D., Liu, X. M., and Zhao, C. (2012). Spatial and temporal change in the potential evapotranspiration sensitivity to meteorological factors in China (1960–2007). J. Geogr. Sci. 22, 3–14. doi: 10.1007/s11442-012-0907-4
Liu, H., Gong, P., Wang, J., Clinton, N., Bai, Y., and Liang, S. (2020). Annual dynamics of global land cover and its long-term changes from 1982 to 2015. Earth Syst. Sci. Data 12, 1217–1243. doi: 10.5194/essd-12-1217-2020
Ma, B. X., Jing, J. L., Liu, B., Wang, Y., and He, H. (2023). Assessing the contribution of human activities and climate change to the dynamics of NPP in ecologically fragile regions. Glob. Ecol. Conserv. 42, e02393. doi: 10.1016/j.gecco.2023.e02393
Mann, H. B. (1945). Nonparametric test against trend. Econometrica 13, 245–259. doi: 10.2307/1907187
Mu, W. B., Zhu, X. Y., Ma, W. X., Han, Y., Huang, H., and Huang, X. (2023). Impact assessment of urbanization on vegetation net primary productivity: a case study of the core development area in central plains urban agglomeration, China. Environ. Res. 229, 115995. doi: 10.1016/j.envres.2023.115995
Ouyang, X., Tang, L. S., Wei, X., and Li, Y. (2021). Spatial interaction between urbanization and ecosystem services in Chinese urban agglomerations. Land Use Policy 109, 105587. doi: 10.1016/j.landusepol.2021.105587
Paukert, C. P., Pitts, K. L., Whittier, J. B., and Olden, J. D. (2011). Development and assessment of a landscape-scale ecological threat index for the Lower Colorado River Basin. Ecol. Indicat. 11, 304–310. doi: 10.1016/j.ecolind.2010.05.008
Peng, J., Liu, Z. H., Liu, Y. H., Wu, J., and Han, Y. (2012). Trend analysis of vegetation dynamics in Qinghai-Tibet Plateau using Hurst Exponent. Ecol. Indicat. 14, 28–39. doi: 10.1016/j.ecolind.2011.08.011
Pettitt, A. N. (1979). A non-parametric approach to the change-point problem. J. Royal Stat. Soc. 28, 126–135. doi: 10.2307/2346729
Potter, C. S., Randerson, J. T., Field, C. B., Matson, P. A., Vitousek, P. M., Mooney, H. A., et al. (1993). Terrestrial ecosystem production: a process model based on global satellite and surface data. Glob. Biogeochem. Cycl. 7, 811–841. doi: 10.1029/93GB02725
Ran, P. L., Hu, S. G., Frazier, A. E., Qu, S., Yu, D., and Tong, L. (2022). Exploring changes in landscape ecological risk in the Yangtze River Economic Belt from a spatiotemporal perspective. Ecol. Indicat. 137, 108744. doi: 10.1016/j.ecolind.2022.108744
Ren, D. F., and Cao, A. H. (2022). Analysis of the heterogeneity of landscape risk evolution and driving factors based on a combined GeoDa and Geodetector model. Ecol. Indicat. 144, 109568. doi: 10.1016/j.ecolind.2022.109568
Song, Y. Z., Wang, J. F., Ge, Y., and Xu, C. (2020). An optimal parameters-based geographical detector model enhances geo-graphic characteristics of explanatory variables for spatial heterogeneity analysis: cases with different types of spatial data. GIScience Remote Sens. 57, 593–610. doi: 10.1080/15481603.2020.1760434
Wang, B. B., Ding, M. J., Li, S. C., Liu, L., and Ai, J. (2020a). Assessment of landscape ecological risk for a cross-border basin: a case study of the Koshi River Basin, central Himalayas. Ecol. Indicat. 117, 106621. doi: 10.1016/j.ecolind.2020.106621
Wang, H., Liu, G. H., Li, Z. S., Zhang, L., and Wang, Z. (2020b). Processes and driving forces for changing vegetation ecosystem services: Insights from the Shaanxi Province of China. Ecol. Indicat. 112, 106105. doi: 10.1016/j.ecolind.2020.106105
Wang, H., Liu, X. M., Zhao, C. Y., Chang, Y., Liu, Y., and Zang, F. (2021a). Spatial-temporal pattern analysis of landscape ecological risk assessment based on land use/land cover change in Baishuijiang National nature reserve in Gansu Province, China. Ecol. Indicat. 124, 107454. doi: 10.1016/j.ecolind.2021.107454
Wang, J. F., and Xu, C. D. (2017). Geodetector: principle and prospective. Acta Geograph. Sin. 72, 116–134. doi: 10.11821/dlxb201701010
Wang, J. Y., Delang, C. O., Hou, G. L., Gao, L., and Lu, X. (2021b). Net primary production increases in the Yangtze River Basin within the latest two decades. Glob. Ecol. Conserv. 26, e01497. doi: 10.1016/j.gecco.2021.e01497
Wei, X. D., Yang, J., Luo, P. P., Li, L., Lin, K., and Guan, J. (2022). Assessment of the variation and influencing factors of vegetation NPP and carbon sink capacity under different natural conditions. Ecol. Indicat. 138, 108834. doi: 10.1016/j.ecolind.2022.108834
Wu, L. H., Zhang, Y., Luo, G. J., Chen, D., Yang, D., Yang, Y., et al. (2023). Characteristics of vegetation carbon sink carrying capacity and restoration potential of China in recent 40 years. Front. For. Glob. Change 6, 12866688. doi: 10.3389/ffgc.2023.1266688
Xie, H. L., He, Y. F., Choi, Y. R., Chen, Q., and Cheng, H. (2020). Warning of negative effects of land-use changes on ecological security based on GIS. Sci. Tot. Environ. 704, 135427. doi: 10.1016/j.scitotenv.2019.135427
Xu, G. C., Zhang, J. X., Li, P., Li, Z., Lu, K., Wang, X., et al. (2018). Vegetation restoration projects and their influence on runoff and sediment in China. Ecol. Indicat. 95, 233–241. doi: 10.1016/j.ecolind.2018.07.047
Xu, Y., Lu, Y. G., Zou, B., Xu, M., and Feng, Y. X. (2023). Unraveling the enigma of NPP variation in Chinese vegetation ecosystems: the interplay of climate change and land use change. Sci. Tot. Environ. 912, 169023. doi: 10.1016/j.scitotenv.2023.169023
Yang, H. Y., Zhong, X. N., Deng, S. Q., and Xu, H. (2021). Assessment of the impact of LUCC on NPP and its influencing factors in the Yangtze River basin, China. Catena 206, 105542. doi: 10.1016/j.catena.2021.105542
Yu, T., Sun, R., Xiao, Z. Q., Zhang, Q., Liu, G., Cui, T., et al. (2018). Estimation of global vegetation productivity from global land surface satellite data. Remote Sens. 10, 327. doi: 10.3390/rs10020327
Zhang, D. H., Jing, P. Q., Sun, P. J., Ren, H., and Ai, Z. (2022a). The non-significant correlation between landscape ecological risk and ecosystem services in Xi'an Metropolitan Area, China. Ecol. Indicat. 141, 109118. doi: 10.1016/j.ecolind.2022.109118
Zhang, M., Yuan, N. Q., Lin, H., Liu, Y., and Zhang, H. (2022b). Quantitative estimation of the factors impacting spatiotemporal variation in NPP in the Dongting Lake wetlands using Landsat time series data for the last two decades. Ecol. Indicat. 135, 108544. doi: 10.1016/j.ecolind.2022.108544
Zhang, S. H., Zhong, Q. L., Cheng, D. L., Xu, C., Chang, Y., Lin, Y., et al. (2022c). Landscape ecological risk projection based on the PLUS model under the localized shared socioeconomic pathways in the Fujian Delta region. Ecol. Indicat. 136, 108642. doi: 10.1016/j.ecolind.2022.108642
Zhang, Y., Li, Y. Z., Lv, J., Wang, J., and Wu, Y. (2021). Scenario simulation of ecological risk based on land use/cover change—a case study of the Jinghe county, China. Ecol. Indicat. 131, 108176. doi: 10.1016/j.ecolind.2021.108176
Zhang, Y. L., Hu, X. J., Wei, B. J., Zhang, X., Tang, L., Chen, C., et al. (2023). Spatiotemporal exploration of ecosystem service value, landscape ecological risk, and their interactive relationship in Hunan Province, Central-South China, over the past 30 years. Ecol. Indicat. 156, 111066. doi: 10.1016/j.ecolind.2023.111066
Zhao, F. B., Wu, Y. P., Yin, X. W., Alexandrov, G., and Qiu, L. (2022). Toward sustainable revegetation in the Loess Plateau using coupled water and carbon management. Engineering 15, 143–153. doi: 10.1016/j.eng.2020.12.017
Zhao, P., Wang, D. J., He, S. T., Lan, H., Chen, W., and Qi, Y. (2020). Driving forces of NPP change in debris flow prone area: a case study of a typical region in SW China. Ecol. Indicat. 119:106811. doi: 10.1016/j.ecolind.2020.106811
Zhou, Y. Y., Yue, D. X., Li, C., Mu, X., and Guo, J. (2021). Identifying the spatial drivers of net primary productivity: a case study in the Bailong River Basin, China. Glob. Ecol. Conserv. 28, e01685. doi: 10.1016/j.gecco.2021.e01685
Keywords: landscape ecological risk, NPP, temporal and spatial variation, non-linear response, Yangtze River Basin
Citation: Jia L, Yu K, Li Z, Li P, Cong P and Li B (2024) Spatiotemporal pattern of landscape ecological risk in the Yangtze River Basin and its influence on NPP. Front. For. Glob. Change 6:1335116. doi: 10.3389/ffgc.2023.1335116
Received: 08 November 2023; Accepted: 18 December 2023;
Published: 23 January 2024.
Edited by:
Zisheng Xing, Agriculture and Agri-Food Canada (AAFC), CanadaReviewed by:
Yang Yu, Beijing Forestry University, ChinaFubo Zhao, Xi'an Jiaotong University, China
Copyright © 2024 Jia, Yu, Li, Li, Cong and Li. This is an open-access article distributed under the terms of the Creative Commons Attribution License (CC BY). The use, distribution or reproduction in other forums is permitted, provided the original author(s) and the copyright owner(s) are credited and that the original publication in this journal is cited, in accordance with accepted academic practice. No use, distribution or reproduction is permitted which does not comply with these terms.
*Correspondence: Kunxia Yu, yukunxia@126.com