Early detection of bark beetle infestation using UAV-borne multispectral imagery: a case study on the spruce forest in the Czech Republic
 Tomáš Klouček
 Roman Modlinger
 Markéta Zikmundová1,3
  Marlena Kycko
 Jan Komárek
- 1Department of Spatial Sciences, Faculty of Environmental Sciences, Czech University of Life Sciences Prague, Prague, Czechia
- 2Forest Risk Research Centre, Faculty of Forestry and Wood Sciences, Czech University of Life Sciences Prague, Prague, Czechia
- 3Department of Mathematics, Informatics and Cybernetics, Faculty of Chemical Engineering, University of Chemistry and Technology Prague, Prague, Czechia
- 4Department of Geoinformatics, Cartography and Remote Sensing, Faculty of Geography and Regional Studies, University of Warsaw, Warsaw, Poland
Over the last decade, biotic disturbances caused by bark beetles have represented a serious environmental and economic issue in Central Europe. Great efforts are expended on the early detection and management of bark beetle infestation. Our study analyses a time series of UAV-borne multispectral imagery of a 250-ha forest in the Vysočina region in the Czech Republic. The study site represents a typical European spruce forest with routine silvicultural management. UAV-borne data was acquired three times during the vegetation period, specifically (a) before swarming, (b) at the early stage of infestation, and (c) in the post-abandon phase, i.e., after most bark beetle offspring left the trees. The spectral reflectance values and vegetation indices calculated from orthorectified and radiometrically calibrated imageries were statistically analyzed by quadratic discriminant analysis (QDA). The study shows that healthy and infested trees could be distinguished at the early stage of infestation, especially using NIR-related vegetation indices (NDVI and BNDVI in our case). Detecting infested trees is more significant by vegetation indices than spectral bands and increases with the increasing time after infestation. The study verified the usability of UAV-borne multispectral imageries for early detection of bark beetle infestation at the level of individual trees. Thus, these methods can contribute to precise and effective forest management on a local level.
1 Introduction
In the last decades, we are witnessing the destruction of the central European Norway spruce Picea abies (L.) H. Karst. forests by unprecedented bark beetle outbreaks. These are augmented by climatic drivers (hot weather and periods of lower precipitation causing drought) and the increasing frequency and severity of wind disturbances (Schelhaas et al., 2003; Modlinger and Novotný, 2015; Hlásny et al., 2021c; Patacca et al., 2023) associated with climate change globally affecting forest ecosystems (Seidl et al., 2017; Hlásny et al., 2021a). Since 2015 to the present, spruce forests have been demonstrably threatened in the Czech Republic, mainly by the European spruce bark beetle Ips typographus (L.) (Hais et al., 2016; Minařík and Langhammer, 2016; Fernandez-Carrillo et al., 2020; Minařík et al., 2020; Bárta et al., 2022); this situation is similar in other Central European countries (Gdulová et al., 2021) such as Germany (Zimmermann and Hoffmann, 2020), Austria (Immitzer and Atzberger, 2014), Slovakia (Havašová et al., 2015), and Poland (Stereńczak et al., 2020). The Czech Republic has become Europe’s epicenter of the bark beetle outbreak, and a short time prognosis (Hlásny et al., 2021b) does not promise early improvement of the situation.
A detailed field survey with an emphasis on the early detection of newly infested spruce trees in the so-called “green-attack” stage (Wulder et al., 2006) just after bark beetle swarming (Hlásny et al., 2019) is one of the most effective tools of forest management; it is, however, often difficult to achieve at the time of outbreaks (Vošvrdová et al., 2023). Moreover, it is often costly and time-consuming (Abdullah et al., 2018, 2019b). Therefore, solutions are searched for to replace or supplement and simplify field surveys. The information about infested trees is crucial not only for the minimization of economic losses (allowing the stoppage or at least slowing down of bark beetle outbreaks) but also from the environmental point of view (Zimmermann and Hoffmann, 2020) as it can help understand the spatial spreading of bark beetle infestation and help predict its future development (Hlásny et al., 2021b,c).
Remote sensing (RS) is the approach with the highest potential to overcome the limitations of field surveys, and its importance in bark beetle detection is gradually growing. The RS applicability relies on significant differences in spectral reflectance of healthy and infested trees, which can be recorded by sensors placed on various platforms. This theoretical assumption was confirmed by Foster et al. (2017) and Abdullah et al. (2018) using in situ spectroscopy measurements. The use of RS methods for the detection of trees infested by bark beetle has been the subject of many studies [see, e.g., reviews published by Wulder et al. (2006), Senf et al. (2017), Abd El-Ghany et al. (2020), Zabihi et al. (2021), and Kautz et al. (2024)]. However, most of these studies are on coarse (national) scales, typically using data from high-resolution multispectral satellites (Latifi et al., 2014; Havašová et al., 2015; Senf et al., 2015; Hais et al., 2016; Stych et al., 2019). At present, the applicability of the data from the Copernicus program (Sentinel1 and Sentinel-2) has been extensively studied (Abdullah et al., 2019b; Zimmermann and Hoffmann, 2020; Bárta et al., 2021; Huo et al., 2021). For fine-scale (local) analysis, methods using Unmanned Aerial Vehicle (UAV) based technology are potentially valuable, especially in forests with high conservation or economic value. In such areas, very detailed and repeated field surveys are needed, which well fits the advantages of UAVs (Näsi et al., 2015; Minařík and Langhammer, 2016; Dash et al., 2017; Brovkina et al., 2018; Stoyanova et al., 2018; Klouček et al., 2019; Minařík et al., 2020, 2021; Slavík et al., 2020; Huo et al., 2023). The regional scale analysis, a “compromise” between the above-mentioned RS approaches, uses airborne RS with, in particular, hyperspectral sensors for bark beetle detection (Lausch et al., 2013; Fassnacht et al., 2014; Näsi et al., 2018; Bárta et al., 2022). As discussed by Bárta et al. (2021) and Abdullah et al. (2019b) existing studies are mainly focusing on the mapping of later stages, tree mortality, or forest disturbances in general. However, these approaches are not suitable for effective stoppage or slowing down of the bark beetle outbreaks (Immitzer and Atzberger, 2014). UAVs bring many benefits to forest management from the perspective of bark beetle detection issues. For instance, their spatial resolution allows the detection at the level of the individual tree (Dash et al., 2017). The current fixed-wing UAVs can cover areas of square kilometers (Li et al., 2020). Thanks to available cloud processing platforms (Moeyersons et al., 2021) and the necessary knowledge of UAV-borne image processing, even the analysis is getting more user-friendly.
The presented study aims to answer the question of whether multispectral imagery acquired by fixed-wing UAVs is able to detect the early stage of bark beetle infestation at the level of individual trees. The investigation is evaluated using three partial hypotheses, namely: (a) the reflectances in the individual bands differ between infested and healthy spruces at a stage when the bark beetles have not yet left the trees, (b) the same can be said for the selected vegetation indices, (c) these differences are more pronounced for the vegetation indices than for the reflectances in the individual bands, and their use sufficiently distinguishes between healthy and early infested spruces.
2 Materials and methods
2.1 Study site
The study area is situated in the Vysočina region, in the center of the Czech Republic, near the town of Nové Město na Moravě (Figure 1). The study area occupies 250 ha and is covered mainly by a Norway spruce forest (Picea abies), growing at elevations between 610 and 780 m a.s.l. The site is a representation of a typical central European coniferous production forest. 10% of trees in the study area were under 18 m in height, 47% of trees were within the height range of 19–24 m, 25% in the range of 25–30 m, and 18% were over 31 m. 21% of trees were younger than 40 years, 41% were 41–80 years old, 32% 81–120 years old, and 6% were over 120 years old, respectively. The canopy was 100% closed in 39% of the area, 90% closed in 32% of the study area, and 80% closed in 28% of the area (FMI, 2024).
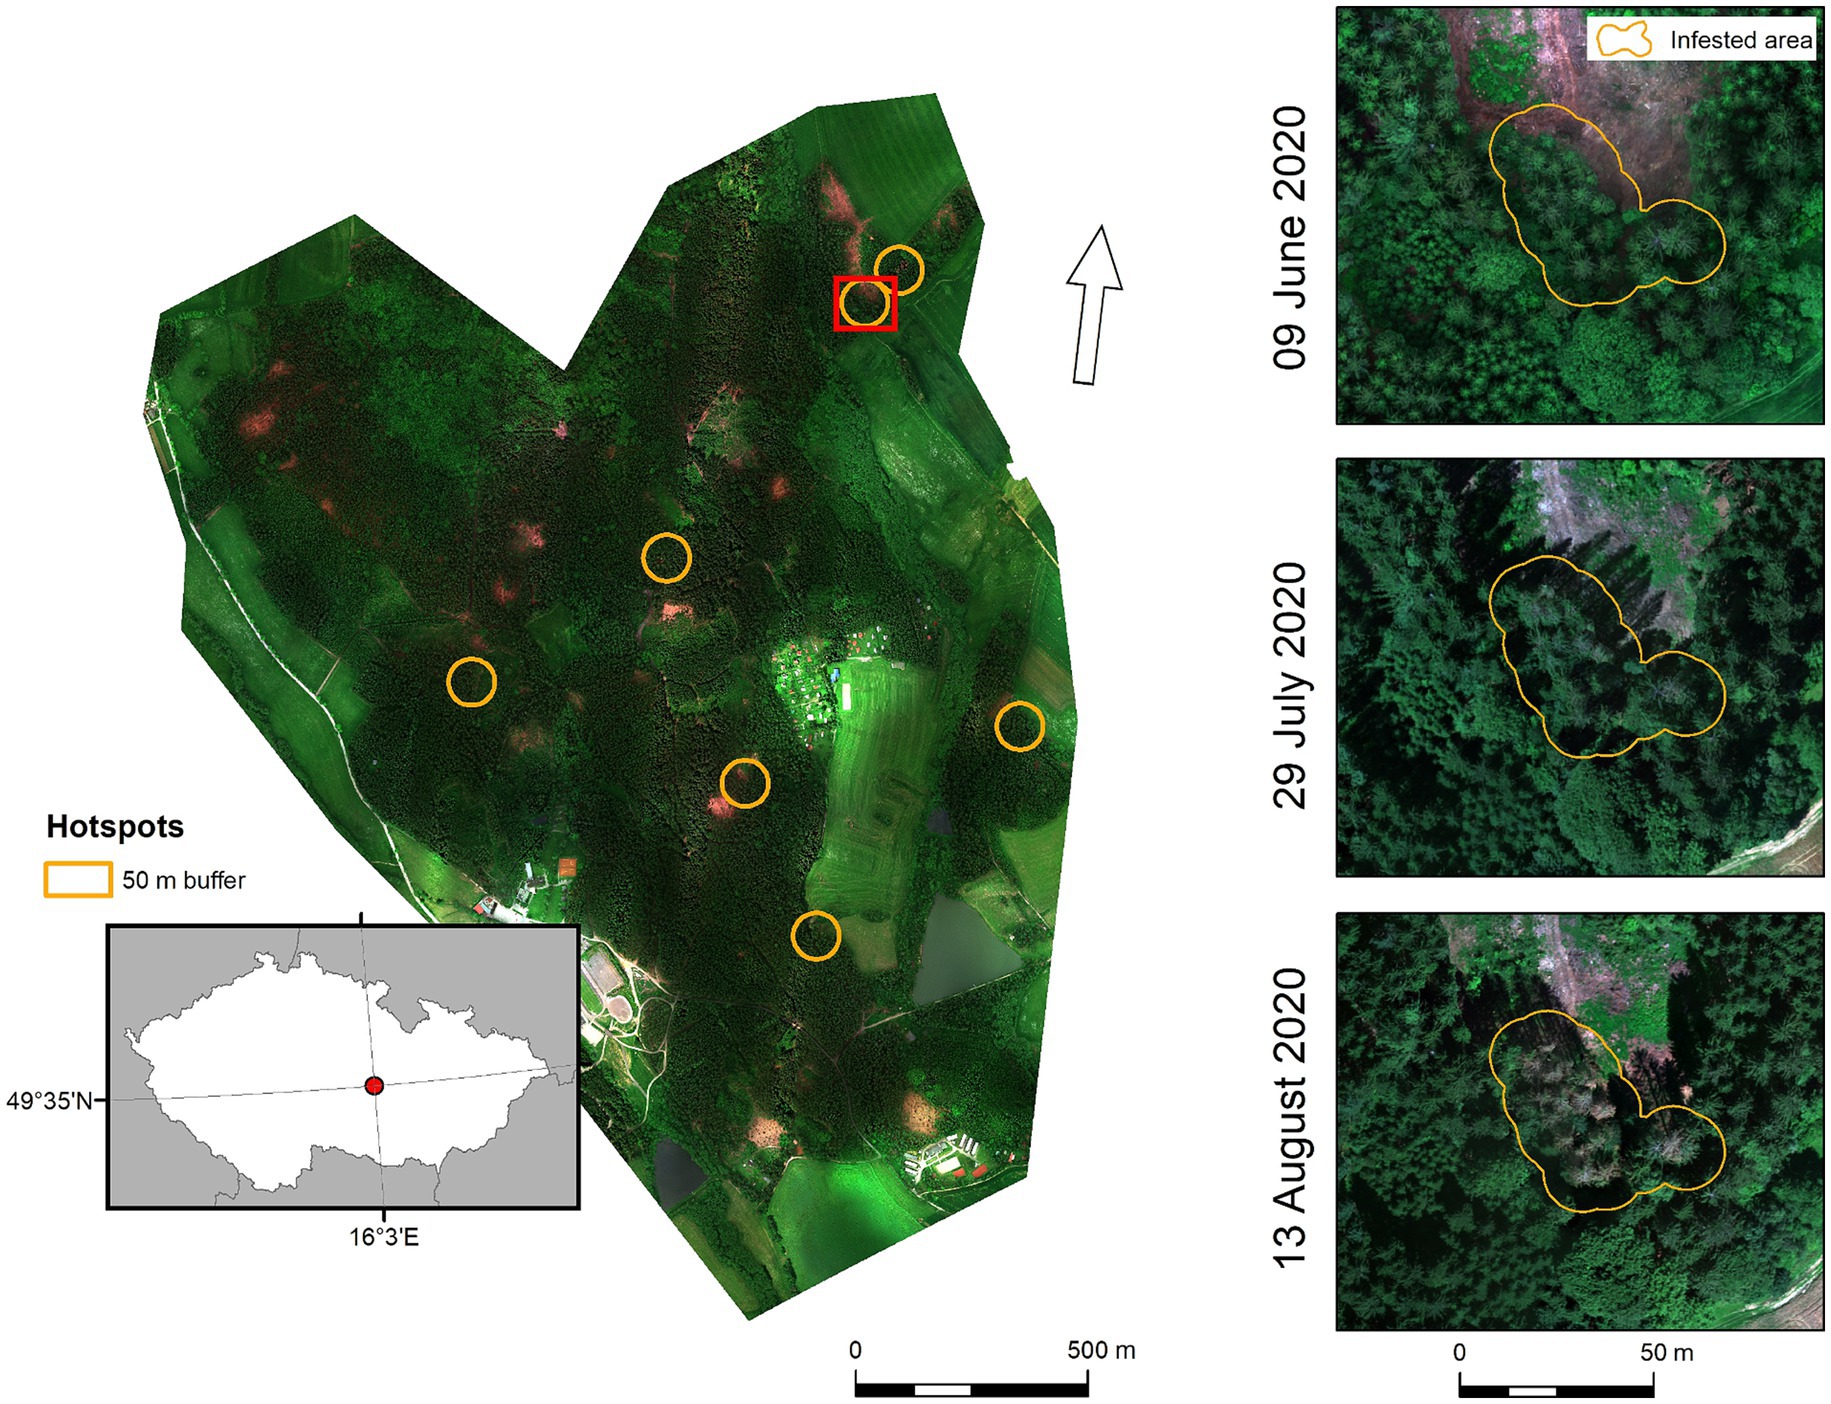
Figure 1. The location of the study area (red dot on the Czech Republic map) and the study site’s extent. The background image represents the true color composite for the first sensing period (09 June). Identified infested hotspots (orange circles) and the detail of one particular bark beetle hotspot (red square) in the study area shows UAV-borne imagery acquired: before bark beetle activity (09 June), after the swarming on 29 July, and in the phase of tree abandonment by most of the new generation bark beetles on 13 August.
Besides silviculture, however, these forests also have an important recreation function (the center of many sports activities). Thanks to this, the forest management in this part of Vysočina area is particularly meticulous (field surveys, early felling, and removal of infested trees, etc.) and although the entire region counts among the areas most affected by the bark beetle infestation in the Czech Republic (Hlásny et al., 2021c), but locally in the area of study the damage to this area remains minimal.
2.2 Bark beetle season and development
Compared to several previous vegetation seasons, the year 2020 was colder and higher in precipitation (see Table A1). The bark beetle activity depends on air temperatures; the swarming can start when the minimum air temperature reaches 16.5°C (Wermelinger, 2004). In the study area, swarming typically occurs in late May (Matějka and Modlinger, 2023) but in 2020, the cold and wet spring/early summer period delayed the peak of the first swarming and mass attack of standing trees to the 25th week of the year (15–21 June 2020). We applied the phenological model PHENIPS (Baier et al., 2007) to project the development of the bark beetle offspring under the bark of infested trees. For the calculation of degree days (dd), data from the nearest meteorological stations of the Czech Hydrometeorological Institute (CHMI) Vatín (558 m a.s.l.) and Bystřice pod Pernštejnem (553 m a.s.l.) were used. Specifically, the mean daily temperature [°C], the maximum daily temperature [°C], and the daily sum of solar radiation in Wh.m−2 were included in the calculation. The mean values from both stations were always used and interpolated to the target altitude of 650 m a.s.l. At the time of the second acquisition, a value of 474 dd was achieved, which corresponds to the pupal stage. The adult phase development of the bark beetle was completed on 06 August. Field observations confirmed the predicted values based on calculation of degree days (dd).
2.3 Acquisition and processing of UAV imagery
The UAV-based imagery acquisition periods represent phases of bark beetle development with visible symptoms in the tree crown (for conditions in the Czech Republic) (a) before swarming on 09 June, (b) the early stage of infestation (green-stage) on 29 July, and (c) the phase of abandonment of trees by most of the bark beetle offspring (yellow/red-stage) on 13 August (Huo et al., 2021). The period of flights was planned with respect to the current conditions (temperature, precipitations) and the probability of bark beetle swarming based on the knowledge of local foresters. The acquisition of UAV images was performed using the fixed-wing eBee X (senseFly, Cheseaux-sur-Lausanne, Switzerland) equipped with the RedEdge-MX (MicaSense, Seattle, United States) multispectral camera (see Table 1 for sensor details). Flight missions predefined using the eMotion ground control software, version 3.20 (senseFly, Cheseaux-sur-Lausanne, Switzerland), were performed at approximately 150 m above ground level with regular 80% side and frontal overlaps; each mission consists of two flights taking approx. 60 min each. All flights were performed approximately at solar noon (±2 h). The weather was sunny, with occasional clouds, for all flights.
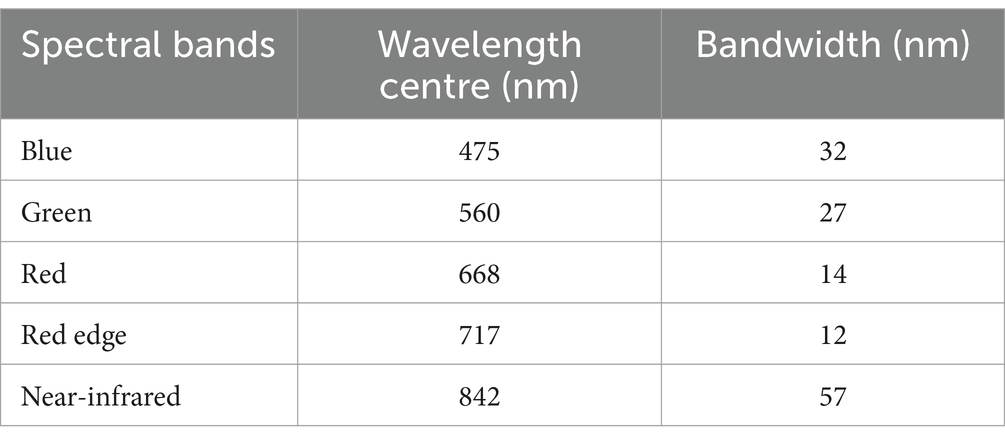
Table 1. Brief description of spectral properties of the RedEdge-MX (MicaSense, Seattle, United States) multispectral camera.
UAV-borne imagery was processed using the image-matching software Metashape version 1.7.3 (Agisoft LLC, Saint Petersburg, Russia). The workflow included standard Structure from Motion (SfM) and Multi-View Stereo processing steps [see Klouček et al. (2019) for details], yielding orthomosaics with a 0.16 m pixel size calibrated using high-reflectance targets and irradiance values. Subsequently, digital surface (DSMs) and digital terrain models (DTMs) with 0.32 m pixel size were created. The calculation of accurate spectral reflectance values using radiometric calibration is a crucial step in UAV-borne data processing. This procedure is necessary when time-series images are analyzed or vegetation indices are calculated (Song et al., 2001). We used the processing workflow recommended by the RedEdge-MX sensor manufacturer using the Metashape software and calibration target with laboratory-measured calibration parameters to guarantee the acquisition of reliable reflectance data throughout the bark beetle season.
2.4 Field survey and creation of tree database
An individual tree detection method was applied using the local maxima filtering approach (Panagiotidis et al., 2017; Surový et al., 2018; Klouček et al., 2022; Komárek et al., 2022) to facilitate database creation. In this way, we created a tree database including all Norway spruce trees (almost 55,000 individuals, 441 were newly infested). As reference data, we used field data provided by the foresters based on their regular field inspections and the database provided by the national Forest Management Institute (FMI, 2022).
Based on the observation of local forest managers, the peak of swarming in the study area was on 15 June. The field survey of newly infested trees was performed by local forest managers on 06 August. The studied period corresponds to the dates of acquisition of UAV-borne images (a) before bark beetle activity (09 June), (b) during the time of offspring development (29 July), and (c) on 13 August, after the offspring left the trees.
Our study aimed to evaluate healthy and infested trees across sensing periods. For this reason, only infested trees determined by the forest manager that remained standing until the last flight served as reference ground truth data for subsequent analyses (i.e., we excluded from analysis trees that were felled to prevent bark beetle spread before the last flight). Finally, seven active bark beetle hotspots were identified (see Figure 1), with 84 Norway spruce trees newly infested during the first bark beetle generation in 2020.
2.5 Image analysis
Pixels representing shadows were masked by thresholding of near-infrared bands. The unique thresholds for orthomosaics were set manually (by trial-and-error approach to visually achieve masking of all shadows; one threshold for the entire orthomosaic acquired during one flight), and the results were visually inspected as in our previous work (Klouček et al., 2019). For every tree, we extracted the (a) mean spectral reflectance value in a 0.5 m buffer around the tree top for spectral bands of masking orthomosaics and (b) height information from the normalized digital surface model (nDSM) calculated by subtracting the DTM from DSM (acquired 09 June). ArcGIS Pro version 2.9.3 (ESRI, Redlands, CA, United States) was used for this process.
2.6 Vegetation indices calculation
From the list of available spectral indices (Bannari et al., 1995; Henrich et al., 2009), we selected typical representatives of broadband normalized vegetation indices (VIs) for further bark beetle detection analysis. Specifically, we calculated Green Leaf Index (GLI), Normalized Difference Green/Red Index (NDGRI), Normalized Difference Red Edge Index (NDRE), Normalized Difference Vegetation Index (NDVI), Green Normalized Difference Vegetation Index (GNDVI), and Blue Normalized Difference Vegetation Index (BNDVI), see formulas in Table 2. We considered only indices that, according to our previous study (Klouček et al., 2018), are very unlikely to mutually correlate. ArcGIS Pro was used for the calculation of vegetation indices.
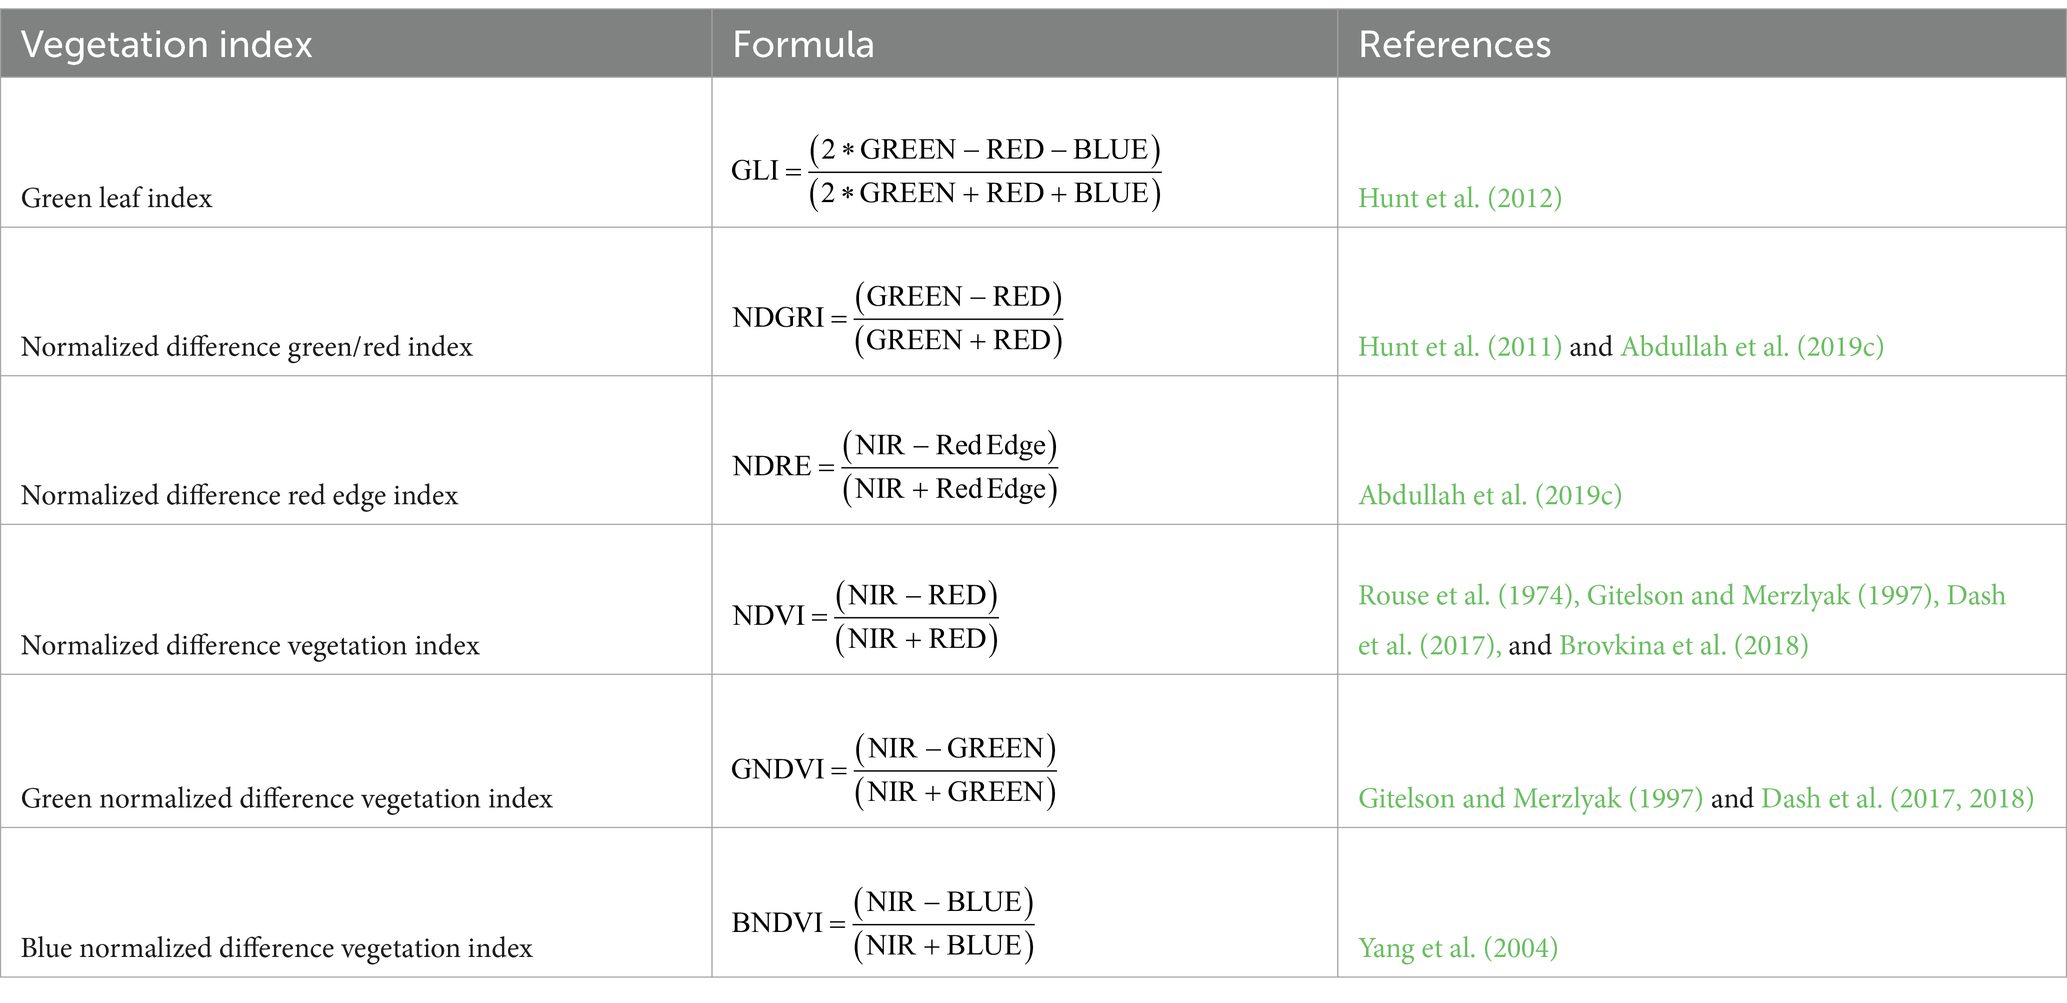
Table 2. Calculated broadband normalized vegetation indices with formulas and examples of use (Henrich et al., 2009).
2.7 Statistical analysis
The statistical evaluation aimed to detect appropriate spectral bands and spectral indices for distinguishing healthy and infested trees. I. typographus prefers mature, weakened trees (Wermelinger, 2004; Hais et al., 2016) and newly infested trees that are most likely to occur near the previous year’s bark beetle infestation locations (Kautz et al., 2011). We used seven located bark beetle hotspots with a total of 84 infested trees. Consequently, we selected all healthy trees taller than 20 m in 50 m buffers around the hotspots, not covered by shadows on orthomosaics. In this way, we selected a total of 960 healthy spruce trees.
An individual regression model was created for each spectral band and vegetation index. Due to the experimental design, a mixed-effect model approach was used (Zuur et al., 2009). The random part of the model was, in all cases, two-way nested by the hotspot and by the individual tree. The fixed part was made up of two factors: the health condition of the tree (Infested, Healthy) and the time of UAV images acquisition; their interaction was also included. During model building and validation, an appropriate distribution function was selected (for most spectral bands and vegetation indices, the Gamma distribution function with log link was the best fit). The Gaussian distribution function was used for several indices with minimal values below zero. Model formulation and prediction were performed in the R package glmmTMB following the procedures described by Brooks et al. (2017).
The quadratic discriminant analysis (QDA) (Rencher, 2002) was used to distinguish the groups of healthy and infested trees based on the spectral bands and vegetation indices. Due to a large difference between the size of both groups of trees, the bootstrap resampling technique with 60 iterations was used for sampling the group of healthy trees used in the QDA analysis (McRoberts et al., 2023). To avoid overfitting caused by the fact that the vast majority of trees were healthy (i.e., the prevalence of infested trees was minimal – approx. 1,000 healthy vs. 80 infested trees, which would influence the QDA discriminant function and resulting accuracy characteristics), an infested to healthy ratio of 1:3 was used for bootstrapping. The set of trees was divided into the training and testing group. The training set contained around 60% of the trees. The goodness of the discrimination was measured by the confusion matrix detailing the sensitivity (i.e., the percentage of infested trees accurately detected as infested) and specificity (i.e., the percentage of healthy trees detected as healthy), and overall accuracy (i.e., the total proportion of accurately classified trees). For the QDA method was used the function qda() in the R package MASS (Venables and Ripley, 2002). Analyses were performed in the R 4.0.2 environment (R Core Team, 2020).
3 Results
3.1 The potential of spectral bands and vegetation indices
The trends of spectral reflectance of individual bands (blue, green, red, red edge, and NIR) in healthy and infested spruce trees analyzed across the entire area changed depending on the time from bark beetle infestation in 2020, with the highest difference observed in the red band (Figure 2E). Over time, the green (Figure 2C), red edge (Figure 2G), and NIR (Figure 2I) bands’ spectral reflectances decreased in both healthy and infested trees. The red band reflectance grew during the last acquisition (13 August). However, the differences between the healthy and infested trees in the first (09 June) and second (29 July) acquisition periods are negligible and does not allow reliable detection of infested trees. Therefore, it is evident that using individual spectral bands makes early detection of infested trees difficult.
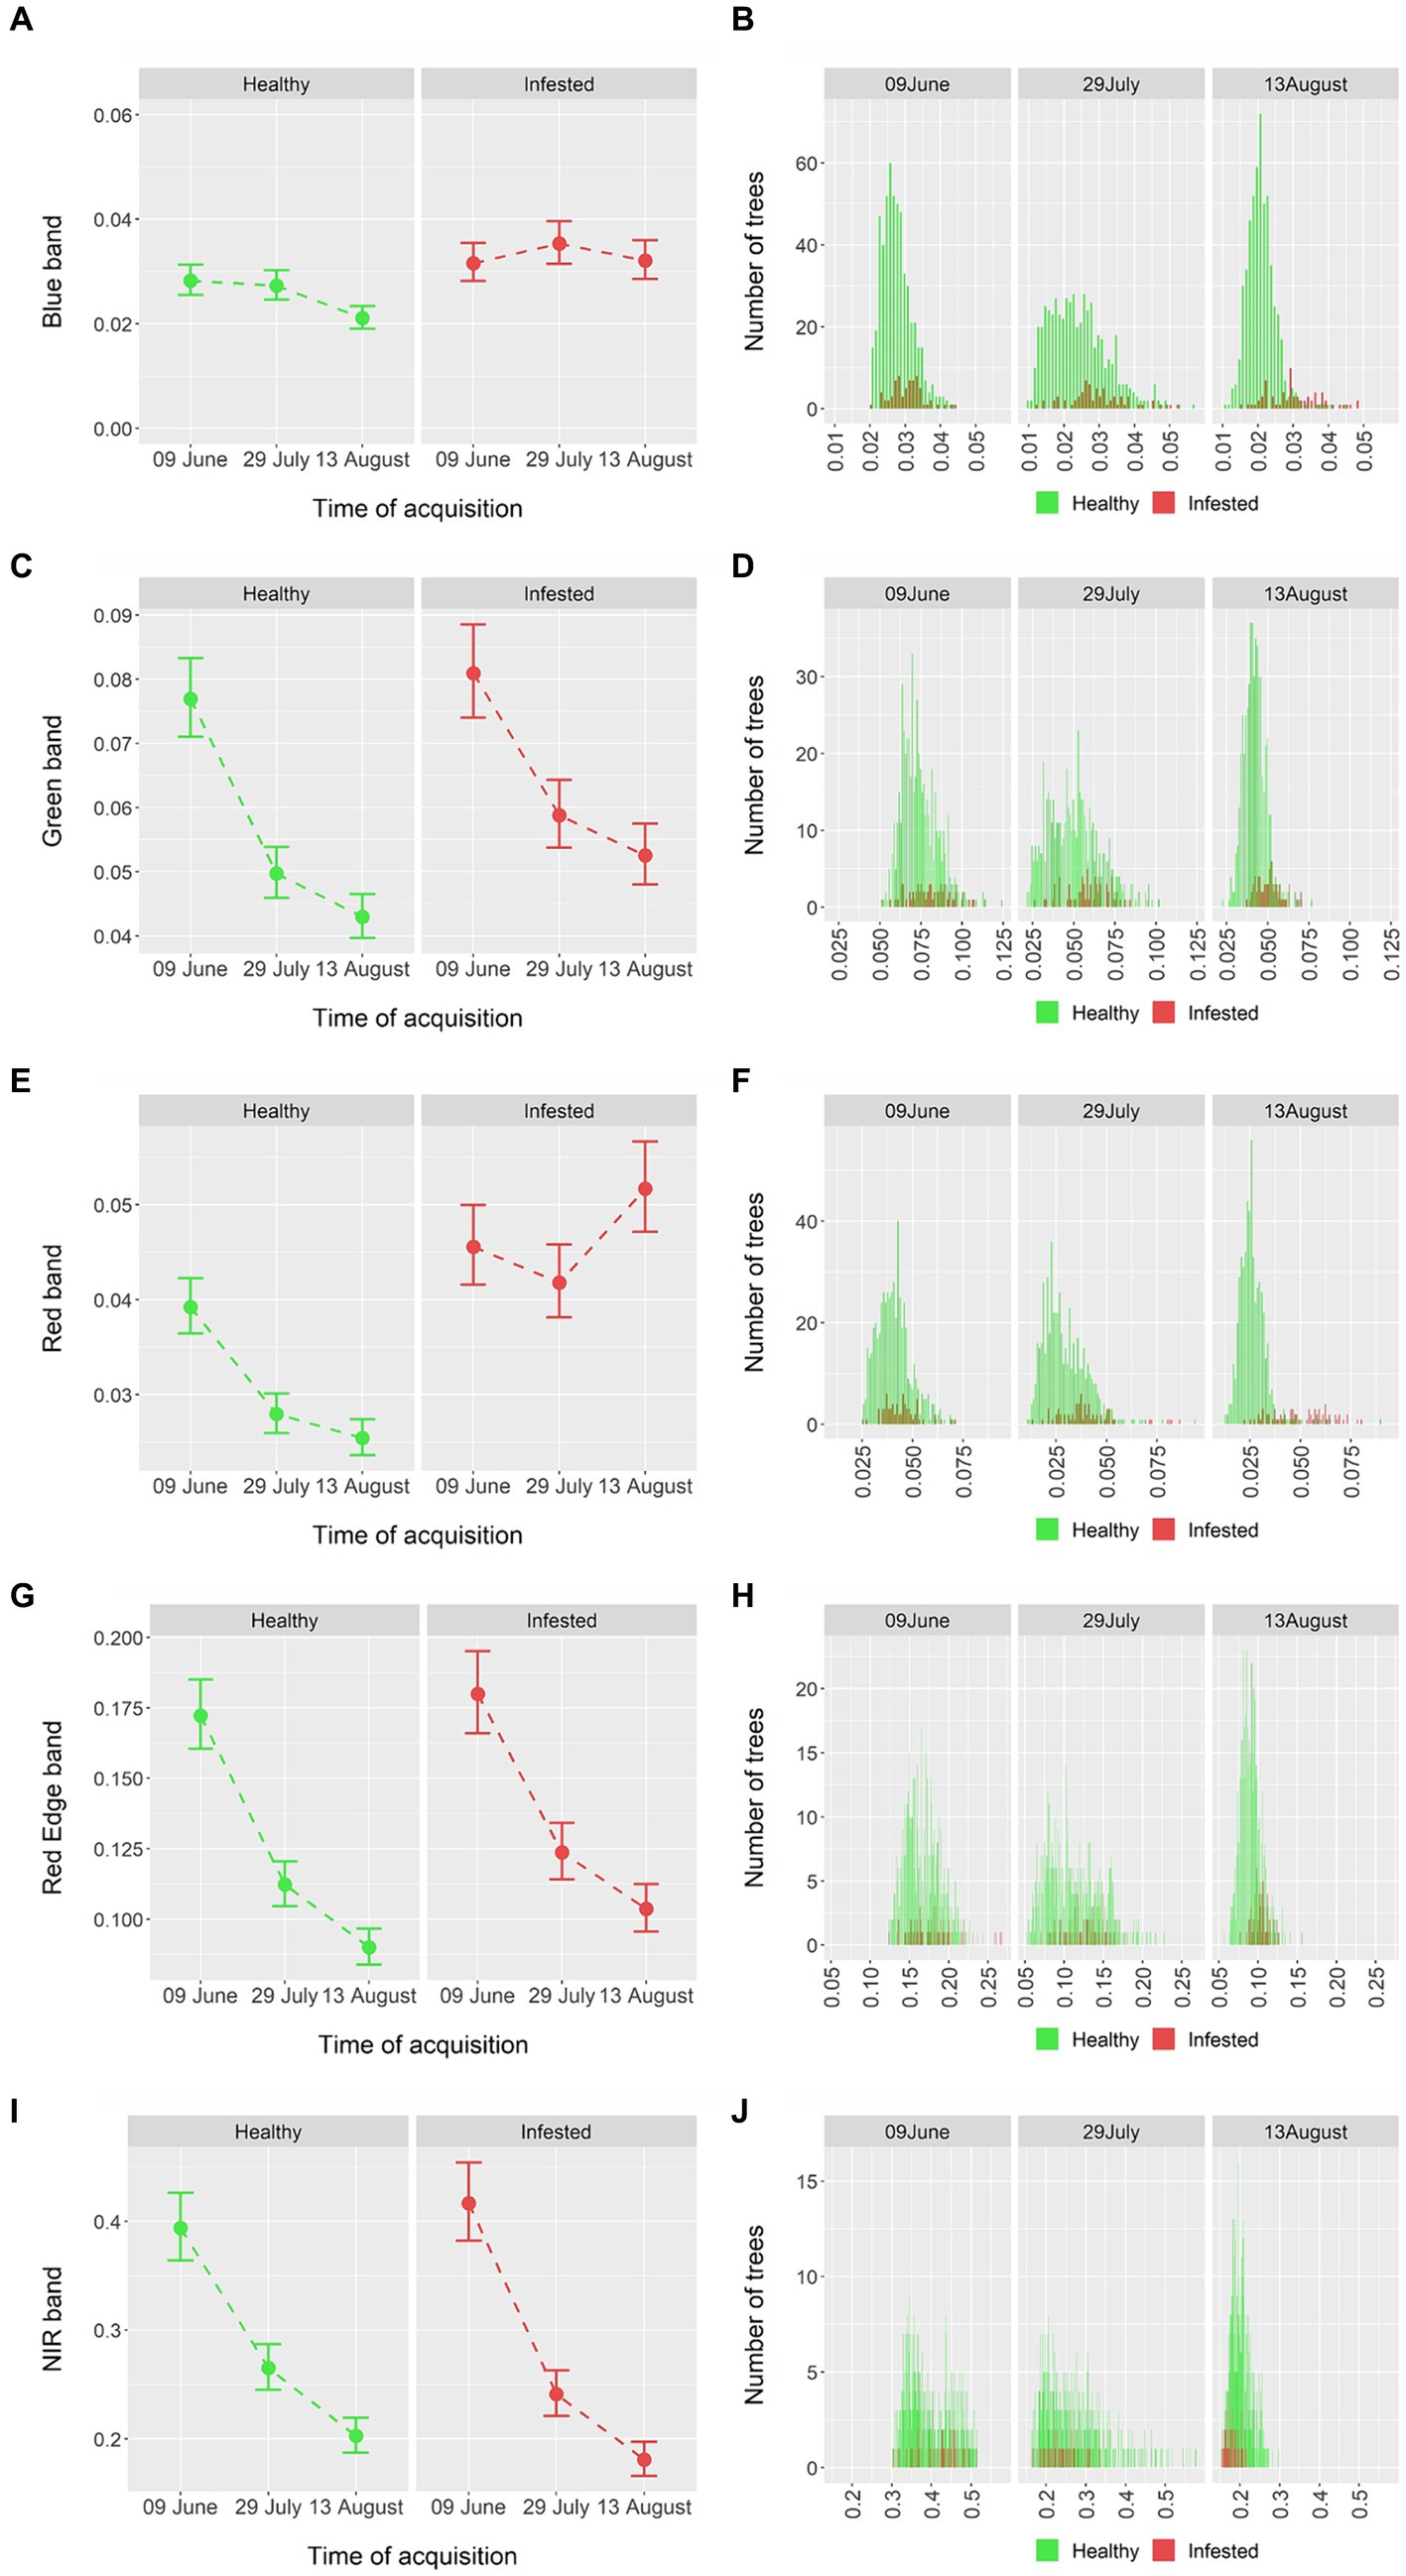
Figure 2. (A,C,E,G,I) Surface reflectance (Y-axis) of individual spectral bands (X-axis) at different time points showing healthy (green) and newly infested (red) trees. The color dots are fitted values resulting from the mixed-effect model, whiskers represent 95% confidence interval. (B,D,F,H,J) Histograms presenting the frequencies of surface reflectances of healthy (green) and infested (red) trees (B,D,F,H,J).
For this reason, we went on to evaluate individual vegetation indices. A significant increase in the differences between healthy and infested trees with the later acquisition time was observed, similar to the visual evaluation based on the spectral bands (Figure 2). All analyzed vegetation indices with the exception of NDRE and GNDVI (which grew between the first two periods in healthy trees) constantly decreased over time for both healthy and infested trees. Before swarming (09 June), almost no difference between healthy and (future) infested trees was observed. However, at the following stages of the bark beetle development (29 July and 13 August), significant differences in fitted (Figures 3A,C,E,G,I,K) and image-based (Figures 3B,D,F,H,J,L) values between infested and healthy trees could be found in all tested vegetation indices (see Figure 3 for details). The use of vegetation indices, therefore, allowed healthy and infested trees to be distinguished at the time of early infestation.
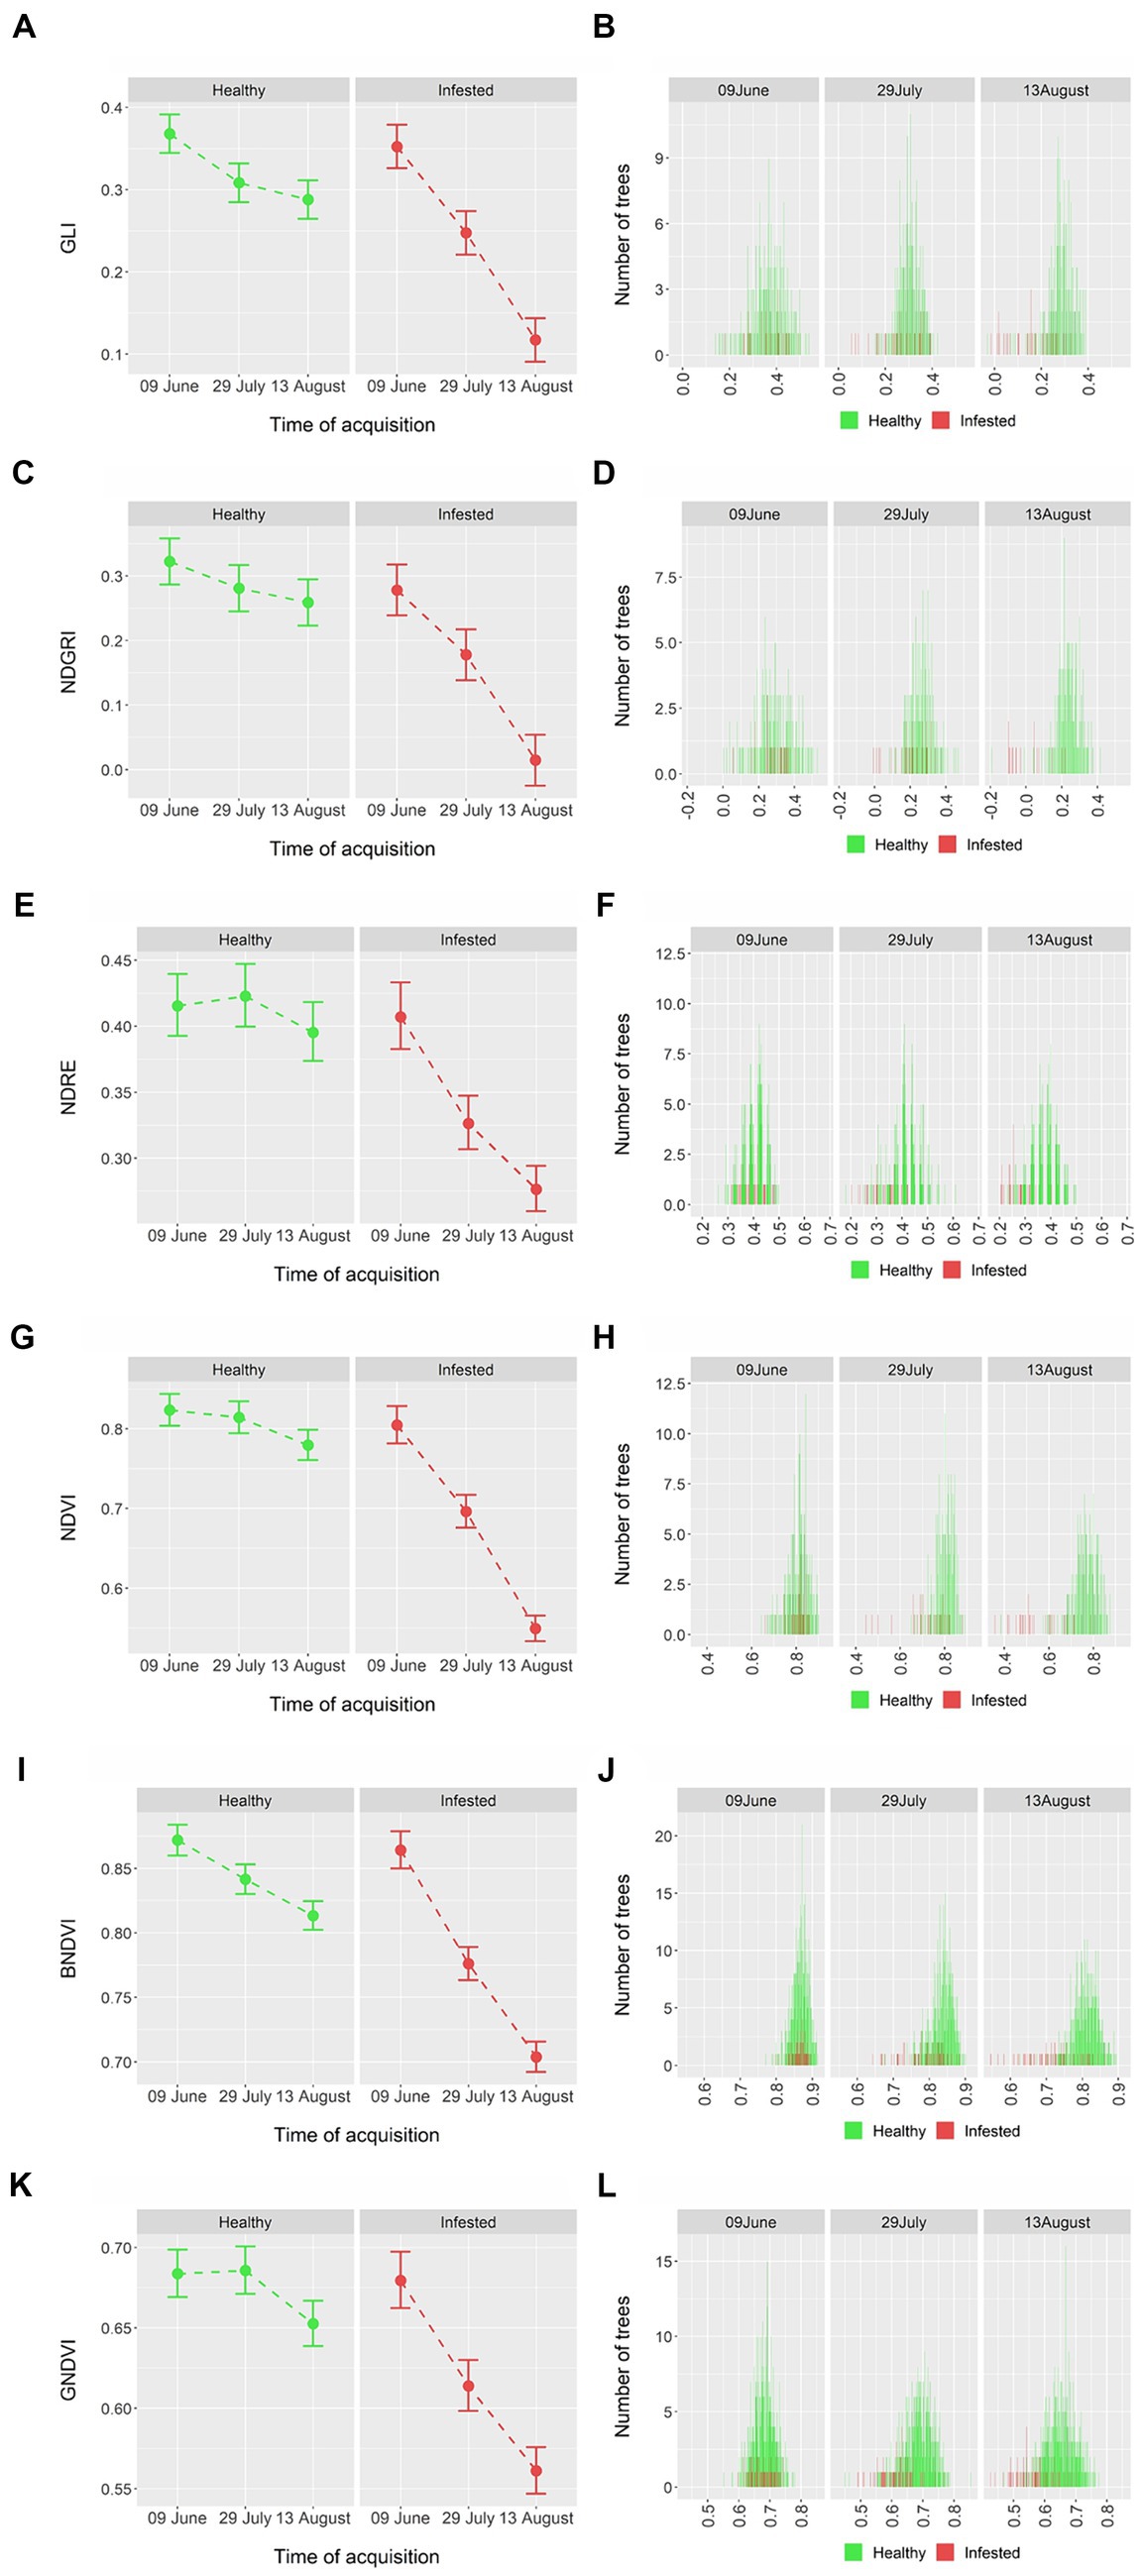
Figure 3. (A,C,E,G,I,K) Vegetation indices values (Y-axis) at different stages of the bark beetle infestation (X-axis), indicating healthy (green) and newly infested (red) trees. The color dots are fitted values resulting from the mixed-effect model, whiskers represent 95% confidence intervals; (B,D,F,H,J,L): histograms showing frequencies of individual values.
3.2 Statistical analysis of early-stage detection
In addition to the visual assessment presented in Figures 2, 3, QDA was also performed. This analysis, took into account the calculated indices and the background differences between hotspots, showed a possibility of distinguishing between healthy and infested trees even while the bark beetle is still in the tree, in particular when using vegetation indices. Therefore, we specifically focused on evaluating vegetation indices calculated only from the UAV imageries acquired at the stage of early infestation (29 July), which is essential for effective forestry intervention (e.g., cutting down infested trees). The best overall accuracy was acquired using NDRE (81%), NDVI (80%), and GNDVI (81%; Table 3). However, the accuracy differed among individual indices as well as between healthy and infested trees. The best success rate for infested trees was achieved using NDVI (90%) and BNDVI (89%). The success of classification of healthy trees was generally lower, and the most promising results were achieved using NDRE (83%) and GNDVI (81%). The most balanced results for both tree groups (approx. 80%) were acquired using GNDVI (combination of green and NIR bands). In addition, relatively low standard deviation values indicate the stability of calculated success rates based on the bootstrap resampling technique (60 iterations) in the QDA analysis (see Table 3).
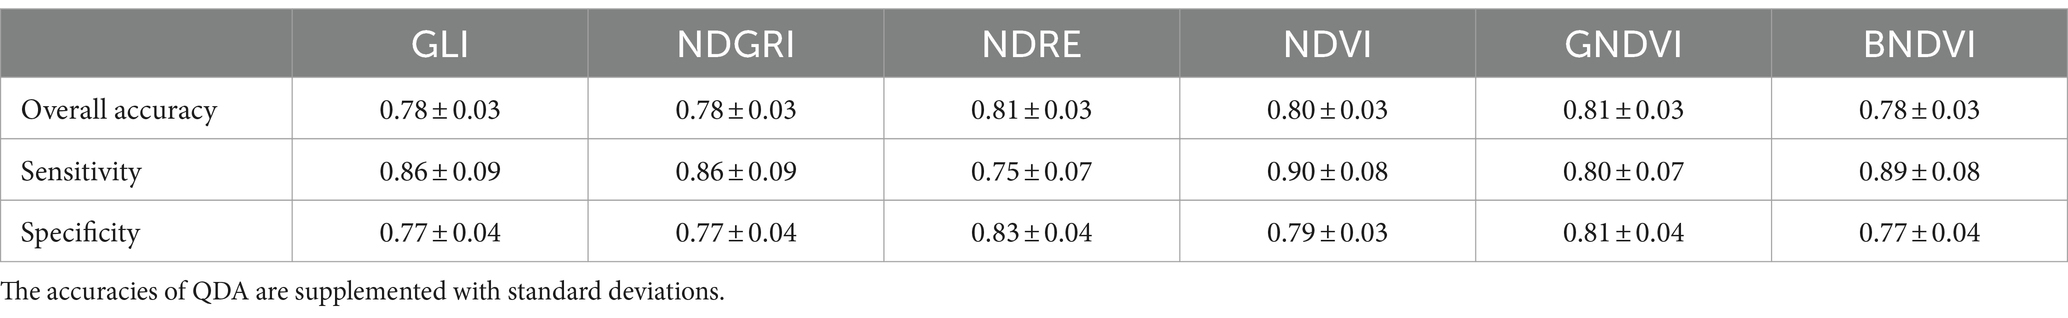
Table 3. The results of the quadratic discriminant analysis (QDA) using individual vegetation indices for the early-stage bark beetle detection period (29 July).
The QDA results based on spectral bands are summarized in Table 4. The early-stage classification based on spectral bands might seem more accurate at first (87% overall accuracy using all available spectral bands) than using vegetation indices. However, the detection success of infested trees was lower (70%). Of the individual bands, the best results were obtained using the red band (which is consistent with the visual interpretation, see Figure 2E), although the sensitivity was still substantially inferior to that yielded by the indices (38%). The worst results, failing to identify any of the infested trees, was observed for the blue band. Therefore, we can consider vegetation indices as more appropriate inputs for the early detection of bark beetle infestation than individual spectral bands.
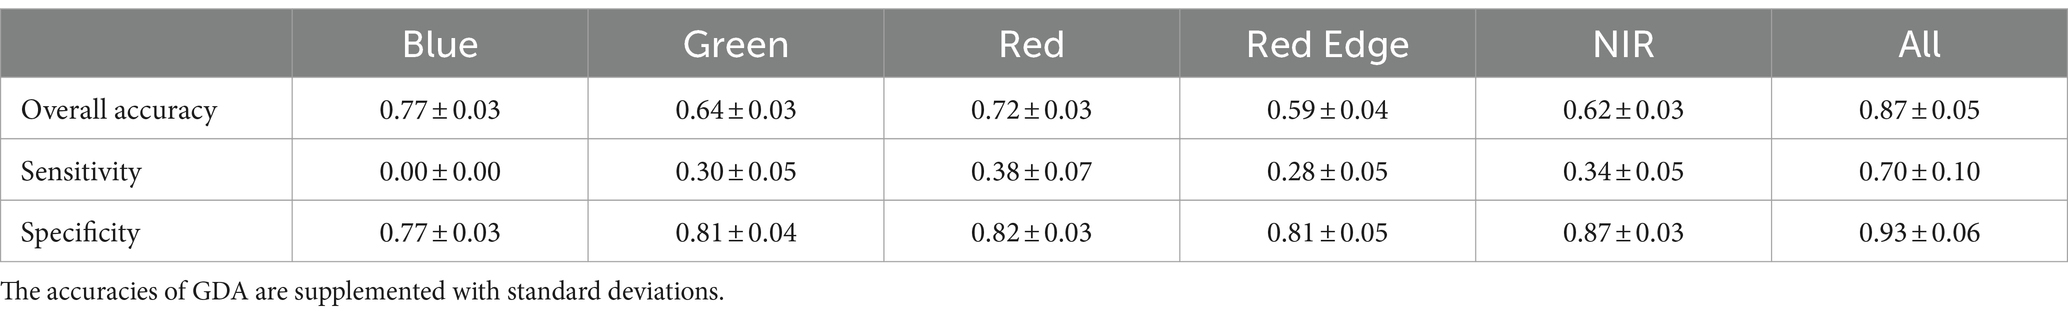
Table 4. The results of the quadratic discriminant analysis (QDA) using individual spectral bands and their combination for the early-stage bark beetle detection period (29 July).
3.3 Detection of the infestation using vegetation indices at different time points
Since the use of vegetation indices leads to significantly better conclusions than detection using spectral bands (see Sections 3.1 and 3.2), we have focused in this section on the detection of infected trees using only vegetation indices. The overall accuracy, sensitivity and specificity using vegetation indices increase with time after infestation (Table 5). The lowest overall accuracy (63%) was obtained before bark beetle swarming (09 June), when only 37% of newly infested and 72% of healthy trees were correctly classified. In the early-stage of infestation (29 July), the overall classification accuracy was 84%, with sensitivity of 80% and specificity of 86%. The combination of before-swarming (09 June) and early-stage (29 July) vegetation indices did not improve the classification results compared to those from 29 July. The highest detection accuracy was achieved in the phase of abandonment of trees, when bark beetles probably left the trees (13 August). In this phase, overall detection accuracy was 94% (90% for infested, and 94% for healthy trees). The results of QDA are in detail summarized in Table 5.
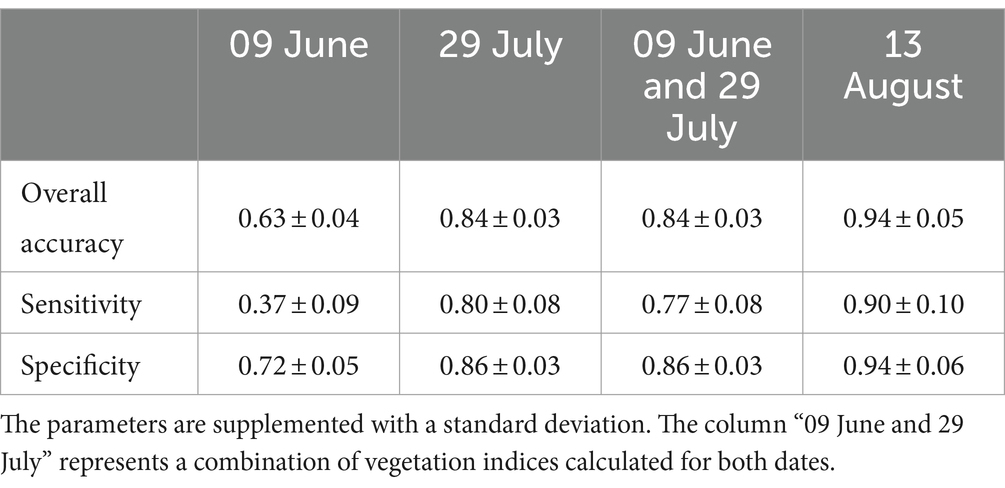
Table 5. The results of the QDA using a combination of all vegetation indices throughout the bark beetle season.
4 Discussion
Our findings confirm that the use of vegetation indices allows detection of bark beetle-infested trees while the bark beetle offspring are still inside the infested tree. The accuracies of QDA increase with time after infestation (see Table 5). The high success rate of detecting infested trees during the second flight, when most of the bark beetle population was in the pupal stage, represents an important prerequisite for successful bark beetle management in forest stands (Wermelinger, 2004; Hlásny et al., 2019). Detection of bark beetle-infested trees was also evaluated by Bárta et al. (2022) at the canopy level or Abdullah et al. (2018) at the individual leaf/needle level using hyperspectral measurements. In the latter study, Abdullah et al. (2018) confirmed the potential usability of visible bands for early bark beetle detection.
The sensitivity of detecting infested trees using individual spectral bands was poor (Table 4). Even for the red band, which showed the best sensitivity during the second flight (6 weeks after infestation), the sensitivity was a mere 38%. The fact that the red band performed best in our study was not expected as other studies attributed greater importance to other bands. For example, Huo et al. (2023) reported the red edge band to perform best. They achieved 15% sensitivity 5 eeks after infestation and 90% sensitivity 10 weeks after infestation. In our study, we achieved better results with the bands alone (38% sensitivity with the red band and 70% in multifactorial analysis using all the bands, Table 4). When using indices, the results were much better – using NDVI, we detected as much as 90% of infested trees 6 weeks after infestation. We must, however, consider the fact that the study by Huo et al. (2023) took place in Scandinavia where the development of the bark beetle is slower than in the Central Europe (Baier et al., 2002). In effect, the acquisition 6 weeks after infestation in the Czech Republic may correspond to 10 weeks after infestation in Scandinavia. However, accurate information about the stage of I. typographus development for individual acquisitions is missing in their paper. In addition, their research was designed differently from ours – while our research is based on natural infestation of the bark beetle, Huo et al. (2023) used pheromone baited trees. Minařík and Langhammer (2016) found red edge and NIR UAV bands to be promising in detecting infested trees. Abdullah et al. (2019b,c) and Hellwig et al. (2021) reported the potential of red edge bands for early detection of Ips typographus infestations. Bárta et al. (2021) highlighted the importance of Sentinel-2 SWIR bands to perform best in early detection of infested trees by bark beetle. Trubin et al. (2023) indicated that the NIR band could be more reliable than other visible bands in detecting susceptible trees in the early detection stage of infestation.
On the other hand, the WorldView-2 study (Immitzer and Atzberger, 2014) using satellite imagery for detecting infestation in mountain regions of Central Europe, yielded results similar to our research, associating the red band with the highest detection accuracy. They called for more research focusing on early-stage detection in association with the change in the spectral signatures of infested trees and their difference from the surrounding environment. Also Huo et al. (2021) found the red band to be promising in detecting infested trees. The importance of the red band was also found in the case of UAVs by Klouček et al. (2019) and Minařík et al. (2021).
Vegetation indices performed better than individual spectral bands, with the differences between infested and healthy trees were obvious in the graphs (Figure 3) as early as the second flight (i.e., during the green attack stage, while the bark beetle offspring were still in the trees). The statistical evaluation using QDA confirmed this visual observation. In particular, the BNDVI (sensitivity of 89%) and NDVI (90%) indices were able to distinguish between healthy and infested trees with sufficient accuracy (Table 3). NDVI returned the overall best results and, therefore, appears to be the most promising of all tested indices. However, vegetation indices are highly correlated (Klouček et al., 2018) and the results provided by many of them are similar. This can also explain the fact that a combination of all indices (Table 5) did not improve the overall detection success compared to individual indices. Combining vegetation indices from different periods did not improve the detection capability, either – likely because the natural seasonal changes alter the natural reflectance of the needles, which confounds the changes associated with early infestation stages. The detailed summary of all 26 recent remote sensing studies focused on early bark beetle detection using individual spectral bands or vegetation indices is available in Appendix Table A1 of the recent review published by Kautz et al. (2024).
Based on our findings, the NIR band (although not providing usable results when detecting solely based on the bands) plays a key role in detecting trees infested by bark beetle using vegetation indices. This corroborates the findings published by Abdullah et al. (2019c), who concluded that the red edge and NIR bands (and, in particular, the indices derived from these bands) are crucial for successful distinguishing between healthy and infested trees. On the other hand, the results disagree with our previous study (Klouček et al., 2019). In that study, visible bands brought more valuable information for differentiation between healthy and infested trees than the NIR band. However, it may be due to the use of a home-made low-cost UAV sensors, instead of the NIR sensor that was used in the present study.
From the practical point of view, the maximum period from infestation that still allows implementation of forestry measures to prevent bark beetles from spreading is approximately 6 weeks in the conditions of the Czech Republic (Bárta et al., 2022). This corresponds to the second image acquisition (29 July), when all vegetation indices discriminated well between the healthy and infested trees (see Table 5). It should be, however, noted, that in countries with a colder climate (i.e., Scandinavia), this period might be longer, allowing more effective measures than is possible in the Czech Republic.
The possibility of finding vulnerable trees before the infestation could be a considerable advantage of RS approaches in bark beetle detection. Other methods react to chemical cues (Vošvrdová et al., 2023) or visual signs of infestation (Kautz et al., 2022) that develop only after the tree is successfully colonized by the bark beetle. Using the vegetation indices, we were able to classify 37% of trees that were later infested as early as the first flight carried out before swarming. A significant difference between healthy and infested trees before the attack was found also by Abdullah et al. (2019c), who, however, did not analyze the classification accuracy. The predisposition of Norway spruce to bark beetle infestation was also identified by Kozhoridze et al. (2023) using thermal satellite imagery. Identifying trees predisposed toward being infested depends, among other things, also on the resistance of the forest stand and on the bark beetle population density: as long as the bark beetle population density is low, I. typographus is able to establish offspring only in weakened trees, while once the infestation enters the epidemic phase, it is able to colonize healthy trees as well (Kausrud et al., 2012). The amounts of weakened (although apparently healthy) trees in forest stands increase with the length of the period between the bark beetle outbreaks (Økland and Bjørnstad, 2006). The study area has been well-managed against bark beetles for a long time, and only relatively small numbers of infested trees have been felled. Even so, the site is in a region with massive outbreaks (Hlásny et al., 2021a), and the supply of immigrant beetles is, therefore, considerable, which facilitates the infestation of healthy trees.
Studies analyzing such an extent of forest (250 ha) using time series of UAV-borne spectral reflectance data focusing primarily on early-stage bark beetle detection, such as that by Huo et al. (2023) are extremely rare (Kautz et al., 2024). This is, among other things, caused by the solar noon conditions allowing only a limited time for acquisition within a day. Considering this and fixed-wing UAV capabilities, the system used in this study can cover approximately 400 ha in 4 h. Of course, it could be possible to use simultaneously multiple UAVs, which would multiply the covered area. For this reason, it might be useful to use detailed airborne (Bárta et al., 2022) or satellite (Abdullah et al., 2019a,b,c; Abdollahnejad et al., 2021; Bárta et al., 2021) data to cover larger extents. The use of UAVs, on the other hand, has advantages over satellite and airborne data, such as high spatial resolution and possibility of optimal timing of the flights, thus allowing more accurate early detection at the individual tree level. Fixed-wings enabling vertical take-off and landing (so-called VTOL), capable of application in inaccessible terrain (Cromwell et al., 2021), are also available on the market. In addition, advanced sensors that combine RGB with multispectral or/and thermal cameras are already available, which reduces the number of necessary flights. In addition, the demands for the expertise required for UAV-borne image processing and analysis are decreasing thanks to the available cloud processing solutions [for example, the Forest Guard application in the Czech Republic, that has, unfortunately, been recently discontinued (Unicorn, 2024)].
As a partial limitation of our study, we can mention that even though all flights were performed approximately at the same time of the day, the sun position differed due to the seasonal changes. However, these differences were accounted for by the use of calibration targets and the imagery was radiometrically calibrated, so this is unlikely to cause any issues with the validity of results.
Early detection of bark beetle infestation is a complex issue influenced by many spatial variables (bark beetle life cycles, temperature, precipitation, the actual health status of trees, weather conditions during imagery acquisition etc.). The use of all RS possibilities and their combination with traditional forestry approaches, such as field surveys (Kautz et al., 2022; Kautz et al., 2024), trap installation, etc., could be a way to more effective prevention of bark beetle calamities.
5 Conclusion
Our study evaluated the effectiveness of UAV-borne multispectral imagery for detecting the early stages of bark beetle infestation. Input data were acquired during the bark beetle season (a) before swarming, (b) at the early stage of infestation, and (c) in the post-abandon phase. Results indicate that multispectral imagery allows good discrimination of healthy and early-infested Norway spruce trees at the so-called green attack stage using quadratic discriminant analysis (QDA). In particular, vegetation indices NDVI and BNDVI performed very well in identifying infested trees, with sensitivities up to 90%, which was much better than when using individual bands. The overall detection sensitivity increased with the increasing time from infestation. The discrimination success rate by QDA was similar for the combination of vegetation indices as for individual well-performing indices. The study shows that the use of professional multispectral UAV-borne sensors allows early bark beetle detection and can contribute to precise and effective forest management on a local level.
Data availability statement
The raw data supporting the conclusions of this article will be made available by the authors, without undue reservation.
Author contributions
All authors contributed in a substantial way to the manuscript. TK and JK conceived, designed, and performed the experiments and wrote the manuscript. RM and MZ performed the statistical evaluation. RM and MK supervised and discussed the research. All authors contributed to the manuscript revision, read, and approved the submitted version.
Funding
The author(s) declare financial support was received for the research, authorship, and/or publication of this article. This study was supported by the Technology Agency of the Czech Republic under grants nos. TP01010050, and SS02030018; and project of the National Agency for Agriculture Research of the Czech Republic no. QK23020039.
Acknowledgments
We would like to thank Petr Klápště for his help with UAV data acquisition. Many thanks also to Jarek Janošek and Karel Hrach for their helpful comments. Finally, we would like to thank our colleagues from the town Nové Město na Moravě for the field survey and for sharing local forest knowledge. This research was also supported by the Action CA17134 SENSECO (Optical synergies for spatiotemporal sensing of scalable ecophysiological traits) funded by COST (European Cooperation in Science and Technology, www.cost.eu, accessed on 20 June 2022).
Conflict of interest
The authors declare that the research was conducted in the absence of any commercial or financial relationships that could be construed as a potential conflict of interest.
Publisher’s note
All claims expressed in this article are solely those of the authors and do not necessarily represent those of their affiliated organizations, or those of the publisher, the editors and the reviewers. Any product that may be evaluated in this article, or claim that may be made by its manufacturer, is not guaranteed or endorsed by the publisher.
References
Abd El-Ghany, N. M., Abd El-Aziz, S. E., and Marei, S. S. (2020). A review: application of remote sensing as a promising strategy for insect pests and diseases management. Environ. Sci. Pollut. Res. 27, 33503–33515. doi: 10.1007/s11356-020-09517-2
Abdollahnejad, A., Panagiotidis, D., Surový, P., and Modlinger, R. (2021). Investigating the correlation between multisource remote sensing data for predicting potential spread of Ips typographus L. spots in healthy trees. Remote Sens. 13:4953. doi: 10.3390/rs13234953
Abdullah, H., Darvishzadeh, R., Skidmore, A. K., Groen, T. A., and Heurich, M. (2018). European spruce bark beetle (Ips typographus, L.) green attack affects foliar reflectance and biochemical properties. Int. J. Appl. Earth Obs. Geoinf. 64, 199–209. doi: 10.1016/j.jag.2017.09.009
Abdullah, H., Darvishzadeh, R., Skidmore, A. K., and Heurich, M. (2019a). Sensitivity of Landsat-8 OLI and TIRS data to foliar properties of early stage bark beetle (Ips typographus, L.) infestation. Remote Sens. 11, 1–23. doi: 10.3390/rs11040398
Abdullah, H., Skidmore, A. K., Darvishzadeh, R., and Heurich, M. (2019b). Sentinel-2 accurately maps green-attack stage of European spruce bark beetle (Ips typographus, L.) compared with Landsat-8. Remote Sens. Ecol. Conserv. 5, 87–106. doi: 10.1002/rse2.93
Abdullah, H., Skidmore, A. K., Darvishzadeh, R., and Heurich, M. (2019c). Timing of red-edge and shortwave infrared reflectance critical for early stress detection induced by bark beetle (Ips typographus, L.) attack. Int. J. Appl. Earth Obs. Geoinf. 82:101900. doi: 10.1016/j.jag.2019.101900
Baier, P., Fuhrer, E., Kirisits, T., and Rosner, S. (2002). Defence reactions of Norway spruce against bark beetles and the associated fungus Ceratocystis polonica in secondary pure and mixed species stands. For. Ecol. Manag. 159, 73–86. doi: 10.1016/S0378-1127(01)00711-3
Baier, P., Pennerstorfer, J., and Schopf, A. (2007). PHENIPS-A comprehensive phenology model of Ips typographus (L.) (Col., Scolytinae) as a tool for hazard rating of bark beetle infestation. For. Ecol. Manag. 249, 171–186. doi: 10.1016/j.foreco.2007.05.020
Bannari, A., Morin, D., Bonn, F., and Huete, A. R. (1995). A review of vegetation indices. Remote Sens. Rev. 13, 95–120. doi: 10.1080/02757259509532298
Bárta, V., Hanuš, J., Dobrovolný, L., and Homolová, L. (2022). Comparison of field survey and remote sensing techniques for detection of bark beetle-infested trees. For. Ecol. Manag. 506:119984. doi: 10.1016/j.foreco.2021.119984
Bárta, V., Lukeš, P., and Homolová, L. (2021). Early detection of bark beetle infestation in Norway spruce forests of Central Europe using Sentinel-2. Int. J. Appl. Earth Obs. Geoinf. 100:102335. doi: 10.1016/j.jag.2021.102335
Brooks, M. E., Kristensen, K., van Benthem, K. J., Magnusson, A., Berg, C. W., Nielsen, A., et al. (2017). glmmTMB balances speed and flexibility among packages for zero-inflated generalized linear mixed modeling. R J. 9, 378–400. doi: 10.32614/RJ-2017-066
Brovkina, O., Cienciala, E., Surový, P., and Janata, P. (2018). Unmanned aerial vehicles (UAV) for assessment of qualitative classification of Norway spruce in temperate forest stands. Geo-spat. Inf. Sci. 21, 12–20. doi: 10.1080/10095020.2017.1416994
CHMI (2024). Czech hydrometeorological institute (CHMI): historical data – meteorology and climatology. Available at: https://www.chmi.cz/historicka-data/pocasi/zakladni-informace?l=en (Accessed February 5, 2024).
Cromwell, C., Giampaolo, J., Hupy, J., Miller, Z., and Chandrasekaran, A. (2021). A systematic review of best practices for uas data collection in forestry-related applications. Forests 12:957. doi: 10.3390/f12070957
Dash, J. P., Pearse, G. D., and Watt, M. S. (2018). UAV multispectral imagery can complement satellite data for monitoring forest health. Remote Sens. 10:1216. doi: 10.3390/rs10081216
Dash, J. P., Watt, M. S., Pearse, G. D., Heaphy, M., and Dungey, H. S. (2017). Assessing very high resolution UAV imagery for monitoring forest health during a simulated disease outbreak. ISPRS J. Photogramm. Remote Sens. 131, 1–14. doi: 10.1016/j.isprsjprs.2017.07.007
Fassnacht, F. E., Latifi, H., Ghosh, A., Joshi, P. K., and Koch, B. (2014). Assessing the potential of hyperspectral imagery to map bark beetle-induced tree mortality. Remote Sens. Environ. 140, 533–548. doi: 10.1016/j.rse.2013.09.014
Fernandez-Carrillo, A., Patočka, Z., Dobrovolný, L., Franco-Nieto, A., and Revilla-Romero, B. (2020). Monitoring bark beetle forest damage in central europe. A remote sensing approach validated with field data. Remote Sens. 12, 1–19. doi: 10.3390/rs12213634
FMI (2022). Forest Management Institute. Available at: https://www.uhul.cz/?lang=en (Accessed June 20, 2022).
FMI (2024). Forest Management Institute. Available at: https://www.uhul.cz/?lang=en (Accessed March 13, 2024).
Foster, A. C., Walter, J. A., Shugart, H. H., Sibold, J., and Negron, J. (2017). Spectral evidence of early-stage spruce beetle infestation in Engelmann spruce. For. Ecol. Manag. 384, 347–357. doi: 10.1016/j.foreco.2016.11.004
Gdulová, K., Marešová, J., Barták, V., Szostak, M., Červenka, J., and Moudrý, V. (2021). Use of tandem-x and srtm-c data for detection of deforestation caused by bark beetle in central European mountains. Remote Sens. 13:3042. doi: 10.3390/rs13153042
Gitelson, A. A., and Merzlyak, M. N. (1997). Remote estimation of chlorophyll content in higher plant leaves. Int. J. Remote Sens. 18, 2691–2697. doi: 10.1080/014311697217558
Hais, M., Wild, J., Berec, L., Brůna, J., Kennedy, R., Braaten, J., et al. (2016). Landsat imagery spectral trajectories-important variables for spatially predicting the risks of bark beetle disturbance. Remote Sens. 8:687. doi: 10.3390/rs8080687
Havašová, M., Bucha, T., Ferenčík, J., and Jakuš, R. (2015). Applicability of a vegetation indices-based method to map bark beetle outbreaks in the high Tatra Mountains. Ann. For. Res. 58, 1–310. doi: 10.15287/afr.2015.388
Hellwig, F. M., Stelmaszczuk-Górska, M. A., Dubois, C., Wolsza, M., Truckenbrodt, S. C., Sagichewski, H., et al. (2021). Mapping European spruce bark beetle infestation at its early phase using gyrocopter-mounted hyperspectral data and field measurements. Remote Sens. 13:4659. doi: 10.3390/rs13224659
Henrich, V., Götze, C., Jung, A., Sandow, C., Thürkow, D., and Cornelia, G. (2009) Development of an online indices database: motivation, concept and implementation, in 6th EARSeL Imaging Spectroscopy SIG Workshop Innovative Tool for Scientific and Commercial Environment Applications Tel Aviv, (Tel Aviv). Available at: https://www.indexdatabase.de (Accessed June 20, 2022).
Hlásny, T., König, L., Krokene, P., Lindner, M., Montagné-Huck, C., Müller, J., et al. (2021a). Bark beetle outbreaks in Europe: state of knowledge and ways forward for management. Curr. For. Rep. 7, 138–165. doi: 10.1007/s40725-021-00142-x
Hlásny, T., Krokene, P., Liebhold, A., Montagné-Huck, C., Müller, J., Qin, H., et al. (2019). Living with bark beetles: impacts, outlook and management options. From Science to Policy 8. European Forest Institute, 52. doi: 10.36333/fs08
Hlásny, T., Merganičová, K., Modlinger, R., Marušák, R., Löwe, R., and Turčáni, M. (2021b). Prognosis of bark beetle outbreak and a new platform for the dissemination of information about the forests in the Czech republic. Zprávy Lesnického Výzkumu 66, 197–205.
Hlásny, T., Zimová, S., Merganičová, K., Štěpánek, P., Modlinger, R., and Turčáni, M. (2021c). Devastating outbreak of bark beetles in the Czech Republic: drivers, impacts, and management implications. For. Ecol. Manag. 490:119075. doi: 10.1016/j.foreco.2021.119075
Hunt, E. R., Daughtry, C. S. T., Eitel, J. U. H., and Long, D. S. (2011). Remote sensing leaf chlorophyll content using a visible band index. Agron. J. 103, 1090–1099. doi: 10.2134/agronj2010.0395
Hunt, E. R., Doraiswamy, P. C., McMurtrey, J. E., Daughtry, C. S. T., Perry, E. M., and Akhmedov, B. (2012). A visible band index for remote sensing leaf chlorophyll content at the canopy scale. Int. J. Appl. Earth Obs. Geoinf. 21, 103–112. doi: 10.1016/j.jag.2012.07.020
Huo, L., Lindberg, E., Bohlin, J., and Persson, H. J. (2023). Assessing the detectability of European spruce bark beetle green attack in multispectral drone images with high spatial- and temporal resolutions. Remote Sens. Environ. 287:113484. doi: 10.1016/j.rse.2023.113484
Huo, L., Persson, H. J., and Lindberg, E. (2021). Early detection of forest stress from European spruce bark beetle attack, and a new vegetation index: normalized distance red & SWIR (NDRS). Remote Sens. Environ. 255:112240. doi: 10.1016/j.rse.2020.112240
Immitzer, M., and Atzberger, C. (2014). Early detection of bark beetle infestation in Norway spruce (Picea abies, L.) using WorldView-2 data. Photogramm. Fernerkun. Geoinform. 2014, 351–367. doi: 10.1127/1432-8364/2014/0229
Kausrud, K., Økland, B., Skarpaas, O., Grégoire, J. C., Erbilgin, N., and Stenseth, N. C. (2012). Population dynamics in changing environments: the case of an eruptive forest pest species. Biol. Rev. 87, 34–51. doi: 10.1111/j.1469-185X.2011.00183.x
Kautz, M., Dworschak, K., Gruppe, A., and Schopf, R. (2011). Quantifying spatio-temporal dispersion of bark beetle infestations in epidemic and non-epidemic conditions. For. Ecol. Manag. 262, 598–608. doi: 10.1016/j.foreco.2011.04.023
Kautz, M., Feurer, J., and Adler, P. (2024). Early detection of bark beetle (Ips typographus) infestations by remote sensing – a critical review of recent research. For. Ecol. Manag. 556:121595. doi: 10.1016/j.foreco.2023.121595
Kautz, M., Peter, F. J., Harms, L., Kammen, S., and Delb, H. (2022). Patterns, drivers and detectability of infestation symptoms following attacks by the European spruce bark beetle. J. Pest. Sci. 96, 403–414. doi: 10.1007/s10340-022-01490-8
Klouček, T., Klápště, P., Marešová, J., and Komárek, J. (2022). UAV-borne imagery can supplement airborne Lidar in the precise description of dynamically changing Shrubland Woody vegetation. Remote Sens. 14:2287. doi: 10.3390/rs14092287
Klouček, T., Komárek, J., Surový, P., Hrach, K., Janata, P., and Vašíček, B. (2019). The use of UAV mounted sensors for precise detection of bark beetle infestation. Remote Sens. 11:1561. doi: 10.3390/rs11131561
Klouček, T., Moravec, D., Komárek, J., Lagner, O., and Štych, P. (2018). Selecting appropriate variables for detecting grassland to cropland changes using high resolution satellite data. PeerJ 6:e5487. doi: 10.7717/peerj.5487
Komárek, J., Klápště, P., Hrach, K., and Klouček, T. (2022). The potential of widespread UAV cameras in the identification of conifers and the delineation of their crowns. Forests 13:710. doi: 10.3390/f13050710
Kozhoridze, G., Korolyova, N., and Jakuš, R. (2023). Norway spruce susceptibility to bark beetles is associated with increased canopy surface temperature in a year prior disturbance. For. Ecol. Manag. 547:121400. doi: 10.1016/j.foreco.2023.121400
Latifi, H., Fassnacht, F. E., Schumann, B., and Dech, S. (2014). Object-based extraction of bark beetle (Ips typographus L.) infestations using multi-date LANDSAT and SPOT satellite imagery. Prog. Phys. Geogr. 38, 755–785. doi: 10.1177/0309133314550670
Lausch, A., Heurich, M., Gordalla, D., Dobner, H. J., Gwillym-Margianto, S., and Salbach, C. (2013). Forecasting potential bark beetle outbreaks based on spruce forest vitality using hyperspectral remote-sensing techniques at different scales. For. Ecol. Manag. 308, 76–89. doi: 10.1016/j.foreco.2013.07.043
Li, J., Xiong, Y., She, J., and Wu, M. (2020). A path planning method for sweep coverage with multiple UAVs. IEEE Internet Things J. 7, 8967–8978. doi: 10.1109/JIOT.2020.2999083
Matějka, K., and Modlinger, R. (2023). Climate, Picea abies stand state, and Ips typographus in the Czech Republic from a viewpoint of long-term dynamics. Informat. Data Syst. Available at: www.infodatasys.cz
McRoberts, R. E., Næsset, E., Hou, Z., Ståhl, G., Saarela, S., Esteban, J., et al. (2023). How many bootstrap replications are necessary for estimating remote sensing-assisted, model-based standard errors? Remote Sens. Environ. 288:113455. doi: 10.1016/j.rse.2023.113455
Minařík, R., and Langhammer, J. (2016). Use of a multispectral UAV photogrammetry for detection and tracking of forest disturbance dynamics. Int. Arch. Photo. Remote Sens. Spat. Infor. Sci. XLI-B8, 711–718. doi: 10.5194/isprsarchives-XLI-B8-711-2016
Minařík, R., Langhammer, J., and Lendzioch, T. (2020). Automatic tree crown extraction from uas multispectral imagery for the detection of bark beetle disturbance in mixed forests. Remote Sens. 12, 1–31. doi: 10.3390/rs12244081
Minařík, R., Langhammer, J., and Lendzioch, T. (2021). Detection of bark beetle disturbance at tree level using uas multispectral imagery and deep learning. Remote Sens. 13:4768. doi: 10.3390/rs13234768
Modlinger, R., and Novotný, P. (2015). Quantification of time delay between damages caused by windstorms and by Ips typographus. For. J. 61, 221–231. doi: 10.1515/forj-2015-0030
Moeyersons, J., Gevaert, M., Réculé, K.-E., Volckaert, B., and Turck, F.De (2021). UAVs-as-a-service: cloud-based remote application Management for Drones, in 2021 IFIP/IEEE International Symposium on Integrated Network Management (IM), 926–931.
Näsi, R., Honkavaara, E., Blomqvist, M., Lyytikäinen-Saarenmaa, P., Hakala, T., Viljanen, N., et al. (2018). Remote sensing of bark beetle damage in urban forests at individual tree level using a novel hyperspectral camera from UAV and aircraft. Urban For. Urban Green. 30, 72–83. doi: 10.1016/j.ufug.2018.01.010
Näsi, R., Honkavaara, E., Lyytikäinen-Saarenmaa, P., Blomqvist, M., Litkey, P., Hakala, T., et al. (2015). Using UAV-based photogrammetry and hyperspectral imaging for mapping bark beetle damage at tree-level. Remote Sens. 7, 15467–15493. doi: 10.3390/rs71115467
Økland, B., and Bjørnstad, O. N. (2006). A resource-depletion model of forest insect outbreaks. Rep. Ecol. 87, 283–290. doi: 10.1890/05-0135
Panagiotidis, D., Abdollahnejad, A., Surový, P., and Chiteculo, V. (2017). Determining tree height and crown diameter from high-resolution UAV imagery. Int. J. Remote Sens. 38, 2392–2410. doi: 10.1080/01431161.2016.1264028
Patacca, M., Lindner, M., Lucas-Borja, M. E., Cordonnier, T., Fidej, G., Gardiner, B., et al. (2023). Significant increase in natural disturbance impacts on European forests since 1950. Glob. Chang. Biol. 29, 1359–1376. doi: 10.1111/gcb.16531
R Core Team (2020). The R project for statistical computing. Available at: https://www.r-project.org (Accessed April 3, 2022).
Rencher, A. C. (2002). Methods of multivariate analysis J. Wiley. Available at: https://onlinelibrary.wiley.com/doi/book/10.1002/0471271357
Rouse, J. W., Haas, R. H., Schell, J. A., and Deering, D. W. (1974). Monitoring vegetation systems in the Great Plains with ERTS. NASA Spec. Publ. 351:309.
Schelhaas, M.-J., Nabuurs, G.-J., and Schuck, A. (2003). Natural disturbances in the European forests in the 19th and 20th centuries. Glob. Chang. Biol. 9, 1620–1633. doi: 10.1046/j.1365-2486.2003.00684.x
Seidl, R., Thom, D., Kautz, M., Martin-Benito, D., Peltoniemi, M., Vacchiano, G., et al. (2017). Forest disturbances under climate change. Nat. Clim. Chang. 7, 395–402. doi: 10.1038/nclimate3303
Senf, C., Pflugmacher, D., Wulder, M. A., and Hostert, P. (2015). Characterizing spectral-temporal patterns of defoliator and bark beetle disturbances using Landsat time series. Remote Sens. Environ. 170, 166–177. doi: 10.1016/j.rse.2015.09.019
Senf, C., Seidl, R., and Hostert, P. (2017). Remote sensing of forest insect disturbances: current state and future directions. Int. J. Appl. Earth Obs. Geoinf. 60, 49–60. doi: 10.1016/j.jag.2017.04.004
Slavík, M., Kuželka, K., Modlinger, R., Tomášková, I., and Surový, P. (2020). UAV laser scans allow detection of morphological changes in tree canopy. Remote Sens. 12, 1–15. doi: 10.3390/rs12223829
Song, C., Woodcock, C. E., Seto, K. C., Lenney, M. P., and Macomber, S. A. (2001). Classification and change detection using Landsat TM data: when and how to correct atmospheric effects? Remote Sens. Environ. 75, 230–244. doi: 10.1016/S0034-4257(00)00169-3
Stereńczak, K., Mielcarek, M., Kamińska, A., Kraszewski, B., Piasecka, Ż., Miścicki, S., et al. (2020). Influence of selected habitat and stand factors on bark beetle Ips typographus (L.) outbreak in the Białowieża Forest. For. Ecol. Manag. 459:117826. doi: 10.1016/j.foreco.2019.117826
Stoyanova, M., Kandilarov, A., Koutev, V., Nitcheva, O., and Dobreva, P. (2018). Potential of multispectral imaging technology for assessment coniferous forests bitten by a bark beetle in Central Bulgaria. MATEC Web Confer. 145:01005. doi: 10.1051/matecconf/201814501005
Stych, P., Lastovicka, J., Hladky, R., and Paluba, D. (2019). Evaluation of the influence of disturbances on forest vegetation using the time series of Landsat data: a comparison study of the low Tatras and Sumava national parks. ISPRS Int. J. Geoinf. 8:71. doi: 10.3390/ijgi8020071
Surový, P., Almeida Ribeiro, N., and Panagiotidis, D. (2018). Estimation of positions and heights from UAV-sensed imagery in tree plantations in agrosilvopastoral systems. Int. J. Remote Sens. 39, 4786–4800. doi: 10.1080/01431161.2018.1434329
Trubin, A., Kozhoridze, G., Zabihi, K., Modlinger, R., Singh, V. V., Surový, P., et al. (2023). Detection of susceptible Norway spruce to bark beetle attack using PlanetScope multispectral imagery. Front. For. Glob. Chang. 6:1130721. doi: 10.3389/ffgc.2023.1130721
Unicorn (2024). ForestGuard. Available at: https://unicornsystems.eu/geoinformatics/en/news?article=najdete-kurovce-vcas-s-aplikaci-forestguard&newsArticleId=606d6de5ee24de0029913bef (Accessed March 13, 2024).
Venables, W. N., and Ripley, B. D. (2002). Modern applied statistics with S. fourth Edn. New York, NY: Springer New York.
Vošvrdová, N., Johansson, A., Turčáni, M., Jakuš, R., Tyšer, D., Schlyter, F., et al. (2023). Dogs trained to recognise a bark beetle pheromone locate recently attacked spruces better than human experts. For. Ecol. Manag. 528:120626. doi: 10.1016/j.foreco.2022.120626
Wermelinger, B. (2004). Ecology and management of the spruce bark beetle Ips typographus – a review of recent research. For. Ecol. Manag. 202, 67–82. doi: 10.1016/j.foreco.2004.07.018
Wulder, M. A., Dymond, C. C., White, J. C., Leckie, D. G., and Carroll, A. L. (2006). Surveying mountain pine beetle damage of forests: a review of remote sensing opportunities. For. Ecol. Manag. 221, 27–41. doi: 10.1016/j.foreco.2005.09.021
Yang, C., Everitt, J. H., Bradford, J. M., and Murden, D. (2004). Airborne hyperspectral imagery and yield monitor data for mapping cotton yield variability. Precis. Agric. 5, 445–461. doi: 10.1007/s11119-004-5319-8
Zabihi, K., Surovy, P., Trubin, A., Singh, V. V., and Jakuš, R. (2021). A review of major factors influencing the accuracy of mapping green-attack stage of bark beetle infestations using satellite imagery: prospects to avoid data redundancy. Remote Sens. Appl. 24:100638. doi: 10.1016/j.rsase.2021.100638
Zimmermann, S., and Hoffmann, K. (2020). Evaluating the capabilities of Sentinel-2 data for large-area detection of bark beetle infestation in the central German uplands. J. Appl. Remote. Sens. 14:1. doi: 10.1117/1.JRS.14.024515
Zuur, A. F., Ieno, E. N., Walker, N., Saveliev, A. A., and Smith, G. M. (2009). Mixed effects models and extensions in ecology with R. New York, NY: Springer New York.
Appendix
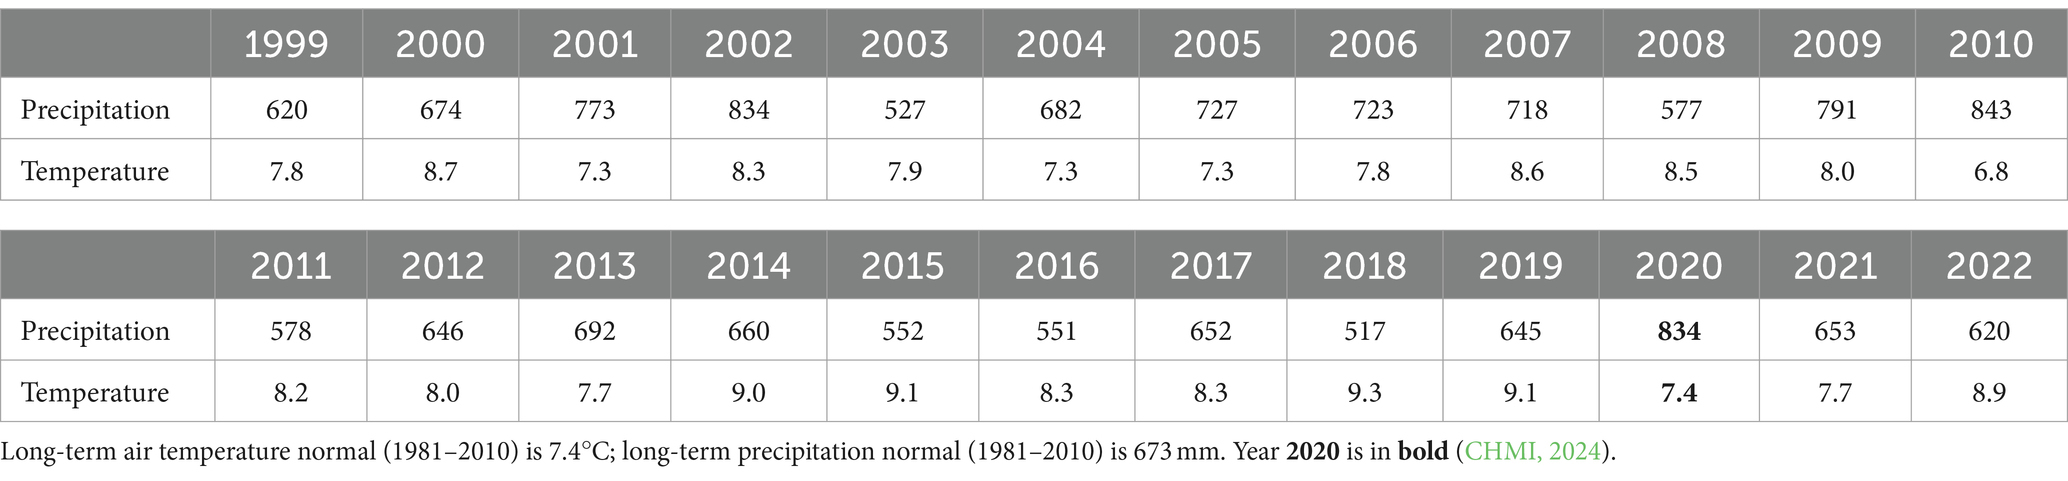
Table A1. Precipitation (mm) and mean temperature (°C) values in the studied region in 1999–2022.
Keywords: bark beetle detection, green-attack stage, unmanned aerial vehicles (UAVs), multispectral sensors, spectral change, vegetation indices, time-series analysis
Citation: Klouček T, Modlinger R, Zikmundová M, Kycko M and Komárek J (2024) Early detection of bark beetle infestation using UAV-borne multispectral imagery: a case study on the spruce forest in the Czech Republic. Front. For. Glob. Change. 7:1215734. doi: 10.3389/ffgc.2024.1215734
Edited by:
Barry Alan Gardiner, Institut Européen De La Forêt Cultivée (IEFC), FranceReviewed by:
Giovanni Santopuoli, University of Molise, ItalyRůžena Janoutová, Czech Academy of Sciences, Czechia
Copyright © 2024 Klouček, Modlinger, Zikmundová, Kycko and Komárek. This is an open-access article distributed under the terms of the Creative Commons Attribution License (CC BY). The use, distribution or reproduction in other forums is permitted, provided the original author(s) and the copyright owner(s) are credited and that the original publication in this journal is cited, in accordance with accepted academic practice. No use, distribution or reproduction is permitted which does not comply with these terms.
*Correspondence: Jan Komárek, komarekjan@fzp.czu.cz
†These authors have contributed equally to this work