Fire frequency, intensity, and burn severity in Kalimantan’s threatened Peatland areas over two Decades
 Andres Schmidt1*
  Lisa M. Ellsworth1
  Grace A. Boisen2 Nisa Novita3 Anjelita Malik3 Adi Gangga3 Israr Albar4 Ati Dwi Nurhayati5
  Rasis Putra Ritonga3 Adibtya Asyhari3 J. Boone Kauffman6
- 1Department of Fisheries, Wildlife, and Conservation Sciences, Oregon State University, Corvallis, OR, United States
- 2Department of Biological and Ecological Engineering, Oregon State University, Corvallis, OR, United States
- 3Yayasan Konservasi Alam Nusantara, Jakarta, Indonesia
- 4Indonesia Ministry of Environment and Forestry (MoEF), Jakarta, Indonesia
- 5Faculty of Forestry and Environment, IPB University, Bogor, Indonesia
- 6Illahee Sciences International, Corvallis, OR, United States
Kalimantan, the Indonesian portion of the Island of Borneo, has an estimated 45,000 km2 of tropical peatland and represents one of the largest stocks of tropical peat carbon. However, over the last three decades, the peatlands of Indonesia, and Kalimantan in particular, have been heavily degraded or destroyed by drainage of peatland swamps, deforestation, land cover change for agriculture, and intentional burning. Many studies have examined degradation of peat forests and the associated frequency of fires, often focusing on specific regions of Kalimantan over limited periods. Here, we present our results of a spatially comprehensive, long-term analysis of peatland fires in Kalimantan over more than two decades from early 2001 to the end of 2021. We examined the effects of changing climate conditions, land cover change, and the regulatory framework on the total burned area and frequency and severity of peatland fires over a 21-year period by combining extensive datasets of medium-resolution and high-resolution satellite imagery. Moreover, surface fire intensity was modeled for four dominant land use/land cover types to determine how land use change alters fire behavior. Our results confirm a consistent and strong spatiotemporal correlation between hydro-climatological drivers associated with El Niño conditions on peatland fire frequencies and burned peatland area. Changes in the number of fires and burn severity are visible over time and are caused by a combination of large-scale meteorological patterns and changing regulations. A significant relative increase of the “high” and “very high” severity across all peatland fires in Kalimantan was found for the latest period from 2015 through 2021 by 12.1 and 13.4%, compared to the two previous 7-year periods from 2001 to 2007 period and from 2008 to 2014, respectively, whereas the total peatland area burned decreased in 2015 to 2021 by 28.7% on average compared to the previous periods. The results underline the importance of a comprehensive approach considering physical aspects of overarching climate conditions while improving political and regulatory frameworks to mitigate the negative effects of burning tropical peatlands.
1 Introduction
Indonesia is home to about 23% of the world’s tropical peatlands with a large portion of the country’s peatland areas (32%, an area of roughly 45,000 km2) located in Kalimantan, the Indonesian portion of the Island of Borneo (Osaki et al., 2016; Xu et al., 2018; Anda et al., 2021). Indonesia’s peatland ecosystems represent one of the largest stocks of tropical forest carbon, storing an estimated 57 Gt of carbon (Page et al., 2011; Kiely et al., 2021). However, over the last three decades, the peat forests of Indonesia, and Kalimantan in particular, have been heavily degraded or destroyed by land cover change including the drainage of peatland swamps, deforestation, and human-ignited fires primarily for land clearing.
Analyses from remote sensing imagery indicate that more than half of tropical peatland areas in Malaysia, Sumatra, and Borneo have been converted (Miettinen et al., 2016). Based on the land cover change datasets of the Indonesian Ministry of Environment and Forestry (MoEF), Indonesia has lost about 21% of peat swamp forests mainly due to oil palm and plantation forest development from 2009−2019 (Indonesia Ministry of Environment and Forestry [MoEF], 2020). This anthropogenically induced land use/land cover (LULC) change transformed large portions of the natural peat swamp to agricultural land primarily for oil palm plantations, industrial timber plantation, the cultivation of rice, and the production of rubber (e.g., Ramdani and Hino, 2013; Tacconi and Muttaqin, 2019). The occurrence of peatland fires in Indonesia is driven by a complex combination of overarching meteorological conditions, the political framework, and socio-economic aspects within agricultural communities in peatland areas (Edwards et al., 2020; Silvianingsih et al., 2020). The province of Central Kalimantan in Indonesia, where an estimated 10,000 km2 of tropical peat swamp forest was cleared during the Mega Rice project (Law et al., 2015) exhibits the highest density of peatland fires in Southeast Asia (Miettinen et al., 2017).
Degraded peatlands are more prone to recurrent fires (Miettinen et al., 2012). For example, Vetrita and Cochrane (2020) analyzed fire frequencies in Indonesia’s two largest peatland regions, Kalimantan and Sumatra during 2001−2018 and found degraded shrublands have the highest rate of annual burning (329 and 236 km2 per year, respectively), impeding forest regeneration. LULC change and the conversion to more flammable vegetation increases the risk of intentionally ignited peatland fires spreading beyond their intended extent (Goldstein et al., 2020). Peatland fires have been attributed to negative consequences across all sectors.
In addition to the devastating effects on public health by smoke and haze during intense drought-induced peatland fire seasons in Indonesia (Marlier et al., 2015; Uda et al., 2019) and substantial economic losses (Kiely et al., 2021), the peatland fires also have a strong impact on climate change as massive amounts of carbon stored in aboveground vegetation, roots, and soils are released into the atmosphere (Turetsky et al., 2015; Heymann et al., 2017; Wiggins et al., 2018; Lasslop et al., 2019; Novita et al., 2021; Ribeiro et al., 2021; Volkova et al., 2021), intensified by contributions from long-lasting peat smoldering below the surface (Yokelson et al., 2022).
Hence, a comprehensive assessment of the effects of climate and meteorological conditions on the number and behavior of peatland fires is needed to reveal short-term and long-term patterns in fire frequency and burn severity and to understand how changing LULC alters landscape flammability within Kalimantan’s threatened peatland areas and consequently inform land management and regulatory strategies.
In recent years, peatland fire frequency has been in the focus of the scientific community to characterize fire regimes in peatlands and link fire occurrences to climate conditions and anthropogenic actions. This is supported with an ever-growing number of studies using remote sensing data and satellite imagery in combination with process models, machine learning, and refined remote sensing methods on various spatial scales to address the fire frequency and fire-induced land cover changes, focusing on specific regions or distinct periods, respectively, (e.g., Sabani et al., 2019; Gaveau et al., 2021).
Burn severity is another key factor in characterizing fire occurrences and is needed to estimate emissions from the fire and to quantify the recovery potential of vegetation (Turetsky et al., 2015). In addition, the properties of the post-fire vegetation are important factors that define the burning conditions for following fire events (Hoscilo et al., 2013). Many studies have linked spatiotemporal patterns of fire frequency and burn severity and their relationship to land cover changes to address drivers of tropical peatland fire in distinct periods (Vetrita and Cochrane, 2020).
Yet, to the knowledge of the authors, studies emphasizing long-term patterns of fire in response to climate-drivers in tropical peatlands are scarce for Indonesia, especially in Kalimantan, a region with vast peatland coverage and continuous threats of fires within peatland ecosystems.
The Indonesian government has initiated various programs and policies to address peatland fires in Kalimantan. These include efforts to restore degraded peatlands, improve fire prevention and control measures, and promote sustainable land-use practices. While organized efforts are needed, informed decisions require the knowledge of causes and effects of peatland fire frequency and severity, especially when long-term changes of climate that affect important large-scale meteorological patterns are added to economically driven LULC change. In this study we aim to (1) assess the effect of climate and meteorological conditions on the number and behavior of fires in tropical peatland (2) analyze spatiotemporal patterns in fire frequency and burn severity across all peatland areas of Kalimantan over more than two decades (January 2001 through December 2021) using medium-resolution and high-resolution satellite imagery, (3) model potential surface fire intensity for four dominant land cover types in Kalimantan to better understand how changing LULC alters landscape flammability.
2 Data and methods
2.1 Study area and climate data
Our peatland study region covers an integrated area of 45,000 km2 in Kalimantan (Figure 1) and was chosen according to the delineation of the PEATMAP landcover dataset (Xu et al., 2018).
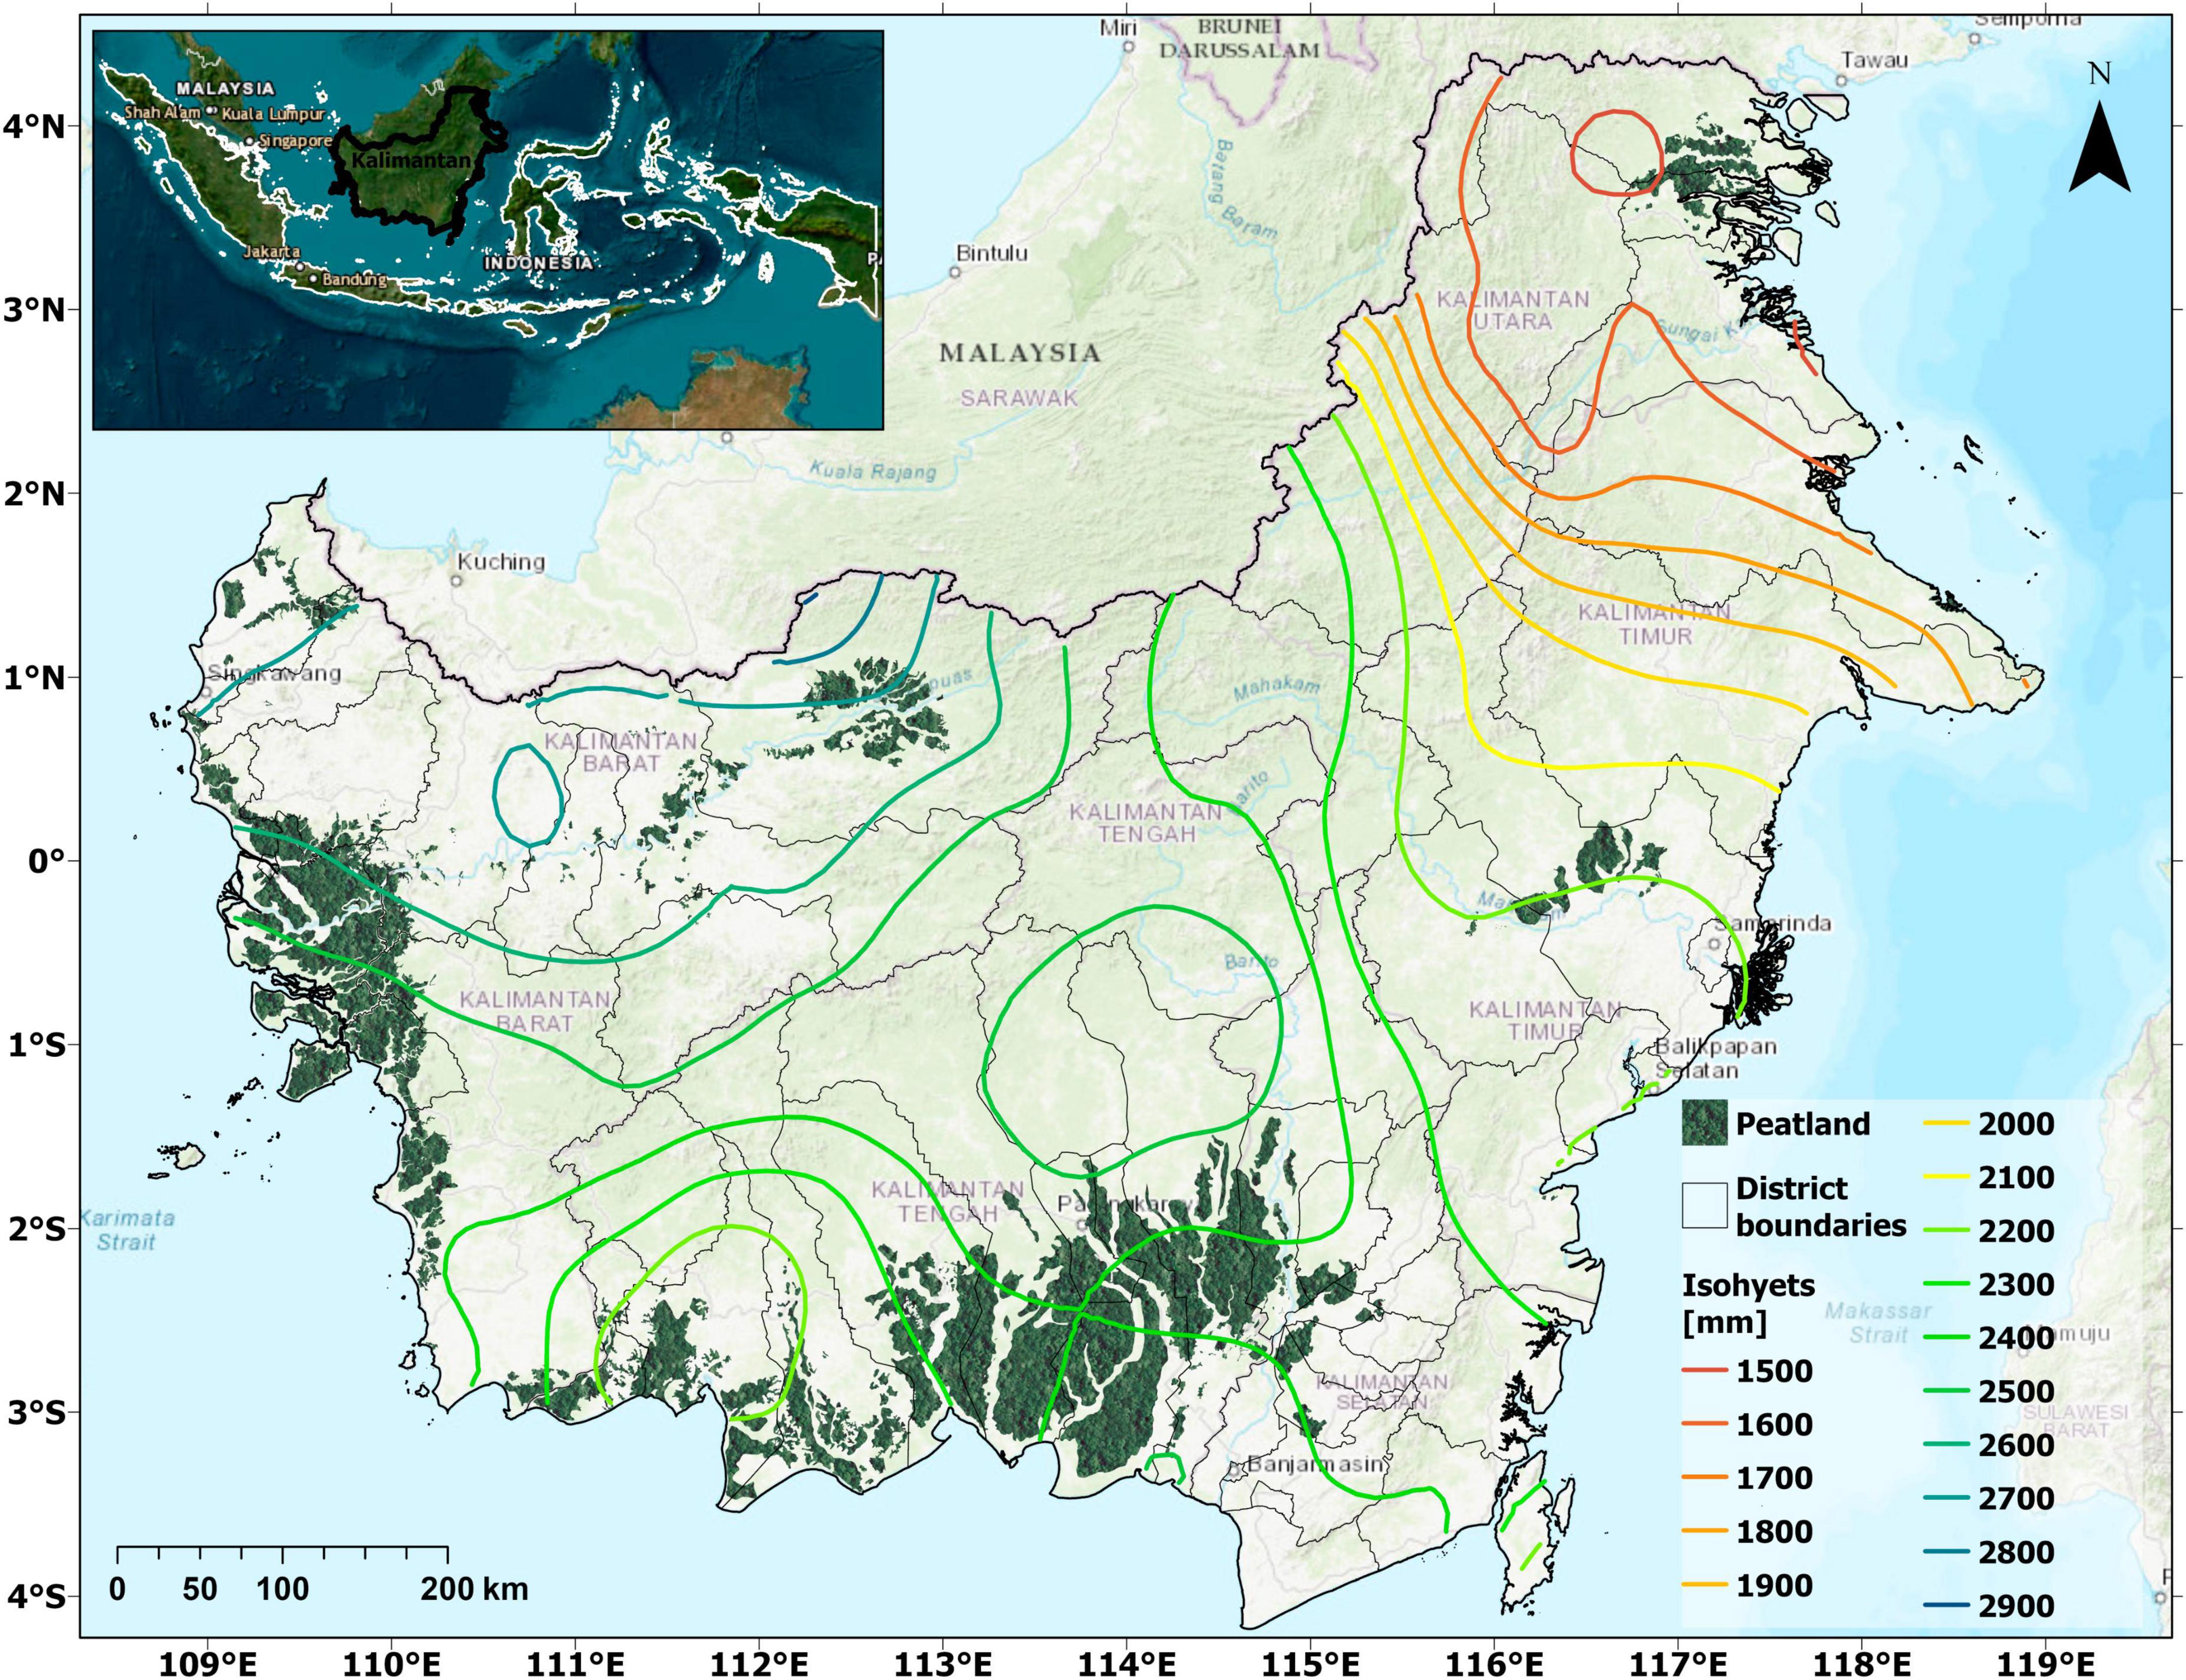
Figure 1. Overview of the study region showing the delineated peatland areas (dark green) based on PEATMAP data and the average annual precipitation for the study period from January 2001 to December 2021.
To spatiotemporally assess the governing climate conditions that drive fire regime conditions and occurrences over more than two decades (January 2001−December 2021), we used gridded climate data with a spatial resolution 0.1 × 0.1 (ca. 11 km × 11 km in our study region) of the ERA5 - Land Reanalysis data (Muñoz-Sabater et al., 2021) over Kalimantan provided by the European Centre for Medium-Range Weather Forecasts (ECMWF).
We used monthly values of synoptic means of air temperature at 2 m a.g.l. and total precipitation accessible through the ECMWF data repository (Muñoz-Sabater, 2019) to calculate anomalies of air temperature and precipitation with respect to the 21-year study period.
2.2 Moderate resolution thermal anomalies
Moderate Resolution Imaging Spectroradiometer (MODIS, Aqua & Terra) Thermal Anomalies / hotspot data (Ver. 6.1), provided through U.S. Geological Survey (USGS) and the National Aeronautics and Space Administration (NASA), was applied to identify peatland fires in Kalimantan from January 2001 through December 2021. While the corresponding Visible Infrared Imaging Radiometer Suite (VIIRS) captures more small fires, the satellite only launched in October 2011 making the dataset unsuitable for our long-term assessment. Hence, to avoid inconsistencies, only MODIS hotspot data was utilized to identify fires.
We combined the daily MODIS MCD14DL (Collection 6.1) active fire product and the corresponding historic fire product MCD14ML to track fire events detected in peatlands of Kalimantan from 2001 through 2021. The MODIS hotspot dataset provides daily 1 km × 1 km resolution center coordinates of fire events and fire radiative power (FRP) values for high-intensity fire pixels (Giglio et al., 2016). The MODIS hotspot dataset has been proven suitable to assess fire frequency and burned area in our study region (e.g., Tansey et al., 2008; Albar et al., 2018). The dataset also contains values reflecting the certainty of each thermal anomaly detection. Only data points with a certainty value of ≥85% were considered actual peatland fire events and used for further analyses. Using locations and dates of fire events detected through the MODIS MCD14DL thermal anomaly/hotspot dataset as reference, temporally corresponding and collocated high-resolution (10 m × 10 m to 30 m × 30 m) satellite surface reflectance data was identified and analyzed for long-term pattern recognition in burn severity of peatland fires. The monthly long-term USGS/NASA MCD64A1 Burned Area data product (Version 6.1) was used to trace the amount burned peatland area over time.
The MCD64A1 dataset combines MODIS active fire observations with MODIS surface reflectance imagery providing a global grid with 500 m × 500 m spatial resolution. The dataset contains a classification indicating whether a pixel is a burned area, accompanied by additional information such as burn date and quality assessment values of the uncertainty in days for the date of burn for each data pixel (Giglio et al., 2018). Globally, the data product exhibits a 40.2% commission error and 72.6% omission error after a comparison with corresponding Landsat 8 burned area values based on 558 pre- and post-fire scenes (Boschetti et al., 2019).
Nevertheless, using aggregated Landsat 8 raster data with decreased spatial resolution, the coefficient of determination (R2) for the MCD64A1 and Landsat 8 burned area data was found to be >0.7 for the linear regression. Hence, while limited by resolution, the global MCD64A1 dataset offers the longest standing reference for burned area assessments.
2.3 High resolution satellite surface reflectance imagery
To cover the 21-year study period as continuously as possible, we combined high resolution imagery from Landsat missions provided through the NASA/USGS Collection 2 / Level 2 data repository (Micijevic et al., 2020) and data from the European Space Agency (ESA) Sentinel-2 A/B satellite mission (Gascon et al., 2014). This comprises Landsat-5 Thematic Mapper (TM), Landsat-7 Enhanced Thematic Mapper Plus (ETM+), Landsat-8 Operational Land Imager (OLI) and Thermal Infrared Sensor (TIRS) multispectral data (e.g., Reuter et al., 2011, 2015; Wulder et al., 2019) as well as data from the Copernicus Sentinel-2 mission (Claverie et al., 2018) for the analyses of burn severity (Figure 2). The USGS Landsat 2 / Level-2 collection datafiles are quality filtered and flagged including cloud masking and atmospheric corrections have been applied such as corrections for solar angle and sensor viewing angles (Micijevic et al., 2020; Pinto et al., 2020).
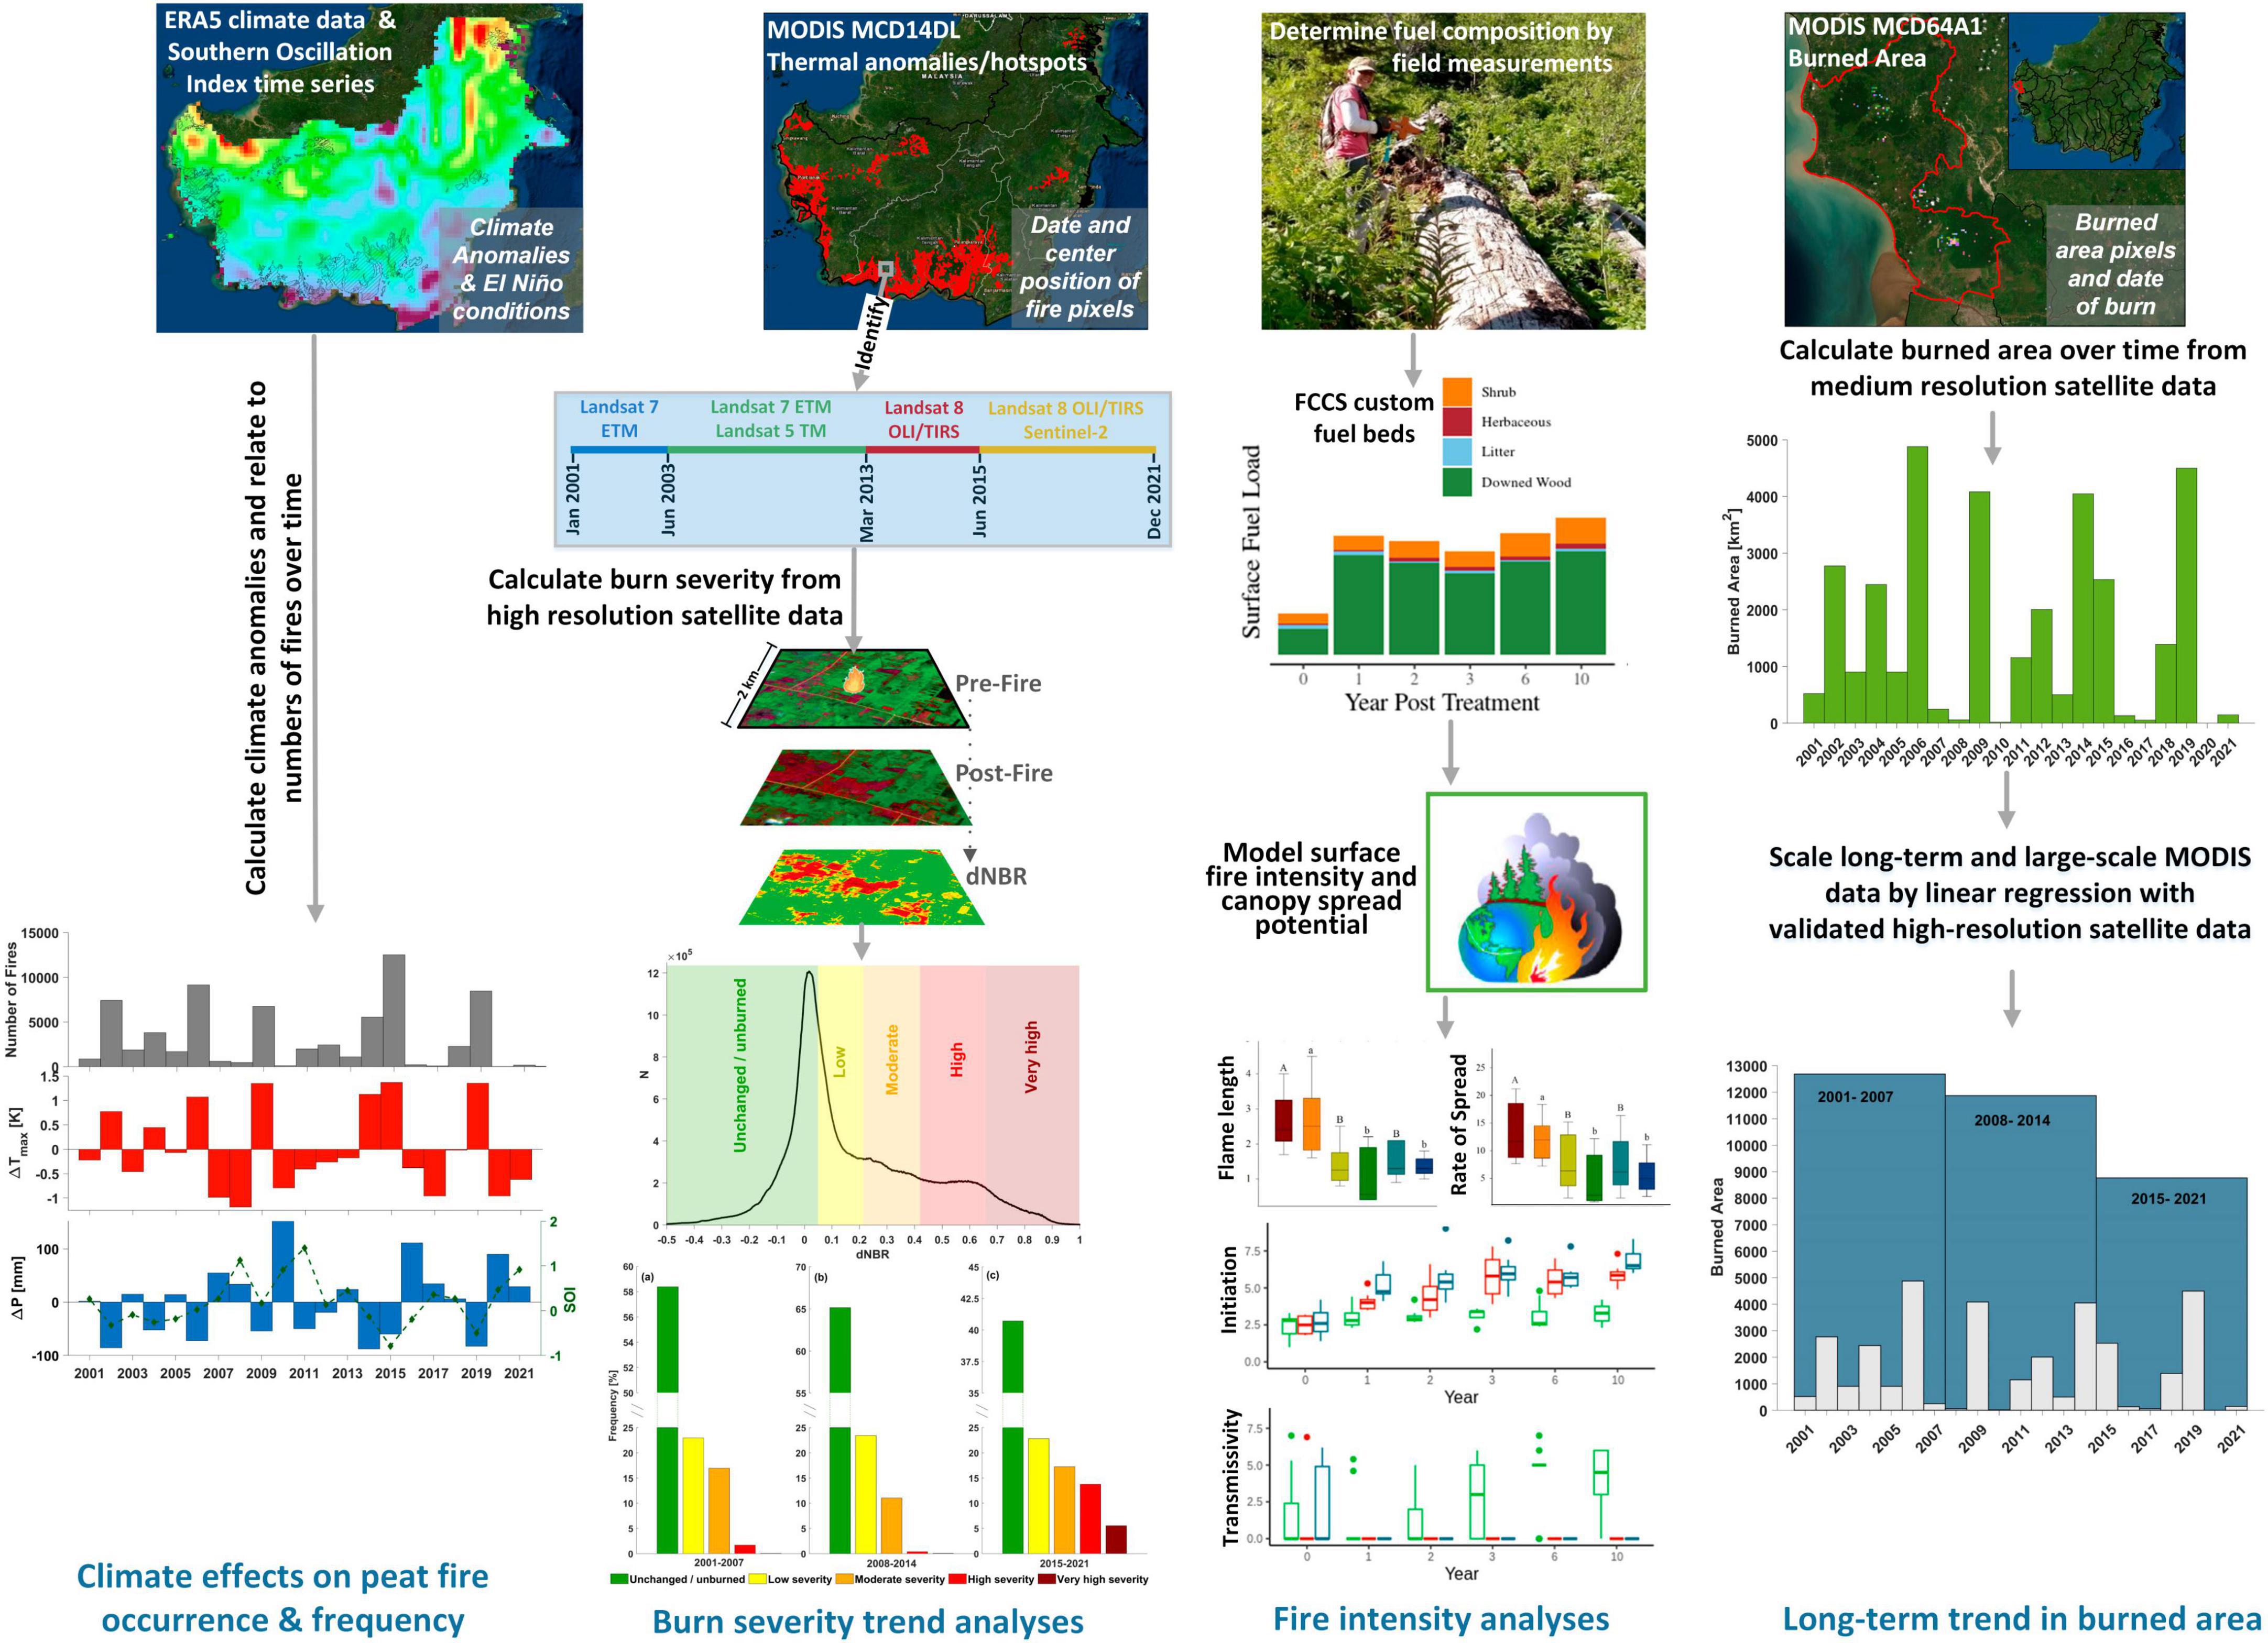
Figure 2. Schematic overview of processing steps and data used for the analyses.
We extracted data sub-grids from the Landsat and Sentinel-2 satellite scenes for each channel for each fire event with a 2 km buffer from the centers of the MODIS hotspot data points. The spatial buffer size was chosen empirically to safely capture the complete extent of all burns while accounting for the spatial accuracy of the MODIS hotspot coordinates. To maximize the availability of high-resolution imagery data from the various Landsat and Sentinel-2 campaigns while accounting for generally faster regrowth in humid and tropic regions compared to temperate ecosystems, we allowed a window-width of 90 days before and after a fire event for the satellite scenes to be used to capture the pre-fire and post-fire surface reflectance spectra around a specific peatland fire event. The rasters used for the reflectance analyses of burn severity have a spatial resolution of 30 m × 30 m for the Landsat imagery and 20 m × 20 m for the Sentinel-2 data.
With the study area located in the tropics, cloudiness mostly affects the quality and usability of the Landsat and Sentinel satellite surface reflectance imagery in our study area (e.g., Sudmanns et al., 2019). Hence, to allow for reliable comparison of pre-fire and post-fire reflectance data, hotspot-specific Landsat, and Sentinel-2 sub-grids with more than 2% of the pixels classified as cloud cover (clouds and cloud shadows) in the reflectance data sub-grids were not used for further analyses.
2.4 Burn severity analyses and classification
The differenced Normalized Burn Ratio (dNBR) was used to assess aboveground damage to vegetated areas after fires (Brewer et al., 2005). Unharmed vegetation exhibits high reflectance values in the near-infrared (NIR), and low reflectance in the shortwave-infrared (SWIR) band spectrum whereas burnt vegetation shows low reflectance in the NIR and high reflectance in the SWIR band. Hence, high NBR (Eq. 1) values indicate healthy unburned vegetation while low NBR values indicate bare ground, charred vegetation, and recently burnt areas. By comparing pre-fire reflectance with post-fire reflectance through the dNBR (Eq. 2), damage to the surface vegetation (i.e., burn severity) can be assessed and classified (e.g., Miller and Yool, 2002; Cocke et al., 2005) following Eqs 1, 2:
The NIR and SWIR channel assignments vary slightly with respect to the wavelengths captured based on the satellites’ instrumentations. Details regarding the quality, spectral comparability, as well as the classification of channels and respective wavelengths for the various LANDSAT missions used and the Sentinel-2 mission can be found in Chander and Markham (2003), Irons et al. (2012), and Lamquin et al. (2019), for instance.
If more than one pre-fire or post-fire NBR raster sub-grids were available after quality filtering, we used averages of the corresponding NBR datasets. This dampens effects of remaining erroneous pixel values and leads to an overall improved accuracy compared to corresponding dNBR values based on only one pre-fire and one post-fire raster pair (Parks et al., 2018).
For some peatland fire events after 2015, a combination of Sentinel-2 and Landsat-8 data were blended after rescaling the higher resolution rasters to 30 m x 30 m resolution, leading to acceptable deviations compared to using post- and pre-fire spectral data from one set of spectral data. However, using imagery from various satellites/instruments increases the overall accuracy if surface reflectance data closer to an actual fire date can be captured (Quintano et al., 2018).
2.5 Fire intensity modeling
Fire behavior models are important in supporting fire characteristics assessment and fire management (Scott and Burgan, 2005). Those models are built around mathematical equations that predict fire spread (Rothermel, 1972; Prichard et al., 2013) based on the amount, type, and arrangement of burnable material (fuels) and weather conditions. Fire behavior is commonly predicted using models that are parameterized with fuel structure and composition data (i.e., cover, height, biomass) that are collected in situ or with existing standard fuel models (Scott and Burgan, 2005; Heinsch and Andrews, 2010). The Fuel Characteristic Classification System (FCCS) in the Fuel and Fire Tool (FFT) (Prichard et al., 2013) allows users to input site-specific fuel and weather data to estimate potential fire behavior (e.g., rate of spread, flame length), as well as to inform prescribed fire planning and fuel hazard assessments. This model improved upon earlier systems (i.e., BehavePlus, Heinsch and Andrews, 2010) by incorporating a modified version of Rothermel (1972) equations that allowed for greater flexibility in user inputs to fuel loads, ultimately allowing the user to set fuel input parameters to represent a heterogeneous and layered fuel structure (i.e., canopy, sub-canopy, understory, surface fuel, and ground fuel) that more accurately represents field conditions (Sandberg et al., 2008). Modeled fire behavior studies have provided valuable information, in particular, for risk assessments (e.g., Ager et al., 2011; Schmidt et al., 2022) and for comparisons among LULC types or management alternatives (Brose and Wade, 2002; Evans et al., 2015; Parsons et al., 2018; Johnston et al., 2021; Williams et al., 2023).
To estimate the impact that different LULC types (forest, plantation, oil palm, early successional grass and shrubland - hereafter, grassland) have on potential fire intensity, we used the FCCS to build custom fuel models based on field observations and characterized surface fire intensity and canopy fire transmission in FFT. Fuels data were derived from published and government literature and local expert opinion for each LULC type (Novita, 2016; Basuki, 2017). The FFT estimates surface fire intensity using ecosystem-specific fuel data and environmental scenarios (i.e., moisture content through the typical fire season).
For each ecosystem type, fuel beds were customized to represent the quantity and arrangement of fuel. Details about the customized fuel beds are provided in the Supplementary material.
Environmental scenarios in the FFT model were calculated by inclusion of a moisture dampening coefficient, which has a linear relationship with model outputs, such that moist fuels generate reduced fire behavior metrics, and drier fuels result in more intense modeled fire behavior (Prichard et al., 2013). “Moderate” and “extreme” environmental scenarios were chosen to represent fuel moisture expected as vegetation phenology progresses from burnable, but moderate fire risk (2/3 cured scenarios; D2L2 in FFT), to highest fire risk, when fuels are dry and highly flammable (fully cured scenario; D2L1). Windspeed assumptions used were 6 kph (mild wind conditions) and 32 kph (moderately high wind). Independent model runs were done for each fuel model (forest, plantation, oil palm, grassland) at each wind and fuel moisture scenario. While not all combinations of influencing parameters that occur in reality can be covered, the applied model conditions cover a variety of meteorological and fuel conditions. Model outputs chosen to characterize surface fire intensity included rate of spread (ROS; m min–1), flame length (FL; m), and reaction intensity (RI; the rate of heat release per unit area of the flaming front; kW m2 min–1) (Byram, 1959; Keeley, 2009).
3 Results and discussion
The results for study’s objectives are consecutively presented in the following sections assessing the effect of climate and meteorological conditions on the number and behavior of fires in tropical peatland (section “3.1 Dependence of fire frequencies on meteorological conditions”), analyzing long-term spatiotemporal patterns of burn severity and peatland area burned across Kalimantan (sections “3.2 Regional trends in peatland fire burn severity” and “3.3 Assessment of burned peatland area over time”), and model potential surface fire intensity for four dominant land cover types in Kalimantan to better understand how changing LULC alters landscape flammability (section “3.4 Modeled fire intensity”). Furthermore, a short overview of the regulatory framework over the two-decade study period is presented in section “3.5 Timeline of the regulatory framework for peatland fires,” including observed effects on the number of peatland fires.
3.1 Dependence of fire frequencies on meteorological conditions
Using monthly ECMWF ERA5 Land Reanalysis climate data, we calculated annual averages for air temperature and precipitation anomalies spatially integrated over the peatland areas of Kalimantan. The annual deviations from the 21-year average of air temperature in 2 m a.g.l. and precipitation are shown in Figures 3B, C, respectively. Increased numbers of fires (Figure 3A) occur during years when the precipitation is lower than the average and the maxima of air temperature at 2 m a.g.l. exceeds the 21-year average value. Accordingly, years with the lower numbers of fires (i.e., 2007, 2008, 2010, 2016, 2017, 2020, and 2021) coincide with the years that exhibit total precipitation amounts above average and air temperature below average, respectively, (Figures 3A, C). The interannual variation of rainfall in Indonesia is strongly influenced by the Southern Oscillation index (SOI) and the associated ocean surface temperature variations, with the El Niño–Southern Oscillation (ENSO) affecting the amounts of precipitation during fire season and annual groundwater levels in the tropical peatlands of Kalimantan (Susilo et al., 2013; Alsepan and Minobe, 2020). The warmer conditions and reduced water vapor during El-Nino years decreases precipitation resulting in lower peatland groundwater level further increasing the fire susceptibility of degraded and drained peatlands (Sulaiman et al., 2023). An increase in the frequency of the El-Niño conditions of the overarching circulation system leads to more frequent, intensely dry fire seasons in Southeast Asia (e.g., Sun et al., 2020; Tan et al., 2020). These meteorological conditions that define the fire regime on a regional scale are reflected in the correlations with El Niño conditions and the corresponding number of fire events observed in our study region (e.g., Chen et al., 2016; Nurhayati et al., 2021).
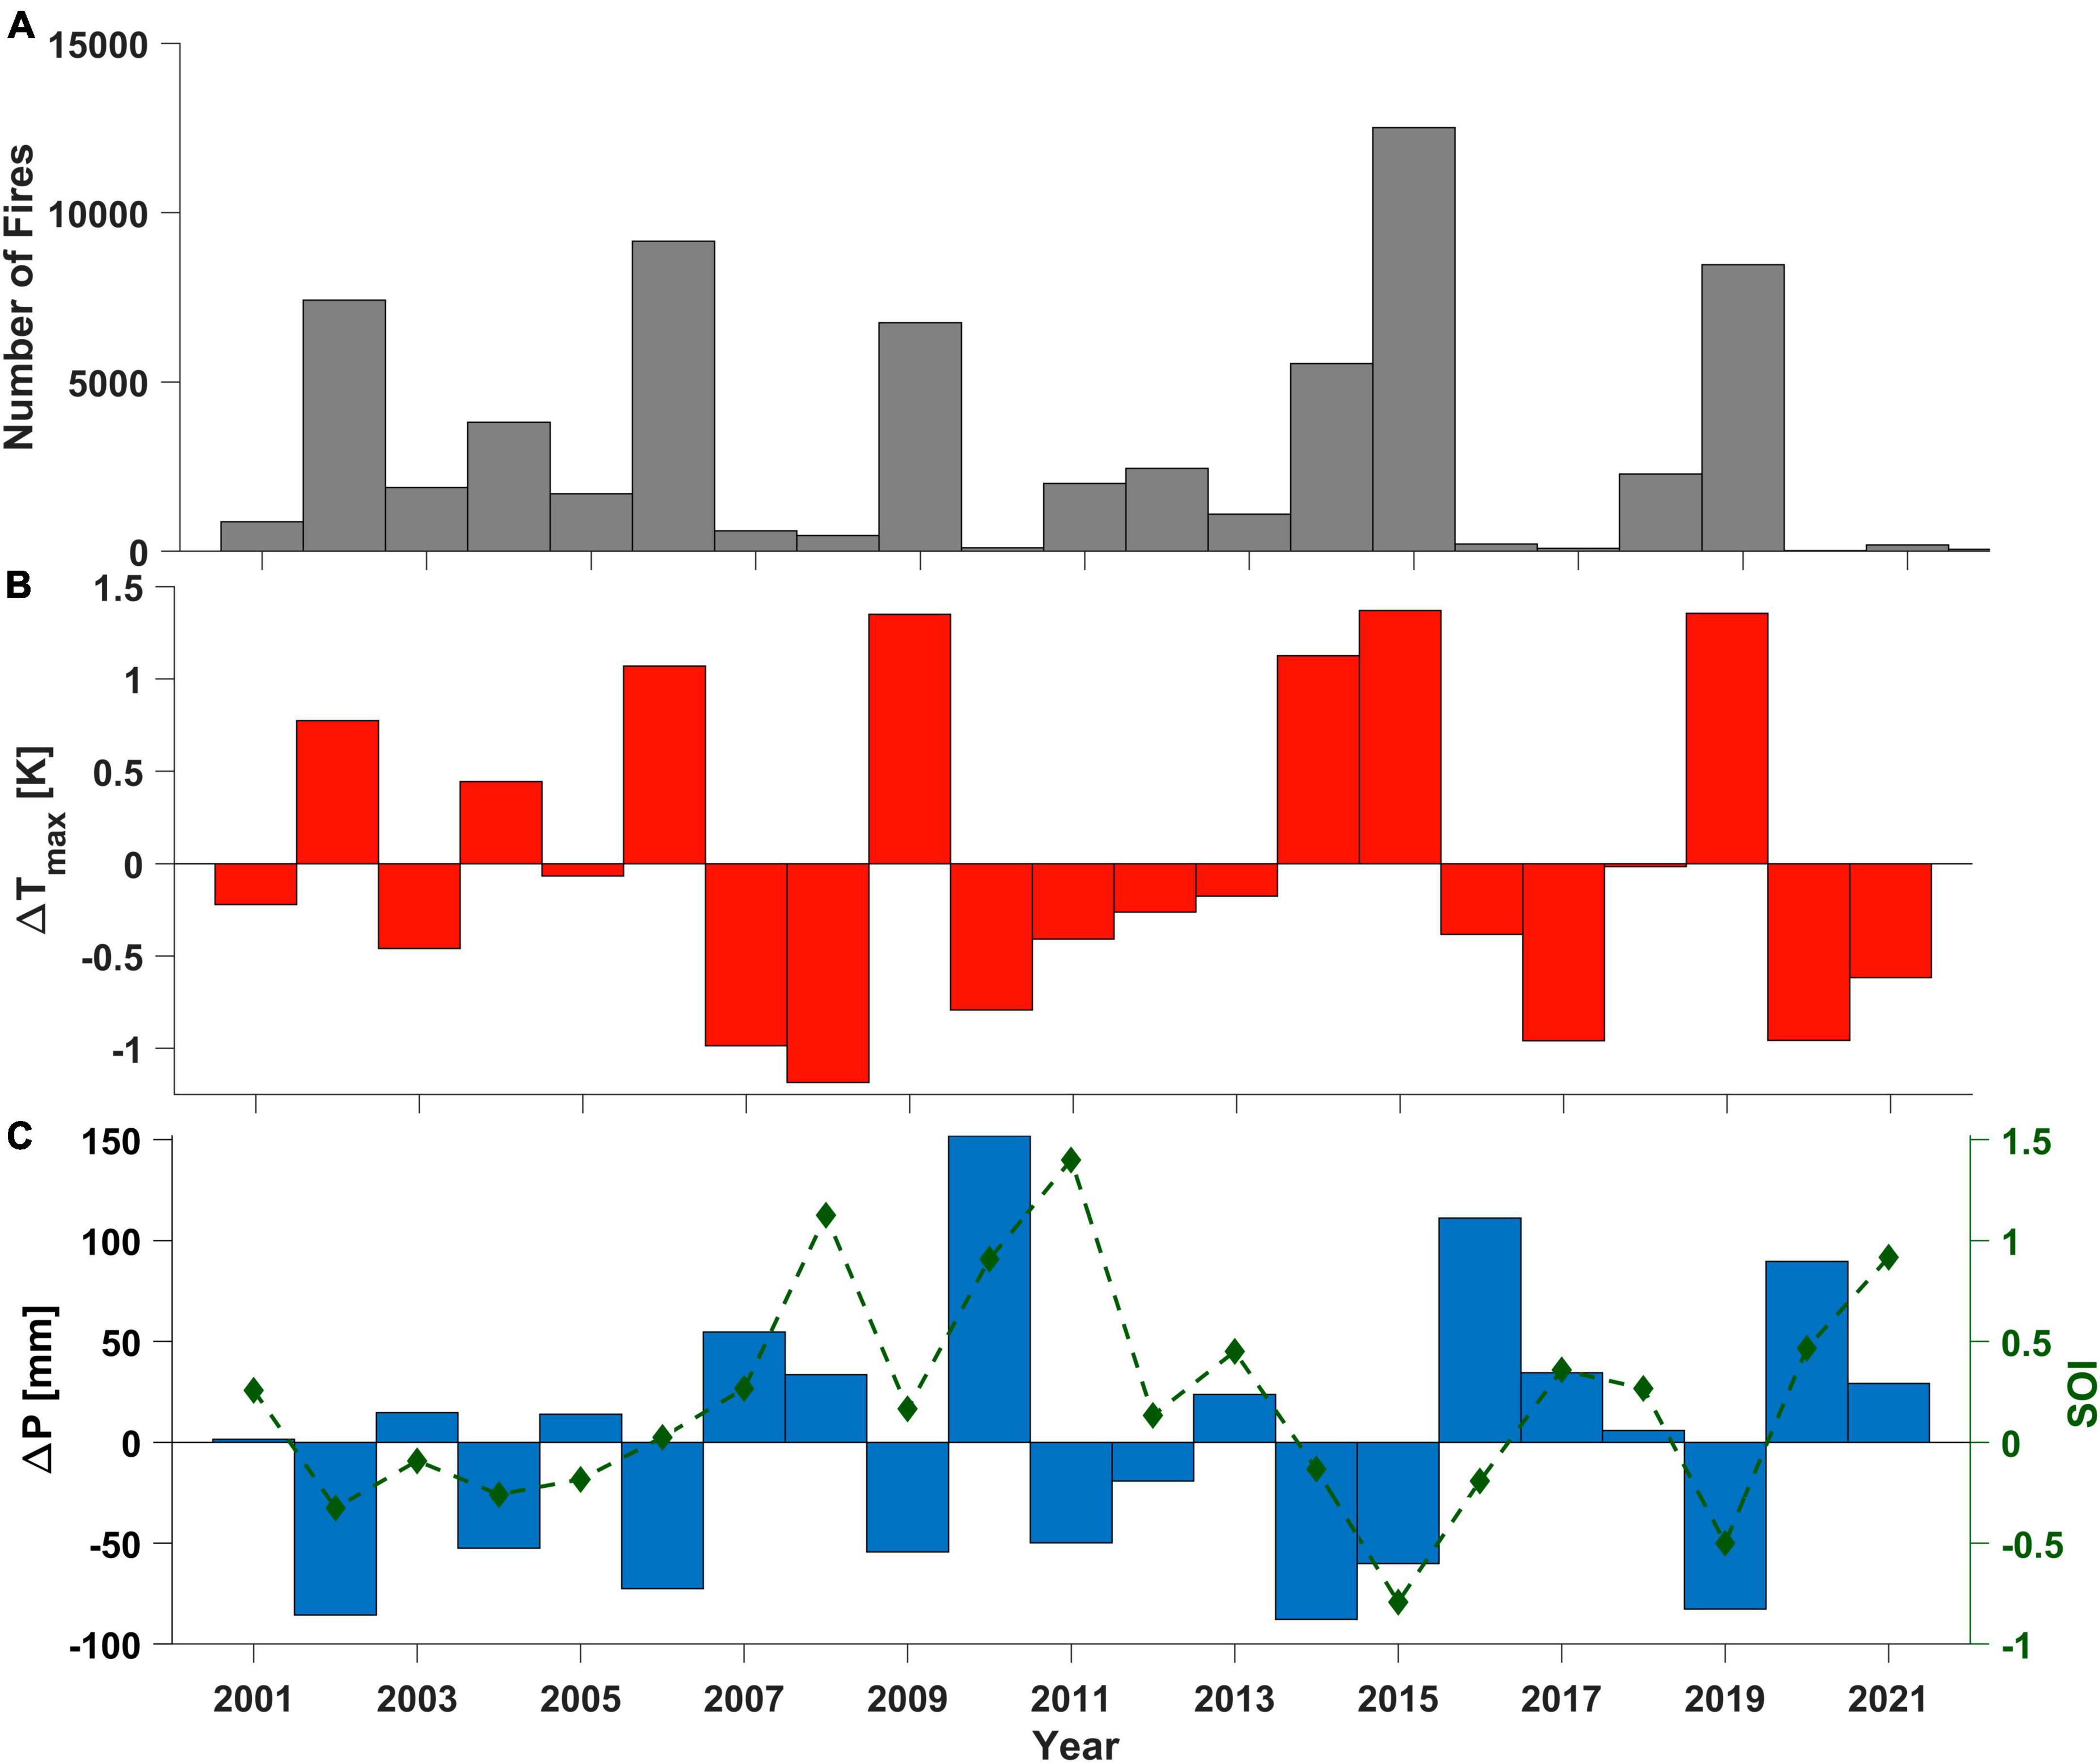
Figure 3. Annual number of peatland fires in Kalimantan based on MODIS hotspot data (A) and the corresponding anomalies of maximum monthly temperature (B) and total precipitation (C) integrated over the peatland areas of Kalimantan based on ERA5 Reanalysis data. The green line in panel (C) shows the annual mean SOI (derived from) https://www.cpc.ncep.noaa.gov/data/indices/soi with negative values indicating El Niño conditions.
We calculated Spearman rank correlation coefficients RS for the time series of the number of peatland fires, SOI, precipitation anomalies, and air temperature anomalies, confined to the peatland areas of Kalimantan (Figure 1). With a 99% confidence level, the annual number of peatland fires shows significant and strong correlations with the anomalies of precipitation (RS = −0.92), air temperature (RS = 0.88), and SOI values (RS = −0.67), respectively.
Annual averages of the Southern Oscillation Index for our 21-year study period are shown in Figure 3C. The negative SOI values are associated with El Niño conditions which lead to changes in large-scale transport of atmospheric moisture in the tropics coupled with intensified dry seasons in our study area. This is noticeable for the period from 2001 through 2006 and 2013 through 2016, for instance, during which also increased numbers of peatland fires were counted across Kalimantan’s peatland areas according to the MODIS hotspot data (Figure 3A).
This dependence of the number of peatland fires on the SOI also persists during short-term fluctuations in 2002, 2009, and 2016 when drops in the SOI concurred with increasing numbers of peatland fires compared to adjacent years (Figures 3A, C).
3.2 Regional trends in peatland fire burn severity
A total of 13,307 peatland fire events with high resolution pre-fire and post-fire surface reflectance data layers captured within 90 days before and after each analyzed fire event were available for our burn severity analyses. We applied a burn severity classification system developed using ground validated assessments of fire damage to the vegetation in combination with satellite imagery based dNBR values in Central Kalimantan to the high-resolution surface reflectance data following Hoscilo et al. (2013). The dNBR classification shows high correlations with corresponding pre-fire and post-fire ground measurements of vegetation parameters such as total woody aboveground biomass, tree density, and numbers of small trees in the affected areas. To increase the bin resolution for higher burn severities, we refined the classification by further separating the “moderate” and “high severity” classes according to Hoscilo et al. (2013), into “moderate,” “high,” and “very high” severity classes using the European Forest Fire Information Service (EFFIS) dNBR classification (e.g., Liu et al., 2022) for the higher burn severity classes.
The classification system (Table 1) also matches the partitioning of our overall distribution of dNBR pixels frequencies (N) calculated across all fires captured in the 21-year period (Figure 4).
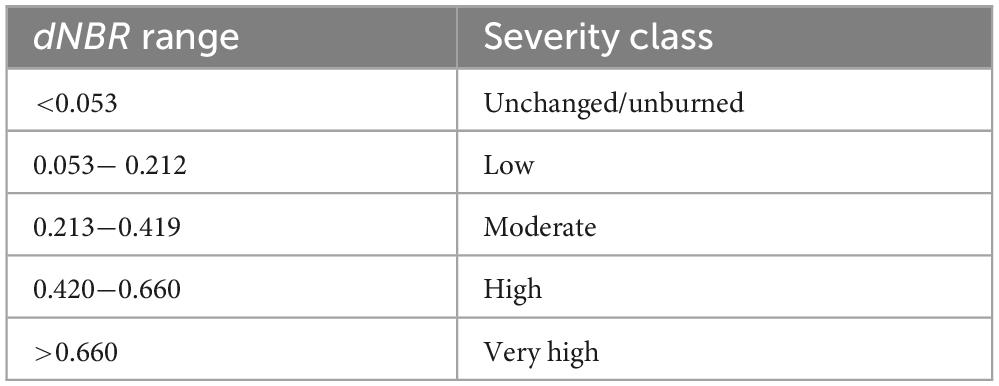
Table 1. Applied burn severity classification.
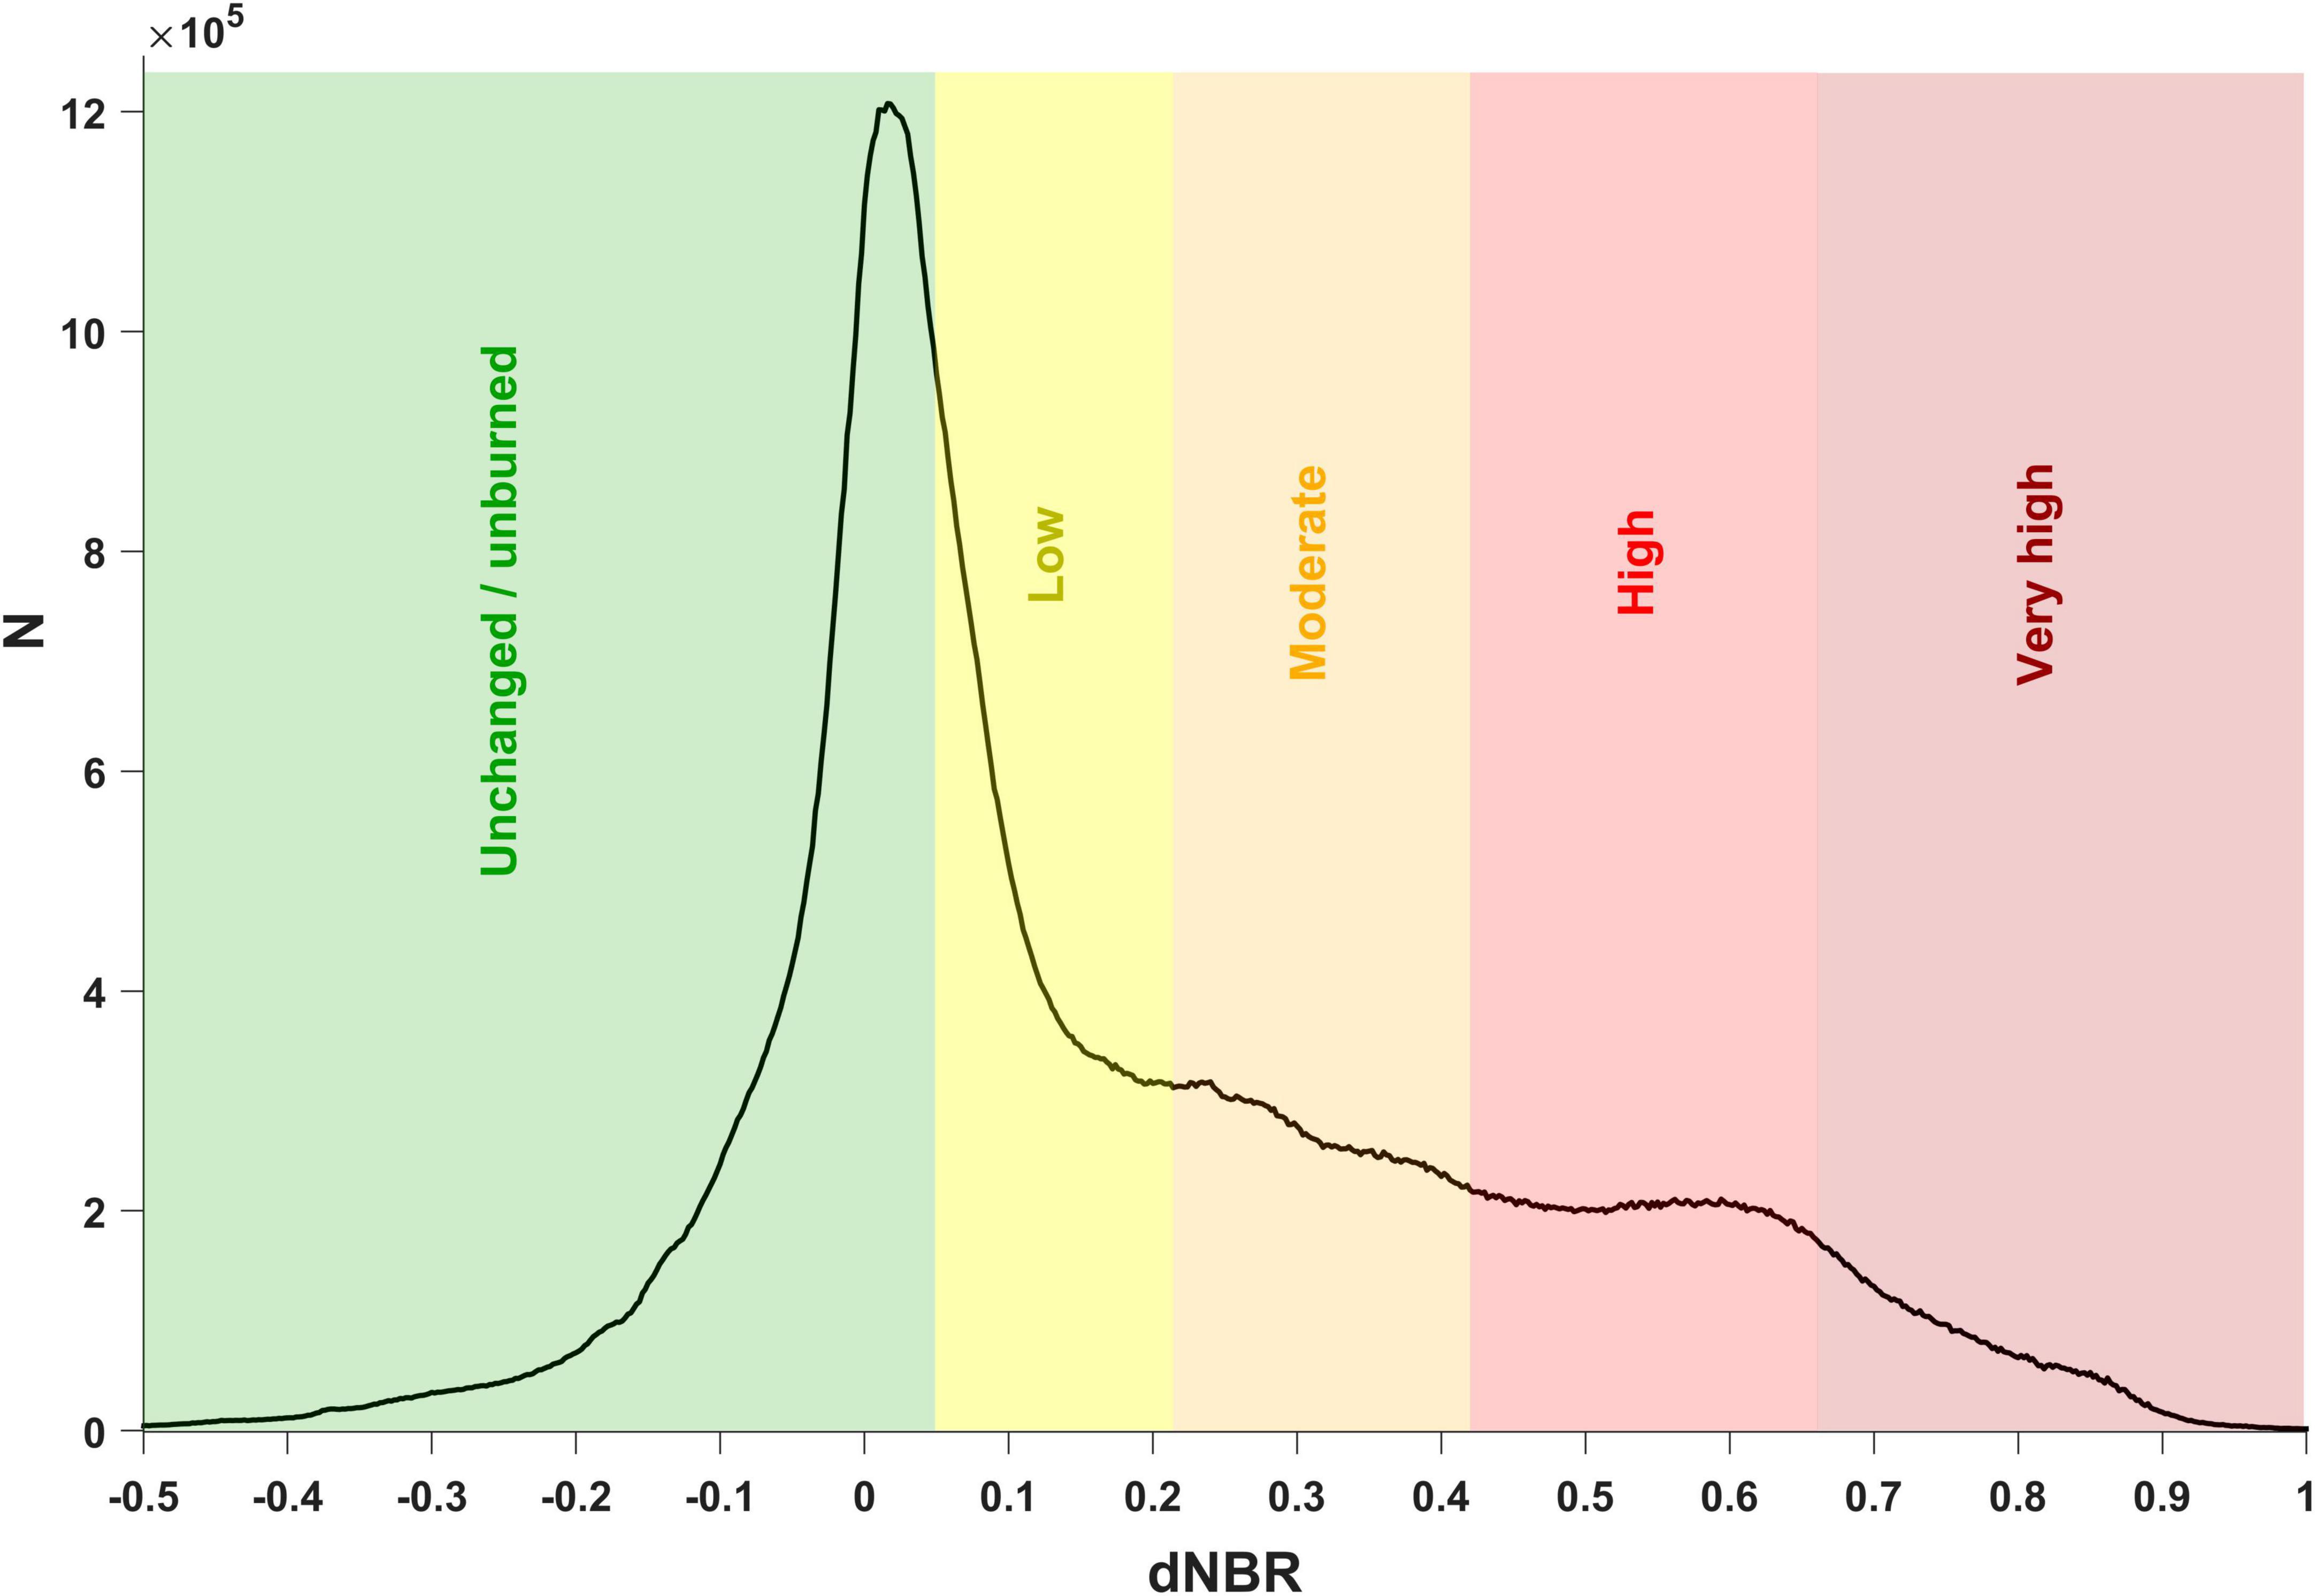
Figure 4. Frequency distribution of calculated dNBR pixel values and applied dNBR class boundaries for the burn severity classification of all fires included in the analysis across Kalimantan.
Many of the peatland fires were ignited to clear the area for establishment of crops such as oil palm plantations or rice fields. Because we applied a constrained window of 90 days after (or before) a fire, the number of dNBR pixel values potentially affected by post-fire reflectance of already growing crops is kept small but cannot completely be avoided in cases where an increased time interval has to be applied to capture the same area before and after a fire. In order to avoid misinterpretation of altered reflectance spectra caused by anthropogenic LULC change after a fire, we did not include an extra ‘enhanced regrowth’ class for negative dNBR pixels as our analyses focus on the fire damage to the natural peatland vegetation.
To assess long-term changes in fire severity in Kalimantan’s peatlands, we aggregated the high-resolution satellite data into three equal periods of 7 years (2001−2007, 2008−2014, and 2015−2021). The selected length of the periods assures that different meteorological conditions with above and below average precipitation and air temperatures are captured within each period (Figure 2). Due to an increasing number of satellite missions and an increasing amount of available imagery over the 21-years, the number of available satellite scenes varies over the 7-year data periods. Therefore, period-specific relative frequencies of burn severity values were calculated to account for changing total numbers that are solely based on an increasing imagery data pool for the later years of our study period.
Figure 5 shows the resulting multi-year histograms of burn-severity, integrated over all peatland fires in Kalimantan with pre- and post-fire high-resolution surface reflectance imagery within each 7-year interval. The fraction of areas with low severity fire damage remains relatively stable with an average of 23.0% (σ = 0.32%) across all periods. The portion of pixels with moderate burn damages fluctuates comparatively with σ = 3.5% and percentage values between 11 and 17% (Figure 5).
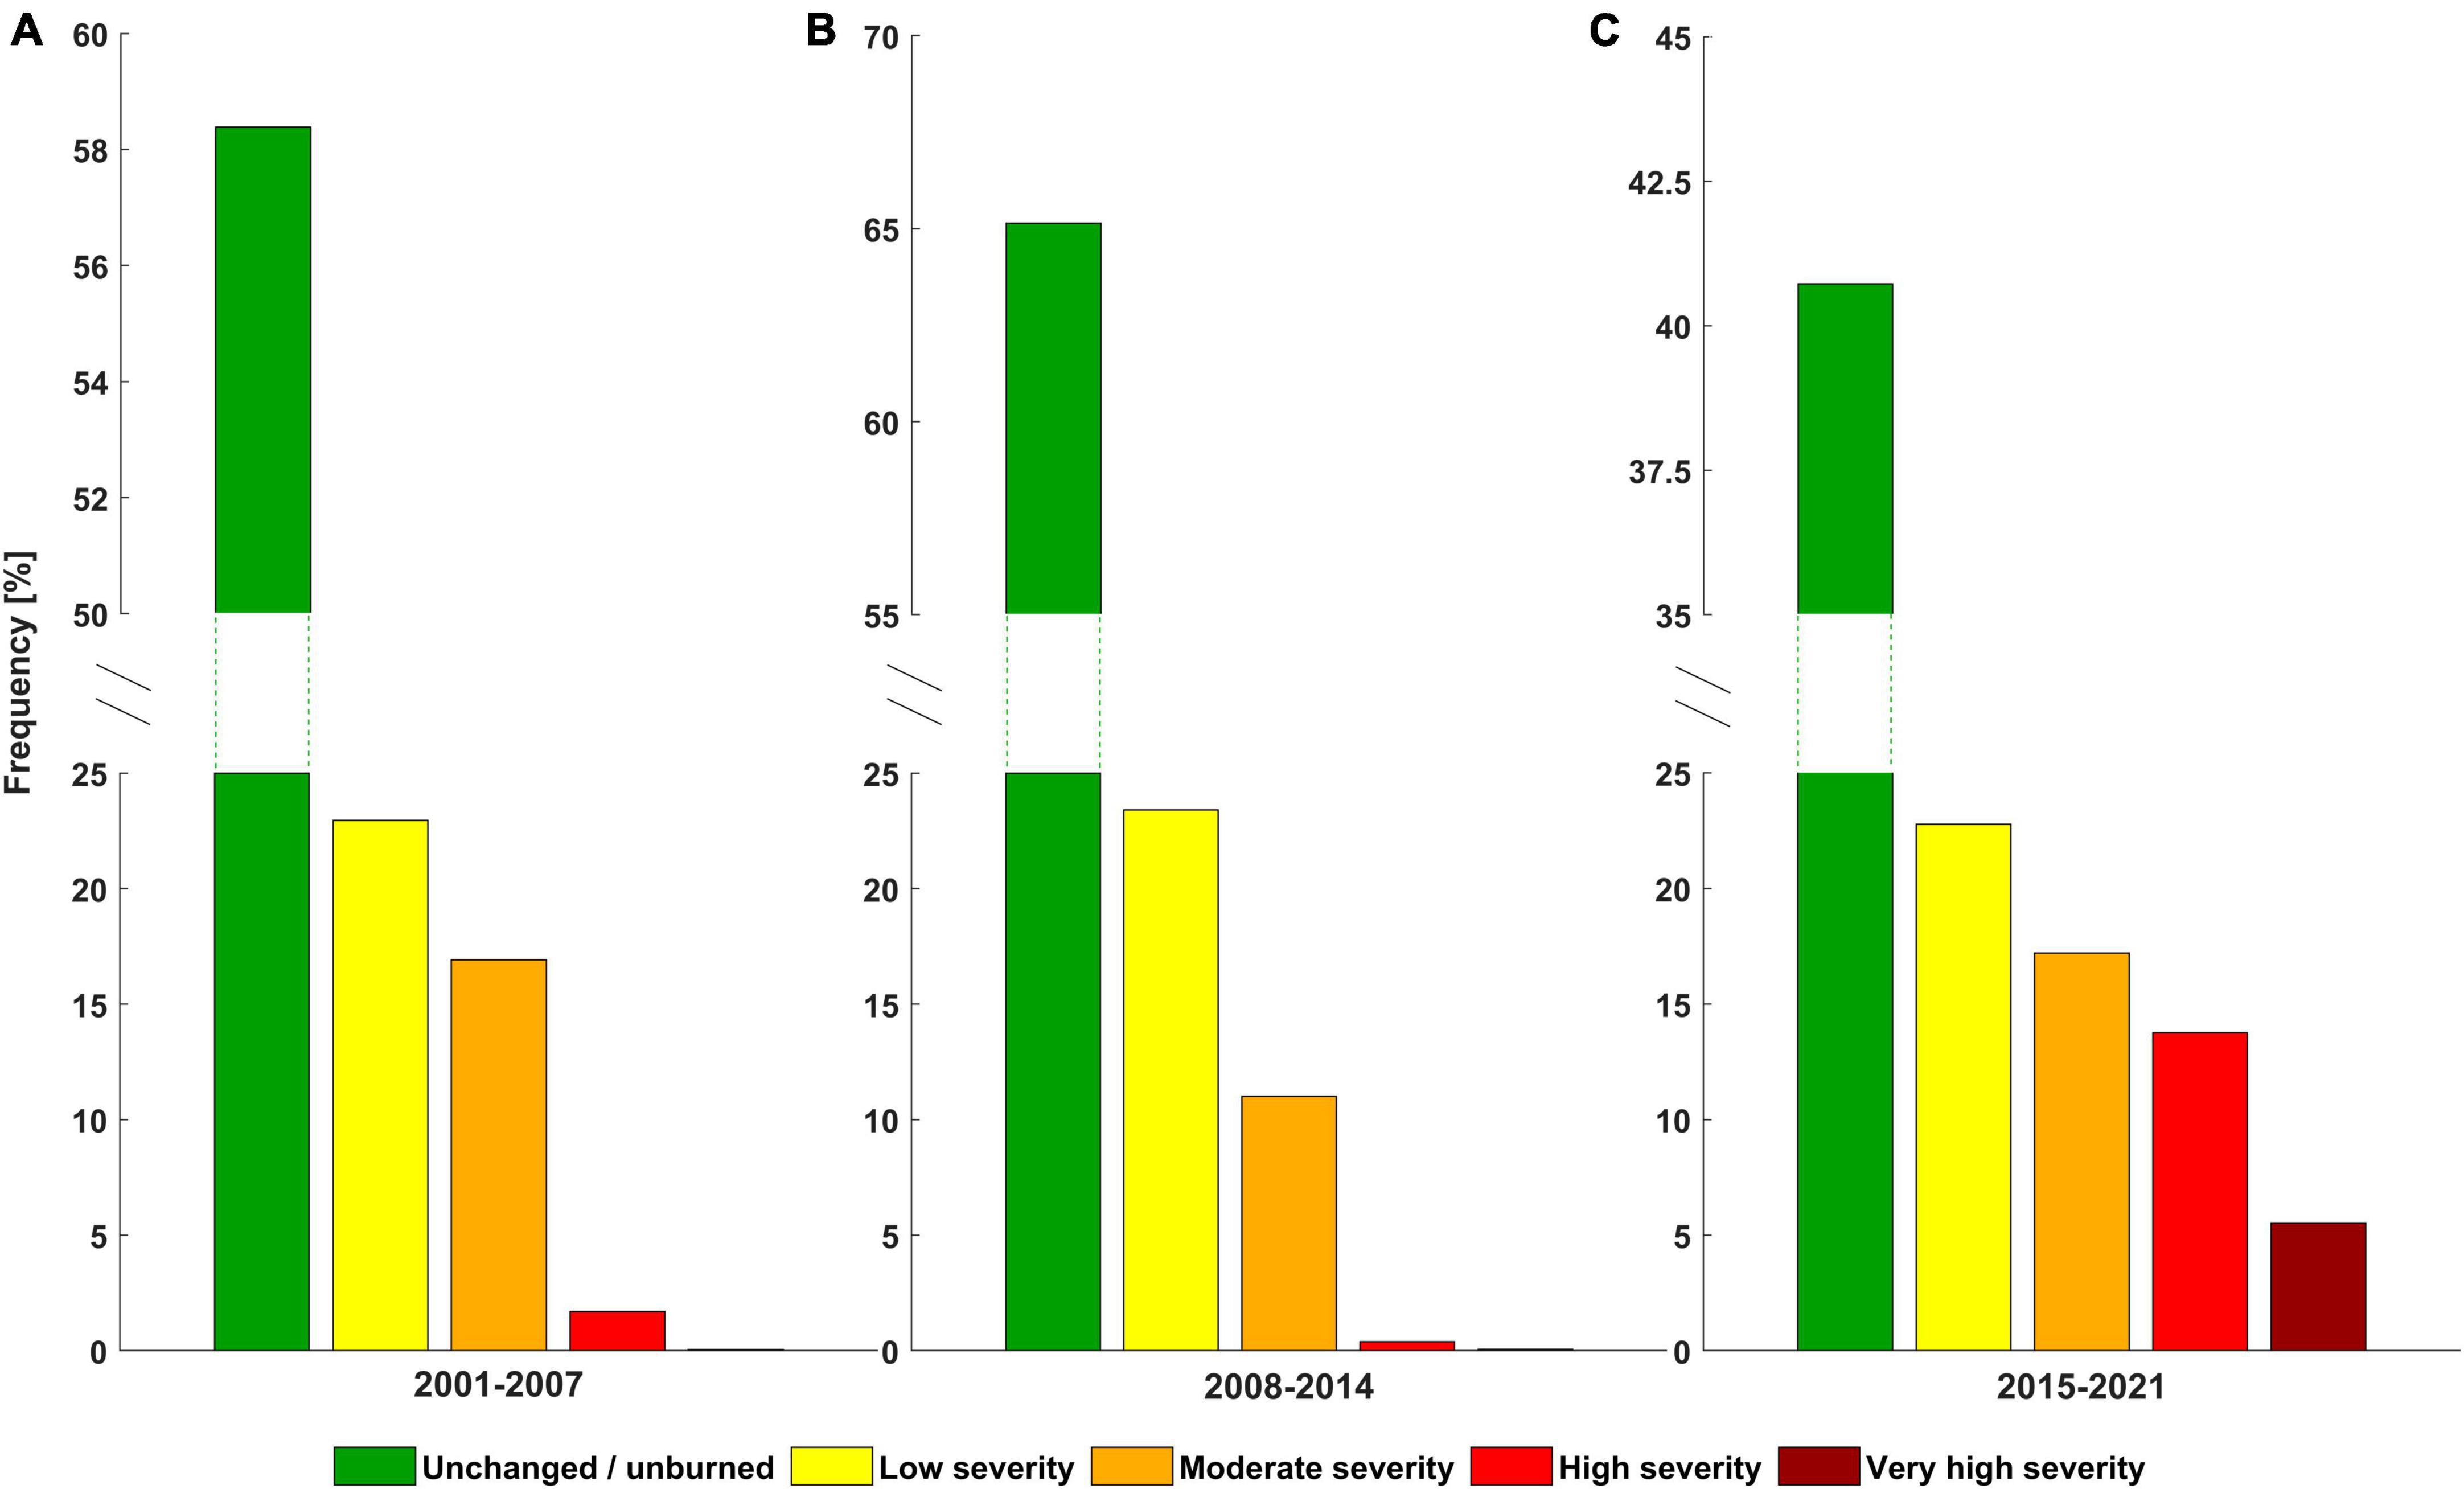
Figure 5. Histograms of average burn severities over the consecutive periods 2001–2007 (A), 2008–2014 (B), and 2015–2021 (C). To account for increased numbers of unchanged/unburned pixels inevitably captured in satellite imagery cutouts, the histograms are plotted with breaks in the y-axes for better visibility of the relative distribution values that refer to burned areas.
However, a strong relative increase of the “high” and “very high” severity class allocations is noticeable for the latest period (January 2015 through December 2021) in the dNBR frequency distribution (Figure 5C) compared to the two previous 7-year intervals (Figures 5A, B).
The number of pixels with high severity burn damages across all peatland fires in Kalimantan increased by 12.1 and 13.4% compared to the 2001−2007 period and 2008−2014 period, respectively.
While only negligible areas were classified as “very high severity” during the first two periods, 5.5% of burned pixels showed very high severity damage during the 2015−2021 period. Surface reflectance spectra alone cannot explain why fires result in more severe burn damage. Nevertheless, the highest severity class is nearly unoccupied during the first two 7-year periods (<1%) whereas a noticeable increase in the “highest severity” class is observed for the later periods. The consistent and significant changes in high severity and highest severity burns over time indicate an overall change in the severity of fire damage to the peat vegetation in more recent years. The latest period (Figure 5C) also includes the two extreme years of 2015 and 2019 with large numbers of peatland fires and strongly developed El Niño conditions (Figure 3). Moreover, both extreme years were characterized by persisting dry conditions starting the previous year which led to exceptionally dry fuel beds that in turn increase fire intensity and burn severity (e.g., Davies et al., 2016; Hantson et al., 2017).
3.3 Assessment of burned peatland area over time
Monthly aggregated MCD64A1 burned area grid maps (Ver 6.1, section “2.2 Moderate resolution thermal anomalies”) were applied as long-term data suitable for tracking temporal patterns and relative changes of burned peatland area in Kalimantan. Only grid cell values with a quality flag indicating sufficient valid data in the reflectance time series for the grid cell to be processed were used for the analyses. Using the available spatial resolution of 500 m × 500 m, we classified the corresponding pixel area as burned and integrated the areas over each year covering all peatland areas in Kalimantan.
Like all satellite imagery, the MODIS dataset is affected by inherent commission and omission errors and furthermore is affected by its moderate spatial resolution which limits the ability to accurately resolve the area of smaller fires. Hence, to capitalize on the long-term availability and consistency of the MODIS data while accounting for its limited resolution, we used 30 m high resolution imagery to scale MODIS derived long-term values of burned area (Vetrita et al., 2021).
We manually delineated burned areas using LANDSAT8 and Sentinel-2 imagery from 2015 through 2021 capturing the total burned area for 49 districts and cities in Kalimantan (Figure 1). To correct the long-term data for the annual total burned area for Kalimantan, we conducted a linear regression analysis (Roy et al., 2019; Vetrita et al., 2021) comparing annual district-specific sums of MODIS burned area and the corresponding burned area sums, manually delineated using high-resolution imagery from LANDSAT8 and Sentinel-2, for each district.
To account for district-year combinations with delineated monthly burned areas missing and to cover different temporal scales for the comparison, we included monthly and annual sums of delineated burned area values and corresponding MCD64A1 sums for the regression (Figure 6).
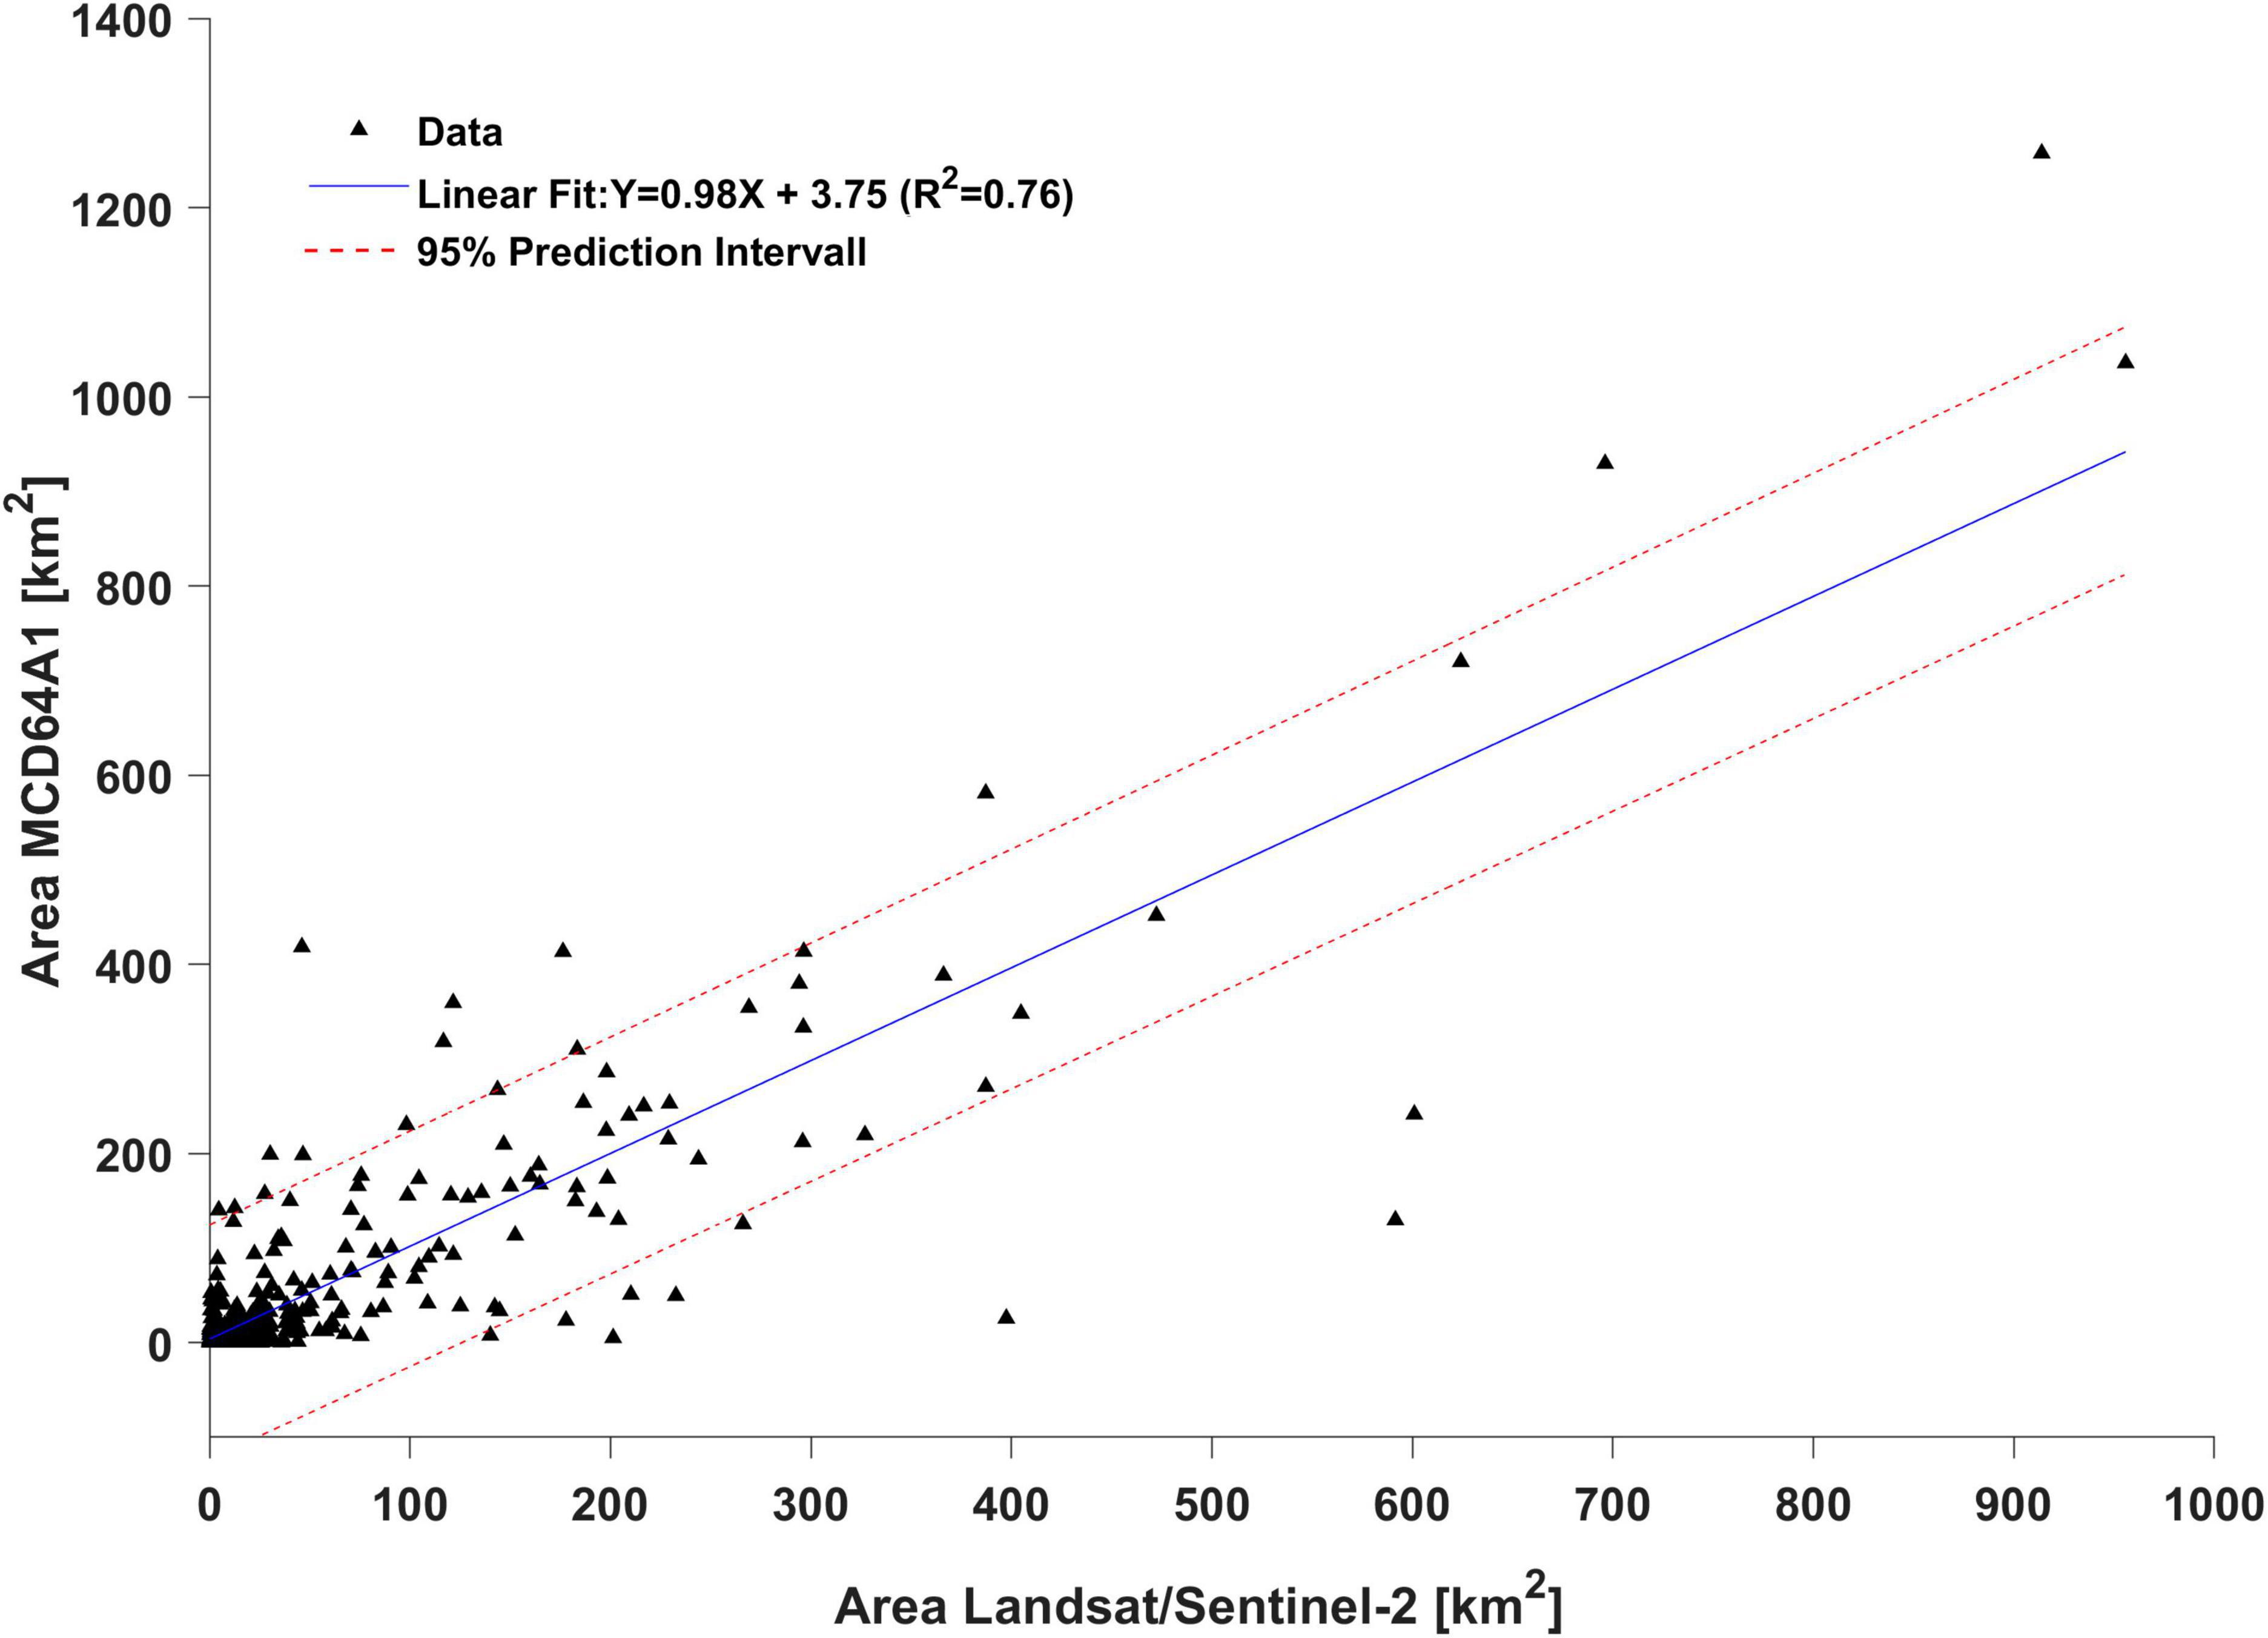
Figure 6. Comparison of monthly and annually accumulated burned peatland area of the MODIS MCD64A1 data for the 49 districts and the corresponding area values from high resolution satellite imagery, including the 95% prediction interval based on the regression model.
District-specific sums of burned areas smaller than 0.25 km2 (monthly or annual sums) were removed to account for the resolution limit of the MODIS data which cannot distinguish areas smaller than 0.25 km2.
The annual MODIS MCD64A1 burned area sums were then scaled using the slope and intercept of the linear regression function leading to a corrected burned area assessment over time (Figure 7). Using the regression equation, the burned area totals increased by 1.8% on average, compared to the original MDC64A1 data.
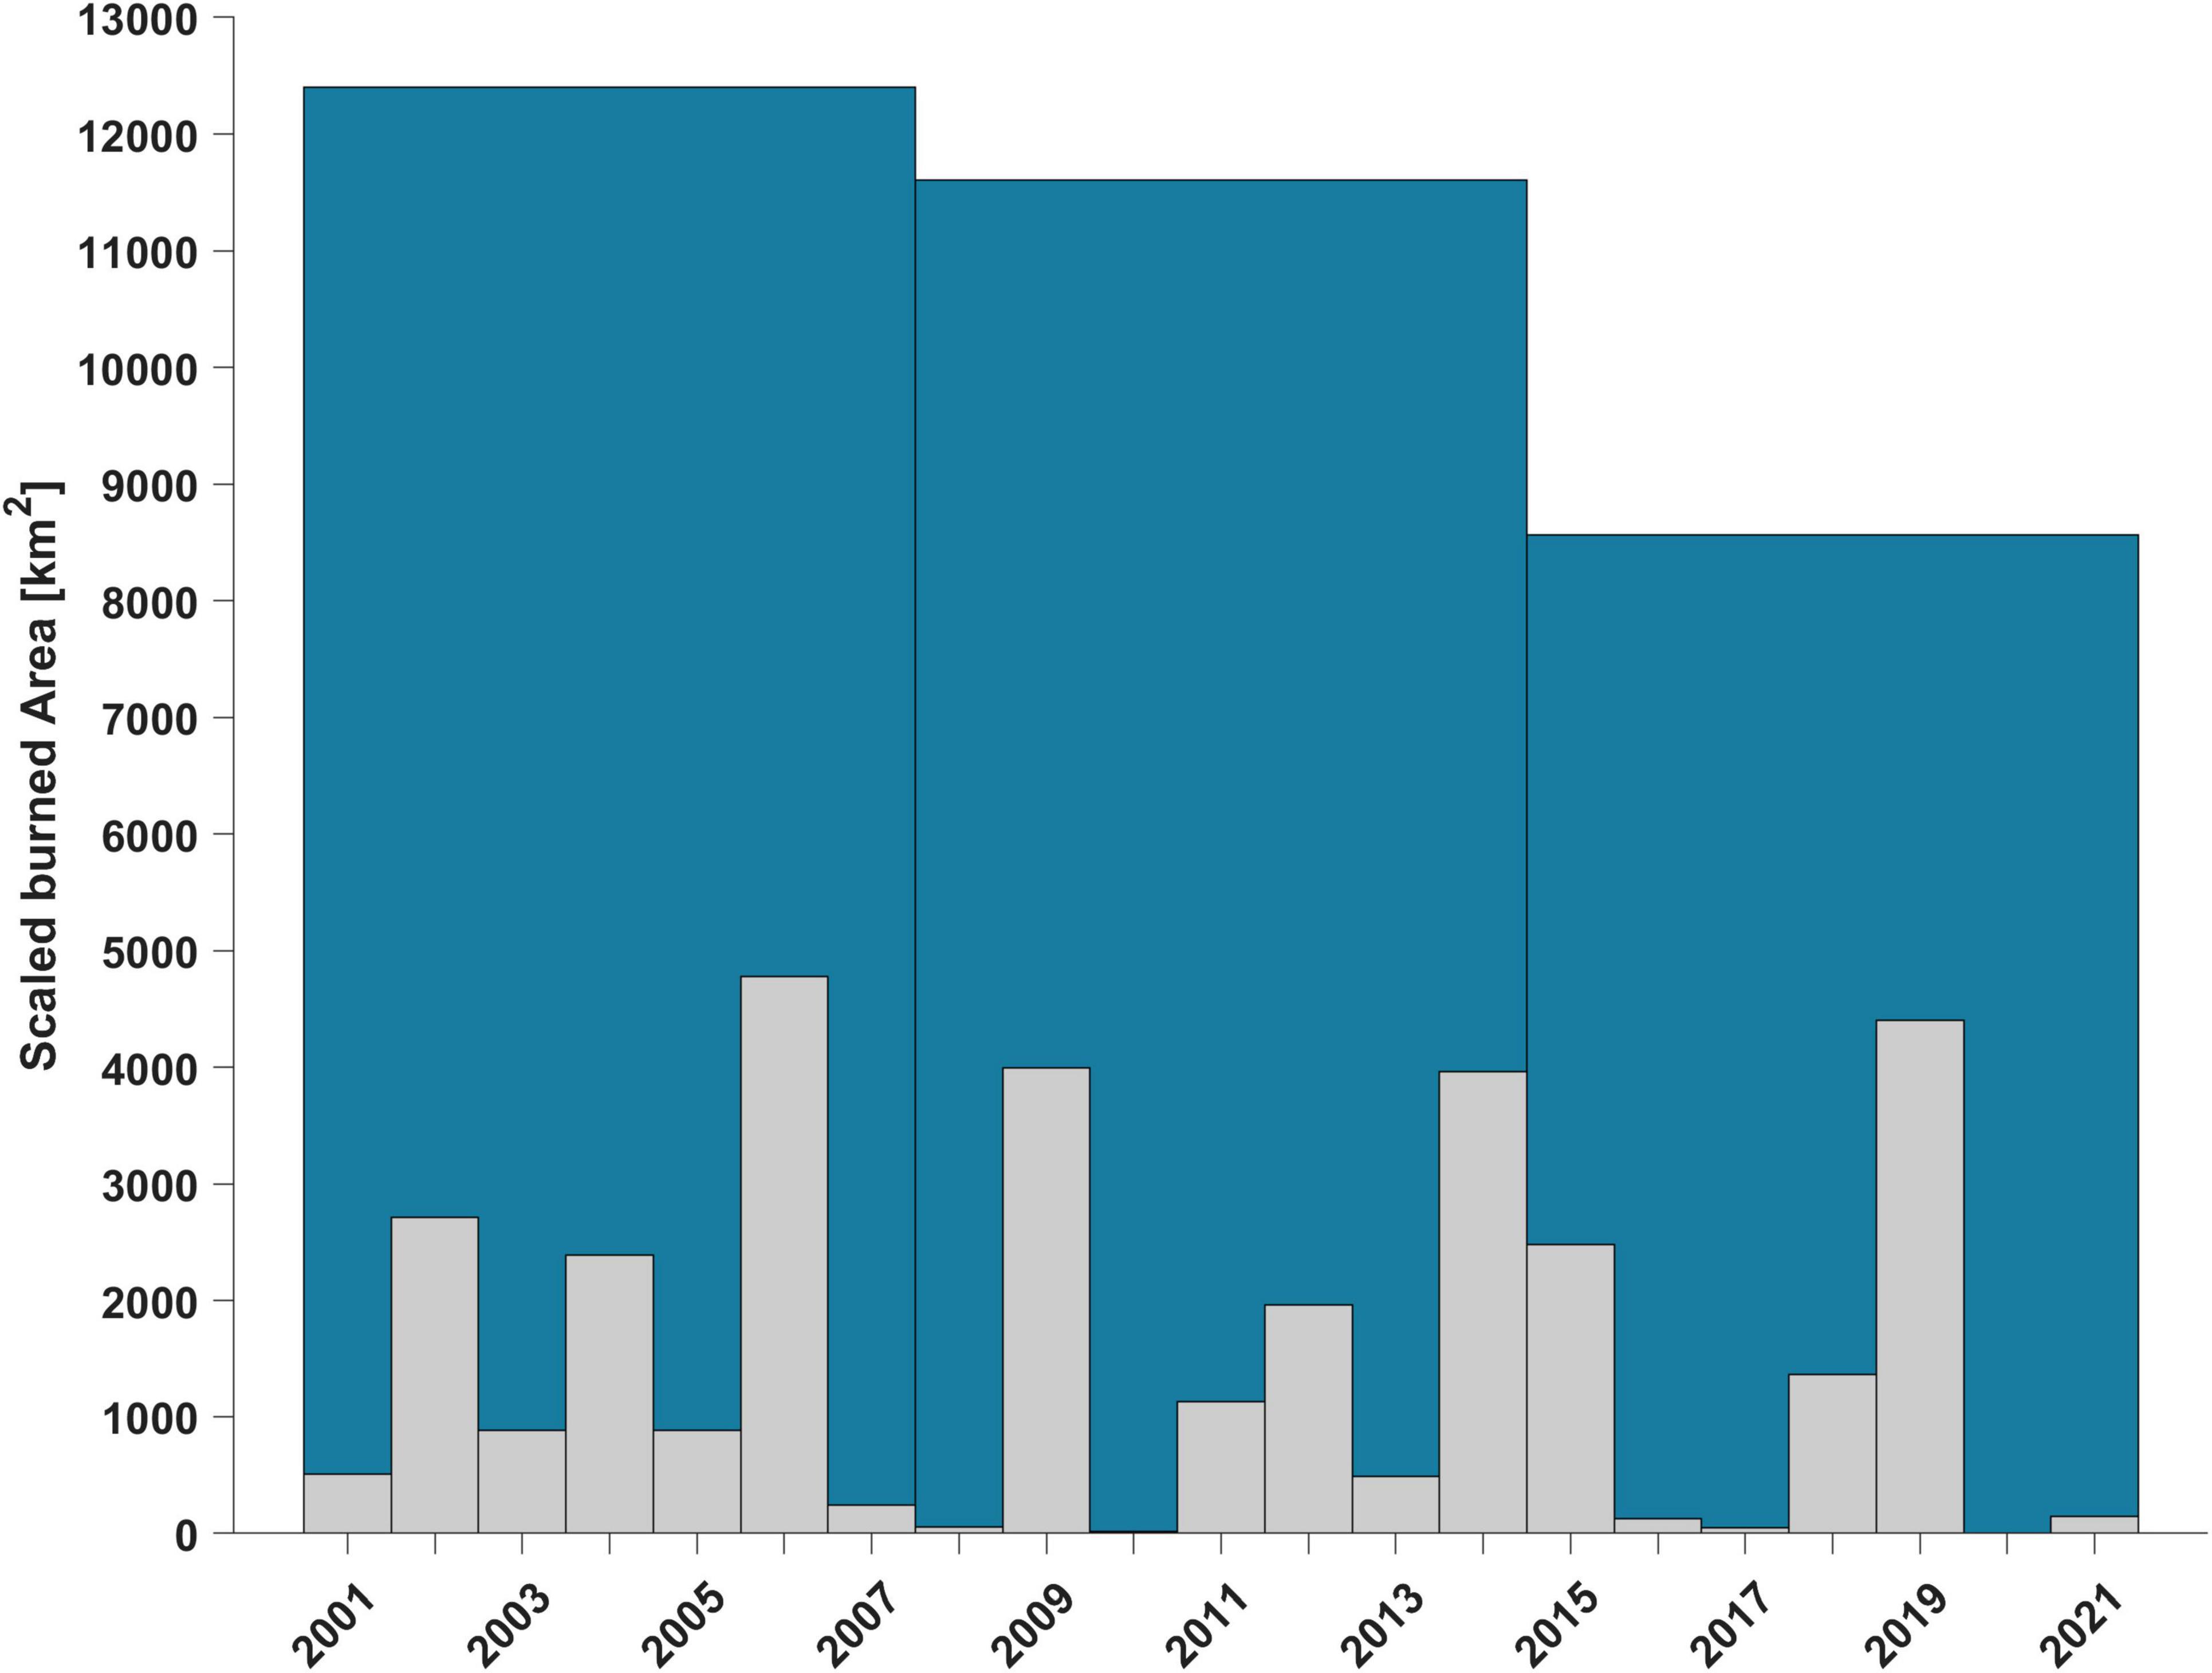
Figure 7. Corrected annual and 7-year accumulated burned area values integrated over all peatland areas of Kalimantan.
While the portion of high and very high severity burns increased over time (Figure 5), the total area burned decreased over time. The average corrected burned area between 2015 and 2021 was 31 and 26% lower than the previous 7-year averages from 2001 to 2007 and 2008 to 2014, respectively, (Figure 7). With respect to the burned area totals, the results agree with the finding that 12% of the areas in our study region were burned twice over the last two decades, with about 23% of the areas burned more than twice (Vetrita and Cochrane, 2020), dominated by smaller fires intentionally ignited for agricultural conversion.
The annual pattern of the amount of burned peatland area follows the patterns of the annual numbers of fires observed per year (Figures 3A, 6), with exception of the period from 2014 to 2015, where despite an increase of the total number of peatland fires in 2015 compared to the previous year (Figure 3A), the total peatland area burned as captured by the MCD14DL record, decreased in 2015 compared to 2014 (Figure 6).
Potential explanations for the temporal patterns in burn severity and number of fires or total area burned are combinations of climate factors and the effect of the regulatory framework. With the 7-year periods smoothing out the effects of single years, the 7-year patterns indicate that the climate factors, mostly driven by long-term and large-scale atmospheric circulations, led to increased burn severities. On the other hand, the burned area integrated over the 7-year sections was reduced due to restrictions on the clearing of peatland through burning as imposed by the legislature through changes in environmental laws over time, driven particularly by the 2015 fire season in Kalimantan with the highest number of peatland fires on record (Figure 2). In addition, the very low area of burned peatland during the year 2020 might also be caused at least in part by the COVID-19 pandemic that temporally limited agricultural activities in the region (Gregorioa and Ancog, 2020) in combination with the climatic effect of a triple La Niña series in Southeast Asia from 2020-2022 which caused persisting wet conditions that likely contributed to the decline in wildfires in 2021-2022, a phenomenon that had previously occurred from 1973-1975 and 1998-2001, respectively, (e.g., Tangang et al., 2017). The comparisons of the long-term patterns of peatland fire counts, SOI, and meteorological parameters that determine the fire regime confirm the strong effect of large-scale atmospheric circulations and regional meteorological conditions on peatland fire occurrences in Kalimantan over the last two decades.
3.4 Modeled fire intensity
The model results show that flame lengths were low under moderate moisture and low wind conditions but increased substantially in high wind and low fuel moisture scenarios (Figure 8A). Flame lengths were highest in dense early successional grasslands, reaching up to 21.5 m under high wind, low fuel moisture scenarios. Modeled surface flame lengths were higher in oil palm than in the forests that they replace, where low-hanging fronds and stringy bark readily ignite and contribute to the active flaming front (Figure 9), resulting in flame lengths ranging from 2.6 to 8.4 m. Lower flame lengths in forests and plantations were reflective of the lower statured shrubby vegetation that carried the surface fire. As plantations had very little vegetation under the tree canopy, there was sparse fuel to carry surface fire for any moisture or wind scenario.
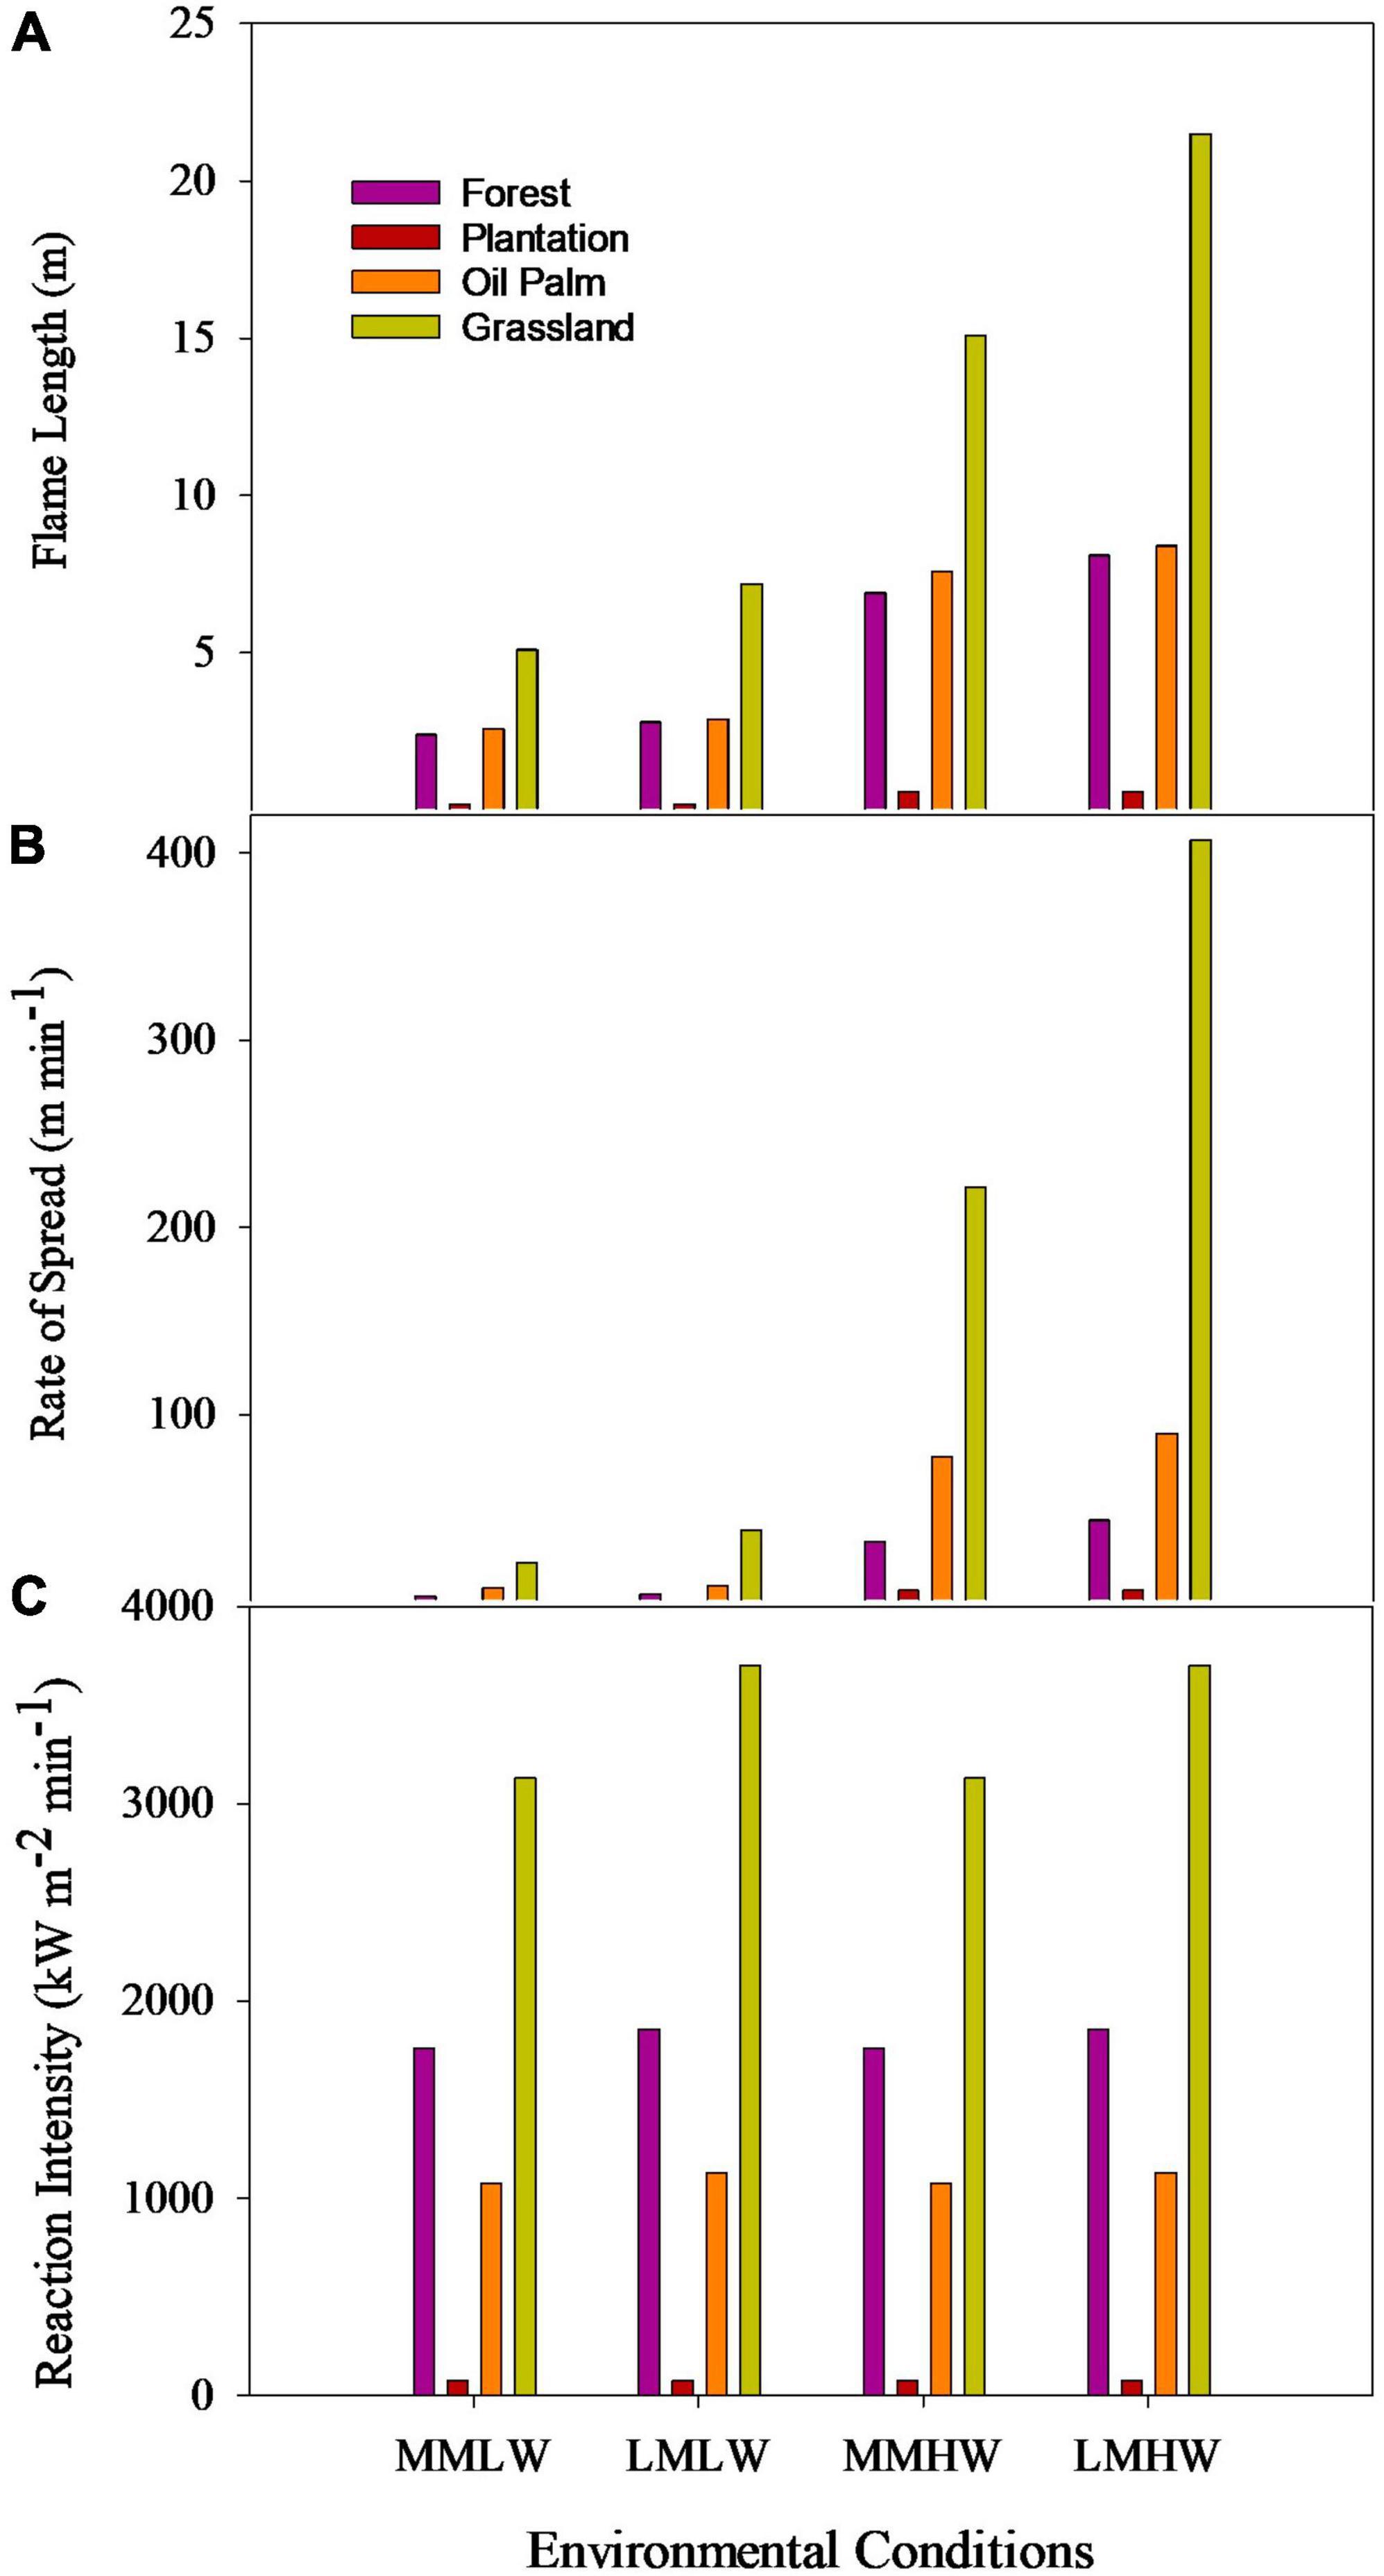
Figure 8. Surface rate of spread (A), flame length (B), and reaction intensity (C) by LULC type (forest, plantation, oil palm, and grassland) under modeled moderate fuel moisture and low wind (MMLW), low fuel moisture and low wind (LMLW), moderate fuel moisture and high wind (MMHW), and low fuel moisture and high wind (LMHW) environmental scenarios. Moderate moisture assumes the following fuel moistures: herbaceous, 60%; shrub, 90%; crown, 60%; 1-hr, 6%; 10-hr, 7%; 100-hr 8%. Low moisture assumes the following fuel moistures: herbaceous, 30%; shrub, 60%; crown, 60%; 1-hr, 6%; 10-hr, 7%; 100-hr 8%. Low wind assumption is windspeed 1.67 ms–1 and high windspeed is 8.89 ms–1. All model runs assume a slope of 0%.
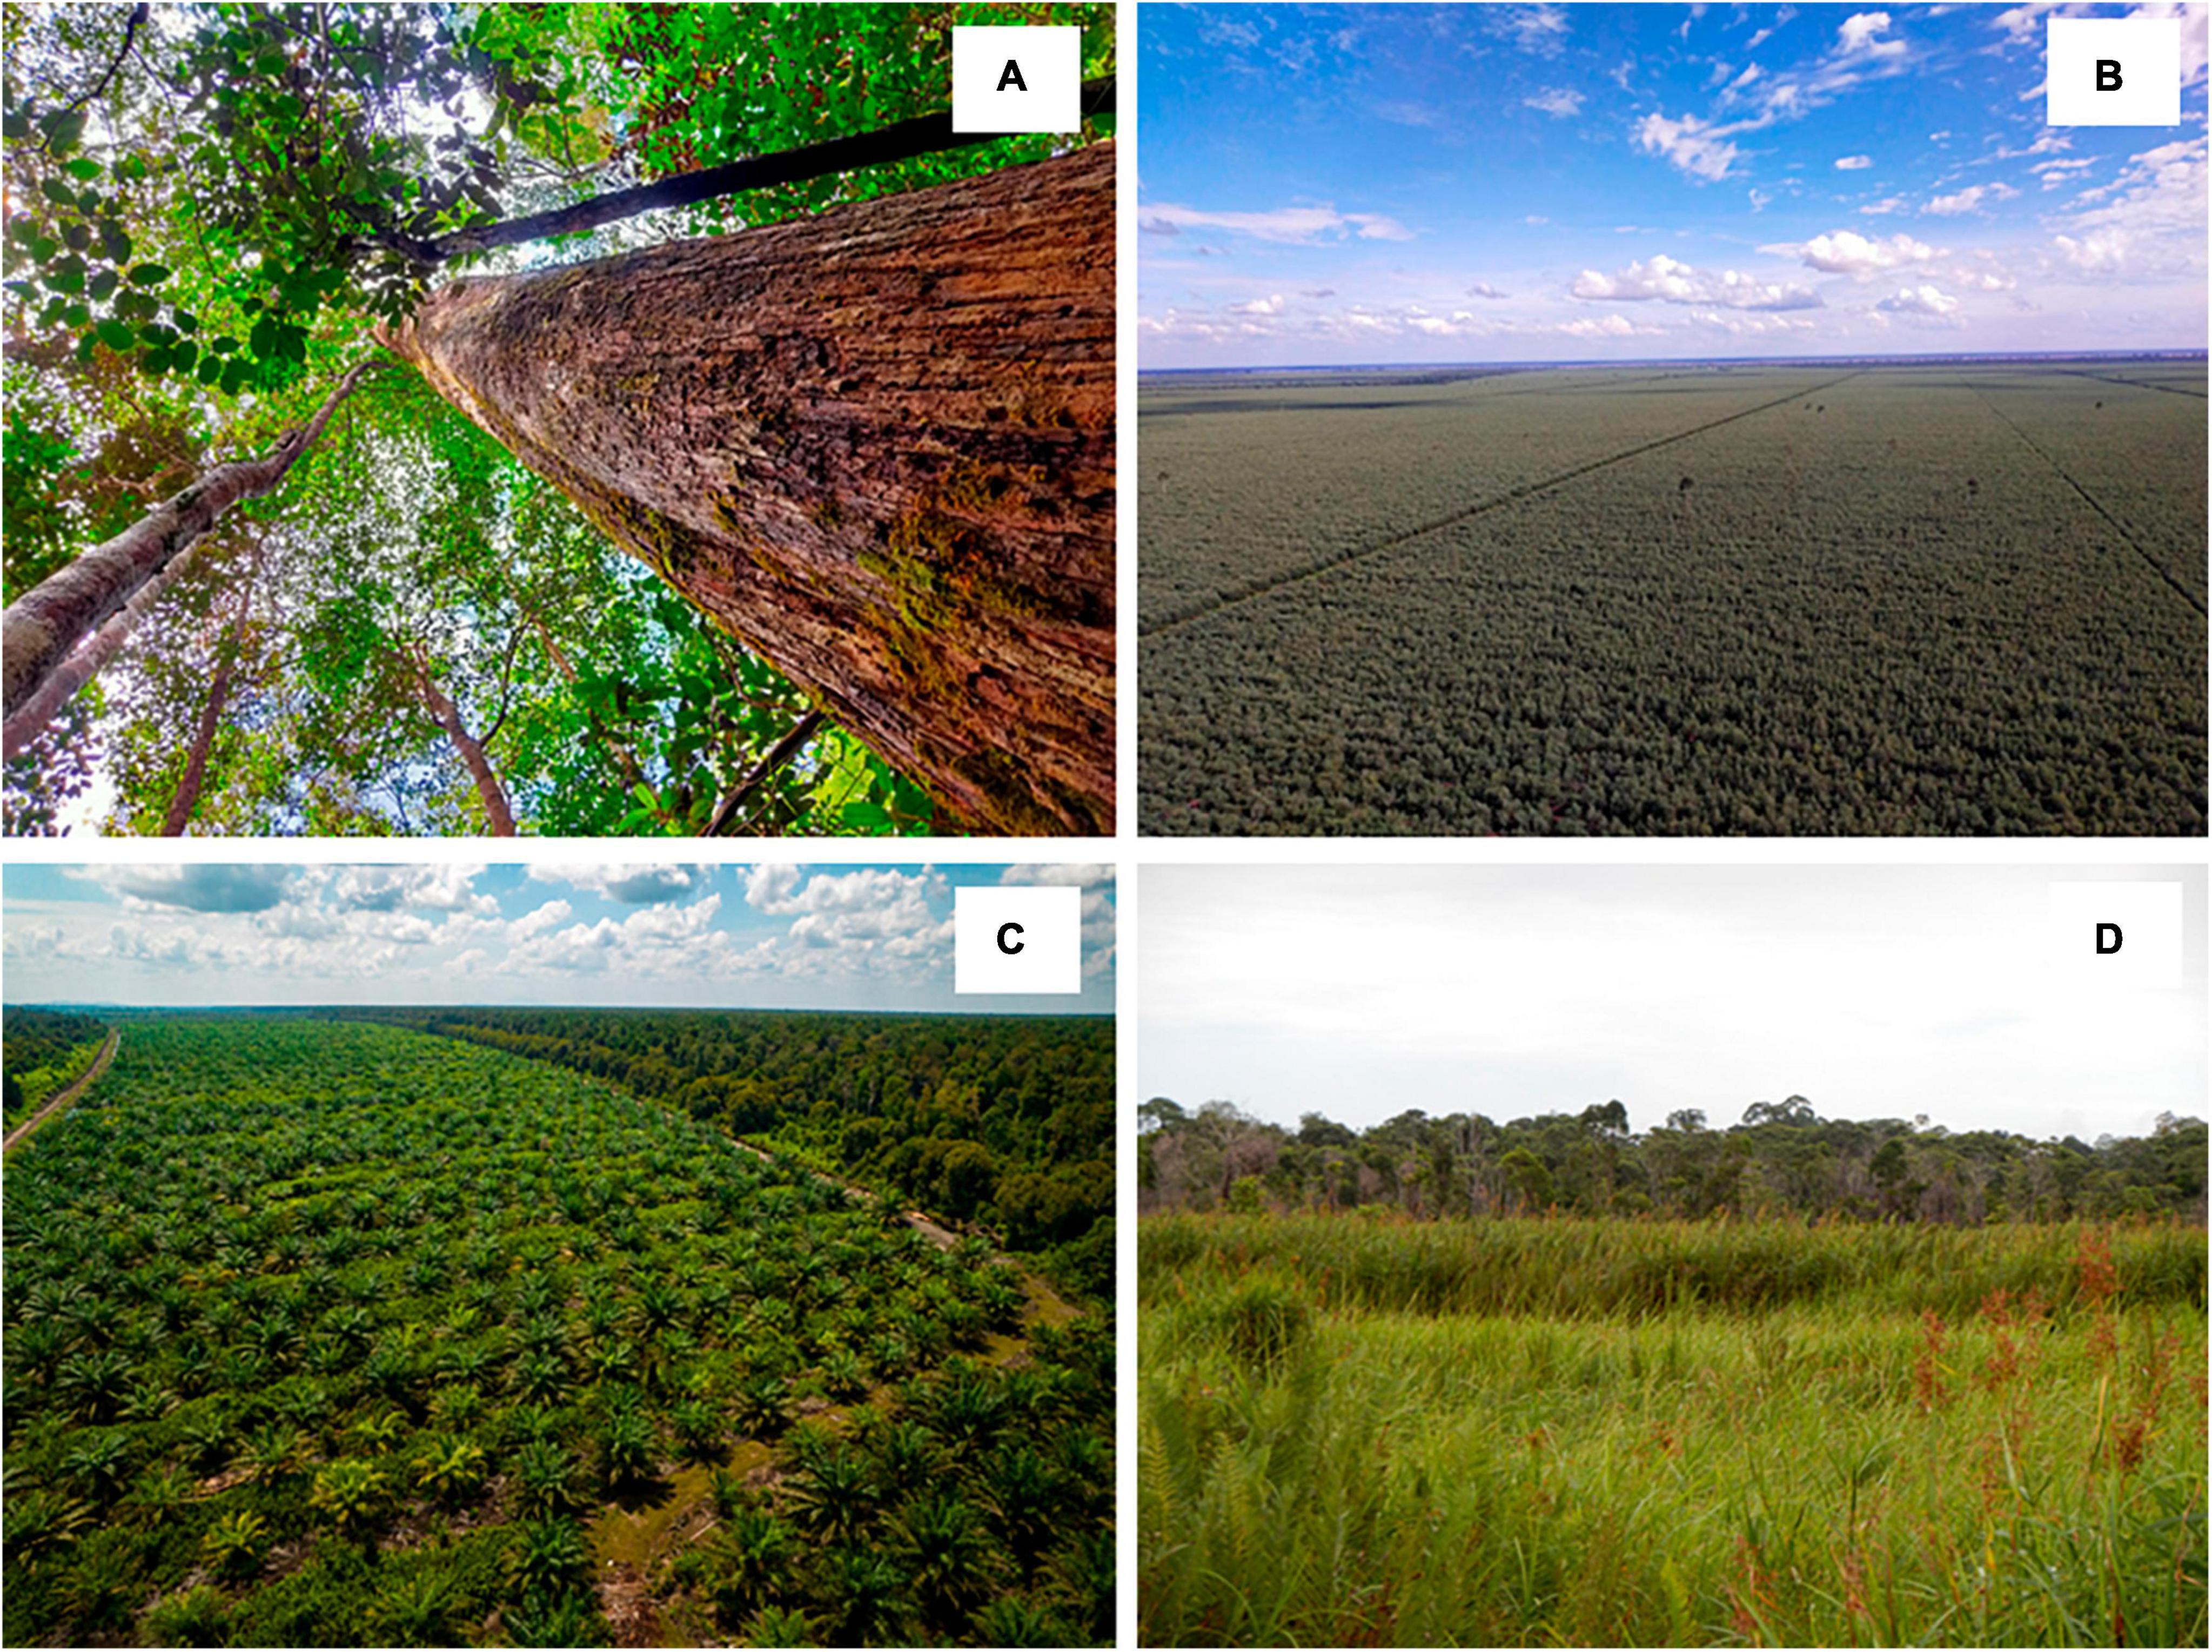
Figure 9. Photos of field sites (A) forest, (B) plantation, (C) oil palm, and (D) early successional grassland from which fuel models were developed and fire behavior interpreted in Kalimantan, Indonesia.
Oil palm (8.9 m min–1 at low wind and up to 89.8 m min–1 in high wind, low fuel moisture scenarios) and grasslands (38.3 m min–1 at low wind and 406.9 m min–1 in high wind, low moisture) had greatly increased rates of spread (Figure 8B), relative to the primary forests (4.3 m min–1 at low wind and 43.6 m min–1 in high wind, low moisture) that they replaced. In contrast, timber plantations, consisting primarily of Eucalyptus and Acacia species, had very low rates of modeled surface fire spread (1.1−6.1 m min–1), as there is little fuel under the tree canopies to carry surface fire. Fuel moisture was an important driver of rates of fire spread in all LULC categories except plantations, with modeled fires at low moisture scenarios 16−84% faster than fires at moderate moisture scenarios, with most pronounced differences in the highly flammable grassland LULC type.
Reaction intensity, a measure of the heat per unit area of the flaming front of a surface fire, is dependent on the density of flammable vegetation in each fuel type. Reaction intensities were highest in grassland LULC types, where dense litter accumulates under the live herbaceous vegetation (Figure 9). Dense forest vegetation, with a complex, layered vegetation structure, large, downed wood, and deep peat layers, also had high reaction intensities (Figure 8C). As plantations are a greatly simplified fuel arrangement, containing primarily merchantable timber species without a lot of natural understory vegetation, there was little surface fuel and greatly reduced reaction intensity. Oil palm fields were structurally simplified relative to forests, with less burnable material on the soil surface, and were intermediate in modeled reaction intensities.
Overall, the model results confirm the superimposed influence of meteorological conditions and indicate the significant effects of LULC on fire behavior by showing that simulated conversions greatly affect surface fire intensity metrics (rate of spread, flame length, and reaction intensity).
3.5 Timeline of the regulatory framework for peatland fires
The results show that climate conditions had a strong effect on the number of peatland fires in Kalimantan during the last two decades. Due to the strong correlations between driving climatological and meteorological conditions, superimposed effects of regulatory restrictions that restrict the burning of natural peatland for agricultural purposes are inherently difficult to quantify.
Due to intense fire seasons and associated effects on the environment and public health (e.g., Kiely et al., 2021; Hein et al., 2022), the laws pertaining to the protection of natural peatlands including burn restrictions in Kalimantan changed over time. Following the wildfire season of 1997−1998 when 1,10,000 km2 of peatland were burned in Indonesia, and in recognition of the increased risk of wildfire in a warming climate, the Government of Indonesia established the Directorate of Forest Fire Control (renamed in 2016 to Directorate of Land and Forest Fire Management) under the Ministry of Forestry in 2000.
Current policies on forest and fire management consist of three main activities, fire prevention, suppression, and post-fire recovery. Under these regulations, people are forbidden by law to intentionally burn large areas of land for clearing or agriculture, though there are at times exceptions and inconsistencies between central and provincial regulations.
In 2006, the Indonesian government allowed burning under certain conditions for farmers in Central Kalimantan, but larger scale ignitions of peatland for land clearing remained prohibited for large oil palm plantations in this region. The reduction of burns after 2006 as well as the tempering of the restrictions in 2008, can clearly be tracked in the burn frequency numbers derived from MODIS hotspot observations across Kalimantan (Figure 3A).
After the extreme fire season of 2015, the government reinstated a complete restriction of prescribed peatland fires for the gain of agricultural land. There has been slow progress in reducing anthropogenic forest and land fire occurrence in Indonesia in the last two decades (Purnomo et al., 2017). Currently, the Government of Indonesia focuses on fire prevention rather than suppression, using integrated fire prevention patrol, land clearing without burning practices, improving community livelihood, or canal blocking and forest restoration in degraded peatlands, and improving fire early warning system such as SPARTAN (Sistem Peringatan Kebakaran Hutan dan Lahan). The Indonesian government also established the Peatland Restoration Agency (Badan Restorasi Gambut, BRG) in January 2016 and stipulated a permanent peatland and primary forest conversion moratorium for business permits in August 2019 to address land and fire issues and strengthen Indonesia’s commitment to slowing deforestation on peatlands. Later in 2020, BRG was transformed into the Mangrove and Peatland Restoration Agency (Badan Restorasi Gambut dan Mangrove-BRGM) with the purpose of restoring 1.2 million ha of peatlands and 600 thousand ha of mangrove across 13 provinces.
Furthermore, Law No 32/2009, concerning Environmental Protection and Management particularly in Article 69, prohibits clearing of land by burning for every entity. However, as an exception, small, prescribed fires (maximum 2 ha) are allowed in peatland vegetation and categorized as local wisdom practices, as local understanding uses controlled burning to reduce the risk of large wildfires fires fire weather with strong or gusty winds and dry fuel conditions.
4 Conclusion
We examined long-term patterns of frequencies, and severities of peatland fires in Kalimantan using medium-resolution and high-resolution satellite imagery over a period of 21 years. Moreover, fire intensity parameters were modeled with regard to conversion from forest to agricultural land uses as has been done for decades in the study region of Kalimantan, Indonesia.
Variations in the number of fires and burn severity are visible over time and are caused by a combination of large-scale meteorological patterns and changing regulations. Our results confirm a strong spatiotemporal correlation between climatological drivers and corresponding peatland fire frequency and burned area, based on noticeable concurrences with spatially and temporally well-defined El Niño-related meteorological extremes. Steep increases of the number of peatland fires were found to be tightly connected to increased air temperature values and reduced precipitation in our study region over the 21-year study period from the beginning of 2001 through the end of 2021.
The results further show a steady, regionally comprehensive increase of burn severity of peatland fires in Kalimantan by 12.8% on average for the latest period from 2015 through 2021 compared to earlier periods of the same length, whereas the total peatland area burned decreased between 2015 and 2021 by 28.7% on average compared to the previous 7-year periods. Our fire model results show an increased fire intensity (elevated flame lengths and rates of spread) for grassland and oil-palm plantations compared to forest stands prior to the LULC conversion. Thus, beyond the release of large amounts of carbon stored above ground and below ground in peatland and the loss of unique tropical ecosystems when peatland is converted to arable land, the decreased fire resilience of degraded peatland and increased proneness to fire of converted areas exacerbates the impacts of a changing climate in this region with increasingly extreme conditions during recurring El Niño periods with higher temperatures and low amounts of precipitation.
As the national Indonesian government holds the highest role as regulator but has little oversight for enforcement, it will be critical for local government to support and uphold policy.
Hence, recommendations for better peatland fire management are (1) more focus on fire prevention activities, (2) alignment and harmonization of government regulations at the national and regional levels, (3) improve availability and accessibility of sufficient funding for pre-fire mitigation, suppression, and post-fire recovery efforts on regional and local scales. Our results show that LULC, regulatory frameworks, and meteorological conditions often driven by larger scale climate patterns all affect the frequency and severity of peatland fires across scales. The ongoing alteration of burn frequencies and severities shown in this study needs to be reassessed frequently while considering ongoing LULC, evolving adaptations of regulations, and a changing climate. Therefore, future studies need to use comprehensive approaches that incorporate the physical aspects of overarching climate conditions as well as political and regulatory frameworks to assess negative effects of burning tropical peatlands. Ultimately, research results can support decision making that leads to a further reduction of tropical peatland burning in Kalimantan.
Data availability statement
Publicly available datasets were analyzed in this study. This data can be found here: https://www.ecmwf.int/.
Author contributions
AS: remote sensing analyses, climate data analyses, and writing and editing of manuscript. LE: fire modeling and writing and editing of manuscript. GB: support of fire modeling. NN: writing and editing of manuscript and analyses of political framework data. AM, AG, and AD: writing and editing of manuscript. IA: writing and editing of manuscript and political framework analyses. RP: GIS data preparation and editing of manuscript. AA: editing of manuscript. JK: support of fire modeling and editing of manuscript. All authors contributed to the article and approved the submitted version.
Acknowledgments
We would like to thank the European Centre for Medium-Range Weather Forecasts, the European Space Agency, the National Aeronautics and Space Administration, and the United States Geological Survey for providing essential research products and making the data accessible for the scientific community through their public data repositories. This research was funded through the Bezos Earth Fund under The Nature Conservancy’s Applied Science to Catalyze Natural Climate Solutions project.
Conflict of interest
The authors declare that the research was conducted in the absence of any commercial or financial relationships that could be construed as a potential conflict of interest.
Publisher’s note
All claims expressed in this article are solely those of the authors and do not necessarily represent those of their affiliated organizations, or those of the publisher, the editors and the reviewers. Any product that may be evaluated in this article, or claim that may be made by its manufacturer, is not guaranteed or endorsed by the publisher.
Supplementary material
The Supplementary Material for this article can be found online at: https://www.frontiersin.org/articles/10.3389/ffgc.2024.1221797/full#supplementary-material
References
Ager, A., Vaillant, N., and Finney, M. (2011). Integrating fire behavior models and geospatial analysis for wildland fire risk assessment and fuel management planning. J. Combust. 2011:572452. doi: 10.1155/2011/572452
Albar, I., Jaya, I., Saharjo, B., Kuncahyo, B., and Vadrevu, K. (2018). “Spatio-temporal analysis of land and forest fires in Indonesia using MODIS active fire dataset,” in Land-atmospheric research applications in south and Southeast Asia, eds K. Vadrevu, T. Ohara, and C. Justice (Cham: Springer). doi: 10.1007/978-3-319-67474-2_6
Alsepan, G., and Minobe, S. (2020). Relations between interannual variability of regional-scale Indonesian precipitation and large-scale climate modes during 1960-2007. J. Clim. 33, 5271–5291. doi: 10.1175/JCLI-D-19-0811.1
Anda, M., Ritung, S., Suryani, E., Sukarman, Hikmat, M., Yatno, E., et al. (2021). Revisiting tropical peatlands in Indonesia: Semi-detailed mapping, extent and depth distribution assessment. Geoderma 402:115235. doi: 10.1016/j.geoderma.2021.115235
Basuki, I. (2017). Carbon dynamics in response to land cover change in tropical Peatlands, Kalimantan, Indonesia. Corvallis, OR: Oregon State University.
Boschetti, L., Roy, D., Giglio, L., Huang, H., Zubkova, M., and Humber, M. (2019). Global validation of the collection 6 MODIS burned area product. Remote Sens. Environ. 235:111490. doi: 10.1016/j.rse.2019.111490
Brewer, C., Winne, J., Redmond, R., Opitz, D., and Mangrich, M. (2005). Classifying and mapping wildfire severity: A comparison of methods. Photogramm. Eng. Remote Sens. 71, 1311–1320.
Brose, P., and Wade, D. (2002). Potential fire behavior in pine flatwood forests following three different fuel reduction techniques. For. Ecol. Manag. 163, 71–84. doi: 10.1016/S0378-1127(01)00528-X
Byram, G. (1959). “Combustion of forest fuels,” in Forest fire control and use, 2nd Edn, eds A. A. Brown and K. P. Davis (New York, NY: McGraw-Hill), 686.
Chander, G., and Markham, B. (2003). Revised landsat-5 TM radiometric calibration procedures and postcalibration dynamic ranges. IEEE Trans. Geosci. Remote Sens. 41, 2674–2677. doi: 10.1109/TGRS.2003.818464
Chen, C., Lin, H., Yu, J., and Lo, M. (2016). The 2015 Borneo fires: What have we learned from the 1997 and 2006 El Niños? Environ. Res. Lett. 11:104003. doi: 10.1088/1748-9326/11/10/104003
Claverie, M., Ju, J., Masek, J., Dungan, J., Vermote, E., Roger, J., et al. (2018). The Harmonized landsat and sentinel-2 surface reflectance data set. Remote Sens. Environ. 219, 145–161. doi: 10.1016/j.rse.2018.09.002
Cocke, A., Fulé, P., and Crouse, J. (2005). Comparison of burn severity assessments using differenced normalized burn ratio and ground data. Int. J. Wildland Fire 14, 189–198. doi: 10.1071/WF04010
Davies, G., Domènech, R., Gray, A., and Johnson, P. (2016). Vegetation structure and fire weather influence variation in burn severity and fuel consumption during peatland wildfires. Biogeosciences 13, 389–398. doi: 10.5194/bg-13-389-2016
Edwards, R., Naylor, R., Higgins, M., and Falcon, W. (2020). Causes of Indonesia’s forest fires. World Dev. 127:104717. doi: 10.1016/j.worlddev.2019.104717
Evans, E., Ellsworth, L., and Litton, C. (2015). Impact of grazing on fine fuels and potential wildfire behaviour in a non-native tropical grassland. Pac. Conserv. Biol. 21, 126–132. doi: 10.1071/PC14910
Gascon, F., Cadau, E., Colin, O., Hoersch, B., Isola, C., Fernández, B., et al. (2014). Copernicus sentinel-2 mission: Products, algorithms and Cal/Val. Earth Observ. Syst. 9218:92181E. doi: 10.1117/12.2062260
Gaveau, D., Descals, A., Salim, M., Sheil, D., and Sloan, S. (2021). Refined burned-area mapping protocol using sentinel-2 data increases estimate of 2019 Indonesian burning. Earth Syst. Sci. Data 13, 5353–5368. doi: 10.5194/essd-13-5353-2021
Giglio, L., Boschetti, L., Roy, D., Humber, M., and Justice, C. (2018). The collection 6 MODIS burned area mapping algorithm and product. Remote Sens. Environ. 217, 72–85. doi: 10.1016/j.rse.2018.08.005
Giglio, L., Schroeder, W., and Justice, C. (2016). The collection 6 MODIS active fire detection algorithm and fire products. Remote Sens. Environ. 178, 31–41. doi: 10.1016/j.rse.2016.02.054
Goldstein, J., Graham, L., Ansori, S., Vetrita, Y., Thomas, A., Applegate, G., et al. (2020). Beyond slash-and-burn: The roles of human activities, altered hydrology and fuels in peat fires in Central Kalimantan, Indonesia. Singap. J. Trop. Geogr. 41, 190–208. doi: 10.1111/sjtg.12319
Gregorioa, G., and Ancog, R. (2020). Assessing the impact of the COVID-19 pandemic on agricultural production in Southeast Asia: Toward transformative change in agricultural food systems. Asian J. Agric. Dev. 17, 1–13. doi: 10.22004/ag.econ.30378
Hantson, S., Scheffer, M., Pueyo, S., Xu, C., Lasslop, G., van Nes, E., et al. (2017). Rare, intense, big fires dominate the global tropics under drier conditions. Sci. Rep. 7:14374. doi: 10.1038/s41598-017-14654-9
Hein, L., Spadaro, J., Ostro, B., Hammer, M., Sumarga, E., Salmayenti, R., et al. (2022). The health impacts of Indonesian Peatland fires. Environ. Health 21:62. doi: 10.1186/s12940-022-00872-w
Heinsch, F., and Andrews, P. (2010). BehavePlus fire modeling system, version 5.0: Design and features. Fort Collins, CO: U.S. Department of Agriculture, Forest Service, Rocky Mountain Research Station, 111.
Heymann, J., Reuter, M., Buchwitz, M., Schneising, O., Bovensmann, H., Burrows, J., et al. (2017). CO2 emission of Indonesian fires in 2015 estimated from satellite-derived atmospheric CO2 concentrations. Geophys. Res. Lett. 44, 1537–1544. doi: 10.1002/2016GL072042
Hoscilo, A., Tansey, K., and Page, S. (2013). Post-fire vegetation response as a proxy to quantify the magnitude of burn severity in tropical peatland. Int. J. Remote Sens. 34, 412–433. doi: 10.1080/01431161.2012.709328
Indonesia Ministry of Environment and Forestry [MoEF] (2020). Annual land cover map from 2009-2019. Jakarta: Indonesia Ministry of Environment and Forestry [MoEF].
Irons, J., Dwyer, J., and Barsi, J. (2012). The next landsat satellite: The landsat data continuity mission. Remote Sens. Environ. 122, 11–21. doi: 10.1016/j.rse.2011.08.026
Johnston, J., Olszewski, J., Miller, B., Schmidt, M., Vernon, M., and Ellsworth, L. (2021). Mechanical thinning without prescribed fire moderates wildfire behavior in an Eastern Oregon, USA ponderosa pine forest. For. Ecol. Manag. 501:119674. doi: 10.1016/j.foreco.2021.119674
Keeley, J. (2009). Fire intensity, fire severity and burn severity: A brief review and suggested usage. Int. J. Wildland Fire 18, 116–126. doi: 10.1071/WF07049
Kiely, L., Spracklen, D., Arnold, S., Papargyropoulou, E., Conibear, L., Wiedinmyer, C., et al. (2021). Assessing costs of Indonesian fires and the benefits of restoring Peatland. Nat. Commun. 12:7044. doi: 10.1038/s41467-021-27353-x
Lamquin, N., Woolliams, E., Bruniquel, V., Gascon, F., Gorroño, J., Govaerts, Y., et al. (2019). An inter-comparison exercise of Sentinel-2 radiometric validations assessed by independent expert groups. Remote Sens. Environ. 233:111369. doi: 10.1016/j.rse.2019.111369
Lasslop, G., Coppola, A., Voulgarakis, A., Yue, C., and Veraverbeke, S. (2019). Influence of fire on the carbon cycle and climate. Curr. Clim. Chang. Rep. 5, 112–123. doi: 10.1007/s40641-019-00128-9
Law, E., Bryan, B., Meijaard, E., Mallawaarachchi, T., Struebig, M., and Wilson, K. (2015). Ecosystem services from a degraded peatland of Central Kalimantan: Implications for policy, planning, and management. Ecol. Appl. 25, 70–87. doi: 10.1890/13-2014.1
Liu, Q., Fu, B., Chen, Z., Chen, L., Liu, L., Peng, W., et al. (2022). Evaluating effects of post-fire climate and burn severity on the early-term regeneration of forest and shrub communities in the san Gabriel mountains of California from sentinel-2(MSI) images. Forests 13:1060. doi: 10.3390/f13071060
Marlier, M., DeFries, R., Kim, P., Koplitz, S., Jacob, D., Mickley, L., et al. (2015). Fire emissions and regional air quality impacts from fires in oil palm, timber, and logging concessions in Indonesia. Environ. Res. Lett. 10:085005. doi: 10.1088/1748-9326/10/8/085005
Micijevic, E., Haque, O., Barsi, J., Anderson, C., Markham, B., and Rengarajan, R. (2020). Landsat collection 2 radiometric calibration updates. Earth Observ. Syst. XXV:115010. doi: 10.1117/12.2570026
Miettinen, J., Shi, C., and Liew, S. (2012). Two decades of destruction in Southeast Asia’s peat swamp forests. Front. Ecol. Environ. 10:124–128. doi: 10.1890/100236
Miettinen, J., Shi, C., and Liew, S. (2016). Land cover distribution in the Peatlands of Peninsular Malaysia, Sumatra and Borneo in 2015 with changes since 1990. Glob. Ecol. Conserv. 6, 67–78. doi: 10.1016/j.gecco.2016.02.004
Miettinen, J., Shi, C., and Liew, S. (2017). Fire distribution in Peninsular Malaysia, Sumatra and Borneo in 2015 with special emphasis on Peatland fires. Environ. Manag. 60, 747–757. doi: 10.1007/s00267-017-0911-7
Miller, J., and Yool, S. (2002). Mapping forest post-fire canopy consumption in several overstory types using multi-temporal landsat TM and ETM data. Remote Sens. Environ. 82, 481–496. doi: 10.1016/S0034-4257(02)00071-8
Muñoz-Sabater, J. (2019). ERA5-land monthly averaged data from 1981 to present, Copernicus climate change service (C3S) climate data store (CDS). doi: 10.24381/cds.68d2bb30
Muñoz-Sabater, J., Dutra, E., Agustí-Panareda, A., Albergel, C., Arduini, G., Balsamo, G., et al. (2021). ERA5-Land: A state-of-the-art global reanalysis dataset for land applications. Earth Syst. Sci. Data 13, 4349–4383. doi: 10.5194/essd-13-4349-2021
Novita, N. (2016). Carbon stocks and soil greenhouse gas emissions associated with forest conversion to oil palm plantations in Tanjung Puting tropical Peatlands, Indonesia. Corvallis, OR: Oregon State University.
Novita, N., Kauffman, J., Hergoualc’h, K., Murdiyarso, D., Tryanto, D., and Jupesta, J. (2021). “Carbon stocks from peat swamp forest and oil palm plantation in central Kalimantan, Indonesia,” in Climate change research, policy and actions in Indonesia, eds R. Djalante, J. Jupesta, and E. Aldrian (Cham: Springer). doi: 10.1007/978-3-030-55536-8_10
Nurhayati, A., Saharjo, B., Sundawati, L., Syartinilia, and Cochrane, M. (2021). Forest and Peatland fire dynamics in south Sumatra province. For. Soc. 5, 591–603. doi: 10.24259/fs.v5i2.14435
Osaki, M., Setiadi, B., Takahashi, H., and Evri, M. (2016). “Peatland in Kalimantan,” in Tropical Peatland ecosystems, eds M. Osaki and N. Tsuji (Tokyo: Springer). doi: 10.1007/978-4-431-55681-7_6
Page, S., Rieley, J., and Banks, C. (2011). Global and regional importance of the tropical peatland carbon pool. Glob. Chang. Biol. 17, 798–818. doi: 10.1111/j.1365-2486.2010.02279.x
Parks, S., Holsinger, L., Voss, M., Loehman, R., and Robinson, N. (2018). Mean composite fire severity metrics computed with Google earth engine offer improved accuracy and expanded mapping potential. Remote Sens. 10:879. doi: 10.3390/rs10060879
Parsons, R., Pimont, F., Wells, L., Cohn, G., Jolly, W., de Coligny, F., et al. (2018). Modeling thinning effects on fire behavior with STANDFIRE. Ann. For. Sci. 75, 1–10. doi: 10.1007/s13595-017-0686-2
Pinto, C., Cibele Jing, X., and Leigh, L. (2020). evaluation analysis of landsat level-1 and level-2 data products using in situ measurements. Remote Sens. 12:2597. doi: 10.3390/rs12162597
Prichard, S., Sandberg, D., Ottmar, R., Eberhardt, E., Andreu, A., Eagle, P., et al. (2013). Fuel characteristic classification system version 3.0: Technical documentation. Portland, OR: U.S. Department of Agriculture, Forest Service, 79. doi: 10.2737/PNW-GTR-887
Purnomo, H., Shantiko, B., Sitorus, S., Gunawan, H., Achdiawan, R., Kartodihardjo, H., et al. (2017). Fire economy and actor network of forest and land fires in Indonesia. For. Policy Econ. 78, 21–31. doi: 10.1016/j.forpol.2017.01.001
Quintano, C., Fernández-Manso, A., and Fernández-Manso, O. (2018). Combination of Landsat and Sentinel-2 MSI data for initial assessing of burn severity. Int. J. Appl. Earth Observ. Geoinf. 64, 221–225. doi: 10.1016/j.jag.2017.09.014
Ramdani, F., and Hino, M. (2013). Land use changes and GHG emissions from tropical forest conversion by oil palm plantations in Riau Province, Indonesia. PLoS One 8:e70323. doi: 10.1371/journal.pone.0070323
Reuter, D., Irons, J., Lunsford, A., Montanaro, M., Pellerano, F., Richardson, C., et al. (2011). The operational land imager (OLI) and the thermal infrared sensor (TIRS) on the landsat data continuity mission (LDCM). Proc. SPIE XVII:804812. doi: 10.1117/12.885963
Reuter, D., Richardson, C., Pellerano, F., Irons, J., Allen, R., Anderson, M., et al. (2015). The thermal infrared sensor (TIRS) on landsat 8: Design overview and pre-launch characterization. Remote Sens. 7, 1135–1153. doi: 10.3390/rs70101135
Ribeiro, K., Pacheco, F. S., Ferreira, J. W., Sousa-Neto, E. R., Hastie, A., Filho, G. K., et al. (2021). Tropical peatlands and their contribution to the global carbon cycle and climate change. Glob. Chang. Biol. 27, 489–505. doi: 10.1111/gcb.15408
Rothermel, R. (1972). A mathematical model for predicting fire spread in wildland fuels. Ogden, UT: U.S Department of Agriculture, Forest Service, 40.
Roy, D., Huang, H., Boschetti, L., Giglio, L., Yan, L., Zhang, H., et al. (2019). Landsat-8 and Sentinel-2 burned area mapping – A combined sensor multitemporal change detection approach. Remote Sens. Environ. 231:111254. doi: 10.1016/j.rse.2019.111254
Sabani, W., Rahmadewi, D., Rahmi, K., Priyatna, M., and Kurniawan, E. (2019). Utilization of MODIS data to analyze the forest/land fires frequency and distribution (case study: Central Kalimantan province). IOP Conf. Ser. Earth Environ. Sci. 243:012032. doi: 10.1088/1755-1315/243/1/012032
Sandberg, D., Riccardi, C., and Schaaf, M. (2008). Reformulation of Rothermel’s wildland fire behavior model for heterogeneous fuelbeds. Can. J. For. Res. 37, 2438–2455. doi: 10.1139/X07-094
Schmidt, A., Leavell, D., Punches, J., Rocha Ibarra, M., Kagan, J., Creutzburg, M., et al. (2022). A quantitative wildfire risk assessment using a modular approach of geostatistical clustering and regionally distinct valuations of assets–A case study in Oregon. PLoS One 17:e0264826. doi: 10.1371/journal.pone.0264826
Scott, J., and Burgan, R. (2005). Standard fire behavior fuel models: a comprehensive set for use with Rothermel’s surface fire spread model. Fort Collins, CO: U.S. Department of Agriculture, Forest Service, Rocky Mountain Research Station, 72.
Silvianingsih, Y., Hairiah, K., Suprayogo, D., and van Noordwijk, M. (2020). Agroforests, swiddening and livelihoods between restored peat domes and river: Effects of the 2015 fire ban in central Kalimantan (Indonesia). Int. For. Rev. 22, 382–396. doi: 10.1505/146554820830405645
Sudmanns, M., Tiede, D., Augustin, H., and Lang, S. (2019). Assessing global Sentinel-2 coverage dynamics and data availability for operational earth observation (EO) applications using the EO-compass. Int. J. Digit. Earth 13, 768–784. doi: 10.1080/17538947.2019.1572799
Sulaiman, A., Osaki, M., Takahashi, H., Yamanaka, M. D., Susanto, R. D., Shimada, S., et al. (2023). Peatland groundwater level in the Indonesian maritime continent as an alert for El Niño and moderate positive Indian Ocean dipole events. Sci. Rep. 13:939. doi: 10.1038/s41598-023-27393-x
Sun, Q., Miao, C., AghaKouchak, A., Mallakpour, I., Ji, D., and Duan, Q. (2020). Possible increased frequency of ENSO-related dry and wet conditions over some major watersheds in a warming climate. Bull. Am. Meteorol. Soc. 101, E409–E426. doi: 10.1175/BAMS-D-18-0258.1
Susilo, G., Yamamoto, K., Imai, T., Ishii, Y., Fukami, H., and Sekine, M. (2013). The effect of ENSO on rainfall characteristics in the tropical peatland areas of central Kalimantan, Indonesia. Hydrol. Sci. J. 58, 539–548. doi: 10.1080/02626667.2013.772298
Tacconi, L., and Muttaqin, M. (2019). Reducing emissions from land use change in Indonesia: An overview. For. Ecol. Manag. 108:101979. doi: 10.1016/j.forpol.2019.101979
Tan, Z., Carrasco, L., and Taylor, D. (2020). Spatial correlates of forest and land fires in Indonesia. Int. J. Wildland Fire 29, 1088–1099. doi: 10.1071/WF20036
Tangang, F., Farzanmanesh, R., Mirzaei, A., Salimun, E., Jamaluddin, A., and Juneng, L. (2017). Characteristics of precipitation extremes in Malaysia associated with El Niño and La Niña events. Int. J. Climatol. 37, 696–716. doi: 10.1002/joc.5032
Tansey, K., Beston, J., Hoscilo, A., Page, S., and Hernández, P. (2008). Relationship between MODIS fire hot spot count and burned area in a degraded tropical peat swamp forest in Central Kalimantan, Indonesia. J. Geophys. Res. Atmos. 113:D23. doi: 10.1029/2008JD010717
Turetsky, M., Benscoter, B., Page, S., Rein, G., van der Werf, G., and Watts, A. (2015). Global vulnerability of peatlands to fire and carbon loss. Nat. Geosci. 8, 11–14. doi: 10.1038/ngeo2325
Uda, S., Hein, L., and Atmoko, D. (2019). Assessing the health impacts of peatland fires: A case study for central Kalimantan, Indonesia. Environ. Sci. Pollut. Res. 26, 31315–31327. doi: 10.1007/s11356-019-06264-x
Vetrita, Y., and Cochrane, M. (2020). Fire frequency and related land-use and land-cover changes in Indonesia’s Peatlands. Remote Sens. 12:5. doi: 10.3390/rs12010005
Vetrita, Y., Cochrane, M., Suwarsono, Priyatna, M., Sukowati, K., and Khomarudin, M. (2021). Evaluating accuracy of four MODIS-derived burned area products for tropical peatland and non-peatland fires. Environ. Res. Lett. 16:035015. doi: 10.1088/1748-9326/abd3d1
Volkova, L., Krisnawati, H., Adinugroho, W., Imanuddin, R., Qirom, M., Santosa, P., et al. (2021). Identifying and addressing knowledge gaps for improving greenhouse gas emissions estimates from tropical peat forest fires. Sci. Total Environ. 763:142933. doi: 10.1016/j.scitotenv.2020.142933
Wiggins, E., Czimczik, C., Santos, G., Chen, Y., Xu, X., Holden, S., et al. (2018). Smoke radiocarbon measurements from Indonesian fires provide evidence for burning of millennia-aged peat. Environ. Res. Lett. 115, 12419–12424. doi: 10.1073/pnas.1806003115
Williams, C., Ellsworth, L., Strand, E., Reeves, M., Shaff, S., Short, K., et al. (2023). Fuel treatments in shrublands experiencing pinyon and juniper expansion result in trade-offs between desired vegetation and increased fire behavior. Fire Ecol. 19:46. doi: 10.1186/s42408-023-00201
Wulder, M., Loveland, T., Roy, D., Crawford, C., Masek, J., Woodcock, C., et al. (2019). Current status of Landsat program, science, and applications. Remote Sens. Environ. 225, 127–147. doi: 10.1016/j.rse.2019.02.015
Xu, J., Morris, P., Liu, J., and Holden, J. (2018). PEATMAP: Refining estimates of global peatland distribution based on a meta-analysis. Catena 160, 134–140. doi: 10.1016/j.catena.2017.09.010
Keywords: peatland fires, changes in burn severity over 2 decades, satellite analysis of peatland fires, fire frequency in Kalimantan, climate effects on peatland fires
Citation: Schmidt A, Ellsworth LM, Boisen GA, Novita N, Malik A, Gangga A, Albar I, Dwi Nurhayati A, Putra Ritonga R, Asyhari A and Kauffman JB (2024) Fire frequency, intensity, and burn severity in Kalimantan’s threatened Peatland areas over two Decades. Front. For. Glob. Change 7:1221797. doi: 10.3389/ffgc.2024.1221797
Received: 12 May 2023; Accepted: 12 February 2024;
Published: 26 February 2024.
Edited by:
Peter Fule, Northern Arizona University, United StatesReviewed by:
Ronggo Sadono, Gadjah Mada University, IndonesiaNophea Sasaki, Asian Institute of Technology, Thailand
Copyright © 2024 Schmidt, Ellsworth, Boisen, Novita, Malik, Gangga, Albar, Dwi Nurhayati, Putra Ritonga, Asyhari and Kauffman. This is an open-access article distributed under the terms of the Creative Commons Attribution License (CC BY). The use, distribution or reproduction in other forums is permitted, provided the original author(s) and the copyright owner(s) are credited and that the original publication in this journal is cited, in accordance with accepted academic practice. No use, distribution or reproduction is permitted which does not comply with these terms.
*Correspondence: Andres Schmidt, andres.schmidt@oregonstate.edu