Suitability assessment for forest landscape restoration based on species diversity conservation
 Niqiao Fan
 Yiwen Wang
 Xin Yang
 Jiajing Li
 Jiemin Kang
 Qiang Liu
 Zhidong Zhang
- College of Forestry, Hebei Agricultural University, Baoding, China
Forest landscape fragmentation poses a significant challenge to the conservation of species diversity. Evaluating the suitability of forest landscape restoration (FLR) becomes essential as it promotes effective management of forest resources and protects species diversity. This study focused on deploying and testing a suitability evaluation framework system for FLR in the Saihanba area of Hebei, China. The framework system incorporated factors such as land cover type, landscape structure, soil quality, and topography. Using the matter-element model, the study evaluated the restoration suitability and identified priority restoration areas. The results revealed that land cover type and landscape structure were the primary factors influencing FLR in the study area. The suitable area for FLR in the study area was about 519.20 km2, accounting for 55.55% of the total area. The area of moderate, marginal, and unsuitable restoration accounted for 17.30%, 23.96%, and 3.18% of the study area, respectively. The suitable restoration areas predominantly consisted of natural secondary forest characterized by large patch areas, short distances between patches, and complex patch shapes. In the study area, the objective of FLR should be protect large and complex shaped patches of natural secondary forests for better conservation of species diversity. The FLR suitability evaluation conducted in this study provide a valuable guidance for promoting species-diversity conservation and restoration of forest ecosystems at the landscape scale in the study area and other similar regions.
1 Introduction
Forests play a vital role in terrestrial ecosystems and are responsible for protecting approximately 80% of terrestrial species diversity (Meng, 2006). However, with the progression of industrialization and urbanization, forest landscape fragmentation has intensified, leading to a decline in species diversity (Haila, 2002) and a reduction in ecosystem functioning (Noulèkoun et al., 2021). The alarming rate of forest loss has prompted conservationists to acknowledge that merely protecting or curbing deforestation is insufficient to conserve biodiversity. Restoration of damaged forest landscapes has become a crucial necessity (Suding et al., 2015). In line with this, global initiatives such as the United Nations Decade of Ecosystem Restoration, the Bonn Challenge, and the New York Declaration on Forests have explicitly stated the global objective of restoring 350 million hectares of forests worldwide by 2030, with a particular focus on restoring forest functions at the landscape scale (Orsi and Geneletti, 2010). The emphasis on forest landscape restoration (FLR) at the landscape scale has garnered considerable global attention (Noulèkoun et al., 2021). A prerequisite and guarantee for these efforts is the suitability assessment of FLR, which carries significant implications for forest management (Chen et al., 2019). Identifying priority areas for restoration through suitability evaluation represents a prominent topic in current research on FLR.
Species diversity is an essential requirement for FLR (Beatty et al., 2018a). It is influenced by various factors, including land cover type (Newbold et al., 2015), landscape structure (Gustafson, 1998; Fahrig, 2003), soil quality (Li et al., 2020), and topography (Chen et al., 2021). Different land cover types offer diverse habitat and environmental conditions, which directly or indirectly affect species diversity (Lambin et al., 2001). Compared to grasslands, natural secondary forests with complex community structures and habitat characteristics provide rich and diverse habitats for wildlife (Chazdon et al., 2009), thus supporting species diversity. Managed plantations, characterized by single-species monocultures, often experience intense human disturbances and exhibit regular patch shapes, resulting in lower species diversity. Conversely, grasslands feature curved patch boundaries and a diverse composition of plant communities (Dong et al., 2014), generally harboring higher species diversity compared to managed plantations. Landscape patterns also have an impact on species diversity (Lindenmayer et al., 2008). Several studies have demonstrated that changes in landscape structure are a significant cause of species diversity loss at the landscape scale (Higgins, 2007). According to island biogeography theory, patch size, and distance are the primary determinants of habitat species diversity (Fahrig, 2013). Unfragmented large forest patches can sustain higher species diversity compared to several small forest fragments that are more susceptible to edge effects (Li L. et al., 2021). Moreover, seed dispersal is critical for maintaining and increasing plant diversity at a landscape scale (Beatty et al., 2018a). Different tree species exhibit varying seed dispersal distances under different conditions. For example, pollen from Larix principis-rupprechtii can disperse up to 100 m (Wen and Shen, 1990), while pollen from Cunninghamia lanceolata can disperse distances exceeding 600 m (Chen et al., 1996). Different animal species also have varying dispersal distances, with small mammals, reptiles, and amphibians having primary dispersal distances of approximately 750 m (Chen et al., 2012). When the spatial extent exceeds 300 m, landscape patterns undergo noticeable fluctuations, posing a significant threat to the survival of reptiles and birds sensitive to habitat range (Wei et al., 2022). Under fragmented forest conditions, patch shape also impacts species diversity (Cook, 2002). More complex patch shapes facilitate stronger interactions between patches and the surrounding matrix, promoting energy, material, and biological exchange, thus benefiting species diversity conservation. Therefore, when evaluating the suitability of FLR, the influence of landscape indices such as patch area, shape index, patch density, and landscape diversity should be considered. Additionally, soil (Van Der Heijden et al., 2008), topography (Qian and Ricklefs, 2000), and climate change (Dawson et al., 2011) also impact species diversity. Good soil quality implies better soil and water retention capabilities, providing more suitable habitats for species. Studies have shown that the contribution of topography to species diversity increases with spatial scale (Hu et al., 2014), while climate change influences species distribution, reproduction, and survival (Copenhaver-Parry and Cannon, 2016). Currently, most traditional restoration methods focus on local scales, and there are limited studies at the landscape scale. Therefore, conducting a comprehensive evaluation of FLR suitability based on factors such as land cover type, landscape structure, soil quality, and topography at the landscape scale is necessary.
To scientifically assess the suitability of landscape restoration, extensive research has been conducted by scholars, exploring various evaluation models. These models include multiple logistic regression (Schulz and Schröder, 2017), artificial neural networks (Liu et al., 2015), geographical detector (Wang et al., 2019), suitability models (Darwiche-Criado et al., 2017), and matter-element models (Chen et al., 2021). The matter-element model has emerged as a notable solution to the challenge of compatibility between indicators and methods, making it suitable for multifactor evaluation (Cai, 1999). Compared to other evaluation models, the matter-element model provides more objective and scientific evaluation results. This method assesses the degree of belonging to a certain set based on quantitative values, allowing for precise evaluation and quantification of correlation degree (Wu et al., 2019). It has been applied in various evaluations such as ecological security evaluation (Wu et al., 2019), water safety evaluation (Li et al., 2017; Wang et al., 2019), ecosystem health evaluation (Li and Li, 2014; Su et al., 2019), and land suitability evaluation (Geng et al., 2019; Chen et al., 2021). The assessment of FLR suitability encompasses multiple indicators, often yielding incompatible results when assessing individual indicators. Therefore, the matter-element model can be employed to facilitate comprehensive evaluation. Additionally, the importance of each evaluation index varies depending on the specific evaluation objectives. The analytic hierarchy process (AHP) is a systematic method used in multi-criteria decision making. Its fundamental concept involves decomposing intricate problems into several hierarchical levels and multiple factors (Saaty, 1977). By evaluating the importance of pairwise indicators, establishing judgment matrices, and calculating the maximum eigenvalue of these matrices, the AHP method determines the relative weights of various alternatives based on their significance (Saaty, 1977; Atkinson et al., 2005). This process serves as a foundation for guiding the selection of the optimal solution. By determining weights through the AHP method, it mitigates the limitations of strong human subjective interference in traditional suitability evaluation processes, leading to more accurate evaluation results. As a result, AHP is widely employed in the field of landscape restoration suitability evaluation.
The Saihanba Nature Reserve, situated in the forest-steppe ecotone, is a diverse ecosystem integrating forest, grassland, meadow, and marsh (Tian et al., 2016). This area holds significant conservation value due to its rich species diversity. However, the area has been negatively affected by long-term anthropogenic disturbances and extensive plantation management practices (Sa and Fan, 2023). Historically, the area experienced extensive deforestation, leading to the disappearance of the original forests by the early 1950s. This situation resulted in desertification, soil erosion, and ecological degradation (Liu et al., 2023). To address these issues, the Chinese government initiated a large-scale afforestation program in 1952. Saihanba was designated as one of the first pilot areas under this program. Since the establishment of the Saihanba Mechanical Forest Farm in 1962, continuous afforestation efforts have transformed it into the largest plantation base in the north of China (Sa and Fan, 2023). However, the plantations still face the challenge of single-species dominance (Fan and Li, 2008), with a higher proportion of pure stands and a lower proportion of mixed forests (Zhang et al., 2022). The predominant plantation species include L. principis-rupprechtii, Pinus sylvestris var. mongolica, Picea asperata, and Quercus mongolica (Li et al., 2021b). The prevalence of pure forests can lead to unstable forest ecosystems, which may result in the ineffective performance of ecosystem services (Wang et al., 2009). Especially, the lack of information on suitable areas for FLR hinders species diversity conservation in the study area. There is an urgent need for FLR in this region, making the identification of suitable restoration area a crucial and challenging task. In this study, the suitability of FLR in the area was evaluated by using a matter-element model. The study aimed to explicitly identify the suitable areas for FLR to effectively conserve species diversity in the area.
2 Materials and methods
2.1 Study area
The Saihanba Nature Reserve (42°04′-42°39′N, 116°56′-117°42′E) is located in Weichang County, Hebei Province, China. It covers a total area of 929.97 km2 and is located on the border between the Inner Mongolia and Hebei Province. The elevation is low in the southwest and high in the northeast. The slopes range from 0° to 53°, and the elevations range from 1,014 to 1,952 m (Qin et al., 2016; Figure 1). The climate is characterized as a cold-temperate semi-arid and semi-humid continental monsoon climate. The average annual temperature is −1.3°C, with extreme maximum and minimum temperatures recorded at 33.4°C and −43.3°C, respectively (Dong et al., 2021). The annual precipitation amounts to approximately 460 mm (Zhao et al., 2023). The unique topography and climate conditions have contributed to the formation of various soil types in the area, including Arenosols, Cambisols, and Luvisols (Li et al., 2021b).
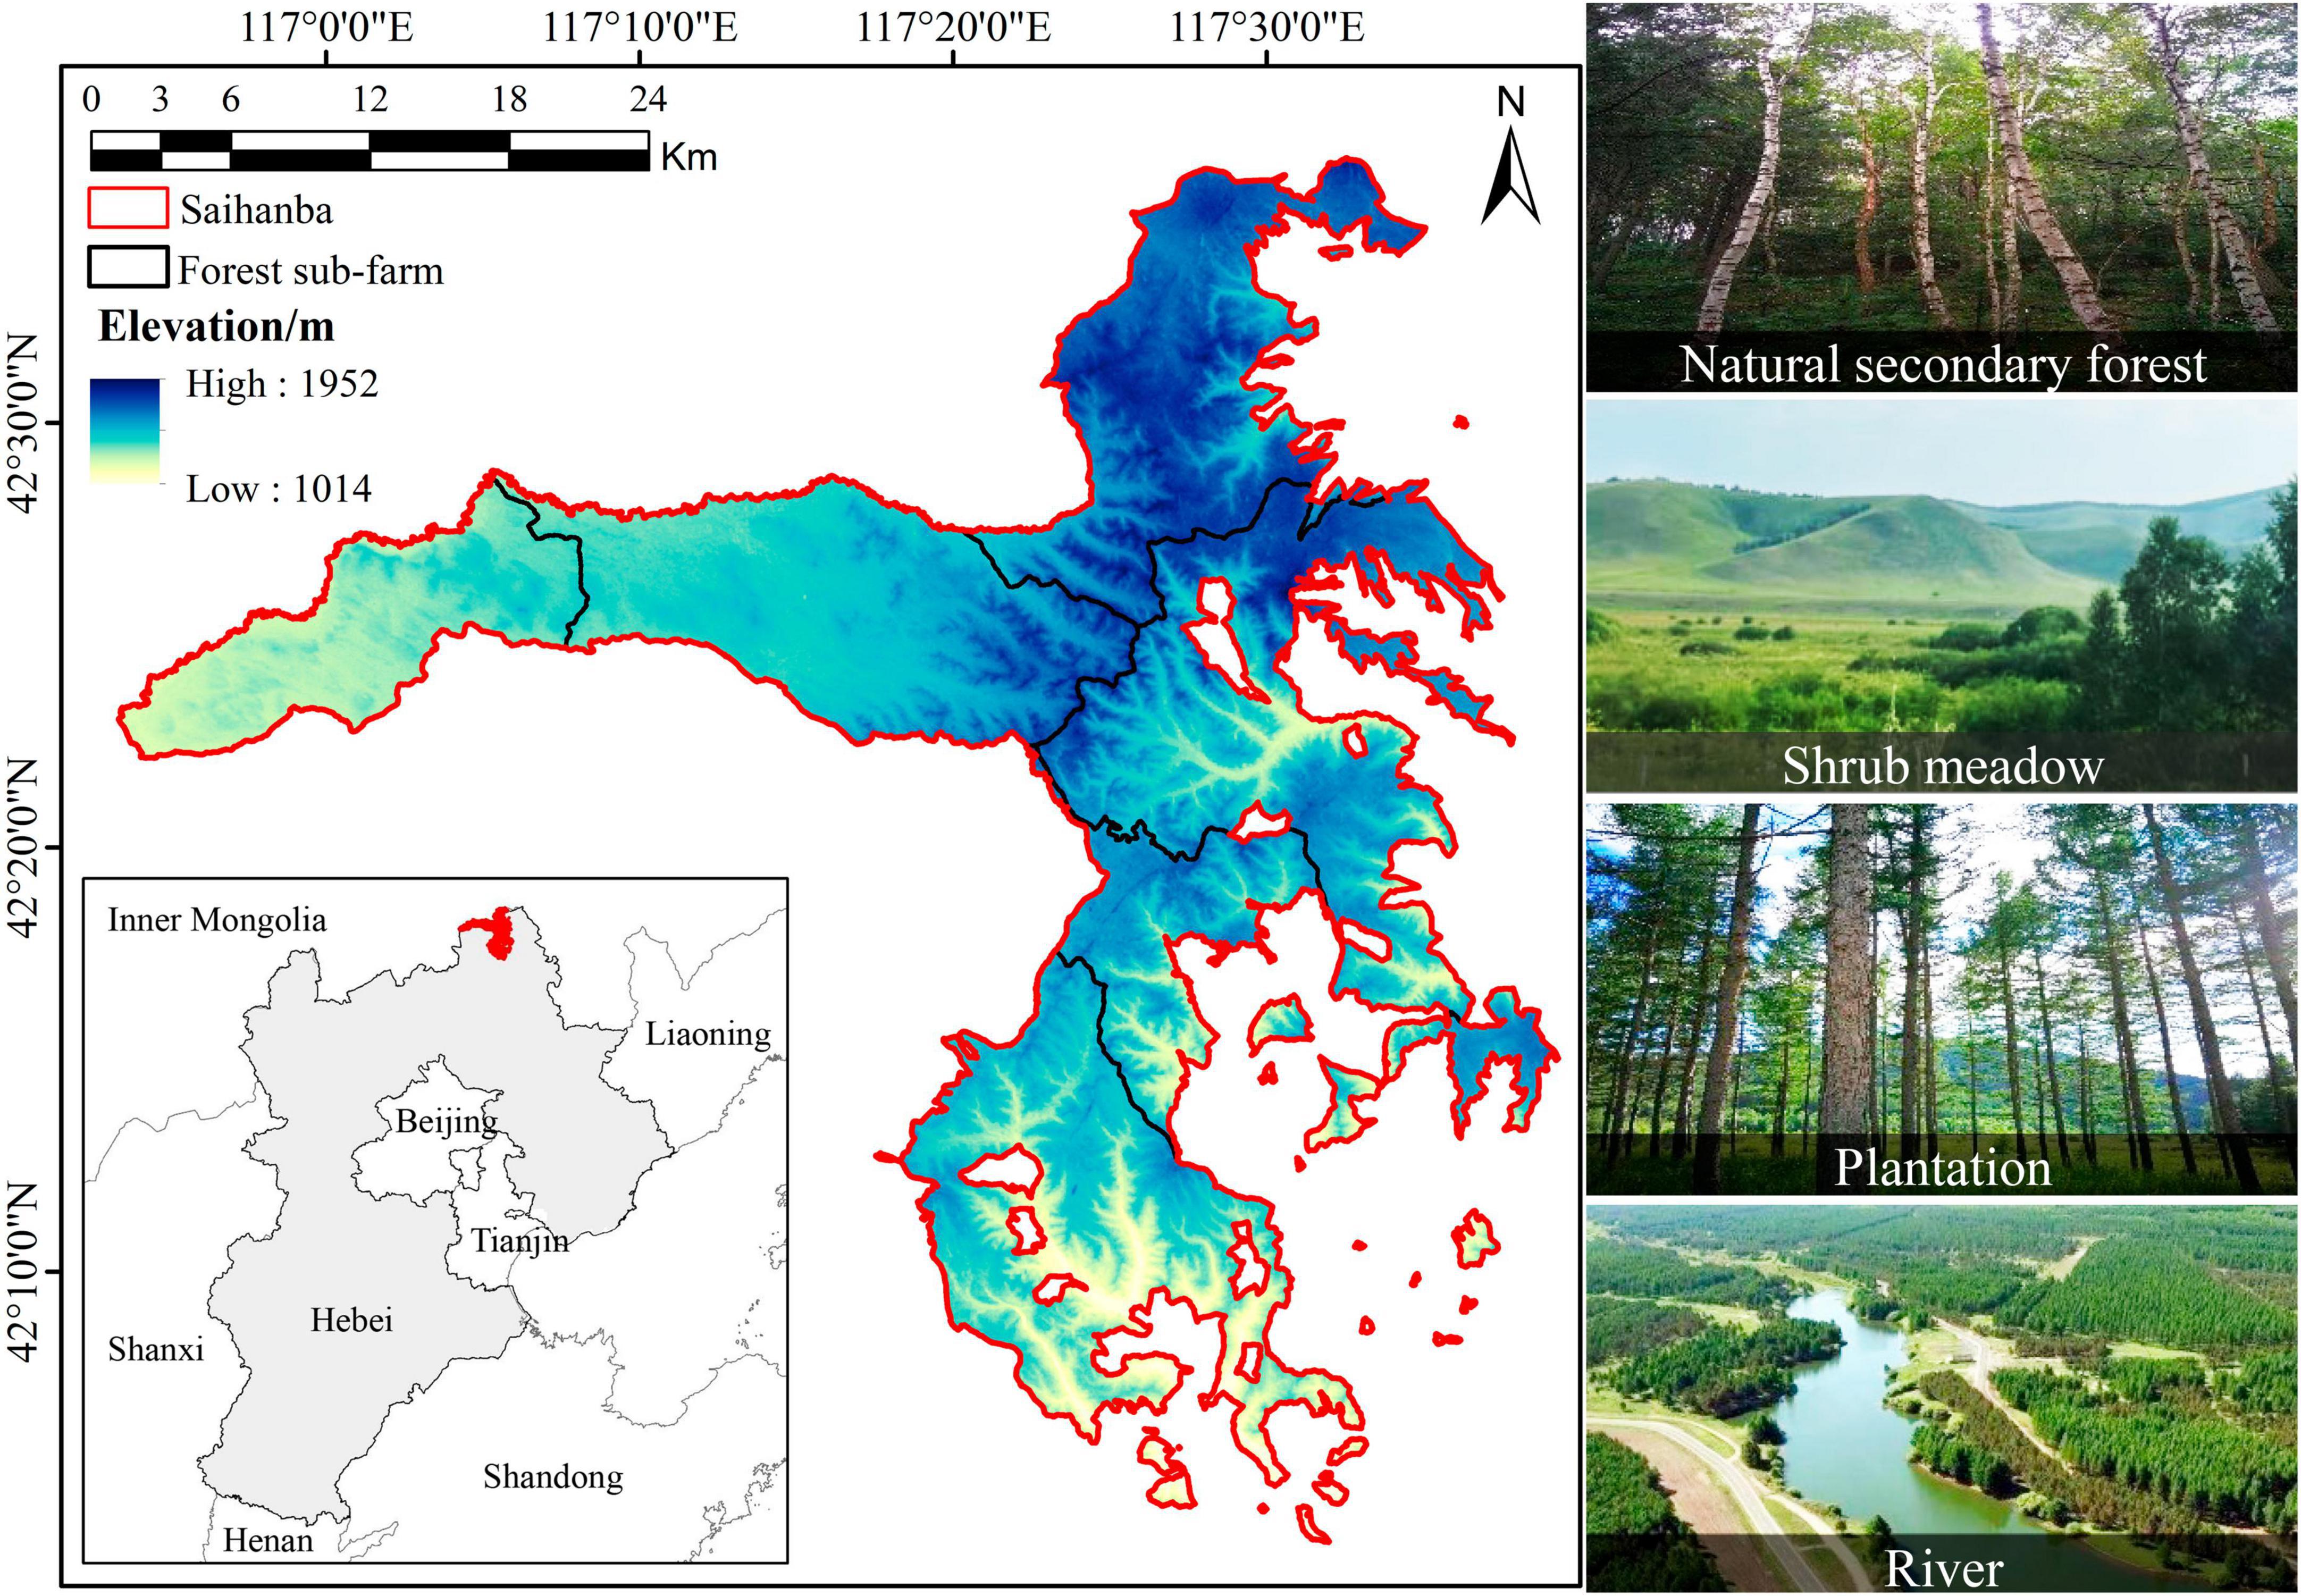
Figure 1. Location of Saihanba Nature Reserve, Hebei Province, China (left) and the main landscape types (right).
Saihanba is the largest plantation forest base in China (Sa and Fan, 2023). Statistics reveal that the plantations in the Saihanba area cover an area of approximately 561.76 km2, but only 33.67% of this area consists of mixed forests. Additionally, the distribution of forest patches across different development stages is imbalanced, with middle and young-aged forests constituting over 50% of the total forest landscape, while the proportion of mature forests is low in study area. Moreover, plantation patches are generally small in size and exhibit simple shapes (Xu et al., 2021). These factors have led to landscape fragmentation (Wei et al., 2022) and a decrease in biodiversity (Ge et al., 2020), thereby impeding the ecological environment’s improvement and the area’s sustainable development. Consequently, there is an urgent need for FLR to harness the multifunctional benefits of the forest in a sustainable and efficient manner.
2.2 Data acquisition and processing
Land use status plays a decisive role in the suitability of FLR (Lambin et al., 2001). The land cover types were classified into natural secondary forest, shrub meadow, plantation, and others (wetland, agricultural landscape, sandy, and construction) by employing the ENVI 5.1 software (Exelis Visual Information Solutions, Broomfield, CO, USA). Prior to classification, several pre-processing steps were conducted on the Landsat 8 image data, including multiband blending, geometric correction, image mosaic, and image cropping. The Landsat remote sensing data, obtained in July 2020, were sourced from the U.S. Geological Survey.1 The supervised classification approach yielded an overall classification accuracy of 98.62%, and a KAPPA coefficient of 0.98. To better verify the accuracy of the land cover type classification results, we conducted ground truthing in the study area in August 2022. A stratified random sampling approach was adopted, and the sample size was determined based on the proportional area of various land cover types in the study area (Pu et al., 2020). A total of 60 testing plots were surveyed. Through ground truth verification, necessary corrections (e.g., some plantations were incorrectly classified as shrub meadow by the algorithm and needed to be corrected to plantation) were applied to the classification results.
Soil nutrients play a crucial role in determining soil fertility and influencing species diversity (Ge et al., 2017). This study focuses on assessing soil fertility using the soil quality index (SQI), a widely used method that combines various biochemical indicators into a single index, particularly in the evaluation of forest soil quality. Soil data were obtained from the National Earth System Science Data Center.2 Seven soil factors were selected: total nitrogen, total phosphorus, total potassium, available potassium, alkali-hydrolysis nitrogen, available phosphorus, and pH. These factors were spatially interpolated and masked using the ArcGIS 10.2 software (Environmental Systems Research Institute, Redlands, CA, USA). The final raster soil factor dataset for the study area was generated. Subsequently, the SQI was calculated by performing principal component analysis (PCA) to construct a minimum data set (MDS) and selecting the principal component with eigenvalues greater than 1. The MDS index scores were then computed, and the weights were determined. Ultimately, a weighted sum model was used to compute the SQI. The formulas for calculating the index scores and SQI (Askari and Holden, 2014) were calculated based on Equations 1, 2.
where S is the index score, a is the highest score (a = 1), x is the soil variable value, x0 is the mean value of the variable, and b is the slope assumed to be −2.5 for “more is better” and 2.5 for “less is better.”
where Wi is the weight of the indicator i; Si is the score of the indicator i; n is the indicator number of the MDS.
Changes in landscape structure can influence the flow and exchange of energy and materials within the landscape, ultimately resulting in a decline or increase in species diversity (Muneepeerakul et al., 2019). Considering the objectives of this study, we focused on three landscape structure factors, namely patch area, patch distance, and patch shape, to assess the suitability of FLR. The patch distance was centered on natural secondary forest patches, and a buffer zone of four magnitudes, 300, 750, 1,000, and 2,000 m, was set (Chen et al., 2012; Wei et al., 2022). The landscape shape index (LSI) was calculated according to Equation 3 (Wu, 2000):
where L is the perimeter of the patch; A is the patch area. LSI ≥ 1, no upper limit. When there is only one square patch in the landscape, LSI = 1; when the patch shape in the landscape is irregular or deviates from square, the LSI value increases.
Topography controls the spatial pattern of basic ecological factors, such as light, temperature, moisture, and soil nutrients (Swanson et al., 1988). Among the various attributes of topography, slope is particularly important as it influences soil thickness, soil erosion, and soil conservation (Li et al., 2013; Méndez-Toribio et al., 2016). The digital elevation model (DEM) data was acquired from the geospatial data cloud.3 We extracted the slope data from the DEM using the spatial analyst tool in the ArcGIS10.2 software.
Raster data were generated for each evaluation factor mentioned above, and all of them used CGCS2000_GK_Zone_20 projection coordinate system. The details of the data used in this study are presented in Table 1.
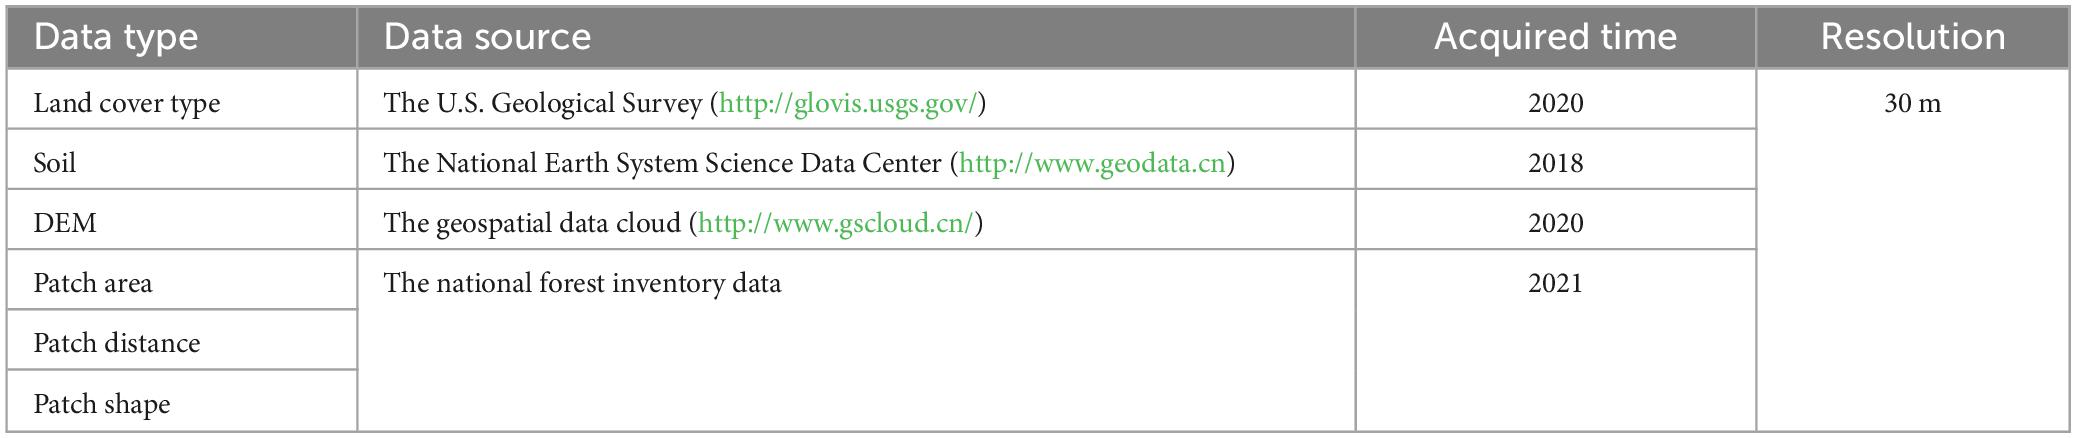
Table 1. Description of the data used in this study.
2.3 Determination of indicator weights
In this study, the AHP method was employed to determine the weights of the evaluation factors. The AHP method involves two main steps. Firstly, the relative importance of the evaluation factors was determined using the expert scoring method. We invited a total of 30 forestry experts to participate in the scoring process. To ensure the objectivity and accuracy of the assessment, the selection of these experts was based on their extensive experience and deep knowledge in the field of FLR. A pairwise judgment matrix (C) was constructed for the criterion layer, and the maximum eigenvalue of the judgment matrix (λmax) and the corresponding eigenvector (W) were calculated. The components of the W represent the weights of the indicators in the criterion layer (Saaty, 1977). Secondly, a consistency test was conducted. The consistency index (CI), average randomness index (RI), and random consistency ratio (CR) were calculated using Equations 4, 5 (Saaty, 1977). If the CR ≤ 0.10, the consistency of matrix C is deemed acceptable, indicating the reliability of the calculated weight values. However, If the CR > 0.10, it signifies the need for readjusting the judgment matrix (Atkinson et al., 2005). Following multiple iterations of adjusting the judgment matrix, the final consistency test value is obtained as CR = 0.0355 (CR ≤ 0.10), confirming the reasonableness of the derived weights (Table 2).
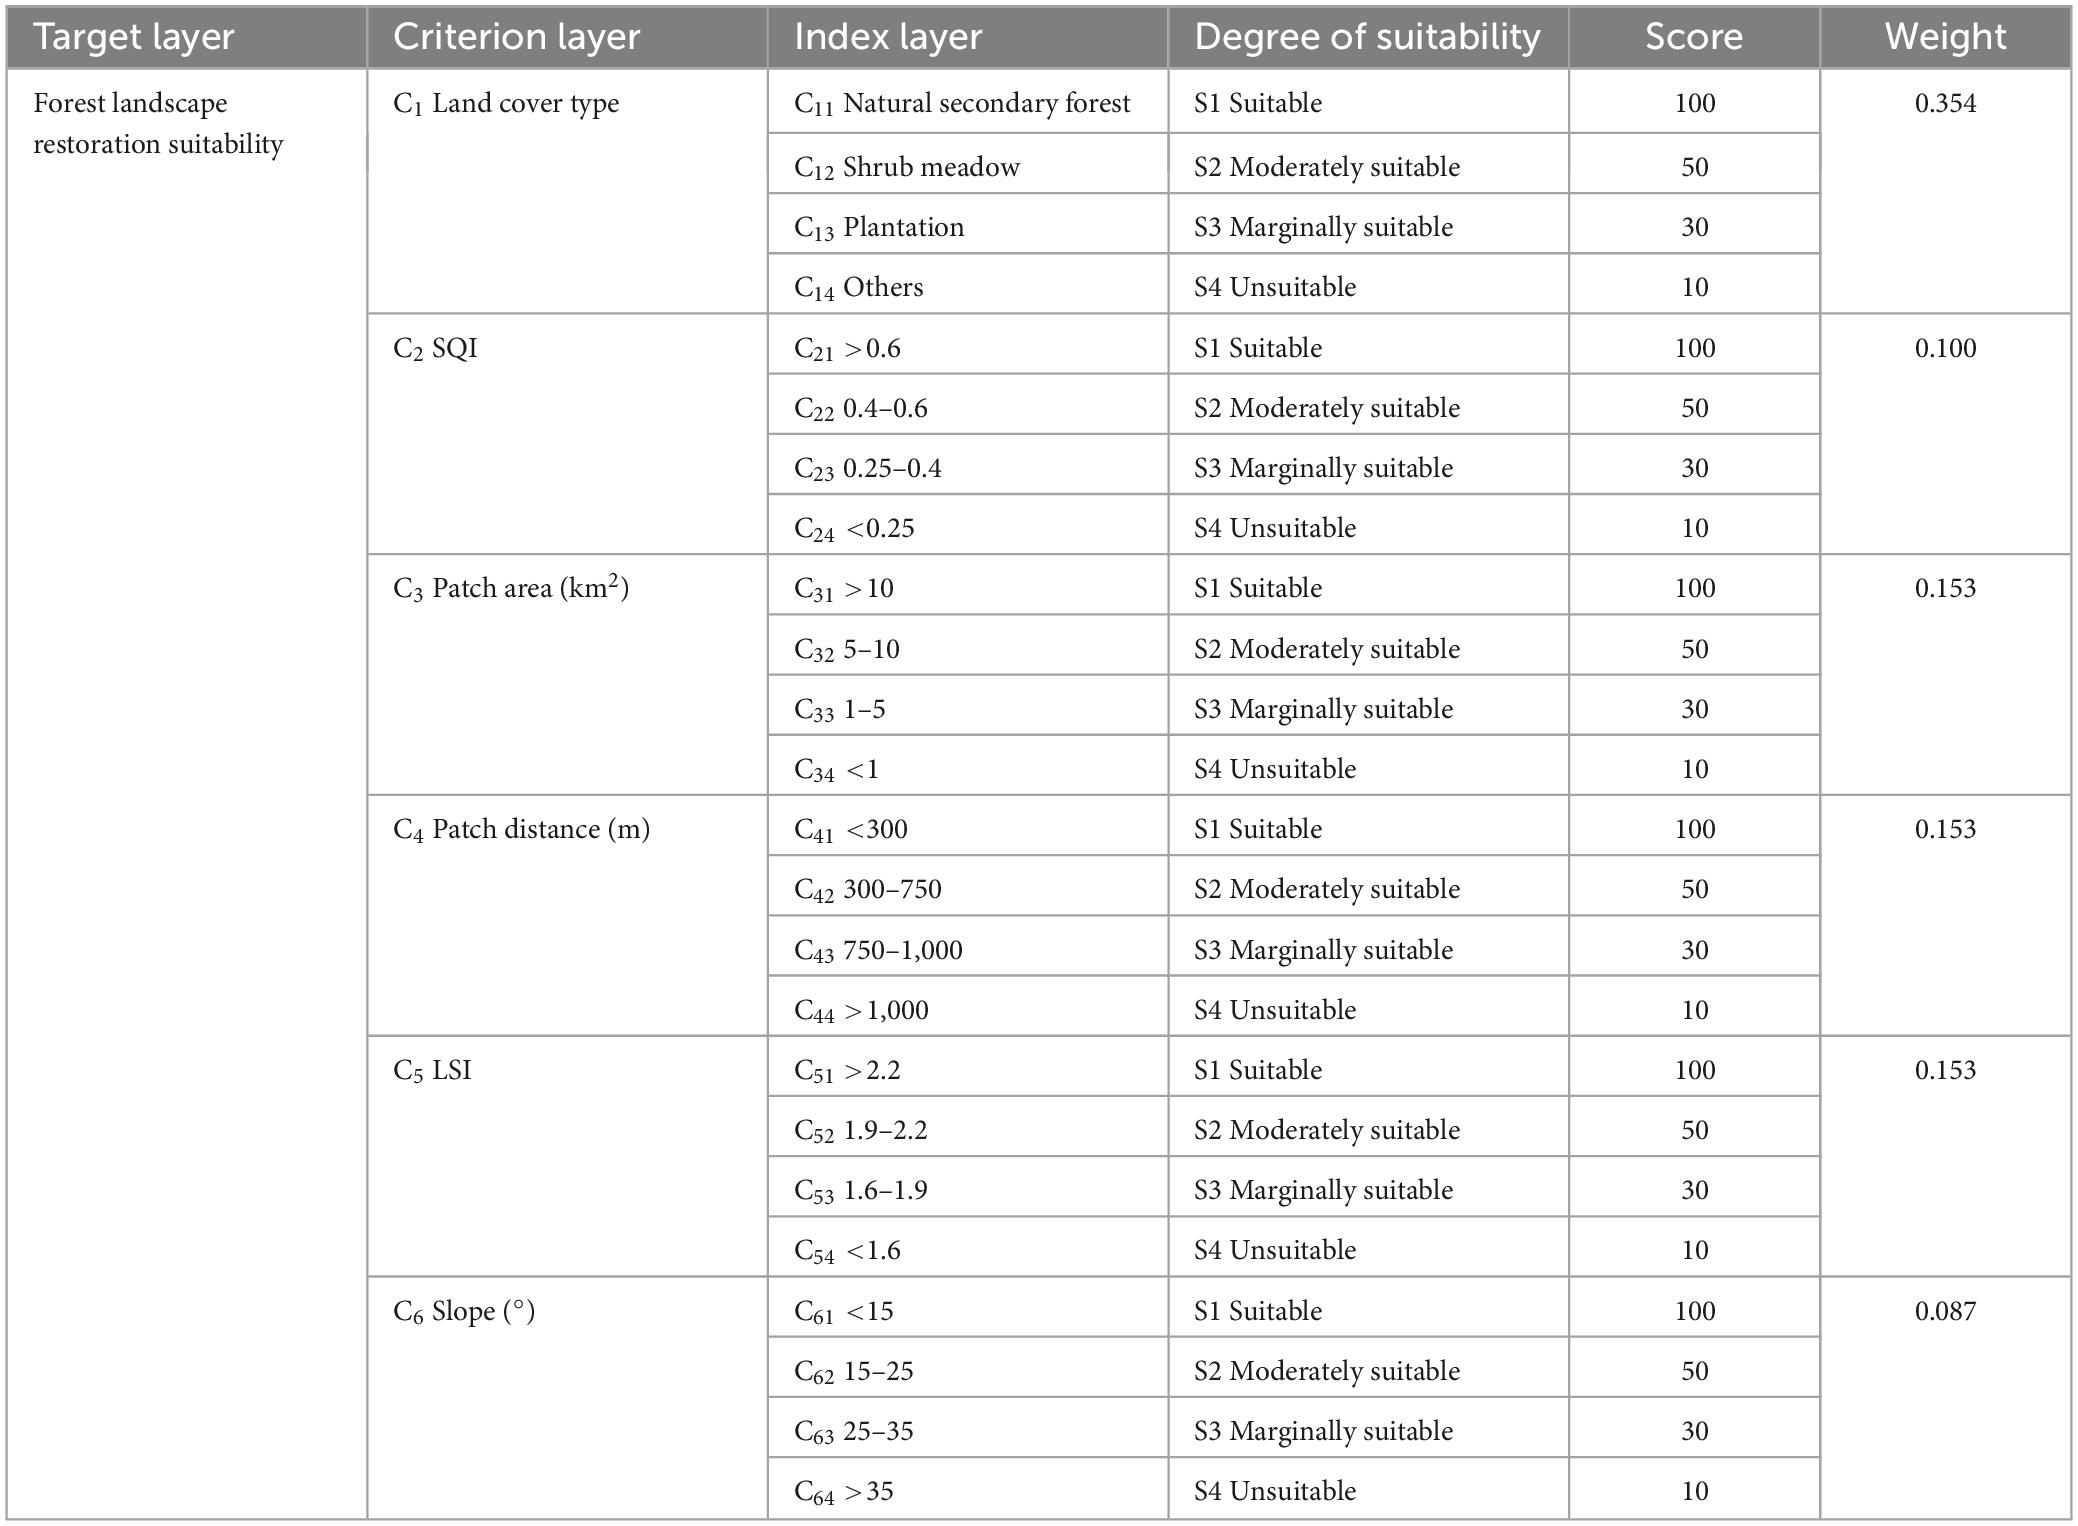
Table 2. Evaluation system of forest landscape restoration suitability in Saihanba Nature Reserve, Hebei Province, China.
2.4 Matter-element analysis
A mathematician first introduced the matter-element analysis theory in the 1980s to tackle incompatibility issues (Cai, 1999). Ecosystems were traditionally viewed as a collection of matter-elements, each comprising objects and characteristics that participate in various processes and transformations (Tang et al., 2009; Gong et al., 2012). Building upon this concept, matter-element analysis now encompasses a set of fundamental steps: firstly, the system undergoes a division into matter-elements. Subsequently, defining the class intervals for each evaluation indicator. Thirdly, calculating the single-index correlation degree to determine the suitability of FLR under each individual indicator. Finally, obtaining comprehensive scores for all indicators through model integration (Gong et al., 2012). Consequently, the evaluation results from matter-element analysis are demonstrated to be more rational and precise in comparison to results obtained through alternative methods (Tang et al., 2009).
2.4.1 Construction of FLR suitability matter-element model
The FLR suitability matter-element model (R) is comprised of three components: the FLR suitability (N), the characteristic of this suitability (C), and the magnitude of the character (V). The N is represented by a vector C (c1, c2,…, cn) with n dimensions, indicating its various characteristics. The corresponding quantity C is represented by the n-dimensional vector V (v1, v2,…, vn). R model (Gong et al., 2012; Geng et al., 2019) is expressed according to Equation 6.
2.4.2 Determination of the classical and segment field of matter-element
If the evaluation object has m levels with N01, N02, … and N0m, the matter-element (Roj) (Gong et al., 2012; Geng et al., 2019) is expressed according to Equation 7.
where Roj denotes the classical field of matter-element; Noj is the j-th evaluation level (j = 1, 2, …, m); ci is the i-th evaluation indicator; Voji is the j-th-level value range of ci, that is the classical domain. The range of Voji is interval < aoji,boji > , which can be recorded as Voji=<aoji,boji>, i = 1, 2, …, n.
According to the classical domain, the section domain (Rp) (Gong et al., 2012; Geng et al., 2019) is expressed according to Equation 8.
where Np is the whole evaluation levels, and the Vpi is the value range of ci. All that is the Np section domain, which can be recorded as Vpi=<api,bpi>, i = 1, 2, …, n. Obviously, here are Voji belongs to Vpi. Determining the classical field is a crucial step in the analysis of matter-element. The evaluation factors were categorized into different suitability levels and assigned scores ranging from 0 to 100. These scores represent the degree to which each evaluation factor contributes to the conservation of species diversity. A higher score indicates a greater benefit to species diversity conservation. Table 2 presents the scores of the suitability evaluation factors for FLR in the study area. The classical and segment domain were calculated as follows Equations 9–13.
The land cover type (C1) was a discrete variable, and its score was assigned within a range of 0–100 for ease of calculations, as shown in Equation 13 and summarized in Table 2. Among the four land cover types, natural secondary forests exhibited the highest species diversity. Shrub meadows typically had lower species diversity compared to natural secondary forests but higher diversity compared to plantation. The other land cover types predominantly consisted of urban construction, which exhibited the lowest species diversity due to the greater impact of human activities. Based on these considerations, the classification criteria for different levels of suitable restoration were as follows: natural secondary forests were considered suitable for restoration, shrub meadows were moderately suitable, plantations were marginally suitable, and the other land cover types were deemed unsuitable for restoration. Specific details of the segment field, suitability classification criteria, and score for other factors (SQI, patch area, patch distance, LSI, and slope) are shown in Table 2.
2.4.3 Calculation of correlation degree
Based on the classical domain and the segmented domain, the degree of correlation between each characteristic and each class (Gong et al., 2012; Su et al., 2019) was calculated using the following functions:
where
where |Voji| = |aoji−boji|; ρ(vi,Voji),ρ(vi,Vpi) are respectively the distances between vi and classical domain Voji and section domain Vpi.
2.4.4 Determination of comprehensive correlation degree and suitability level
The formula (Tang et al., 2009; Gong et al., 2012) for calculating the comprehensive degree of correlation of each evaluation unit is:
where Kj(P0) expresses the integrated correlation degree between evaluation object P0 and its corresponding grade j. Kj(vi) is the correlation function of the i-th characteristic belonging to j level. ai is the weight of each evaluation indicator, and ∑ai = 1. If:
then the evaluated matter P0 belongs to rank j.
The numerical value of the associated function Kj(P0) represents the extent to which the subject under evaluation conforms to a certain standard (Su and Chen, 2005). If Kj(P0)≥0, it signifies that the evaluation object aligns with the requirements of a specific grade standard, and the degree of compliance increases with its value. When −1 < Kj(P0) < 0, the evaluation object does not meet the criteria of a particular grade standard, yet it possesses the potential for transformation to that standard, with a higher value making this transformation more attainable. However, if Kj(P0) < −1, the evaluation object not only fails to meet the requirements of the grade standard but also lacks the capacity for advancement to that standard. A lower value in this case indicates a more significant disparity between the evaluated object and the evaluation criteria (Su and Chen, 2005; Gong et al., 2012). Using the ArcGIS raster calculator, the distances of the four classical fields and one segment field for the six indicator raster values were calculated based on Equations 14–16, respectively. The correlation degrees corresponding to each suitability level were also calculated, resulting in a total of 24 correlation degree layers for each indicator. The weights for each indicator were determined using the AHP method. These weights were used to calculate the comprehensive correlation degrees for each raster in the four suitability classes: suitable, moderately suitable, marginally suitable, and unsuitable. This was done using Equation 17, which determined the degree of belonging to each class. To obtain the final result of the FLR suitability evaluation, the grade corresponding to the maximum value of the comprehensive correlation degree for each grid was selected as its suitability grade. This selection process was performed using Equation 18.
2.5 Statistical analysis
For each sub-farm (a management unit delineated within the Forest Farm for the purpose of conducting forest management activities in a rational manner) as the unit of analysis, a one-way ANOVA and Tukey’s difference significance test (p < 0.05) were conducted to determine if there were significant variations in the percentage of area among different suitability classes for each index. All analyses were performed using the R4.1.0 software (R Core Team, 2021).
For a framework of the research methods, see Figure 2.
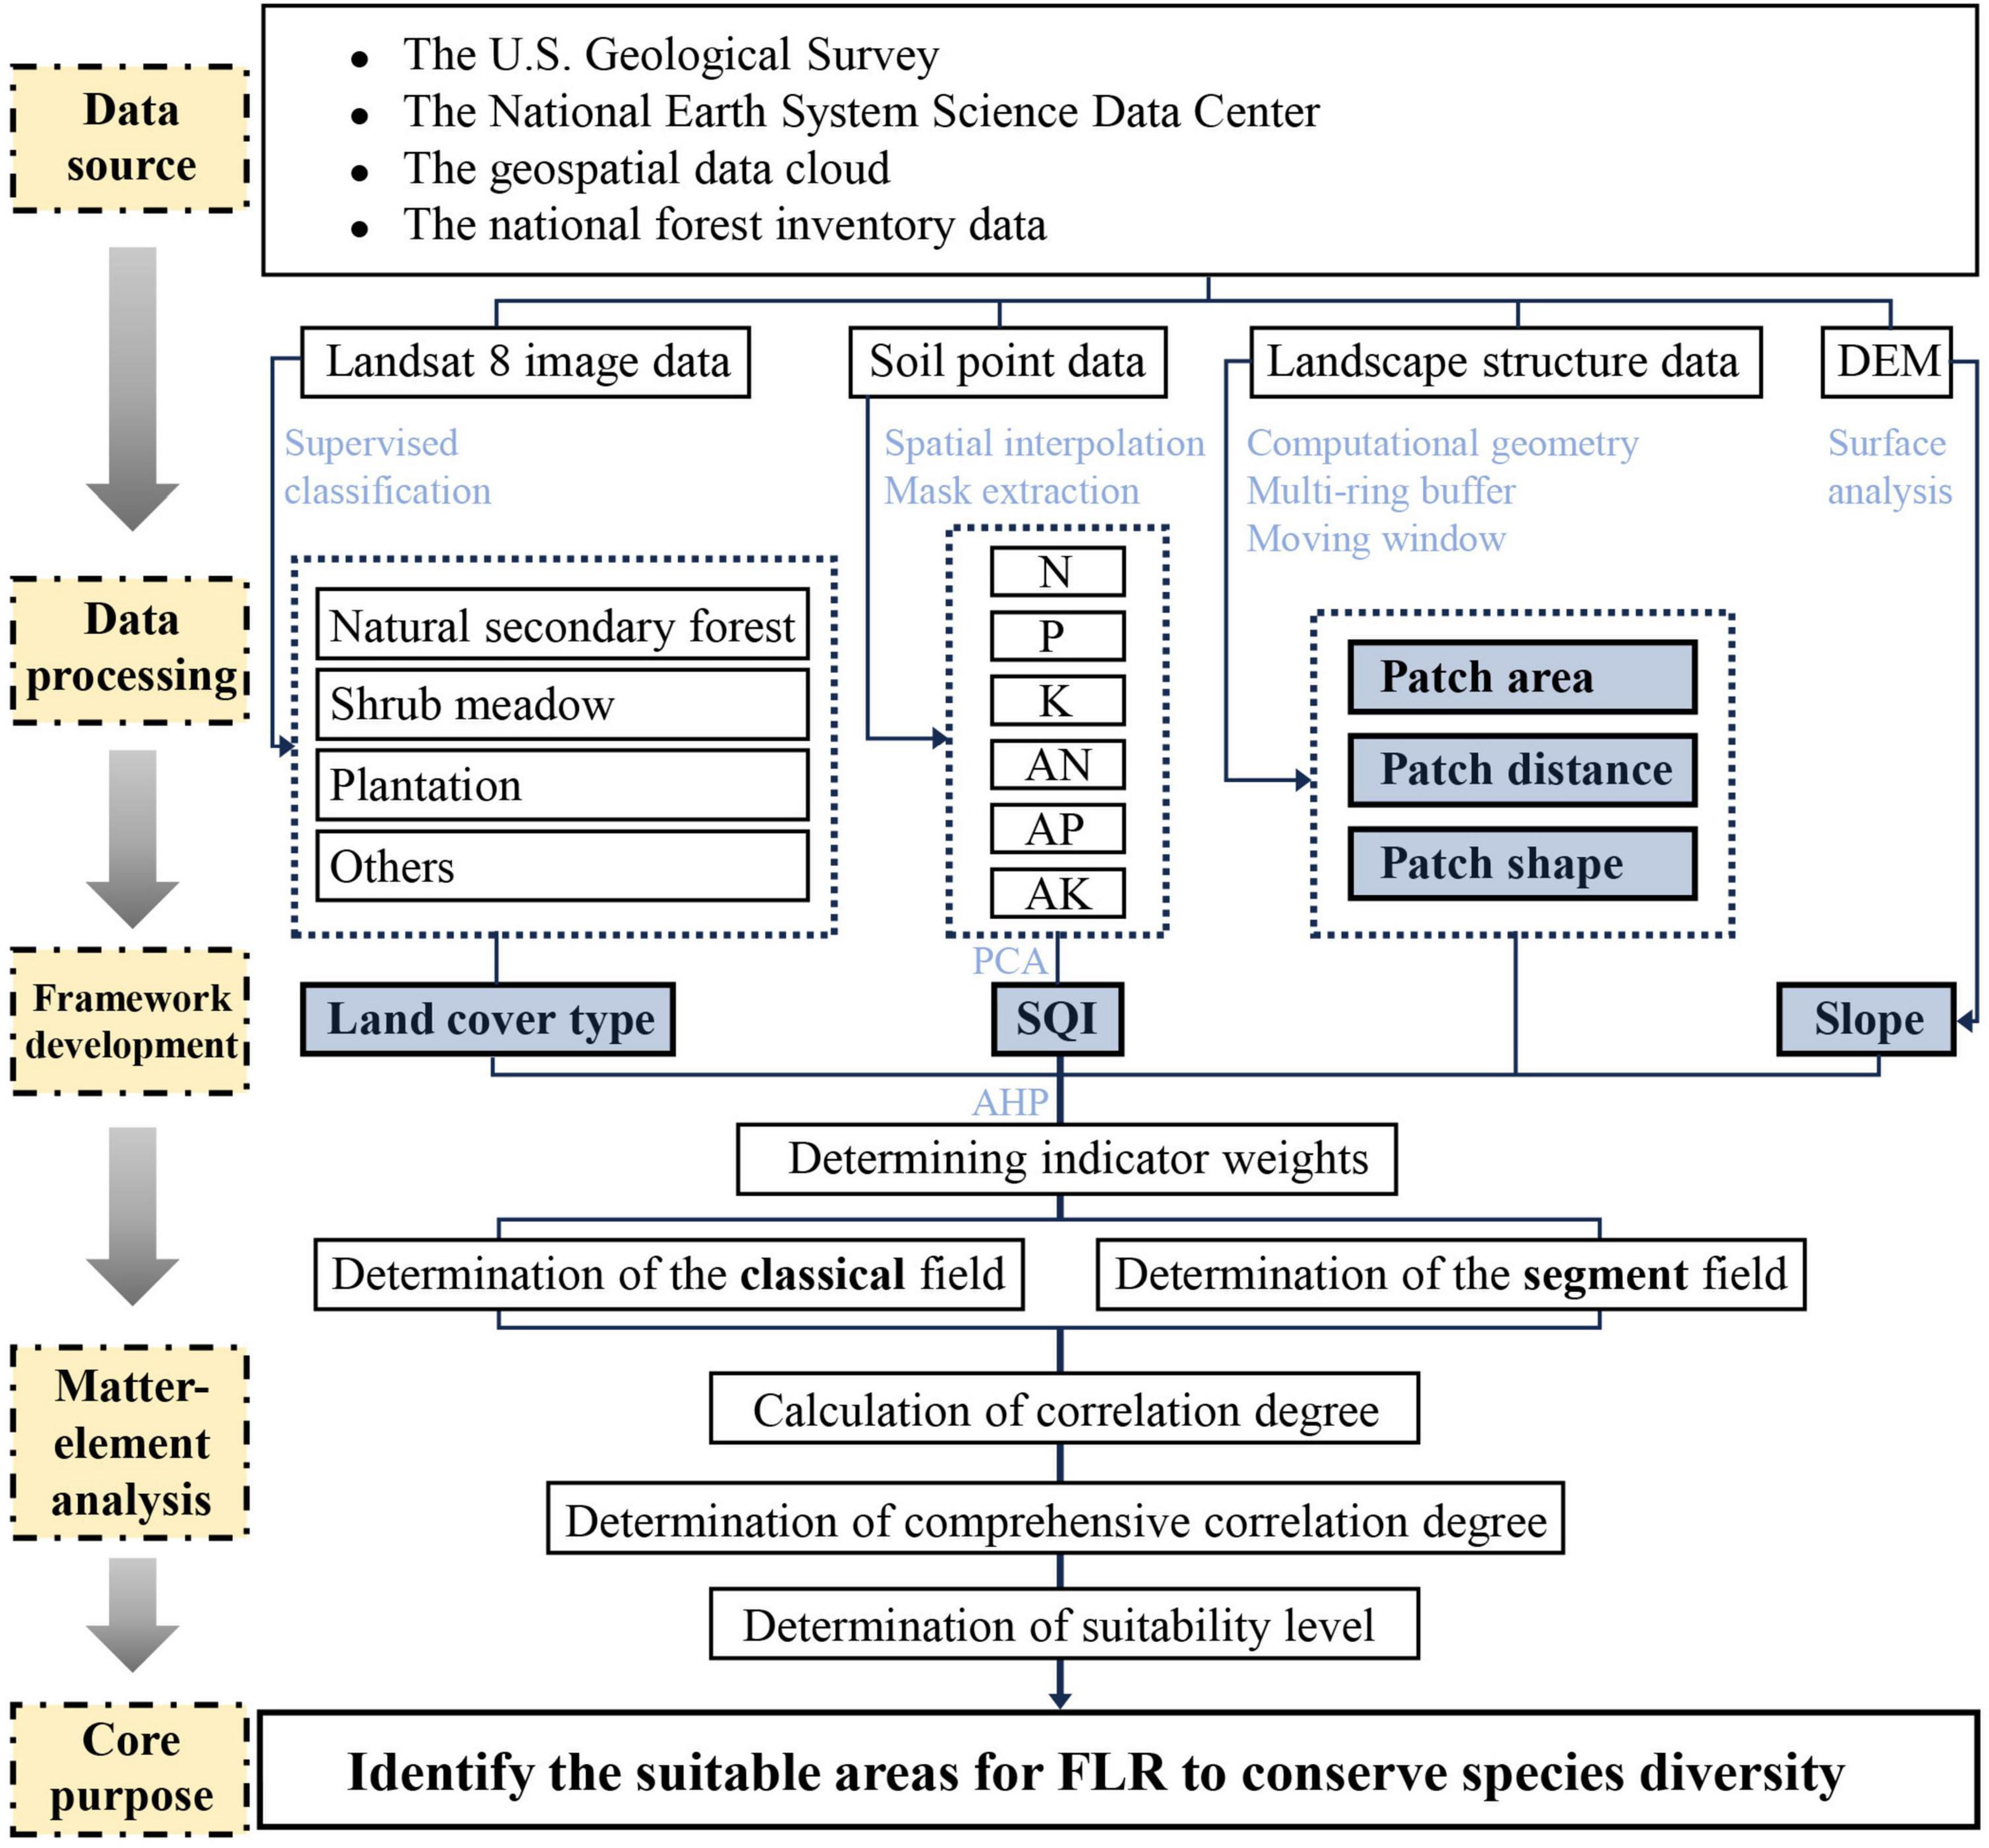
Figure 2. The research framework for evaluating the suitability of FLR in Saihanba Nature Reserve, Hebei Province, China.
3 Results
3.1 Land cover type, soil quality, landscape structure, and slope analysis
Among the four land cover types, plantation covered approximately 54.40% of the total area in the study area, which was significantly higher than the area occupied by natural secondary forest, shrub meadow, and other types (p < 0.05). The area of natural secondary forest accounted for the second highest percentage at 24.25%, but there was no significant difference compared to the area of other types (p > 0.05) (Figures 3, 4).
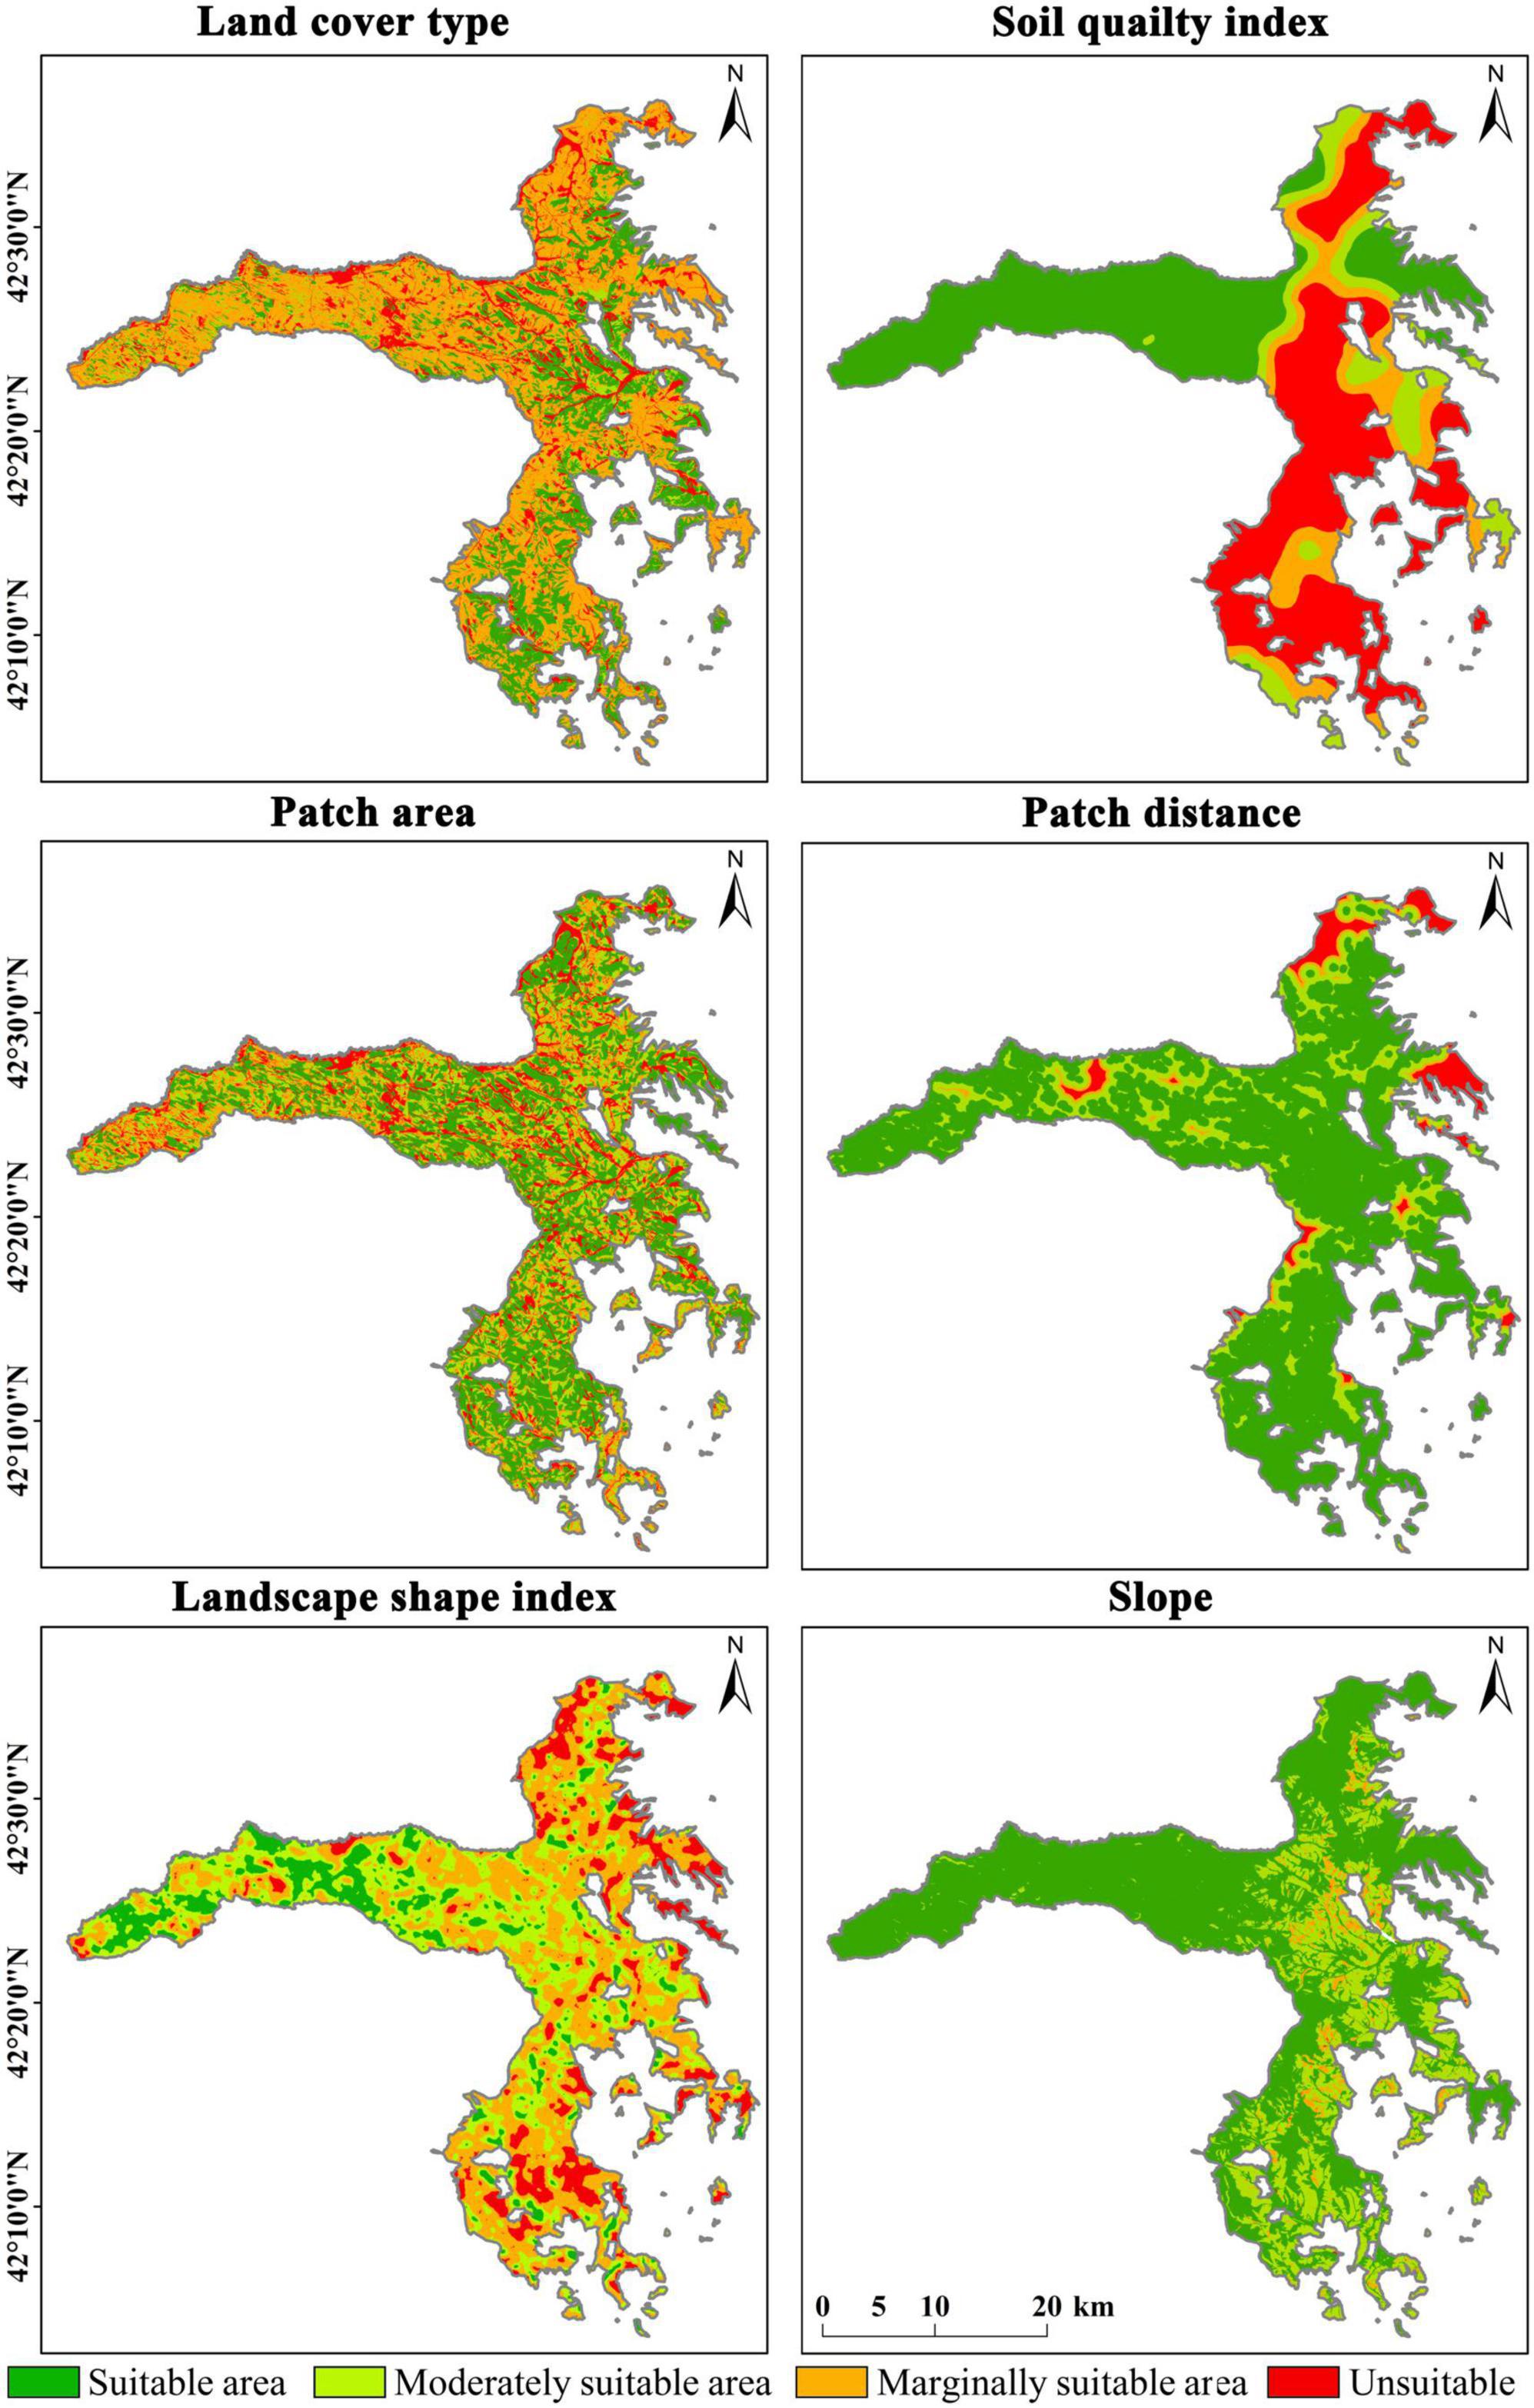
Figure 3. The suitability distribution of land cover type, soil quality, landscape metrics, and slope in Saihanba Nature Reserve, Hebei Province, China.
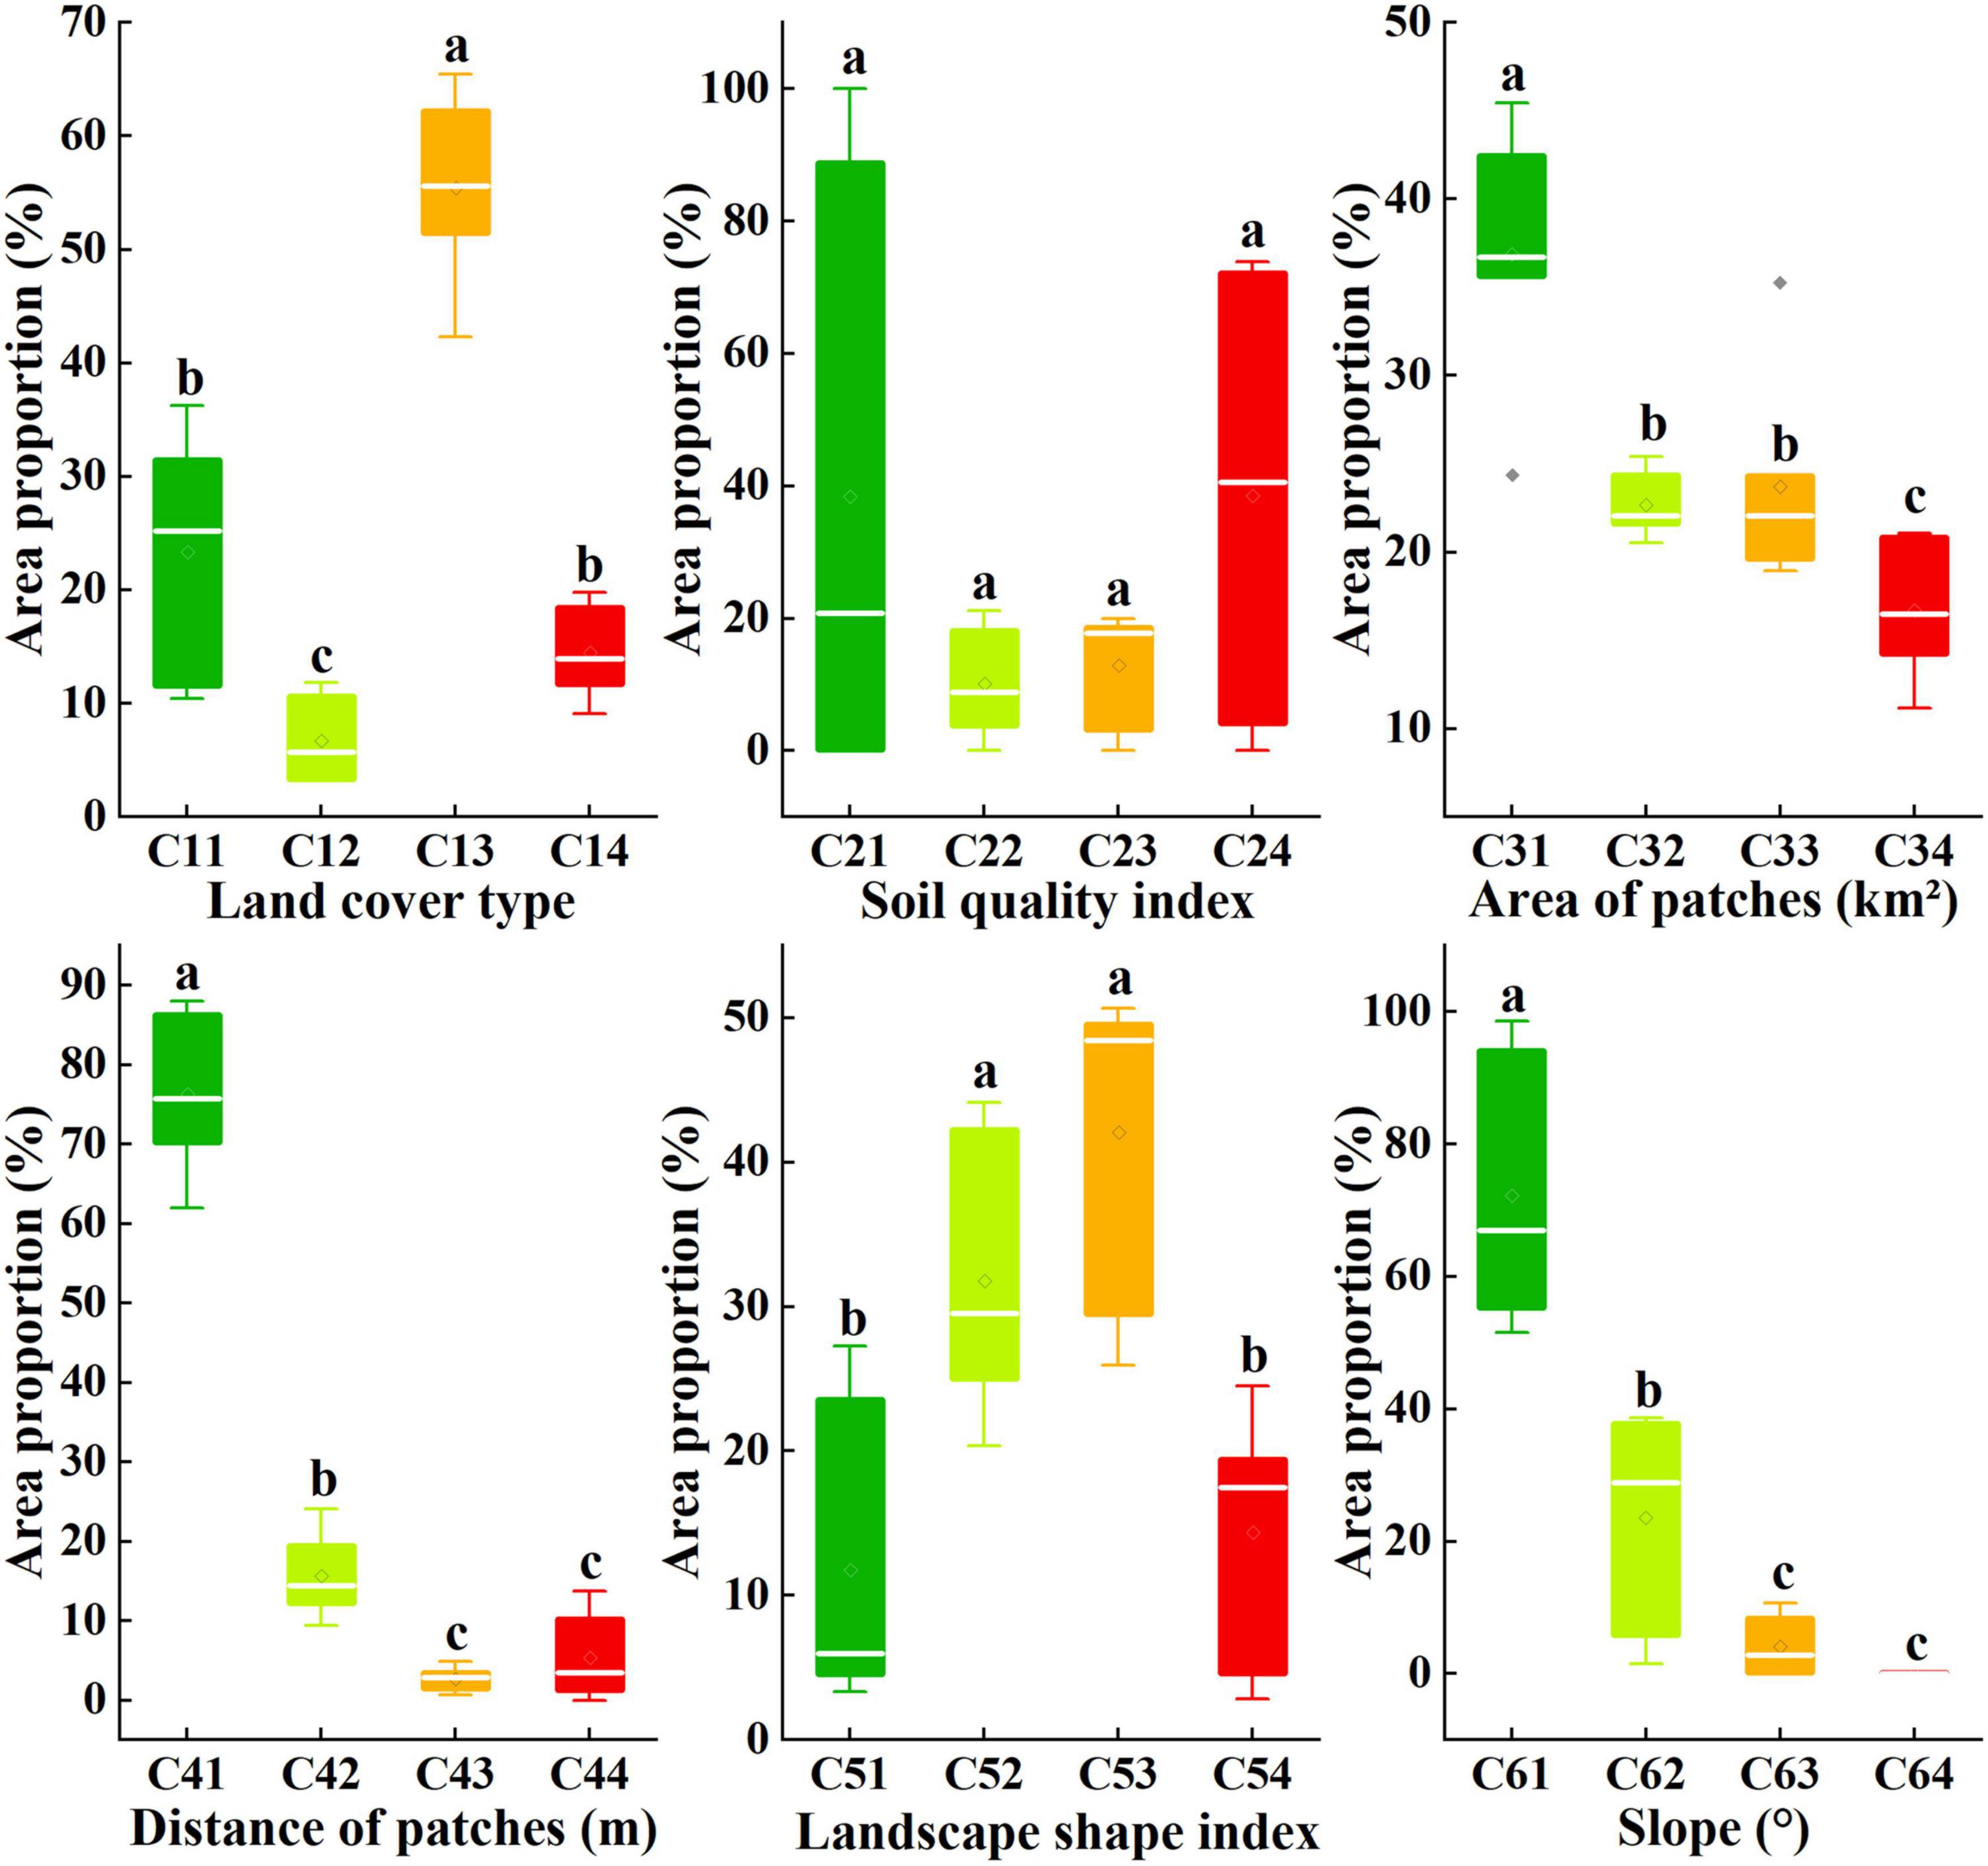
Figure 4. The differences in area proportions among the suitable classes of land cover type, soil quality, landscape metrics, and slope in Saihanba Nature Reserve, Hebei Province, China. The different letters show significant difference at p < 0.05 level; C11–C64 represent the indicators at the index layer. Refer to Table 2 for their specific meanings. The same applies below.
There was no significant difference in the area proportions among soil quality class (p > 0.05). The area with SQI lower than 0.25 was the largest, accounting for 39.19% of the total study area, while the second largest proportion, 36.24%, had an SQI greater than 0.6 (Figures 3, 4).
In terms of patch size, patches larger than 10 km2 covered 38.17% of the total area, which was significantly higher than patches equal to or smaller than 10 km2 (p < 0.05). Conversely, patches smaller than 1 km2 made up 16.88% of the total area, and their area was significantly lower than patches equal to or larger than 1 km2 (p < 0.05). However, there was no significant difference between patches of 1–5 and 5–10 km2 (p > 0.05). The majority of patches, 75.92% of the total area, had distances less than 300 m, which was significantly higher than patches with distances greater than or equal to 300 m (p < 0.05). Patches with distances between 300 and 750 m accounted for 15.66% of the total area, and their area was significantly larger than patches with distances greater than 750 m (p < 0.05). Regarding the LSI, patches with LSI values between 1.6 and 1.9 had the highest occurrence, and accounted for 42.91% of the total study area. The area of patches with LSI values less than 1.6 or greater than 2.2 was significantly low (p < 0.05) (Figures 3, 4).
The area of patches with slope less than 15° accounted for 71.38% of the total area, which was significantly higher than that of patches with slope equal to or greater than 15° (p < 0.05). However, the area of patches with slope between 15° and 25° was significantly lower than that of patches with slope less than 15°. The area of patches with slope greater than or equal to 25° was significantly lower than that of patches with slope less than 25° (p < 0.05) (Figures 3, 4).
3.2 Forest landscape restoration suitability evaluation
Figure 5 shows that the overall suitability of FLR was good, presenting a tendency of gradually decreasing suitability from west to east. The suitable restoration area covered 519.20 km2, accounting for 55.55% of the study area, which was significantly higher than the moderately suitable, marginally suitable, and unsuitable areas (p < 0.05). The suitable restoration areas were mainly concentrated in the western part of the study area and scattered distribution in the eastern region. The dominant land cover type in these areas was natural secondary forest, characterized by high soil fertility, large patch sizes, close patch distances, complex patch shapes, and gentle slopes.
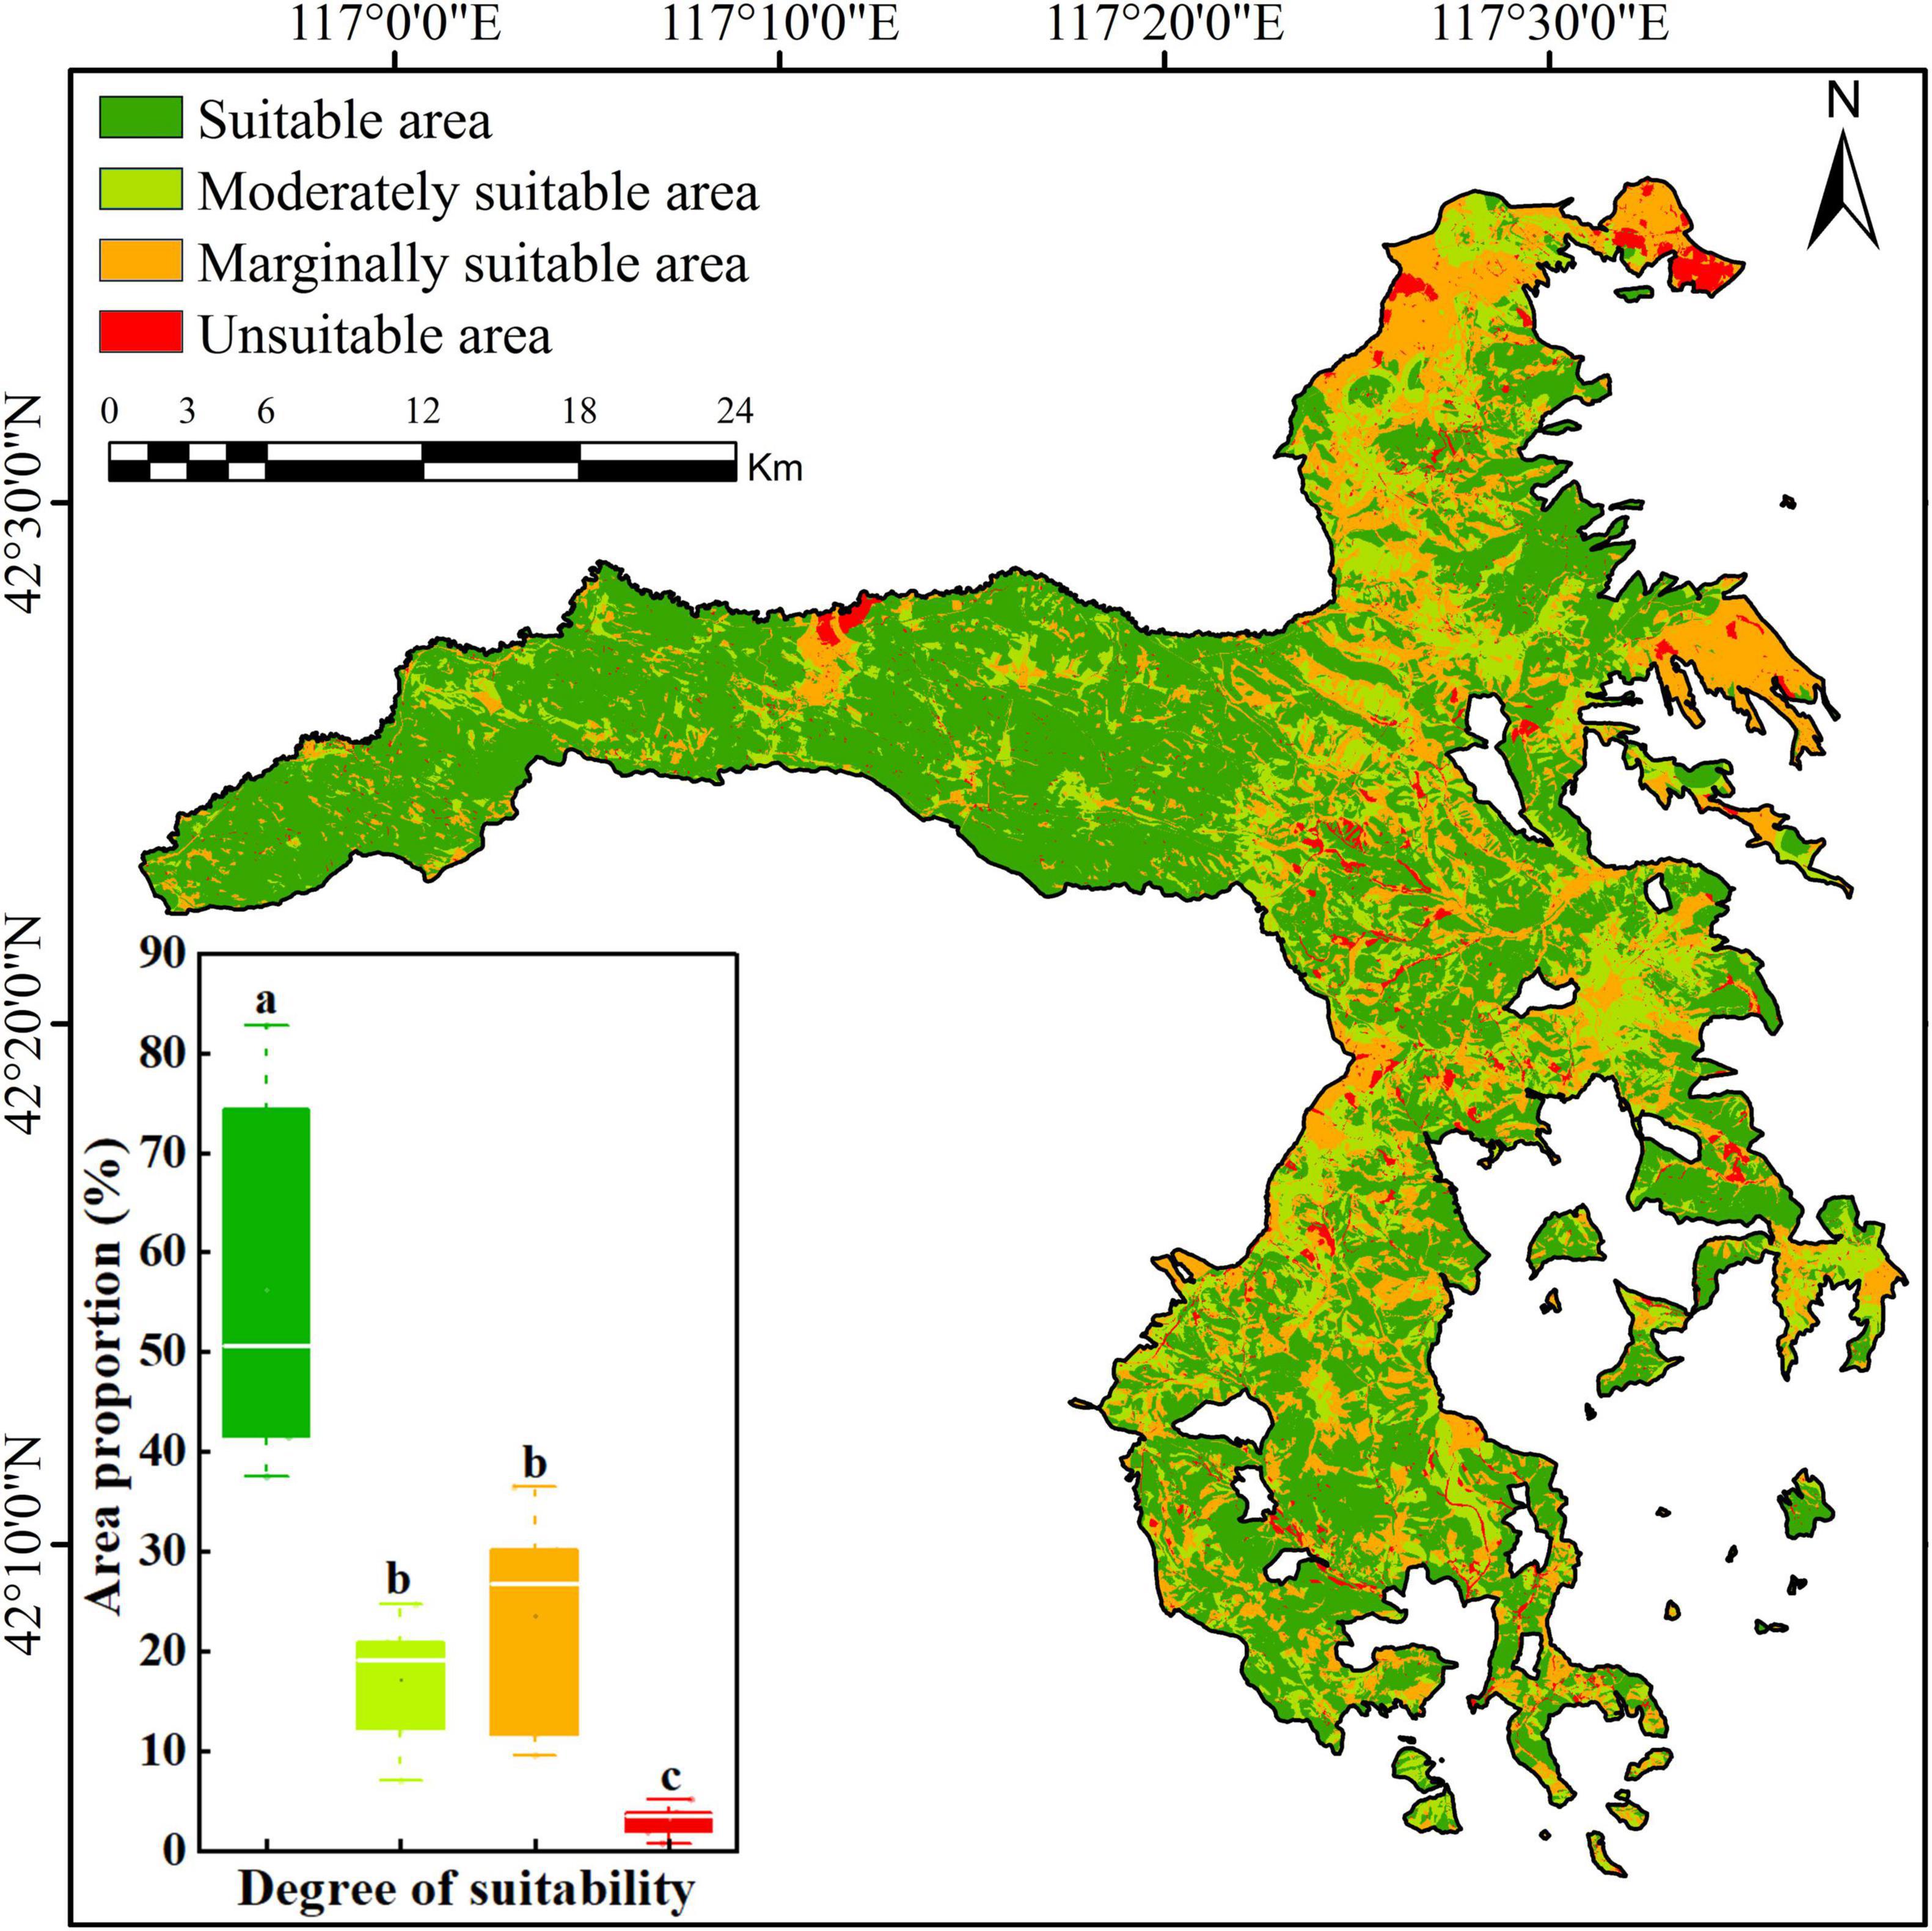
Figure 5. Suitability for forest landscape restoration in Saihanba Nature Reserve, Hebei Province, China. The different letters show significant differences among the suitable classes at a significance level of p < 0.05 in boxplot.
The moderately and marginally suitable restoration areas covered 161.72 and 223.96 km2, accounting for 17.30% and 23.96% of the total study area, respectively. These areas were primarily scattered in the eastern part of the study area, and the main land cover type was plantation. In these areas, the patches were characterized by close distances, low soil fertility, small patch sizes, and steep slopes.
The unsuitable restoration area covered 29.74 km2, accounting for 3.18% of the total study area, which was significantly lower than the other types (p < 0.05). It was primarily located in the northeastern edge of the study area. Among these areas, other land cover types occupied 85.94% of the area. Plantation patches in this region were limited by the combined effects of low soil fertility, small patch sizes, long patch distances, regular patch shapes, and steeper slopes, making FLR more challenging.
3.3 Suitability characteristics of important factors
Natural secondary forests had the largest area suitable for restoration (226 km2), accounting for 43.53% of the suitable restoration area, followed by plantations, shrub meadows, and others, accounting for 42%, 8.7%, and 5.76% of the suitable restoration area, respectively. The area of plantations in the moderately and marginally suitable restoration areas reached 91.40% and 62.07%, respectively. However, only 0.39% of natural secondary forests were classified as moderately suitable for restoration (Figure 6).
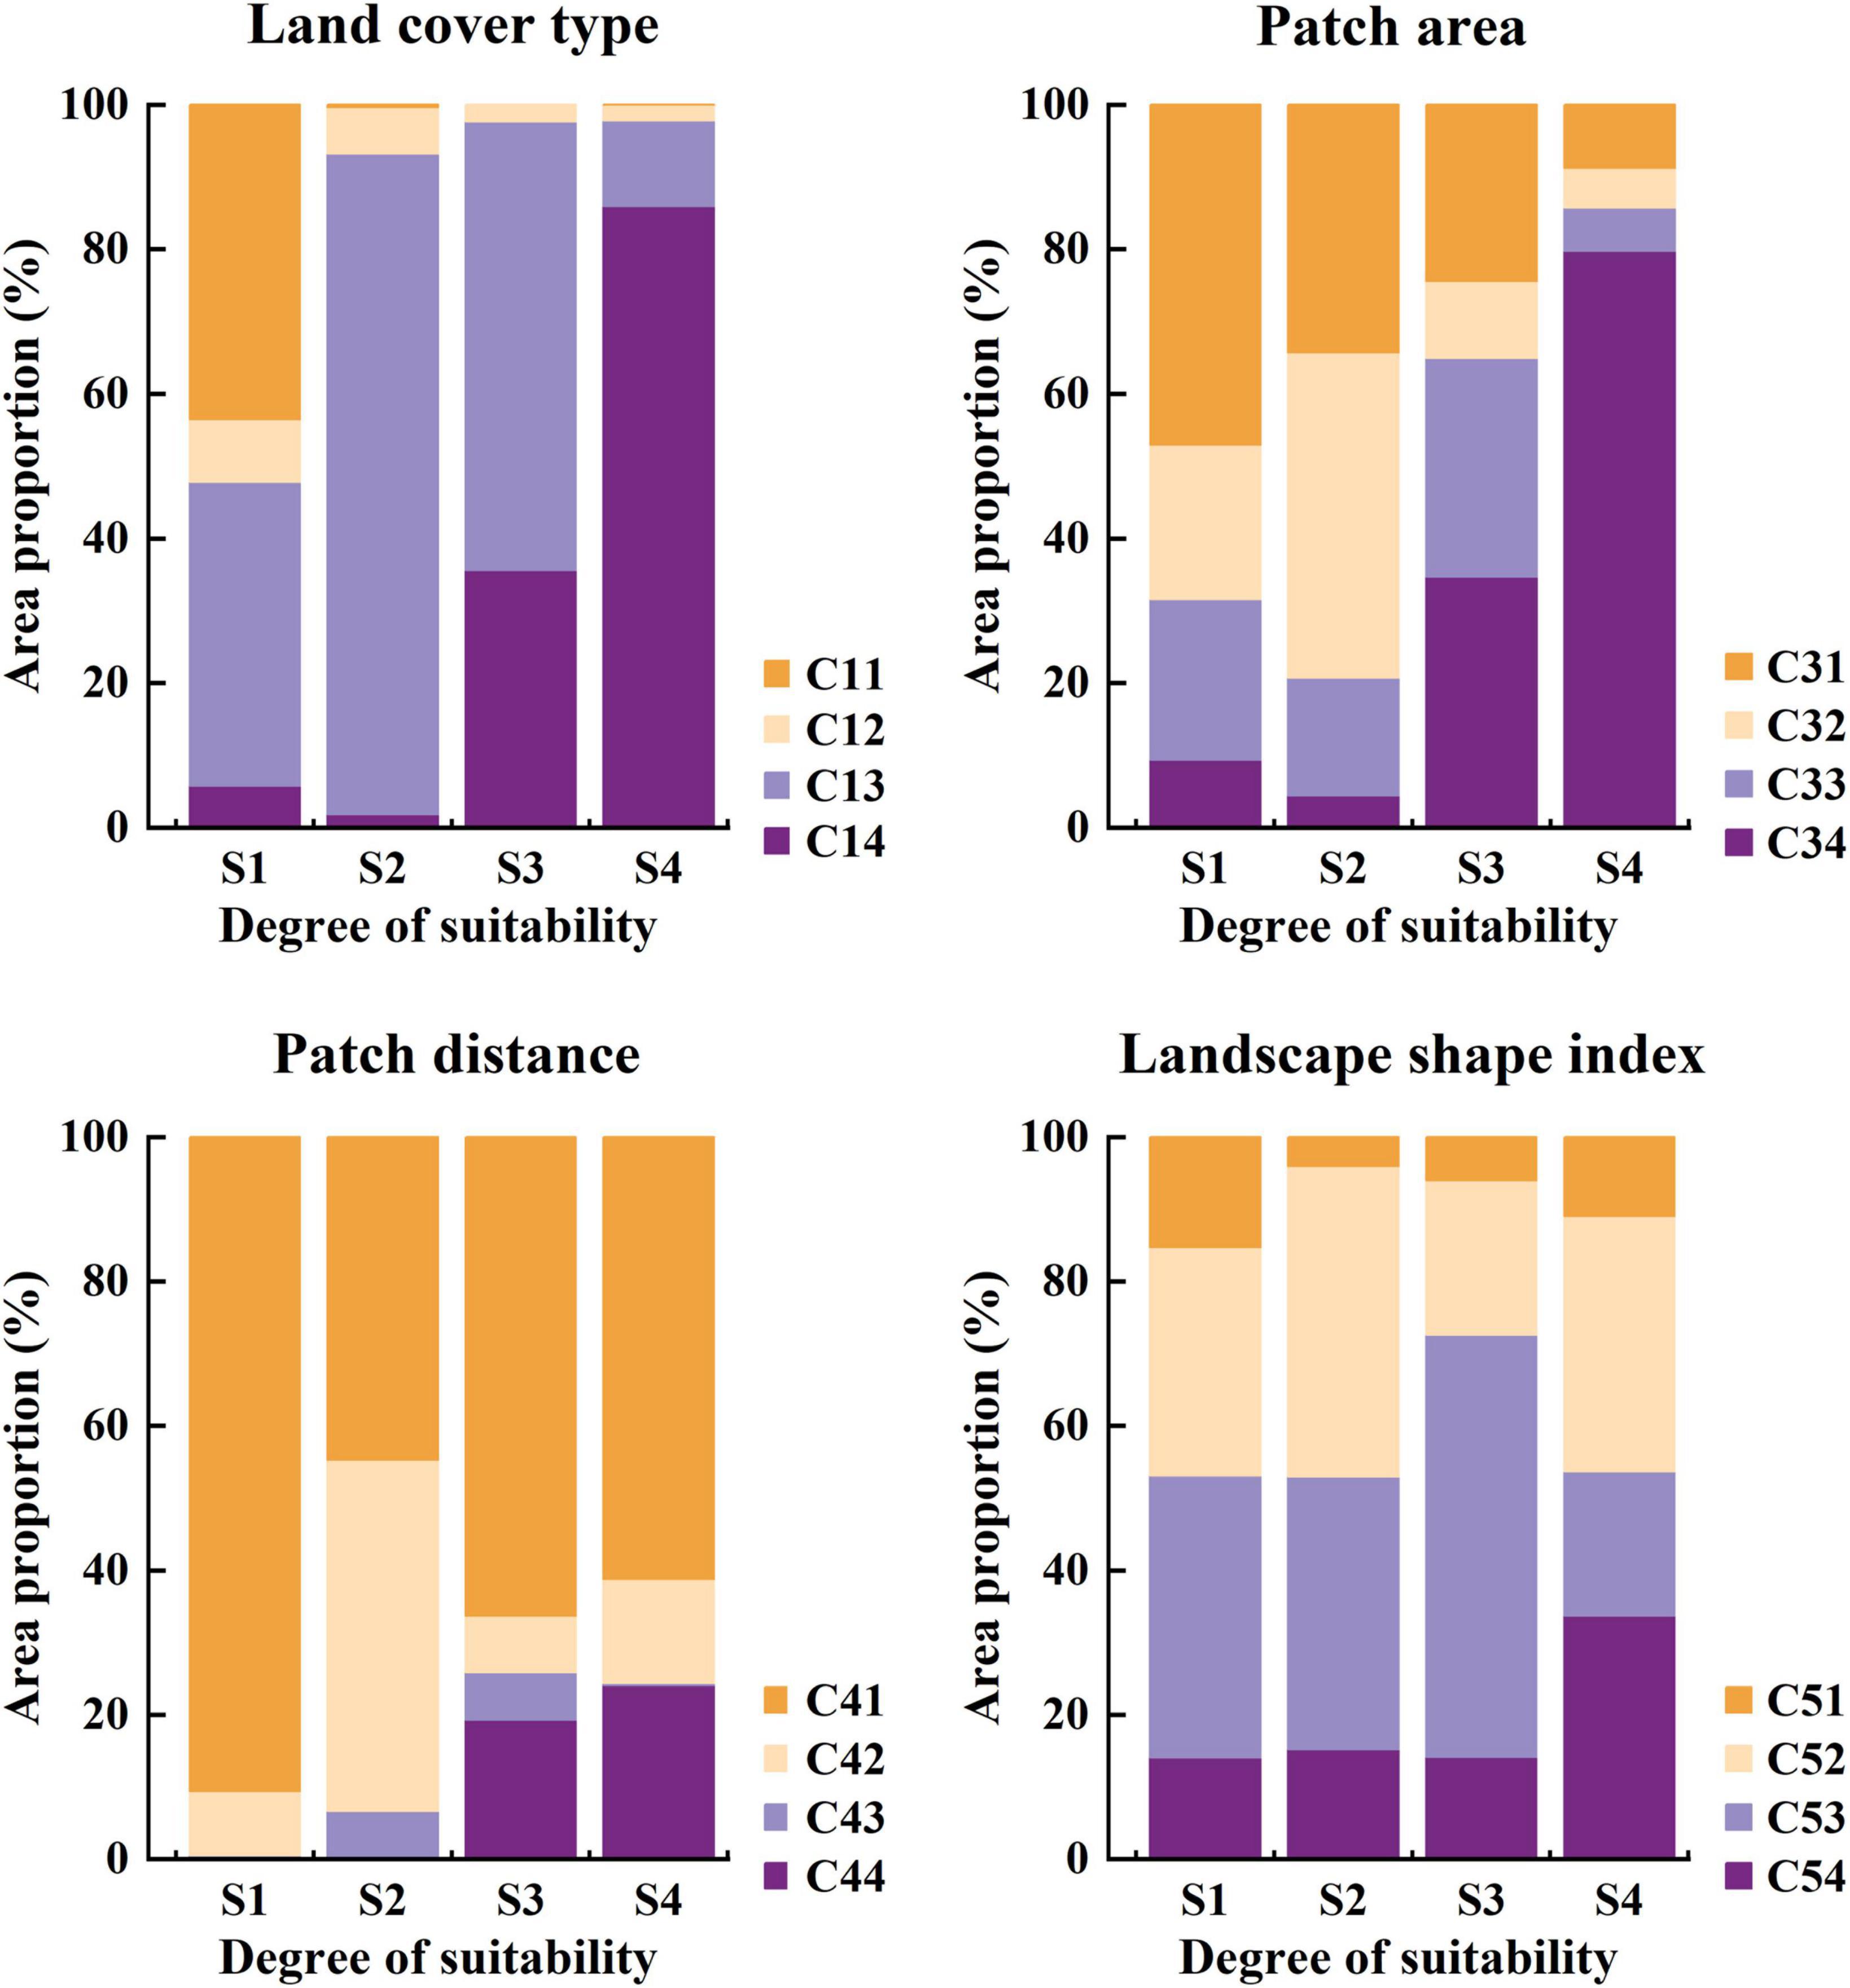
Figure 6. The area proportions of the sub-classes of land cover type, patch area, patch distance, and landscape shape index at corresponding suitable level.
In terms of patch sizes in the suitable restoration area, about half of the patches were larger than 10 km2, followed by patches with an area of 1–5 and 5–10 km2, accounting for 22.19% and 21.40% of the suitable restoration area, respectively. Patches smaller than 1 km2 accounted for only 9.35% of the suitable restoration area. In the moderately suitable restoration area, the majority of patches (45%) fell within the 5–10 km2 range. For the marginally and unsuitable restoration areas, there was a gradual increase in the proportion of patches smaller than 1 km2, accounting for 34.65% and 79.76%, respectively (Figure 6).
When examining patch distances, the suitable restoration area had the largest number of patches with a distance of less than 300 m, accounting for 90.62% of the suitable restoration area. In the moderately suitable restoration area, patches with distances of 300–750 m were the most prevalent, accounting for 48.64% of this area. As for the marginally and unsuitable restoration areas, the proportion of patches with distances greater than 750 m gradually increased (Figure 6).
Regarding the LSI, patches with an LSI of 1.9–2.2 were more common in the suitable and moderately suitable restoration areas, accounting for 31.61% and 42.95% of these areas, respectively. The proportion of patches with an LSI greater than 2.2 gradually decreased in these areas. In the marginally suitable and unsuitable areas, there were more patches with LSIs of 1.6–1.9 or less than 1.6, comprising 58.47% and 33.67% of these areas, respectively (Figure 6).
4 Discussion
Identifying priority areas for FLR is a crucial task (Mansourian et al., 2006). At the landscape scale, factors such as land cover type, landscape structure, soil quality, and topography significantly influence the suitability of FLR. The evaluation results indicated that suitable restoration areas were predominantly concentrated in the western part of the study area and scattered distribution in the eastern part. The land cover types in these areas are mainly natural secondary forests, followed by plantation, with no significant difference in their proportions (Figures 3, 6). This may be because both land cover types play a crucial role in the conservation of species diversity. Natural secondary forests exhibit strong adaptability and a relatively stable stand structure. There is substantial evidence that plantations can provide habitats for certain endangered species and contribute to the conservation of species diversity through various mechanisms (Brockerhoff et al., 2008). In our study area, endangered species such as Paris verticillata M.-Bieb, Rhodiola rosea L., Aquila clanga Pallas, and Cervus elaphus Linnaeus have been identified as beneficiaries of these plantation (Du et al., 2020). However, plantations often exhibit extensive fragmentation, which restricts species migration and hinders the conservation of species-diversity (Mensah et al., 2020). Therefore, establishing artificial mixed forests and adjusting their landscape patterns has recently been a key focus of landscape restoration (Löf et al., 2019; Stanturf and Mansourian, 2020). The specific characteristics of the suitable restoration areas, including large patch area, proximity to natural secondary forests, and complex patch shape (Figures 3, 6), align with the principles of island biogeography theory and are consistent with the findings of Diniz et al. (2023), indicating that closely connected patches are potential candidates for FLR. The relatively low slope of the suitable restoration areas (Figure 3) may be due to the fact that gentle sloping areas can offer diverse ecological niches for various species, thereby facilitating species dispersion and promoting higher species biodiversity (Wang et al., 2018). As slope steepness increases, water and nutrient loss escalate, leading to a gradual decrease in species numbers (Li et al., 2013). In FLR projects, priority should be given to these patches, focusing on identifying and establishing ecological corridors among suitable restoration areas. This approach aims to create continuous habitat areas, establishes pathways for plant and animal migration and dispersal, and enhances species diversity conservation with relative lower effort (Fahrig et al., 2022). This is similar to the viewpoint of Volis (2018) who suggests that priority should be given to changing the minimum, in other words, focusing on habitats that are currently in the best condition. Moderate and marginally suitable restoration areas were scattered in the eastern and northern parts of the study area, mainly comprising plantations. These patches were in close proximity to natural secondary forest but possessed limitations such as low soil fertility, small patch sizes, regular patch shapes, and steep slopes (Figures 3, 6). These factors imposed challenges for conserving species diversity. There were limited areas unsuitable for restoration, mainly concentrated in the northeastern edge of the study area, where the main land cover type was classified as “other” (Figures 3, 6). These areas mainly consisted of patches influenced by human activities, such as construction land, characterized by regular patch shapes, small patch areas, and frequently human disturbances. These factors hinder the migration and dispersal of some species and do not contribute to landscape functionality or species diversity conservation (O’Neill et al., 1997), classifying them as unsuitable for restoration.
In this study, the FLR evaluation was mainly performed by using the matter-element model. Compared with the traditional overlay analysis, the calculation of the correlation function by the matter-element model is dimensionless, which can avoid the inaccurate evaluation results caused by the inappropriate method of standardizing the data. Additionally, the computation of the comprehensive correlation degree is based on the calculation of the correlation degree for each level of suitability of the evaluation index. The level corresponding to the highest value of the comprehensive correlation degree is then chosen as the suitable level of the evaluation unit. This approach effectively minimizes the impact of subjectivity in the suitable level classification, enhancing the scientific accuracy of FLR suitability evaluations. Additionally, this method is characterized by its ease of computation (Su and Chen, 2005). Compared to other methods, the matter-element model not only facilitates a comprehensive assessment of the target, but also enables separate evaluations of each indicator, thereby offering more information (Gong et al., 2012). This approach has found extensive use in urban planning (Gong et al., 2012), the assessment of farmland quality, the evaluation of ecological vulnerable areas (Qi et al., 2020), and reclamation efforts in mining areas (Liu et al., 2022), as well as various other contexts. Furthermore, there is significant potential for its extended application and exploration in areas such as the selection of evaluation criteria, the establishment of thresholds, the universality of correlation functions in the matter-element analysis method, and its integration with advanced geographic information technology and big data analysis methods. The AHP method is a well-established technique for determining weights of multiple factors and assessing their consistency in the presence of conflicting criteria (Valente and Vettorazzi, 2008). However, it is important to limit the number of factors used in the evaluation to avoid difficulties in determining weight values and solving complex judgment matrix eigenvalues and eigenvectors. In future research, this issue can potentially be addressed by employing fuzzy hierarchical analysis to optimize the evaluation process.
The dominant factors influencing FLR vary at different scales. At a large scale, factors such as climate and altitude directly affect the distribution patterns of species diversity (Kreft and Jetz, 2007), consequently impacting FLR. In our study, we did not incorporate the elevation factor into the assessment framework. In future research, it is advisable to consider relevant environmental factors for a more comprehensive analysis. At the landscape scale, the prioritization of FLR presents a multi-objective planning challenge that involves nature conservation and other problems, particularly socio-economic issues (Höhl et al., 2020). Socio-economic factors and stakeholder involvement can considerably influence FLR in the long term (Kremen and Merenlender, 2018). Since the Saihanba Nature Reserve is primarily a natural landscape and socio-economic factors are more closely related to the choice of restoration measures (Beatty et al., 2018b), natural factors were more frequently considered than socio-economic factors in the evaluation process. Different stakeholders hold distinct perspectives on FLR. Implementers of landscape restoration are primarily concerned about the regional scope and technical implementation methods, while policy makers prioritize factors such as budgetary requirements, funding sources, benefits of landscape restoration, social benefits, and cost-effectiveness (Maginnis et al., 2014). Therefore, future efforts can collect various socio-economic information, including statistics and census data of government department (Wang D. et al., 2015), commercial data sources (Zhang and Zhou, 2018), as well as independent research initiatives data such as surveys or interviews with local scientists and farmers (Chen and Huang, 2020). Furthermore, integrating 3S (GIS, GPS, and RS) technologies (Wang et al., 2015b) can facilitate the acquisition of socio-economic data, which can then be incorporated into the assessment framework. It is essential to consider the interests of different stakeholder groups to conduct forest landscape suitability assessments from a more scientific and comprehensive perspective. In this study, species diversity was substituted indirectly with vegetation types due to data limitations. To enhance the precision of assessment results in future research, it is essential to conduct field surveys on species diversity to improve the accuracy in FLR evaluations.
5 Conclusion
Determining priority restoration areas is a crucial topic in FLR, and the conservation of species diversity is an inherent requirement in this endeavor. In this study, we focus on the Saihanba Nature Reserve and develop a suitability evaluation framework system for FLR. By integrating factors such as land cover type, landscape structure, soil quality, and topography, our aim is to analyze the distribution pattern of suitability for FLR, with a specific emphasis on conserving species diversity. The findings of this study reveal that the suitable restoration area in the Saihanba Nature Reserve encompasses approximately 519.20 km2, which accounts for 55.55% of the total region. The areas classified as moderate, marginally suitable, and unsuitable for FLR occupy 17.30%, 23.96%, and 3.18% of the study area, respectively. In the suitable restoration area, the predominant land cover type is natural secondary forest, characterized by large patch areas, close patch distances, and complex patch shapes. In conclusion, these findings suggest that the potential for FLR in this area is enormous. Meanwhile, land cover type and landscape metrics (patch area, patch distance, and patch shape) are the key factors influencing FLR in the Saihanba region. The quantitative and visual results of this FLR suitability evaluation provide valuable insights into identifying patches with the highest conservation value in terms of species diversity in the study area. Simultaneously, these findings serve as a scientific foundation for evaluating FLR suitability in other regions. Future FLR should focus on protect large and complex shaped patches of natural secondary forests for better conservation of species diversity.
Data availability statement
The raw data supporting the conclusions of this article will be made available by the authors, without undue reservation.
Author contributions
ZZ, NF, and YW designed the study and performed the formal analysis. NF performed the software analysis and wrote the first draft of the manuscript. XY, JL, QL, and JK contributed the data curation. ZZ contributed to the writing, review, and editing. All authors contributed to the article and approved the submitted version.
Funding
The author(s) declare financial support was received for the research, authorship, and/or publication of this article. This research was financially supported by the National Key Research and Development Plan of China (2022YFD2200503), the Hebei Province Research and Development Plan of China (22326803D), and the Hebei Province Forest and Grass Science and Technology Demonstration Project (TG [2022]018).
Acknowledgments
We thank our graduate students and many local staff, who have conducted the field investigation in the study area. Special thanks to the reviewers for their valuable comments.
Conflict of interest
The authors declare that the research was conducted in the absence of any commercial or financial relationships that could be construed as a potential conflict of interest.
Publisher’s note
All claims expressed in this article are solely those of the authors and do not necessarily represent those of their affiliated organizations, or those of the publisher, the editors and the reviewers. Any product that may be evaluated in this article, or claim that may be made by its manufacturer, is not guaranteed or endorsed by the publisher.
Footnotes
References
Askari, M. S., and Holden, N. M. (2014). Indices for quantitative evaluation of soil quality under grassland management. Geoderma 23, 131–142. doi: 10.1016/j.geoderma.2014.04.019
Atkinson, D. M., Deadman, P., Dudycha, D., and Traynor, S. (2005). Multi-criteria evaluation and least cost path analysis for an arctic all-weather road. Appl. Geogr. 25, 287–307. doi: 10.1016/j.apgeog.2005.08.001
Beatty, C. R., Cox, N. A., Kuzee, M. E., and Nathan, R. (2018a). Biodiversity Guidelines for Forest Landscape Restoration Opportunities Assessments. Gland: IUCN, International Union for Conservation o-f Nature.
Beatty, C. R., Raes, L., Vogl, A. L., Hawthorne, P. L., and Prado, K. M. (2018b). Landscapes, at your Service: Applications of the Restoration Opportunities Optimization Tool (ROOT). Gland: IUCN.
Brockerhoff, E. G., Jactel, H., Parrotta, J. A., Quine, C. P., and Sayer, J. (2008). Plantation forests and biodiversity: Oxymoron or opportunity? Biodivers. Conserv. 17, 925–951. doi: 10.1007/s10531-008-9380-x
Cai, W. (1999). Extension theory and its application. Chin. Sci. Bull. 44, 1538–1548. doi: 10.1007/BF02886090
Chazdon, R. L., Peres, C. A., Dent, D., Sheil, D., Lugo, A. E., Lamb, D., et al. (2009). The potential for species conservation in tropical secondary forests. Conserv. Biol. 23, 1406–1417. doi: 10.1111/j.1523-1739.2009.01338.x
Chen, J., Liang, G. F., and Ding, S. Y. (2012). Multi-scale effects for landscape metrics and species diversity under the different disturbcance:a case study of Gongyi City. Acta Ecol. Sin. 32, 3773–3781. doi: 10.5846/stxb201310302618
Chen, L. Y., and Huang, G. L. (2020). Socioeconomic factors in global long-term urban ecological studies: Indicators, sources and applications. Acta Ecol. Sin. 40, 6678–6686. doi: 10.5846/stxb201907011381
Chen, M. Y., Zeng, L. X., Huang, Z. L., Lei, L., Shen, Y. F., and Xiao, W. F. (2021). Evaluating suitability of land for forest landscape restoration: A case study of Three Gorges Reservoir, China. Ecol. Indic. 127:107765. doi: 10.1016/j.ecolind.2021.107765
Chen, X. Y., Li, W. G., Pan, Q. M., and Yang, M. S. (1996). Studies on spacial distribution and the spread distance of pollen in Chinese Fir Seed Orchards. J. Beijing For. Univ. 18, 24–30. doi: 10.1007/BF02951625
Chen, Y. L., Wu, B. G., Chen, D., and Qi, Y. (2019). Using machine learning to assess site suitability for afforestation with particular species. Forests 10, 739–761. doi: 10.3390/f10090739
Cook, E. A. (2002). Landscape structure indices for assessing urban ecological networks. Landsc. Urban Plan. 58, 269–280. doi: 10.1016/S0169-2046(01)00226-2
Copenhaver-Parry, P. E., and Cannon, E. (2016). The relative influences of climate and competition on tree growth along montane ecotones in the Rocky Mountains. Oecologia 182, 13–25. doi: 10.1007/s00442-016-3565-x
Darwiche-Criado, N., Sorando, R., Eismann, S. G., and Comín, F. A. (2017). Comparing two multi-criteria methods for prioritizing wetland restoration and creation sites based on ecological, biophysical and socio-economic factors. Water Resour. Manage. 31, 1227–1241. doi: 10.1007/s11269-017-1572-2
Dawson, T. P., Jackson, S. T., House, J. I., Prentice, I. C., and Mace, G. M. (2011). Beyond predictions: Biodiversity conservation in a changing climate. Science 332, 53–58. doi: 10.1126/science.1200303
Diniz, ÉS., Mota, P. H. S., Reis, J. P., da Silva Costa, W., de Paiva, E. V., de Lana, J. M., et al. (2023). Connectivity value of Atlantic forest fragments: Pathways towards enhancing biodiversity conservation. Braz. J. Bot. 47, 249–259. doi: 10.1007/s40415-023-00970-0
Dong, C. F., Liang, G. F., Ding, S. Y., Lu, X. L., and Tang, X. (2014). Multi-scale effects for landscape metrics and species diversity under the different disturbance:a case study of Gongyi City. Acta Ecol. Sin. 34, 3444–3451. doi: 10.5846/stxb201310302618
Dong, X. T., Zhang, J., Zhang, Z. D., and Huang, X. R. (2021). Effects of tree species interaction, stand density, and tree size on the productivity of Larix principis-rupprechtii. Chin. J. Appl. Ecol. 32, 2722–2728. doi: 10.13287/j.1001-9332.202108.006
Du, X. L., Zhou, J. B., and Shi, W. B. (2020). Present situation and protectioncountermeasures of Saihanba wetland resources. Inner Mongolia For. Invest. Des. 43, 60–62. doi: 10.13387/j.cnki.nmld.2020.02.019
Fahrig, L. (2003). Effects of habitat fragmentation on biodiversity. Annu. Rev. Ecol. Evol. Syst. 34, 487–515. doi: 10.1146/annurev.ecolsys.34.011802.132419
Fahrig, L. (2013). Rethinking patch size and isolation effects: The habitat amount hypothesis. J. Biogeogr. 40, 1649–1663. doi: 10.1111/jbi.12130
Fahrig, L., Watling, J. I., Arnillas, C. A., Arroyo-Rodríguez, V., Jörger-Hickfang, T., Müller, J., et al. (2022). Resolving the sloss dilemma for biodiversity conservation: A research agenda. Biol. Rev. 97, 99–114. doi: 10.1111/brv.12792
Fan, B. M., and Li, Z. Y. (2008). Introduction to the history of forest ecology in China. Beijing: Science Press.
Ge, Z. X., Sun, G. L., Yuan, Y., Huang, X. R., and Zhang, Z. D. (2017). Herbaceous plant species diversity and functional diversity in the forest-steppe zone of Hebei, China. Acta Pratac. Sin. 26, 35–44. doi: 10.11686/cyxb2017015
Ge, Z. X., Yuan, M. Y., Shan, B. W., Huang, X. R., and Zhang, Z. D. (2020). Evaluation of management modes on Larix principis-rupprechtii plantations in Saihanba of Hebei Province, China. For. Res. 33, 38–47. doi: 10.13275/j.cnki.lykxyj.2020.05.005
Geng, S. B., Shi, P. L., Zong, N., and Zhu, W. R. (2019). Agricultural land suitability of production space in the Taihang Mountains, China. Acta Geogr. Sin. 29, 1024–1038. doi: 10.1007/s11769-019-1075-6
Gong, J. Z., Liu, Y. S., and Chen, W. L. (2012). Land suitability evaluation for development using a matter-element model: A case study in Zengcheng, Guangzhou, China. Land Use Policy 29, 464–472. doi: 10.1016/j.landusepol.2011.09.005
Gustafson, E. J. (1998). Quantifying landscape spatial pattern: What Is the state of the art? Ecosystems 1, 143–156. doi: 10.1007/s100219900011
Haila, Y. (2002). A conceptual genealogy of fragmentation research: From island biogeography to landscape ecology. Ecol. Appl. 12, 321–334. doi: 10.2307/3060944
Higgins, P. A. T. (2007). Biodiversity loss under existing land use and climate change: An illustration using northern South America. Glob. Ecol. Biogeogr. 16, 197–204. doi: 10.1111/j.1466-8238.2006.00278.x
Höhl, M., Ahimbisibwe, V., Stanturf, J. A., Elsasser, P., Kleine, M., and Bolte, A. (2020). Forest landscape restoration—what generates failure and success? Forests 11:938. doi: 10.3390/f11090938
Hu, G., Jin, Y., Liu, J., and Yu, M. (2014). Functional diversity versus species diversity: Relationships with habitat heterogeneity at multiple scales in a subtropical evergreen broad-leaved forest. Ecol. Res. 29, 897–903. doi: 10.1007/s11284-014-1178-6
Kreft, H., and Jetz, W. (2007). Global patterns and determinants of vascular plant diversity. Proc. Natl. Acad. Sci. U. S. A. 104, 5925–5930. doi: 10.1073/pnas.0608361104
Kremen, C., and Merenlender, A. M. (2018). Landscapes that work for biodiversity and people. Science 362:eaau6020. doi: 10.1126/science.aau6020
Lambin, E. F., Turner, B. L., Geist, H. J., Agbola, S. B., Angelsen, A., Bruce, J. W., et al. (2001). The causes of land-use and land-cover change: Moving beyond the myths. Global Environ. Change 11, 261–269. doi: 10.1016/S0959-3780(01)00007-3
Li, B., Yang, G., Wan, R., and Hoermann, G. (2017). Dynamic water quality evaluation based on fuzzy matter-element model and functional data analysis, a case study in Poyang Lake. Environ. Sci. Pollut. Res. 24, 19138–19148. doi: 10.1007/s11356-017-9371-0
Li, C. J., Sun, Q., Chen, Z., Pang, L., Hu, X., and Long, F. (2013). Effects of roadside slope gradient on plant diversity during revegetation. Bull. Bot. Res. 33, 477–483. doi: 10.7525/j.issn.1673-5102.2013.04.015
Li, L., Gou, M., Wang, N., La, L., and Liu, C. (2021). Do ecological restoration programs reduce forest fragmentation? case study of the Three Gorges Reservoir Area, China. Ecol. Eng. 172:106410. doi: 10.1016/j.ecoleng.2021.106410
Li, W. B., Lü, Z. G., Huang, X. R., and Zhang, Z. D. (2021b). Predicting spatial distribution of site index for Larix principis-rupprechtii plantations in the Northern Hebei Province. Sci. Silv. Sin. 57, 79–89. doi: 10.11707/j.1001-7488.20210308
Li, Y., Liu, X. J., Xu, W. B., Bongers, F. J., Bao, W. K., Chen, B., et al. (2020). Effects of diversity, climate and litter on soil organic carbon storage in subtropical forests. For. Ecol. Manage. 476:118479. doi: 10.1016/j.foreco.2020.118479
Li, Y. F., and Li, D. (2014). Assessment and forecast of Beijing and Shanghai’s urban ecosystem health. Sci. Total Environ. 487, 154–163. doi: 10.1016/j.scitotenv.2014.03.139
Lindenmayer, D., Hobbs, R. J., Montague-Drake, R., Alexandra, J., Bennett, A., Burgman, M., et al. (2008). A checklist for ecological management of landscapes for conservation. Ecol. Lett. 11, 78–91. doi: 10.1111/j.1461-0248.2007.01114.x
Liu, C., Xu, L. R., Li, D. L., Huang, Y. R., Kang, J. M., Peng, B., et al. (2023). Spatiotemporal variations and determinants of supply-demand balance of ecosystem service in Saihanba Region, China. Forests 14:1100. doi: 10.3390/f14061100
Liu, X., Wang, X. H., Huang, D. J., and Yi, Z. B. (2022). Potential evaluation of land reclamation to grassland in an open——pit mine based on game theory and matter element model. Min. Res. Dev. 42, 147–152. doi: 10.13827/j.cnki.kyyk.2022.04.006
Liu, Y. X., Wang, Y. L., Peng, J., Wei, H., Song, Z. Q., and Zhang, X. F. (2015). Land ecological suitability assessment for forest coupled with the resilience perspective: A case study in Wangqing county,Jilin province,China. Acta Geogr. Sin. 70, 476–487. doi: 10.11821/dlxb201503010
Löf, M., Madsen, P., Metslaid, M., Witzell, J., and Jacobs, D. F. (2019). Restoring forests: Regeneration and ecosystem function for the future. New For. 50, 139–151. doi: 10.1007/s11056-019-09713-0
Maginnis, S., Laestadius, L., Verdone, M., DeWitt, S., Saint-Laurent, C., Rietbergen-McCracken, J., et al. (2014). A Guide to the Restoration Opportunities Assessment Methodology (ROAM): Assessing Forest Landscape Restoration Opportunities at the National or Sub-National Level. Gland: IUCN.
Mansourian, S., Vallauri, D., and Dudley, N. (2006). Forest restoration in landscapes: Beyond planting trees. Restor. Ecol. 14, 322–323. doi: 10.1111/j.1526-100X.2006.00138.x
Méndez-Toribio, M., Meave, J. A., Zermeño-Hernández, I., and Ibarra-Manríquez, G. (2016). Effects of slope aspect and topographic position on environmental variables, disturbance regime and tree community attributes in a seasonal tropical dry forest. J. Veg. Sci. 27, 1094–1103. doi: 10.1111/jvs.12455
Meng, Q. F. (2006). Discussion on effects of plantation on biodiversity conservation. Wld. For. Res. 19, 1–6. doi: 10.13348/j.cnki.sjlyyj.2006.05.001
Mensah, S., Salako, V. K., and Seifert, T. (2020). Structural complexity and large-sized trees explain shifting species richness and carbon relationship across vegetation types. Funct. Ecol. 34, 1731–1745. doi: 10.1111/1365-2435.13585
Muneepeerakul, R., Bertuzzo, E., Rinaldo, A., and Rodriguez-Iturbe, I. (2019). Evolving biodiversity patterns in changing river networks. J. Theor. Biol. 462, 418–424. doi: 10.1016/j.jtbi.2018.11.021
Newbold, T., Hudson, L. N., Hill, S. L. L., Contu, S., Lysenko, I., Senior, R. A., et al. (2015). Global effects of land use on local terrestrial biodiversity. Nature 520, 45–50. doi: 10.1038/nature14324
Noulèkoun, F., Mensah, S., Birhane, E., Son, Y., and Khamzina, A. (2021). Forest landscape restoration under global environmental change: Challenges and a future roadmap. Forests 12, 276–289. doi: 10.3390/f12030276
O’Neill, R. V., Hunsaker, C. T., Jones, K. B., Riitters, K. H., Wickham, J. D., Schwartz, P. M., et al. (1997). Monitoring environmental quality at the landscape scale: Using landscape indicators to assess biotic diversity, watershed integrity, and landscape stability. BioScience 47, 513–519. doi: 10.2307/1313119
Orsi, F., and Geneletti, D. (2010). Identifying priority areas for forest landscape restoration in Chiapas (Mexico): An operational approach combining ecological and socioeconomic criteria. Landsc. Urban Plan. 94, 20–30. doi: 10.1016/j.landurbplan.2009.07.014
Pu, D. C., Zhang, Z. M., Long, T. F., and Niu, X. F. (2020). GABAM2010 accuracy assessment using stratified random sampling. J. Remote Sens. 24, 550–558. doi: 10.11834/jrs.20209171
Qi, P., Wang, X. J., Fan, W., Jiao, Y. P., and Wang, Y. Z. (2020). Evaluation of ecological security in Jiayuguan City based on matter element model. Ecol. Sci. 39, 259–267. doi: 10.14108/j.cnki.1008-8873.2020.04.032
Qian, H., and Ricklefs, R. E. (2000). Large-scale processes and the Asian bias in species diversity of temperate plants. Nature 407, 180–182. doi: 10.1038/35025052
Qin, P. Y., Yang, H. J., Jiang, F. L., Zhang, S. B., Tian, X. M., Huang, X. R., et al. (2016). Quantitative classification of natural plant communities in the saihanba national nature reserve, Hebei Province, China. Chin. J. Appl. Ecol. 27, 1383–1392. doi: 10.13287/j.1001-9332.201605.007
R Core Team (2021). R: A Language and Environment for Statistical Computing. Vienna: R Foundation for Statistical Computing
Sa, R., and Fan, W. (2023). Estimation of forest parameters in boreal artificial coniferous forests using landsat 8 and sentinel-2A. Remote Sens. 15:3605. doi: 10.3390/rs15143605
Saaty, T. L. (1977). A scaling method for priorities in hierarchical structures. J. Math. Psychol. 15, 234–281. doi: 10.1016/0022-2496(77)90033-5
Schulz, J. J., and Schröder, B. (2017). Identifying suitable multifunctional restoration areas for forest landscape restoration in Central Chile. Ecosphere 8:e01644. doi: 10.1002/ecs2.1644
Stanturf, J. A., and Mansourian, S. (2020). Forest landscape restoration: State of play. Roy. Soc. Open Sci. 7:201218. doi: 10.1098/rsos.201218
Su, H. M., and Chen, J. F. (2005). The application of matter element analysis in land suitability evaluation. J. Qufu Norm. Univ. 31, 115–119.
Su, M. R., Xie, H., Yue, W. C., Zhang, L. X., Yang, Z. F., and Chen, S. H. (2019). Urban ecosystem health evaluation for typical Chinese cities along the belt and road. Ecol. Indic. 101, 572–582. doi: 10.1016/j.ecolind.2019.01.070
Suding, K., Higgs, E., Palmer, M., Callicott, J. B., Anderson, C. B., Baker, M., et al. (2015). Committing to ecological restoration. Science 348, 638–640. doi: 10.1126/science.aaa4216
Swanson, F. J., Kratz, T. K., Caine, N., and Woodmansee, R. G. (1988). Landform effects on ecosystem patterns and processes. BioScience 38, 92–98. doi: 10.2307/1310614
Tang, J., Wang, C. Y., Lin, N. F., Li, Z. Y., Li, H. Y., and Mao, Z. L. (2009). Application of matter-element model in soil nutrient evaluation of ecological fragile region. Acta Geogr. Sin. 19, 168–176. doi: 10.1007/s11769-009-0168-z
Tian, X. M., Yan, H. X., Yuan, Y., Ge, Z. X., Huang, X. R., and Zhang, Z. D. (2016). Response of species richness to the fragmentation of vegetation landscape and its spatial variation scales in Saihanba Nature Reserve. Sci. Silv. Sin. 52, 13–21. doi: 10.11707/j.1001-7488.20161202
Valente, R. D. O. A., and Vettorazzi, C. A. (2008). Definition of priority areas for forest conservation through the ordered weighted averaging method. For. Ecol. Manage. 256, 1408–1417. doi: 10.1016/j.foreco.2008.07.006
Van Der Heijden, M. G. A., Bardgett, R. D., and Van Straalen, N. M. (2008). The unseen majority: Soil microbes as drivers of plant diversity and productivity in terrestrial ecosystems. Ecol. Lett. 11, 296–310. doi: 10.1111/j.1461-0248.2007.01139.x
Volis, S. (2018). “Plant conservation in the anthropocene: Definitely not win–win but maybe not lose–lose?,” in Encyclopedia of the Anthropocene, eds D. A. Dellasala and M. I. Goldstein (Oxford: Elsevier), 389–397.
Wang, D., Brown, G., and Liu, Y. (2015). The physical and non-physical factors that influence perceived access to urban parks. Landsc. Urban Plan. 133, 53–66. doi: 10.1016/j.landurbplan.2014.09.007
Wang, H. F., Qureshi, S., Knapp, S., Friedman, C. R., and Hubacek, K. (2015b). A basic assessment of residential plant diversity and its ecosystem services and disservices in Beijing, China. Appl. Geogr. 64, 121–131. doi: 10.1016/j.apgeog.2015.08.006
Wang, J. M., Xu, H., Li, Y. D., Lin, M. X., and Zhou, Z. (2018). Effects of topographic heterogeneity on community structure and diversity of woody plants in Jianfengling tropical montane rainforest. Sci. Silvae Sin. 54, 1–11. doi: 10.11707/j.1001-7488.20180101
Wang, Q., Li, S. Q., and Li, R. R. (2019). Evaluating water resource sustainability in Beijing, China: Combining PSR model and matter-element extension method. J. Cleaner Prod. 206, 171–179. doi: 10.1016/j.jclepro.2018.09.057
Wang, Z. L., Tian, M. H., and Li, H. X. (2009). Study on the System Reform and Sustainable Development of the State-Owned Forest Farms in New Period. Beijing: China Forestry Publishing House.
Wei, S. K., Xu, W. W., Zhang, Z. D., and Huang, X. R. (2022). Spatiotemporal scale effect of landscape pattern for natural vegetation in a forest-steppe zone of Hebei. Ecol. Sci. 41, 157–166. doi: 10.14108/j.cnki.1008-8873.2022.06.019
Wen, X. F., and Shen, X. H. (1990). Study on pollen dispersal of Larix principis-rupprechtii Mayr. J. Beijing For. Univ. 12, 68–75. doi: 10.13332/j.1000-1522.1990.04.011
Wu, J. G. (2000). Landscape Ecology——Pattern, Process, Scale and Hierarchy. Beijing: Higher Education Press.
Wu, X., Liu, S. L., Sun, Y. X., An, Y., Dong, S. K., and Liu, G. H. (2019). Ecological security evaluation based on entropy matter-element model: A case study of Kunming city, southwest China. Ecol. Indic. 102, 469–478. doi: 10.1016/j.ecolind.2019.02.057
Xu, W. W., Dong, X. T., Zhang, Z. D., and Huang, X. R. (2021). Spatiotemporal scale effect of vegetation landscape pattern in Saihanba Area. J. Northeast For. Univ. 49, 106–111. doi: 10.13759/j.cnki.dlxb.2021.01.020
Zhang, J., Zhao, J. M., Cheng, R. M., Ge, Z. X., and Zhang, Z. D. (2022). Effects of neighborhood competition and stand structure on the productivity of pure and mixed Larix principis-rupprechtii forests. Forests 13:1318. doi: 10.3390/f13081318
Zhang, S., and Zhou, W. Q. (2018). Recreational visits to urban parks and factors affecting park visits: Evidence from geotagged social media data. Landsc. Urban Plan. 180, 27–35. doi: 10.1016/j.landurbplan.2018.08.004
Keywords: species diversity, forest landscape restoration, suitability assessment, priority areas, Saihanba
Citation: Fan N, Wang Y, Yang X, Li J, Kang J, Liu Q and Zhang Z (2024) Suitability assessment for forest landscape restoration based on species diversity conservation. Front. For. Glob. Change 7:1252077. doi: 10.3389/ffgc.2024.1252077
Received: 03 July 2023; Accepted: 11 March 2024;
Published: 26 March 2024.
Edited by:
Arbi James Sarkissian, Lancaster University, United KingdomReviewed by:
Florent Noulekoun, Korea University, Republic of KoreaPrashant Sharma, Dr. Yashwant Singh Parmar University of Horticulture and Forestry, India
Anita Zaitunah, University of North Sumatra, Indonesia
Copyright © 2024 Fan, Wang, Yang, Li, Kang, Liu and Zhang. This is an open-access article distributed under the terms of the Creative Commons Attribution License (CC BY). The use, distribution or reproduction in other forums is permitted, provided the original author(s) and the copyright owner(s) are credited and that the original publication in this journal is cited, in accordance with accepted academic practice. No use, distribution or reproduction is permitted which does not comply with these terms.
*Correspondence: Zhidong Zhang, zhangzd@hebau.edu.cn
†These authors have contributed equally to this work