 Nicholas A. Povak
 Patricia N. Manley
 Kristen N. Wilson
- 1USDA-FS, Pacific Southwest Research Station, Placerville, CA, United States
- 2The Nature Conservancy, San Francisco, CA, United States
With the onset of rapid climate change and the legacy of past forest management and fire suppression policies, the capacity for forested landscapes to maintain core functionality and processes is being challenged. As such, managers are tasked with increasing the pace and scale of management to mitigate negative impacts of future large disturbances and improve resilience and climate adaptation of large landscapes. Such efforts require consensus building, with partners and stakeholders to determine where to allocate scarce resources. We present a methodology to identify strategic (where to go) and tactical (what to do) priorities across large landscapes to assist in project level planning. The model integrates a spatial assessment of current ecosystem resource conditions and spatial outputs from a landscape succession and disturbance simulation model (LANDIS-II) to assess the potential to achieve desired conditions under climate change with ongoing disturbances. Based on the expected trajectory of landscape conditions over time, the model applies fuzzy logic modeling to provide quantitative support for four management strategies (Monitor, Protect, Adapt, and Transform) across the landscape. We provide an example application of these methods targeting sustainable carbon loads across a 970,000 ha landscape in the central Sierras in California. By including future landscape conditions in the model, decisions made at the stand-level are inherently tied to and influenced by larger landscape-level processes that are likely to have the greatest impact on future landscape dynamics. The methods outlined here are able to incorporate multiple metrics to capture the many resources targeted by management. Model outputs could also be used as inputs into spatial optimization models to assess tradeoffs and synergies among treatment options and to aid in long-term planning.
1 Introduction
1.1 Landscape management planning under climate change
The magnitude and severity of disturbance in recent decades has led to concerted efforts among land managers and policymakers to increase the pace and scale of restorative and adaptive management across much of western North America (wNA) (Kelly et al., 2019; Hessburg et al., 2021; North et al., 2021; Prichard et al., 2021). Despite these efforts, management substantially lags the levels needed to alter ecological trajectories and maintain ecosystem services in the long term (North et al., 2012, 2021). Identifying treatment priorities through a strategic planning process is generally not standard practice in affected regions but locally done to serve specific management needs. To address the extent of current and future impacts from natural disturbances, managers and policymakers are shifting to coordinated planning efforts that can collectively build resilient conditions across landscapes and jointly address multiple barriers to implementation (North et al., 2012; McIver and Becker, 2021; Manley et al., This issue). Scaling treatment needs to regional landscapes requires transparent, flexible, and repeatable methods that can identify potential treatment areas where uncertainty in attaining and maintaining resilient conditions is low and anticipated benefits from treatments are high.
While many models can be used to programmatically optimize treatment options over space and time (e.g., ForSys, EMDS), most do not directly incorporate future landscape dynamics under climate change (cf. Abelson et al., 2021 for an aspatial example). As a result, management is often directed towards (1) areas that are most departed from desired conditions under the assumption that management can make the most impact where conditions are currently poorest (Reynolds and Hessburg, 2005) and (2) areas proximal to infrastructure and other highly valued resources given their potential vulnerability to disturbance (Ager et al., 2021) under the assumption that proximal management can sufficiently reduce risk. Under this latter framework, management emphasizes resistant or defensive strategies targeting social and economic vulnerabilities without regard to ecological processes and interdependencies operating across landscapes. Certainly, treatments can lessen the negative effects of wildfire in situ (Lyons-Tinsley and Peterson, 2012; Povak et al., 2020; Prichard et al., 2020) and provide other ecological benefits (Stephens et al., 2021), especially when applied near the wildland urban interface (WUI, Johnson and Kennedy, 2019). However, as climate change continues to challenge the capacity for systems to retain characteristic patterns, processes, and functions, defensive strategies may wane in their effectiveness unless coupled with adaptation and resilience strategies implemented over large scales (Millar et al., 2007; Schuurman et al., 2022). The ability for treatments to sustain desired conditions over time will depend on neighborhood effects of surrounding environmental conditions, future climatic variability, and natural disturbance processes. Focusing solely on the most departed areas without consideration of future stressors may result in significant and sustained investments to maintain conditions over time, whereas future-informed management may be directed elsewhere on the landscape where conditions are more aligned with future projected climatic conditions and disturbances.
Incorporating climate change influences on species, disturbances, and environmental conditions is now essential at all levels of decision-making (MacDicken et al., 2015). For example, as biophysical conditions shift under climate change, many forest species may soon inhabit environments that are declining in suitability for establishment, growth, development, and reproduction (Decker et al., 2021; Hill and Field, 2021). In California, Thorne et al. (2017) estimated that climate stress will impact as much as 45–56% of the State’s vegetated area by the end of the 21st-century.
However, planning efforts rarely include information about potential climate change impacts largely due to a lack of available methods (Prober et al., 2019). Several climate-informed management frameworks have been forwarded in recent years to anticipate ecological impacts from climate change. Most emphasize a need to rethink past management paradigms that have focused on stability and resistance in favor of acceptance of change and uncertainty (Millar et al., 2007; Prober et al., 2019; Runyon et al., 2020; Peterson St-Laurent et al., 2021; Schuurman et al., 2022). For example, the RAD (Resist-Accept-Direct) framework provides managers with a decision space to allow change to unfold without interference (Accept), facilitate change to new desired system states (Direct), or resist (Resist) change to undesirable states through management intervention. Underlying this decision space is the notion that climate change will drive ecological transformations in which irreversible shifts in multiple ecosystem components will alter ecosystem functioning in the long term (Williams, 2022). However, the velocity and direction of change will vary across a region (Dobrowski et al., 2013; Morelli et al., 2016), and as such, the immediacy of management need will also vary spatially. Knowledge of where areas of relative stability are anticipated can help allocate management elsewhere on the landscape, and in turn, knowledge of where conditions will likely move towards more desirable conditions may indicate areas with high likelihood of near-term management success in facilitating the development of those conditions.
We developed a methodology to operationalize climate-informed management prioritizations (e.g., McWethy et al., 2019; Schuurman et al., 2022) using fuzzy logic to jointly evaluate current resource conditions and future resource stability under climate change. The model provides a series of spatial maps depicting the level of support for each of four management strategies: Monitor, Adapt, Protect, and Transform. The PROMOTE (Provisioning Resilience Outcomes for Management Optimization Tool) model integrates an assessment of current conditions to evaluate the current state of the system with an assessment of future landscape conditions under climate change to evaluate the potential for system components to achieve and maintain desired conditions over time. Model outputs express strategic (i.e., where to manage to invoke the largest impact) and tactical (i.e., what is the intended goal of treatments) priorities across a landscape within a single decision support model. Model outputs can be subsequently subjected to ranking, prioritization, or optimization to identify treatment locations, quantify tradeoffs among management options, spatially cluster proposed treatments, and develop landscape management plans e.g., (see Ager et al., 2017; Pascual et al., 2022).
Here, we introduce the PROMOTE model components and calculations, and apply it to a 1-million ha landscape located in the central Sierras, USA. PROMOTE can evaluate any number and type of data sources, and through the fuzzy logic analyses, these data can easily be combined at higher conceptual levels to evaluate multiple propositions regarding ecosystem conditions (e.g., forests are in a resilient condition; Manley et al., This issue). The model translates fundamental concepts of resilience and adaptive management into quantitative representations of the anticipated effectiveness of each management strategy in achieving targeted outcomes. Many definitions of resilience exist (Schmidt, 2021), and our modeling accommodates a broad interpretation of resilience concepts, which can be user-defined. Specifically, our model addresses the evaluation of resource conditions towards the goal of improving the long-term supply of ecosystems services under climate change. The model therefore assumes that improving the long-term condition of one or more resources (or processes) imparts a higher degree of resilience onto the landscape. Here, we provide an example application to a single ecosystem process: carbon sequestration.
2 Methods and materials
Decision support systems (DSS) have a long history in forest management planning across the world (Reynolds et al., 2014; Marto et al., 2019). Relevant to our context, DSSs are knowledge-based systems that are commonly used to evaluate ecosystem conditions and facilitate prioritizing spatial management treatments (Reynolds and Hessburg, 2005; Reynolds and Hessburg, 2014; Povak et al., 2022). PROMOTE uses fuzzy logic to evaluate current ecosystem resource conditions across a landscape as well as the future potential and stability of these resources under climate change and natural disturbances. Fuzzy logic membership functions (sensu, Miller and Saunders, 2002) are mathematical transformations used to evaluate logical propositions (e.g., forest density is resilient to climate change). These functions translate raw data values (i.e., large trees per hectare) to values ranging from −1 (no support for the proposition) to +1 (full support, Figure 1). Numerical outputs from fuzzy ramp functions represent a strength of evidence (SOE) in support of the proposition. In Figure 1, this membership function shows that increases in metric values (e.g., large tree density increases) leads to concomitant increases in the strength of support for the proposition (e.g., large trees are abundant). Choices related to the directionality and “shape” of the membership function (e.g., positive or negative linear, two-tailed, asymptotic, exponential, etc.), and the selection of cutoff values (i.e., and in Figure 1) can be informed by the literature, expert opinion, or through inspection of the statistical distribution of the metric (e.g., 10th and 90th percentiles of the data distribution).
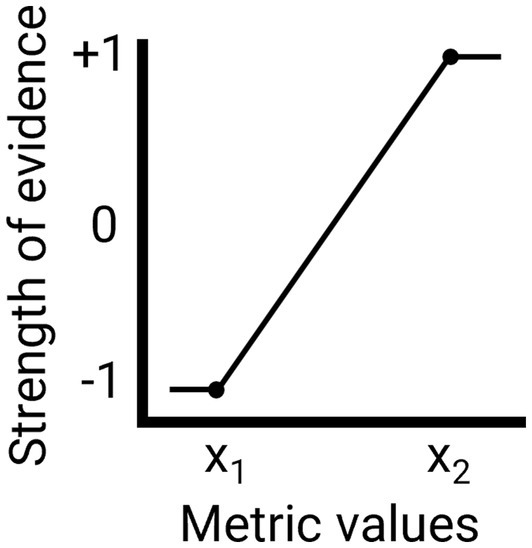
Figure 1. Example fuzzy logic ramp function for a given Metric. Value x1 and x2 represent target or desired conditions which are used to evaluate the metric and produce a strength of evidence score to determine the level of support for the proposition (e.g., that forest carbon levels for a given landscape unit exceed the 90th percentile for the landscape).
In the following section, we outline how we incorporated logic modeling conventions to integrate future landscape dynamics under climate change into the PROMOTE model.
2.1 PROMOTE management strategy scores
We first established a two-dimensional decision space represented as a Cartesian coordinate graph with both x- and y-axes ranging from −1 to +1. The x-axis represents the current state of the system, and the y-axis represents the potential to achieve and maintain a given desired state. The trajectory of conditions for a given location and their uncertainty are then interpreted from the coordinates of a given location on the graph.
Conceptually, the plotting region can be partitioned into four quadrants (Figure 2) each representing a management strategy (Table 1). Within the plotting region, the proximity of a point on the graph to a plot corner determines the level of support (i.e., strength-of-evidence, SOE) for a given strategy (Figure 2). Accordingly, a set of four management strategy scores (i.e., Monitor, Protect, Adapt, and Transform) is calculated for a given landscape unit as the Euclidean distance from their coordinates to each of the four corners of the two-dimensional graph (Table 1).
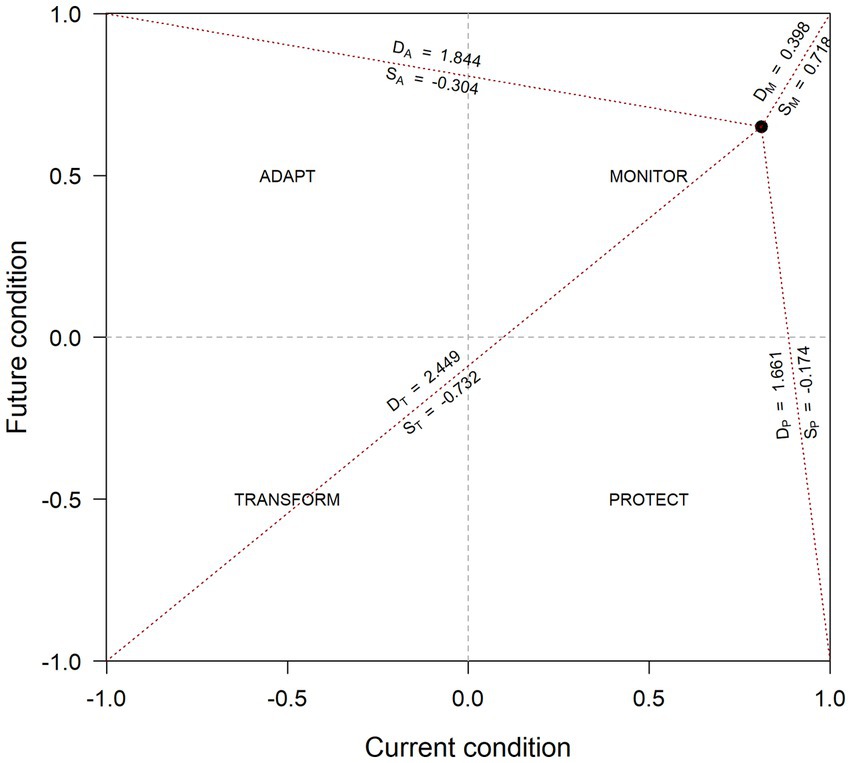
Figure 2. Cartesian graph representing the PROMOTE model scoring convention. The plotting region is segmented into four quadrant regions representing suggested management strategies based on the current and future conditions assessed for one or more sites within a landscape. The corners of the graph represent full support for each management strategy, and the distance from a given location in the plotting region to each corner is indicative of the level of support for a given management strategy. In this example, a site (black dot) scored 0.81 for current condition and 0.65 for future condition for a given Metric. The Euclidean distance (Dx) to each corner is determined and a linear transformation [Eq. (1)] is used to calculate a management score (Sx) for each restoration strategy where −1 represents no support for a given strategy and +1 indicates full support.
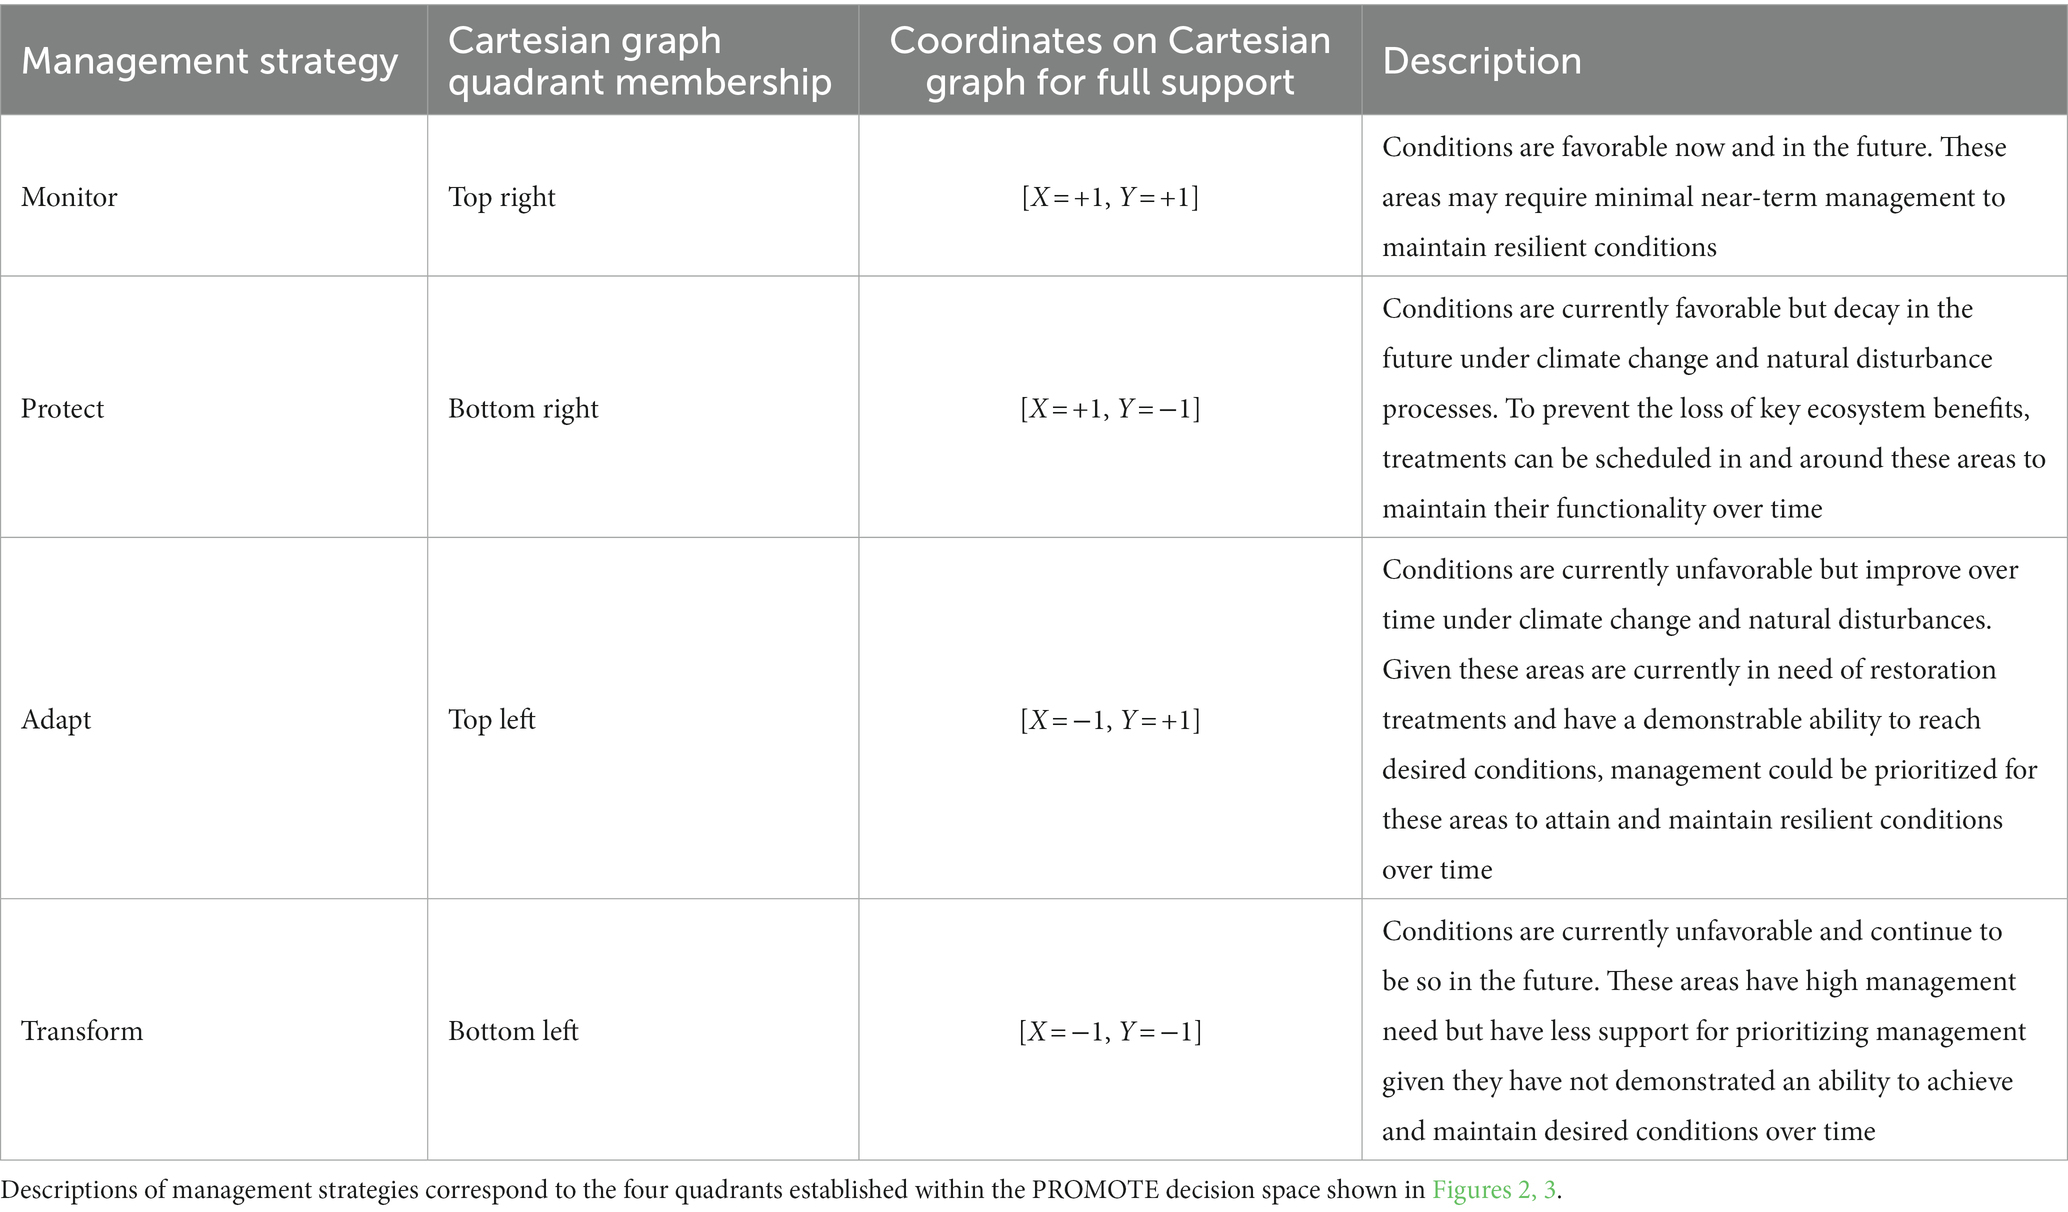
Table 1. Description of the quantitative assessment of current and future conditions within the PROMOTE model.
Concretely, the possible distance from any point on the Cartesian graph to any corner of the graph ( ) ranges from 0 (full support) to 2.8284 (no support; Figure 2). The subscript “x” applies to the Monitor, Protect, Adapt, or Transform (M, P, A, or T) strategy under consideration. Distances are then rescaled to −1 to +1 using a linear transformation [Eq. (1)]. On this scale, sites whose coordinates correspond to a given corner (i.e., = 0) would receive a SOE score = +1, which signifies full support for a given restoration strategy, while a site located on the opposite corner (i.e., = 2.8284) would receive a = −1 for no support. Thus, each location on the landscape can be evaluated based on the SOE for each of the four management strategies outlined in Table 1.
For example, if a given site within a landscape had a current condition score of 0.81 (x-axis) and future condition score of 0.65 (y-axis) it would have = 0.3982, = 1.6609, = 1.8435, = 2.4492. Accordingly, applying Eq. (1) to these values would yield = 0.718, = −0.174, = −0.304, and = −0.732 (Figure 2).
The Cartesian graph represents the level of support for each of the four management strategies (Figure 3). Scores can also be combined to emphasize different management objectives. For instance, managers may want to identify options for the protection of current resource conditions that are at risk of decline (e.g., Protect areas), as well as directing management to areas currently in poor condition but that exhibit the highest certainty of success (e.g., Adapt areas). A combined score representing where management opportunities are greatest for one or both strategies – hereafter referred to as the Management Opportunity (MO) score – would emphasize locations with strong support for either Protect (proximity to lower-right corner) or Adapt (proximity to upper-left corner) (Figure 3). As a technical detail, when emphasizing these two corners of the graph in an evaluation, the maximum distance from either the Adapt or Protect corners becomes 2 (the length of an axis) instead of 2.8284 (the distance between two opposing corners), and as a result, the range of possible management opportunity scores is restricted to −0.4142 to +1 (Figure 4A). These scores are rescaled to span the full −1 to +1 scale using Eq. (2) (Figure 4B),
where MO is the original management opportunity score.
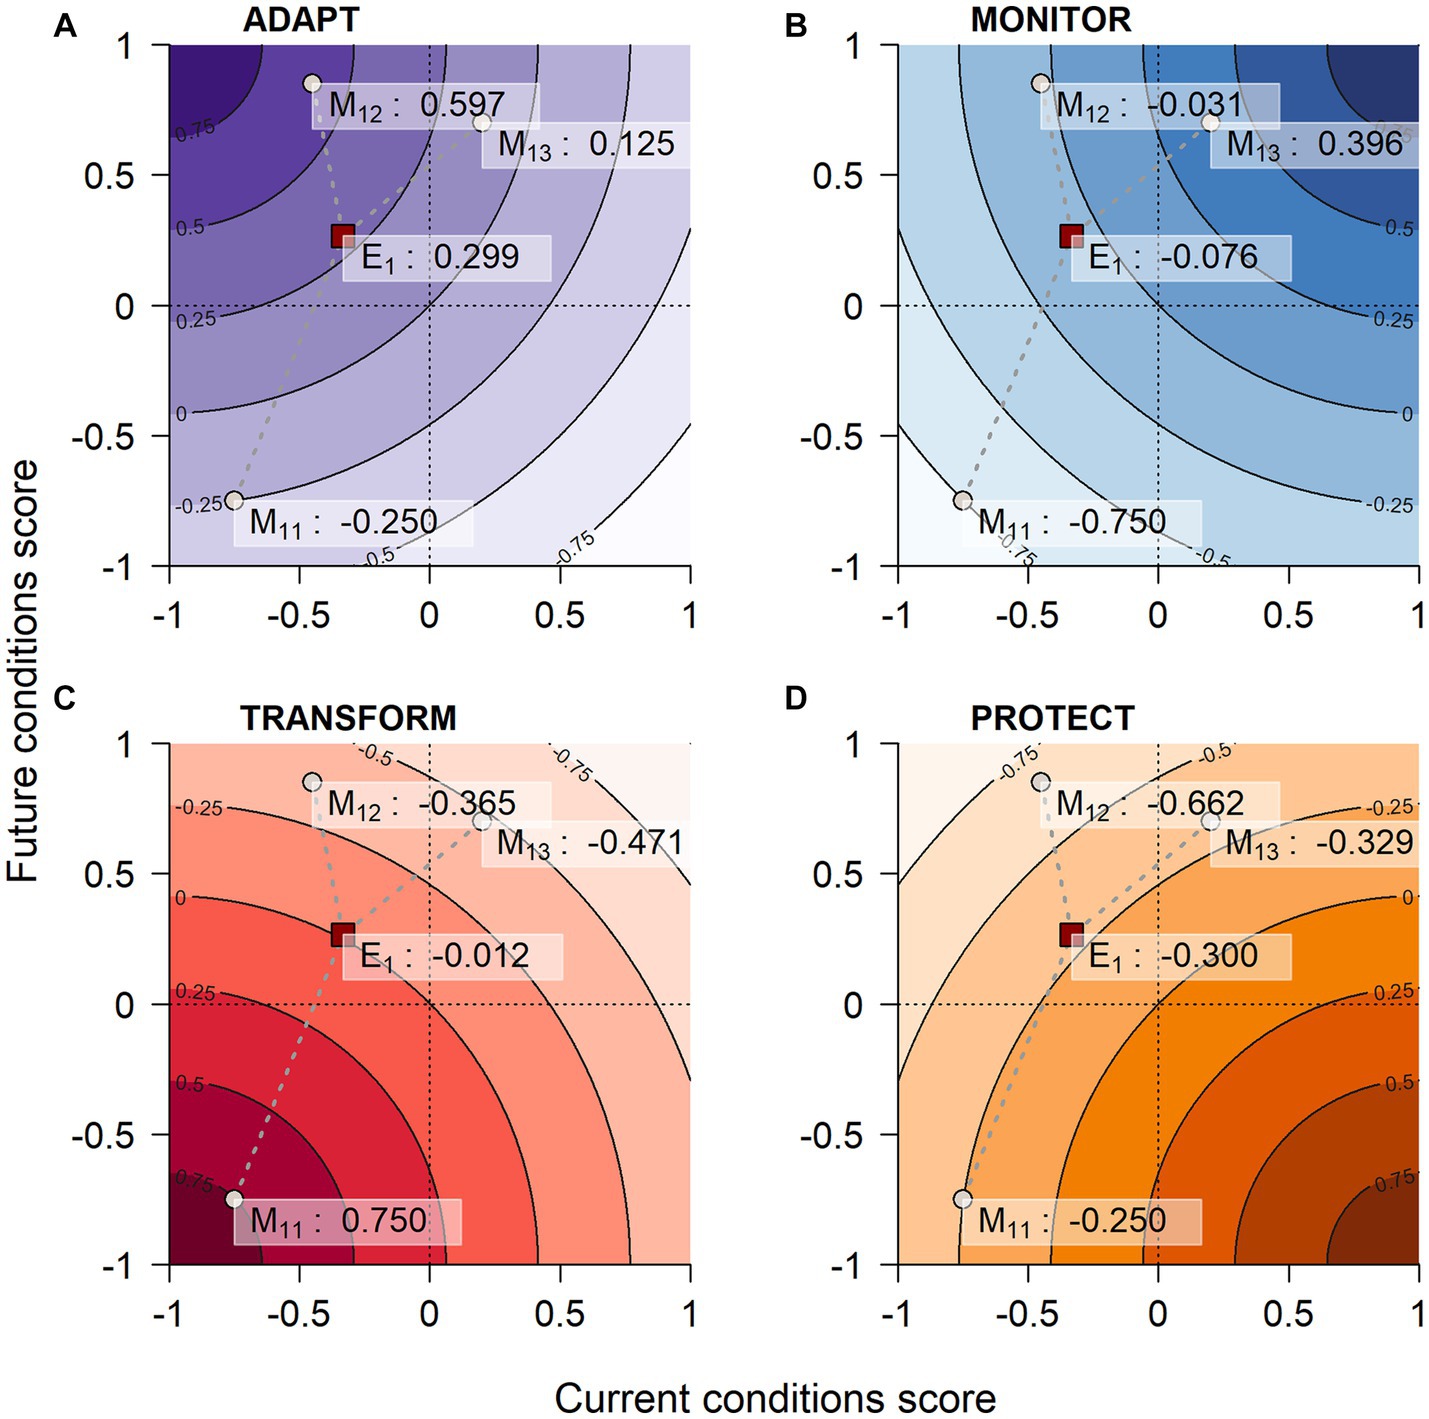
Figure 3. Multiple interpretations of the PROMOTE model scoring and example calculations for evaluating and combining multiple metrics into a given element. White points represent three metric scores calculated for a given cell on the landscape. The red square represents the element score resulting from averaging the coordinates of each metric score.
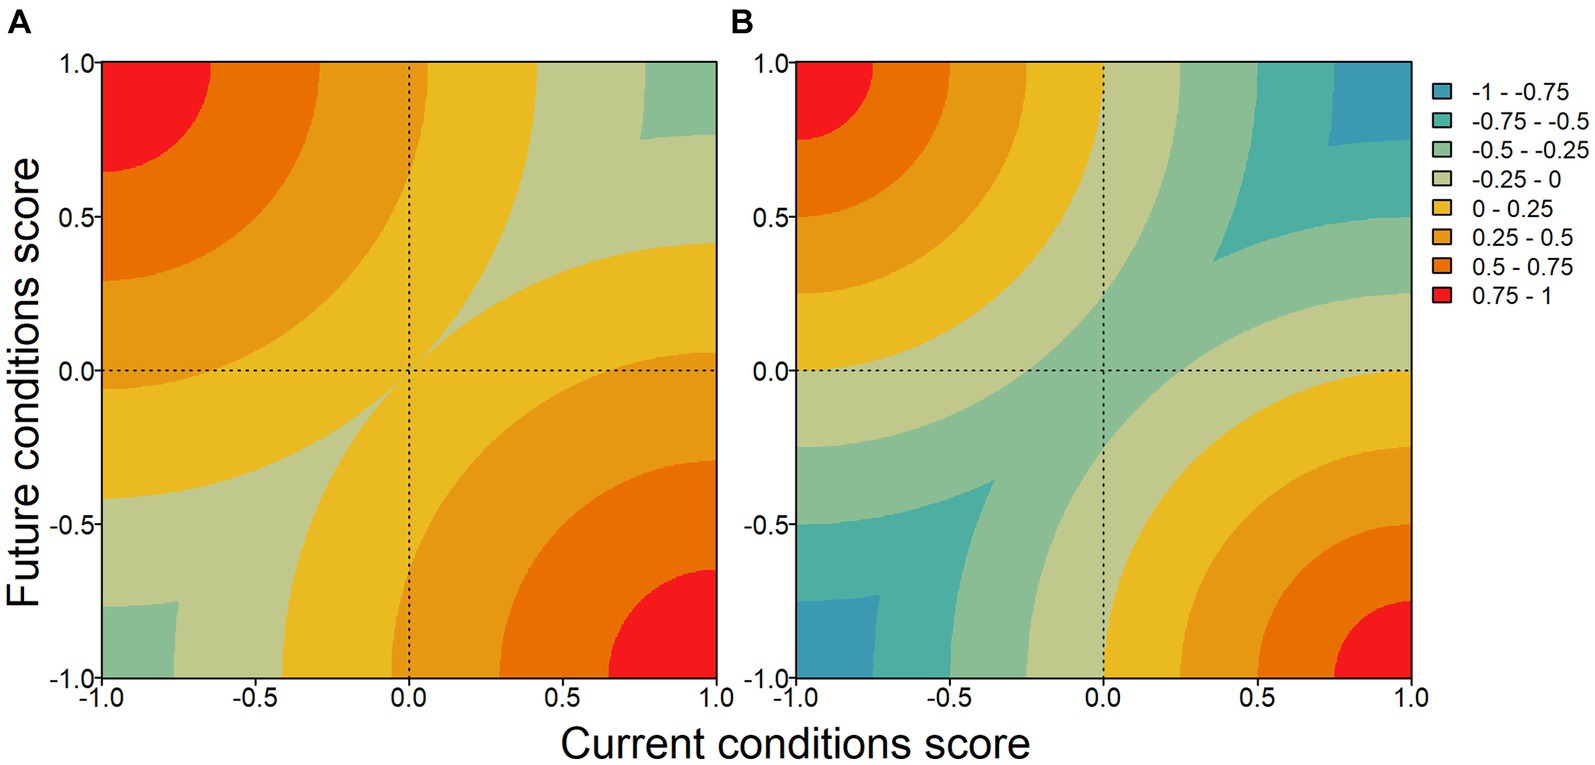
Figure 4. Example application of the PROMOTE scoring system to derive a Management Opportunity (MO) score that represents where either adapt or protect management strategies exist on the landscape. (A) represents the original scoring from maximizing the adapt and protect scores and (B) represents a rescaling of the score so that it ranges from −1 to +1 [Eq. (2)].
2.2 Example application of the PROMOTE model to identify stable carbon
The 907,000 ha Tahoe-Central Sierra Initiative (TCSI) landscape (Figure 5) is a diverse, multi-ownership landscape in the central Sierra Nevada in California and Nevada that is the current focus of a collaborative effort among state, federal, nonprofit, and private partners. The goal of TCSI is to increase the pace and scale of management to improve forest health and resilience across the region. The landscape serves as an excellent case example for the PROMOTE model, given that it is a regional-scale planning landscape that encompasses a diverse array of socio-ecological environments – ranging from urban areas and major interstate highways to vast areas of National Forest, multiple wilderness areas, and Lake Tahoe, a major destination for outdoor recreation. In addition, it is inclusive of an entire west to east swath across the central Sierra Nevada, spanning a steep elevational gradient from the foothills to the crest (~900 m to over 3,300 m), along which responses to climate change are expected to be pronounced.
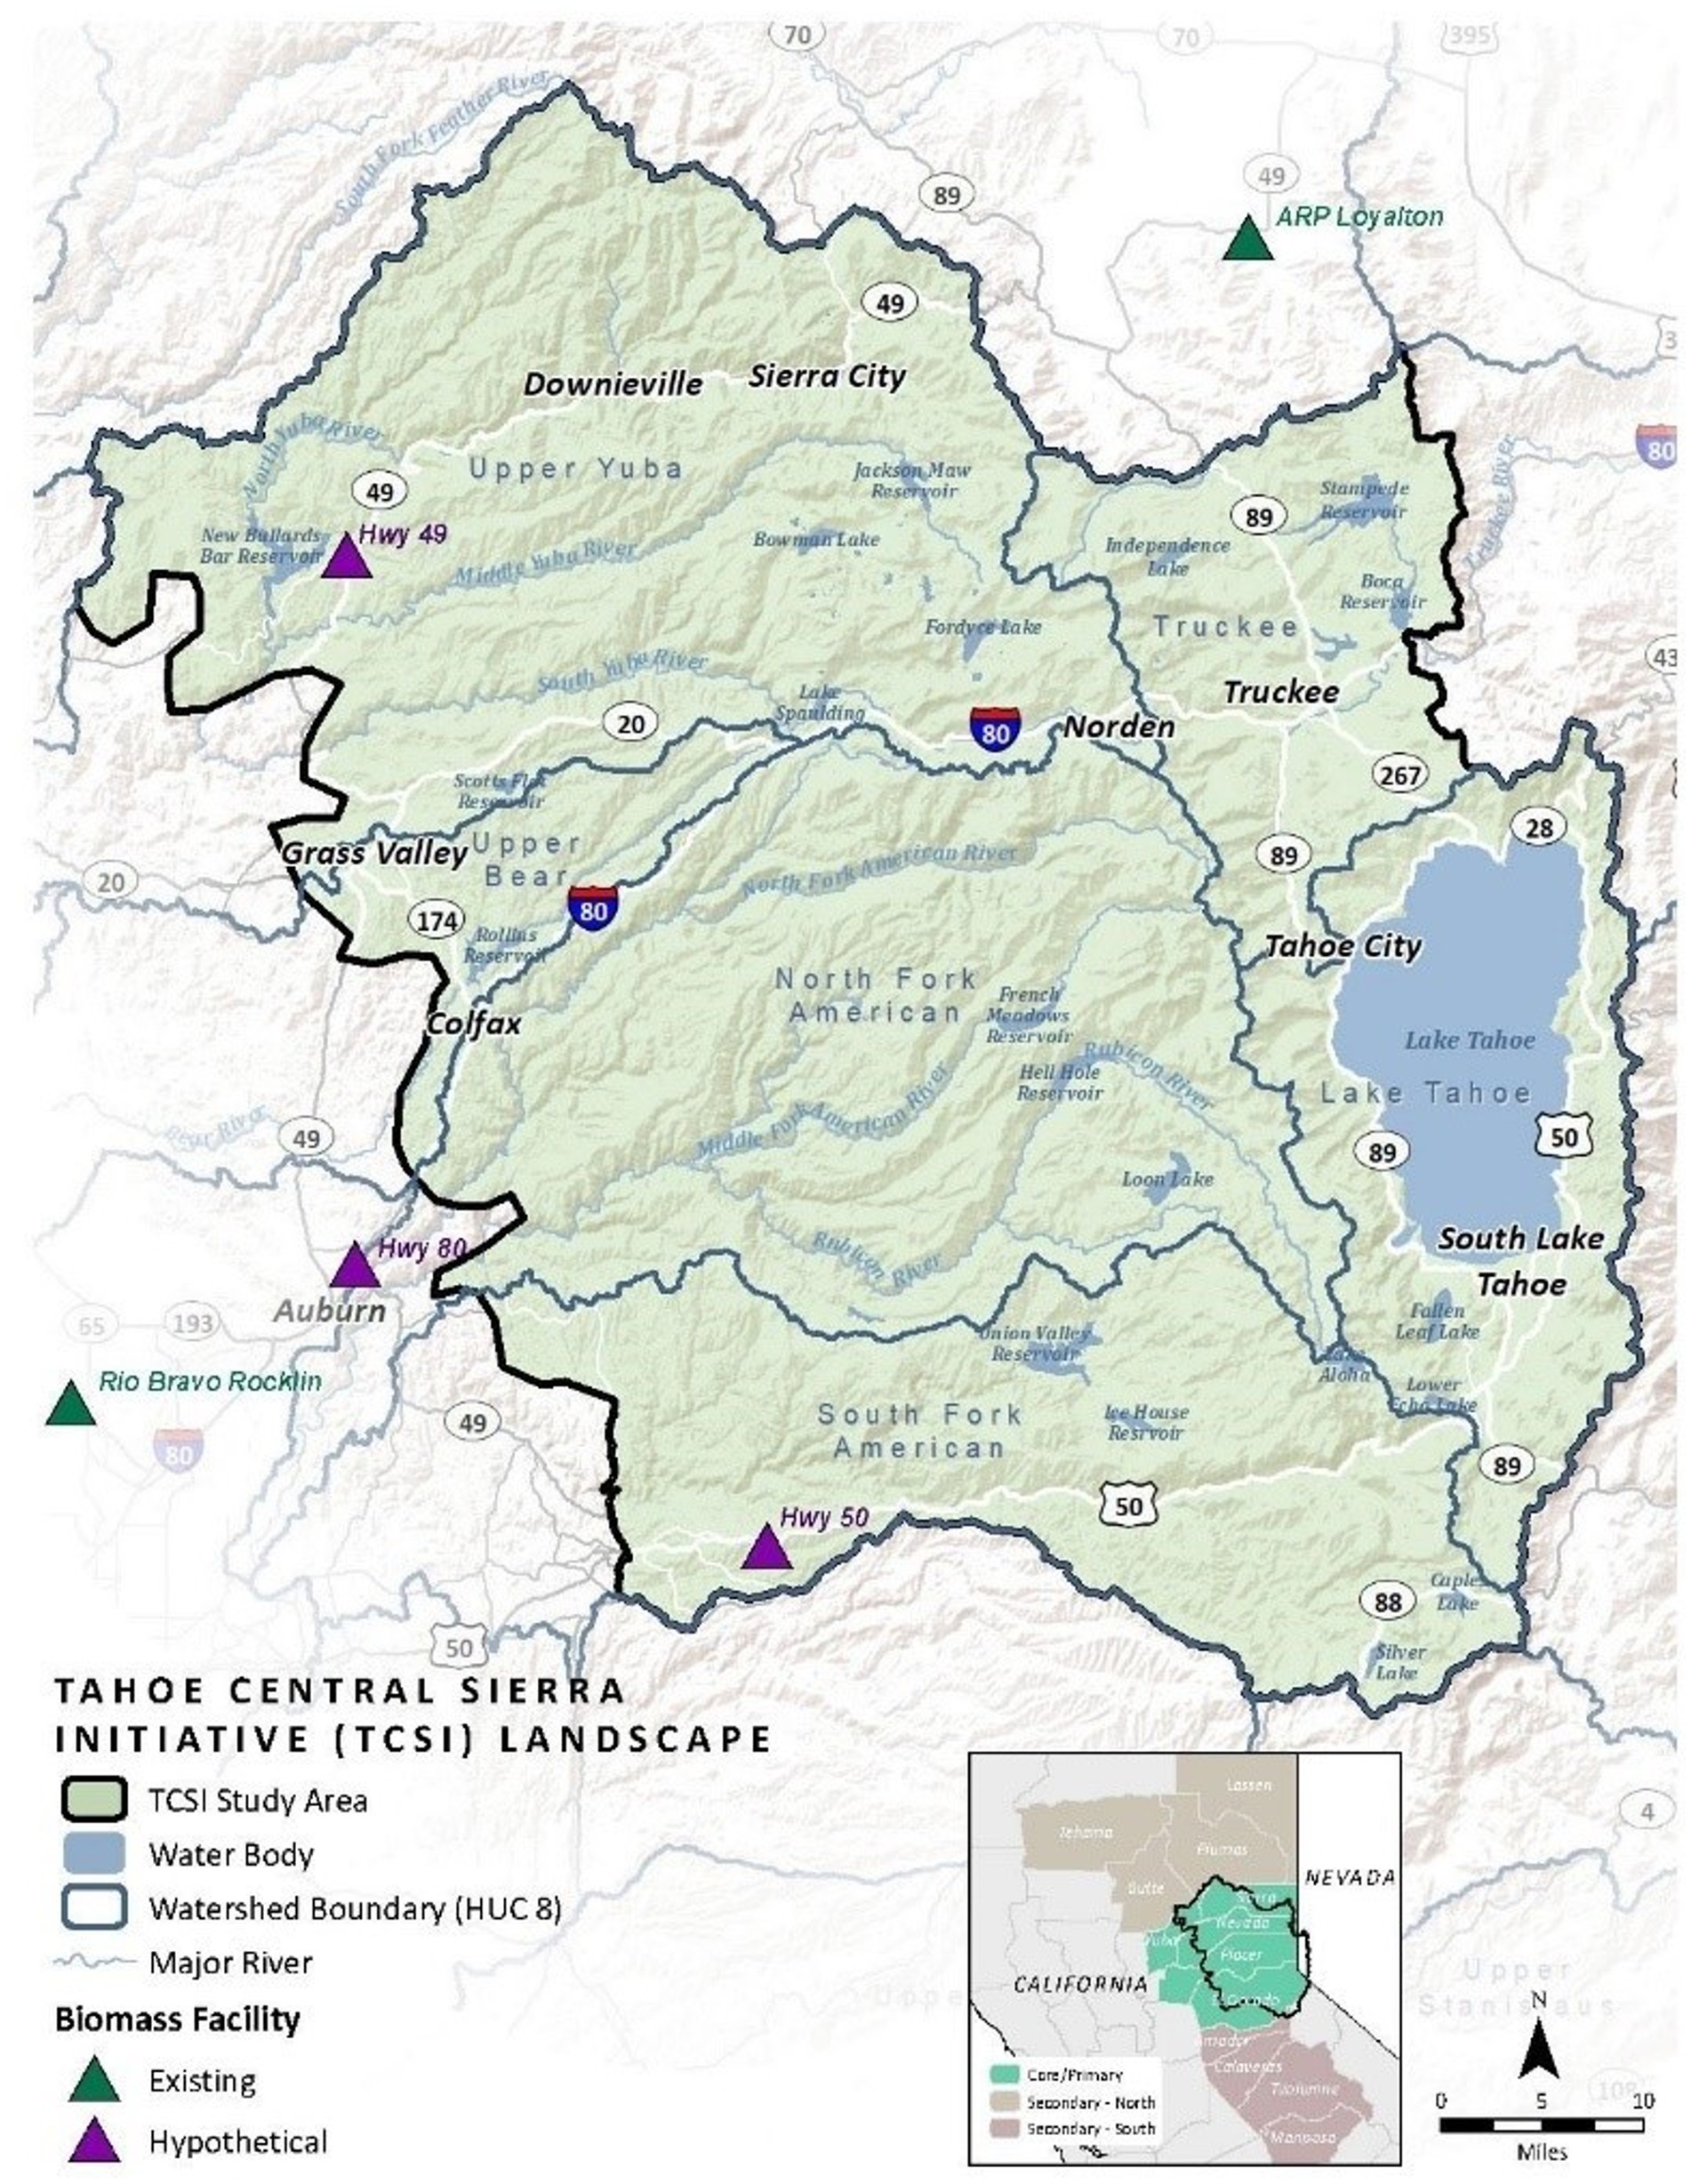
Figure 5. Tahoe-Central Sierra Initiative landscape.
The PROMOTE model was developed in collaboration with several local area experts representing state environmental collaboratives, US Forest Service scientists and managers, and non-profit agencies. Through a series of work sessions, participants contributed expert knowledge on the ecology and restoration needs in the landscape to help inform the development of these models, which included the selection of metrics, spatial data, fuzzy ramp target values, and the interpretation of the results.
To illustrate the model’s functionality, we provide an evaluation of aboveground live carbon levels across the TCSI. The proposition being evaluated is that resilient forested landscapes exhibit enhanced carbon sequestration capacity that is stable and sustainable in the long-term. The capacity to store carbon (C) over the long-term is a critical ecosystem service provided by natural areas. By regulating greenhouse gases, including human-derived emissions, these areas play a crucial role in regulating global atmospheric processes (Sierra et al., 2021). There is currently growing interest in C accounting in forests to value their contributions as C sinks towards offsetting greenhouse gas to achieve emissions reduction targets (Badgley et al., 2022). Sequestration incentives, therefore, are contingent upon forestlands sustaining a net C sink status in the long-term.
2.3 Current and future carbon modeling with LANDIS-II
As climate continues to change and natural disturbances from wildfire, insects, and drought continue to impact forest growth and mortality, the capacity for forests to maintain their status as net C sinks is greatly compromised (Anderegg et al., 2020). Integrating landscape simulation modeling into C accounting can reveal where current C hotspots are sustainable, and where future C sinks can mature over time.
Data used to characterize the carbon Metrics were derived from the LANDIS-II landscape simulation model (Scheller et al., 2007). In the current application, we apply the LANDIS-II model developed by Maxwell et al. (2022) for the TCSI landscape. The model incorporated the NECN (Net Ecosystem Carbon and Nitrogen; Scheller et al., 2011) successional dynamics, the SCRPPLE (Social-Climate Related Pyrogenic Processes and their Landscape Effects; Scheller et al., 2019), the base biological disturbance agents (BDA; Sturtevant et al., 2004), and biomass harvest (Gustafson et al., 2000) extensions. The model was run under the MIROC 8.5 climate change scenario over a 40 years period (2020–2060). The MIROC climate model was one of five recommended by California’s Fourth Climate Change Assessment (Pierce et al., 2018) and, after extensive testing, was the only one to adequately represent recent exceptional droughts (2003–2004, 2012–2015) (Maxwell et al., 2022). Climate projections were downscaled using the MACA methodology (Abatzoglou and Brown, 2012) and are available through the USGS Geo Data Portal.1
A four-decade simulation period was selected given the project focus of informing near-term forest management planning (1–2 decades). Longer simulation periods would incorporate a higher level of uncertainty and would be less well connected to current vegetation conditions and outcomes associated with vegetation transitions and climate interactions over typical planning periods. A total of five model replicates were run to capture stochastic variation among replicates.
LANDIS-II was run under a minimal harvest scenario, wherein management was restricted to private lands and within a wildland urban interface (WUI) 2 km buffer around built environments. We chose this scenario to best understand the evolution of vegetation conditions under climate- and vegetation-driven changes in wildfire disturbances without management interventions in the associated wildlands.
A 2019 vegetation base map developed by NCX (formerly SilviaTerra) was derived using statistical imputation methods to distribute geographically relevant FIA tree lists to individual 15 m cells. The NCX modeling workflow (1) processed remotely-sensed imagery from 30 m Landsat 8 and Sentinel-1, 30 m tree cover data from the National Landcover Dataset (Dewitz, 2019), and a 10 m digital elevation model from the National Elevation Dataset (U.S. Geologic Survey, 2019), (2) reduced data dimensions using principal components analysis, (3) summarized FIA plot data and grew it forward to a common year, (4) algorithmically predicted FIA plot locations, (5) trained a set of imputation models, and (6) generated predictions of forest density, basal area, tree summaries for 2.5 cm diameter classes, and species importance. These data were then resampled to 180 m for model processing.
LANDIS-II-modeled above-ground dry weight biomass was converted to carbon equivalents by multiplying biomass (g m−2) by 0.47 (IPCC, 2006; Manickam et al., 2014). Dead biomass (i.e., soil, coarse woody debris, and snags) was not included as it was determined by consensus that such sources do not represent stable carbon, the focus of the evaluation.
2.4 Logic model development
Logic models were developed to evaluate current (Figure 6) and future (Figure 7) aboveground C stocks across the TCSI landscape. Evaluations occurred from individual pixels up to HUC-10 watershed scales (Hydrologic Unit Code, HUC-10 watersheds, range 16,000 to 100,000 ha, USGS 2013). Hydrologic units are often used to stratify the landscape in forest management applications (Keane et al., 2010).
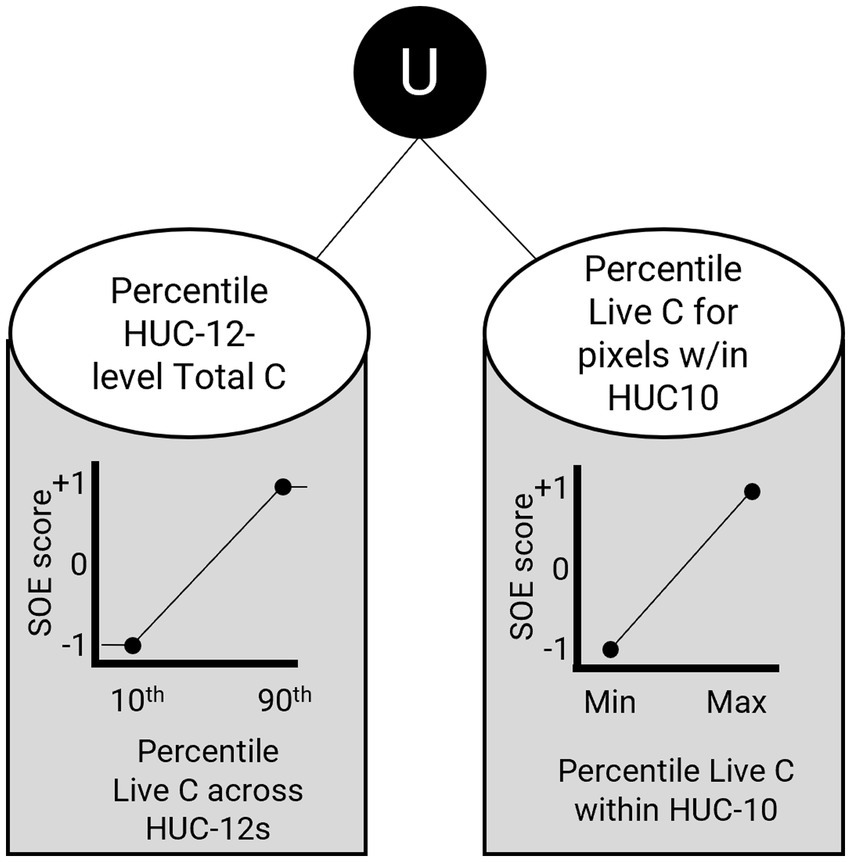
Figure 6. Fuzzy logic structure evaluating the current carbon conditions of cells. Fuzzy logic ramps were used to quantify the strength of evidence of a given metric. SOE scores range from −1 (no support) and +1 (full support). The union (U) operator was used to calculate the average of the two SOE scores to represent the overall current condition for Carbon. HUC stands for hydrologic unit code.
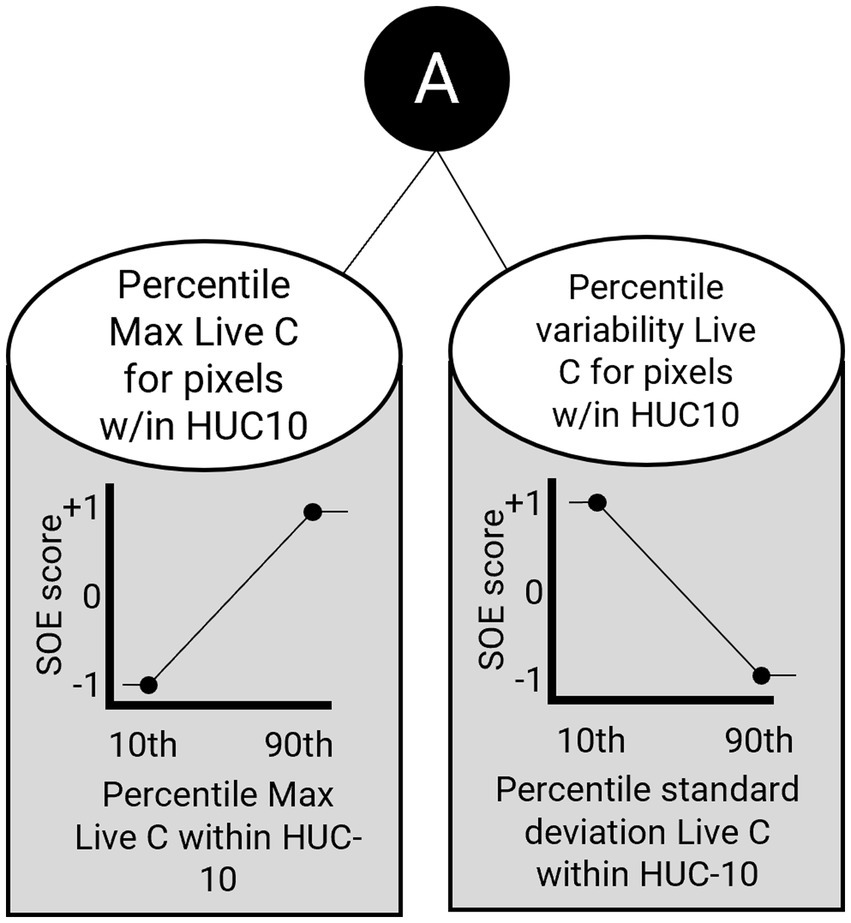
Figure 7. Fuzzy logic structure for evaluating future carbon conditions of cells. Fuzzy logic ramps were used to quantify the strength of evidence of a given metric. SOE scores range from −1 (no support) and +1 (full support). HUC-10 stands for ten-digit hydrologic unit code. The And (A) operators were used to evaluate the most limiting evidence for a given metric such that full support was indicated by cells with high potential to achieve a given metric and low variability over the LANDIS-II model simulation period.
2.5 Current carbon condition evaluation
Current C levels were evaluated using a pair of fuzzy logic membership functions that were combined using a UNION operator, which gave the results equal weighting (Figure 6). In the first evaluation, we developed a membership function to relativize the mean C levels for each HUC-12 subwatershed (4,000 to 16,000 ha). HUC-12 subwatersheds were identified in the planning process as a management-relevant landscape scale, where finer-scaled treatment patches could be delineated and prioritized within these hydrologically based land units. The use of the HUC-12-level was to differentiate total live C levels at a broader scale such that larger planning areas could be rank ordered based on their ability to store carbon over time. We used the 10th and 90th percentile conditions summarized across all HUC-12 s within the TCSI landscape to assign low (−1) to high (+1) SOE scores, respectively.
A second evaluation quantified the amount of C within 81 ha (~200 ac) focal windows around each cell and compared those levels to the minimum and maximum levels within their respective HUC-10 watershed. Summing C levels within a focal neighborhood allowed for identifying “patches” of high producing carbon areas rather than depending on estimates at the cell-level, which may vary considerably over space and time.
2.6 Future carbon condition evaluation
For future conditions, a pair of metrics were evaluated (Figure 7) and combined using the AND operator, which results in a condition representation being based on the most limiting condition (i.e., minimum level of support).
The metrics (top, Figure 7) evaluated the (1) maximum and (2) standard deviation of C levels for each cell across the simulation periods. Like the current conditions assessment, total live C was summarized to 81 ha moving windows around each cell. The 10th and 90th percentiles of each Metric were then calculated at the HUC-10 scale, and these percentiles were used to assign the SOE scores for each cell. Cells with large maximum C levels and with low variability across model replicates received high SOE scores.
3 Results
For current conditions, the landscape supported a broad distribution of carbon values across the landscape, but with more limited occurrence of very high and very low carbon values (Figure 8A). The distribution of areas with low C storage (warm colors, Figure 8A) was highly clustered and occurring at low elevations (western edge), within high elevation wilderness areas (southwest of Lake Tahoe), and within recent fire footprints (center, 2013 American Fire and southern, 2014 King Fire). Based on current conditions alone, there were broad areas available for C conservation, with the majority of high C storage occurring in the mid elevational ranges, and much of the Lake Tahoe basin.
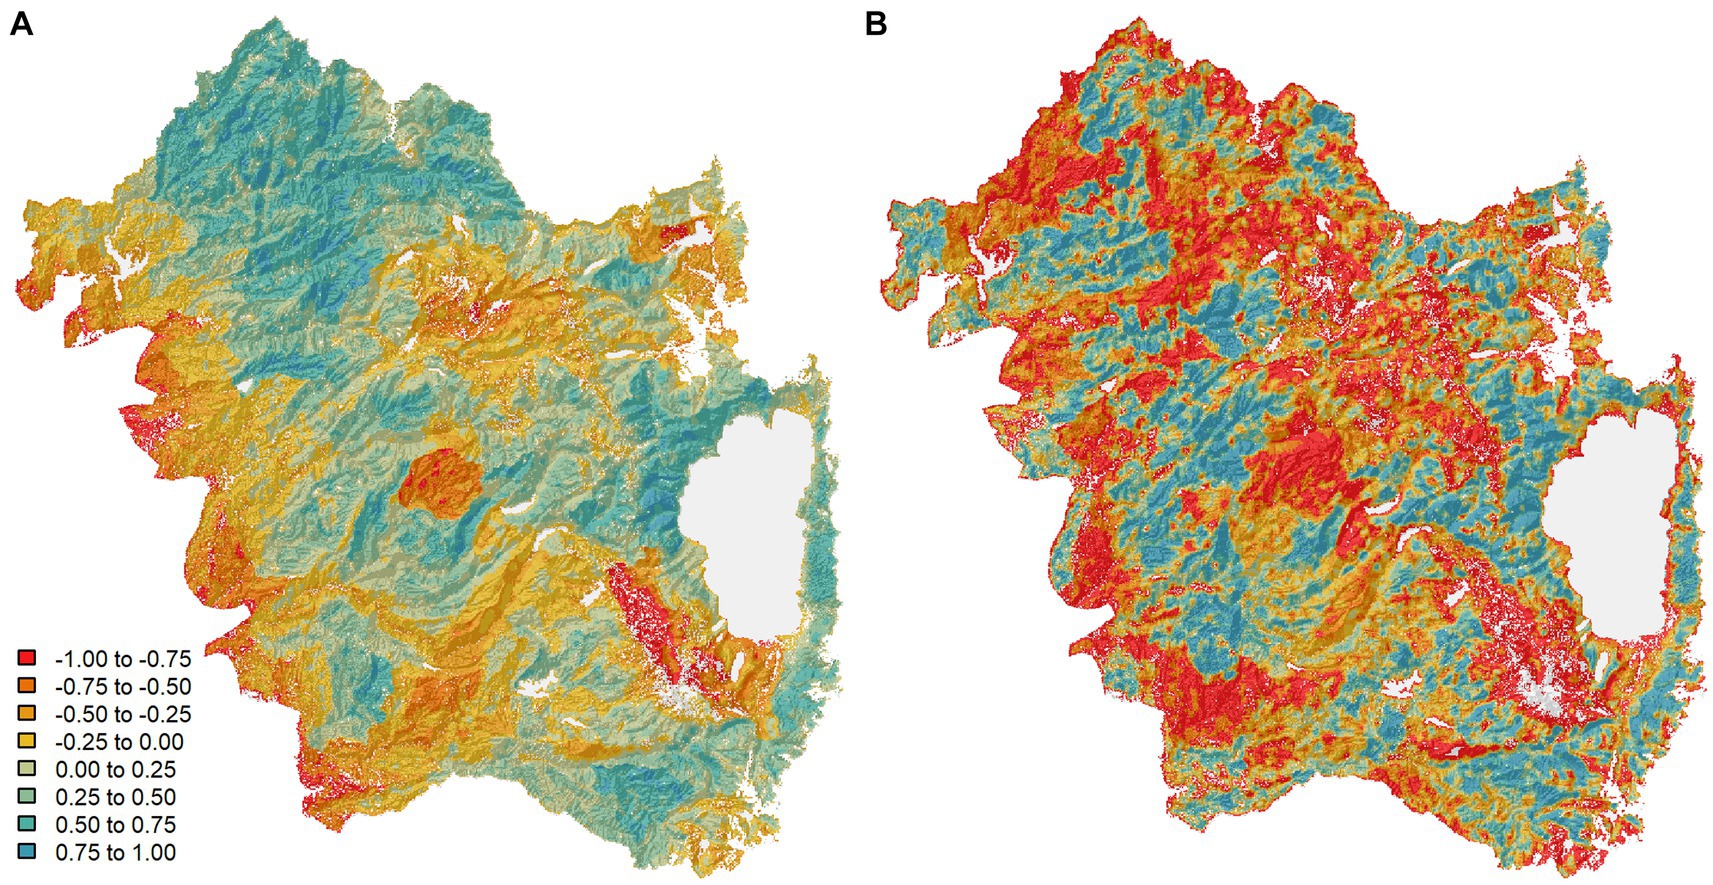
Figure 8. Spatial raster depicting strength of evidence scores for (A) current and (B) future (mid-21st century) carbon conditions. Cool colors indicate higher values for amount and/or stability of carbon while warm colors indicate lower values for amount and/or stability.
The potential future condition presented a very different outcome (Figure 8B). The landscape transitioned from a broad array of C storage conditions to an intermix of juxtaposed high and low C storage, with intermediate values primarily occurring as transitions between high and low C storage areas (Figure 9). Carbon storage stability was more patchily distributed with isolated pockets of stable C stores (cooler colors, Figure 8B). High and low elevations did not exhibit much improvement or stability in C levels over the LANDIS-II simulations. Carbon levels over much of the 2013 American Fire and 2014 King Fire footprint remained low over the course of the simulation period. Some stable C pockets were identified in the northern portion of the landscape and around the Lake Tahoe basin. Future conditions greatly narrowed the extent and fragmented the distribution of areas that could be strong candidates for C storage and indicated that the combination of protecting current and fostering potential future C stores would provide the most robust foundation for management investments toward C conservation.
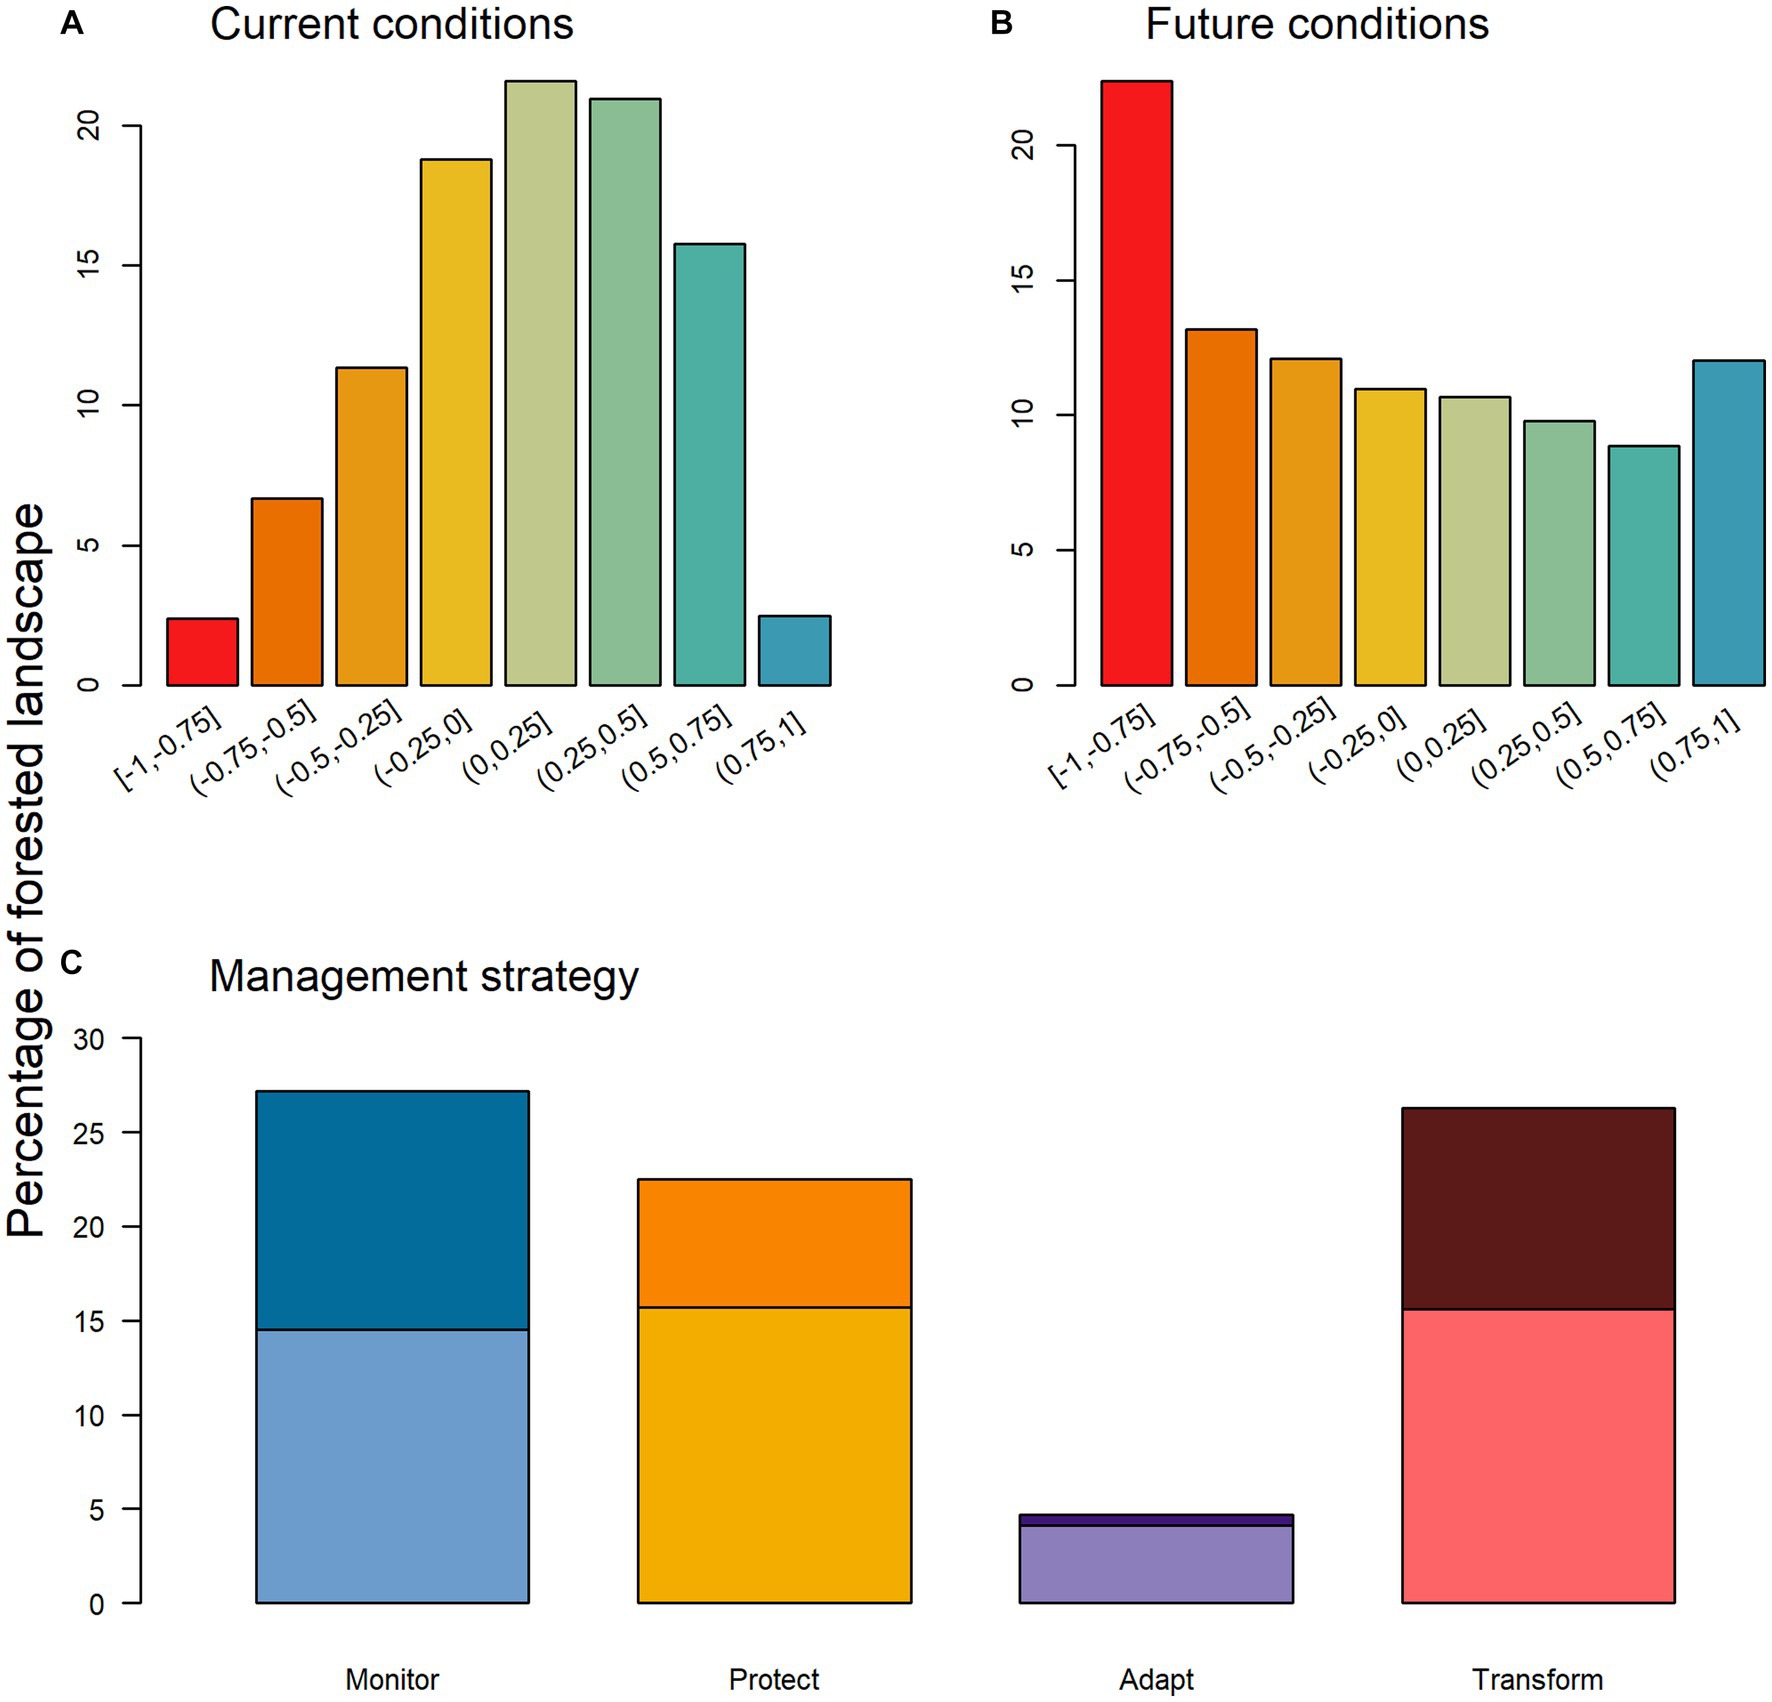
Figure 9. Histograms depicting the distribution of (A) current conditions scores, (B) future conditions scores for carbon across the TCSI landscape, and (C) the percentage of the landscape represented by strong (>0.50, dark shaded bars) and weak (0.25–0.50, light shaded bars) management strategies scores. The colors in panel (C) correspond to the spatial distribution of these scores in Figure 10.
From the current and future assessments, we used the methods outlined above to calculate the management strategy scores for the Carbon pillar (Figures 9, 10). The resulting interpretation clearly identifies areas where (1) stable C is high and expected to remain high without management investment (Monitor), (2) risk reduction efforts can increase the likelihood of sustaining stable C over the next few decades (Protect), (3) stable C can likely be improved through management investments (Adapt), and (4) management is unlikely to yield C dividends (Transform).
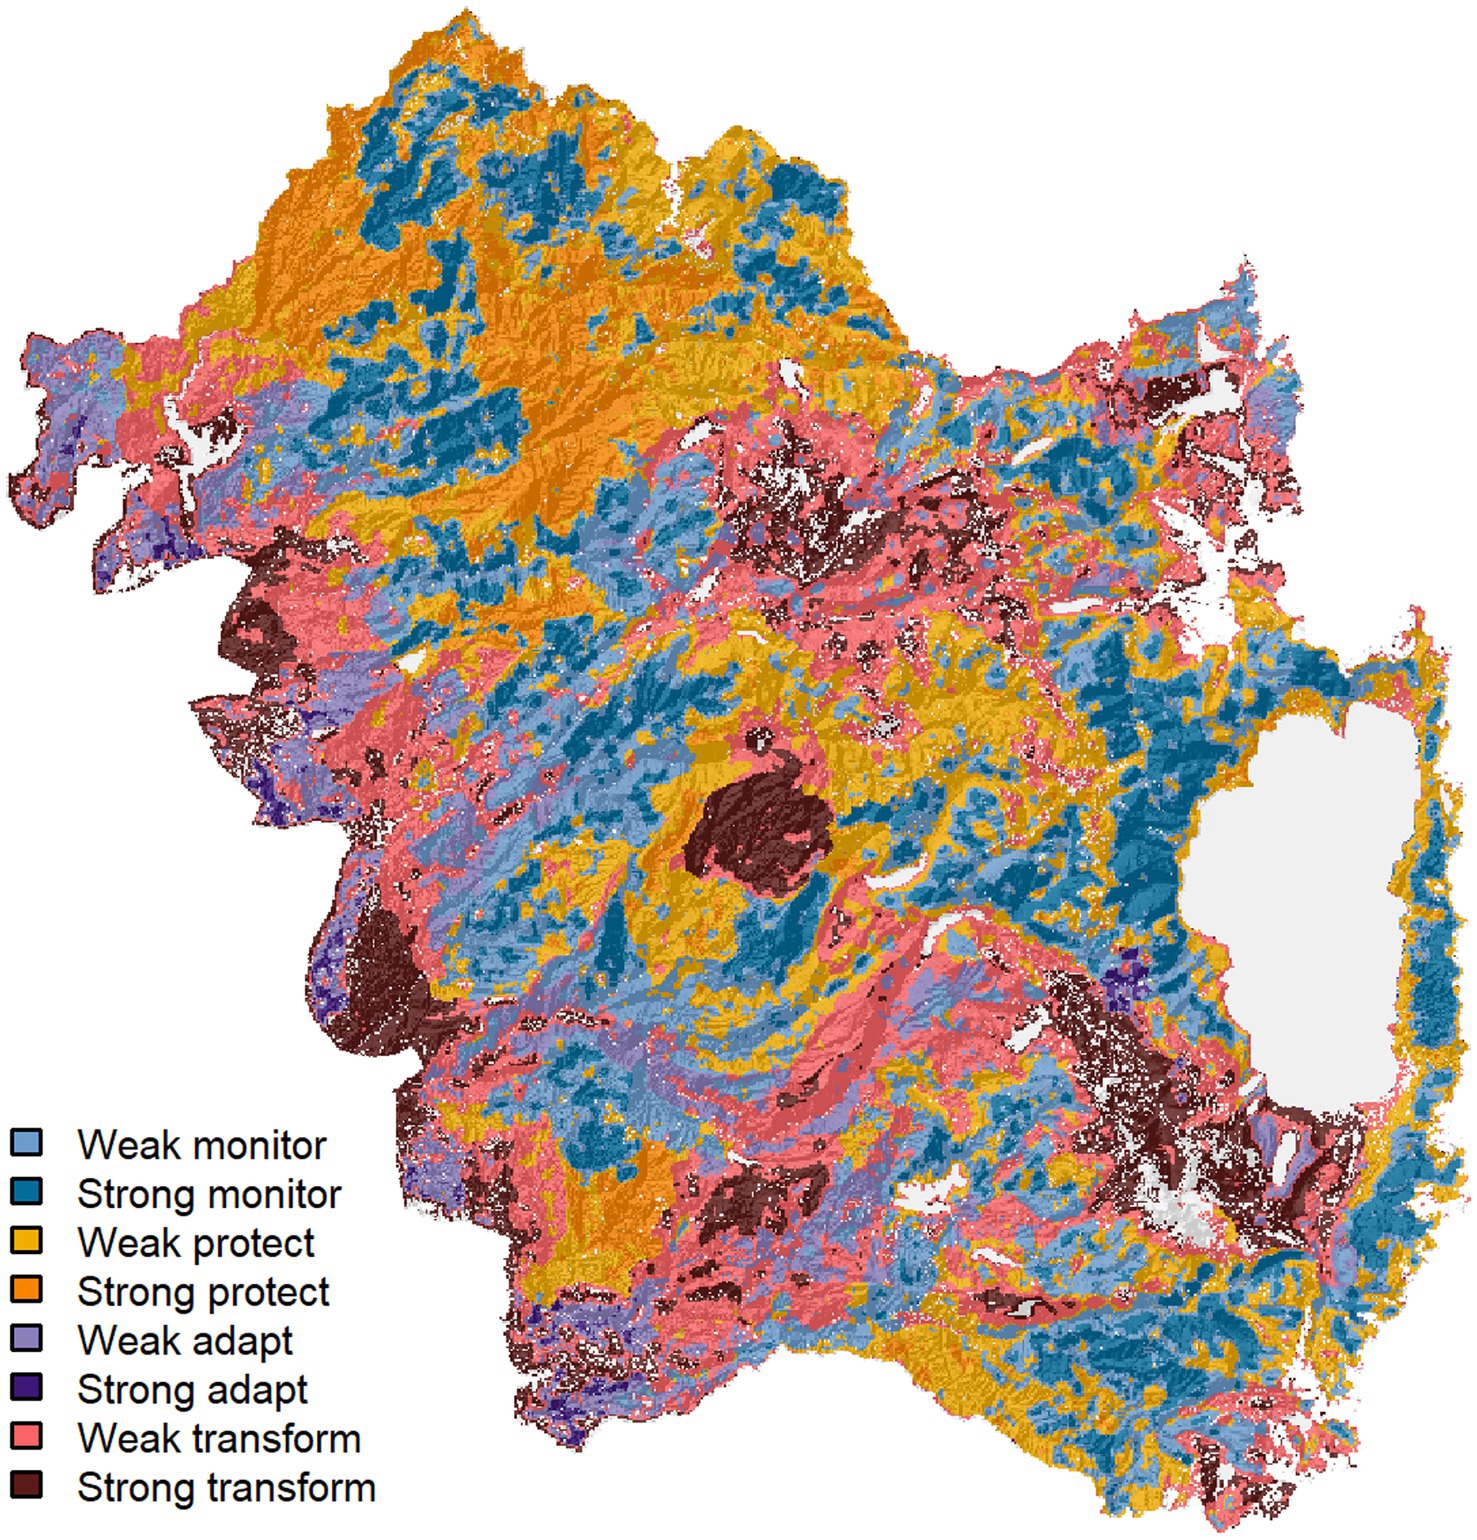
Figure 10. Spatial raster depicting strength of evidence scores for management strategy scores for the carbon pillar across the TCSI landscape. (A) Adapt, (B) Monitor, (C) Transform, and (D) Protect. Scores ranged from −1 (no support for a given management strategy) and +1 (full support). Strong scores were those >0.50 and weak scores were between 0.25 and 0.5.
In sum, the extent of areas with strong support (strategy score > 0.50) for any given management strategy was generally low across strategies: Monitor (12.1% of the forested landscape), Transform (10.7%), Protect (7.6%), and Adapt (0.6%) (Figures 9, 10). Strong support for any given strategy was found across 31% of the landscape, but only 8.2% of the landscape was of high management priority (i.e., Adapt or Protect strategies). Areas with the opportunity for increasing carbon storage (Adapt) were the most limited (<1% of the landscape). When weaker strategy scores were also considered (SOE > 0.25), 81.8% of the landscape showed support for one of the four strategies and 29.2% of the landscape had support for either Adapt (4.7%) or Protect (24.5%) strategies.
4 Discussion
We present the PROMOTE decision support model, which provides a methodology to inform strategic (where to go) and tactical (what to do) management decisions towards the goal of improving social-ecological resilience at landscape and regional levels while considering potential impacts from climate change. This effort expands upon central tenets from previous climate-informed management frameworks [e.g., Resist-Accept-Direct (Schuurman et al., 2022) and Resistance–Resilience–Transformation (Peterson St-Laurent et al., 2021)] by providing a quantitative evaluation of current and future resource conditions within a flexible fuzzy logic model. Landscape simulation modeling with climate change and natural disturbances was used to spatially represent the potential for achieving desired resource conditions over time. PROMOTE model outputs provide spatial maps representing quantitative support for each of four management strategies that cover the full range of potential management responses, from Monitor (intact conditions with low vulnerability over time) to Transform (poor conditions that remain unsuitable into the future). The model allows for an accounting of each management strategy across a landscape and facilitates the development of strategic management plans across ownerships within the analysis domain. These methods can be adapted to include multiple metrics in the evaluation and at multiple scales relevant to landscape and regional planning (Manley et al., This issue). Furthermore, the PROMOTE model is amenable to alternative representations of future conditions where landscape modeling is not available or feasible to implement. For example, Povak et al. (2024) provide an assessment of future ecosystem resource stability using climate analog modeling at 1 km resolution for the state of California. Other approaches (e.g., Thorne et al., 2017; Triepke et al., 2019) can be readily applied across large spatial extents and require less model calibration and processing time compared to simulation modeling.
4.1 Scaling management to landscapes
Climate change and natural disturbances will continue to be the main determinants of system-level dynamics (North et al., 2021; Larson et al., 2022). While treatments are effective at local scales, strategic planning is required to effectively allocate scarce resources (i.e., crews, equipment, funding, time) at scales large enough to positively impact landscape-scale dynamics and secure ecosystem services. Landscape resilience, therefore, is not a property that can be evaluated or conferred at the patch- or stand-scale, because the dominant pattern-process interactions impacting resilience occur across multiple spatial and temporal scales (Hessburg et al., 2019). Management for resilience is not a stand-level proposition. Without a broader perspective on how disturbances and other broad-scale processes (e.g., seed dispersal and climate adaptation) impact future fine-scale processes (i.e., successional development, carbon sequestration), and how fine-scale patterns (i.e., old forest structural complexity) provide the template for broader scale processes (i.e., high severity fire spread), evaluations of management priorities may fall short in meeting resilience goals (Vose et al., 2021). Specifically, addressing future wildfire disturbances requires a more holistic approach that includes traditional resource-focused management balanced with decision making that integrates future landscape dynamics under climate change. Identifying where resistance will likely not be a successful strategy in the future (Clifford et al., 2022) and working with the dominant natural disturbance processes will be essential to achieve resilience goals at landscape scales.
4.2 Implications of individual management strategies
The PROMOTE model generates a quantitative, continuous value representation of the strength of affiliation with each management strategy. Although the four management strategies represent portions of a gradient along a continuum, the implications of membership in each strategy provides the foundation for effective tactical approaches. Importantly, these four strategies are interpretations of the decision space constructed through the joint assessment of current and future conditions (Figures 2–4), and the four strategies presented here are rooted in the literature and were supported through collaboration. However, inferences made from these evaluations are ultimately left to the users who may have uniquely place-based interpretations of how best to respond to the conditions assessments based on their management priorities. Below, we present interpretations of each management strategy we used to characterize the PROMOTE decision space.
Monitor – This strategy is unique relative to other climate-informed management frameworks in that it identifies areas that do not currently need management input to retain resilient conditions into the future. In our application, strong Monitor areas accounted for approximately 12% of the forested landscape with some higher concentrations in the northernmost reaches of the landscape (Figure 9). Such areas may represent stable climatic and/or disturbance refugia where changes in vegetation and disturbances are less likely or somewhat more remote in time (Carroll et al., 2017; Meddens et al., 2018), and where no management investments are currently warranted. This strategy has two important implications: it (1) identifies areas that are most likely to support a stronghold of favorable conditions that management might want to build on in terms of expanding their size and extent by investing in adjacent areas and (2) enhances efficient and effective management investments by directing them away from Monitor areas and toward those that are more likely to yield short- and long-term benefits.
Protect – The Protect management strategy implies that management can enhance the future prospects of conditions that are otherwise likely to decline with changing climate. In our application, management would most effectively be directed towards vulnerable C hotspots that currently play a valuable role as C sinks and are vulnerable to future climate change. In our study, about 25% of the forested landscape had some support for the Protect strategy indicating much of the C storage capacity on the landscape is vulnerable to disturbances and climate change. This is not unique to the central Sierras; evidence suggests that future drought-induced mortality and large severe disturbance events will likely compromise the capacity of forests to retain their status as carbon sinks (Kurz et al., 2008; Fargione et al., 2018; Albrich et al., 2022). Some studies suggest that Sierran forests are currently overstocked with C and that historical C levels were much lower under an active fire regime (Krofcheck et al., 2017; Liang et al., 2017; Knight et al., 2020; Bernal et al., 2022). Our results suggest that C can be maintained, although at reduced levels, in frequently disturbed forests in the future, likely with strategic management investments.
Adapt – Areas affiliated with the adapt strategy identify areas currently in poor condition but have the demonstrable ability to improve over time under climate change and natural disturbances. The role of management would be to facilitate the attainment of those conditions in the near term with the expectation that they will be stable over time. The PROMOTE model enables managers to differentiate adapt from transform areas that, in contrast, are unlikely to improve in the face of future climate (see below). Management investments can then be made where they have the greatest opportunity to retain high functioning conditions on the landscape while facilitating changes where conditions can likely be sustained. Concomitant with a substantial opportunity for improvement, adapt areas are also most likely to benefit from a wider range of management investments, although some will undoubtedly be more effective than others. Management investments are driven and constrained by a wide array of factors, so adapt areas offer opportunity for progress regardless of the type or character of treatment options that might be available to managers. In our evaluation, we found that areas with currently low C storage account for 63% of the landscape. Within that subset, the adapt strategy accounted for <1% of the area and transform accounted for the balance (62%), suggesting that active restoration likely has a limited capacity to increase C amounts in the future where C is currently deficient. However, in contrast, McCauley et al. (2019) found landscape treatments increased C 9–18% over no-harvest scenarios in the US Southwest, suggesting that strategic treatment implementations may have landscape-level C benefits over time by reducing losses to wildfire broadly and increasing forest productivity locally.
Transform – Areas identified as strong transforms can be interpreted in two ways. Firstly, these areas may provide opportunities to manage for alternative stable states (e.g., non-forest types, early seral stages, dominant species composition) that provide alternative or additional functionality. In western North America, early seral and non-forest types were historically an integral component of the landscape when fires and other disturbances played a more active role in shaping vegetation patterns (Swanson, 2012; Hessburg et al., 2016, 2019, 2021; Hagmann et al., 2021). Such areas can serve important ecological functions such as providing key foraging habitat for certain wildlife species and mitigate the spread and severity of wildfires. Secondly, management may opt to apply treatments in Transform areas but with the knowledge that these conditions may require additional longer-term investments to achieve and maintain management objectives. As such, the model facilitates a shift in management focus on improving areas in the worst condition towards those areas with the highest likelihood of near- and long-term success. Deferring such investments to areas with a higher likelihood of success (e.g., adapt areas) may improve return on investments as these areas have a demonstrated ability to achieve desired conditions.
5 Conclusion
The scale and scope of land management problems requires a flexible and multifaceted approach that includes both engineered solutions aimed at reducing near-term risks to resources from disturbances and ecological solutions aimed at improving long-term social-ecological resilience (Millar et al., 2007; Seddon et al., 2020a,b). Such an approach necessitates access to tools to ensure that investments made at the stand-scale can impact landscape resilience properties while procuring ecosystem service benefits. By modeling landscape dynamics over time under climate change, the PROMOTE model captures the relevant dynamics at the scale necessary to capture top-down drivers from climate and contagious disturbances processes (i.e., meso-scale, Moritz et al., 2011). Doing so provides the broader context with which to evaluate possible future trajectories and outcomes from management, thereby enabling managers to account for the complexity of interacting ecological and social factors acting within landscapes. Furthermore, PROMOTE model outputs can be used within a multi-criteria decision (Marques et al., 2021) or optimization (Ager et al., 2017) modeling framework to assess tradeoffs and synergies among strategic planning options. Such models help resolve complex decision-making problems where there are multiple resources of interest and varying priorities among interest groups to consider. These models also allow for the inclusion of other factors that may influence decisions including treatment costs and revenues, social/political/cultural factors, and other potential limitations on treatment activities.
Data availability statement
The raw data supporting the conclusions of this article will be made available by the authors, without undue reservation.
Author contributions
NP: Conceptualization, Data curation, Formal analysis, Methodology, Software, Visualization, Writing – original draft, Investigation. PM: Conceptualization, Funding acquisition, Methodology, Project administration, Supervision, Writing – original draft. KW: Conceptualization, Funding acquisition, Investigation, Project administration, Writing – original draft.
Funding
The author(s) declare financial support was received for the research, authorship, and/or publication of this article. Project partially funded by the Sierra Nevada Conservancy through the Tahoe-Central Sierra Landscape-level Restoration Program Regional Initiatives and Priority Area Justification via the CAL FIRE Forest Health Grant Program (#16-GGRF-FH-0011-NEU).
Acknowledgments
The authors would like to acknowledge the contributions of several colleagues including Liraz Bistriz, Linda Long, Kathy Zeller, Kira Hefty, and Tucker Furniss. We thank Paul Hessburg and Keith Reynolds for friendly reviews of the manuscript and invaluable discussions on the model development. The authors are grateful for the modeling efforts of Charles Maxwell, Rob Scheller, and Samuel Flake who contributed LANDIS-II outputs for this project. Thanks also go out to members of the California Tahoe Conservancy and Sierra Nevada Conservancy including Kim Carr, Sarah Campe, and Erin Ernst for their efforts in providing feedback to the application of this research in TCSI, as well as Forest Schafer (California Natural Resources Agency), and Nic Enstice (California Department of Conservation).
Conflict of interest
The authors declare that the research was conducted in the absence of any commercial or financial relationships that could be construed as a potential conflict of interest.
Publisher’s note
All claims expressed in this article are solely those of the authors and do not necessarily represent those of their affiliated organizations, or those of the publisher, the editors and the reviewers. Any product that may be evaluated in this article, or claim that may be made by its manufacturer, is not guaranteed or endorsed by the publisher.
Footnotes
References
Abatzoglou, J. T., and Brown, T. J. (2012). A comparison of statistical downscaling methods suited for wildfire applications. Int. J. Climatol. 32, 772–780. doi: 10.1002/joc.2312
Abelson, E. S., Reynolds, K. M., Manley, P., and Paplanus, S. (2021). Strategic decision support for long-term conservation management planning. For. Ecol. Manag. 497:119533. doi: 10.1016/j.foreco.2021.119533
Ager, A. A., Evers, C. R., Day, M. A., Alcasena, F. J., and Houtman, R. (2021). Planning for future fire: scenario analysis of an accelerated fuel reduction plan for the western United States. Landsc. Urban Plan. 215:104212. doi: 10.1016/j.landurbplan.2021.104212
Ager, A. A., Vogler, K. C., Day, M. A., and Bailey, J. D. (2017). Economic opportunities and trade-offs in collaborative forest landscape restoration. Ecol. Econ. 136, 226–239. doi: 10.1016/j.ecolecon.2017.01.001
Albrich, K., Seidl, R., Rammer, W., and Thom, D. (2022). From sink to source: Changing climate and disturbance regimes could tip the 21st century carbon balance of an unmanaged mountain forest landscape. Forestry Int. J. Forest Res. 96, 399–409. doi: 10.1093/forestry/cpac022
Anderegg, W. R., Trugman, A. T., Badgley, G., Anderson, C. M., Bartuska, A., Ciais, P., et al. (2020). Climate-driven risks to the climate mitigation potential of forests. Science 368:eaaz7005. doi: 10.1126/science.aaz7005
Badgley, G., Freeman, J., Hamman, J. J., Haya, B., Trugman, A. T., Anderegg, W. R., et al. (2022). Systematic over-crediting in California’s forest carbon offsets program. Glob. Chang. Biol. 28, 1433–1445. doi: 10.1111/gcb.15943
Bernal, A. A., Stephens, S. L., Collins, B. M., and Battles, J. J. (2022). Biomass stocks in California’s fire-prone forests: mismatch in ecology and policy. Environ. Res. Lett. 17:044047. doi: 10.1088/1748-9326/ac576a
Carroll, C., Roberts, D. R., Michalak, J. L., Lawler, J. J., Nielsen, S. E., Stralberg, D., et al. (2017). Scale-dependent complementarity of climatic velocity and environmental diversity for identifying priority areas for conservation under climate change. Glob. Chang. Biol. 23, 4508–4520. doi: 10.1111/gcb.13679
Clifford, K. R., Cravens, A. E., and Knapp, C. N. (2022). Responding to ecological transformation: mental models, external constraints, and manager decision-making. Bioscience 72, 57–70. doi: 10.1093/biosci/biab086
Decker, R.R., Baskett, M.L., and Hastings, A., (2021). Trailing-edge zombie forests can increase population persistence in the face of climate change. bioRxivdoi: 10.1101/2021.12.07.471250
Dewitz, J. (2019). National Land Cover Database (NLCD) 2016 products: U.S. Geol. Survey Data Release 66:6HHBIE. doi: 10.5066/P96HHBIE
Dobrowski, S. Z., Abatzoglou, J., Swanson, A. K., Greenberg, J. A., Mynsberge, A. R., Holden, Z. A., et al. (2013). The climate velocity of the contiguous U nited S tates during the 20th century. Glob. Chang. Biol. 19, 241–251. doi: 10.1111/gcb.12026
Fargione, J. E., Bassett, S., Boucher, T., Bridgham, S. D., Conant, R. T., Cook-Patton, S. C., et al. (2018). Natural climate solutions for the United States. Science. Advances 4:eaat1869. doi: 10.1126/sciadv.aat1869
Geologic Survey, U. S. (2019). USGS 30 meter resolution, one-sixtieth degree National Elevation Dataset for CONUS, Alaska, Hawaii, Puerto Rico, and the US Virgin Islands., accessed December 10, 2019 Available at: https://www.usgs.gov/the-national-map-data-delivery
Gustafson, E. J., Shifley, S. R., Mladenoff, D. J., Nimerfro, K. K., and He, H. S. (2000). Spatial simulation of forest succession and timber harvesting using LANDIS. Can. J. For. Res. 30, 32–43. doi: 10.1139/x99-188
Hagmann, R. K., Hessburg, P. F., Prichard, S. J., Povak, N. A., Brown, P. M., Fulé, P. Z., et al. (2021). Evidence for widespread changes in the structure, composition, and fire regimes of western North American forests. Ecol. Appl. 31, 1–34. doi: 10.1002/eap.2431
Hessburg, P. F., Churchill, D. J., Larson, A. J., Haugo, R. D., Miller, C., Spies, T. A., et al. (2015). Restoring fire-prone inland Pacific landscapes: seven core principles. Landsc. Ecol. 30, 1805–1835. doi: 10.1007/s10980-015-0218-0
Hessburg, P. F., Miller, C. L., Parks, S. A., Povak, N. A., Taylor, A. H., Higuera, P. E., et al. (2019). Climate, environment, and disturbance history govern resilience of western North American forests. Front. Ecol. Evol. 7:239. doi: 10.3389/fevo.2019.00239
Hessburg, P. F., Prichard, S. J., Hagmann, R. K., Povak, N. A., and Lake, F. K. (2021). Wildfire and climate change adaptation of western North American forests: a case for intentional management. Ecol. Appl. 31:e02432. doi: 10.1002/eap.2432
Hessburg, P. F., Spies, T. A., Perry, D. A., Skinner, C. N., Taylor, A. H., Brown, P. M., et al. (2016). Tamm review: management of mixed-severity fire regime forests in Oregon, Washington, and northern California. For. Ecol. Manag. 366, 221–250. doi: 10.1016/j.foreco.2016.01.034
Hill, A. P., and Field, C. B. (2021). Forest fires and climate-induced tree range shifts in the western US. Nat. Commun. 12, 1–10. doi: 10.1038/s41467-021-26838-z
IPCC, (2006), IPCC guidelines for national greenhouse gas inventories, 4, Agriculture, Forestry and other land use (AFLOLU). Institute for Global Environmental Strategies, Hayama, Kanagawa, Japan
Johnson, M. C., and Kennedy, M. C. (2019). Altered vegetation structure from mechanical thinning treatments changed wildfire behaviour in the wildland–urban interface on the 2011 wallow fire, Arizona, USA. Int. J. Wildland Fire 28, 216–229. doi: 10.1071/WF18062
Keane, R. E., Drury, S. A., Karau, E. C., Hessburg, P. F., and Reynolds, K. M. (2010). A method for mapping fire hazard and risk across multiple scales and its application in fire management. Ecol. Model. 221, 2–18. doi: 10.1016/j.ecolmodel.2008.10.022
Kelly, E. C., Charnley, S., and Pixley, J. T. (2019). Polycentric systems for wildfire governance in the Western United States. Land Use Policy 89:104214. doi: 10.1016/j.landusepol.2019.104214
Knight, C. A., Cogbill, C. V., Potts, M. D., Wanket, J. A., and Battles, J. J. (2020). Settlement-era forest structure and composition in the Klamath Mountains: reconstructing a historical baseline. Ecosphere 11:e03250. doi: 10.1002/ecs2.3250
Krofcheck, D. J., Hurteau, M. D., Scheller, R. M., and Loudermilk, E. L. (2017). Restoring surface fire stabilizes forest carbon under extreme fire weather in the Sierra Nevada. Ecosphere 8:e01663. doi: 10.1002/ecs2.1663
Kurz, W. A., Stinson, G., Rampley, G. J., Dymond, C. C., and Neilson, E. T. (2008). Risk of natural disturbances makes future contribution of Canada's forests to the global carbon cycle highly uncertain. Proc. Natl. Acad. Sci. 105, 1551–1555. doi: 10.1073/pnas.0708133105
Larson, A. J., Jeronimo, S. M., Hessburg, P. F., Lutz, J. A., Povak, N. A., Cansler, C. A., et al. (2022). Tamm review: ecological principles to guide post-fire forest landscape management in the inland Pacific and northern Rocky Mountain regions. For. Ecol. Manag. 504:119680. doi: 10.1016/j.foreco.2021.119680
Liang, S., Hurteau, M. D., and Westerling, A. L. (2017). Potential decline in carbon carrying capacity under projected climate-wildfire interactions in the Sierra Nevada. Sci. Rep. 7, 1–7. doi: 10.1038/s41598-017-02686-0
Lyons-Tinsley, C., and Peterson, D. L. (2012). Surface fuel treatments in young, regenerating stands affect wildfire severity in a mixed conifer forest, eastside Cascade Range, Washington, USA. For. Ecol. Manag. 270, 117–125. doi: 10.1016/j.foreco.2011.04.016
MacDicken, K. G., Sola, P., Hall, J. E., Sabogal, C., Tadoum, M., and de Wasseige, C. (2015). Global progress toward sustainable forest management. For. Ecol. Manag. 352, 47–56. doi: 10.1016/j.foreco.2015.02.005
Manickam, V., Krishna, I. V. M., Shanti, S. K., Radhika, R., Campus, B. V., and Pradesh, A. (2014). Biomass calculations for carbon sequestration in forest ecosystem. J. Energy 2, 30–38. doi: 10.3390/f12070867
Manley, P. N., Povak, N. A., and Wilson, K. N. (This issue) A framework for socio-ecological resilience to inform management strategies across forested landscapes. Ecosphere 6:286980. doi: 10.3389/ffgc.2023.1286980
Manley, P.N., Povak, N.A., and Wilson, K.N., Fairweather, M.L, Griffey, V., and Long, L.L., Blueprint for resilience: the Tahoe-central Sierra initiative. Gen. Tech. Rep. PSW-GTR-277. Albany, CA: U.S. Department of Agriculture, Forest Service, Pacific southwest Research Station. GTR, 277,:94, doi: 10.2737/PSW-GTR-277
Marques, M., Reynolds, K. M., Marques, S., Marto, M., Paplanus, S., and Borges, J. G. (2021). A participatory and spatial multicriteria decision approach to prioritize the allocation of ecosystem services to management units. Land 10:747. doi: 10.3390/land10070747
Marto, M., Reynolds, K. M., Borges, J. G., Bushenkov, V. A., Marques, S., Marques, M., et al. (2019). Web-based forest resources management decision support system. Forests 10:1079. doi: 10.3390/f10121079
Maxwell, C., Scheller, R. M., Wilson, K. P., and Manley, P. N. (2022). Effectiveness of landscape-scale forest restoration to improve restoration outcomes under projected climate change. Frontiers in forests and global. Change 5:740869. doi: 10.3389/ffgc.2022.740869
McCauley, L. A., Robles, M. D., Woolley, T., Marshall, R. M., Kretchun, A., and Gori, D. F. (2019). Large-scale forest restoration stabilizes carbon under climate change in Southwest United States. Ecol. Appl. 29:e01979. doi: 10.1002/eap.1979
McIver, C. P., and Becker, D. R. (2021). An empirical evaluation of the impact of collaboration on the pace and scale of national forest management in Idaho. For. Sci. 67, 49–59. doi: 10.1093/forsci/fxaa040
McWethy, D. B., Schoennagel, T., Higuera, P. E., Krawchuk, M., Harvey, B. J., Metcalf, E. C., et al. (2019). Rethinking resilience to wildfire. Nat. Sustain. 2, 797–804. doi: 10.1038/s41893-019-0353-8
Meddens, A. J., Kolden, C. A., Lutz, J. A., Smith, A. M., Cansler, C. A., Abatzoglou, J. T., et al. (2018). Fire refugia: what are they, and why do they matter for global change? Bioscience 68, 944–954. doi: 10.1093/biosci/biy103
Millar, C. I., Stephenson, N. L., and Stephens, S. L. (2007). Climate change and forests of the future: managing in the face of uncertainity. Ecol. Appl. 17, 2145–2151. doi: 10.1890/06-1715.1
Miller, B.J., and Saunders, M.C., (2002). The NetWeaver reference manual. Pennsylvania State University, College Park, PA
Morelli, T. L., Daly, C., Dobrowski, S. Z., Dulen, D. M., Ebersole, J. L., Jackson, S. T., et al. (2016). Managing climate change refugia for climate adaptation. PLoS One 11:e0159909. doi: 10.1371/journal.pone.0159909
Moritz, M. A., Hessburg, P. F., and Povak, N. A. (2011). “Native fire regimes and landscape resilience” in The landscape ecology of fire (Dordrecht: Springer), 51–86.
North, M. P., Collins, B. M., and Stephens, S. L. (2012). Using fire to increase the scale, benefits and future maintenance of fuels treatments. J. For. 110, 492–401. doi: 10.5849/jof.12-021
North, M. P., York, R. A., Collins, B. M., Hurteau, M. D., Jones, G. M., Knapp, E. E., et al. (2021). Pyrosilviculture needed for landscape resilience of dry western United States forests. J. For. 119, 520–544. doi: 10.1093/jofore/fvab026
Pascual, A., Giardina, C. P., Povak, N. A., Hessburg, P. F., and Asner, G. P. (2022). Integrating ecosystem services modeling and efficiencies in decision-support models conceptualization for watershed management. Ecol. Model. 466:109879. doi: 10.1016/j.ecolmodel.2022.109879
Peterson St-Laurent, G., Oakes, L. E., Cross, M., and Hagerman, S. (2021). R–R–T (resistance–resilience–transformation) typology reveals differential conservation approaches across ecosystems and time. Commun. Biol. 4, 1–9. doi: 10.1038/s42003-020-01556-2
Pierce, D. W., Kalansky, J. F., and Cayan, D. R. (2018). Climate, drought, and sea level rise scenarios for California’s fourth climate change assessment. Sacramento, CA: California Energy Commission and California Natural Resources Agency.
Povak, N. A., Furniss, T. J., Hessburg, P. F., Salter, R. B., Wigmosta, M., Duan, Z., et al. (2022). Evaluating basin-scale Forest adaptation scenarios: wildfire, streamflow, biomass, and economic recovery synergies and trade-offs. Front. Forests Global Change 5:805179. doi: 10.3389/ffgc.2022.805179
Povak, N. A., Kane, V. R., Collins, B. M., Lydersen, J. M., and Kane, J. T. (2020). Multi-scaled drivers of severity patterns vary across land ownerships for the 2013 rim fire. Landscape Ecol. 35, 293–318. doi: 10.1007/s10980-019-00947-z
Povak, N. A., and Manley, P. N. (2024). Evaluating climate change impacts on ecosystems resources through the lens of climate analog modeling. Frontiers in forests and global. Change 6:286980.
Prichard, S. J., Hessburg, P. F., Hagmann, R. K., Povak, N. A., Dobrowski, S. Z., Hurteau, M. D., et al. (2021). Adapting western North American forests to climate change and wildfires: 10 common questions. Ecol. Appl. 31:e02433. doi: 10.1002/eap.2433
Prichard, S. J., Povak, N. A., Kennedy, M. C., and Peterson, D. W. (2020). Fuel treatment effectiveness in the context of landform, vegetation, and large, wind-driven wildfires. Ecol. Appl. 30:e02104. doi: 10.1002/eap.2104
Prober, S. M., Doerr, V. A. J., Broadhurst, L. M., Williams, K. J., and Dickson, F. (2019). Shifting the conservation paradigm: a synthesis of options for renovating nature under climate change. Ecol. Monogr. 89:e01333. doi: 10.1002/ecm.1333
Reynolds, K. M., and Hessburg, P. F. (2005). Decision support for integrated landscape evaluation and restoration planning. For. Ecol. Manag. 207, 263–278. doi: 10.1016/j.foreco.2004.10.040
Reynolds, K. M., and Hessburg, P. F. (2014). An overview of the ecosystem management decision-support system. Making Transp. Environ. Manag. Decisions 2, 3–22. doi: 10.1007/978-3-642-32000-2_1
Reynolds, K.M., Hessburg, P.F., and Bourgeron, P.S. (2014). Making transparent environmental management decisions. Berlin and Heidelberg: Springer
Runyon, A. N., Carlson, A. R., Gross, J. E., Lawrence, D. J., and Schuurman, G. W. (2020). Repeatable approaches to work with scientific uncertainty and advance climate change adaptation in US national parks. Parks Stewardship Forum 36, 98–104. doi: 10.5070/P536146402
Scheller, R. M., Domingo, J. B., Sturtevant, B. R., Williams, J. S., Rudy, A., Gustafson, E. J., et al. (2007). Design, development, and application of LANDIS-II, a spatial landscape simulation model with flexible temporal and spatial resolution. Ecol. Model. 201, 409–419. doi: 10.1016/j.ecolmodel.2006.10.009
Scheller, R. M., Hua, D., Bolstad, P. V., Birdsey, R., and Mladenoff, D. J. (2011). The effects of forest harvest intensity in combination with wind disturbance on carbon dynamics in a Lake states Mesic landscape. Ecol. Model. 222, 144–153. doi: 10.1016/j.ecolmodel.2010.09.009
Scheller, R. M., Kretchun, A., Hawbaker, T. J., and Henne, P. D. (2019). A landscape model of variable social-ecological fire regimes. Ecol. Model. 401, 85–93. doi: 10.1016/j.ecolmodel.2019.03.022
Schmidt, C., (2021). Landscape resilience: basics, case studies, Practical Recommendations. Springer Nature
Schuurman, G. W., Cole, D. N., Cravens, A. E., Covington, S., Crausbay, S. D., Hoffman, C. H., et al. (2022). Navigating ecological transformation: resist–accept–direct as a path to a new resource management paradigm. Bioscience 72, 16–29. doi: 10.1093/biosci/biab067
Seddon, N., Chausson, A., Berry, P., Girardin, C. A., Smith, A., and Turner, B. (2020a). Understanding the value and limits of nature-based solutions to climate change and other global challenges. Philos. Trans. R. Soc. B 375:20190120. doi: 10.1098/rstb.2019.0120
Seddon, N., Daniels, E., Davis, R., Chausson, A., Harris, R., Hou-Jones, X., et al. (2020b). Global recognition of the importance of nature-based solutions to the impacts of climate change. Global Sustainability 3:e8. doi: 10.1017/sus.2020.8
Sierra, C. A., Crow, S. E., Heimann, M., Metzler, H., and Schulze, E. D. (2021). The climate benefit of carbon sequestration. Biogeosciences 18, 1029–1048. doi: 10.5194/bg-18-1029-2021
Stephens, S. L., Battaglia, M. A., Churchill, D. J., Collins, B. M., Coppoletta, M., Hoffman, C. M., et al. (2021). Forest restoration and fuels reduction: convergent or divergent? Bioscience 71, 85–101. doi: 10.1002/eap.2682
Sturtevant, B. R., Gustafson, E. J., Li, W., and He, H. S. (2004). Modeling biological disturbances in LANDIS: a module description and demonstration using spruce budworm. Ecol. Model. 180, 153–174. doi: 10.1016/j.ecolmodel.2004.01.021
Swanson, M.E., (2012). Early seral Forest in the Pacific northwest: a literature review and synthesis of current science. Report for the Willamette National Forest, Central Cascades Adaptive Management Partnership, McKenzie Bridge, OR
Thorne, J. H., Choe, H., Boynton, R. M., Bjorkman, J., Albright, W., Nydick, K., et al. (2017). The impact of climate change uncertainty on California's vegetation and adaptation management. Ecosphere 8:e02021. doi: 10.1002/ecs2.2021
Triepke, F. J., Muldavin, E. H., and Wahlberg, M. M. (2019). Using climate projections to assess ecosystem vulnerability at scales relevant to managers. Ecosphere 10:e02854. doi: 10.1002/ecs2.2854
Vose, J.M., Peterson, D.L., Fettig, C.J., Halofsky, J.E., Hiers, J.K., and Keane, R.E., (2021). Fire and forests in the 21st century: managing resilience under changing climates and fire regimes in USA forests. Fire ecology and management: Past, present, and future of US forested ecosystems (465–502). Springer, Cham
Keywords: climate change, decision support, landscape simulation model, socio-ecological resilience, restoration, ecosystem services, promote
Citation: Povak NA, Manley PN and Wilson KN (2024) Quantitative methods for integrating climate adaptation strategies into spatial decision support models. Front. For. Glob. Change. 7:1286937. doi: 10.3389/ffgc.2024.1286937
Edited by:
Jose G. Borges, University of Lisbon, PortugalReviewed by:
Zhaofei Fan, Auburn University, United StatesDavid Lieske, Mount Allison University, Canada
Copyright © 2024 Povak, Manley and Wilson. This is an open-access article distributed under the terms of the Creative Commons Attribution License (CC BY). The use, distribution or reproduction in other forums is permitted, provided the original author(s) and the copyright owner(s) are credited and that the original publication in this journal is cited, in accordance with accepted academic practice. No use, distribution or reproduction is permitted which does not comply with these terms.
*Correspondence: Nicholas A. Povak, bmljaG9sYXMucG92YWtAdXNkYS5nb3Y=