Trees diversity explains variations in biodiversity-ecosystem function relationships across environmental gradients and conservation status in riparian corridors
 Socrate Mercator Dossou Kinnoumè1*†
  Gérard Nounagnon Gouwakinnou1†
  Florent Noulèkoun1,2
  Rodrigue Ogoulonou Balagueman3
  Thierry Dèhouégnon Houehanou1 Armand Kuyéma Natta4
- 1Research Unit of Biodiversity Conservation at the Interface People, Land use and Climate Changes (BIPLaC), Laboratory of Ecology, Botany and Plant Biology, Faculty of Agronomy, University of Parakou, Parakou, Benin
- 2Department of Environmental Science and Ecological Engineering, Korea University, Seoul, Republic of Korea
- 3Research Unit of Forest Biology and Ecological Modeling (UR-BioME), Laboratory of Ecology, Botany and Plant Biology, University of Parakou, Parakou, Benin
- 4Laboratory of Ecology, Botany and Plant Biology, Faculty of Agronomy, University of Parakou, Parakou, Benin
Riparian ecosystems are recognized as large reservoirs of biodiversity providing important ecosystem services. However, the relationship between tree species diversity and ecosystem functions and the underlying ecological mechanisms have less been studied in riparian corridors. This study assessed the effect of tree diversity (taxonomic, functional, and phylogenetic) on riparian ecosystem functions (habitat quality–HbQ and aboveground carbon–AGC) across environmental gradients (distances to stream bed) and conservation status. Data were collected from 96 inventory plots installed in a 1 km buffer zone on either side of permanent streams in the Upper Ouémé watershed in northern Benin. We employed linear mixed effects models and structural equation modeling to analyze the data. We found that ecosystem functions (HbQ, AGC) and diversity attributes including species richness (SR), Faith’s phylogenetic diversity index (PD) and community-weighted mean of maximum height (CWMHmax) were significantly lower away from the streambed than nearby. The correlation between SR and ecosystem functions was significant and positive across and within the distance gradient and conservation status. We also found that the CWMHmax was the best predictor of both ecosystem functions, and that PD mediated the effect of SR on AGC and HbQ in areas close to the streambed and in unprotected areas, respectively. Our study reveals the influence of human activities on biodiversity and ecosystem functioning relationships in riparian corridors and provides new insights into the importance of tall stature trees and species with distant lineages for the functioning of these ecosystems. Based on the variables measured and tested in this study, we argue that riparian corridor management policies should consider plant traits and phylogeny and promote wider riparian buffers for the co-benefits of biodiversity conservation and climate change mitigation.
1 Introduction
Understanding the relationships between biodiversity and the functioning of ecosystems is a central focus of conservation ecology research. Riparian ecosystems provide important ecosystem services (hereafter ES) and refuge habitats for many animals and plant species (Natta et al., 2002; Swanson and Bohlman, 2021; Saklaurs et al., 2022), particularly in arid and semi-arid Sudanian areas, where they are the only ecosystems that offers environmental conditions similar to those prevailing in wetland ecosystems (Natta, 2003). Riparian ecosystems have received more attention in recent decades especially due to their potential to play a dual role as corridors for dispersing individuals and genes and mitigating climate change through carbon sequestration (Seavy et al., 2009; Dybala et al., 2019). However, studies about the relationships between tree species diversity, habitat quality (HbQ) and carbon storage in riparian ecosystems are still limited. Previous studies have shown that HbQ ensures functionality in different types of ecosystems around the world (Deng et al., 2018; Mensah et al., 2020a; Mengist et al., 2021; Yang et al., 2021; Jin et al., 2022). For example, Yang et al. (2021) analyzed changes in trade-offs and synergistic relationships between grassland functions, including HbQ and carbon storage, in the Yellow River watershed in China. These two ecosystem functions were also considered in the analysis of the influence of tree species diversity on ecosystems multifunctionality in the Afromontane forest in South Africa (Mensah et al., 2020a). Assessing HbQ and carbon storage in riparian corridors is particularly important for maintaining biodiversity and sustaining ecosystem functioning.
The relationships between tree species diversity and ES are controlled by an interaction of complex ecological processes (Noulèkoun et al., 2021). Several studies have shown that taxonomic diversity often measured by species richness (SR) does not always cover the entire functional spectrum relevant to specific ecological functions and often lacks information on the evolutionary history of communities (Jarzyna and Jetz, 2016; Mensah et al., 2020a). The combined use of trait-based approaches and phylogenetic attributes to understand ecological processes in plant communities is increasingly relevant because of their potential to provide more information about community structure, ecological strategies and species adaptations (Duru et al., 2014; Jarzyna and Jetz, 2016; Ohlert et al., 2022). Therefore, taking into account the relative importance of biotic mechanisms (quantified through functional diversity, functional composition and phylogenetic diversity) that contribute to ecological processes could help to better explain the relationships between species diversity and ES (Cadotte et al., 2011; Esquivel et al., 2020; Mensah et al., 2020a; Sintayehu et al., 2020; Noulèkoun et al., 2021). These mechanisms are supported by several theories including the “niche complementarity effect” and “selection effect,” which are widely debated in the literature (Mensah et al., 2016; Ali, 2019; Sintayehu et al., 2020; Noulèkoun et al., 2021; Ullah et al., 2021). The niche complementarity, which can be tested using functional diversity attributes (Violle et al., 2007; Noulèkoun et al., 2021), suggests that increasing species diversity would promote a greater pool of functional traits with a positive effect on ecosystem functioning due to efficient use of available resources (e.g., light; Tilman et al., 1997; Hector, 1998). As an alternative to the niche complementarity effect, the selection effect, often tested using functional composition attributes, postulates that a more diverse community has a higher probability of including one or few dominant species that disproportionally contribute to ecosystem functioning (Tilman et al., 1997; Hector, 1998). Evidence for selection effect has been indicated partly through support to the “mass ratio” hypothesis in forests, which posits that the functional traits of the dominant species primarily determine ecosystem functioning (Grime, 1998; Ruiz-Benito et al., 2014). In addition to functional diversity and composition, phylogenetic diversity that quantifies the relatedness between species within a community, such as the sum of the lengths of branches in a phylogenetic tree linking all species (Faith, 2006; MacIvor et al., 2018), has the potential to increase ecosystem functioning via complementarity of beneficial attributes among phylogenetically distant species (Navarro-Cano et al., 2016; Oka et al., 2019).
Furthermore, ecological processes that directly or indirectly influence the relationships between biodiversity and ecosystem functioning may vary depending on the environmental context (Mensah et al., 2016; Noulèkoun et al., 2021; Pyles et al., 2022; Swacha et al., 2023). For example, Noulèkoun et al. (2021) found that functional composition attributes linked SR to aboveground carbon (AGC) at a broad environmental scale. Similarly, Butterfield and Suding (2013) found that single-trait indices of functional composition best related changes in environmental gradients to forage productivity and soil carbon. Yuan et al. (2020) also reported an indirect effect of plant phylogenetic diversity via increased stand structural complexity on multiple ecosystem functions, under the influence of local scale changes in environmental conditions. However, although many attempts have been made to explain the influence of environmental factors (e.g., slope, altitude, soil characteristics, climate and disturbance regimes) on the relationships between species diversity and ecosystem functions (Concostrina-Zubiri et al., 2014; Mensah et al., 2016, 2023a; Noulèkoun et al., 2021, 2024; Pyles et al., 2022; Swacha et al., 2023), additional knowledge on the role of other aspects like ecosystem conservation status and the distance from streambed may shed new insights on the functioning of riparian corridors. Reports from the Habitats Directive (92/43/European Economic Community) suggest that protected areas better contribute to the protection of habitats and species and offer more opportunities to safeguard ESs than non-protected areas (Maes et al., 2012; Rees et al., 2013). For example, Maes et al. (2012) observed that habitats with a conservation status provided more biodiversity and ESs than unprotected habitats. Similarly, Huang et al. (2022) showed that the Amazon protected areas have a cooling effect on local land surface temperature compared to unprotected areas with the same land cover. Therefore, conservation status could influence the relationships between ESs (e.g., HbQ, carbon storage) and tree species diversity, especially in specific ecosystems such as the riparian corridors.
It is also important to examine the influence of the spatial distribution of riparian forests (Ding et al., 2017) by including the mediation effect of the distance gradient from the streambed in the relationships between tree species diversity and ESs. For example, previous studies have found a negative correlation of AGC stocks with distance to streambeds (Suchenwirth et al., 2012; Nunes et al., 2018). Besides, several studies found that HbQ (in terms of structure and diversity) of natural ecosystems was correlated with the distance to the streambed due to human proximity and variation in soil properties and light intensity (Swamy et al., 2000; Herrero-Jáuregui et al., 2011; Keeton et al., 2017; Kouagou et al., 2018; Leishangthem and Singh, 2018). The integration of the abovementioned abiotic factors into an integrative model that analyses the relationships between species diversity and ecosystem functioning could help to define strategies for the sustainable management of riparian corridors and take appropriate legislative measures to maintain ecological connectivity.
In this study we employed a piecewise structural equation modeling (pSEM) to test three major hypotheses based on three major research questions on biodiversity–ecosystem functioning relationships. We used HbQ and AGC as proxies for ecosystem functions. We asked:
(1) Do ecosystem functions (i.e., HbQ and AGC) and species diversity attributes (i.e., SR, phylogenetic diversity, functional composition, and functional diversity) of riparian corridors vary with the distance from the streambeds and conservation status of the riparian corridors? We hypothesized that HbQ, AGC and species diversity attributes of riparian corridors would decrease with increasing distance from streambed probably because of the higher human pressure far from the streambed and changes in microclimatic conditions and nutrients availability. We also hypothesized that HbQ, AGC and species diversity attributes would be higher in protected areas than non-protected areas due to the more effective management policies in protected areas.
(2) Are HbQ and AGC directly related to SR? How do the SR-HbQ and SR-AGC bivariate relationships change with the distance from the streambeds and conservation status? We hypothesized that HbQ and AGC would increase with SR consistently along the distance gradient from the streambed and across the conservation statuses. However, we expect that the strength of HbQ-SR and AGC-SR bivariate relationships would increase as we move far from the streambeds and would be higher in non-protected areas than in protected areas, probably due to the stress-gradient hypothesis (Maestre et al., 2009) which posits that the positive effects of plant diversity on ecosystem functioning are strengthened in environments unfavorable for plant growth in both experiments and natural systems.
(3) How do other attributes of species diversity (functional diversity, functional composition and phylogenetic diversity) relate SR to HbQ and AGC and what is their relative importance within and across distance from streambed and conservation status? We expect that functional diversity and functional composition attributes would be stronger mediators of the SR-HbQ and SR-AGC relationships than phylogenetic diversity, in line with previous findings showing their greater importance for the functioning of tropical forests (Cavanaugh et al., 2014; Mensah et al., 2016, 2020a,2024; Ali et al., 2017; Sintayehu et al., 2020; Wondimu et al., 2021; Wang and Ali, 2022; Noulèkoun et al., 2024).
2 Materials and methods
2.1 Study area and data collection
The study was carried out in the Upper Ouémé watershed at the Bétérou outlet in northern Benin, located between 9° 9′ and 10° 11′ N and 1° 30′ and 2° 48′ E (Figure 1). This area is located in the Sudanian zone with an average rainfall of around 1,160 mm between 1961 and 2010 (Akognongbe et al., 2014; Biao, 2017; Kodja et al., 2020), and a predominantly ferruginous soil type (Richard, 2012). Land use in this watershed consists of cultivated lands, savannas and gallery forests along the rivers (Bigot et al., 2005; Akognongbe et al., 2014). The watershed covers a total area of 10,140 km2, and 12% of which (1,223 km2) is occupied by the Ouémé Supérieur classified forest.
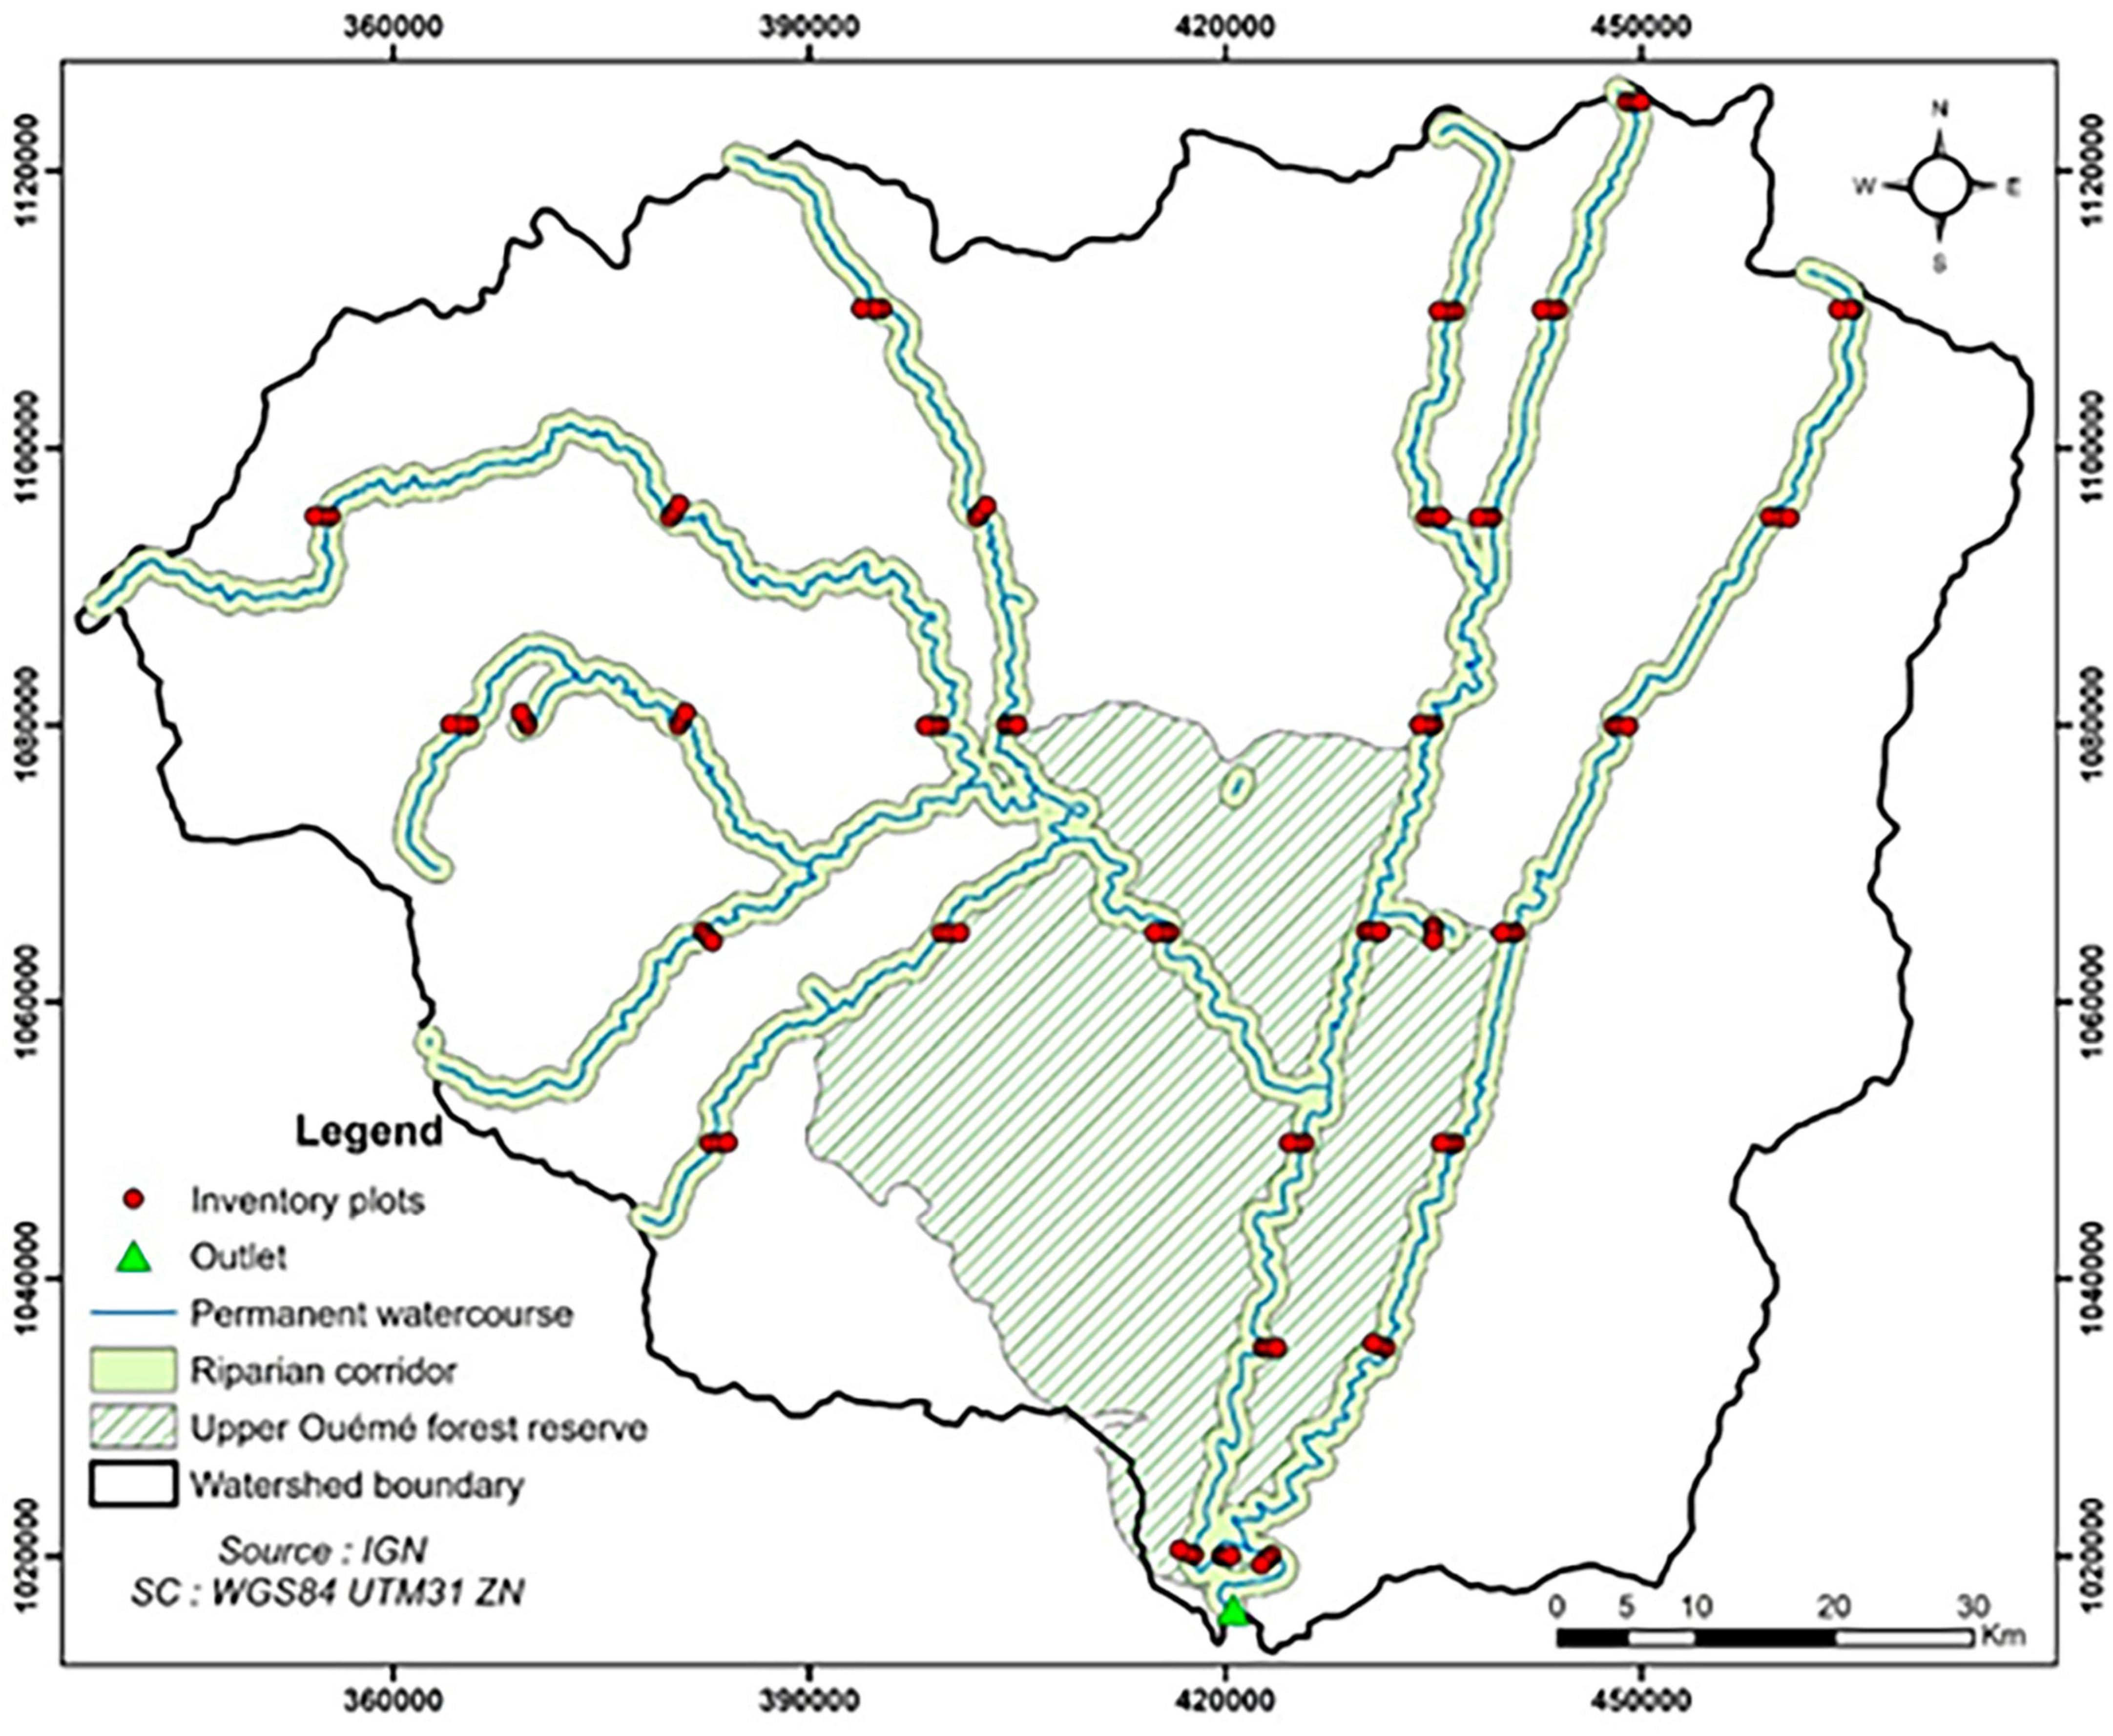
Figure 1. Layout of the forest inventory plots.
We collected data from 32 sites, spanning six (6) municipalities. The sampling sites were selected following the same latitude within a 1 km buffer zone on each side of the permanent streams of the watershed. Three circular plots of 18 m of radius (approximately 0.1 ha) were installed at each site following three distance intervals from the streambed: 0 to 300 m (near), 300 to 600 m (intermediate) and 600 to 1000 m (far). Thus, a total of 96 circular plots were randomly installed and inventoried. Individual trees with a diameter at breast height (DBH) ≥10 cm (referred to as adult trees) were inventoried within the plots of 0.1 ha. The total height (H) and DBH of trees were measured with a handheld clinometer and diameter tape, respectively. At the center of each 0.1 ha plot, a subplot of 4 m of radius (50.24 m2) was installed for the systematic count of young trees (3 cm < DBH < 10 cm and H < 10 m). These data were used in the computation of HbQ.
A total of 1223 trees belonging to 79 species were inventoried. The scientific name of each individual tree species was identified using the national flora of Benin (Akoègninou et al., 2006) and an illustrated collection of Sahelian woody plants (Arbonnier, 2009), with the support of local botanical experts. However, when local experts failed to identify the species or when they have doubt about the species name, specimens were collected and transported to the National Herbarium of Benin for the identification or confirmation of their names.
2.2 Data processing
2.2.1 Ecosystem functions
We considered AGC and HbQ as proxies for ecosystem functions in this study. AGC sequestration is widely recognized as a fundamental ES in the global context of climate change mitigation (Salunkhe et al., 2018). It was selected to account for provisioning ES if harvested as timber in forests but also as regulating ES due to its key role in the global climate regulation. In the context of this study, HbQ measures the health of the ecosystem and generally stands for the property of goodness of ecosystems (Schuler et al., 2017). HbQ is assumed to affect the capacity of an ecosystem to supply services (Liquete et al., 2016).
2.2.1.1 Carbon storage estimation
We first estimated the aboveground biomass (AGB) using the best-fit allometric model developed by Chave et al. (2014) for tropical trees (Eq. 1). By including trunk diameter, total tree height, and specific wood density (WD) in the same aboveground biomass model as covariates, the authors generated a single pan-tropical model using a dataset that covers a wide range of environmental and vegetation types in Africa, South America, South Asia, and Australia. The equation of Chave et al. (2014) has been applied to estimate the AGB of individual trees in several studies conducted in the study region (Mensah et al., 2020b,2023b; Noulèkoun et al., 2024). In the absence of species-specific and regional allometric equations for West-Africa, the Chave et al. (2014) equation can be used for reliable biomass estimates (Mensah et al., 2020b).
where AGB is the aboveground tree biomass (kg); H is the tree Height (m); WD is species-specific wood density (g⋅cm–3); DBH = tree diameter at breast height (cm).
Wood density values were obtained from the global wood density database (Kattge et al., 2011). The CSV file of this global database was obtained from the package BIOMASS version 2.1.8 (Réjou-Méchain et al., 2017) in R version 4.1.0 (R Core Team, 2021). The AGB was estimated at plot level by summing the AGB of all individual trees within the plot. The AGC was estimated by multiplying the plot-level AGB by the conversion factor of 0.47, as recommended by IPCC (2006).
2.2.1.2 Habitat quality estimation
Based on the hypothesis that the vertical structure variability is correlated to habitat quality (Schuler et al., 2017), HbQ was measured by the vertical structural diversity which refers to the Shannon diversity index based on the number of individual stems in tree height classes (Hheight, Eq. 2). Three height classes were defined in this study following Mensah et al. (2020a): < 10 m, 10–20 m and > 20 m. The Hheight was calculated as follows:
where pi is the percentage of trees in the ith height class within the jth sample plot. The higher the Hheight, the better the habitat quality.
2.2.2 Environmental factor
We used the distance from the streambed of riparian corridors as the single environmental factor. The distance from the streambed is considered to affect habitat quality (structure and diversity). A low habitat quality is expected far from the streambed due to the influence of human proximity and variation in soil properties and light intensity (Swamy et al., 2000; Herrero-Jáuregui et al., 2011; Keeton et al., 2017; Kouagou et al., 2018; Leishangthem and Singh, 2018). The plots that are located at < 300 m from the streambed were considered close, those located between 300 and 600 m were at an intermediate distance and those located between 600 and 1000 m were at a far distance away from the streambed.
2.2.3 Riparian corridors status
We used the protection status (protected vs. non-protected) as a measure of corridor’s conservation status. The conservation status is often used by ecologists to evaluate the effectiveness of protected areas. Higher biodiversity is expected in protected areas than in non-protected areas given that human activities are highly restricted in protected areas (Houessou et al., 2013). The conservation status is a categorial variable in this study with two levels: “non-protected areas” when the plot is located in a non-protected area and “protected areas” when it is located in a protected area.
2.2.4 Estimation of diversity metrics
Four metrics were used to measure the diversity of the riparian corridors: taxonomic diversity, functional diversity, functional composition, and phylogenetic diversity. Taxonomic diversity was quantified by the SR, which is defined as the number of distinct species observed within a plot. SR was computed with the package vegan (Okansen et al., 2020) using a species-abundance matrix. Functional diversity was estimated based on three relevant functional traits: specific leaf area (SLA), WD and maximum plant height (Hmax). SLA was obtained from the TRY plant traits database1 (Kattge et al., 2020). The species Hmax was calculated as the 90th percentile height of all trees of the species (Pyles et al., 2022). The trait values were used to estimate functional richness (FRic), functional evenness (FEve), functional divergence (FDiv) and functional dispersion (FDisp) at the plot level (Botta-Dukát, 2005; Villéger et al., 2008) with the package “FD” in R (R Core Team, 2021). The functional composition was measured by the plot level community-weighted mean (CWM) for each functional trait. CWM is the mean of each species trait value weighted by the species relative abundance. Then, CWM was estimated for SLA, WD, and Hmax using the “FD” package in R. The number of plots used to compute functional diversity and composition was limited to 85 because the values of the selected traits were not available for some species recorded in 11 plots.
To estimate the phylogenetic diversity, we first rooted and time-calibrated a phylogenetic tree by connecting the species observed in the 85 surveyed plots to the mega-phylogeny implemented in the V.PhyloMaker2 package (Jin and Qian, 2022). Based on the phylogeny tree, we computed the Faith’s phylogenetic diversity index (PD) using the R package “picante” (Kembel et al., 2010) in R. We also computed the Mean Pairwise Phylogenetic Distance (MPD), the Mean Nearest Taxon Distance (MNTD) and the Nearest Taxon Index (NTI) using V.PhyloMaker2 package. The Standardized Effect Sizes (SESs) of MPD and MNTD were also computed to account for the correlation between species richness and phylogenetic metrics (Mazel et al., 2016; Sandel, 2018).
2.3 Statistical analyses
To test the first hypothesis, we used Generalized Linear Mixed-effects Models (GLMMs) to assess the significant effects of the distance from the streambed and conservation status and their interactions on ecosystem functions and plant diversity metrics. The distance from the streambed and conservation status were used as fixed factors and the site identity (1| sites) as random factor to account for unknown heterogeneity effects (Mensah et al., 2018). Poisson distribution was used to model SR (Zuur et al., 2009; Mensah et al., 2020b) while plant diversity metrics and ecosystem functions were modeled using the Gaussian distribution. Because we have more than one metric that can represent each diversity group (functional diversity, functional composition and phylogenetic diversity), we selected the most representative metric per group by performing multi-model inference analyses using the “dredge” function of the MuMIn package in R (Bartón, 2018). The most representative metric is the one that showed the highest relative importance value. The GLMM parameters were estimated using the package nlme with a restricted maximum likelihood estimator (Pinheiro and Bates, 2000) in R. Conditional R2 (variance explained by fixed and random factors) and marginal R2 (variance explained by fixed factors only) values were computed using the function r.squared GLMM in the package MuMIn (Bartón, 2018). All the dependent variables were scaled but we log-transformed AGC, FRic and CWM of Hmax (CWMHmax) before scaling them to meet the normality assumptions.
To test the second hypothesis, we first used LMM to examine whether the bivariate relationships SR-AGC and SR-HbQ are significant using the initial global dataset. Thereafter, we tested the significance of the LMM for each distance interval and conservation status by splitting the initial global dataset into 5 subsets based on the three distance intervals and two conservation status levels. For the initial dataset, we used 1| sites/ conservation status/distance as a random term. For the subsets, we used 1| sites/distance for each conservation status as a random factor. Alternatively, 1| sites/conservation status was used as a random factor for each distance interval. The significance and strength of the bivariate relationships were compared using the regression slopes (effect sizes) and Pearson coefficients of correlation.
To test the third hypothesis, we performed pSEM based on the most representative metrics that were selected from the multi-model inference analyses. pSEM was chosen because it offers the opportunity to combine in a single causal network several predictor and response variables (Grace, 2006; Shipley, 2016). pSEM is often preferred to the other modeling approaches as it tests the direct and indirect effects of hypothesized causal relationships (Fan et al., 2016) and allows the inclusion of both simple linear and mixed-effects regressions in the modeling framework (Shipley, 2016). For the pSEM analyses, we selected the most representative metrics per group of diversity attributes for the initial pooled dataset and for each distance interval and conservation status using the methodology described above (see 1st paragraph). The pSEM was performed separately for the pooled dataset and for each distance interval and conservation status. To account for unknown heterogeneity effects in the dataset, we used LMM as a regression method to predict all response variables in the pSEM. We used 1| sites/conservation status/distance as a random factor in the LMM for the initial pooled dataset. For each distance interval and conservation status, 1| sites/distance and 1| sites/conservation status were used as random factors, respectively. To perform the pSEM, we started with a saturated model (including all possible causal paths) and improved the model fit by removing non-significant paths while adding potential covariance effects based on the path modification indices (Luo et al., 2019). The saturated model was compared to the reduced models using AIC (Akaike Information Criteria) and the model with the lowest AIC value was selected as the most parsimonious one (Luo et al., 2019). Before the multi-model inference analysis and the pSEM, we standardized all the variables using the function “scale” in R to bring them to the same scale (Fanin et al., 2018). We only tested direct and indirect effects during the modeling given that SR-HbQ and SR-AGC paths were not significant to test the total effect in the pSEM. The indirect effects were determined through manual computation by multiplying the coefficient of the direct effect of SR on the mediator with that of the direct effect of the mediator on the response (AGC or HbQ). The indirect effect is judged significant if the two direct effects are significant.
We fitted all the pSEMs using the “piecewiseSEM” package in R (Lefcheck, 2016). The goodness-of-fit (GOF) of the models was evaluated using the Fisher’s C test statistic. The model is well-fitted to the data when the test probability value of Fisher’s C is greater than the threshold of 5% (Lefcheck, 2016).
3 Results
3.1 Selected metrics of functional diversity, functional composition and phylogenetic diversity
The results from the multi-model inference analyses showed that the CWMHmax, FRic and PD were the most important metrics to predict AGC and HbQ considering the initial dataset (Table 1). Therefore, we represented functional composition by CWMHmax, functional diversity by FRic and phylogenetic diversity by PD in the analyses based on the initial dataset. At the close distance interval, FDiv, CWMHmax, and PD were selected as the most relevant metrics to predict AGC while FDisp, CWMHmax, and MPD showed the highest relative importance values for HbQ. At the intermediate distance, FRic, CWMHmax, and PD exhibited the highest relative importance value and were therefore selected as the most representative metrics to explain AGC and HbQ. Far from the streambed, FDiv, CWMHmax and PD were selected as the most relevant metrics for AGC prediction whereas FRic, CWMSLA, and PD were the most relevant metrics for HbQ. Regarding the conservation status, FRic, CWMHmax, and PD were the most relevant metrics for AGC prediction in protected areas while FDisp, CWMHmax and MNTD were the most relevant for HbQ. In non-protected areas, we selected FDisp, CWMHmax, and PD as the most relevant metrics to explain AGC and HbQ.
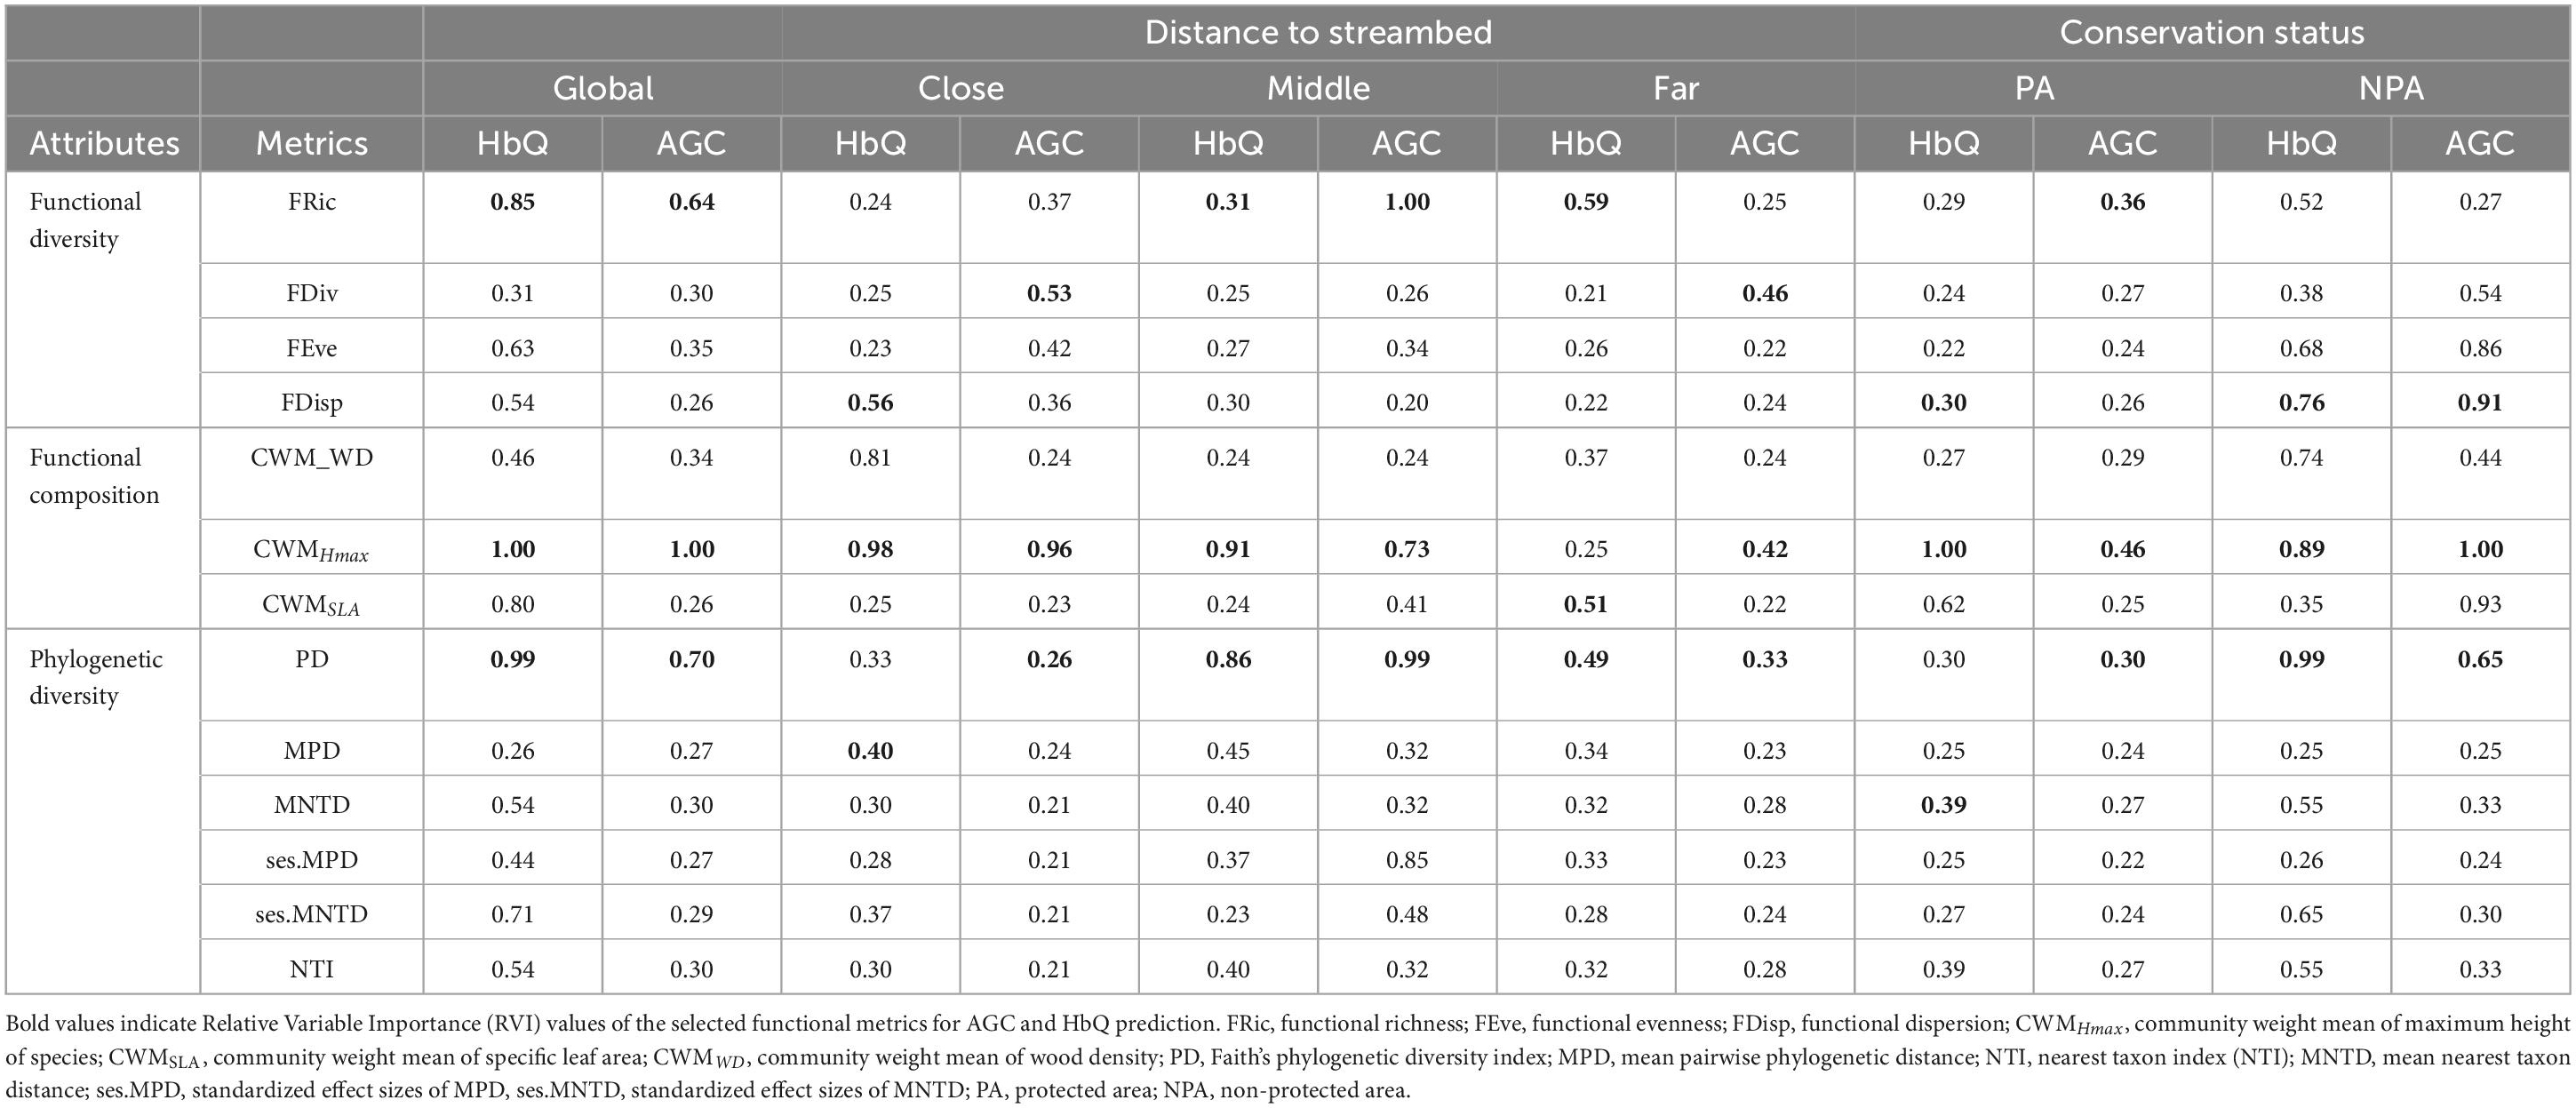
Table 1. Relative variable importance (RVI) of functional diversity, functional composition, and phylogenetic diversity metrics used as predictors of aboveground carbon (AGC) and habitat quality (HbQ) across distances to streambed and conservation statuses.
3.2 Effect of the distance from streambed and conservation status on riparian corridors functions and species diversity attributes
The results of the linear mixed-effects model showed a significant effect of distance from streambed on AGC and HbQ (Table 2). Plots located far from the streambed showed significantly lower HbQ than those located nearby. Similarly, plots located far from the streambed and in the middle showed significantly lower AGC than those located nearby.
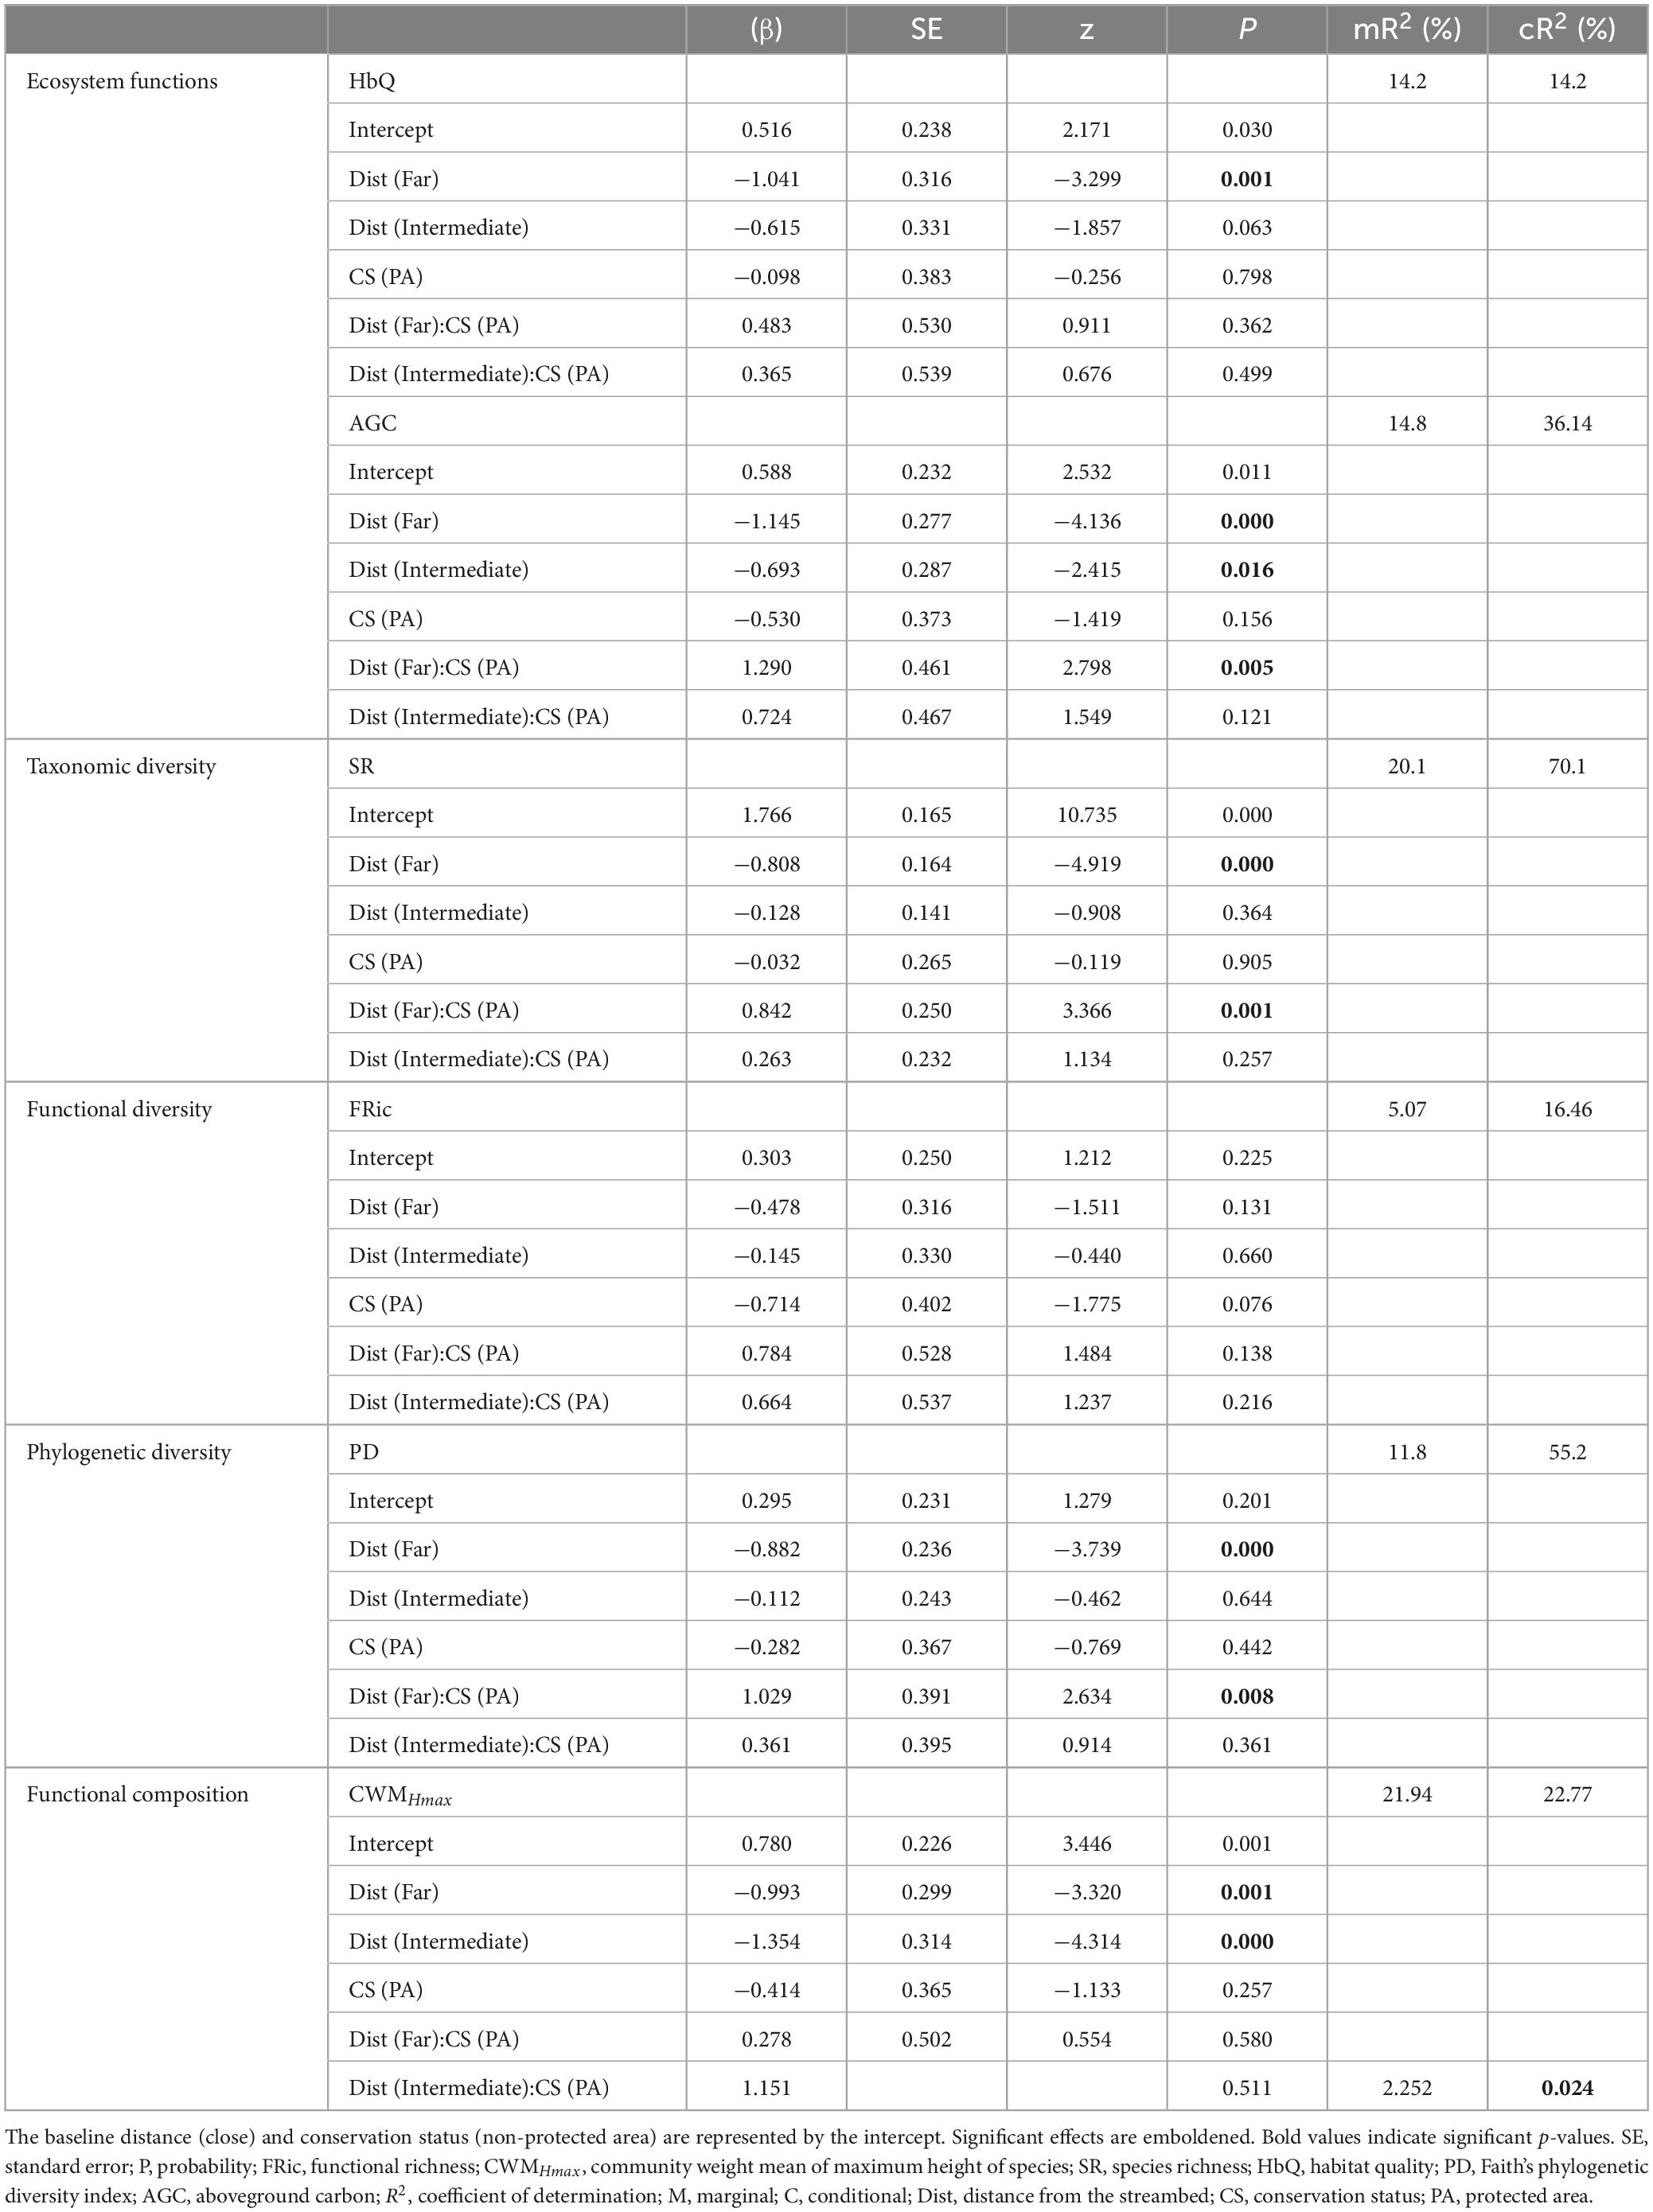
Table 2. Results of the generalized linear mixed-effects models (GLMMs) testing the effects of the distance from the streambed and conservation status on plant diversity metrics and ecosystem functions.
Taxonomic, functional, and phylogenetic diversity attributes varied significantly along the distance gradient (Table 2). SR and PD were significantly lower away from the streambed than nearby. CWMHmax was significantly lower away from the streambed and in the middle than nearby. However, no significant difference in FRic was found along the distance gradient (p > 0.05).
Furthermore, the results revealed no significant differences in ecosystem functions and different diversity attributes according to conservation status (p > 0.05; Table 2). However, the interaction between the distance intervals and conservation status showed significant differences in AGC and some diversity attributes (SR, PD, and CWMHmax). We observed a positive interaction effect between distance intervals and conservation status on AGC, SR and PD, which was particularly evident far from the streambed within the protected area. Additionally, the interaction effect on CWMHmax was positive at intermediate distances within the protected area.
3.3 Variation of SR-AGC and SR-HbQ bivariate relationships along the distance gradient from the streambed and between the conservation status
The results showed that HbQ and AGC increased significantly with SR for the pooled dataset (Figures 2A, 3A). The bivariate SR-AGC relationship was also positive and significant in both protected (Figure 2B) and unprotected (Figure 2C) areas. However, the strength of the SR-AGC bivariate relationship was marginally higher in protected areas. Following the distance intervals, the SR-AGC bivariate relationship was positive and significant in the plots located far from the watercourse and those located at intermediate distance (Figures 2E, F), but the strength of the SR-AGC relationship was higher at the intermediate distance (Figure 2E) than at far distances (Figure 2F). The relationship between SR and AGC was not significant close to the watercourse (Figure 2D).
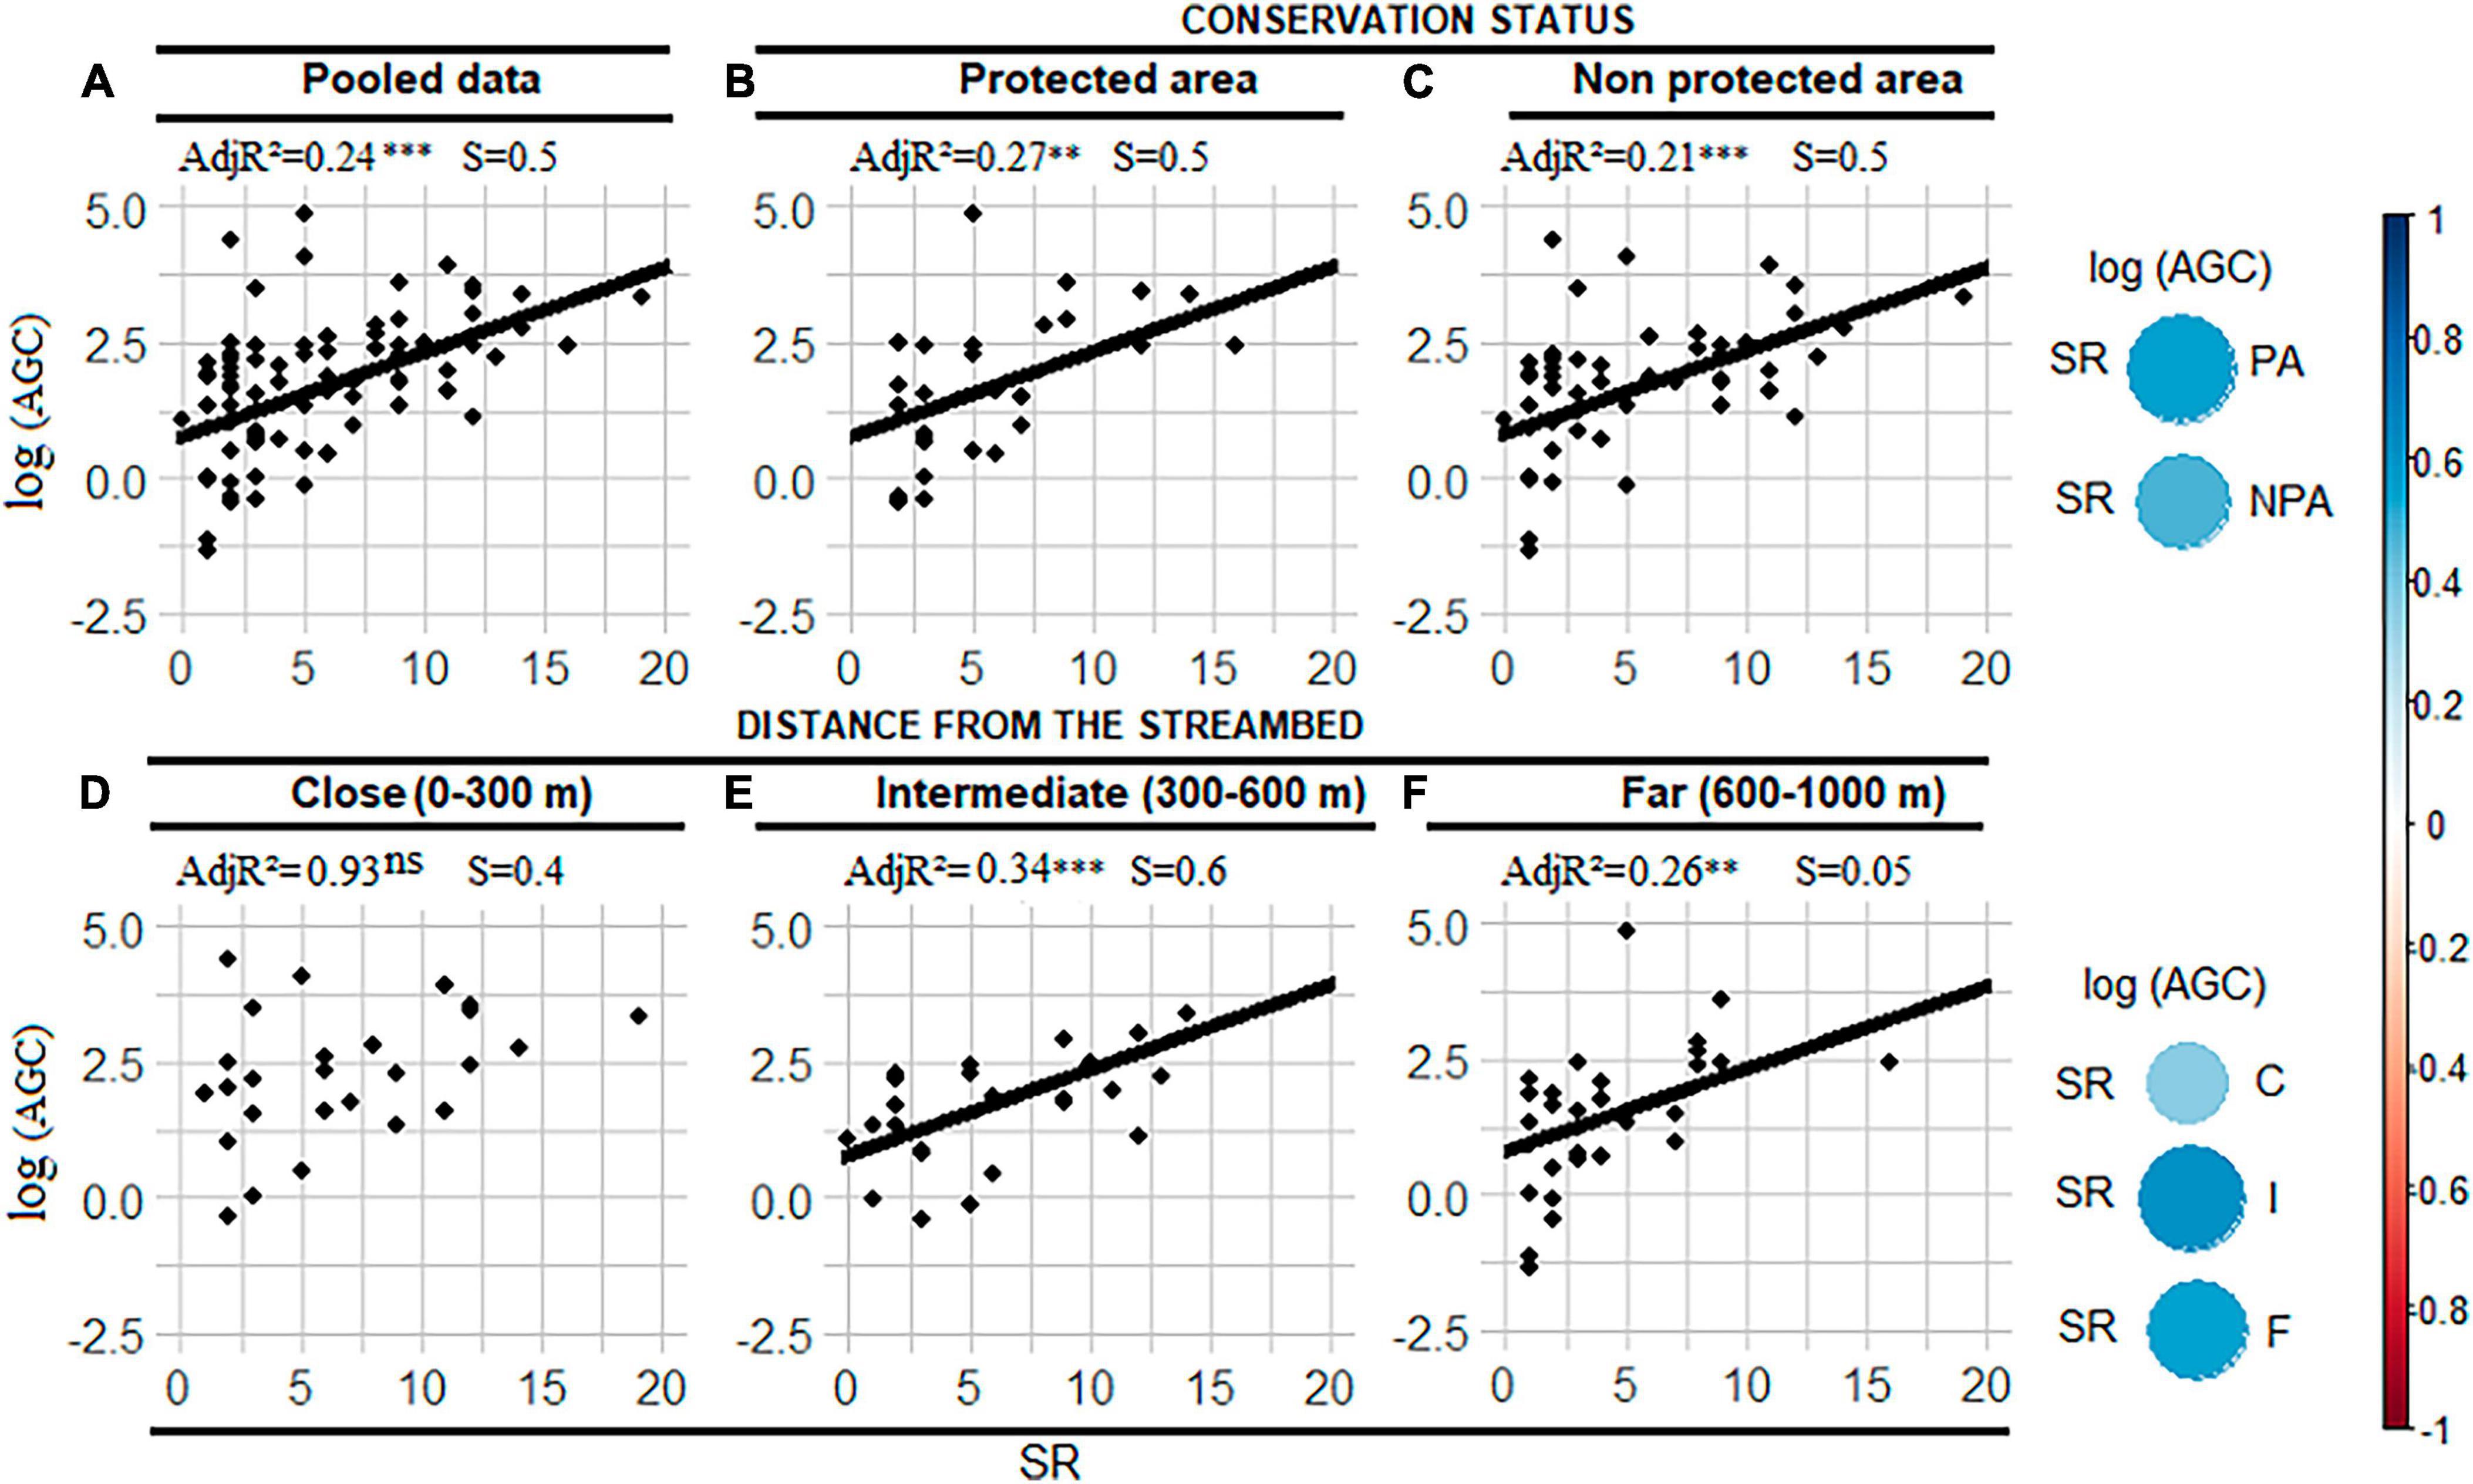
Figure 2. Aboveground carbon (AGC)-Species richness (SR) bivariate relationships for the initial dataset (A), within each conservation status (B,C) and each distance from the streambed (D–F). AdjR2 is the adjusted coefficient of determination in percentage, ns indicates non-significant relationships. AGC was log transformed to meet the normality assumption. The graph on the extreme left hand side indicates the effect size of the correlation between AGC and SR within and across conservation statuses and distance intervals. NPA, non-protected area; PA, protected area; S, slope of AGC-SR regression. **Indicates the p-value is smaller than 0.01 and ***p-value smaller than 0.001.
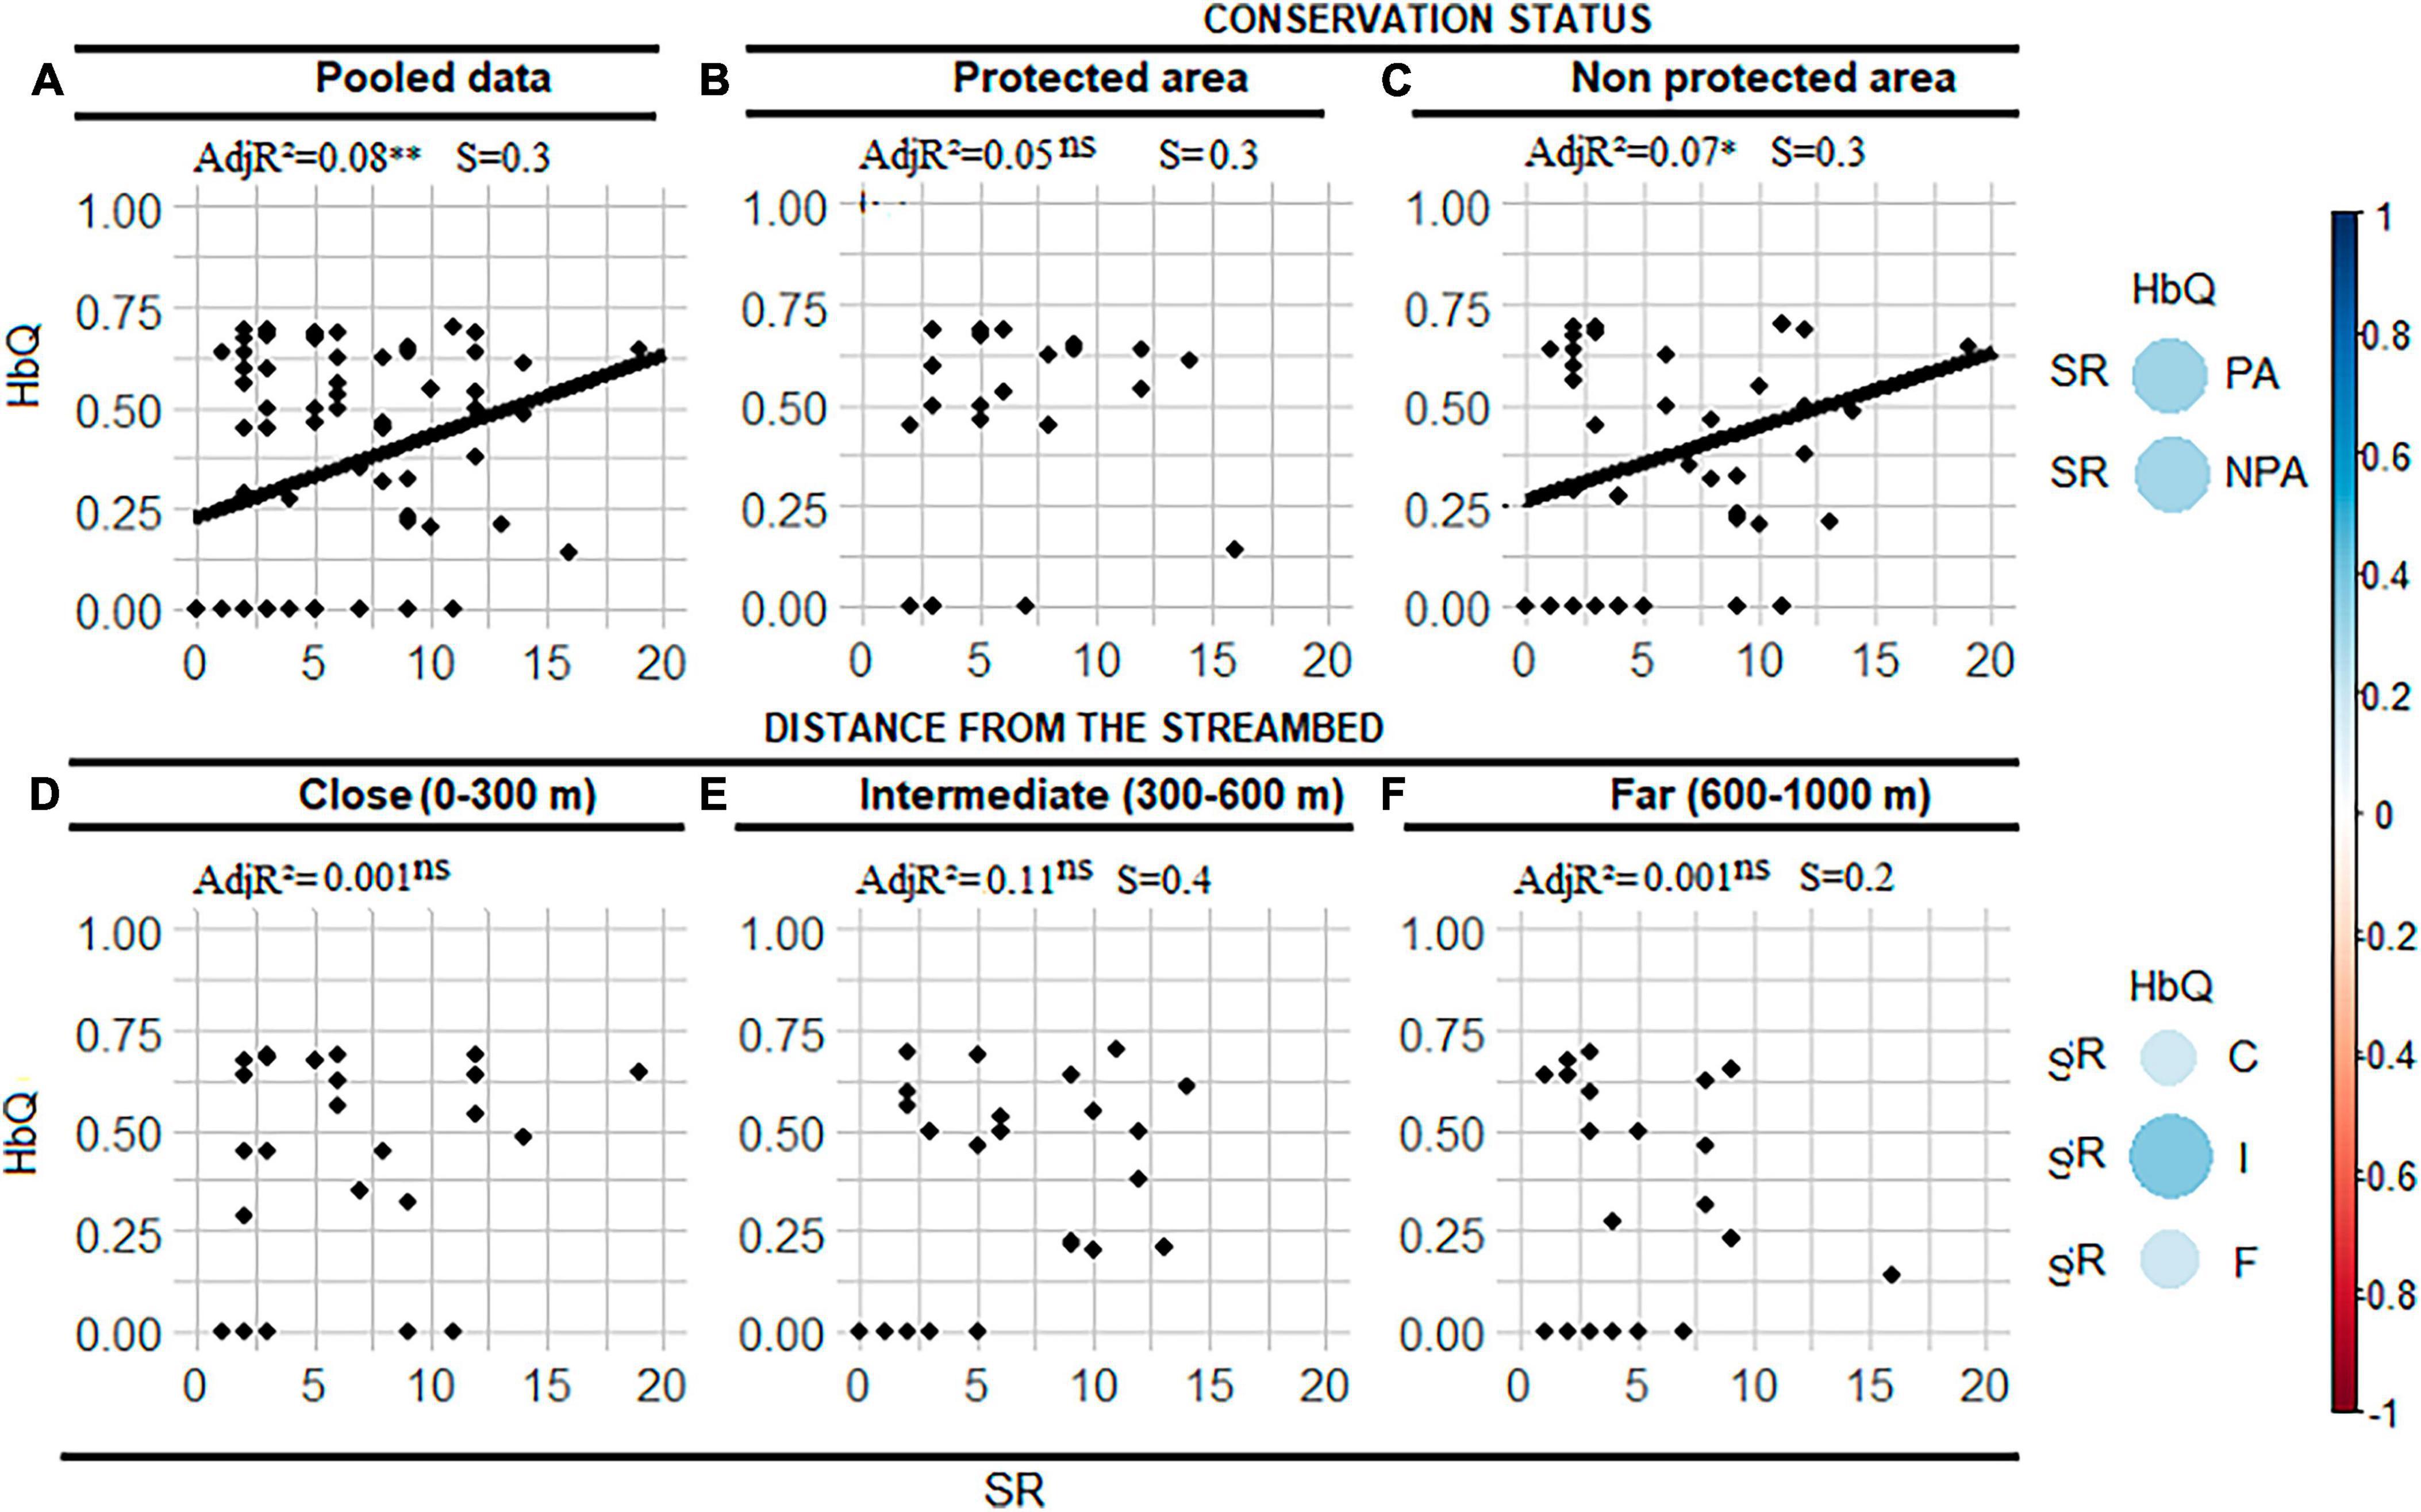
Figure 3. Habitat quality (HbQ)-Species richness (SR) bivariate relationships across the distance gradient and conservation status (A), within each conservation status (B,C) and each distance from the streambed (D–F). AdjR2 is the adjusted coefficient of determination in percentage, ns indicates non-significant relationships. The graph on the extreme left hand side indicates the effect size of the correlation between HbQ and SR within and across conservation status and distance intervals. *Indicates the p value is smaller than 0.05. NPA, non-protected area; PA, protected area; S, slope of HbQ-SR regression; S, slope of AGC-SR regression. **For a probability value smaller than 0.01.
The SR-HbQ relationship was only significant for the initial dataset and in unprotected areas (Figures 3A, C). This relationship was not significant in protected areas (Figure 3B). The HbQ-SR relationship was not significant over the whole range of distances (Figures 3D–F).
3.4 Direct and indirect effects of SR on HbQ and AGC
3.4.1 Direct and indirect effects across distance gradient and conservation status
The pSEM for the initial dataset showed a good fit to the data, as indicated by the acceptable range of the values of all GOF indicators (Supplementary Table 1). Based on the pSEM results, we found a significant effect of SR on FRic and PD (Figures 4A, B). Additionally, SR shared a significant positive covariance with PD. CWMHmax was also positively related to AGC and HbQ. SR had no direct or indirect effect on AGC and HbQ.
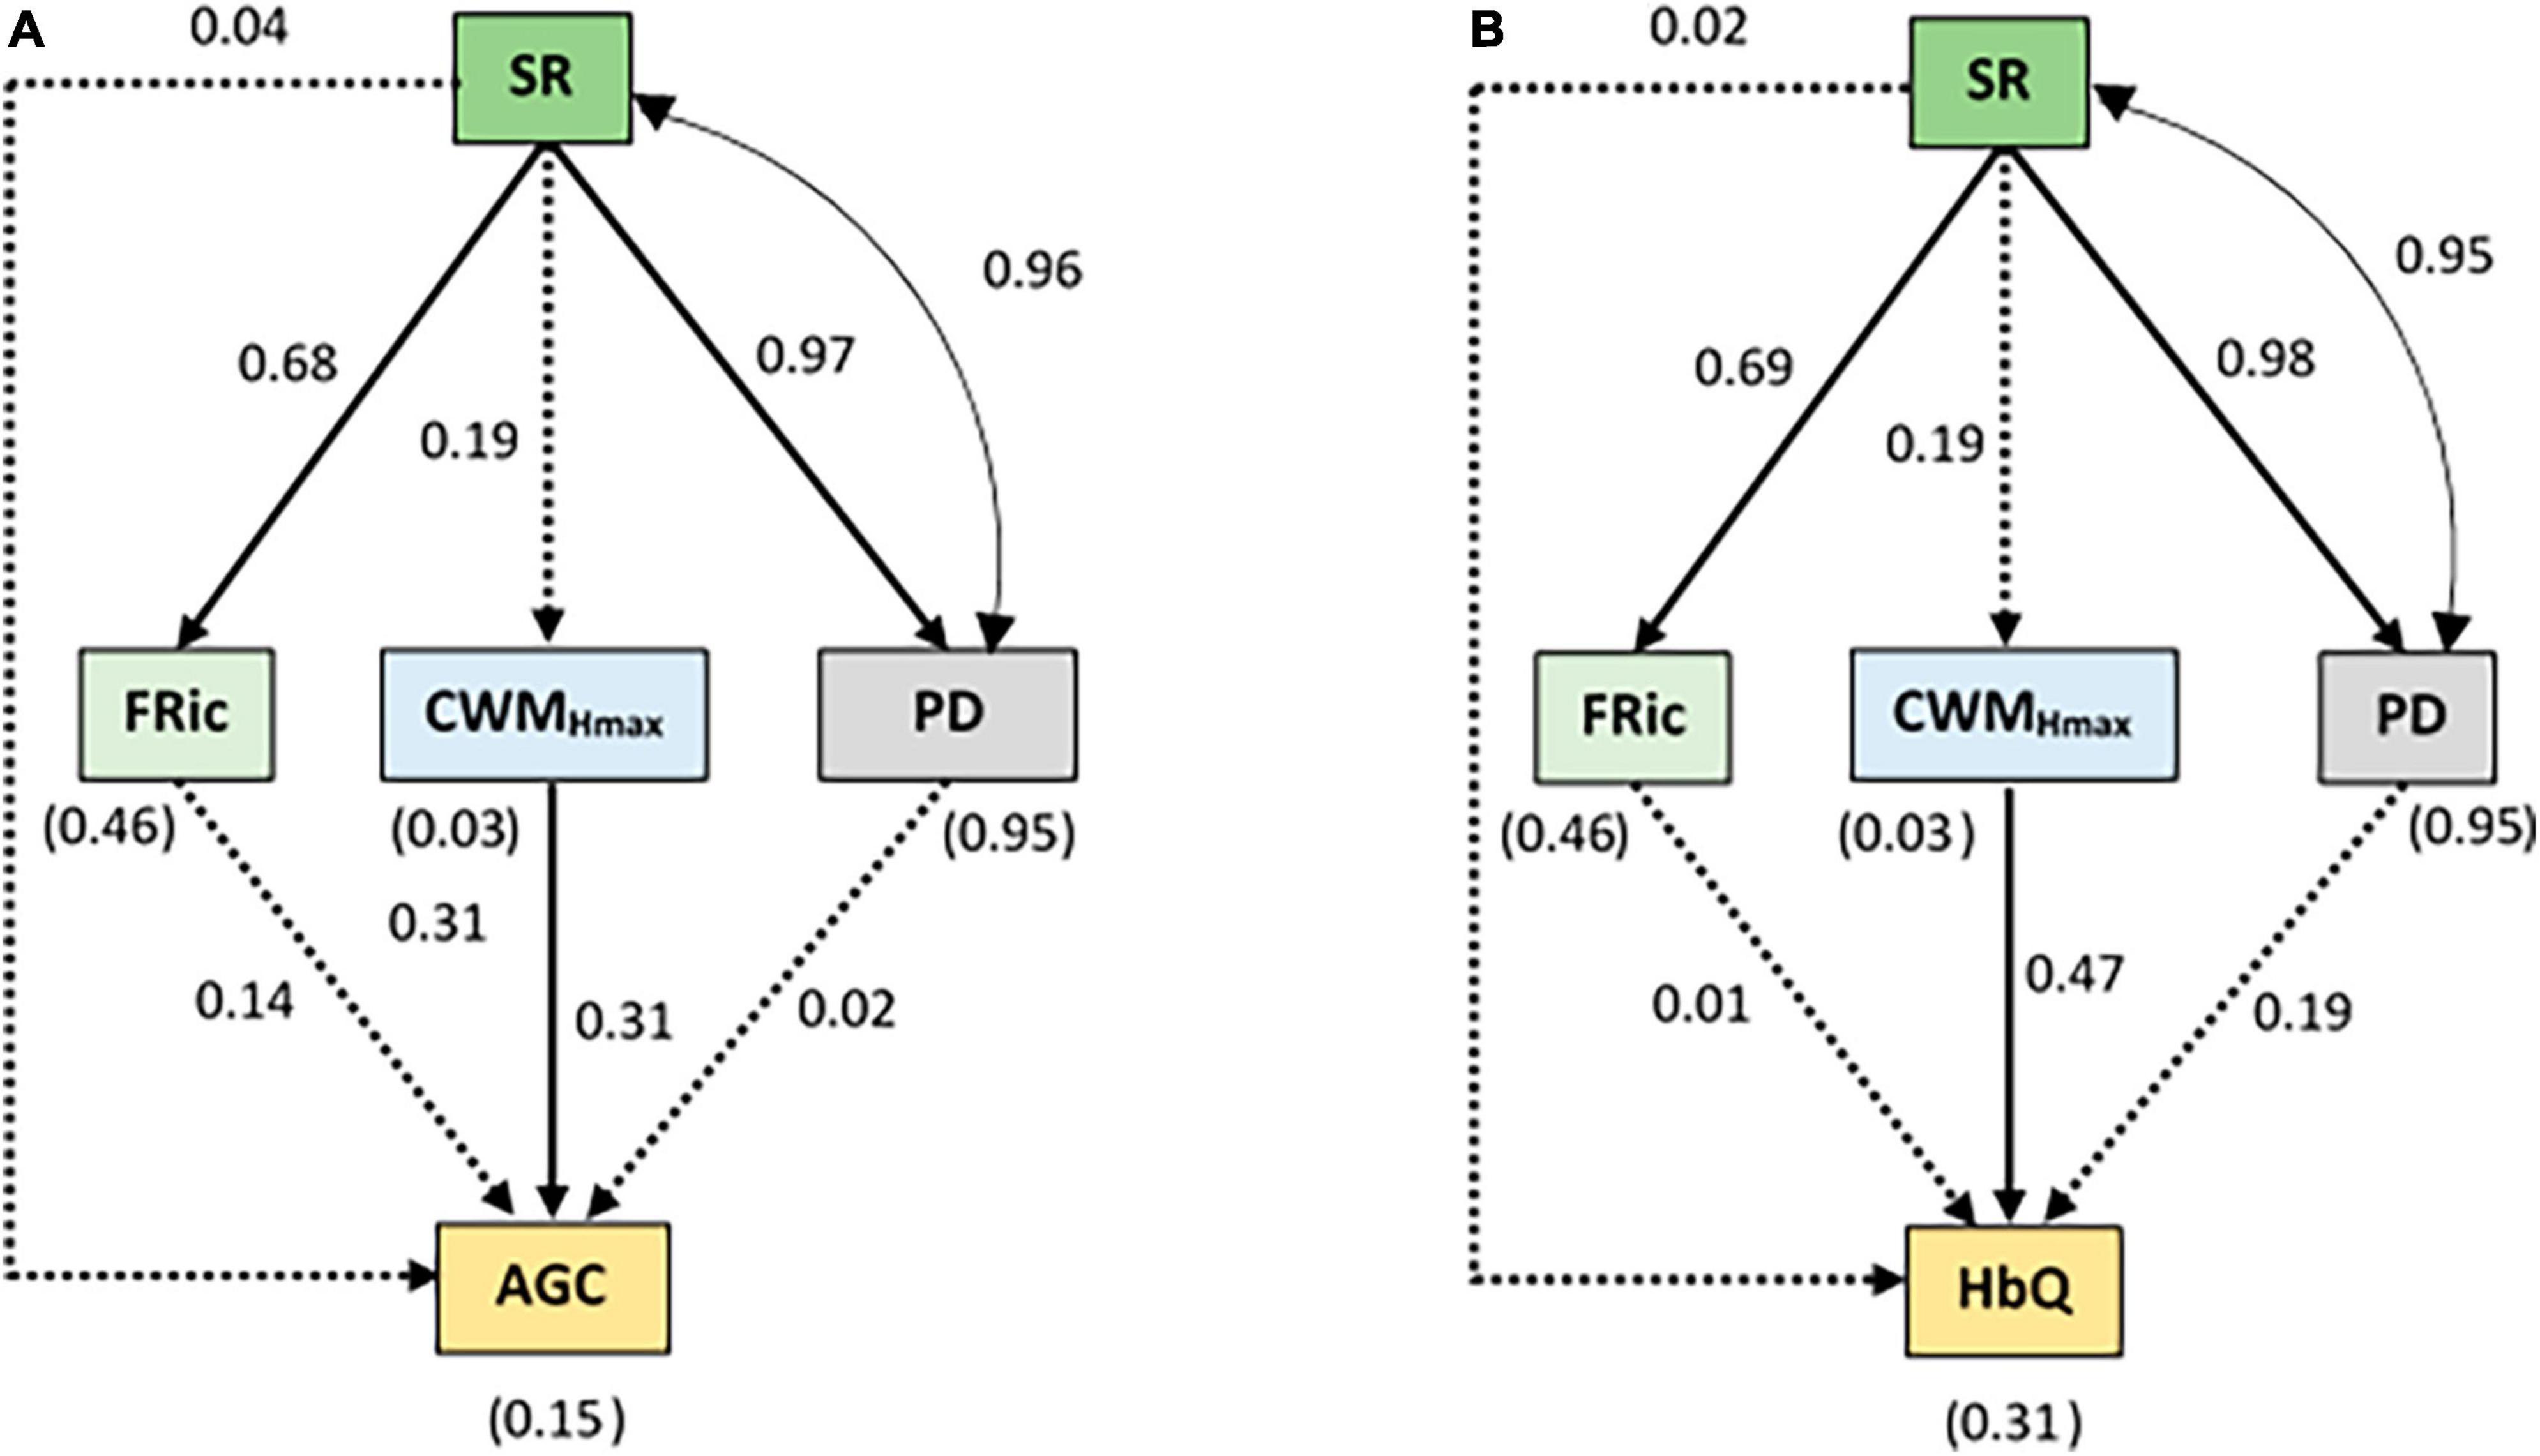
Figure 4. Results of the pSEM for the initial dataset (across the distance gradient and conservation status) relating (A) species richness (SR), functional richness (FRic), community weighted mean of maximum height (CWMHmax) and Faith’s phylogenetic diversity index (PD) to the aboveground carbon (AGC) and (B) habitat quality (HbQ). The values without brackets on the graphs are the standardized path coefficients and their significance is summarized in the Appendix (Supplementary Table 3). The values within brackets represent the coefficients of determination (R2) for the response variables. The solid arrows represent the significant (p < 0.05) causal paths, while the dashed arrows represent the non-significant (p > 0.05) causal paths. The goodness-of-fit (GOF) statistics are summarized in Supplementary Table 1. The double-pointed arrow indicates significant covariances.
3.4.2 Direct and indirect effects across the distance intervals
Similar to the initial dataset, the pSEM for the distance intervals exhibited a good fit to the data (Supplementary Table 1). The results showed that SR had significant and positive effects on FDiv and PD close to the streambed (Figure 5A). At this distance interval, CWMHmax and PD exhibited significant positive effects on AGC and PD mediated the effect of SR on AGC (Supplementary Table 2). Only CWMHmax predicted HbQ close to the streambed with a positive effect. CWMHmax also shared a significant positive covariance with FDisp close to the streambed (Figure 5B). At intermediate distance interval, FRic and PD were positively predicted by SR. At this distance interval, both AGC and HbQ were significantly and positively related to CWMHmax (Figures 5C, D). We also found that PD shared positive covariate relationships with FRic and SR at this distance interval. Far from the streambed, we found significant positive effects of SR on PD and FRic and significant positive covariance between SR and PD (Figures 5E, F). The other relationships were not significant at this distance interval.
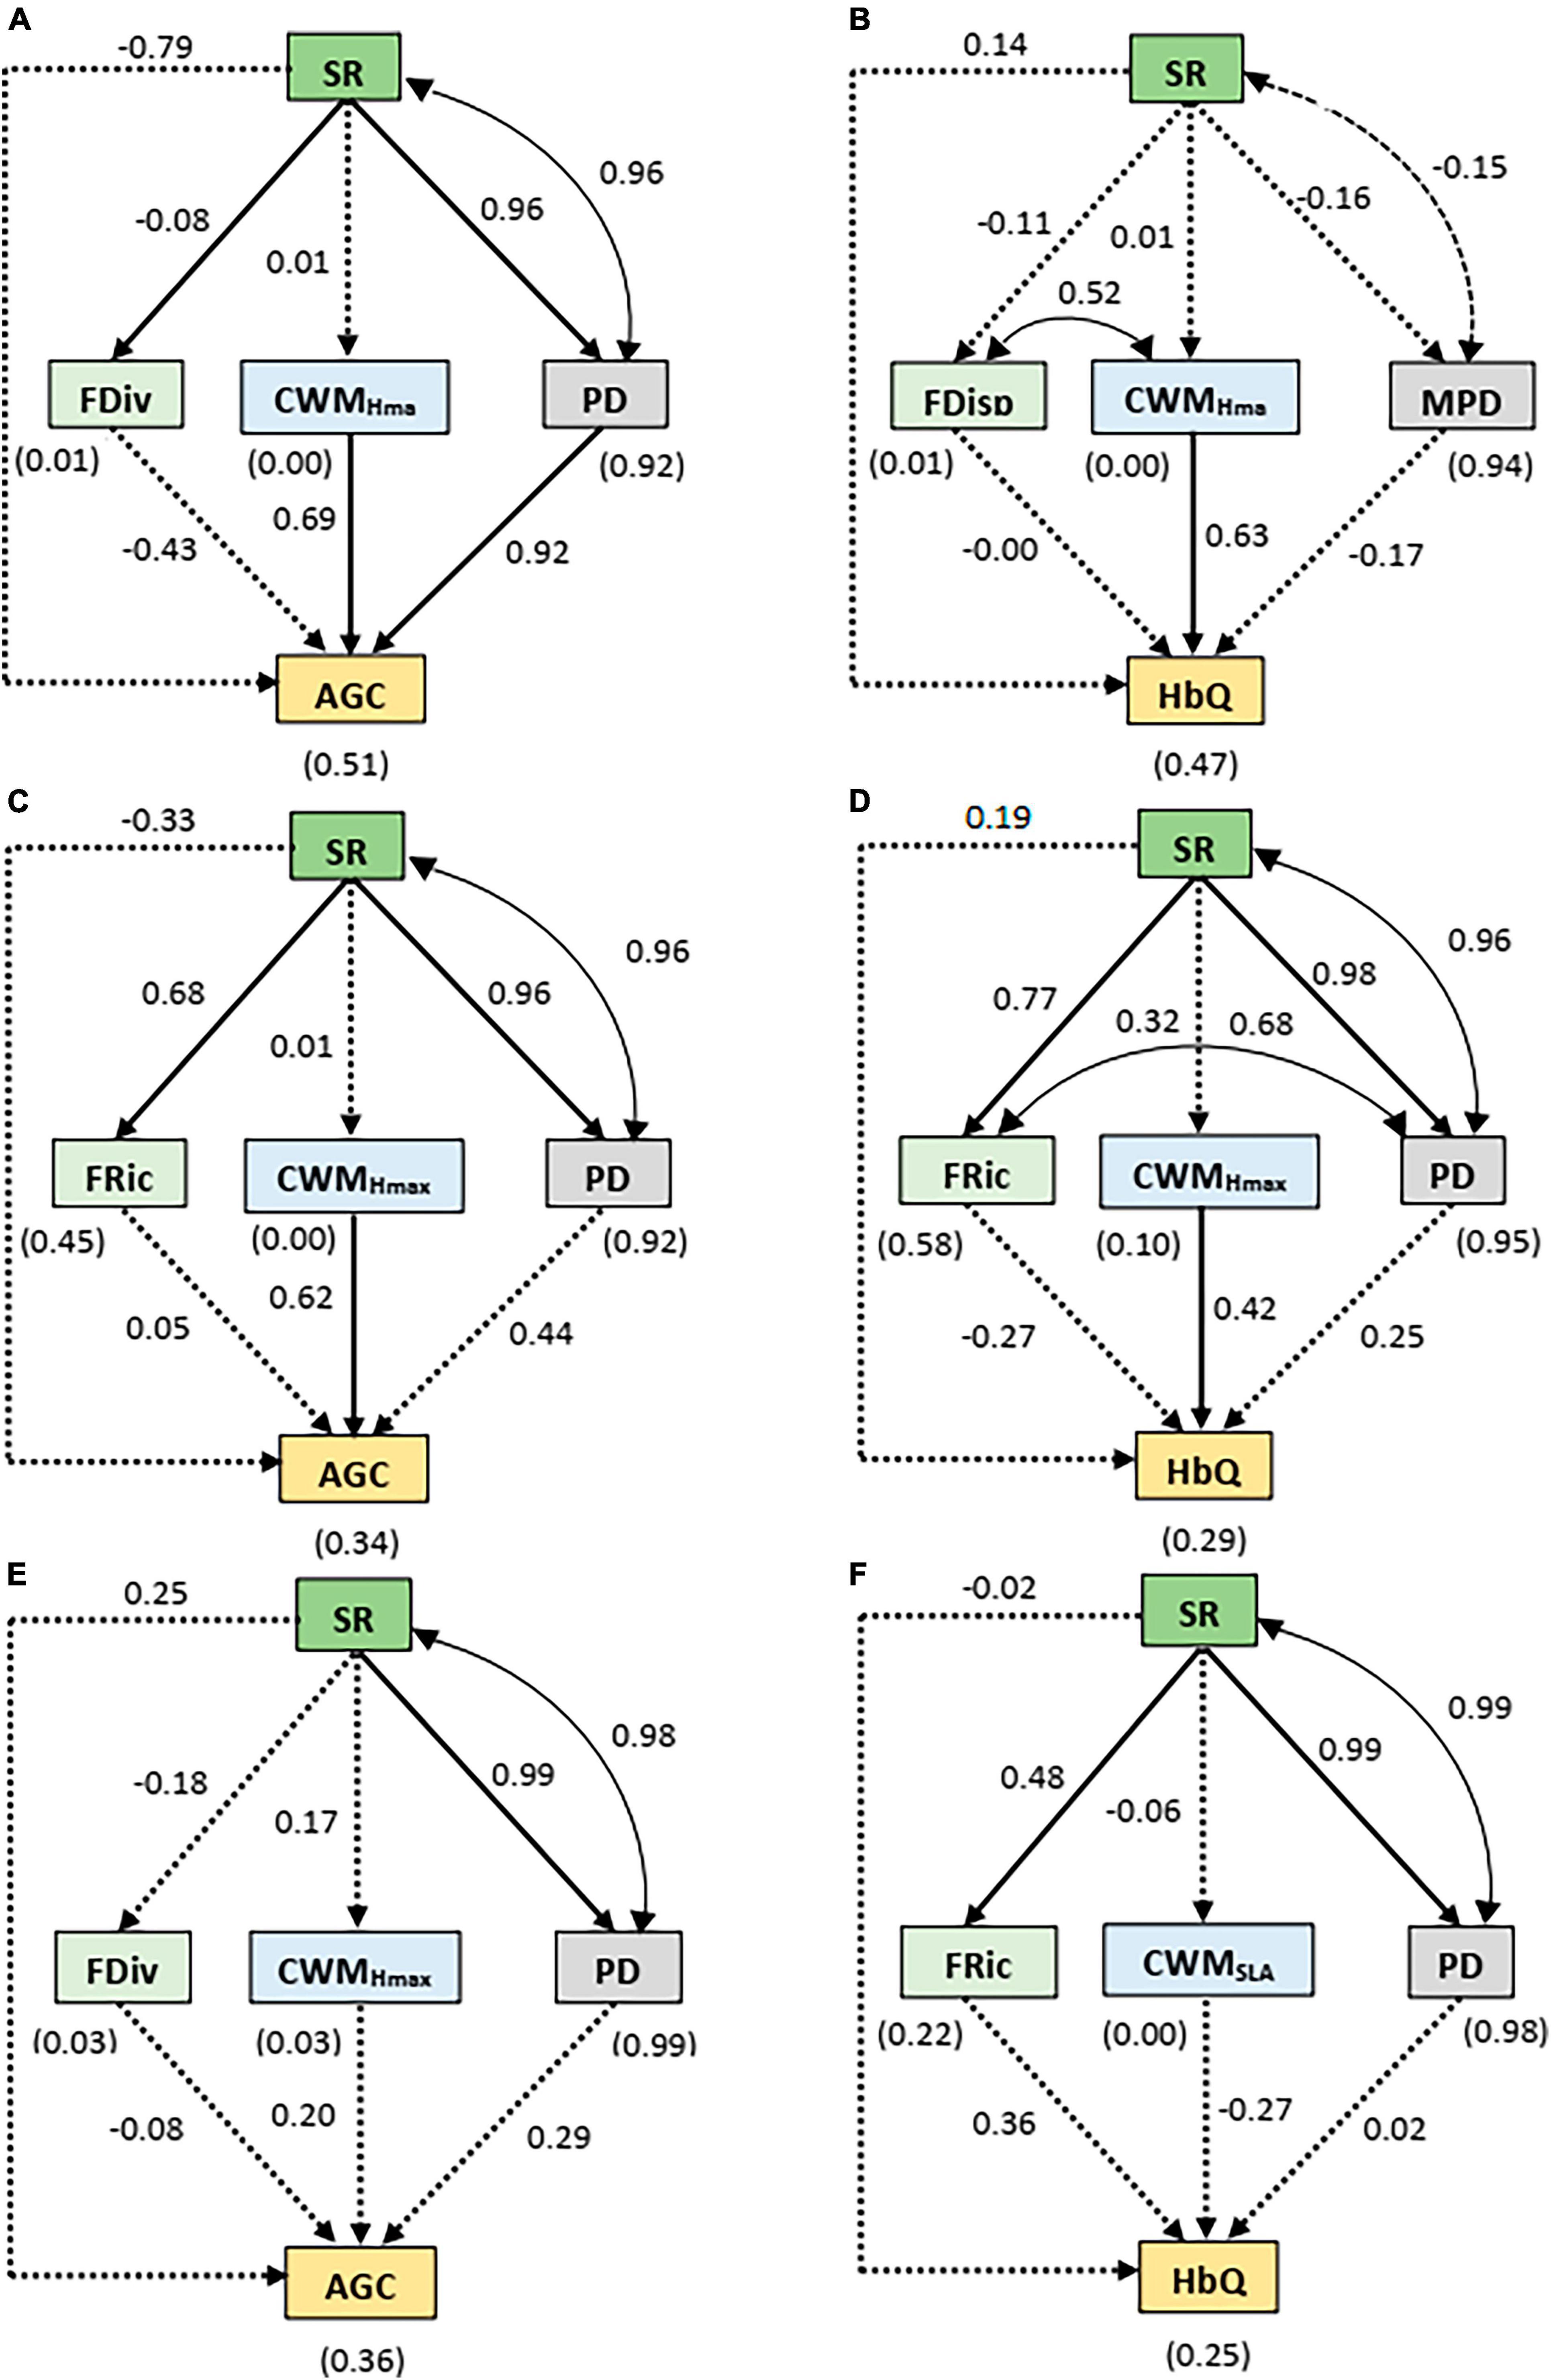
Figure 5. Results of the SEM relating species richness (SR), functional richness (FRic), community weighted mean of maximum height of species (CWMHmax), Faith’s phylogenetic diversity index (PD), functional divergence (FDiv) and mean phylogenetic distance (MPD) to aboveground carbon (AGC) and Habitat quality (HbQ) along the distance intervals: (A,B) close to the streambed (0–300 m), (C,D) intermediate distance (300–600 m) and (E,F) far from the streambed (600–1000 m). The values without brackets on the graphs are the standardized path coefficients and their significance is summarized in Supplementary Table 4. The values within brackets represent the coefficients of determination (R2) for the response variables. The solid arrows represent the significant (p < 0.05) causal paths, while the dashed arrows represent the non-significant (p > 0.05) causal paths. The goodness-of-fit (GOF) statistics are summarized in Supplementary Table 1. The double-pointed arrow indicates significant covariances.
3.4.3 Direct and indirect effects according to the conservation status
The pSEM for the conservation status also exhibited a good fit to the data (Supplementary Table 1). We found a positive effect of SR on FRic, CWMHmax and PD while SR negatively influenced MNTD in protected areas (Figures 6A, B). Moreover, a significant positive covariance was found between SR and PD while a negative covariance was found between SR and MNTD in the protected areas. Only HbQ was significantly influenced by CWMHmax in protected areas. In non-protected areas, SR did not influence CWMHmax but had a positive effect on FDisp and PD. For this conservation status, ecosystem functions were predicted by PD and CWMHmax. CWMHmax positively predicted AGC and HbQ. PD exhibited a direct effect on HbQ only, thereby linking SR to HbQ (Figures 6C, D and Supplementary Table 2).
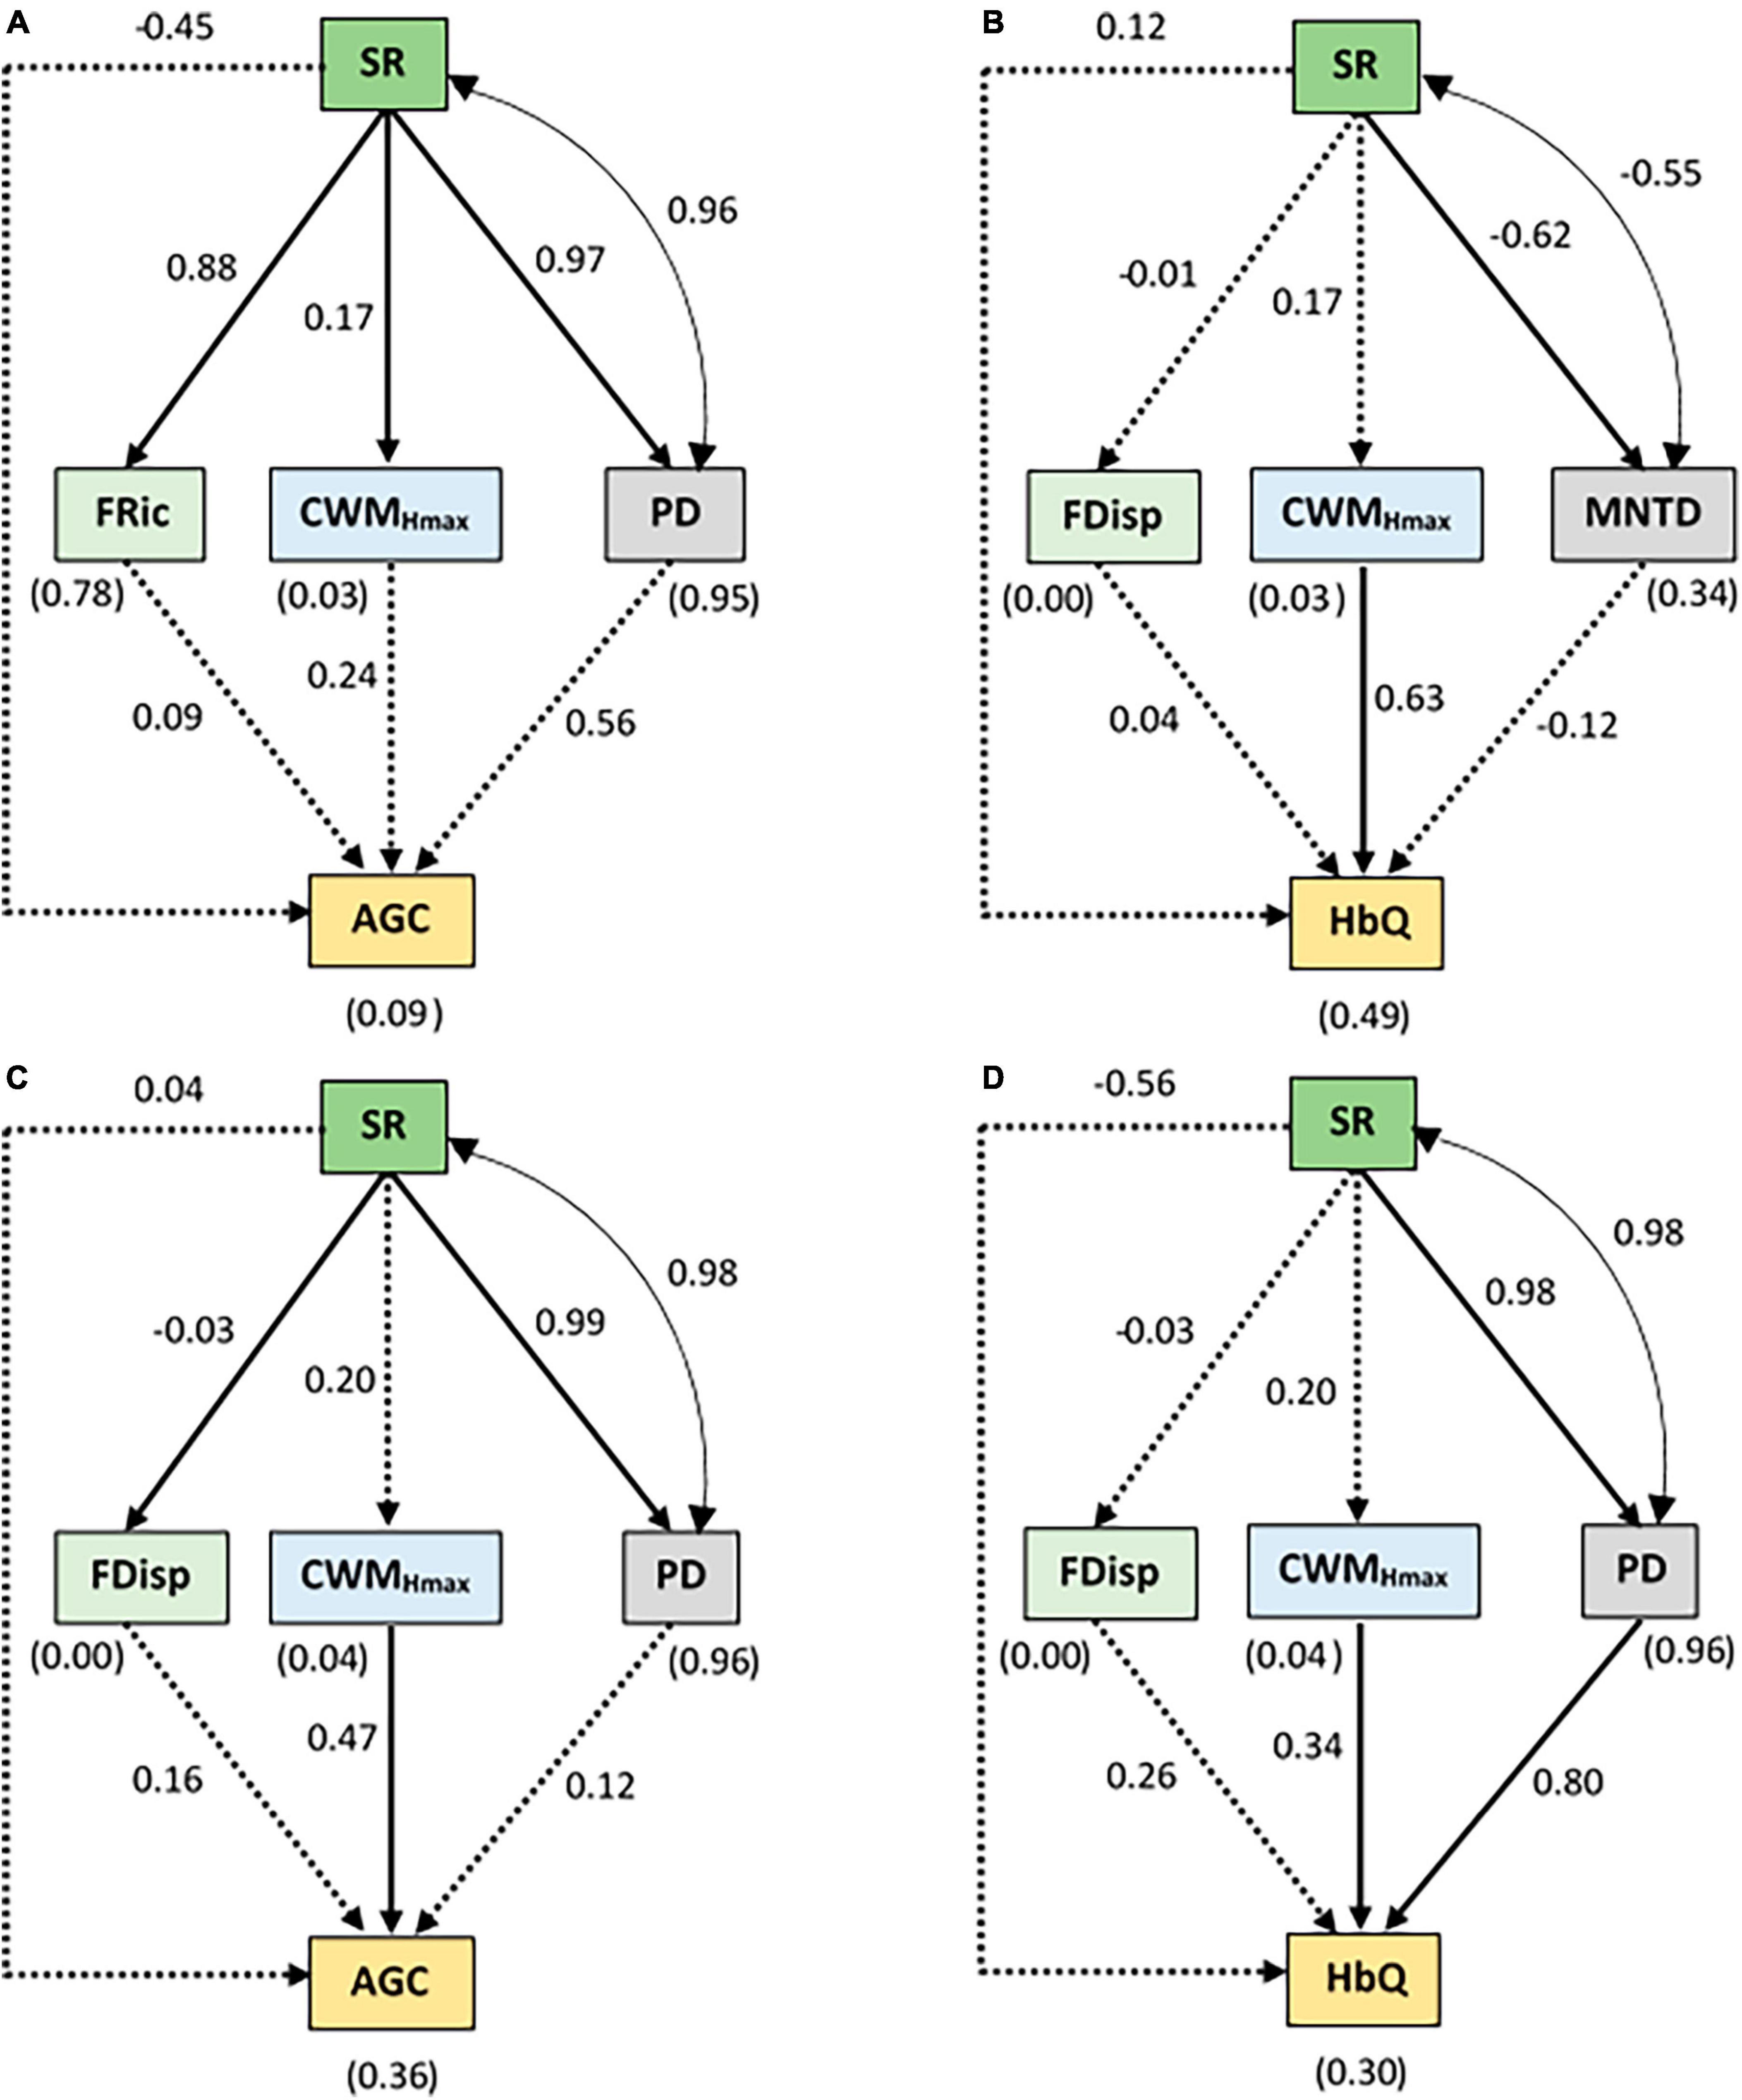
Figure 6. Results of the SEM relating species richness (SR), functional richness (FRic), functional dispersal (FDisp), community-weighted mean of maximum height of species (CWMHmax), Faith’s phylogenetic diversity index (PD), and mean nearest taxon distance (MNTD) to aboveground carbon (AGC) and Habitat quality (HbQ) according to the conservation status: (A,B) protected area and (C,D) non-protected area. The values without brackets on the graphs are the standardized path coefficients and their significance is summarized in Supplementary Table 5. The values within brackets represent the coefficients of determination (R2) for the response variables. The solid arrows represent the significant (p < 0.05) causal paths, while the dashed arrows represent the non-significant (p > 0.05) causal paths. The goodness-of-fit (GOF) statistics are summarized in Supplementary Table 1. The double-pointed arrow indicates significant covariances.
4 Discussion
We assessed the relationships between tree diversity and ecosystem functions, as well as the relative importance of biotic mechanisms along a gradient of distance from the streambed and between conservation status. We found a significant effect of distance from the streambed on ecosystem functions (HbQ, AGC) and diversity attributes (SR, PD and CWMHmax), as well as positive and significant correlations between ecosystem functions and SR. In addition, direct and indirect effects showed that the functional composition attribute (CWMHmax) was the best predictor of both ecosystem functions in most of the cases, and that Faith’s phylogenetic diversity index (PD) mediated the effect of SR on AGC and HbQ in areas close to the streambed and in unprotected areas, respectively.
4.1 Effect of the distance to streambed and conservation status on riparian corridor functions and plant diversity
Distance from the riverbed had significant effects on ecosystem functions and diversity attributes (taxonomic, phylogenetic, and functional). We found that plant communities located far from the streambed exhibited lower ecosystem functions (HbQ, AGC) and diversity (SR, PD, and CWMHmax) than those located nearby, in line with our first hypothesis. These results are in agreement with those of Paixão et al. (2013), who reported that plant species richness of riparian zones decreased with increasing distance from the watercourse. Similarly, previous studies also revealed that forests closer to streams had higher composition, vegetation height and tree species diversity than riparian forest edges (Wasser et al., 2015; Xu et al., 2017; Maracahipes-Santos et al., 2020). Teixeira et al. (2022) also observed that proximity to the watercourse favored phylogenetic diversity and plant growth. The lower diversity, HbQ and AGC observed far from the river bed could be attributed to low nutrient availability for tree uptake at distances far from the river bed since previous studies have reported low nutrient availability far from the river bed compared to close to the river (Azihou et al., 2013; Altuna et al., 2019; Henriksson et al., 2021). Nutrient availability is one of the main factors influencing plant diversity and growth. Soil type and nutrient availability can change depending on the distance from the streambed (Newcomer et al., 2016). This variation in nutrient availability along the distance gradient, caused by changes in water levels, sediment deposition, and nutrient runoff from nearby areas (Munn, 2018), may influence plant growth and diversity in contrasting ways, benefiting the species that are adapted to particular nutrient conditions while being detrimental to non-adapted ones. Apart from nutrient availability, the influence of human activities (e.g., cropping) can also explain the decline in biodiversity, HbQ and AGC with increasing distance from the river course in the riparian corridors. Wasser et al. (2015) found that natural, undeveloped land use types contained taller riparian vegetation and wider corridors than land-use types subject to human disturbances. Similarly, riparian forest ecosystems adjacent to croplands in the southeastern Brazilian Amazon had fewer tree species and a high proportion of opportunistic species than those in large areas of intact primary forest (Maracahipes-Santos et al., 2020). The results show that wider riparian corridors are needed, particularly in agricultural landscapes (Jones et al., 2010), as they are more likely to encompass a wider variety of biotic assemblages to ensure the sustainability of ecosystem functions. Ives et al. (2011) found that width of riparian corridors was the best predictor of plant assemblage composition in northern Sydney, Australia. Wider riparian buffer zones are important to consider in riparian corridor management strategies for better biodiversity conservation.
Furthermore, our results showed that the combined effects of distance from the streambed and conservation status explained more of the variation in AGC and some diversity attributes (SR, FRic, PD and CWMHmax) than conservation status alone which had a negligible effect. This finding suggests that integrative models combining the effects of environmental variables are essential to better predict the relative importance of biodiversity facets and carbon storage in riparian corridors, as proposed by Mensah et al. (2023b) for mixed-species forests.
4.2 Direct and indirect effects of diversity attributes on AGC and HbQ
Overall, our results showed direct effects of SR, mainly on phylogenetic (PD) and functional (FRic) diversity attributes across distance intervals and conservation statuses. Previous studies have also observed a positive correlation between tree SR and FRic under the influence of environmental conditions (Peña-Lara et al., 2022; Suárez-Castro et al., 2022). For instance, Gatica et al. (2020) found a reduction in functional diversity with declining plant SR. Phylogenetic diversity was also correlated with SR between elevation bands and plant communities in China’s Dulong Valley (Li et al., 2015). Galván-Cisneros et al. (2023) also noted a decrease in phylogenetic diversity accompanied by a decrease in SR with increasing altitude. The positive effect of SR on Fric and PD suggests that increasing SR results in a larger pool of co-occurring species with diverse functional traits and distant lineages (Li et al., 2015; Suárez-Castro et al., 2022).
When examining the bivariate relationships, we observed that AGC and HbQ increased significantly with SR considering the pooled dataset. These results are consistent with several previous studies that also showed a positive relationship between SR and AGC in different agroecosystems such as grazing exclosures in Ethiopia (Noulèkoun et al., 2021), in South African mistbelt forest (Mensah et al., 2016), and in West Africa natural forests (Noulèkoun et al., 2024). Similarly, Mensah et al. (2020a) found that plant diversity enhances habitat quality. Terrado et al. (2016) also reported that HbQ is positively correlated with terrestrial vascular plant species richness in the Llobregat river basin in Spain. Our results confirm these general patterns and suggest that improving plant diversity enhances both AGC and habitat quality in riparian corridors. Greater plant species richness offers a greater variety of ecosystem functions resulting from the coexistence of several trophic groups (Mensah et al., 2020a). This positive effect could result from niche complementarity between species (functional diversity) with a greater variety of traits and efficient resource use (Mensah et al., 2016; Gamfeldt and Roger, 2017; Ali, 2019; Magnano et al., 2023) or increased tree density leading to greater productivity (Mensah et al., 2016, 2020a; Noulèkoun et al., 2021). It is also possible that this positive correlation between SR and AGC or HbQ is favored by the disproportionate contribution of highly productive dominant species (functional composition) (Mensah et al., 2016; Gamfeldt and Roger, 2017; Noulèkoun et al., 2021).
However, the SR-AGC and SR-HbQ relationships varied according to the distance gradient and conservation status. The SR-AGC relationship was significantly positive and stronger in plots located at intermediate and distant distances from the stream, supporting our second hypothesis. This result indicates that the bivariate SR-AGC relationship may be mediated by distance from the streambed. Indeed, riparian corridors often show a decreasing gradient in resource availability as one moves away from the stream bed (e.g., water, nutrients), which could limit plant species diversity. In the plots located far from the watercourse, where resources are less abundant, functional complementarity between species may become more important, which could strengthen the SR-AGC relationship, in line with the stress gradient hypothesis (Maestre et al., 2009). Consequently, the more pronounced SR-AGC relationship at intermediate and distant distances from the watercourse suggests that plant species in these areas face more limiting conditions. The non-significant effect of SR on AGC near the streambed may be related to saturation effect if the additional species are redundant (Tilman et al., 1997; Chesson et al., 2001; Noulèkoun et al., 2021). However, it is important to note that the complexity of relationships between biotic variables can vary between ecosystems and regions, and specific studies are needed to confirm these trends in particular contexts. The bivariate SR-AGC relationship was also positive and significant in both protected and unprotected areas, suggesting that conservation status does not influence the SR-AGC relationship in riparian corridors. In contrast, the SR-HbQ relationship was positive and significant only in unprotected areas, indicating the influence of conservation measures on diversity and HbQ in riparian corridors. This finding suggests that conservation actions and policies aimed at increasing species diversity and HbQ in the riparian corridors would have a more significant impact when implemented in unprotected areas.
Contrary to the results from the bivariate relationships, we found non-significant direct effects of SR on AGC and HbQ in the SEMs. This is probably due to the following reasons. The consideration of the mediating factors in the SEM may lower the strength of the association between SR and ecosystem functions. It is also possible that the SEM models need refinement to better capture the relationships among the variables, since the sample size may not have been large enough to capture significant relationships in the SEM. In fact, bivariate relationships might be more sensitive to small sample variations, leading to significant results (Riley et al., 2007). SEM tends to be more powerful with larger sample sizes (Burgess, 2014). Interestingly, our results showed indirect effects of SR on AGC and HbQ only through PD. This confirms the observation that SR often lacks information on the evolutionary history of communities (Safi et al., 2011; Cardoso et al., 2014; Jarzyna and Jetz, 2016). PD was a positive mediator of the effect of SR on AGC at a distance close to the streambed. These results are consistent with those of Le Bagousse-Pinguet et al. (2019) who showed the significant role of PD as a mediator of several ecological functions including carbon storage in arid ecosystems. Prager et al. (2021) examined the relationships between carbon dynamics and multiple dimensions of plant diversity in the Colorado Rockies and found that plant PD was the only diversity component significantly linked to carbon uptake. A recent study in the study area reported a positive relationship between phylogenetic diversity metrics and AGC (Mensah et al., 2024). Cadotte et al. (2008) and Cadotte (2013) showed that within-community PD explained much more variation in plant community carbon storage than other measures of diversity. The mediating role of phylogenetic diversity in the carbon storage function of riparian plant diversity supports the idea that diverse tree assemblages are composed of distantly related species which contribute to ecosystem productivity through niche complementarity (Cadotte et al., 2008; Cadotte, 2013; Prager et al., 2021). Concostrina-Zubiri et al. (2022) also found that increasing PD had a positive effect on biocrust taxonomic diversity along the habitat degradation gradient in the remnants of a Mediterranean shrubland. The indirect effect of SR on HbQ through PD in unprotected areas is likely due to the stronger complementarity effects between phylogenetically distant species in speciose plant communities, which enhances habitat quality. Our results suggest that phylogenetic diversity attributes may be relevant to define management strategies, as greater phylogenetic diversity could improve carbon storage potential and habitat quality in riparian corridors. It is important to note that the relationship between SR and ecosystem functions in riparian corridors may also vary according to other environmental factors, such as soil properties and climatic conditions, which were not considered in this study. Further research is needed to fully understand the mechanisms underlying these relationships and their implications for the management of riparian ecosystem services.
Our findings showed that the functional composition attribute (CWMHmax) was the strongest predictor of both ecosystem functions (HbQ and AGC) in most cases. Our results are consistent with recent studies showing that the dominance of tall stature trees determine carbon stock in Atlantic secondary forests (Rodrigues et al., 2023), along the secondary and old-growth tropical forests of Panama (Wallwork et al., 2022) and in the subtropical forests of Nepal (Kunwar et al., 2023). Similarly, the work of Ouyang et al. (2023) in the subtropical forests of China also showed that CWMHmax was the best predictor of ecosystem multifunctionality, including carbon storage. Mensah et al. (2020a) also found that functional dominance influenced ecosystem multifunctionality, including habitat quality and carbon storage, with stronger effects on individual functions. Our study therefore supports the “mass ratio” hypothesis (Grime, 1998; Garnier et al., 2004), and suggests that the functioning of riparian ecosystems is also determined by the functional traits of the most dominant species. The strong effect of CWMHmax reflects the importance of vertical stratification of riparian ecosystems for the relationship between diversity and ecosystem functions (HbQ, AGC), as suggested by Mensah et al. (2016), to maintain the primary role of corridors as dispersal channels for individuals and genes across the landscape.
It is important to recognize that our study has some limitations. For example, the sampling scheme adopted may not ensure a homogeneous community of species in all plots, particularly in plots close to the streambed. Finally, although this study has addressed an important aspect of the relationship between biodiversity and the functioning riparian corridors, similar studies should be extended to larger spatial scales with consideration of additional environmental variables such as soil and climate to strengthen the current results and contribute to sustainable management strategies for riparian corridors that prioritize ecological connectivity.
Data availability statement
The raw data supporting the conclusions of this article will be made available by the authors, without undue reservation.
Author contributions
SK: Conceptualization, Data curation, Methodology, Writing – original draft. GG: Conceptualization, Funding acquisition, Methodology, Project administration, Supervision, Writing – review and editing. FN: Formal Analysis, Methodology, Software, Supervision, Writing – review and editing. RB: Formal Analysis, Methodology, Software, Writing – original draft. TH: Writing – review and editing. AN: Conceptualization, Supervision, Writing – review and editing.
Funding
The author(s) declare that no financial support was received for the research, authorship, and/or publication of this article. This study received no external funding. All relevant financial resources were provided by the authors.
Acknowledgments
We are grateful to Sèwanou Marc TOVIHESSI, Nicanor KOUTON, and Zakiou Deen SALIFOU MALICK for field assistance.
Conflict of interest
The authors declare that the research was conducted in the absence of any commercial or financial relationships that could be construed as a potential conflict of interest.
Publisher’s note
All claims expressed in this article are solely those of the authors and do not necessarily represent those of their affiliated organizations, or those of the publisher, the editors and the reviewers. Any product that may be evaluated in this article, or claim that may be made by its manufacturer, is not guaranteed or endorsed by the publisher.
Supplementary material
The Supplementary Material for this article can be found online at: https://www.frontiersin.org/articles/10.3389/ffgc.2024.1291252/full#supplementary-material
Footnotes
References
Akoègninou, A., Van der Burg, W. J., and Van der Maesen, L. J. G. (2006). Flore analytique du Bénin. London: Backhuys Publishers.
Akognongbe, A., Abdoulaye, D., Vissin, E. W., and Boko, M. (2014). Dynamique de l’occupation du sol dans le bassin versant de l’Oueme à l’exutoire de Bétérou (Bénin). Afri. Sci. 10, v10i2. doi: 10.4314/afsci.v10i2
Ali, A. (2019). Forest stand structure and functioning: Current knowledge and future challenges. Ecol. Indic. 98, 665–677. doi: 10.1016/j.ecolind.2018.11.017
Ali, A., Yan, E.-R., Chang, S. X., Cheng, J.-Y., and Liu, X.-Y. (2017). Community-weighted mean of leaf traits and divergence of wood traits predict aboveground biomass in secondary subtropical forests. Sci. Total Environ. 574, 654–662.
Altuna, M., Martí, E., Sabater, F., Díez, J. R., Riera, J. L., Izco, F., et al. (2019). Incorporating in-stream nutrient uptake into river management: Gipuzkoa Rivers (Basque Country, North Spain) as a Case Study. Sustainability 11:2692. doi: 10.3390/su11092692
Arbonnier, M. (2009). Arbres arbustes et lianes des zones sèches d’Afrique de l’Ouest. Arbres arbustes et lianes des zones sèches d’Afrique de l’Ouest, 1–100. Available online at: https://www.torrossa.com/en/resources/an/5063322 (accessed February 16, 2023).
Azihou, A. F., Kakaï, R. G., Bellefontaine, R., and Sinsin, B. (2013). Distribution of tree species along a gallery forest–savanna gradient: patterns, overlaps and ecological thresholds. J. Trop. Ecol. 29, 25–37.
Bartón, K. (2018). MuMIn: Multi-Model Inference. R Packag. version 1.40. 4. Vienna: The R Project for Statistical Computing.
Biao, E. I. (2017). Assessing the impacts of climate change on river discharge dynamics in Oueme river Basin (Benin, West Africa). Hydrology 4:47. doi: 10.3390/hydrology4040047
Bigot, S., Zin, I., and Diedhiou, A. (2005). Apport de données de HRV de Spot pour l’étude des variations phénologiques dans le bassin de l’Ouémé (Bénin). Télédétection 4, 339–353.
Botta-Dukát, Z. (2005). Rao’s quadratic entropy as a measure of functional diversity based on multiple traits. J. Veg. Sci. 16, 533–540.
Burgess, S. (2014). Sample size and power calculations in Mendelian randomization with a single instrumental variable and a binary outcome. Int. J. Epidemiol. 43, 922–929. doi: 10.1093/ije/dyu005
Butterfield, B. J., and Suding, K. N. (2013). Single-trait functional indices outperform multi-trait indices in linking environmental gradients and ecosystem services in a complex landscape. J. Ecol. 101, 9–17. doi: 10.1111/1365-2745.12013
Cadotte, M. W. (2013). Experimental evidence that evolutionarily diverse assemblages result in higher productivity. Proc. Natl. Acad. Sci. U.S.A. 110, 8996–9000. doi: 10.1073/pnas.1301685110
Cadotte, M. W., Cardinale, B. J., and Oakley, T. H. (2008). Evolutionary history and the effect of biodiversity on plant productivity. Proc. Natl. Acad. Sci. 105, 17012–17017. doi: 10.1073/pnas.0805962105
Cadotte, M. W., Carscadden, K., and Mirotchnick, N. (2011). Beyond species: Functional diversity and the maintenance of ecological processes and services. J. Appl. Ecol. 48, 1079–1087. doi: 10.1111/j.1365-2664.2011.02048.x
Cardoso, P., Rigal, F., Borges, P. A. V., and Carvalho, J. C. (2014). A new frontier in biodiversity inventory: a proposal for estimators of phylogenetic and functional diversity. Methods Ecol. Evol. 5, 452–461. doi: 10.1111/2041-210X.12173
Cavanaugh, K. C., Gosnell, J. S., Davis, S. L., Ahumada, J., Boundja, P., Clark, D. B., et al. (2014). Carbon storage in tropical forests correlates with taxonomic diversity and functional dominance on a global scale. Glob. Ecol. Biogeogr. 23, 563–573.
Chave, J., Réjou-Méchain, M., Búrquez, A., Chidumayo, E., Colgan, M. S., Delitti, W. B., et al. (2014). Improved allometric models to estimate the aboveground biomass of tropical trees. Glob. Change Biol. 20, 3177–3190.
Chesson, P., Pacala, S., and Neuhauser, C. (2001). “Environmental niches and ecosystem functioning,” in Functional consequences of Biodiversity, eds A. Kinzig, S. Pacala, and D. Tilman (Princeton: Princeton University Press), 213–245.
Concostrina-Zubiri, L., Pescador, D. S., Martínez, I., and Escudero, A. (2014). Climate and small scale factors determine functional diversity shifts of biological soil crusts in Iberian drylands. Biodivers. Conserv. 23, 1757–1770. doi: 10.1007/s10531-014-0683-9
Concostrina-Zubiri, L., Prieto, M., Hurtado, P., Escudero, A., and Martínez, I. (2022). Functional diversity regulates the effects of habitat degradation on biocrust phylogenetic and taxonomic diversities. Ecol. Applic. 32:2599. doi: 10.1002/eap.2599
Deng, Y., Jiang, W., Wang, W., Lü, J., and Chen, K. (2018). Urban expansion led to the degradation of habitat quality in the Beijing-Tianjin-Hebei Area. Shengtai Xuebao 38, 4516–4525. doi: 10.5846/stxb201712062200
Ding, J., Zhao, W., Daryanto, S., Wang, L., Fan, H., Feng, Q., et al. (2017). The spatial distribution and temporal variation of desert riparian forests and their influencing factors in the downstream Heihe River basin, China. Hydrol. Earth Syst. Sci. 21, 2405–2419. doi: 10.5194/hess-21-2405-2017
Duru, M., Jouany, C., Le Roux, X., Navas, M. L., and Cruz, P. (2014). From a conceptual framework to an operational approach for managing grassland functional diversity to obtain targeted ecosystem services: Case studies from French mountains. Renew. Agric. Food Syst. 29, 239–254. doi: 10.1017/S1742170513000306
Dybala, K. E., Matzek, V., Gardali, T., and Seavy, N. E. (2019). Carbon sequestration in riparian forests: A global synthesis and meta-analysis. Glob. Change Biol. 25, 57–67. doi: 10.1111/gcb.14475
Esquivel, J., Echeverría, C., Saldaña, A., and Fuentes, R. (2020). High functional diversity of forest ecosystems is linked to high provision of water flow regulation ecosystem service. Ecol. Indic. 115:106433. doi: 10.1016/j.ecolind.2020.106433
Faith, D. P. (2006). The role of the phylogenetic diversity measure, PD, in bio-informatics: Getting the definition right. Evol. Bioinform. Online 2:117693430600200. doi: 10.1177/117693430600200008
Fan, Y., Chen, J., Shirkey, G., John, R., Wu, S. R., Park, H., et al. (2016). Applications of structural equation modeling (SEM) in ecological studies: an updated review. Ecol. Process. 5:19. doi: 10.1186/s13717-016-0063-3
Fanin, N., Gundale, M. J., Farrell, M., Ciobanu, M., Baldock, J. A., Nilsson, M.-C., et al. (2018). Consistent effects of biodiversity loss on multifunctionality across contrasting ecosystems. Nat. Ecol. Evol. 2, 269–278.
Galván-Cisneros, C. M., Villa, P. M., Coelho, A. J. P., Campos, P. V., and Meira-Neto, J. A. A. (2023). Altitude as environmental filtering influencing phylogenetic diversity and species richness of plants in tropical mountains. J. Mountain Sci. 20, 285–298. doi: 10.1007/s11629-022-7687-9
Gamfeldt, L., and Roger, F. (2017). Revisiting the biodiversity–ecosystem multifunctionality relationship. Nat. Ecol. Evol. 1, 1–7. doi: 10.1038/s41559-017-0168
Garnier, E., Cortez, J., Billès, G., Navas, M.-L., Roumet, C., Debussche, M., et al. (2004). Plant functional markers capture ecosystem properties during secondary succession. Ecology 85, 2630–2637.
Gatica, G., Escudero, A., and Pucheta, E. (2020). Livestock settlement affects shrub abundance via plant functional diversity but not species richness in arid environments. Plant Ecol. 221, 1253–1264. doi: 10.1007/s11258-020-01079-0
Grace, J. B. (2006). Structural Equation Modeling and Natural Systems. Cambridge: Cambridge University Press.
Grime, J. P. (1998). Benefits of plant diversity to ecosystems: immediate, filter and founder effects. J. Ecol. 86, 902–910. doi: 10.1046/j.1365-2745.1998.00306.x
Hector, A. (1998). The effect of diversity on productivity: Detecting the role of species complementarity. Oikos 82, 597–599. doi: 10.2307/3546380
Henriksson, N., Lim, H., Marshall, J., Franklin, O., McMurtrie, R. E., Lutter, R., et al. (2021). Tree water uptake enhances nitrogen acquisition in a fertilized boreal forest – but not under nitrogen-poor conditions. N. Phytol. 232, 113–122. doi: 10.1111/nph.17578
Herrero-Jáuregui, C., García-Fernández, C., Sist, P. L. J., and Casado, M. A. (2011). Recruitment dynamics of two low-density neotropical multiple-use tree species. Plant Ecol. 212, 1501–1512. doi: 10.1007/s11258-011-9924-0
Houessou, L. G., Teka, O., Imorou, I. T., Lykke, A. M., and Sinsin, B. (2013). Land use and land-cover change at “W” Biosphere Reserve and its surroundings areas in Benin Republic (West Africa). Environ. Natl. Resourc. Res. 3: 87.
Huang, A., Xu, X., Jia, G., and Shen, R. (2022). Asymmetrical cooling effects of Amazonian protected areas across spatiotemporal scales. Environ. Res. Lett. 17:054038. doi: 10.1088/1748-9326/ac6a6d
IPCC (2006). “IPCC. 2006. IPCC Guidelines for National Greenhouse Gas Inventories,” in Prepared by The National Greenhouse Gas Inventories Programme, eds H. S. Eggleston, L. Buendia, K. Miwa, T. Ngara, and K. Tanabe (Japan: IGES).
Ives, C. D., Hose, G. C., Nipperess, D. A., and Taylor, M. P. (2011). Environmental and landscape factors influencing ant and plant diversity in suburban riparian corridors. Landsc. Urban Plann. 103, 372–382. doi: 10.1016/j.landurbplan.2011.08.009
Jarzyna, M. A., and Jetz, W. (2016). Detecting the multiple facets of biodiversity. Trends Ecol. Evol. 31, 527–538. doi: 10.1016/j.tree.2016.04.002
Jin, S., Liu, X., Yang, J., Lv, J., Gu, Y., Yan, J., et al. (2022). Spatial-temporal changes of land use/cover change and habitat quality in Sanjiang plain from 1985 to 2017. Front. Environ. Sci. 10:1032584. doi: 10.3389/fenvs.2022.1032584
Jin, Y., and Qian, H. (2022). V. PhyloMaker2: An updated and enlarged R package that can generate very large phylogenies for vascular plants. Plant Divers. 44, 335–339.
Jones, K. B., Slonecker, E. T., Nash, M. S., Neale, A. C., Wade, T. G., and Hamann, S. (2010). Riparian habitat changes across the continental United States (1972-2003) and potential implications for sustaining ecosystem services. Landsc. Ecol. 25, 1261–1275.
Kattge, J., Bönisch, G., Díaz, S., Lavorel, S., Prentice, I. C., Leadley, P., et al. (2020). TRY plant trait database – enhanced coverage and open access. Glob. Change Biol. 26, 119–188. doi: 10.1111/gcb.14904
Kattge, J., Diaz, S., Lavorel, S., Prentice, I. C., Leadley, P., Bönisch, G., et al. (2011). TRY–a global database of plant traits. Glob. Change Biol. 17, 2905–2935.
Keeton, W. S., Copeland, E. M., Sullivan, S. M. P., and Watzin, M. C. (2017). Riparian forest structure and stream geomorphic condition: implications for flood resilience. Can. J. For. Res. 47, 476–487. doi: 10.1139/cjfr-2016-0327
Kembel, S. W., Cowan, P. D., Helmus, M. R., Cornwell, W. K., Morlon, H., Ackerly, D. D., et al. (2010). Picante: R tools for integrating phylogenies and ecology. Bioinformatics 26, 1463–1464.
Kodja, D. J., Akognongbé, A. J. S., Amoussou, E., Mahé, G., Vissin, E. W., Paturel, J.-E., et al. (2020). Calibration of the hydrological model GR4J from potential evapotranspiration estimates by the Penman-Monteith and Oudin methods in the Ouémé watershed (West Africa). PIAHS 383, 163–169. doi: 10.5194/piahs-383-163-2020
Kouagou, M., Ahouandjinou, E. B. O., Biaou, S. S. H., Keita, N. T., and Natta, K. A. (2018). Impact of fragmentation on tree diversity, density and structure of Pentadesma butyracea Sabine Clusiaceae population in Benin (West-Africa). Int. J. Biol. Chem. Sci. 12, 1965–1975. doi: 10.4314/ijbcs.v12i5
Kunwar, S., Wang, L.-Q., Kazempour Larsary, M., Chaudhary, R., Joshi, P. R., and Ali, A. (2023). Functional composition of tall-statured trees underpins aboveground biomass in tropical forests. J. For. Res. 34, 333–344. doi: 10.1007/s11676-022-01460-x
Le Bagousse-Pinguet, Y., Soliveres, S., Gross, N., Torices, R., Berdugo, M., and Maestre, F. T. (2019). Phylogenetic, functional, and taxonomic richness have both positive and negative effects on ecosystem multifunctionality. Proc. Natl. Acad. Sci. U.S.A. 116, 8419–8424. doi: 10.1073/pnas.1815727116
Lefcheck, J. S. (2016). piecewiseSEM: Piecewise structural equation modelling in r for ecology, evolution, and systematics. Methods Ecol. Evol. 7, 573–579.
Leishangthem, D., and Singh, M. R. (2018). Tree diversity, distribution and population structure of a riparian forest from certain zones along the Dikhu River in Nagaland, India. J. For. Environ. Sci. 34, 31–45. doi: 10.7747/JFES.2018.34.1.31
Li, R., Kraft, N. J. B., Yu, H., and Li, H. (2015). Seed plant phylogenetic diversity and species richness in conservation planning within a global biodiversity hotspot in eastern Asia. Conserv. Biol. 29, 1552–1562. doi: 10.1111/cobi.12586
Liquete, C., Cid, N., Lanzanova, D., Grizzetti, B., and Reynaud, A. (2016). Perspectives on the link between ecosystem services and biodiversity: The assessment of the nursery function. Ecol. Indic. 63, 249–257. doi: 10.1016/j.ecolind.2015.11.058
Luo, Y.-H., Cadotte, M. W., Burgess, K. S., Liu, J., Tan, S.-L., Zou, J.-Y., et al. (2019). Greater than the sum of the parts: how the species composition in different forest strata influence ecosystem function. Ecol. Lett. 22, 1449–1461.
MacIvor, J. S., Sookhan, N., Arnillas, C. A., Bhatt, A., Das, S., Yasui, S.-L. E., et al. (2018). Manipulating plant phylogenetic diversity for green roof ecosystem service delivery. Evol. Applic. 11, 2014–2024. doi: 10.1111/eva.12703
Maes, J., Paracchini, M. L., Zulian, G., Dunbar, M. B., and Alkemade, R. (2012). Synergies and trade-offs between ecosystem service supply, biodiversity, and habitat conservation status in Europe. Biol. Conserv. 155, 1–12. doi: 10.1016/j.biocon.2012.06.016
Maestre, F. T., Callaway, R. M., Valladares, F., and Lortie, C. J. (2009). Refining the stress-gradient hypothesis for competition and facilitation in plant communities. J. Ecol. 97, 199–205. doi: 10.1111/j.1365-2745.2008.01476.x
Magnano, A. L., Meglioli, P. A., Vazquez Novoa, E., Chillo, V., Alvarez, J. A., Alvarez, L. M., et al. (2023). Relationships between land-use intensity, woody species diversity, and carbon storage in an arid woodland ecosystem. For. Ecol. Manage. 529:120747. doi: 10.1016/j.foreco.2022.120747
Maracahipes-Santos, L., Silvério, D. V., Macedo, M. N., Maracahipes, L., Jankowski, K. J., Paolucci, L. N., et al. (2020). Agricultural land-use change alters the structure and diversity of Amazon riparian forests. Biol. Conserv. 252:108862. doi: 10.1016/j.biocon.2020.108862
Mazel, F., Davies, T. J., Gallien, L., Renaud, J., Groussin, M., Münkemüller, T., et al. (2016). Influence of tree shape and evolutionary time-scale on phylogenetic diversity metrics. Ecography 39, 913–920.
Mengist, W., Soromessa, T., and Feyisa, G. L. (2021). Landscape change effects on habitat quality in a forest biosphere reserve: Implications for the conservation of native habitats. J. Clean. Prod. 329:129778. doi: 10.1016/j.jclepro.2021.129778
Mensah, S., Dimobe, K., Noulèkoun, F., van der Plas, F., and Seifert, T. (2024). Phylogenetic diversity and community wide-trait means offer different insights into mechanisms regulating aboveground carbon storage. Sci. Total Environ. 907:167905. doi: 10.1016/j.scitotenv.2023.167905
Mensah, S., du Toit, B., and Seifert, T. (2018). Diversity–biomass relationship across forest layers: implications for niche complementarity and selection effects. Oecologia 187, 783–795.
Mensah, S., Noulèkoun, F., Dimobe, K., Seifert, T., and Glèlè Kakaï, R. (2023a). Climate and soil effects on tree species diversity and aboveground carbon patterns in semi-arid tree savannas. Sci. Rep. 13, 11509. doi: 10.1038/s41598-023-38225-3
Mensah, S., Noulèkoun, F., Salako, V. K., Lokossou, C. S. M. J., Akouété, P., Seifert, T., et al. (2023b). Structural and taxonomic diversity predict above-ground biomass better than functional measures of maximum height in mixed-species forests. Appl. Veg. Sci. 26, e12732. doi: 10.1111/avsc.12732
Mensah, S., Salako, K. V., Assogbadjo, A., Glèlè Kakaï, R., Sinsin, B., and Seifert, T. (2020a). Functional trait diversity is a stronger predictor of multifunctionality than dominance: Evidence from an Afromontane forest in South Africa. Ecol. Indic. 115:106415. doi: 10.1016/j.ecolind.2020.106415
Mensah, S., Salako, V. K., and Seifert, T. (2020b). Structural complexity and large-sized trees explain shifting species richness and carbon relationship across vegetation types. Funct. Ecol. 34, 1731–1745.
Mensah, S., Veldtman, R., Assogbadjo, A. E., Glèlè Kakaï, R., and Seifert, T. (2016). Tree species diversity promotes aboveground carbon storage through functional diversity and functional dominance. Ecol. Evol. 6, 7546–7557. doi: 10.1002/ece3.2525
Munn, M. D. (2018). Understanding the influence of nutrients on stream ecosystems in agricultural landscapes. Washington, DC: United States Department of the Interior.
Natta, A. K. (2003). Ecological assessment of riparian forests in Benin. Wageningen: Wageningen University and Research.
Natta, A. K., Sinsin, B., Maesen, L. J. G., and van der. (2002). Riparian forests, a unique but endangered ecosystem in Benin. Bot. Jahrb. Syst. Pflanzengesch. Pflanzengeogr. 124, 55–69. doi: 10.1127/0006-8152/2002/0124-0055
Navarro-Cano, J. A., Ferrer-Gallego, P. P., Laguna, E., Ferrando, I., Goberna, M., Valiente-Banuet, A., et al. (2016). Restoring phylogenetic diversity through facilitation: Restoring phylogenetic diversity. Restor. Ecol. 24, 449–455. doi: 10.1111/rec.12350
Newcomer, T. A., Kaushal, S. S., Mayer, P. M., Smith, R. M., and Sivirichi, G. M. (2016). Nutrient retention in restored streams and rivers: A global review and synthesis. Water 8:116. doi: 10.3390/w8040116
Noulèkoun, F., Birhane, E., Mensah, S., Kassa, H., Berhe, A., Gebremichael, Z. M., et al. (2021). Structural diversity consistently mediates species richness effects on aboveground carbon along altitudinal gradients in northern Ethiopian grazing exclosures. Sci. Total Environ. 776:145838. doi: 10.1016/j.scitotenv.2021.145838
Noulékoun, F., Mensah, S., Dimobe, K., Birhane, E., Kifle, E. T., Naab, J., et al. (2024). Both the selection and complementarity effects underpin the effect of structural diversity on aboveground biomass in tropical forests. Glob. Ecol. Biogeogr. 33, 325–340. doi: 10.1111/geb.13800
Nunes, M. H., De Castro Nunes Santos Terra, M., De Oliveira, I. R. C., and Van Den Berg, E. (2018). The influence of disturbance on driving carbon stocks and tree dynamics of riparian forests in Cerrado. J. Plant Ecol. 11, 401–410. doi: 10.1093/jpe/rtx007
Ohlert, T., Kimmel, K., Avolio, M., Chang, C., Forrestel, E., Gerstner, B., et al. (2022). Exploring the impact of trait number and type on functional diversity metrics in real-world ecosystems. PLoS One 17:e0272791. doi: 10.1371/journal.pone.0272791
Oka, C., Aiba, M., and Nakashizuka, T. (2019). Phylogenetic clustering in beneficial attributes of tree species directly linked to provisioning, regulating and cultural ecosystem services. Ecol. Indic. 96, 477–495. doi: 10.1016/j.ecolind.2018.09.035
Okansen, J., Blanchet, F. G., Friendly, M., Kindt, R., Legendre, P., McGlinn, D., et al. (2020). vegan: community ecology package. R package version 2.5–7.
Ouyang, S., Gou, M., Lei, P., Liu, Y., Chen, L., Deng, X., et al. (2023). Plant functional trait diversity and structural diversity co-underpin ecosystem multifunctionality in subtropical forests. For. Ecosyst. 10:100093. doi: 10.1016/j.fecs.2023.100093
Paixão, E. C., Noronha, J. C., Nunes da Cunha, C., and Arruda, R. (2013). More than light: Distance-dependent variation on riparian fern community in Southern Amazonia. Rev. Brasil. Bot. 36, 25–30. doi: 10.1007/s40415-013-0003-8
Peña-Lara, V. A., Dupuy, J. M., Reyes-Garcia, C., Sanaphre-Villanueva, L., Portillo-Quintero, C. A., and Hernández-Stefanoni, J. L. (2022). Modelling species richness and functional diversity in tropical dry forests using multispectral remotely sensed and topographic data. Remote Sens. 14:5919. doi: 10.3390/rs14235919
Pinheiro, J., and Bates, D. (2000). Mixed-Effects Models in S and S-PLUS. New York, NY: Springer-Verlag, doi: 10.1007/b98882
Prager, C. M., Jing, X., Henning, J. A., Read, Q. D., Meidl, P., Lavorel, S., et al. (2021). Climate and multiple dimensions of plant diversity regulate ecosystem carbon exchange along an elevational gradient. Ecosphere 12:3472. doi: 10.1002/ecs2.3472
Pyles, M. V., Magnago, L. F. S., Maia, V. A., Pinho, B. X., Pitta, G., de Gasper, A. L., et al. (2022). Human impacts as the main driver of tropical forest carbon. Sci. Adv. 8, eabl7968. doi: 10.1126/sciadv.abl7968
R Core Team (2021). R: A language and environment for statistical computing. Vienna: R Foundation for Statistical Computing. Available online at: https://www.R-project.org/
Rees, S. E., Sheehan, E. V., Jackson, E. L., Gall, S. C., Cousens, S. L., Solandt, J.-L., et al. (2013). A legal and ecological perspective of ‘site integrity’ to inform policy development and management of Special Areas of Conservation in Europe. Mar. Poll. Bull. 72, 14–21. doi: 10.1016/j.marpolbul.2013.03.036
Réjou-Méchain, M., Tanguy, A., Piponiot, C., Chave, J., and Hérault, B. (2017). Biomass: An r package for estimating above-ground biomass and its uncertainty in tropical forests. Methods Ecol. Evol. 8, 1163–1167.
Richard, A. (2012). Caractérisation de la variabilité spatiale des propriétés hydrodynamiques des sols de l’Ouémé supérieur (Bénin): Rapport d’analyse. Grenoble: LTHE.
Riley, R. D., Abrams, K. R., Sutton, A. J., Lambert, P. C., and Thompson, J. R. (2007). Bivariate random-effects meta-analysis and the estimation of between-study correlation. BMC Med. Res. Methodol. 7:3. doi: 10.1186/1471-2288-7-3
Rodrigues, A. C., Villa, P. M., Silla, F., Gomes, L. P., Meira-Neto, J. A. A., Torres, C. M. M. E., et al. (2023). Functional composition enhances aboveground carbon stock during tropical late-secondary forest succession. Plant Biosyst. 157, 1–11. doi: 10.1080/11263504.2022.2073394
Ruiz-Benito, P., Gómez-Aparicio, L., Paquette, A., Messier, C., Kattge, J., and Zavala, M. A. (2014). Diversity increases carbon storage and tree productivity in Spanish forests. Glob. Ecol. Biogeogr. 23, 311–322. doi: 10.1111/geb.12126
Safi, K., Cianciaruso, M. V., Loyola, R. D., Brito, D., Armour-Marshall, K., and Diniz-Filho, J. A. F. (2011). Understanding global patterns of mammalian functional and phylogenetic diversity. Philos. Trans. R. Soc. B: Biol. Sci. 366, 2536–2544.
Saklaurs, M., Dubra, S., Liepa, L., Jansone, D., and Jansons, A. (2022). Vegetation affecting water quality in small streams: Case study in Hemiboreal forests, Latvia. Plants 11:1316. doi: 10.3390/plants11101316
Salunkhe, O., Khare, P. K., Kumari, R., and Khan, M. L. (2018). A systematic review on the aboveground biomass and carbon stocks of Indian forest ecosystems. Ecol. Process. 7, 1–12.
Sandel, B. (2018). Richness-dependence of phylogenetic diversity indices. Ecography 41, 837–844. doi: 10.1111/ecog.02967
Schuler, L. J., Bugmann, H., and Snell, R. S. (2017). From monocultures to mixed-species forests: is tree diversity key for providing ecosystem services at the landscape scale? Landsc. Ecol. 32, 1499–1516.
Seavy, N. E., Gardali, T., Golet, G. H., Griggs, F. T., Howell, C. A., Kelsey, R., et al. (2009). Why climate change makes riparian restoration more important than ever: Recommendations for practice and research. Ecol. Restor. 27, 330–338. doi: 10.3368/er.27.3.330
Shipley, B. (2016). Cause and Correlation in Biology: A User’s Guide to Path Analysis, Structural Equations and Causal Inference with R. Cambridge: Cambridge University Press.
Sintayehu, D. W., Belayneh, A., and Dechassa, N. (2020). Aboveground carbon stock is related to land cover and woody species diversity in tropical ecosystems of Eastern Ethiopia. Ecol. Process. 9, 1–10. doi: 10.1186/s13717-020-00237-6
Suárez-Castro, A. F., Raymundo, M., Bimler, M., and Mayfield, M. M. (2022). Using multi-scale spatially explicit frameworks to understand the relationship between functional diversity and species richness. Ecography 2022, e05844. doi: 10.1111/ecog.05844
Suchenwirth, L., Förster, M., Cierjacks, A., Lang, F., and Kleinschmit, B. (2012). Knowledge-based classification of remote sensing data for the estimation of below- and above-ground organic carbon stocks in riparian forests. Wetlands Ecol. Manage. 20, 151–163. doi: 10.1007/s11273-012-9252-8
Swacha, G., Meserszmit, M., Pavlù, L., Pavlù, V. V., Kajzrová, K., Kassahun, T., et al. (2023). Drivers of species-specific contributions to the total live aboveground plant biomass in Central European semi-natural hay grasslands. Ecol. Indic. 146:109740. doi: 10.1016/j.ecolind.2022.109740
Swamy, P. S., Sundarapandian, S. M., Chandrasekar, P., and Chandrasekaran, S. (2000). Plant species diversity and tree population structure of a humid tropical forest in Tamil Nadu, India. Biodivers. Conserv. 9, 1643–1669. doi: 10.1023/A:1026511812878
Swanson, A. C., and Bohlman, S. (2021). Cumulative impacts of land cover change and dams on the land-water interface of the Tocantins river. Front. Environ. Sci. 9:662904. doi: 10.3389/fenvs.2021.662904
Teixeira, L. H., Mazzochini, G. G., Kollmann, J., and Ganade, G. (2022). Phylogenetic distance controls plant growth during early restoration of a semi-arid riparian forest. Ecol. Solut. Evid. 3:12184. doi: 10.1002/2688-8319.12184
Terrado, M., Sabater, S., Chaplin-Kramer, B., Mandle, L., Ziv, G., and Acuña, V. (2016). Model development for the assessment of terrestrial and aquatic habitat quality in conservation planning. Sci. Total Environ. 540, 63–70. doi: 10.1016/j.scitotenv.2015.03.064
Tilman, D., Knops, J., Wedin, D., Reich, P., Ritchie, M., and Siemann, E. (1997). The influence of functional diversity and composition on ecosystem processes. Science 277, 1300–1302.
Ullah, F., Gilani, H., Sanaei, A., Hussain, K., and Ali, A. (2021). Stand structure determines aboveground biomass across temperate forest types and species mixture along a local-scale elevational gradient. For. Ecol. Manage. 486:118984. doi: 10.1016/j.foreco.2021.118984
Villéger, S., Mason, N. W., and Mouillot, D. (2008). New multidimensional functional diversity indices for a multifaceted framework in functional ecology. Ecology 89, 2290–2301.
Violle, C., Navas, M.-L., Vile, D., Kazakou, E., Fortunel, C., Hummel, I., et al. (2007). Let the concept of trait be functional! Oikos 116, 882–892. doi: 10.1111/j.0030-1299.2007.15559.x
Wallwork, A., Banin, L. F., Dent, D. H., Skiba, U., and Sayer, E. (2022). Soil carbon storage is related to tree functional composition in naturally regenerating tropical forests. Funct. Ecol. 36, 3175–3187. doi: 10.1111/1365-2435.14221
Wang, L.-Q., and Ali, A. (2022). Functional identity regulates aboveground biomass better than trait diversity along abiotic conditions in global forest metacommunities. Ecography 2022:05854.
Wasser, L., Chasmer, L., Day, R., and Taylor, A. (2015). Quantifying land use effects on forested riparian buffer vegetation structure using LiDAR data. Ecosphere 6, 1–17. doi: 10.1890/es14-00204.1
Wondimu, M. T., Nigussie, Z. A., and Yusuf, M. M. (2021). Tree species diversity predicts aboveground carbon storage through functional diversity and functional dominance in the dry evergreen Afromontane forest of Hararghe highland, Southeast Ethiopia. Ecol. Process. 10:47. doi: 10.1186/s13717-021-00322-4
Xu, F., Otte, A., Ludewig, K., Donath, T., and Harvolk-Schöning, S. (2017). Land cover changes (1963–2010) and their environmental factors in the upper Danube floodplain. Sustainability 9:943. doi: 10.3390/su9060943
Yang, J., Xie, B., and Zhang, D. (2021). The trade-offs and synergistic relationships between grassland ecosystem functions in the yellow river basin. Diversity 13:100505. doi: 10.3390/d13100505
Yuan, Z., Ali, A., Ruiz-Benito, P., Jucker, T., Mori, A. S., Wang, S., et al. (2020). Above-and below-ground biodiversity jointly regulate temperate forest multifunctionality along a local-scale environmental gradient. J. Ecol. 108, 2012–2024.
Keywords: aboveground carbon, habitat quality, protected areas, Upper Ouémé, West-Africa
Citation: Kinnoumè SMD, Gouwakinnou GN, Noulèkoun F, Balagueman RO, Houehanou TD and Natta AK (2024) Trees diversity explains variations in biodiversity-ecosystem function relationships across environmental gradients and conservation status in riparian corridors. Front. For. Glob. Change 7:1291252. doi: 10.3389/ffgc.2024.1291252
Received: 08 September 2023; Accepted: 27 February 2024;
Published: 26 March 2024.
Edited by:
Wensheng Bu, Jiangxi Agricultural University, ChinaReviewed by:
Salako Kolawole Valere, University of Abomey-Calavi, BeninWen Xing Long, Hainan University, China
Copyright © 2024 Kinnoumè, Gouwakinnou, Noulèkoun, Balagueman, Houehanou and Natta. This is an open-access article distributed under the terms of the Creative Commons Attribution License (CC BY). The use, distribution or reproduction in other forums is permitted, provided the original author(s) and the copyright owner(s) are credited and that the original publication in this journal is cited, in accordance with accepted academic practice. No use, distribution or reproduction is permitted which does not comply with these terms.
*Correspondence: Socrate Mercator Dossou Kinnoumè, kinos3@yahoo.fr
†These authors have contributed equally to this work