Effects of changing riparian topography on the decline of ecological indicators along the drawdown zones of long rivers in China
 Muhammad Arif
 Irene Petrosillo
 Li Changxiao
- 1Key Laboratory of Eco-Environments in the Three Gorges Reservoir Region (Ministry of Education), College of Life Sciences, Southwest University, Chongqing, China
- 2Biological Science Research Center, Academy for Advanced Interdisciplinary Studies, Southwest University, Chongqing, China
- 3Lab of Landscape Ecology, Department of Biological and Environmental Sciences and Technologies, University of Salento, Lecce, Italy
Riparian topographical features can drive a suite of ecological indicators (EIs) that shape the river ecosystem. The mechanisms that EIs reflect provide several ecosystem services. We know little about the responses of EIs (indicators of plant cover, regeneration, exotics, habitat, erosion, and stressors) to the changing stream-channel width, riparian width, and elevation of the lengthy drawdown zones (upstream, midstream, and downstream) of long rivers. We have discovered that changing topographical characteristics affect riparian buffer areas differently by using a rapid field-based method with 297 transects in inundated regions along the Yangtze River and other 36 linked tributaries in China. Changing stream-channel widths was most effective on downstream EIs and the least effective at midstream. The exotic parameters were the most affected (with a range of −0.36 < r < 0.401) by stream-channel widths, as determined using Pearson correlation (p < 0.05). In contrast, the changing riparian width had the uppermost impact on the upstream EIs and the lowermost impact downstream; riparian width had the most significant impact on habitat parameters (with r ≤ 0.787). The elevation followed the riparian width pattern and was negatively associated with habitat and exotics (r ≤ −0.645 and r ≤ −0.594) and positively correlated with regeneration (r ≤ 0.569). These results reaffirm the imperative need for studies on regionally dependent riparian areas maintained under the same management strategies regardless of their topographical features. Future policies should be formulated to enhance ecosystem service provision, promoting the sustainable use of extensive river ecosystems while considering EIs. Additionally, these future policies should acknowledge drawdown zone factors within the same river network. Furthermore, additional measures are imperative to conserve topographical features and prevent further destruction.
1 Introduction
Freshwater resources face tremendous pressure due to climate change, intensive land-use, and increased population density worldwide (Rodrigues et al., 2018; Martins et al., 2021; Zheng et al., 2023). The variation in available water supplies has increased the necessity of freshwater conservation, particularly in limited and unstable water supply situations (Belete et al., 2020; Suwal et al., 2020; Arif et al., 2023). In the midst of development changes on an international and even global scale, the morphological and hydrological characteristics of rivers have changed considerably (Biswas et al., 2019; Fernandes et al., 2021). These changes resulted in transformed ecosystems that were discovered in more than half of rivers at the end of the last century, and they are projected to be present in 90% of riverscapes worldwide by 2030 (Van Cappellen and Maavara, 2016). The development of sustainable river ecosystems becomes more critical if changes in the topographical features of riparian habitats are caused by human activities in aquatic environments (Dempsey et al., 2017; Stutter et al., 2021; Terencio et al., 2021).
Several studies have shown that waterways are strongly susceptible to anthropogenic drivers that result in topographical changes (Huang et al., 2019; Hira et al., 2023). These changes in topographical features frequently pose a significant threat to waterways, which represent the most valuable natural capital that provides vital ecosystem services for human survival (Hanasaki et al., 2018; Eriyagama et al., 2020). Therefore, river resource degradation requires immediate political attention. In this perspective, the Water Framework Directive 2000/60/EC plans to restore almost 60 percent of rivers to “healthy environmental standards” by 2027 in Europe (Guo et al., 2021). A similar level of attention is required globally, including in China. Moreover, wetlands modification and climate change all have an impact on river landscapes, resulting in river worsening, increased natural water contamination, and ecological quality declines (Boisjolie et al., 2017).
The maintenance of the quality of riparian zones is determined by various factors that also include river flora characteristics (Fernandes et al., 2016; Janssen et al., 2021), since the complex network and river scale determine watercourse responses (Xiang et al., 2021). For example, tributaries differ from main rivers in terms of topographical, hydrological, and ecological factors such as slope, discharge, and riparian vegetation that influence their services (Wohl, 2017). There was evidence that riparian buffers of less than 10 meters did not provide the maximum ecological benefits on either side of a stream and that significantly larger buffers (>30 meters) could provide higher ecological benefits (Luke et al., 2019). A smaller buffer zone measured in Sweden, Finland, and British Columbia was insufficient to mitigate the adverse effects of environmentally destructive activities and failed to prevent erosion of waterways (Kujanova et al., 2018). Globally, large river networks require proper attention in order to function sustainably (Hecht et al., 2019). The first step towards conserving aquatic ecosystems would be to improve environmental and hydrological conditions (Grabas et al., 2019). Once a stable ecosystem has been established, biological conservation can be more effectively achieved. Typically, riparian laws call for a minimum protection width in a given region. As a comparison, few studies have examined buffer width in the tropics and North America (Kuglerova et al., 2020) to ascertain its impact on the environment. In Asian countries, policies are either non-existent or loosely defined. In developing countries, standards do exist, but they can be ambiguous, nuanced, and heavily reliant on local evidence. Therefore, it is imperative to assess the specific effects of changing topographic features on regional stream networks, such as the Yangtze River and other linked rivers drawdown zone. It contributes substantially to the economic well-being of the Chinese people and the global economy in general.
The drawdown zone of lengthy rivers can be divided into upstream, midstream, and downstream sections (Muhammad et al., 2022), which may vary along elevation gradients and modify ecological indicators (EIs), as is the case for the Yangtze River network. Besides being the longest river in Asia, the Yangtze also provides drinking water for millions of people and plays an essential role in the region’s ecosystem. The diverse geography and ecosystems along this river intricately intertwine human activities and the environment (Li et al., 2023a). Understanding Yangtze dynamics is essential to dealing with pollution and habitat degradation (Arif et al., 2022). Additionally, this understanding has implications for sustainable river management. Recent research has suggested that climate change and damming on rivers will shift phenological features through elevation gradients, resulting in riparian zone deterioration (Vitasse et al., 2018; Chen et al., 2022). The literature on changing topographical aspects governing the drawdown zones of large rivers in China is limited. At different elevations, the climate has a dissimilar impact upon the vegetation; hence, a similar effect can be expected from other topographical features (stream channel widths and riparian buffer widths) of the drawdown zone of rivers. Because the environment affects vegetation in different ways at varying elevations (Pompa-Garcia et al., 2021; Shahariar et al., 2021), topographical features (e.g., stream-channel width, riparian width, and elevation) may variably impact the river’s other EIs. Hence, in the face of a shifting environment and its consequences on productivity, topographical features remain important measures of EIs (Tito et al., 2018; Zheng et al., 2023). It is hypothesized that changes in riparian topographical features affect ecological indicators along the drawdown zones of long rivers similarly or not. In this context, the objectives of this study are to: (1) determine the EIs situation (in terms of riparian health and stress) based on the drawdown zones (e.g., upstream, midstream, and downstream); (2) classify the significant components that account for the overall variance in riparian zone structure across different scales; (3) explore the relationship between these EIs with stream channel widths, riparian buffer widths, and elevation, which change the riparian zone landscape pattern; and (4) measure the statistical interrelationship between the ecological parameter indexes and sub-indexes of the upstream, midstream, and downstream riparian areas inside the Yangtze River and other linked tributaries in China.
2 Materials and methods
2.1 Study area
This research covers the inundated areas of the Yangtze River and its other 36 linked tributaries (Figure 1) flowing through the Three Gorges Dam (TGD) in China. The Yangtze River comprises a cumulative area of 1,084 km2 (Arif et al., 2023), which is the longest river in Asia and the third-longest river in the world. It has an approximately 6,380 km long span and has connections with differently sized tributaries. Most of the tributaries are first- and second-order streams (Li et al., 2023b). The drawdown zone of the Yangtze River and its other 36 linked tributaries comprises three parts: upstream (23%), midstream (49%), and downstream (28%). The ranges of stream channel width, riparian widths, and elevation were dissimilar from the range of the drawdown zone (Figure 2). The stream channel width was more prominent in the midstream and was 388.03 ± 124.79 m (mean ± standard deviation) in the Yangtze River and 100.10 ± 86.07 m in tributaries. It was the lowest in the upstream segment at 196.32 ± 58.97 m in the Yangtze River and 65.07 ± 58.44 m downstream in the tributaries. The riparian width ranged highest in the midstream section at 132.83 ± 96.77 m wide in the Yangtze River and 123.62 ± 128.90 m in tributaries. It was varying lowest in the downstream segment at 58.47 ± 33.80 m in the Yangtze River and in the upstream segment at 69.16 ± 32.66 m in the tributaries. The water level varied from 145 to 175 m during the year (Xiang et al., 2021), with a gross storage volume of 39.3 billion m3 at 175 m at TGD (details in Supplementary Figure SA1). Thus, the elevation varied between 145 m and 184 m in our sample transects due to the construction of the TGD. It has an entirely dissimilar impact on EIs with the same range along the drawdown zone inside these rivers.
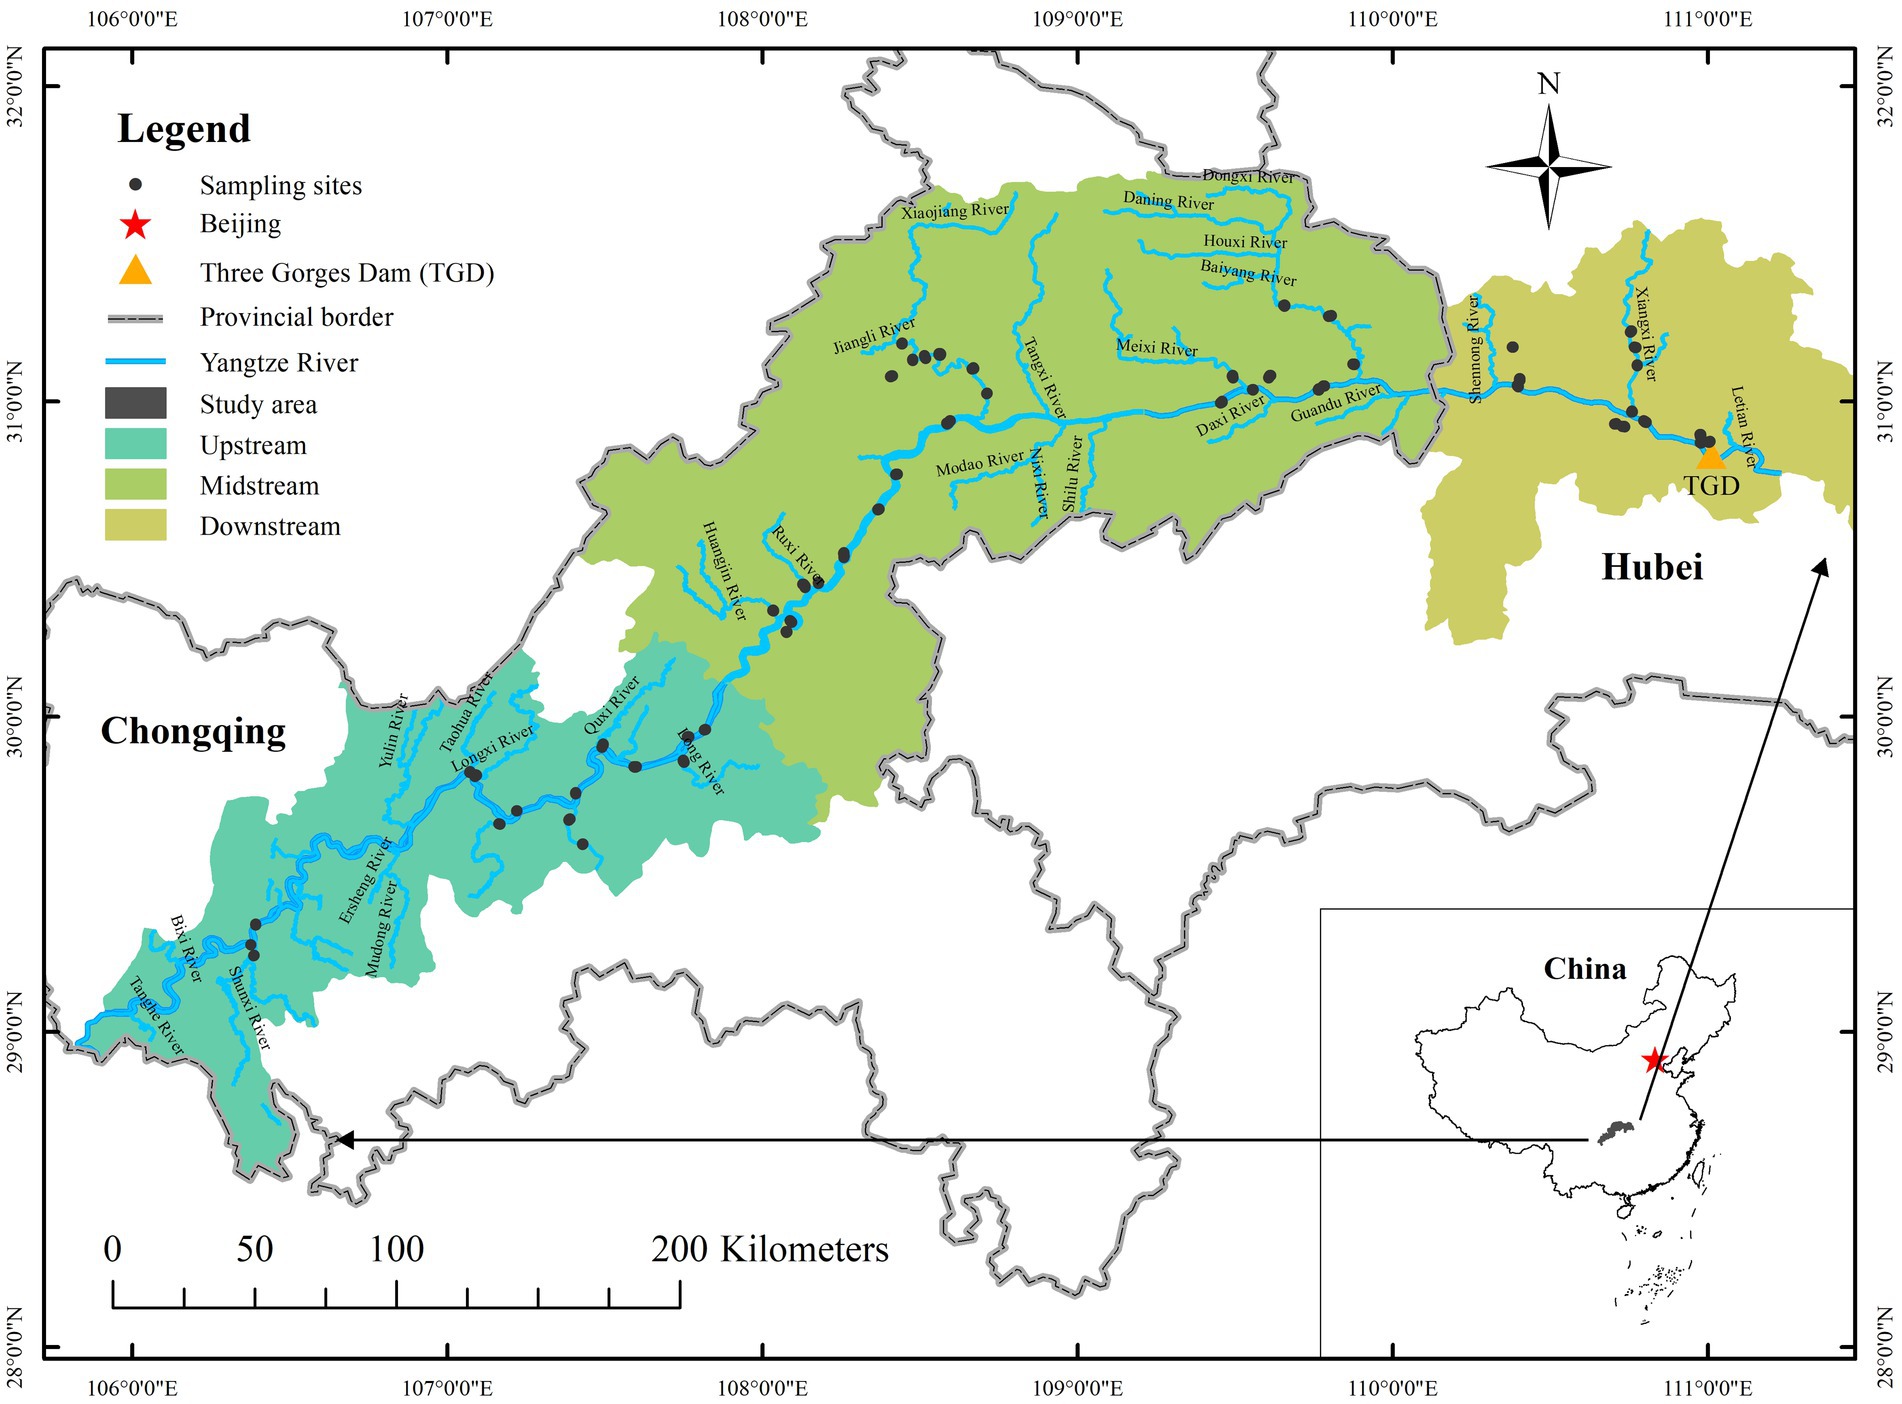
Figure 1. Location of sample sites in the drawdown zone (upstream, midstream, and downstream) within the Yangtze River and other linked tributaries in China.
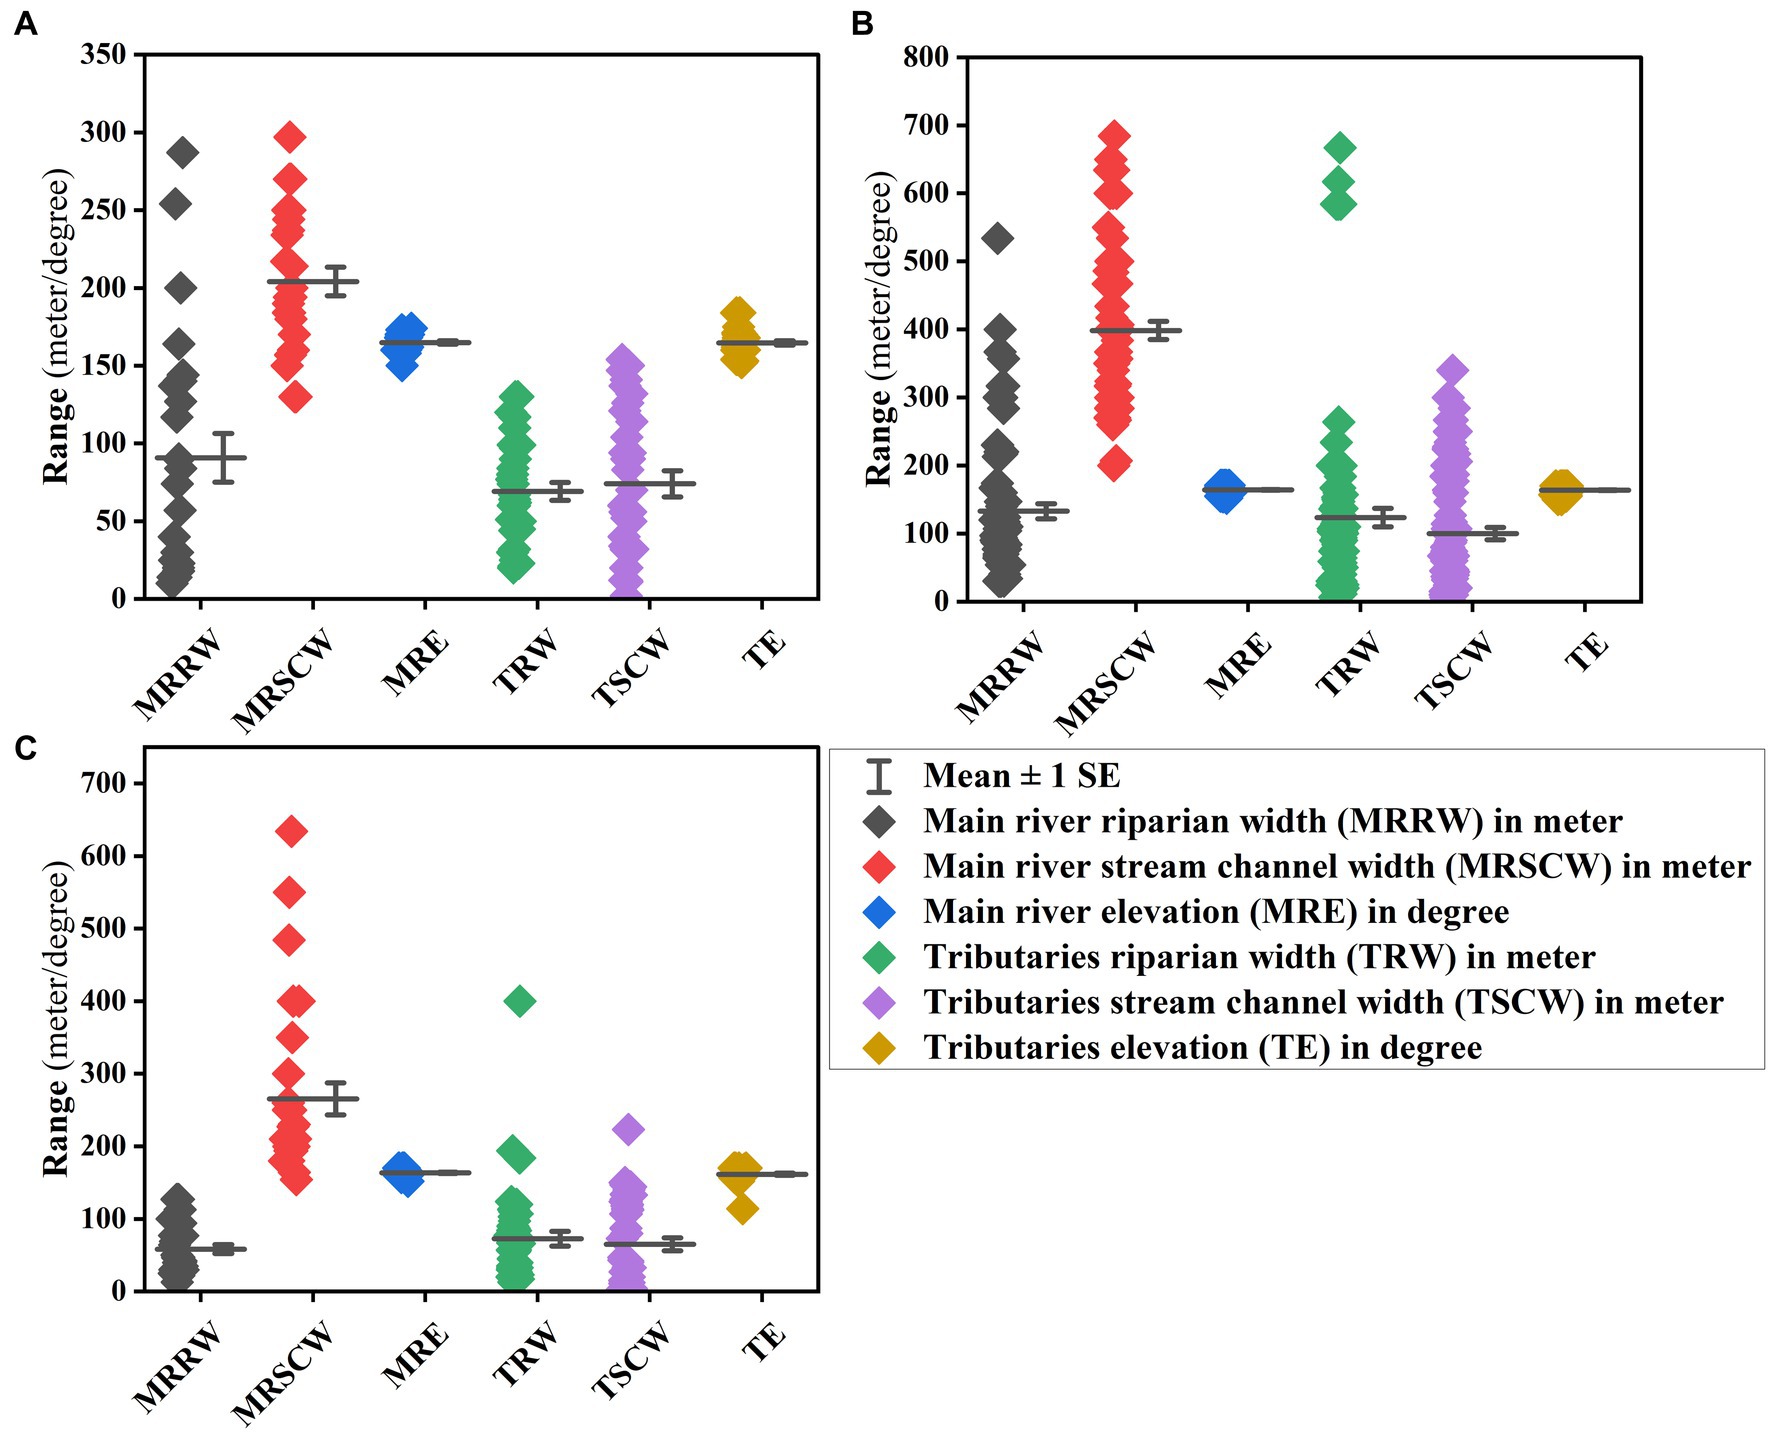
Figure 2. Riparian topographical features interval-plots measured in transects of the upstream (A), midstream (B), and downstream (C) segments within the Yangtze River and other linked tributaries in China.
The study area shows divergent environmental features considering the length and subtropical atmospheric monsoon climate in the area (Chen et al., 2022). The annual precipitation was 1,064 ± 55 mm, 1,194 ± 66 mm, and 1,100 ± 58 mm in the upstream, midstream, and downstream sections (details in Supplementary Figure SA2). The yearly temperature was higher in the midstream section (18.56 ± 0.49°C) and lowest in the downstream section (17.76 ± 0.49°C). The Chinese soil classification describes the soils in this region as purple and yellow. The soil pH showed different values and was highest in the upstream section (7.59 ± 0.22) and lowest in the midstream section (7.21 ± 0.49). The soil bulk density (g cm−3) was the highest and lowest in the midstream and downstream sections, respectively, at 1.24 ± 0.16 and 1.21 ± 0.16. The riparian buffer zone showed a 30 m vertical submersion, which would affect the ecological characteristics overall (Chen et al., 2022). Over two-thirds of the newly uncovered areas in the survey transects were occupied by grass species. Due to the obvious rich sediment in floodplain regions, exotic species thrive in the fertile and resource-rich alluvial plains. The flora was diverse. The floristic composition was identified, and structures of the landform reacted differently along the latitudinal and longitudinal axes within their riparian buffer areas (Li et al., 2023a). The vegetation deterioration in sampled rivers has also been attributed to long-term human activity (primarily cultivation and construction). As a result, farm fields and pasture occupied some sites, whereas secondary trees dominated other ground covers.
Only a few terrestrial animals were observed during field trips, and the remainder were raising livestock managed by locals. At many locations, fishing and camping events were witnessed, demonstrating the significant variety of lotic species. Particular geographical areas with varied topography and climatic surroundings were associated with the river networks. The presence of ancient, native, exotic, and endangered plants in the river suggested diversity. The flora included a wide range of tropical, subtropical, and temperate species. Furthermore, the fauna of Yangtze River and its tributaries included several terrestrial species. However, the periodic submergence was found to have a partly or eradicated effect on many plant species. The conservation status of the riparian zones along these rivers was well below that of native terrestrial resources, causing the ecosystem and its ecological conditions to change. The Yangtze River and its tributaries showed a declining situation of EIs along the drawdown zone of the sampled rivers. In most transects, the lower banks were clear, with thin vegetation strips in the river systems, and erosion was relatively heavy. Due to the extreme shortage of shrubs and trees, the central banks had lost organic litter. With sparse edge trees, the upper banks showed largely stable. The ecological conditions of the Yangtze River and its tributaries varied in terms of composition and resources throughout the TGD.
2.2 Conceptualization of sampling
Our study utilized a qualitative systemic approach to collect data on 297 transects through collaboration work (provided in acknowledgement) along the drawdown zone of the Yangtze River and its linked tributaries. This was done during the summer of 2019 and 2020 as the summer season is most suitable for data collection in the TGD. This technique is mainly used to measure riparian buffer variations in the river settings. A total of 57 (19%), 167 (56%), and 73 (25%) transects were chosen in riparian areas, considering the relative proportions of upstream (23%), midstream (49%), and downstream (28%) segments in the sampled rivers, respectively. Of these, 131 and 166 transects were from the Yangtze River and tributaries, respectively. Our research included 40 EIs (Figure 3) divided into six categories to reflect riparian zone characteristics (e.g., plant cover, exotics, regeneration, habitat, erosion, and stressors). Stressors were compiled as a separate index considering their nature. These parameters measuring information can be found in previous publication (Arif et al., 2022). Field assessments were conducted (details in Supplementary Figures SB1–SB13), and equal weights were assigned to these variables. When determining the exact location of transects, we prioritized the accessibility of the sites (e.g., thorny shrub or vertical sites). Transects were 100 m long and 20 m wide in order to determine parameters parallel with streams. Three transects were developed at each research site to monitor substantial variations in the buffer zone. Firstly, at 10 m from the stream channel to capture lower-bank functions; secondly, at 40–50 m from the fluvial channel border to detect the central-bank attributes; thirdly, at 80–100 m from the river to record the top bank features. Each parameter was determined at three points in each transect (e.g., 0, 50, and 100 m) (details in Supplementary Figure SB2). Our measurements of stream channels, riparian buffers, and elevation were performed using the Global Positioning System (GPS). We saw significant variations in these widths in the field sites. A measuring tape was used to determine the width of the transect through each site.
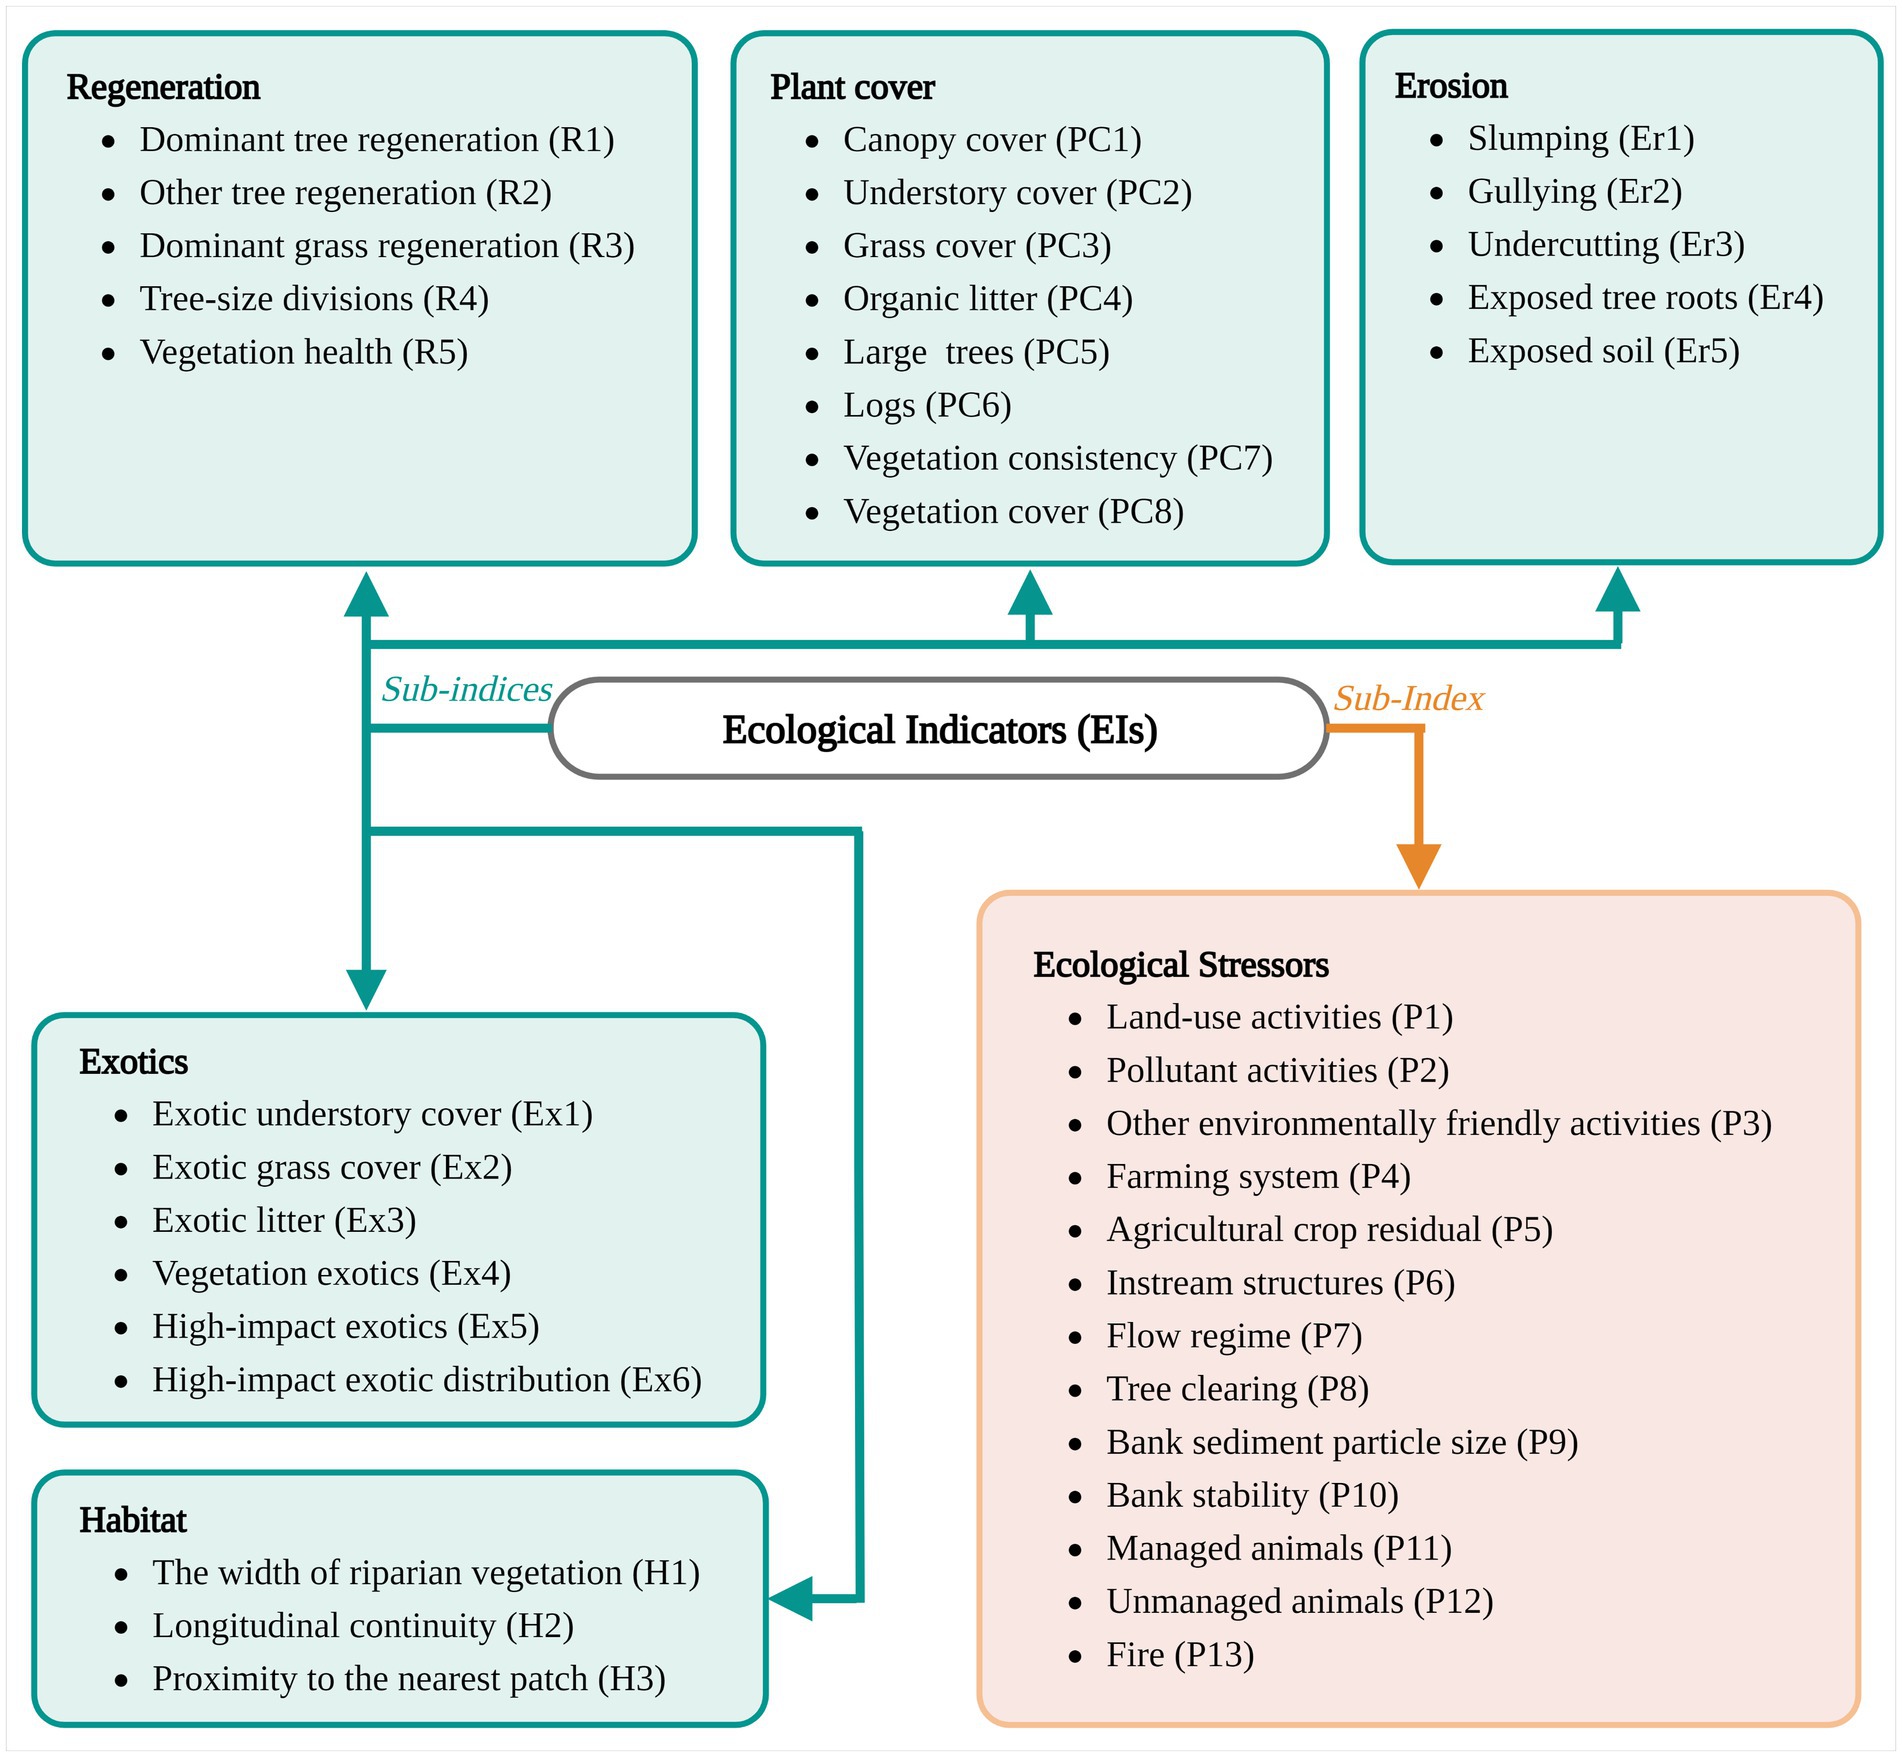
Figure 3. List of ecological indicators (EIs) along with their respective abbreviations inside the parentheses, used for drawdown zone (upstream, midstream, and downstream) within the Yangtze River and other linked tributaries in China. Source: Arif et al. (2022, 2023).
2.3 Statistical methods
We measured statistically significant variations between the ecological network parameter indexing with Kruskal–Wallis tests (p < 0.05) under the domains of stream-channel width, riparian buffer width, and elevation separately for the upstream, midstream, and downstream segments as the data was not normally distributed. Nonparametric analyses can assess whether the ecosystem and conservation research show substantial heterogeneity between two or more independent variables (Higgins, 2004; Zema et al., 2018). Principal component (factor) analyses were performed to determine the essential parameters (Bombino et al., 2019). This work diminished the complexity of the 40 parameters without the loss of information, improving parameter interpretability. The association of stream-channel widths, riparian widths, and elevation with all EIs was measured using Pearson correlation separately for the upstream, midstream, and downstream segments. The correlation analysis function is widely used for linear relationships, and this analysis reflects their interaction (Wang, 2013; Li et al., 2023b). Finally, hierarchical cluster analysis (dendrogram) was carried out to combine the index and sub-indices of EIs with their interrelationship potential. These parameters are compared in detail in these consolidated graphs and can be found contrarily along the drawdown zone within the Yangtze River and other linked tributaries region. The variables in the setting are kept in clusters. The average for each group is computed using the cluster method. The correlation is determined by distance type. The sum of distances is computed by finding the clustered by. Additionally, we maintained the horizontal orientation of the plot. These tests were conducted using Origin Pro software (Northampton, MA, the USA) released in 2023.
3 Results and discussion
The current study aims to quantify all possible EIs within riparian areas along the drawdown zones of the Yangtze River and its linked tributaries flowing through the TGD. This discussion begins with the observation that river ecosystems worldwide—and particularly in China—are under extraordinary and unprecedented stress resulting from both anthropogenic activity and topographical feature variation (Lanzanova et al., 2019; Weldegebriel et al., 2021). Excessive human demands for water supplies threaten the health of river basin regions everywhere (Schwabe et al., 2020; Muhammad et al., 2022). Therefore, the conservation of river riparian zones to sustain their resources is a growing concept in river management (Jones et al., 2019; He et al., 2020). As human well-being and ecosystem resources have shown significant positive associations since 2005, according to the Millennium Ecosystem Assessment (Guo et al., 2021). Moreover, topography has a direct influence on the quantity and nature of ecosystem services provided by rivers, as previously noted (Hanasaki et al., 2018; Hecht et al., 2019). A significant research trend relating to topographical impacts on ecosystem resources along the drawdown zone has considerable implications for river ecosystem management.
3.1 Changing topographical features and ecological indicators
The variations in EIs indices and sub-indices are illustrated by a bar graph of 95% confidence intervals for the upstream, midstream, and downstream sections (Figure 4). For each parameter index and sub-index, Kruskal-Wallis tests were performed (at p < 0.01** and p < 0.05*) to determine the magnitude of statistical differences. There were frequent statistical differences in the indexing of these parameters at p < 0.01** in all three segments. Such differences are well noted for their intrinsic differences in topography, soil type, flora, and environmental quality, as reported by others (Sang et al., 2019; Hira et al., 2022). Regeneration (in the upstream segment), erosion, condition, and stress (in the downstream segment) all showed significance at p < 0.05*. However, it was insignificant for plant cover, condition, and stress in the upstream region only since pressure nature varies by place (Dai et al., 2017; Biswas et al., 2019; Bombino et al., 2019). The plant cover was highest in the midstream segment with 23.71 ± 5.10% and lowest in the upstream segment with 20.98 ± 7.27% as it depends on the unique adaptation characteristics of the plant cover to the available environment (Gurnell, 2014; Yi et al., 2020). The plant cover varies considerably from other areas where the riparian zone is dominated by shrubs and trees (Biswas et al., 2019). Regeneration followed the same patterns, with 11.86 ± 2.18% and 10.47 ± 3.11% depending on the species (Zhu et al., 2020; Bai et al., 2021; Zhang and Xie, 2021). The exotics appeared differently, with the highest of 17.37 ± 2.79% for the upstream segment and the lowest of 15.85 ± 2.46% in the midstream segment as exotics respond to shifts in aquatic ecosystems (Manolaki et al., 2020). The response sequence of erosion, habitat, and condition was consistent with plant cover indicating site-specific adjustments (Gurnell, 2014), and it was determined to be 17.33 ± 3.88% and 12.46 ± 5.31%, 18.66 ± 2.38 and 16.44 ± 3.93, and 87.25 ± 8.66 and 77.60 ± 13.73%, respectively. Stress was reflected differently, and it exhibited the uppermost in the upstream segment (36.98 ± 17.22%) and the lowermost in the downstream segment (27.33 ± 13.47%) considering less inundation effects (Yi et al., 2020). Typically, river landscapes respond to stressors in different ways (Li et al., 2023b). Previous research has also shown that the developmental initiative such as TGD significantly impacts riparian zone diversity (He et al., 2018). Topographic features influence ecosystem shape, biodiversity, and EIs. Natural and human-induced topography changes profoundly affect the environment (Rauf et al., 2023). Changing physical structures, changes in elevation or slope, or changes in soil composition may impact water flow patterns, soil composition, and the microclimate. This affects plant and animal abundance and distribution. EIs are essential tools for evaluating topographic changes. Scientists and environmental managers can understand ecosystem dynamics by monitoring these indicators (Cao et al., 2023).
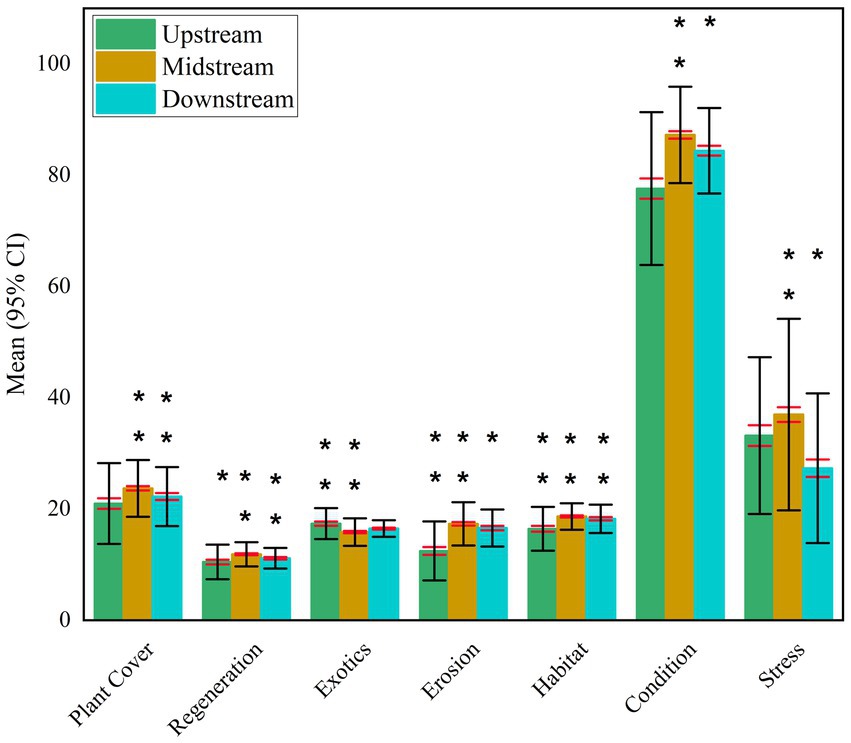
Figure 4. Plot of riparian health and stress indicators (indices and sub-indices) measured in transects along the drawdown zone within the Yangtze River and other linked tributaries in China. The y-axis denotes the mean score (%) with a 95% confidence interval. The vertical black bars and red bars show the variability in standard deviation and standard error among each respective index transects. Note: each index or sub-index bar indicates significant differences at p < 0.01 (**) or p < 0.05 (*) according to the Kruskal–Wallis test.
3.2 Selection of key ecological indicators for the assessment of riparian health and stressors
Conservation of riparian zones aims to eliminate or control the factors that degrade the river ecosystem and provide long-term benefits for future generations (Santos et al., 2021; Terencio et al., 2021). In this context, the decisive EIs were arranged in the following manner based on principal component analysis (PCA): riparian health (a) and stressors (b), as shown in Figure 5. The interpretation of essential aspects focuses on defining the factors most intricately linked to each function (Arif et al., 2022). Naturally, the range of criteria we deem low or high is a personal preference. The Kaiser–Meyer–Olkin sample adequacy analysis verified our findings (0.826–ai and 0.727–bi). Bartlett’s sphericity tests were the second verification, with 0.000 for both (ai and bi). In terms of the overall variance, the significant components of riparian health (aii) and stressors (bii) accounted for approximately 69.13 and 83.08%, respectively. Following desirable protocols, two more tests (Monte Carlo PCA for parallel analysis and screening plot) found that the results were adequate and credible. The first rotating component in ai was closely linked to seven parameters (H1, H2, R5, Er5, and PC3, PC7, PC8). In bi, it assembled four parameters (P1, P2, P4, and P11). This first component demonstrates that these parameters converge together with positive correlations. The second rotating component gathered only exotic parameters (Ex2, Ex4, Ex5, and Ex6) in ai. These were associated positively with each other. Unexpectedly, only one parameter (P6) was present in bi. The pattern of parameters for the components was inconsistent in the PCA. EIs may have a different impact on different types of communities and rivers (Ferreira et al., 2005; Perry et al., 2012). Thus, component three of ai contains three parameters (Er1, Er2, and Er3), while component three of bi contains two parameters (P9 and P10), in which only P10 was negatively correlated. The ai and bi contain four (PC1, PC4, PC6, and R1) parameters and one (P5) parameter for the fourth component. Moreover, components five and six have two parameters (PC5, R4, and PC2, R2) only in ai, which were positively connected. It is evident from these results that EIs respond differently depending on their location within the riparian zone (Wohl, 2017; Rodrigues et al., 2018; Zema et al., 2018). Providing an interface between terrestrial and aquatic ecosystems, riparian zones influence watershed health (Zheng et al., 2023). EIs for riparian assessments should consider the unique characteristics of these transitional areas. Plant cover or indicator species might be key indicators (Hira et al., 2023). It is imperative to understand stressors in riverine ecosystems holistically. Human activities, such as agriculture, urbanization, and industrial runoff, can also contribute to stress. Monitoring invasive species abundance, sedimentation rates, and nutrient levels can help identify and quantify these stressors. Developing comprehensive indicators can enhance conservation and restoration strategies’ effectiveness.
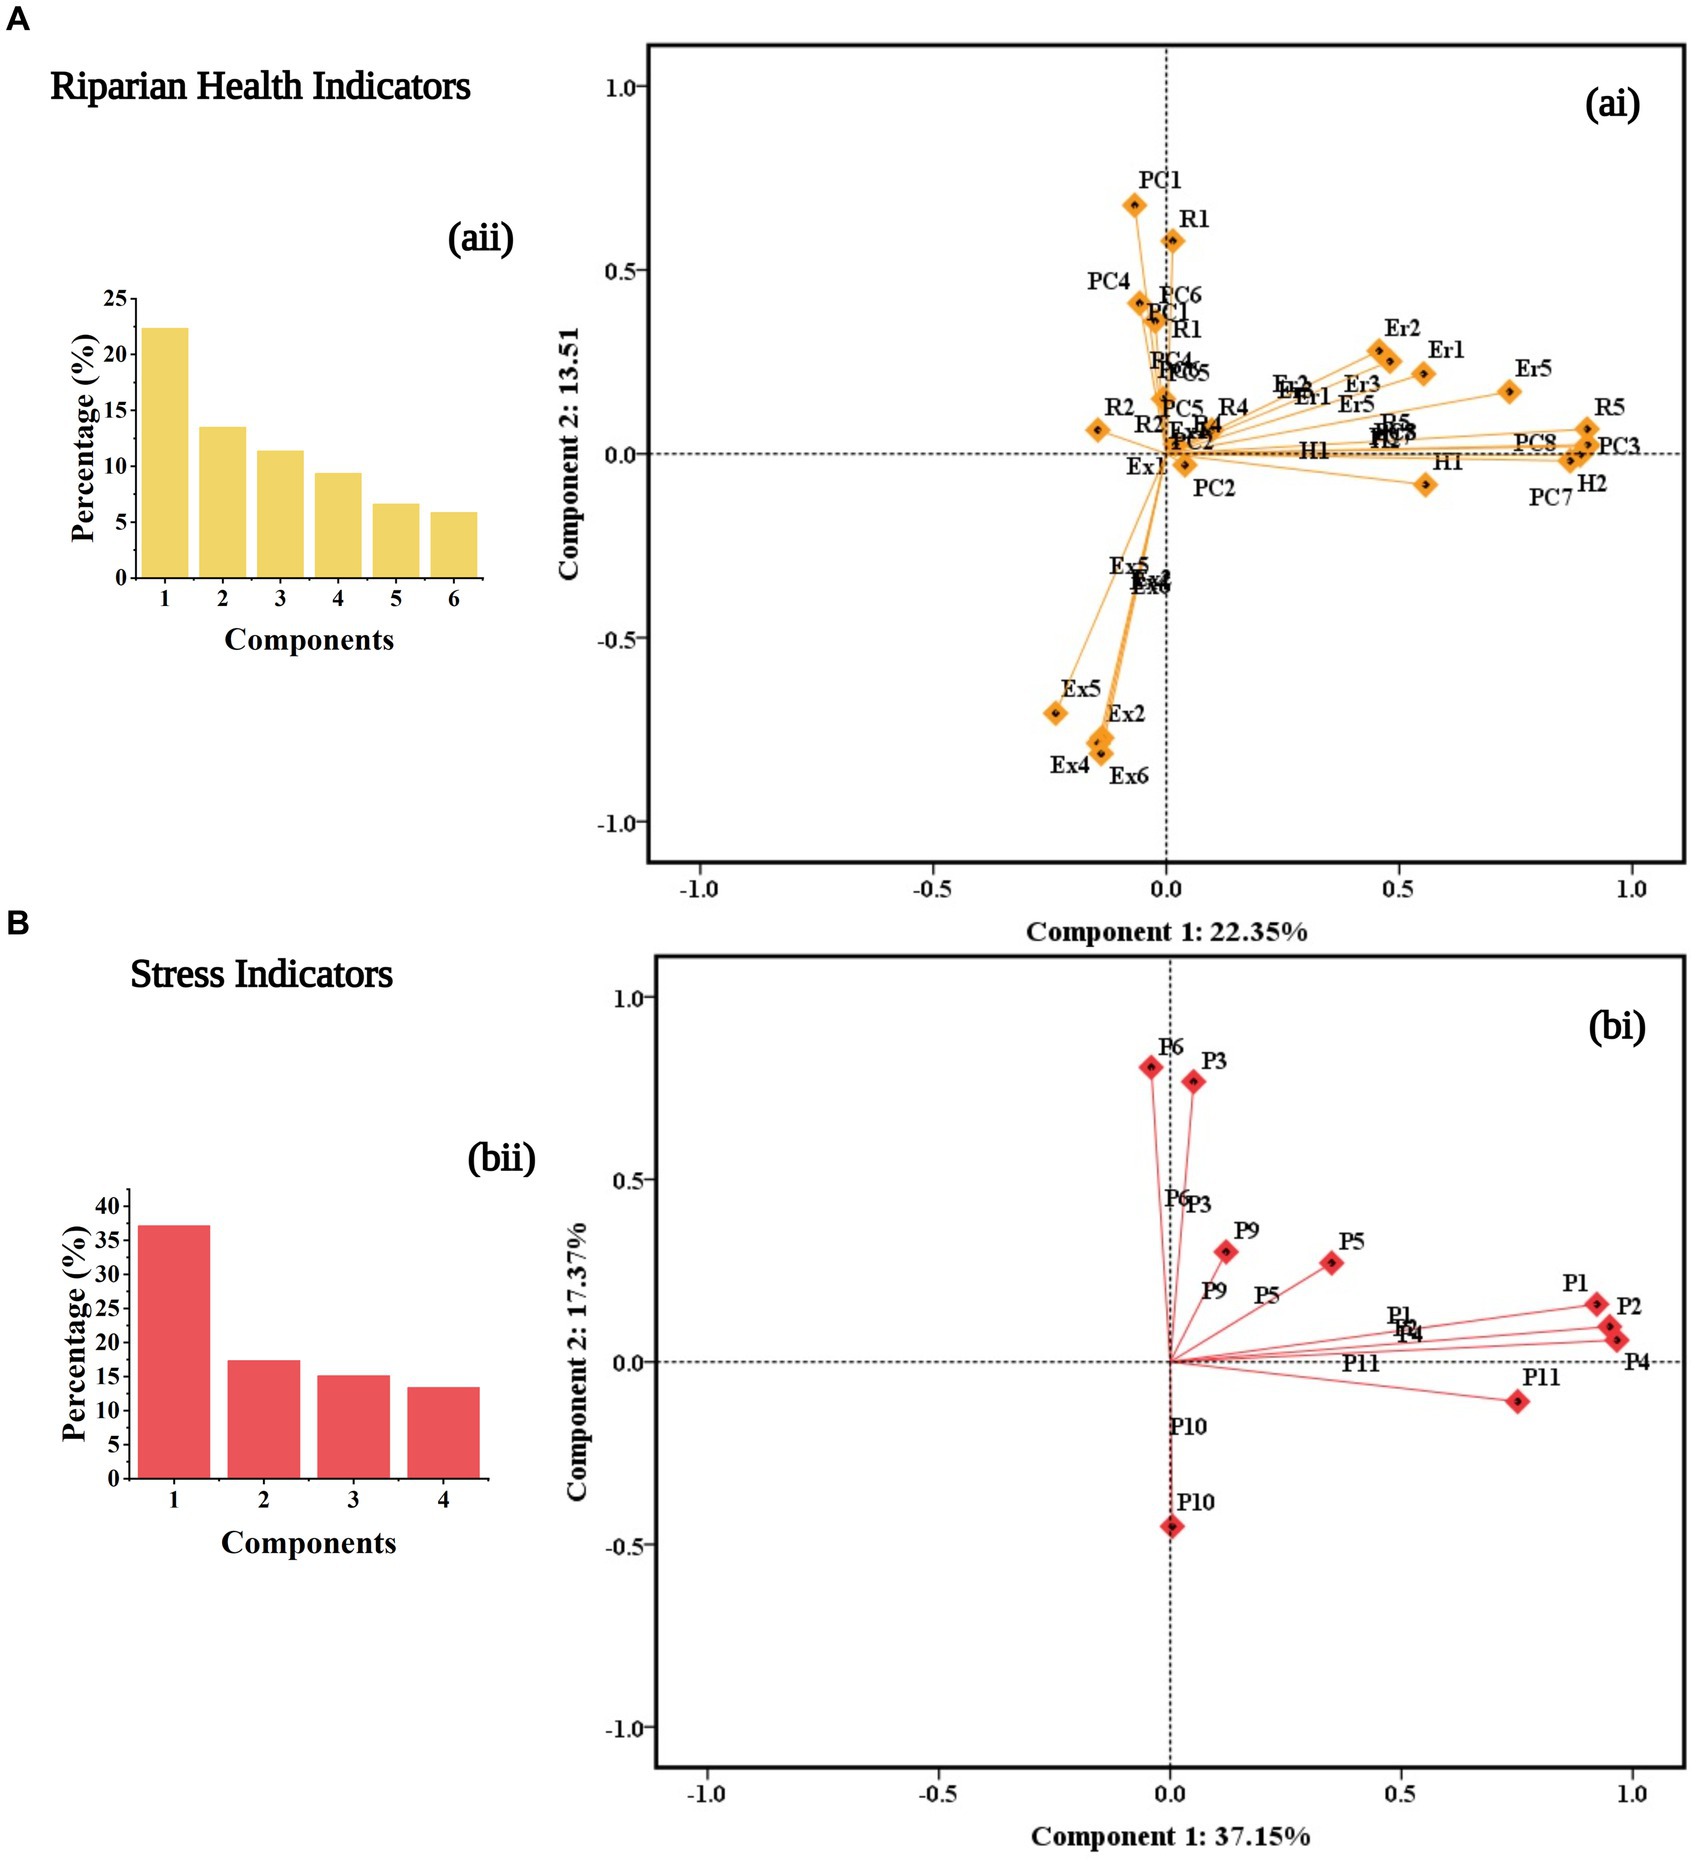
Figure 5. Principal component analysis (PCA) plots (A,B) of riparian health indicators (ai) and stress indicators (bi) for the riparian buffer of the drawdown zone within the Yangtze River and other linked tributaries in China. The PCA factor loadings of the riparian health (aii) and stress (bii) indicator significant components explain 69.13 and 83.08% of the total variation, respectively. See more details of abbreviations in Figure 3.
3.3 Relationships between changing topographical features and ecological indicators
We made use of Pearson correlation at p < 0.01** and p < 0.05* to establish the linear relationships of changing stream-channel width, riparian width, and elevation with EIs for the upstream (a), midstream (b), and downstream (c) segments (Figure 6). Both positive and negative correlation coefficients were present, with the correlation coefficients varying from low to high. Midstream EIs have been least affected by changing stream channel width, and downstream EIs have been most affected by it as EIs submerged more downstream. Changing stream-channel width had the greatest impact on the exotic parameters (−0.36** < r < 0.401**) as exotics respond distinctly (Manolaki et al., 2020; Hu et al., 2022), and the effect differed from that seen with the other groupings. These impacts can vary with river size and location, but they must be categorically simplified for applied ease and protection. Other researchers have discovered related results in different stream networks (Eriyagama et al., 2020; Janssen et al., 2021).
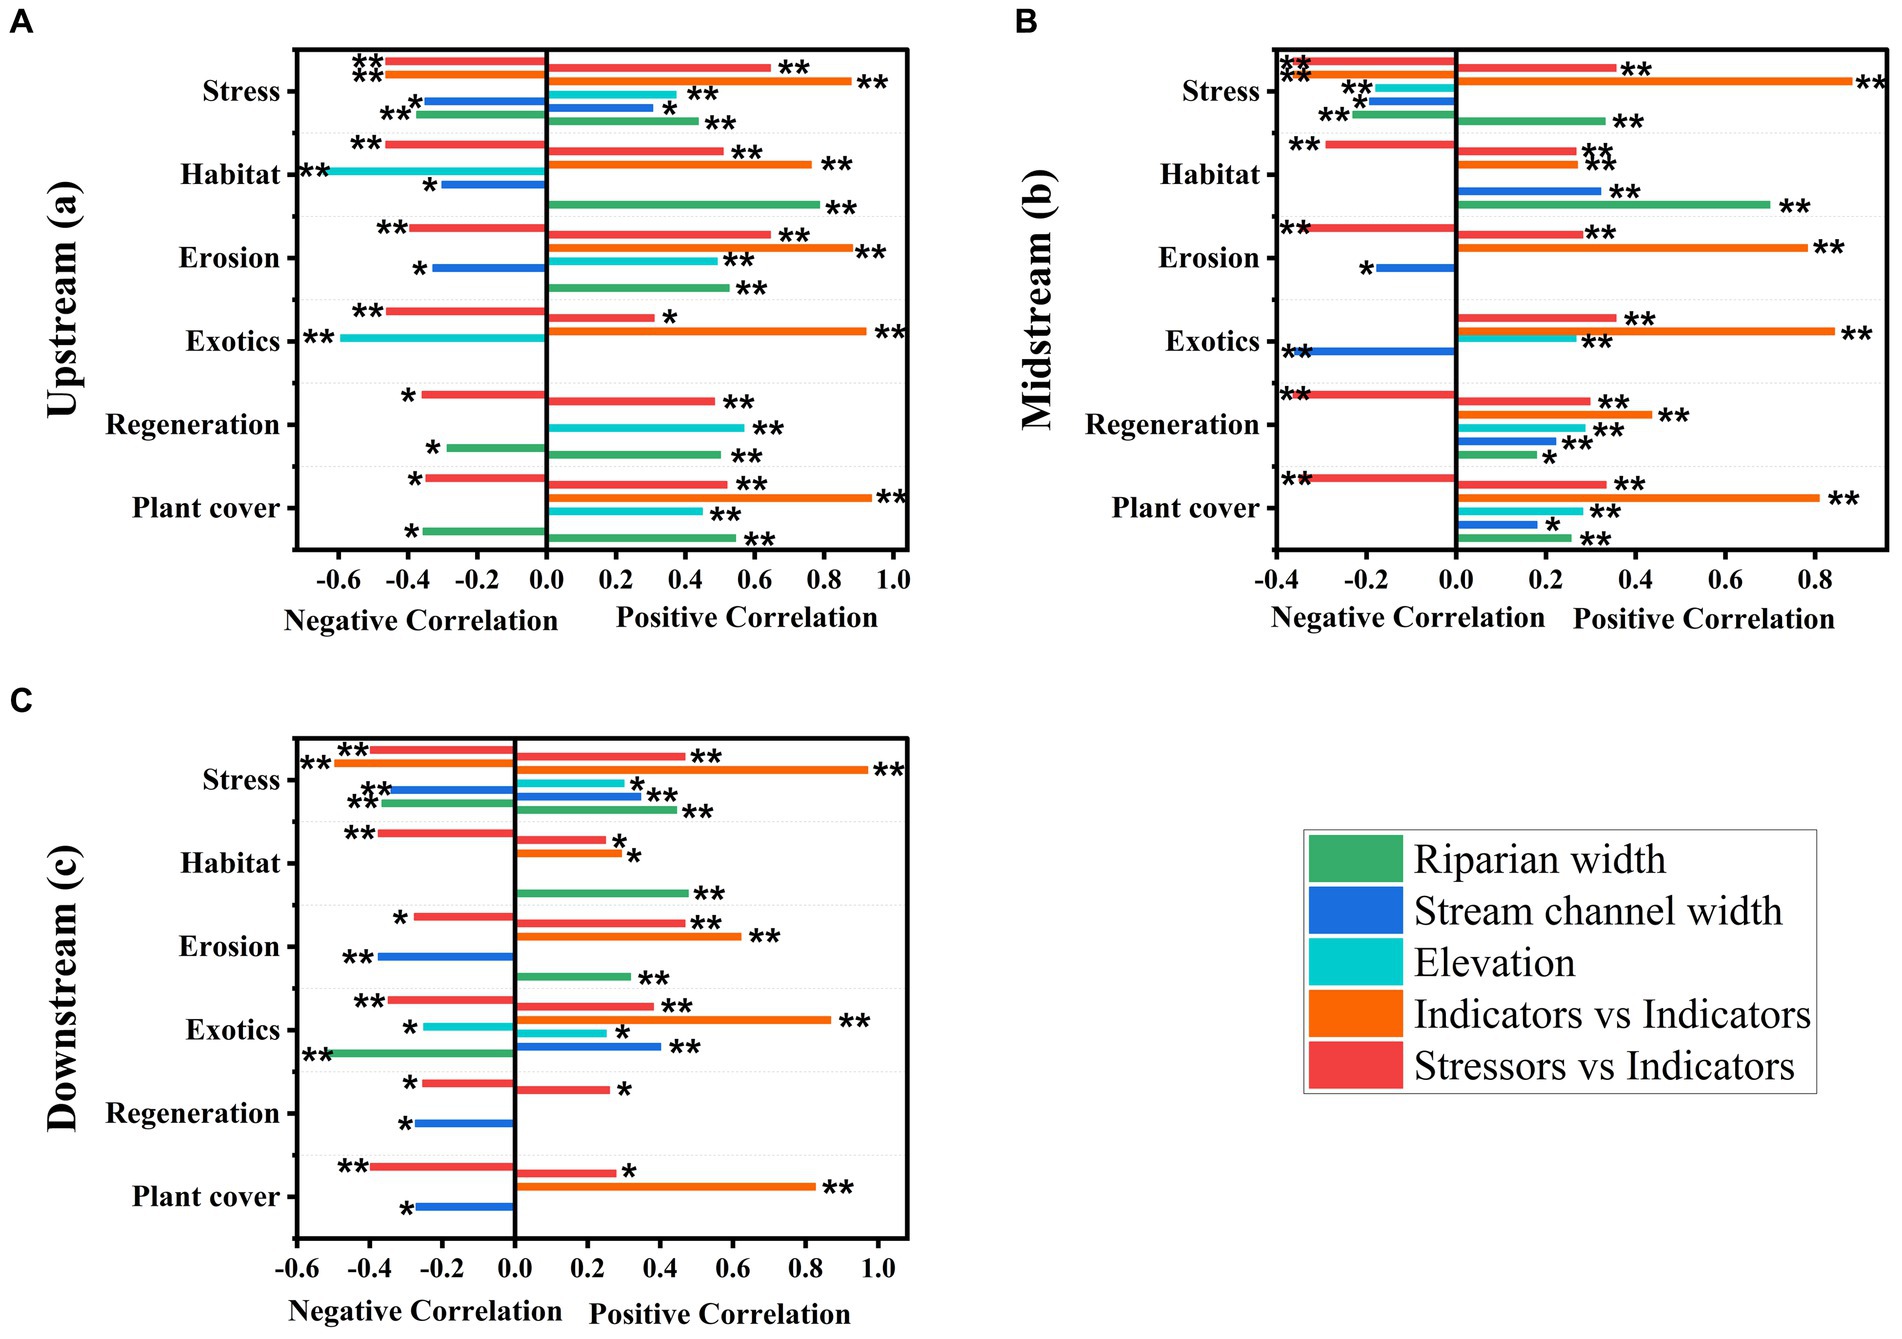
Figure 6. Bar charts of Pearson’s correlation (r) for changing topographical features and ecological indicators for the upstream (A), midstream (B), and downstream (C) segments within the Yangtze River and other linked tributaries in China. The Pearson coefficient maximum limit among all indicators from the conferring combination is positive and negative in the right and left sections (origin line at 0). Only significant values are shown. **Correlation is significant at the 0.01 level (two-tailed); *Correlation is significant at the 0.05 level (two-tailed).
In relative terms, changes in riparian width have the greatest impact on upstream EIs, and the smallest impact on downstream EIs. The greatest impact was found for habitat (0.477** < r < 0.787**), and this impact was inconsistent with the impacts discovered for other categories. Throughout the drawdown zone, regeneration has negligible impacts from changing riparian width as grass cover regeneration exits in most of the areas in the TGD (Zhu et al., 2020; Bai et al., 2021; Zhang and Xie, 2021). Considering these, the government should fix the widths of river buffers under management programs to facilitate the growth and protection of these ecosystems (Suwal et al., 2020). It has been widely recognized in the United States that riparian zones are valuable. As a result, 25 different types of riparian zones have been protected by state directives in Oregon (Luke et al., 2019; Kuglerova et al., 2020; Stutter et al., 2021). The widths of their buffers vary from 0 to 152 m there (Boisjolie et al., 2017), based on the streams and location. The same implications are required for the protection of riparian zones in China.
Environmental features and EIs that differ widely across elevation gradients may explain such variability (Tito et al., 2018; Fernandes et al., 2021). Upstream EIs are influenced the most by elevation, whereas the minimum is found downstream. The elevation impact was negatively greater on habitat (−0.645**) and exotics (−0.594**) and positive on regeneration (0.569**). These results are supported by previous studies (He et al., 2018; Huang et al., 2019), which discovered a reduction in EIs with elevation in other watersheds in China. Riparian health parameter relationships were more significant in the upstream segment, and their coefficient values were measured for the plant over (0.937**), exotics (0.921**), habitat (0.763**), erosion (0.882**), and stressors (−0.464** < r < 0.878**). The strength of the relationships of these parameters was least in the midstream, with their values for the plant over (0.809**), exotics (0.843**), regeneration (0.436**), habitat (0.27**), erosion (0.783**), and stressors (−0.363** < r < 0.882**). The impact patterns of stressors followed the same and exerted a leading damaging effect on riparian health parameters (Hooke and Mant, 2000; Bombino et al., 2019) in the upstream segment. The coefficient values were generally large for plant cover (0.52**), exotics (−0.462** < r < 0.31**), regeneration (0.484**), habitat (−0.464** < r < 0.509**), erosion (−0.395** < r < 0.645**), and stressors (−0.496** < r < 0.971**). Few other findings (Chen et al., 2016; Grabas et al., 2019) have examined how they react to significant changes in topographical features in a vastly controlled environment.
EIs and topographical changes are often interconnected. Changes in topography, such as dams, and changes in land use can affect water flow patterns and sedimentation rates (Li et al., 2023b). This influences aquatic and riparian ecosystems. Landscape dynamics can be affected by changes in vegetation patterns and microbial communities over time. Ecosystem changes can be predicted by understanding these relationships (Zheng et al., 2023). The research must be interdisciplinary and include geospatial, hydrological, ecological, and other disciplines. Scientists will be able to formulate more effective land management strategies based on these relationships. This will result in more accurate predictions of ecological responses to changing landscapes.
3.4 Comparison of ecological indicators (indices and subindices) along The drawdown zone
We used cluster analysis to determine whether the suggested parameters had a similar association between each pair of indexes or sub-indexes (Figure 7). In this sense, the clustering procedure must be interpreted as a similar mechanism through which the previous approaches were tested and substantiated, rather than a separate analytical methodology. The drawdown region was subjected to a more in-depth review of information divergences. The three graphs depict the order in which the criteria included in this analysis were assessed. Cluster analysis, on either hand, can provide a more thorough examination of the similarities and differences between the upstream, midstream, and downstream segments. Clustering was carried out to establish specified groups of similar characteristics (Wang, 2013). Furthermore, hierarchical methods can result in groups that are interpretable and homogeneous (Muhammad et al., 2022). The gap between each cluster is shown on the horizontal axis; five classes are defined for upstream (a), midstream (b), and downstream (c) segments. The plant cover and condition responses were persistent in the drawdown zone, and they were grouped in Cluster 1. The differences are evident in Cluster 2, and habitat convened for downstream instead of regeneration, as in the upstream and midstream segments. Cluster 3 comprises erosion, habitat, and regeneration for the upstream, midstream, and downstream segments. Exotics and stress converged together in Cluster 4 in the midstream segment, whereas erosion and stress were for the downstream segment. As a result, Cluster 5 has an entirely different grouping in a, b, and c. It has previously been shown that EIs change differently under dissimilar environmental conditions (Van Cappellen and Maavara, 2016; Bombino et al., 2019). Drawdown zones are ecological contexts where water levels fluctuate, usually associated with altered water bodies (Chen et al., 2022). Comparing EIs along the drawdown zone involves considering factors such as vegetation dynamics, sedimentation patterns, and aquatic biodiversity (Li et al., 2023b). Comparing multiple EIs using these metrics can lead to a deeper understanding of ecosystem health. These indicators can guide conservation efforts and adaptive management strategies in vulnerable and resilient areas.
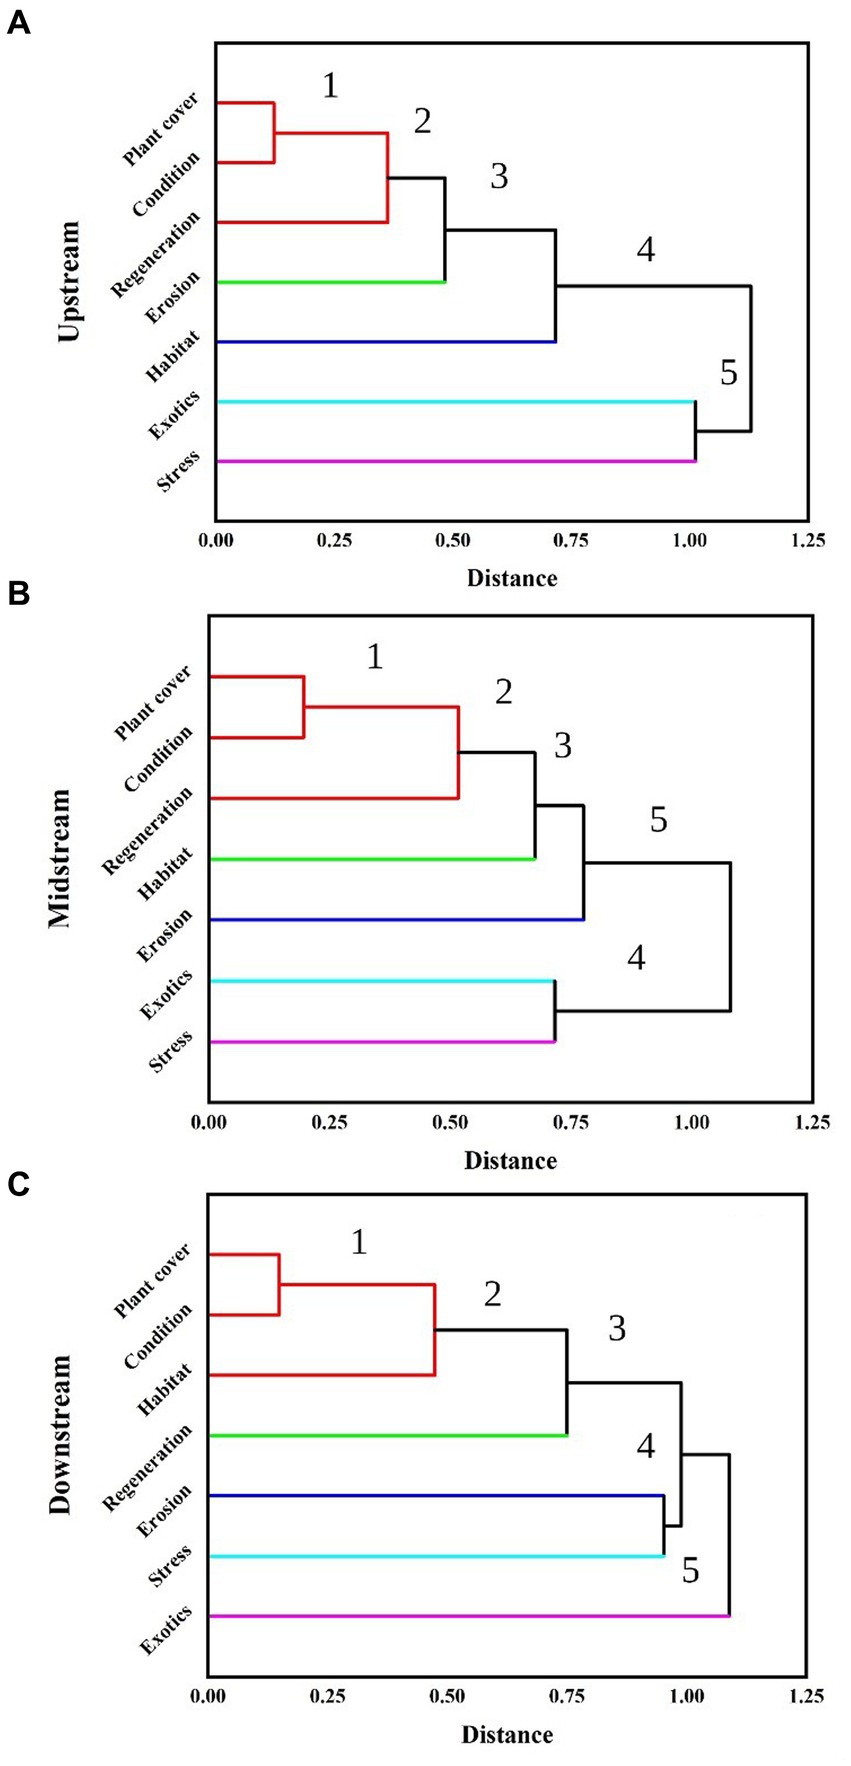
Figure 7. Dendrograms produced by agglomerative hierarchical clustering under the influence of changing topographical features and ecological indicators (indices and subindices) along the drawdown zone (A-C) within the Yangtze River and other linked tributaries in China.
It is generally recognized that maintaining normal and safe flows without deteriorating EIs is one of the most challenging aspects of river conservation planning (Poff et al., 2011; Hanasaki et al., 2018). River resource conservation commitments have changed from simply restoration and reducing pollution to environmentally friendly and sustainable watershed management over the last 30 years (Dai et al., 2017). According to the United States Best Management Strategies, wetlands may be effective instruments for the enhancement of ecosystem services (Calicioglu and Bogdanski, 2021), since many constructed, restored, or created wetlands can provide several ecosystem/landscape services (Räpple et al., 2017; García de Jalón et al., 2020). This system has been seen to have both economic and environmental advantages (Feld et al., 2018). Evaluating river flow responses at different levels will help assess research priorities for sustainable river services (Mulligan et al., 2020) along the drawdown zone. EIs behave differently under different scenarios within the same river system. Comprehensive river systems such as TGD can be assessed based on river categories, land uses along the riparian zone, and drawdown zones. Often, researchers conduct research based on one scenario that lacks the detailed information required to produce comprehensive policy recommendations. The present study contributes to the literature by examining the drawdown zone for better protection and conservation of riparian zones in China.
4 Conclusion
Our findings support the conjecture that stream-channel width, riparian width, and elevation features are also the most critical factors that influence ecological indicators, regardless of spatial size. Downstream segments were most affected by stream-channel width, while midstream segments were least affected. The exotic parameters were the most influenced by this, and the development differed from that of the other indices. In comparison, riparian width has the greatest impact on upstream segments and the least on downstream segments. The most important factors were exposed from habitat index and impact, which were inconsistent with other categories. Upstream ecological parameters were most affected by elevation, whereas downstream ecological parameters were the least affected. It had negative impacts on habitat and exotic parameters and had a positive effect on regeneration. Dendrograms confirmed the changes in ecological indicators indexing along the drawdown zone within the Yangtze River and other linked tributaries in China. Establishing riparian buffer strips that fix multiple stressors evolving on topographical features at the same time is one option. Integration of environmental policies is required around the globe to balance these synergies and services. Coordination among different conservation policies may allow for healthy river resources, more strategies for biological conservation, and a decrease in negative impacts on the provision of ecosystem services. Policy formulation should be based on promoting extensive river ecosystem sustainability while also considering ecosystem services. Furthermore, these policies need to incorporate factors associated with drawdown zones within the same river network. Moreover, additional measures must be taken to prevent further topographical destruction.
Data availability statement
The original contributions presented in the study are included in the article/Supplementary material, further inquiries can be directed to the corresponding author.
Author contributions
MA: Conceptualization, Data curation, Formal analysis, Funding acquisition, Investigation, Methodology, Project administration, Resources, Software, Supervision, Validation, Visualization, Writing – original draft, Writing – review & editing. IP: Formal analysis, Software, Writing – review & editing, Validation. LC: Funding acquisition, Investigation, Methodology, Project administration, Resources, Supervision, Writing – review & editing.
Funding
The author(s) declare financial support was received for the research, authorship, and/or publication of this article. This work was supported by the Foreign Young Talent Program (Program number: QN2022168001L); Chongqing Housing and Urban–rural Construction Committee (Program number: Chengkezi-2022-6-3); Chongqing Municipality Key Forestry Research Project (2021–9); Forestry Extension Project of China Central Finance (No. Yulinketui 2023–8).
Acknowledgments
Special thanks are extended to the representatives of the Three Gorges Reservoir management unit, Chongqing immigration management office, and local townships and communities for their assistance during the entire research process.
Conflict of interest
The authors declare that the research was conducted in the absence of any commercial or financial relationships that could be construed as a potential conflict of interest.
Publisher’s note
All claims expressed in this article are solely those of the authors and do not necessarily represent those of their affiliated organizations, or those of the publisher, the editors and the reviewers. Any product that may be evaluated in this article, or claim that may be made by its manufacturer, is not guaranteed or endorsed by the publisher.
Supplementary material
The Supplementary material for this article can be found online at: https://www.frontiersin.org/articles/10.3389/ffgc.2024.1293330/full#supplementary-material
References
Arif, M., Jiajia, L., Dongdong, D., Xinrui, H., Qianwen, G., Fan, Y., et al. (2022). Effect of topographical features on hydrologically connected riparian landscapes across different land-use patterns in colossal dams and reservoirs. Sci. Total Environ. 851:158131. doi: 10.1016/j.scitotenv.2022.158131
Arif, M., Jie, Z., Behzad, H. M., and Changxiao, L. (2023). Assessing the impacts of ecotourism activities on riparian health indicators along the three gorges reservoir in China. Ecol. Indic. 155:111065. doi: 10.1016/j.ecolind.2023.111065
Bai, X., Xu, Q., Li, H., Cheng, C., and He, Q. (2021). Lack of methane hotspot in the upstream dam: case study in a tributary of the three gorges reservoir, China. Sci. Total Environ. 754:142151. doi: 10.1016/j.scitotenv.2020.142151
Belete, M., Deng, J., Abubakar, G. A., Teshome, M., Wang, K., Woldetsadik, M., et al. (2020). Partitioning the impacts of land use/land cover change and climate variability on water supply over the source region of the Blue Nile Basin. Land Degrad. Dev. 31, 2168–2184. doi: 10.1002/ldr.3589
Biswas, S. R., Mallik, A. U., Braithwaite, N. T., and Biswas, P. L. (2019). Effects of disturbance type and microhabitat on species and functional diversity relationship in stream-bank plant communities. For. Ecol. Manag. 432, 812–822. doi: 10.1016/j.foreco.2018.10.021
Boisjolie, B. A., Santelmann, M. V., Flitcroft, R. L., and Duncan, S. L. (2017). Legal ecotones: a comparative analysis of riparian policy protection in the Oregon coast range, USA. J. Environ. Manag. 197, 206–220. doi: 10.1016/j.jenvman.2017.03.075
Bombino, G., Zema, D. A., Denisi, P., Lucas-Borja, M. E., Labate, A., and Zimbone, S. M. (2019). Assessment of riparian vegetation characteristics in Mediterranean headwaters regulated by check dams using multivariate statistical techniques. Sci. Total Environ. 657, 597–607. doi: 10.1016/j.scitotenv.2018.12.045
Calicioglu, O., and Bogdanski, A. (2021). Linking the bioeconomy to the 2030 sustainable development agenda: can SDG indicators be used to monitor progress towards a sustainable bioeconomy? New Biotechnol. 61, 40–49. doi: 10.1016/j.nbt.2020.10.010
Cao, W. Q., Muhammad, A., Cui, Z., and Li, C. X. (2023). Effects of different trace elements on ecophysiological characteristics of Ligustrum obtusifolium saplings. Forests 14:972. doi: 10.3390/f14050972
Chen, J., Shi, H. Y., Sivakumar, B., and Peart, M. R. (2016). Population, water, food, energy and dams. Renew. Sust. Energ. 56, 18–28. doi: 10.1016/j.rser.2015.11.043
Chen, Z., Song, H., Arif, M., and Li, C. (2022). Effects of hydrological regime on Taxodium ascendens plant decomposition and nutrient dynamics in the three gorges reservoir riparian zone. Front. Environ. Sci. 10:990485. doi: 10.3389/fenvs.2022.990485
Dai, X., Zhou, Y., Ma, W., and Zhou, L. (2017). Influence of spatial variation in land-use patterns and topography on water quality of the rivers inflowing to Fuxian Lake, a large deep lake in the plateau of southwestern China. Ecol. Eng. 99, 417–428. doi: 10.1016/j.ecoleng.2016.11.011
Dempsey, J. A., Plantinga, A. J., Kline, J. D., Lawler, J. J., Martinuzzi, S., Radeloff, V. C., et al. (2017). Effects of local land-use planning on development and disturbance in riparian areas. Land Use Policy 60, 16–25. doi: 10.1016/j.landusepol.2016.10.011
Eriyagama, N., Smakhtin, V., and Udamulla, L. (2020). How much artificial surface storage is acceptable in a river basin and where should it be located: a review. Earth-Sci. Rev. 208:103294. doi: 10.1016/j.earscirev.2020.103294
Feld, C. K., Fernandes, M. R., Ferreira, M. T., Hering, D., Ormerod, S. J., Venohr, M., et al. (2018). Evaluating riparian solutions to multiple stressor problems in river ecosystems - a conceptual study. Water Res. 139, 381–394. doi: 10.1016/j.watres.2018.04.014
Fernandes, A. C. P., Martins, L. M. D., Pacheco, F. A. L., and Fernandes, L. F. S. (2021). The consequences for stream water quality of long-term changes in landscape patterns: implications for land use management and policies. Land Use Policy 109:105679. doi: 10.1016/j.landusepol.2021.105679
Fernandes, M. R., Segurado, P., Jauch, E., and Ferreira, M. T. (2016). Riparian responses to extreme climate and land-use change scenarios. Sci. Total Environ. 569-570, 145–158. doi: 10.1016/j.scitotenv.2016.06.099
Ferreira, M., Aguiar, F., and Nogueira, C. (2005). Changes in riparian woods over space and time: influence of environment and land use. For. Ecol. Manag. 212, 145–159. doi: 10.1016/j.foreco.2005.03.010
García de Jalón, D., Martínez-Fernández, V., Fazelpoor, K., and González del Tánago, M. (2020). Vegetation encroachment ratios in regulated and non-regulated Mediterranean rivers (Spain): an exploratory overview. J. Hydro-Environ. Res. 30, 35–44. doi: 10.1016/j.jher.2019.11.006
Grabas, G. P., Fiorino, G. E., and Reinert, A. (2019). Vegetation species richness is associated with daily water-level fluctuations in Lake Ontario coastal wetlands. J. Gt. Lakes Res. 45, 805–810. doi: 10.1016/j.jglr.2019.05.008
Guo, Z. F., Boeing, W. J., Borgomeo, E., Xu, Y. Y., and Weng, Y. (2021). Linking reservoir ecosystems research to the sustainable development goals. Sci. Total Environ. 781:146769. doi: 10.1016/j.scitotenv.2021.146769
Gurnell, A. (2014). Plants as river system engineers. Earth Surf. Proc. Land. 39, 4–25. doi: 10.1002/esp.3397
Hanasaki, N., Yoshikawa, S., Pokhrel, Y., and Kanae, S. (2018). A global hydrological simulation to specify the sources of water used by humans. Hydrol. Earth Syst. Sci. 22, 789–817. doi: 10.5194/hess-22-789-2018
He, X., Wang, M., Tang, Q., Bao, Y., Li, J., and Khurram, D. (2020). Decadal loss of paddy fields driven by cumulative human activities in the three gorges reservoir area, China. Land Degrad. Dev. 31, 1990–2002. doi: 10.1002/ldr.3574
He, S., Yin, X. A., Yu, C. X., Xu, Z. H., and Yang, Z. F. (2018). Quantifying parameter uncertainty in reservoir operation associated with environmental flow management. J. Clean. Prod. 176, 1271–1282. doi: 10.1016/j.jclepro.2017.11.246
Hecht, J. S., Lacombe, G., Arias, M. E., Dang, T. D., and Piman, T. (2019). Hydropower dams of the Mekong River basin: a review of their hydrological impacts. J. Hydrol. 568, 285–300. doi: 10.1016/j.jhydrol.2018.10.045
Higgins, J.J., (2004). An introduction to modern nonparametric statistics, Pacific Grove, California.
Hira, A., Arif, M., Nowsherwan, Z., Gul, Z., Xiangyue, L., and Yukun, C. (2023). Effects of riparian buffer and stream channel widths on ecological indicators in the upper and lower Indus River basins in Pakistan. Front. Environ. Sci. 11. doi: 10.3389/fenvs.2023.1113482
Hira, A., Muhammad, A., Zarif, N., Gul, Z., Liu, X., and Cao, Y. (2022). Impacts of stressors on riparian health indicators in the upper and lower Indus River basins in Pakistan. Int. J. Environ. Res. Public Health 19:13239. doi: 10.3390/ijerph192013239
Hooke, J. M., and Mant, J. M. (2000). Geomorphological impacts of a flood event on ephemeral channels in SE Spain. Geomorphology 34, 163–180. doi: 10.1016/S0169-555X(00)00005-2
Hu, X., Arif, M., Ding, D. D., Li, J. J., He, X. R., Li, C. X., et al. (2022). Invasive plants and species richness impact litter decomposition in riparian zones. Front. Plant Sci. 13, 1–14. doi: 10.3389/fpls.2022.955656
Huang, J. C., Zhang, Y. J., Arhonditsis, G. B., Gao, J. F., Chen, Q. W., Wu, N. C., et al. (2019). How successful are the restoration efforts of China's lakes and reservoirs? Environ. Int. 123, 96–103. doi: 10.1016/j.envint.2018.11.048
Janssen, A. B. G., Hilt, S., Kosten, S., de Klein, J. J. M., Paerl, H. W., and Van de Waal, D. B. (2021). Shifting states, shifting services: linking regime shifts to changes in ecosystem services of shallow lakes. Freshw. Biol. 66, 1–12. doi: 10.1111/fwb.13582
Jones, S. K., Boundaog, M., DeClerck, F. A., Estrada-Carmona, N., Mirumachi, N., and Mulligan, M. (2019). Insights into the importance of ecosystem services to human well-being in reservoir landscapes. Ecosyst. Serv. 39:100987. doi: 10.1016/j.ecoser.2019.100987
Kuglerova, L., Jyvasjarvi, J., Ruffing, C., Muotka, T., Jonsson, A., Andersson, E., et al. (2020). Cutting edge: a comparison of contemporary practices of riparian buffer retention around small streams in Canada, Finland, and Sweden. Water Resour. Res. 56:e2019WR026381. doi: 10.1029/2019wr026381
Kujanova, K., Matouskova, M., and Hosek, Z. (2018). The relationship between river types and land cover in riparian zones. Limnologica 71, 29–43. doi: 10.1016/j.limno.2018.05.002
Lanzanova, D., Whitney, C., Shepherd, K., and Luedeling, E. (2019). Improving development efficiency through decision analysis: reservoir protection in Burkina Faso. Environ. Model. Softw. 115, 164–175. doi: 10.1016/j.envsoft.2019.01.016
Li, J. J., Li, L. J., Arif, M., Ding, D. D., Hu, X., and Li, C. X. (2023b). Newly formed riparian microhabitats simplify bacterial community structure and diversity. J. Soils Sediments 23, 1927–1943. doi: 10.1007/s11368-023-03454-6
Li, J. J., Muhammad, A., Ding, D. D., Hu, X., Gen, Q., Yin, F., et al. (2023a). The diversity of plant communities in different habitats can lead to distinct methanotrophic communities. Rhizosphere 26:100690. doi: 10.1016/j.rhisph.2023.100690
Luke, S. H., Slade, E. M., Gray, C. L., Annammala, K. V., Drewer, J., Williamson, J., et al. (2019). Riparian buffers in tropical agriculture: scientific support, effectiveness and directions for policy. J. Appl. Ecol. 56, 85–92. doi: 10.1111/1365-2664.13280
Manolaki, P., Guo, K., Vieira, C., Papastergiadou, E., and Riis, T. (2020). Hydromorphology as a controlling factor of macrophytes assemblage structure and functional traits in the semi-arid European Mediterranean streams. Sci. Total Environ. 703:134658. doi: 10.1016/j.scitotenv.2019.134658
Martins, M. S. D., Valera, C. A., Zanata, M., Santos, R. M. B., Abdala, V. L., Pacheco, F. A. L., et al. (2021). Potential impacts of land use changes on water resources in a tropical headwater catchment. Water 13:3249. doi: 10.3390/w13223249
Muhammad, A., Behzad, H. M., Tahir, M., and Li, C. (2022). The impact of ecotourism on ecosystem functioning along main rivers and tributaries: implications for management and policy changes. J. Environ. Manag. 320:115849. doi: 10.1016/j.jenvman.2022.115849
Mulligan, M., van Soesbergen, A., and Saenz, L. (2020). GOOD, a global dataset of more than 38,000 georeferenced dams. Sci. Data 7:31. doi: 10.1038/s41597-020-0362-5
Perry, L. G., Andersen, D. C., Reynolds, L. V., Nelson, S. M., and Shafroth, P. B. (2012). Vulnerability of riparian ecosystems to elevated CO2 and climate change in arid and semiarid western North America. Glob. Chang. Biol. 18, 821–842. doi: 10.1111/j.1365-2486.2011.02588.x
Poff, B., Koestner, K. A., Neary, D. G., and Henderson, V. (2011). Threats to riparian ecosystems in western North America: an analysis of existing literature 1. J. Am. Water Resour. As. 47, 1241–1254. doi: 10.1111/j.1752-1688.2011.00571.x
Pompa-Garcia, M., Gonzalez-Casares, M., Gazol, A., and Camarero, J. J. (2021). Run to the hills: Forest growth responsiveness to drought increased at higher elevation during the late 20th century. Sci. Total Environ. 772:145286. doi: 10.1016/j.scitotenv.2021.145286
Räpple, B., Piégay, H., Stella, J. C., and Mercier, D. (2017). What drives riparian vegetation encroachment in braided river channels at patch to reach scales? Insights from annual airborne surveys (Drôme River, SE France, 2005–2011). Ecohydrology 10:e1886. doi: 10.1002/eco.1886
Rauf, Z., Zarif, N., Khan, A., Siddiqui, S., Fatima, S., Iqbal, W., et al. (2023). The Western Himalayan fir tree ring record of soil moisture in Pakistan since 1855. Int. J. Biometeorol. 67, 1477–1492. doi: 10.1007/s00484-023-02517-0
Rodrigues, V., Estrany, J., Ranzini, M., de Cicco, V., Martin-Benito, J. M. T., Hedo, J., et al. (2018). Effects of land use and seasonality on stream water quality in a small tropical catchment: the headwater of Corrego Agua Limpa, Sao Paulo (Brazil). Sci. Total Environ. 622-623, 1553–1561. doi: 10.1016/j.scitotenv.2017.10.028
Sang, C., Zheng, Y. Y., Zhou, Q., Li, D. P., Liang, G. D., and Gao, Y. W. (2019). Effects of water impoundment and water-level manipulation on the bioaccumulation pattern, trophic transfer and health risk of heavy metals in the food web of three gorges reservoir (China). Chemosphere 232, 403–414. doi: 10.1016/j.chemosphere.2019.04.216
Santos, R. M. B., Monteiro, S. M., Cortes, R. M. V., Pacheco, F. A. L., and Fernandes, L. F. S. (2021). Seasonal effect of land use management on gill histopathology of Barbel and Douro Nase in a Portuguese watershed. Sci. Total Environ. 764:142869. doi: 10.1016/j.scitotenv.2020.142869
Schwabe, K., Nemati, M., Amin, R., Tran, Q., and Jassby, D. (2020). Unintended consequences of water conservation on the use of treated municipal wastewater. Nat. Sustain. 3, 628–635. doi: 10.1038/s41893-020-0529-2
Shahariar, S., Soolanayakanahally, R., and Bedard-Haughn, A. (2021). Short rotation willow on the prairie Potholes' degraded marginal riparian lands: a potential land-use practice to manage soil salinity. Land Degrad. Dev. 32, 5178–5189. doi: 10.1002/ldr.4100
Stutter, M., Baggaley, N., Huallachain, D. O., and Wang, C. (2021). The utility of spatial data to delineate river riparian functions and management zones: a review. Sci. Total Environ. 757:143982. doi: 10.1016/j.scitotenv.2020.143982
Suwal, N., Huang, X. F., Kuriqi, A., Chen, Y. Q., Pandey, K. P., and Bhattarai, K. P. (2020). Optimisation of cascade reservoir operation considering environmental flows for different environmental management classes. Renew. Energy 158, 453–464. doi: 10.1016/j.renene.2020.05.161
Terencio, D. P. S., Varandas, S. G. P., Fonseca, A. R., Cortes, R. M. V., Fernandes, L. F., Pacheco, F. A. L., et al. (2021). Integrating ecosystem services into sustainable landscape management: a collaborative approach. Sci. Total Environ. 794:148538. doi: 10.1016/j.scitotenv.2021.148538
Tito, R., Vasconcelos, H. L., and Feeley, K. J. (2018). Global climate change increases risk of crop yield losses and food insecurity in the tropical Andes. Glob. Chang. Biol. 24, E592–E602. doi: 10.1111/gcb.13959
Van Cappellen, P., and Maavara, T. (2016). Rivers in the Anthropocene: global scale modifications of riverine nutrient fluxes by damming. Ecohydrol. Hydrobiol. 16, 106–111. doi: 10.1016/j.ecohyd.2016.04.001
Vitasse, Y., Signarbieux, C., and Fu, Y. S. H. (2018). Global warming leads to more uniform spring phenology across elevations. Proc. Natl. Acad. Sci. U. S. A. 115, 1004–1008. doi: 10.1073/pnas.1717342115
Wang, J. (2013). “Pearson correlation coefficient” in Encyclopedia of systems biology. eds. W. Dubitzky, O. Wolkenhauer, K. H. Cho, and H. Yokota (New York: Springer) doi: 10.1007/978-1-4419-9863-7_372
Weldegebriel, L., Kruskopf, M., Thompson, S. E., and Tebeje, K. (2021). Detecting the short term impact of soil and water conservation practices using stage as a proxy for discharge—a case-study from the tana sub-basin, Ethiopia. Land Degrad. Dev. 32, 867–880. doi: 10.1002/ldr.3750
Wohl, E. (2017). The significance of small streams. Front. Earth Sci. 11, 447–456. doi: 10.1007/s11707-017-0647-y
Xiang, R., Wang, L. J., Li, H., Tian, Z. B., and Zheng, B. H. (2021). Water quality variation in tributaries of the three gorges reservoir from 2000 to 2015. Water Res. 195:116993. doi: 10.1016/j.watres.2021.116993
Yi, X., Huang, Y., Ma, M., Zhaofei, W., Chen, J.-L., Chen, C., et al. (2020). Plant trait-based analysis reveals greater focus needed for mid-channel bar downstream from the three gorges dam of the Yangtze River. Ecol. Indic. 111:105950. doi: 10.1016/j.ecolind.2019.105950
Zema, D. A., Bombino, G., Denisi, P., Lucas-Borja, M. E., and Zimbone, S. M. (2018). Evaluating the effects of check dams on channel geometry, bed sediment size and riparian vegetation in Mediterranean mountain torrents. Sci. Total Environ. 642, 327–340. doi: 10.1016/j.scitotenv.2018.06.035
Zhang, A., and Xie, Z. (2021). C4 herbs dominate the reservoir flood area of the three gorges reservoir. Sci. Total Environ. 755:142479. doi: 10.1016/j.scitotenv.2020.142479
Zheng, J., Muhammad, A., He, X. R., Liu, X. L., and Li, C. X. (2023). Distinguishing the mechanisms driving multifaceted plant diversity in subtropical reservoir riparian zones. Front. Plant Sci. 14, 1–14. doi: 10.3389/fpls.2023.1138368
Keywords: riparian forests, Yangtze River, three gorges dam, river ecosystem, streamchannel width, riparian width, elevation
Citation: Arif M, Petrosillo I and Changxiao L (2024) Effects of changing riparian topography on the decline of ecological indicators along the drawdown zones of long rivers in China. Front. For. Glob. Change. 7:1293330. doi: 10.3389/ffgc.2024.1293330
Edited by:
Derrick Y. F. Lai, The Chinese University of Hong Kong, ChinaReviewed by:
Tanzeel Javaid Aini Farooqi, Yibin University, ChinaPallavi Saxena, University of Delhi, India
Copyright © 2024 Arif, Petrosillo and Changxiao. This is an open-access article distributed under the terms of the Creative Commons Attribution License (CC BY). The use, distribution or reproduction in other forums is permitted, provided the original author(s) and the copyright owner(s) are credited and that the original publication in this journal is cited, in accordance with accepted academic practice. No use, distribution or reproduction is permitted which does not comply with these terms.
*Correspondence: Li Changxiao, lichangx@swu.edu.cn