Spatiotemporal variation and response of gross primary productivity to climate factors in forests in Qiannan state from 2000 to 2020
 Zhangze Liao1,2,3
  Xue-Hai Fei1,2,3,4*† Binghuang Zhou1,2,3 Jingyu Zhu1,2,3 Hongyu Jia1,2,3 Weiduo Chen1,2,3 Rui Chen1,2,3 Peng Xu1,2,3 Wangjun Li5
- 1College of Resources and Environmental Engineering, Key Laboratory of Karst Georesources and Environment (Guizhou University), Ministry of Education, Guizhou University, Guiyang, Guizhou, China
- 2Guizhou Karst Environmental Ecosystems Observation and Research Station, Ministry of Education, Guiyang, China
- 3Guizhou Provincial Double Carbon and Renewable Energy Technology Innovation Research Institute, Guiyang, Guizhou, China
- 4Guizhou Caohai Observation and Research Station for Wet Ecosystem, National Forestry and Grassland Administration, Weining, Guizhou, China
- 5Guizhou Province Key Laboratory of Ecological Protection and Restoration of Typical Plateau Wetlands, Guizhou University of Engineering Science, Guizhou Bijie, Guizhou, China
Accurate estimation of terrestrial gross primary productivity (GPP) is essential for quantifying the carbon exchange between the atmosphere and biosphere. Light use efficiency (LUE) models are widely used to estimate GPP at different spatial scales. However, difficulties in properly determining the maximum LUE (LUEmax) and downregulation of LUEmax into actual LUE result in uncertainties in the LUE-estimated GPP. The recently developed P model, a new LUE model, captures the adaptability of vegetation to the environment and simplifies parameterization. Site-level studies have proven the superior performance of the P model over LUE models. As a representative karst region with significant changes in forest cover in Southwest China, Qiannan is useful for exploring the spatiotemporal variation in forest GPP and its response to climate change for formulating forest management policies to address climate changes, e.g., global warming. Based on remote sensing and meteorological data, this study estimated the forest ecosystem GPP in Qiannan from 2000–2020 via the P model. This study explored the spatiotemporal changes in GPP in the study region over the past 20 years, used the Hurst index to predict future development trends from a time series perspective, and used partial correlation analysis to analyse the spatiotemporal GPP changes over the past 20 years in response to three factors: temperature, precipitation, and vapor pressure deficit (VPD). Our results showed that (1) the total amount of GPP and average GPP in Qiannan over the past 21 years (2000–2020) were 1.9 × 10⁴ ± 2.0 × 10³ MgC ha−1 year−1 and 1238.9 ± 107.9 gC m−2 year−1, respectively. The forest GPP generally increased at a rate of 6.1 gC m−2 year−1 from 2000 to 2020 in Qiannan, and this increase mainly occurred in the nongrowing season. (2) From 2000 to 2020, the forest GPP in Qiannan was higher in the southeast and lower in the northwest, indicating significant spatial heterogeneity. In the future, more than 70% of regional forest GPP will experience a weak increase in nonsustainability. (3) In Qiannan, forest GPP was positively correlated with both temperature and precipitation, with partial correlation coefficients of 0.10 and 0.11, respectively. However, the positive response of GPP to precipitation was approximately 70.47%, while that to temperature was 64.05%. Precipitation had a stronger restrictive effect on GPP than did temperature in this region, and GPP exhibited a negative correlation with VPD. The results showed that an increase in VPD inhibits GPP to some extent. Under rapid global change, the P model GPP provides new GPP data for global ecology studies, and the comparison of various stress factors allows for improvement of the GPP model in the future. The results of this study will aid in understanding the dynamic processes of terrestrial carbon. These findings are helpful for estimating and predicting the carbon budget of forest ecosystems in karst regions, clarifying the regional carbon absorption capacity, clarifying the main factors limiting vegetation growth in these regions, promoting sustainable regional forestry development and serving the “dual carbon goal.” This work has important guiding significance for policy formulation to mitigate climate change.
1 Introduction
Forest ecosystems, as the main component of terrestrial ecosystems, play important roles in the terrestrial carbon cycle and climate change (Trumbore et al., 2015; Tang et al., 2018; Zhu et al., 2022; Zhen et al., 2022). The gross primary productivity (GPP) of forest ecosystems is defined as the total gross carbon fixation by autotrophic carbon-fixing tissues per unit area and time (i.e., gross photosynthesis minus photorespiration) (Chapin et al., 2006; Wohlfahrt and Gu, 2015). GPP is an important component in carbon exchange that represents the ability of vegetation to fix CO2 in the carbon cycle through photosynthesis, actuates the seasonal and interannual changes in CO2 concentration. Moreover, GPP is a key parameter affecting to understand atmosphere–biosphere interactions and the changing climate. Research shows that the GPP output of forest ecosystems accounts for approximately half of the terrestrial ecosystem flux (Beer et al., 2010). Therefore, slight changes in forest GPP may affect the total anthropogenic carbon dioxide emissions absorbed by terrestrial ecosystems (Keenan and Williams, 2018; Luo et al., 2019). Inaccurate estimation of forest GPP may lead to compromise of deliverables. Furthermore, researchers have argued that forests are vulnerable to climate changes, extreme climatic events and human-induced disturbances (Gerlitz et al., 2017; Sharma et al., 2017; Kumar et al., 2019). Kumar et al. (2019) studied the spatial patterns of climatic variables and their relationships with productivity and discovered that regions with high productivity were mainly concentrated in areas with moderate ranges of temperature, while regions with very high or very low temperatures had low productivity. As a result, accurately estimating forest GPP is important for understanding the carbon cycle mechanism of forest ecosystems and revealing the response of forest ecosystems to climate change against the background of global change and increased CO2 concentrations (Piao et al., 2013; Fernández-Martínez et al., 2014; Yao et al., 2018). Simulation research on vegetation productivity has gone through multiple stages of development, including simple statistical models, remote sensing data-driven process models, and dynamic global vegetation models. Remote sensing data play an irreplaceable role in regional assessment and prediction research due to their ability to provide spatiotemporally continuous vegetation change characteristics, and they make it possible to estimate and monitor vegetation productivity globally (Yuan et al., 2014). Dynamic carbon models driven by data and remote sensing have been widely used in the estimation of GPP in forest ecosystems (Yuan et al., 2014). However, the use of different model structures and parameterization schemes will result in significant differences in the estimation of GPP (Guanter et al., 2014). Therefore, there is still great uncertainty in the assessment of GPP in forest ecosystems in karst areas and mountainous tropical/subtropical areas that are highly important for regional/global-scale GPP estimation (Friedlingstein et al., 2006; Hu et al., 2018).
The light use efficiency (LUE) model has been widely used for the estimation of GPP at regional to global scales due to its basis in terms of mechanism and feasibility for model construction (Running et al., 2004; Yuan et al., 2006; Pei et al., 2022). On the one hand, this kind of model simplifies the physiological and ecological processes of vegetation, and the calculations are relatively simple compared with those of biogeochemical models. On the other hand, the spatiotemporal variation and results of GPP estimated by the LUE model are more reliable and accurate than those estimated by other methods (Wang et al., 2020). In recent years, researchers have developed more than 20 LUE-based models with that use eddy covariance (EC) data accumulation and remote sensing technology (Pei et al., 2022). Although these models were developed based on LUE theory, they use different quantitative methods to describe the contribution of environmental factors to GPP changes, which represents the main reason for the differences in LUE model performance (Liu et al., 2022). Many studies in China have been carried out using various LUE models, show that there are still significant differences in the annual variation in GPP (Li et al., 2013; Zan et al., 2018; Du et al., 2020; Jia et al., 2020). Simulation research on vegetation productivity has gone through multiple stages of development, including simple statistical models, remote sensing data-driven process models, and dynamic global vegetation models. Remote sensing data play an irreplaceable role in regional assessment and prediction research due to their ability to provide spatiotemporally continuous vegetation change characteristics. Moreover, these methods could aid in the global estimation and monitoring of vegetation productivity. This is because the most important parameter in estimating GPP using the light utilization rate model is the potential light utilization rate, which directly determines the accuracy of vegetation productivity simulation. However, there are significant differences in these parameters among the models, and we compared several models and found that their potential light energy utilization efficiency varied from 0.604 to 2.760 g C/MJ APAR (Potter et al., 1993; Xiao et al., 2004, 2005; Yuan et al., 2007). The estimation of the potential light energy utilization rate needs to be obtained through the inversion of the measured GPP. Differences in the observed values and environmental factors will cause errors in the setting of the light energy utilization rate, leading to a model with good simulation performance in the determined research area. However, when applied to areas with different climatic conditions, the estimation results will have great uncertainty. In general, most light energy utilization models consider temperature and moisture. The impact of phenology and other environmental conditions on the utilization efficiency of light energy has not been characterized, but the effective radiation that the vegetation canopy can absorb and use in the photosynthetic process has not been accurately characterized, resulting in differences in regional and global vegetation productivity simulations (Yuan et al., 2014).
We attempted to estimate GPP using the P model proposed by Wang et al. (2017) and adjusted the model parameters based on site measurement data. The main feature of this model is that it does not directly use a fixed light energy utilization rate as an input parameter but estimates the light energy utilization efficiency of different vegetation types based on temperature and the photosynthetic effective radiation absorption ratio. The most significant feature of this model is that it combines the basic principles of traditional light efficiency models and the principle of vegetation optimality to calculate light efficiency through parameters such as temperature and the canopy-to-photosynthetic effective radiation absorption ratio. Based on these results, the GPP of vegetation experiencing dynamic changes was calculated. After the model builder used measured data from multiple global flux stations for correction and parameter adjustment, the estimation accuracy of the model improved. Currently, the model has good applicability. We applied the model, made several parameter adjustments, and attempted to improve the accuracy of the model simulation by improving the resolution of photosynthetically active radiation. Based on the simulation results, we analysed the spatial distribution, trend, and response to climate change of GPP in Qiannan because the results are still unknown. Therefore, the P model, which was constructed based on the principles of photosynthetic optimality, was used to estimate the GPP of forests in Qiannan. Site-based GPP and MODIS GPP were used to estimate and verify the accuracy of the P-modelled GPP. Our objectives were to (1) clarify the spatiotemporal pattern of GPP in the Qiannan region and predict its future development and (2) explore the response of GPP to climate change. This research clarifies the regional CO2 absorption capacity against the background of global climate change, helps us meet the carbon peak and carbon neutral goals and provides data and suggestions for the development of carbon neutral accounting and the formulation of local carbon emission reduction policies.
2 Data and methods
2.1 Overview of the study area
The study area is in Qiannan, Guizhou Province, China (106° 12′–108° 18′ E, 25° 04′–27° 29′ N, with an average elevation of 997 m above sea level). This area belongs to the subtropical monsoon humid climate zone, and has abundant rainfall with four distinct seasons. Mean annual temperature (MAT) is 16.6°C, annual precipitation is approximately 1,100–1,400 mm, and annual average sunshine duration is 882.5 h. Overall, the humidity is relatively high, increasing gradually from north to south and from west to east. The vegetation types are subtropical evergreen-deciduous mixed forests, including evergreen needle-leaf forest (ENF), evergreen broadleaf forest (EBF), deciduous broadleaf forest (DBF) and mixed forest (MF), respectively. The dominant species are Cunninghamia lanceolata, Cupressus funebris, Pinus massoniana, and Pinus armandii. Phenology shifts smoothly between the rainy and high-temperature seasons (May–October). The region has a high vegetation coverage rate, and the forest coverage rate increased from 52.5% in 2012 to 66% in 2020. The study area contains 6 national forest parks and 5 provincial forest parks (Figure 1).
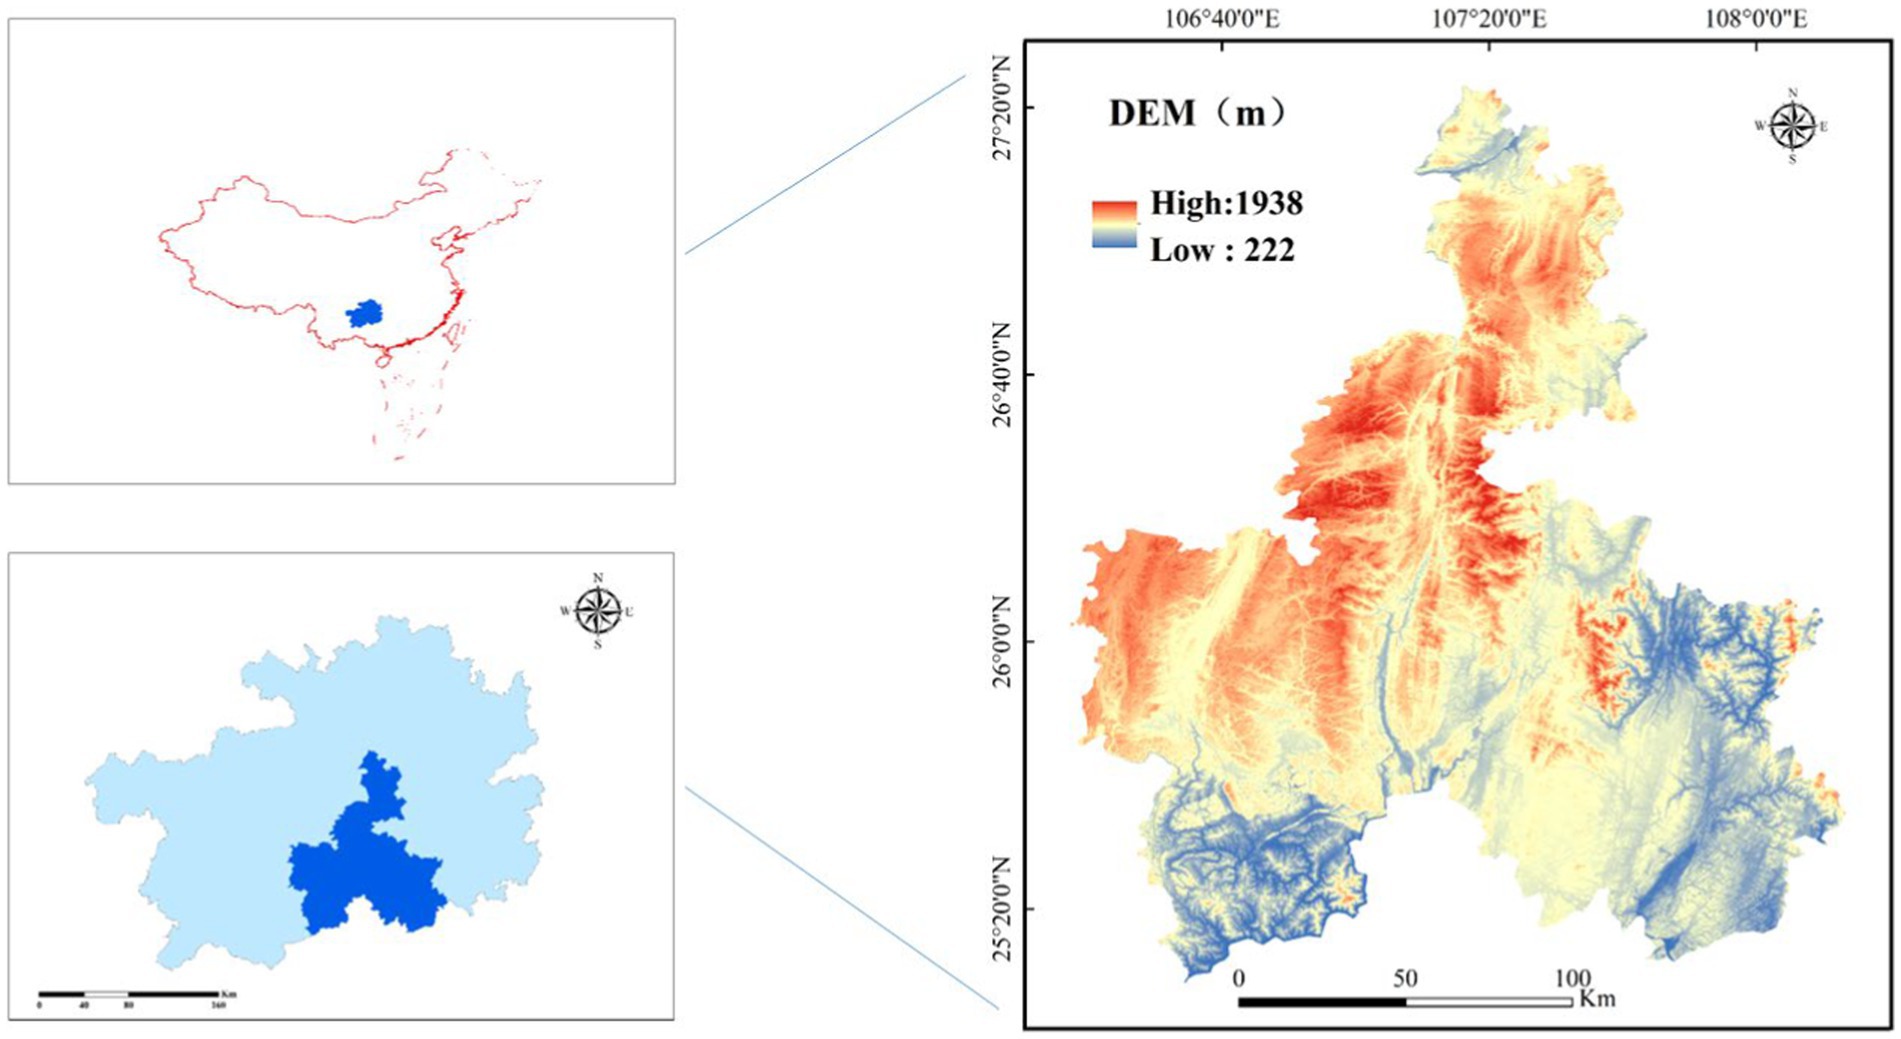
Figure 1. Study area and geographic information.
2.2 Data sources and processing
2.2.1 MODIS data
Considering the difference in spatiotemporal resolution, we used GPP data derived from the MOD17A2H product, including GPP_500 m, PsnNet_500 m and Psn_QC_500 m, from 2000 to 2020. Datasets from NASA1 with a spatial resolution of 500 m and a temporal resolution of 8 days (hereinafter referred to as MODIS GPP) were used in our study. Normalized difference vegetation index (NDVI) data were obtained from the latest version (V6) of the MOD13Q1 product on the NASA website, with a spatial resolution of 250 m and a temporal resolution of 16 days.2 The monthly-scale fPAR was retrieved according to the empirical formula (Eq. 1). First, the product quality control file was used to exclude low-quality data, and then the high-frequency noise was removed by the Savitzky–Golay filter (Singh et al., 2019). Finally, the fPAR dataset of the complete time series was constructed as the model input.
where fPARmax = 0.95 and fPARmin = 0.001.
The digital elevation model (DEM) spatial distribution data (with a spatial resolution of 30 m) used in this study were acquired from the Data Center for Resources and Environmental Sciences, Chinese Academy of Sciences.3
2.2.2 Meteorological data
Meteorological data from 2000 to 2020, including monthly temperature, monthly precipitation, mean relative humidity and mean barometric pressure, were acquired from the China Meteorological Administration.4 To maintain a consistent spatial resolution between the meteorological data and remote sensing data, kriging interpolation was used to interpolate the point data into raster data with the same spatial resolution (250 m) as the fPAR, NDVI and other data based on 25 meteorological stations in the Qiannan region.
2.2.3 Land use and land cover data
Land use and land cover (LUCC) data from 2000 to 2020 in Qiannan were obtained from the Resources and Environmental Science Data Center of the Chinese Academy of Sciences.5 In this study, we used remote sensing data with a temporal resolution of every 5 years and a spatial resolution of 30 metres. The LUCC data were regrouped into four categories according to the existing vegetation types in Guizhou Province, resulting in (i) evergreen needle-leaf forest (ENF), (ii) evergreen broadleaf forest (EBF), (iii) deciduous broadleaf forest (DBF), and (iv) mixed forest (MF).
2.3 Methodology
2.3.1 P model
In this study, a LUE model, the global production efficiency model (P model), constructed based on the principle of vegetation optimality was used to simulate the GPP of forests in Qiannan. The model unifies the Farquhar–Von Caemmerer–Berry (FvCB) and LUE models. It assumes the optimality principle of balancing the C cost (per unit assimilation) of maintaining transpiration and carboxylation (Vcmax) capacity (Wang et al., 2017). The model was used to predict the adaptability of leaf horizontal photosynthesis to the environment, simulate the LUE, and estimate the GPP under different environmental conditions in combination with site-level fPAR and meteorological data. Although the P model requires relatively few inputs, the R2 of the predicted GPP and the observed GPP based on the complete model setting was 0.75 (8-day average, 126 sites) (Stocker et al., 2020).
The principle of optimality indicates that plants can adjust their physical and chemical properties to adapt to the growth environment and realize the optimal utilization of energy, water, and nutrient resources. According to the physiological and biochemical models of photosynthesis, the instantaneous photosynthetic rate is affected by the intercellular carbon dioxide concentration (Ci, μmol/mol), which is regulated by stomatal opening and closing. It is believed that plants can balance photosynthetic gain and transpiration loss caused by adjusting stomatal opening to maximize carbon assimilation efficiency (Stocker et al., 2020). For stomatal behaviour, a minimum consumption hypothesis is proposed: plant stomatal regulation tends to minimize carbon consumption to maintain carboxylation and transpiration rates and is integrated with the classical LUE to obtain the theoretical model of Ci expressed in Eqs. 2, 3:
where Ca represents the ambient carbon dioxide concentration (μmol/mol); Γ* represents the carbon dioxide compensation point (Pa), expressed as a function of temperature Ta: Γ* = 4.08*exp [(27055.67/8.3145) (1/298.15-1/Ta)]; η* represents the viscous resistance of water, expressed as a function of temperature: η* = exp [580.1/(Ta − 138) − 1/160]; and K is the Mie coefficient (Pa) of the Rubisco enzyme, expressed as follows: K = Kc (1 + 209,460/Ko), where Kc and Ko are the Michael coefficients of the carboxylation and oxygenation reactions at the Ta temperature, respectively. Wang et al. (2017) determined the value of β in Eq. 3 to be 146 using the observed stable carbon isotopes of leaves at the global scale and verified the theoretical model. Finally, the collaborative restriction hypothesis was integrated with the Ci model and photosynthetic physiological and biochemical models to construct the C3 plant universal photosynthetic model P model (Eqs. 4, 5), which was verified on a global scale. The effect of soil moisture on the photosynthetic process was further considered in the latest version of the P model (Stocker et al., 2020), and the open source code can be accessed at GitHub:6
where GPP is the gross primary productivity, which is reflected at the canopy scale. Iobs represents the canopy intercepted photosynthetically active radiation [mol photon/(m2 s)], expressed as photosynthetically active radiation (PAR) and fraction of photosynthetically active radiation (fPAR); that is, Iobs = fPAR × PAR, C* is fixed at 0.41, and β(θ) is a water stress term driven by the soil water content (SWC) (m3/m3). φ0 is the intrinsic light quantum efficiency in mol CO2/mol, again calculated as a function of Ta. In addition, m reflects the limitation of photosynthesis by CO2. For the detailed derivation process of the P model, please refer to the model construction studies (Wang et al., 2017; Stocker et al., 2020).
2.3.2 Trend analysis of GPP
Univariate linear regression was applied to analyse the interannual variation in GPP (Zhao et al., 2018). The formula for trend analysis is as follows (Eq. 6):
where Slope is the interannual rate of GPP change, n is the 21-year period from 2000 to 2020, and GPPi is the amount of GPP in year i.
2.3.3 Sen–Mann–Kendall trend
To quantitatively study the variation trend of forest GPP, we adopted Sen–Mann–Kendall trend analysis in this study to reflect the evolutionary of the regional pattern of GPP during the period from 2000 to 2020 by exploring the spatial variation and variation slope of each pixel. The calculation formula was as follows (Eq. 7):
where 1 < j < i < n, n is the total time sequence length, and GPPi and GPPj are the sample time series datasets. If β > 0, GPP shows an increasing trend; if β < 0, GPP shows a decreasing trend.
2.3.4 Partial correlation analysis
Correlation coefficients were used to describe the relationships between GPP and temperature, precipitation, and vapor pressure deficit (VPD) is the difference between the saturated vapour pressure. The correlation coefficient was calculated as expressed in Eqs. 8–10:
where Rxy, Rxz, and Rxw are the single correlation coefficients between GPP and temperature, VPD, and precipitation, respectively, and n is the length of the time series data. Many factors affect GPP. To analyse the correlation between one of these variables and GPP, other variables need to be excluded. Hence, we adopted a third-order partial correlation analysis and used a T test to inspect the results of the partial correlation analysis (Tian Z. et al., 2019). The formula is as follows (Eq. 11):
where Rij·mn, Rij·mn and Rjh·mn are the partial correlation coefficients of variables (i, j), (i, h) and (j, h), respectively. The formula for the T test is shown in Eq. 12:
where t is the t-statistic magnitude of the T test, R is the partial correlation coefficient between the GPP and the corresponding variable, n is the sample number, and k is the number of controllable variables.
2.3.5 Hurst index
The Hurst index can not only be used to describe the sustainability of the GPP in Qiannan but also predict future development trends from time series. Therefore, this study attempts to explore future changes in the ecological environment of forests in Qiannan by using the Hurst index to provide a reference for the sustainable management of forests in the future. The Hurst index (H), which is based on rescale range (R/S) analysis, is an effective method for quantitatively describing the long-term dependence of time series information (Wang et al., 2008; Ma and Li, 2010). The following sequences are established at any moment (i = 1, 2, …, n) after a given time series variable of GPP. For any positive integer m, the above time series are defined. Here, this study mainly predicts the changes in GPP from 2000 to 2020, so n is equal to 21. The Hurst was calculated as expressed in Eqs. 13–17.
Difference sequence:
Mean sequence:
Cumulative dispersion:
Range:
Standard deviation:
The formula R/S = R(m)/S(m) is defined based on computing R(m) and S(m).
When R/S ∝ TH, the Hurst phenomenon occurs in the considered time series, and the representational significance of the Hurst index is evident. When 0.5 < H < 1, the time series is persistent, meaning that the future trend is consistent with the past trend. The closer the value is to 1, the stronger the continuity will be. However, when 0 < H < 0.5, the time series has an anti-continuous nature, indicating that the future change trend is opposite to the past change trend. The closer the value is to 0, the stronger the degree of anti-continuity. When H = 0.5, the event sequence is random, and the future change trend is unpredictable (Wang et al., 2018).
3 Model validation
MODIS GPP and EC-based GPP were applied to validate the P model-based GPP in this study (see Figure 1).
3.1 P model-based GPP vs. MODIS GPP
To assess the accuracy of the P model, this study performed a comparative analysis of the estimated GPP based on the P model and MODIS GPP products in 2010, 2015 and 2019 (Figure 2). The coefficients of determination at the pixel scale in 2010, 2015 and 2019 were 0.34, 0.42 and 0.41, respectively. Although MODIS GPP and P-model GPP were similar at low values of GPP, the slope of the regression line was less than one, indicating that MODIS GPP underestimated P-model GPP at more productive sites based. The results of this study support the view that the MODIS GPP product underestimates GPP across many sites, most significantly in areas with drought (Sjöström et al., 2013). The GPP was markedly underestimated by MODIS at highly productive sites. In contrast, the GPP was close to the estimated GPP based on EC observations (EC-observed GPP) at sites with low productivity (Zhao et al., 2006; Wang et al., 2013). The MODIS GPP and EC-observed GPP were compared at an alpine meadow site on the Qinghai–Tibet Plateau and a crop site on the North China Plain, and the MODIS GPP was significantly lower than the EC-observed GPP (Zhang et al., 2008). Research has shown that at hardwood forest sites, the MODIS GPP phenology started earlier than that indicated by the scaled GPP, and the summertime GPP from MODIS was generally lower than the scaled GPP. The overall trend for GPP involved underestimation (Turner et al., 2003). The EC-observed GPP at 10 sites in northern China was used to validate the MODIS GPP, and the results indicated that the model explained 85% of the EC-observed GPP at the sites with the inputs observed in situ and improved parameters in the MODIS GPP algorithm, whereas the MODIS GPP algorithm without in situ inputs and parameters explained only 26% of the EC-observed GPP (Wang et al., 2013). Another study also revealed that the MODIS GPP product clearly underestimated the GPP in temperate grassland ecosystems in Inner Mongolia, China (Wu et al., 2008). Tang et al. (2015) evaluated the interannual trend captured by the annual mean GPP estimates inferred from EC data and by the MODIS GPP product for the typical flux site of each forest type. The results showed that the MODIS GPP product in the ENF was moderate, accompanied by an apparent underestimation and a weaker performance in the encompassing EBF and DBF. In terms of simulation accuracy, the current MODIS GPP estimates still need to improve the quality of different upstream inputs. Based on these studies, the estimation results of standard MODIS GPP products showed significant differences in different study areas. This is because the model parameterization scheme of the MODIS GPP algorithm is relatively invariable and simplistic. We believe that due to the uncertainty of MODIS GPP data, it is more reasonable and reliable to evaluate the spatiotemporal distribution of GPP in Qiannan using the P model.
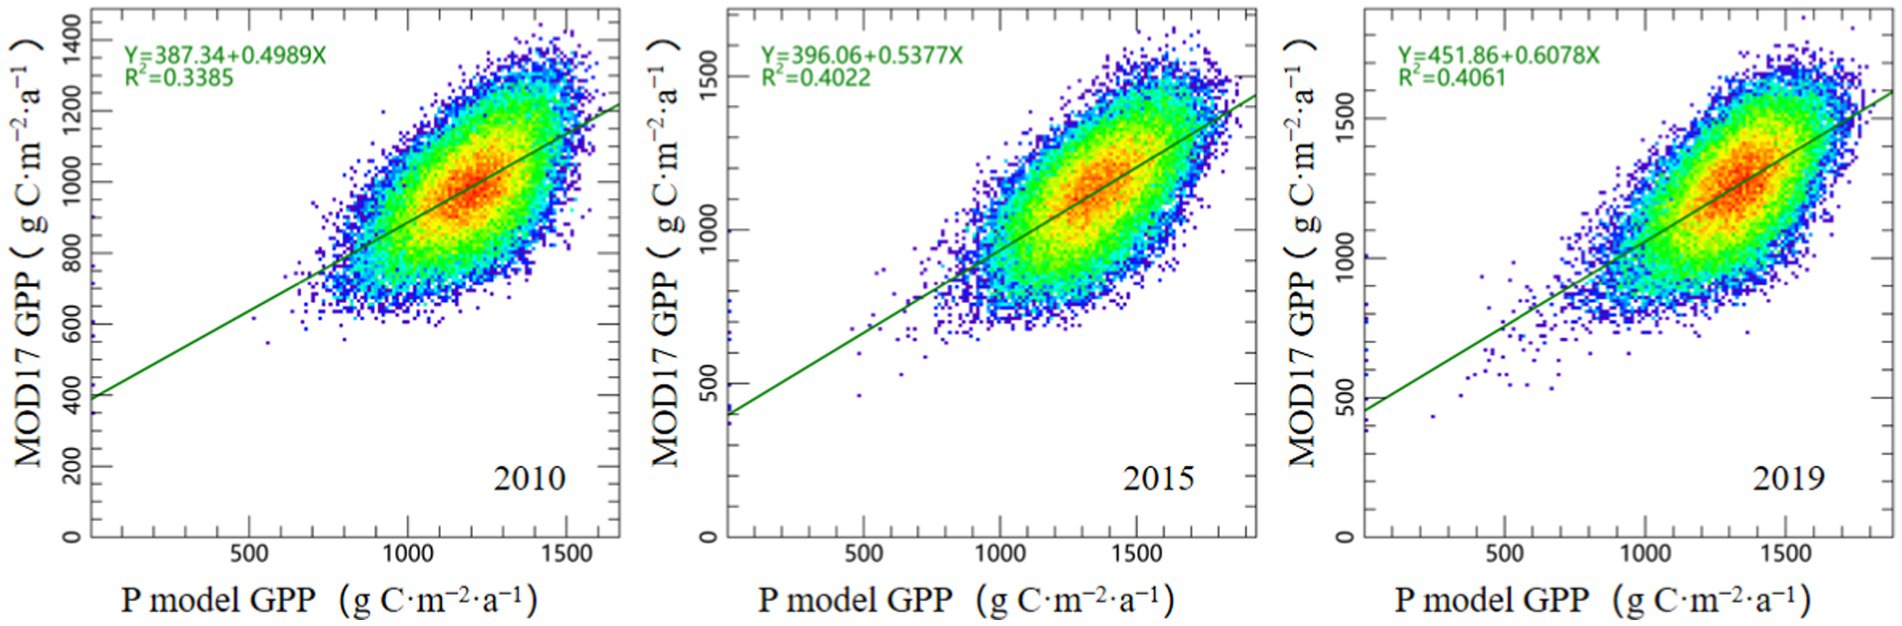
Figure 2. Comparison between P model-based GPP and MODIS GPP based on different raster pixels in 2010, 2015 and 2019.
3.2 P model-based GPP vs. EC-based GPP
The main vegetation types at Ailao station and Dinghu station are evergreen broadleaf forest and mixed forest, respectively. Both sites have a humid subtropical monsoon climate, which is very similar to the climatic conditions and vegetation composition in Qiannan. To further evaluate the accuracy of the model simulation, the in situ monthly EC-based GPP at Ailao station from 2009 to 2013 and that at Dinghu station from 2003 to 2010 were compared and verified with the P model-based GPP (Figure 3) to verify the estimation accuracy of the P model-based GPP under similar environmental conditions. The results showed that the in situ measured monthly GPP values at the Ailao and Dinghu stations were basically consistent with the P model-based GPP, and the coefficients of determination were 0.87 (Figure 3A) and 0.82 (Figure 3B). The simulation results that are in good agreement with the EC-based GPP data indicate that the adjusted P model has good simulation performance under these ecosystem and climate conditions, and these simulation results are superior to those of the MODIS GPP. This difference may also be due to our improved resolution of the input parameters. We believe that using the P model GPP to determine spatiotemporal changes in the Qiannan region and respond to climate factors is more accurate.
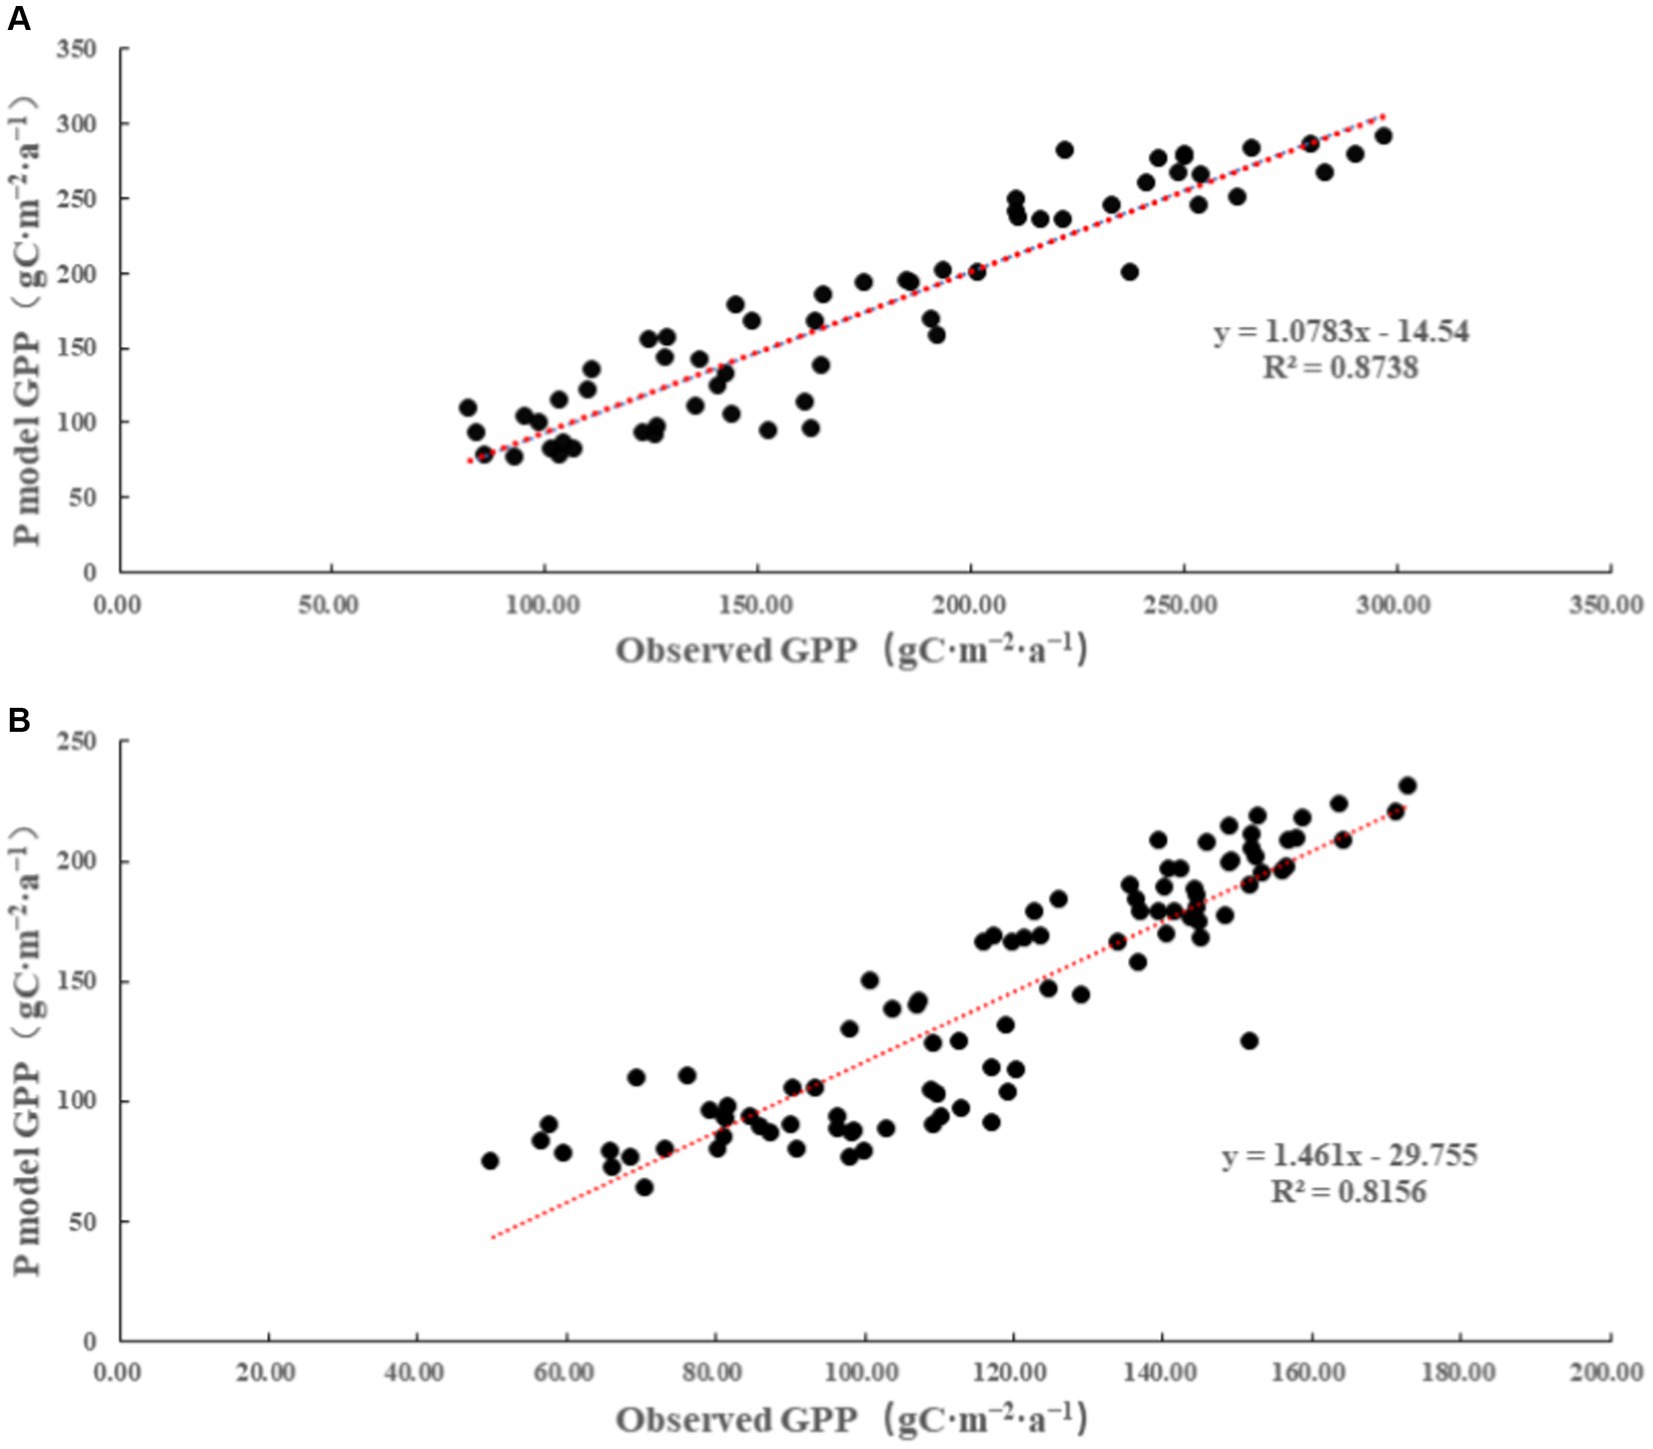
Figure 3. Comparison between P model-based GPP and EC-observed GPP at Ailao station (A) and Dinghu station (B).
4 Results
4.1 Spatiotemporal variation in GPP in Qiannan
4.1.1 The photosynthetic capacity of the forest in Qiannan
The total amount of GPP and average GPP in the study area over the past 21 years (2000–2020) were 1.9 × 10⁴ ± 2.0 × 10³ MgC ha−1 year−1 and 1238.8 ± 107.8gC m−2 year−1, respectively. In general, the total amount of GPP and average GPP in the southern regions of Qiannan, such as Sandu, Dushan, Libo and Luodian Counties, were greater than those in the northern regions, especially Changshun, Fuquan and Weng’an Counties, and the maximum and minimum values appeared in Sandu County and Changshun County, respectively. The total amount of GPP and average GPP distribution of each county/city are shown in Figure 4, and the specific values are shown in Table 1.
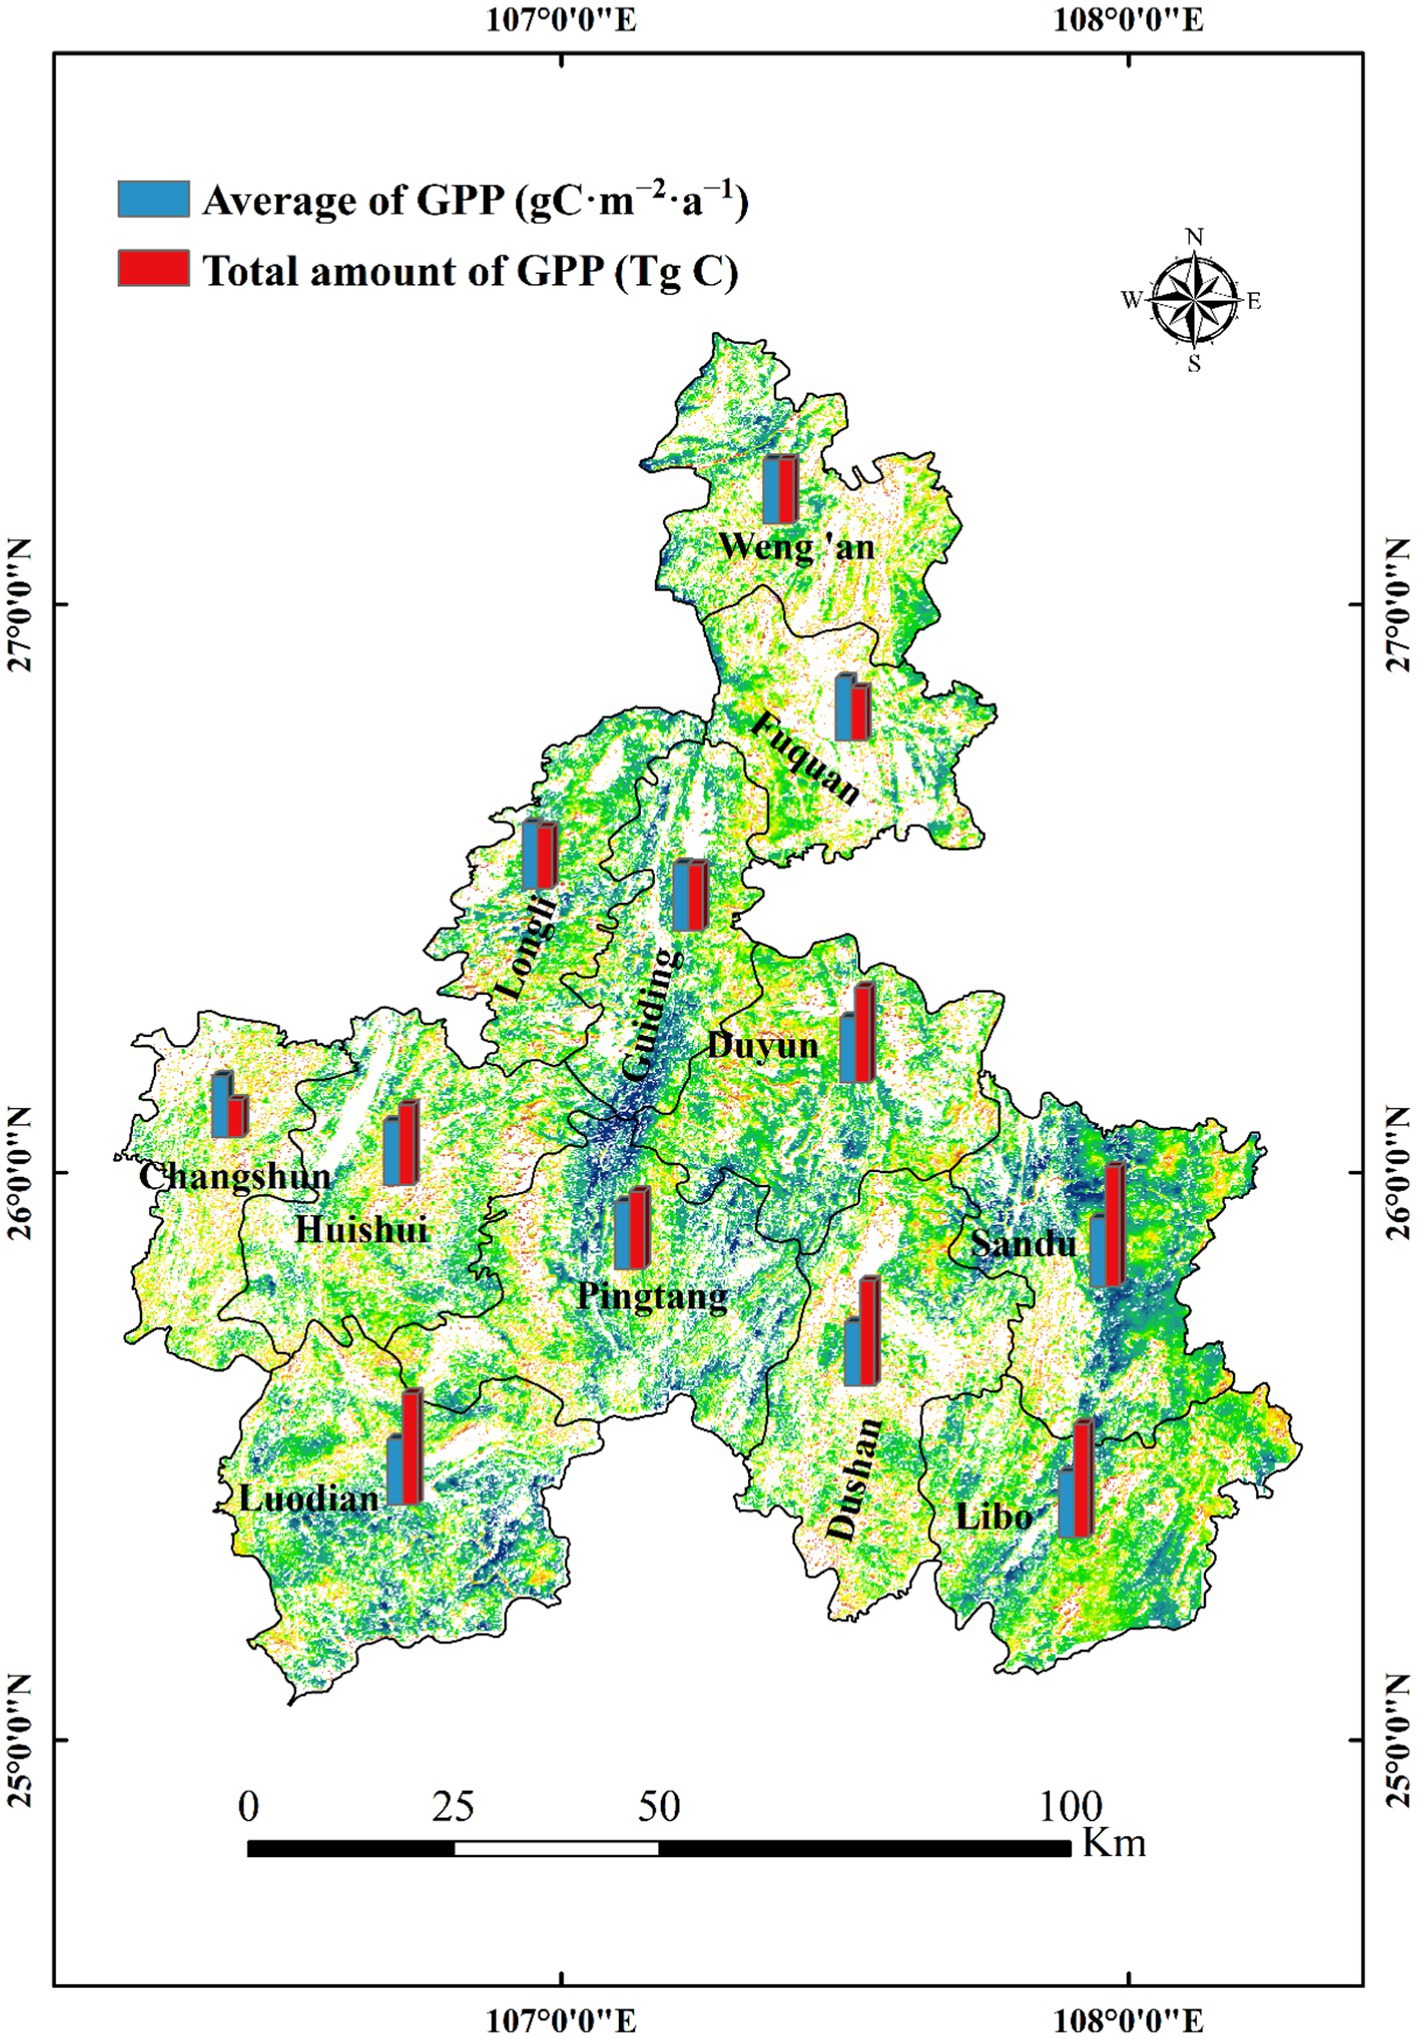
Figure 4. Distribution pattern of the total amount of GPP and average GPP in Qiannan from 2000 to 2020.
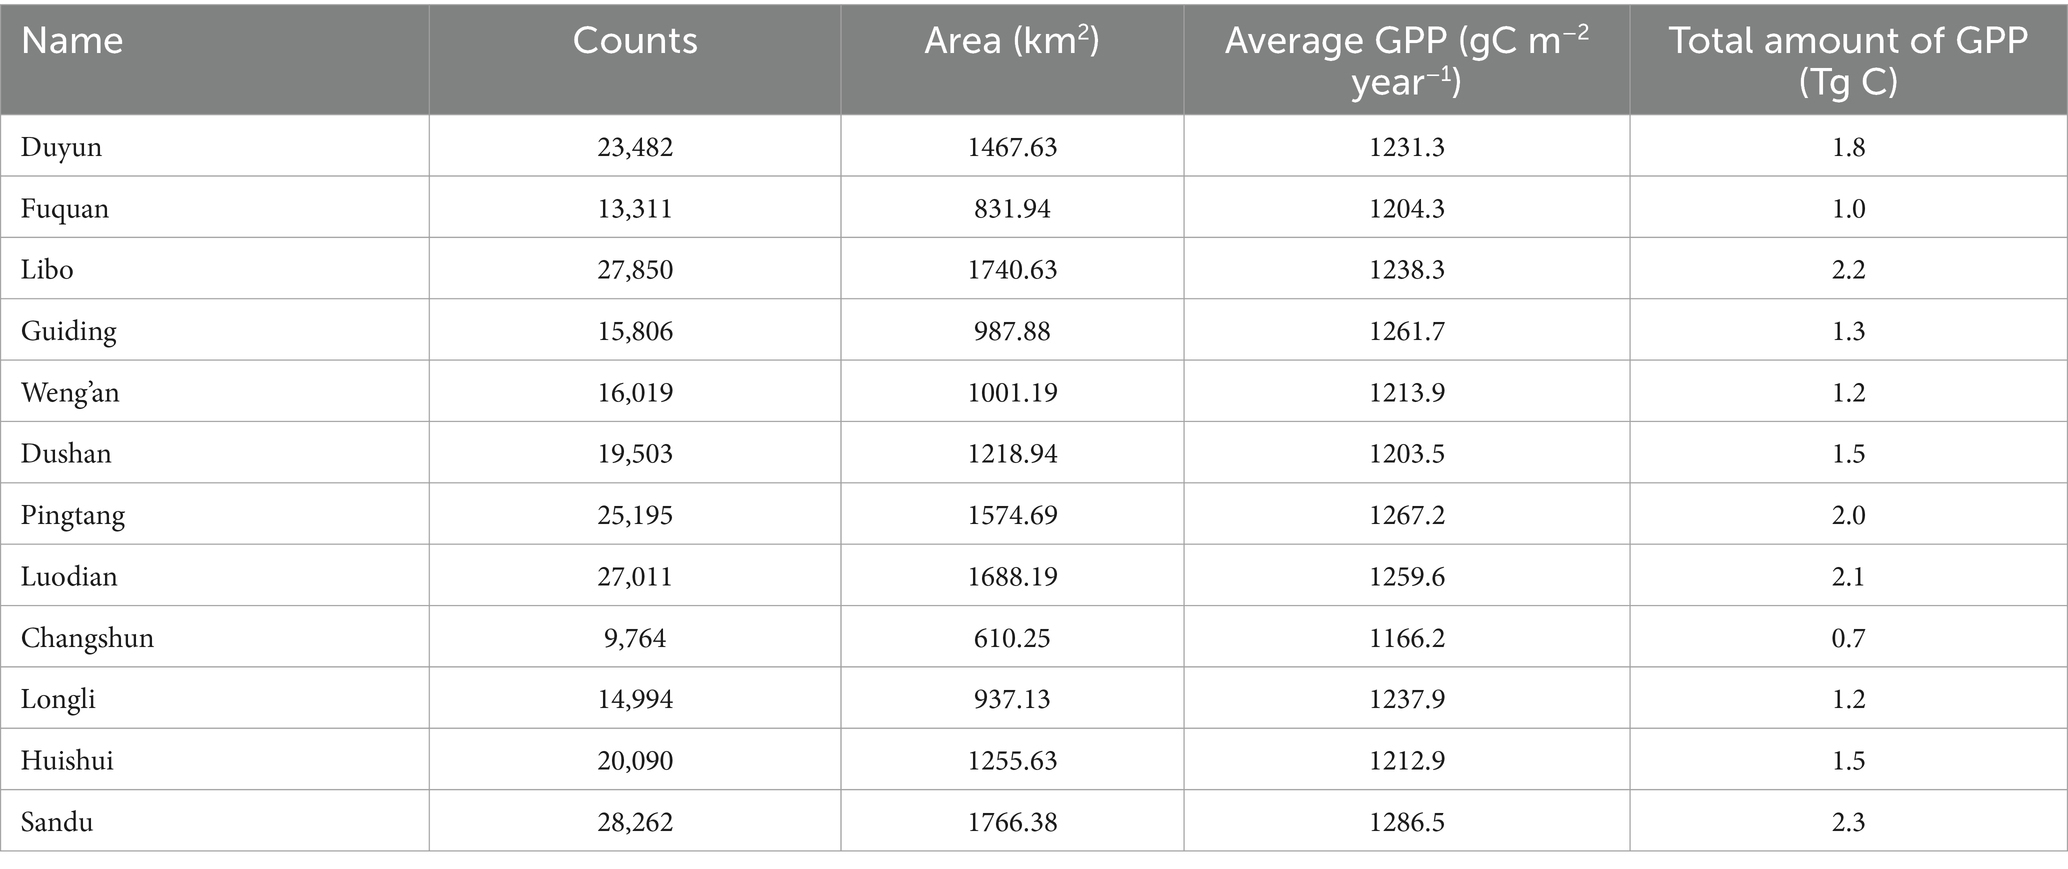
Table 1. The total amount of GPP and average GPP values for counties/cities in Qiannan.
4.1.2 Spatial evolution of forest GPP from 2000 to 2020
The forest GPP in Qiannan from 2000 to 2020 was estimated by the P model to reveal the spatial distribution of forest GPP in the study area, and then, the spatiotemporal information was analysed in different stages, namely, 2000, 2005, 2010, 2015, and 2020 (Figure 5). The spatial evolution of GPP in the study area exhibited notable spatial heterogeneity, with an increasing trend from west to east and from north to south. Overall, the change in GPP in the high-value areas ranged from 1,400 to 2,100 gC m−2 year−1, with small fluctuations every 5 years. Lower-value areas (2–800 gC m−2 year−1) gradually transitioned to intermediate-value areas (1,200–1,400 gC m−2 year−1) from 2000 to 2014 and reached the maximum value of 20,045 gC m−2 year−1 in 2013. The main reason may be that with the development of natural forest protection measures and afforestation in large areas, the forest distribution in the study area was relatively uniform, except for the slightly lower values in the north. There was a fluctuating increase from 2015–2020 (Figures 5D,E).
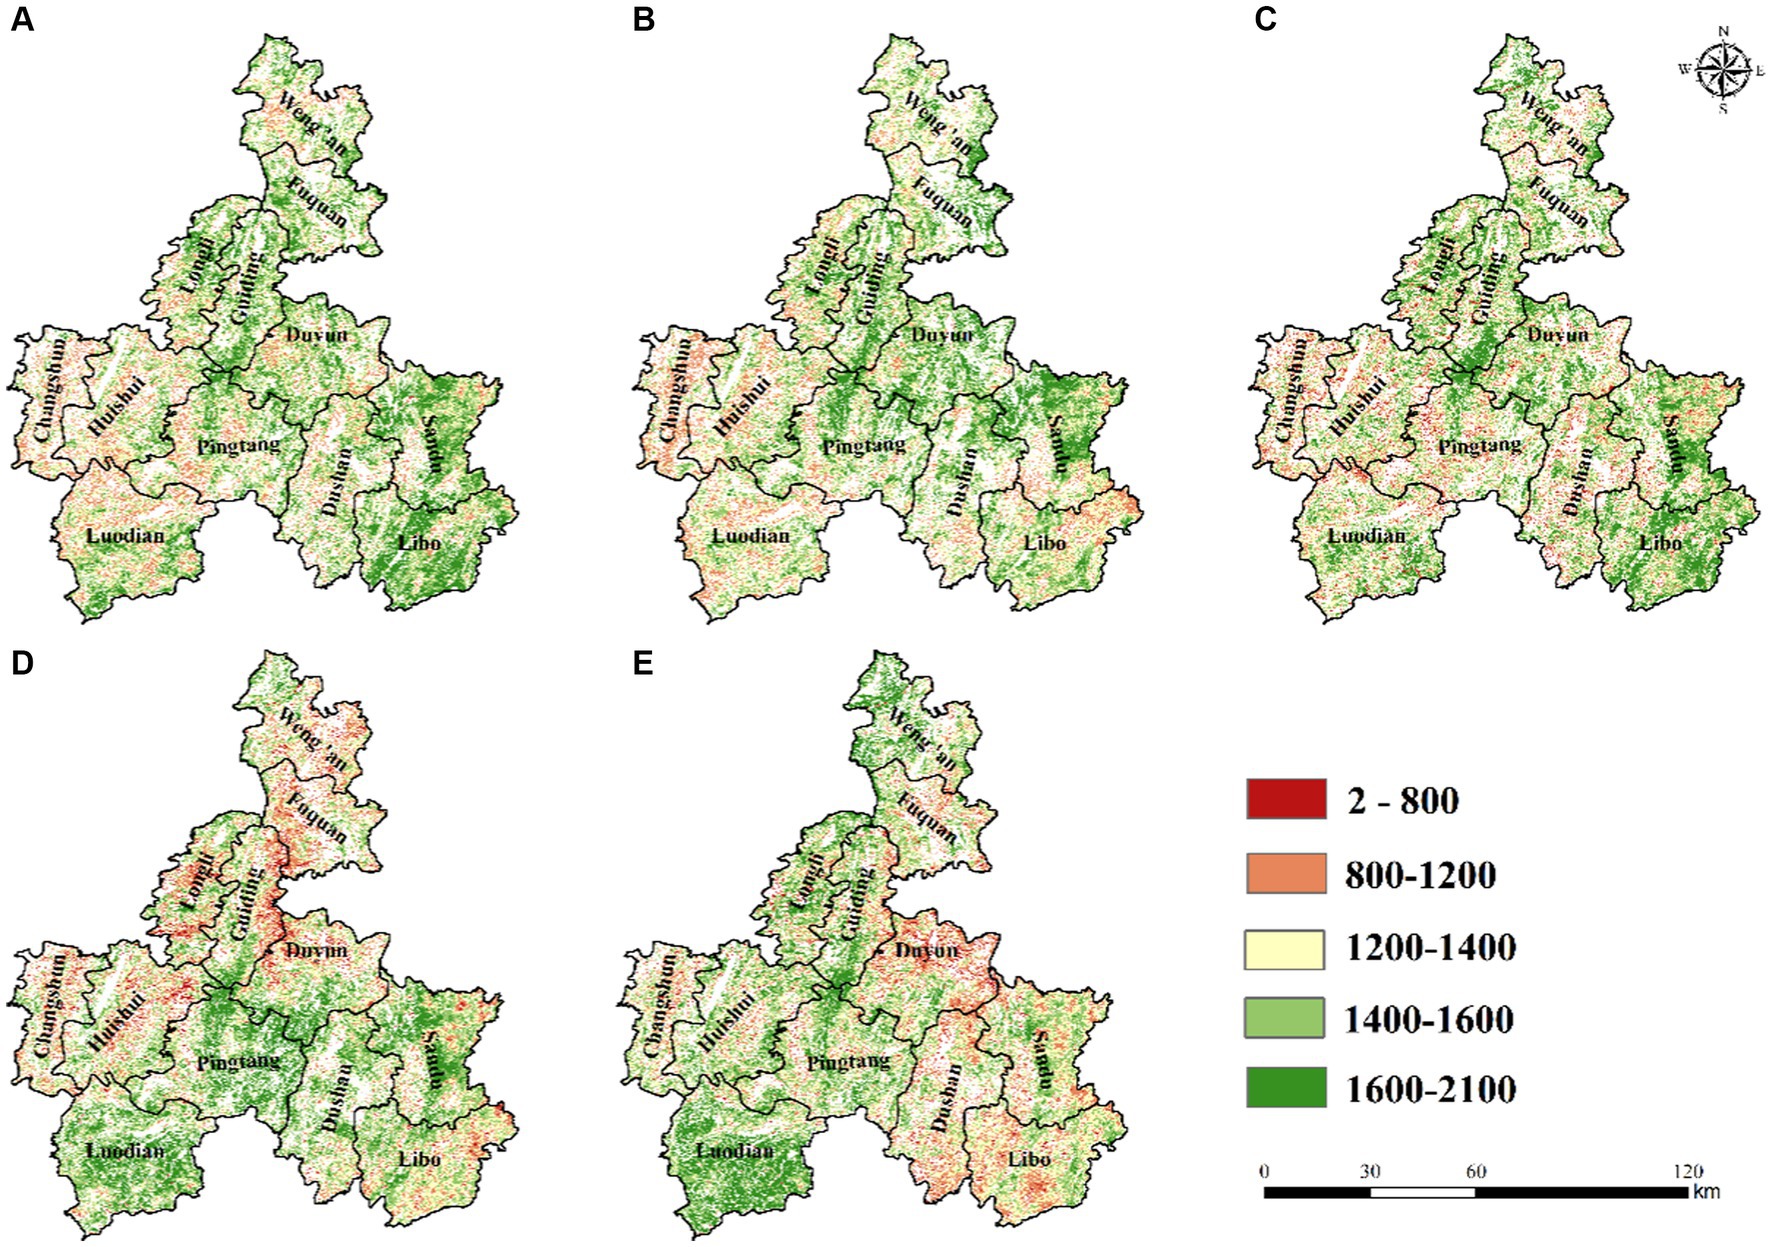
Figure 5. The spatial distribution of forest ecosystem GPP in Qiannan from 2000 to 2020. (A) 2000, (B) 2005, (C) 2010, (D) 2015, and (E) 2020.
4.1.3 Interannual variation in GPP
The average GPP from 2000 to 2020 was chosen as an indicator of environmental quality. Overall, the results showed increasing forest ecosystems, with an average increase of 6.1 gC m−2 year−1 (Figure 6A) between 2000 and 2020. GPP fluctuated with an increase of 17.6% and a subsequent decrease of 21.9% between 2001 and 2006. GPP increased rapidly from 2006 to 2009, reaching 1339.7 gC m−2 year−1 in 2009. Thereafter, it did not show a trend of continuous increase. There was relatively stable fluctuation except for the low GPP in 2012, which may have been related to large-scale drought events. GPP gradually increased again from 2010 to 2019, reaching a maximum of 1496.8 gC m−2 year−1 in 2013. During the period from 2016 to 2020, the forest GPP decreased slightly, likely affected by climate changes, such as decreased temperature and reduced precipitation.
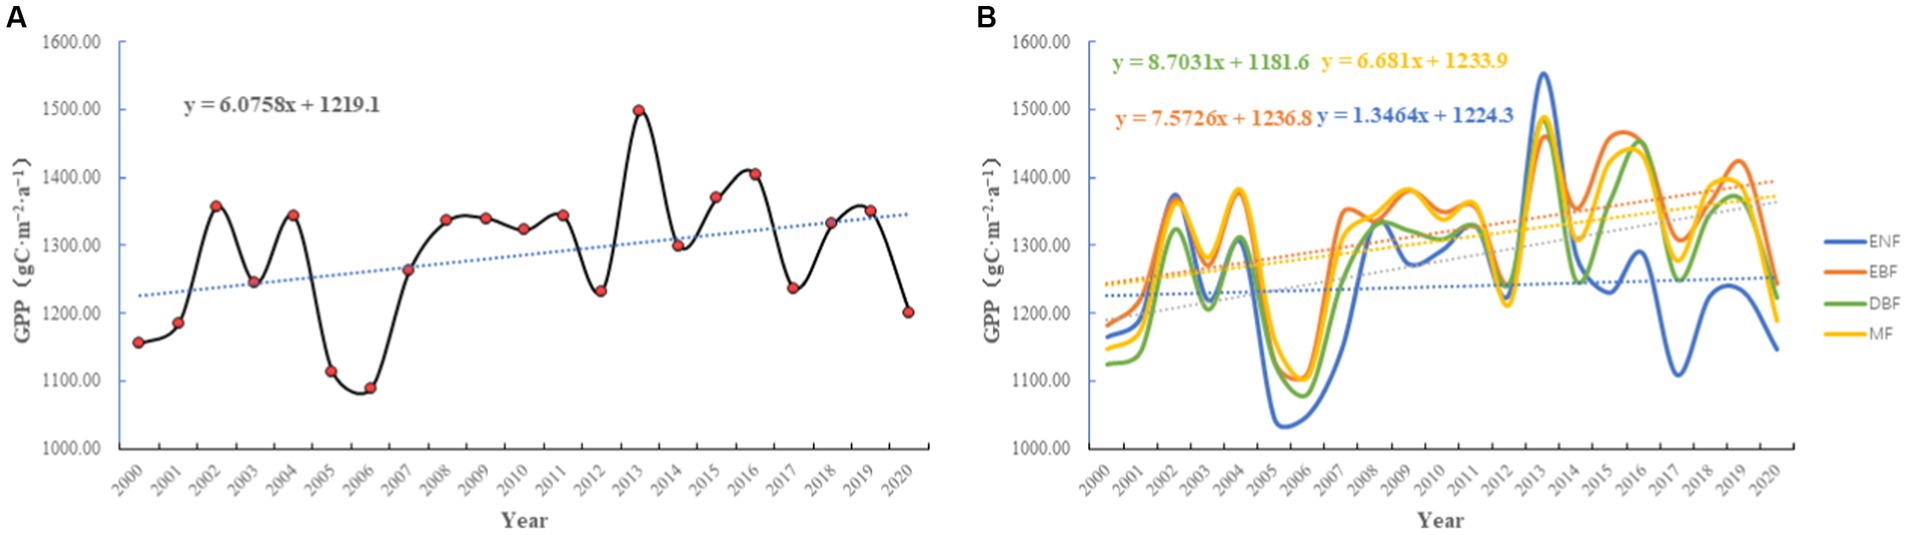
Figure 6. Interannual variation in forest GPP in Qiannan during the period 2000–2020 [A forest ecosystems, B four types of vegetation evergreen needle-leaf forest (ENF), evergreen broadleaf forest (EBF), deciduous broadleaf forest (DBF), and mixed forest (MF)].
The GPPs of different kinds of forests were estimated to reveal the variation characteristics of these forests. The results showed that the average GPPs of the four forests from 2000 to 2020 ranked from high to low were DBF > EBF > MF > ENF. Compared with that in the other three forests, the GPP in DBF showed an increasing trend, with a rate of 8.7 gC m−2 year−1, possibly because global warming resulted in longer growing seasons, leading to a significant increase in GPP. Similarly, the GPPs of the other forest types all exhibited increasing trends, and the rates of increase in EBF, MF, and ENF were 7.6, 6.7 and 1.3 gC m−2 year−1, respectively.
From the pattern of the GPP of the different forest types during the different periods (Figure 6B), it was evident that the GPP of the various forests exhibited a decreasing trend from 2001 to 2006, after which it increased gradually and reached its highest point in 2013. GPP declined significantly in 2014. In the following years (2015–2020), the GPP of these forests declined substantially. During the period from 2000 to 2020, there were two peaks for these forest types, at 1042 gC m−2 year−1 in 2005 and 1,554 gC m−2 year−1 in 2013. For EBF and DBF, the changes in GPP were consistent with those for MF overall. The GPP of these three forest types decreased significantly during 2003–2006 and 2013–2014. In the first stage, they varied from 1,282 gC m−2 year−1 to 1,106 gC m−2 year−1 and from 1,489 gC m−2 year−1 to 1,247 gC m−2 year−1, respectively. In the second stage, the GPP decreased more severely, with rates of 13.7 and 16.3%, respectively. The highest GPP values reached 1,459 gC m−2 year−1, 1,485 gC m−2 year−1, and 1,489 gC m−2 year−1 in 2013. However, the interannual GPP changes in the ENF were relatively unstable compared with those in the other forest types. The increasing trend rate remained low and fluctuated greatly; maximum mean GPP appeared in this vegetation type at 1,554 gC m−2 year−1 in 2013. The lowest annual average GPP value among the four vegetation types occurred in this vegetation type, with a value of 1,042 gC m−2 year−1.
4.1.4 Intra-annual variation in GPP
The multiyear monthly averaged GPP of the forest ecosystem exhibited low–high–low intra-annual variation trends (Figure 7). Multiyear monthly average GPP value increased beginning in January (6.8 ± 0.8 gC m−2 month−1), peaked in September (204.3 ± 23.9 gC m−2 month−1) and gradually decreased until December (18.5 ± 4.5 gC m−2 month−1). The highest monthly GPP value in the forest ecosystem occurred in September 2012 (259.3 gC m−2), and the lowest monthly GPP value occurred in January 2000 (1.6 gC m−2). In general, the regularity of the intra-annual variation in GPP was significant, with a regular trend of first increasing and then decreasing, with the monthly maximum appearing in summer.
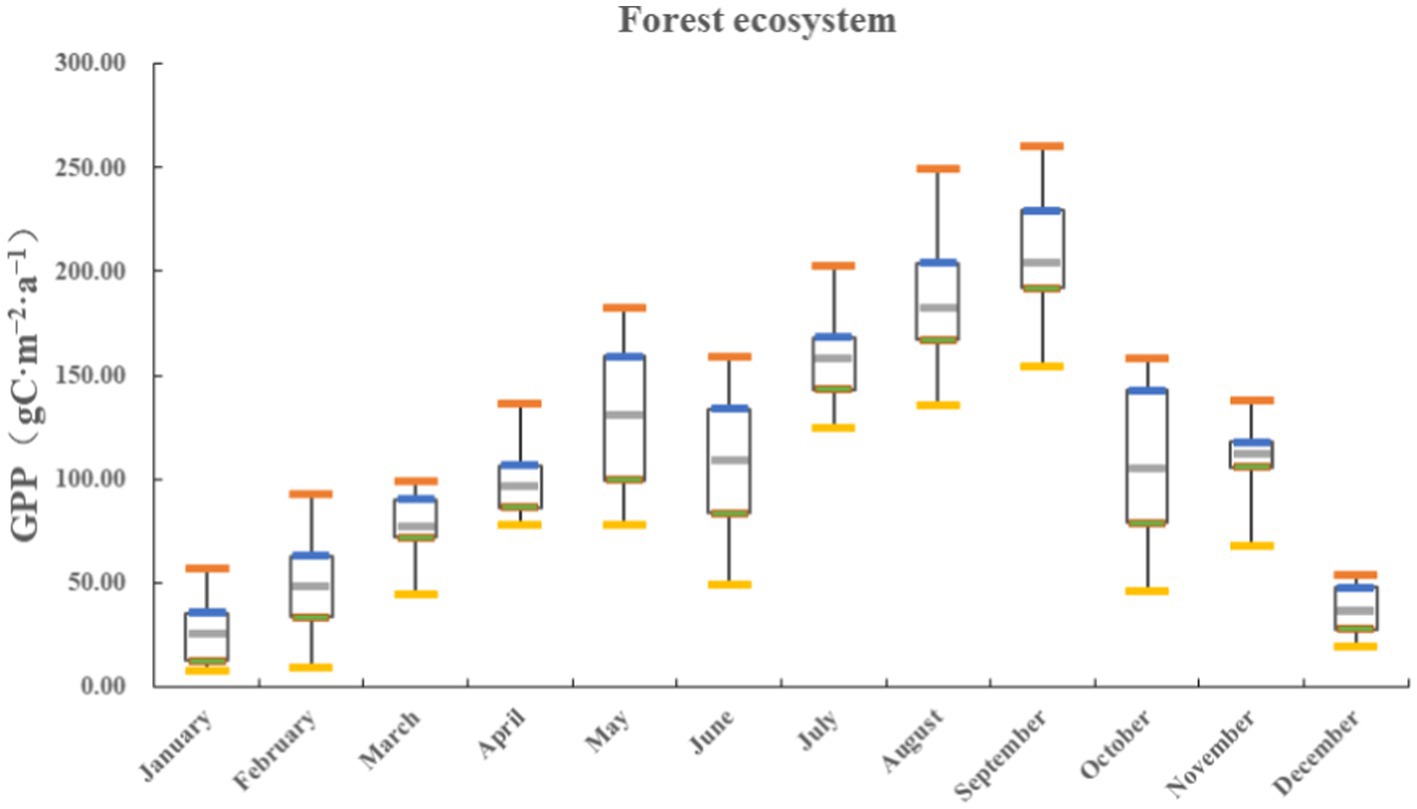
Figure 7. The intra-annual variation in the multiyear monthly averaged GPP of forest ecosystems between 2000 and 2020.
The monthly maximum, minimum and monthly mean values for the different vegetation types are shown in Figure 8. The GPP peaks of evergreen needle-leaf forest, deciduous broadleaf forest and mixed forest all occurred in September, with values of 258.1, 2,636 and 261.6 gC m−2 month−1, respectively. However, the peak GPP in evergreen broadleaf forest was 238.9 gC m−2 month−1 in August. The average monthly GPP values of the four vegetation types were ranked as follows: evergreen needle-leaf forest > evergreen broadleaf forest > mixed forest > deciduous broadleaf forest. This pattern was not consistent with the ranking of the annual mean GPP values of the four vegetation types.
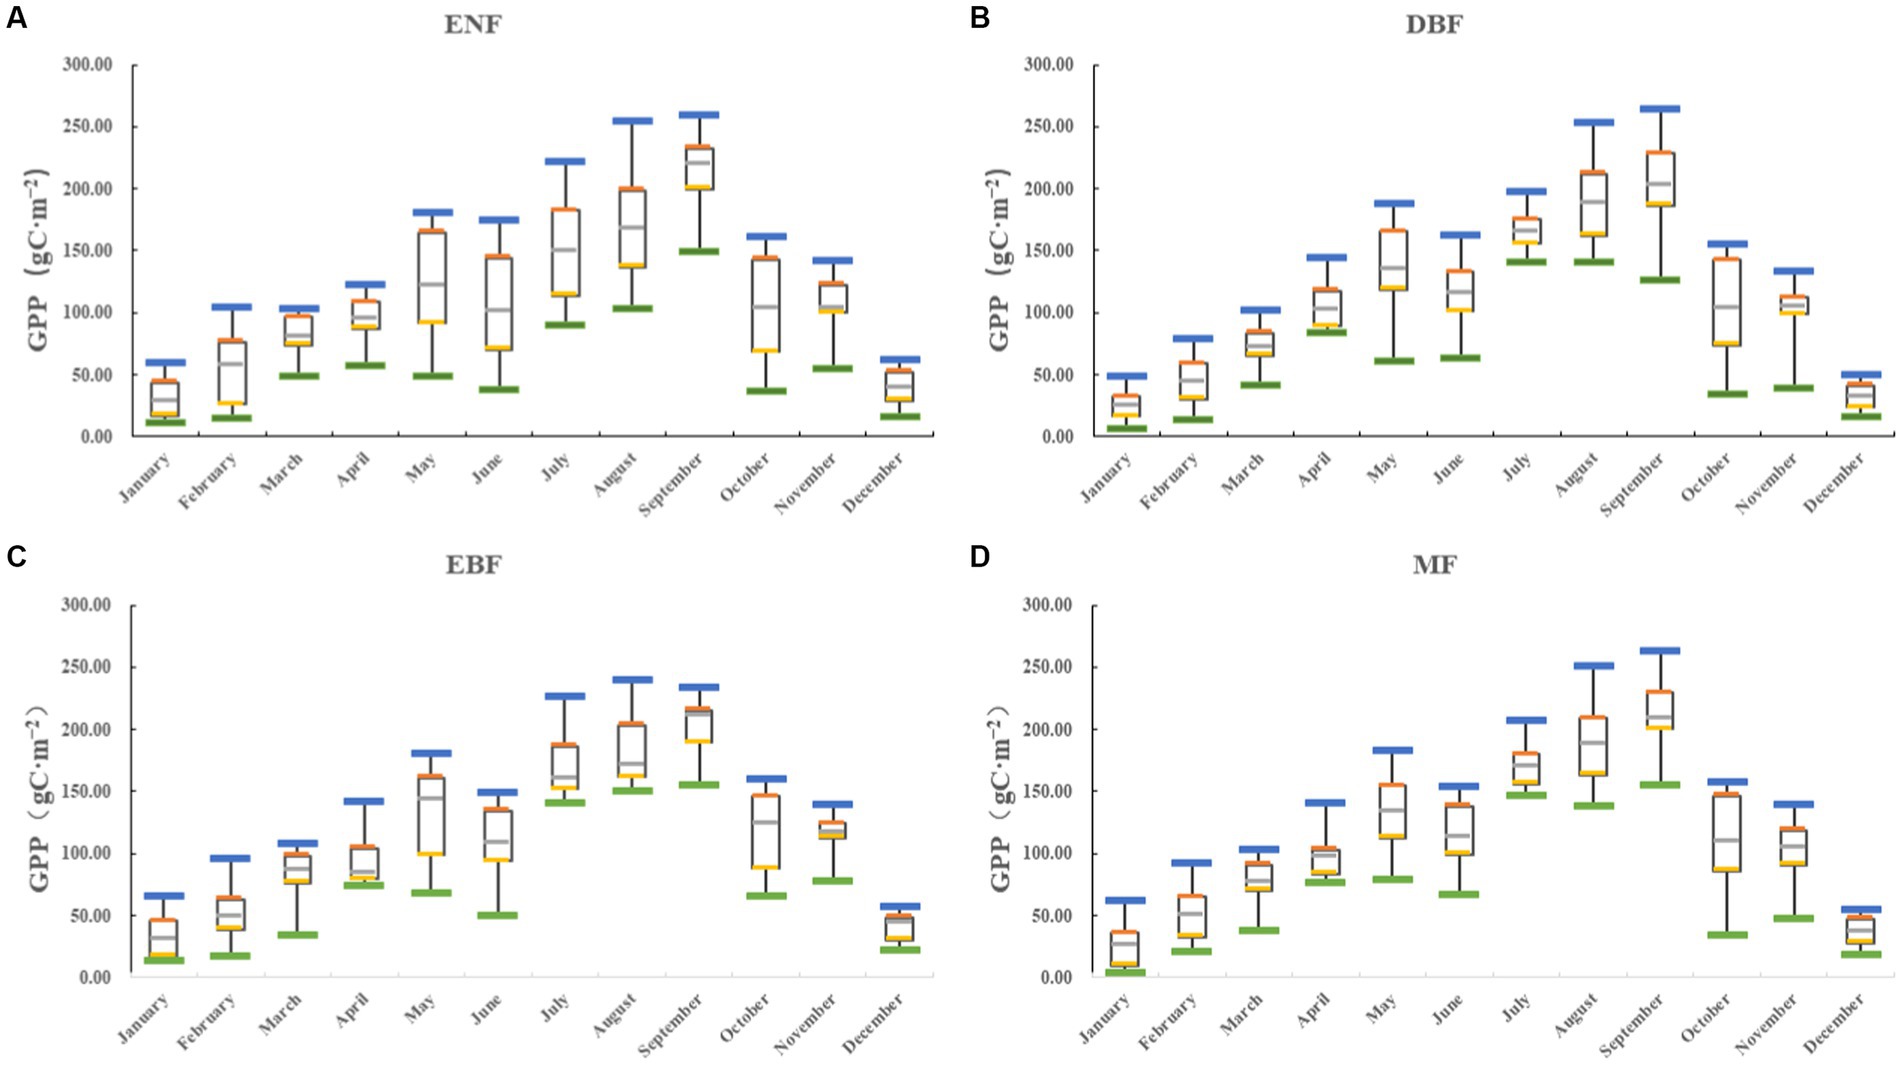
Figure 8. The variation patterns of multiyear monthly averaged GPP in four types of forest ecosystems in Qiannan from 2000 to 2020.
The spatiotemporal distribution of the forest ecosystem in this area was obtained by superimposing the four main vegetation types pixel by pixel. The annual average GPP change in the growing season (April–September) from 2000 to 2020 showed a slight downwards trend (−1.9 gC m−2 year−1) (Figure 9). The multiyear average GPP values in the growing season and nongrowing season were 887.0 ± 26.7 gC m−2 and 351.8 ± 17.0 gC m−2, respectively. The lowest growing/nongrowing season GPPs were 710.4 gC m−2 (2020) and 266.2 gC m−2 (2006), respectively. The increasing trend in GPP in forest ecosystems over the past 21 years was mainly due to the increase in GPP in the nongrowing season (October–March), because global warming, lead to an extension of the growing season. GPP in March and October each year exhibited a small increasing trend, indicating that the beginning of the growing season started earlier and that the end of the growing season was later.

Figure 9. GPP variation trends in the growing and nongrowing seasons.
4.2 Future trend of forest GPP in Qiannan
4.2.1 Analysis of the spatial trend of GPP from 2000 to 2020
The Sen-Trend of GPP from 2000 to 2020 was estimated to explore the change of GPP in Qiannan. The overall GPP showed significant increases from 2000 to 2020 (p < 0.05); the areas with increasing and decreasing trends accounted for 51.3 and 48.7%, respectively (Figure 10A). There was a large proportion of the area with a change rate between 0 and 17.7 gC m−2 year−1, and these areas were mainly in the middle part of Pingtang County, Huishui County and northwest Libo County. The regions with a GPP change greater than 17.7 gC m−2 year−1 accounted for 13.2% of the whole area, and these areas were mainly distributed around the edges in a belt-shaped spatial pattern. The regions with a rate less than −9.3 gC m−2 year−1 were almost negligible, and they were mainly distributed in the northwestern part of Duyun city, where only a small area showed serious ecological environmental degradation. In general, although there was little difference between the areas with increasing and decreasing GPP, the proportion of areas with increasing GPP was greater than that of areas with decreasing GPP, and the whole area showed an overall increasing GPP trend.
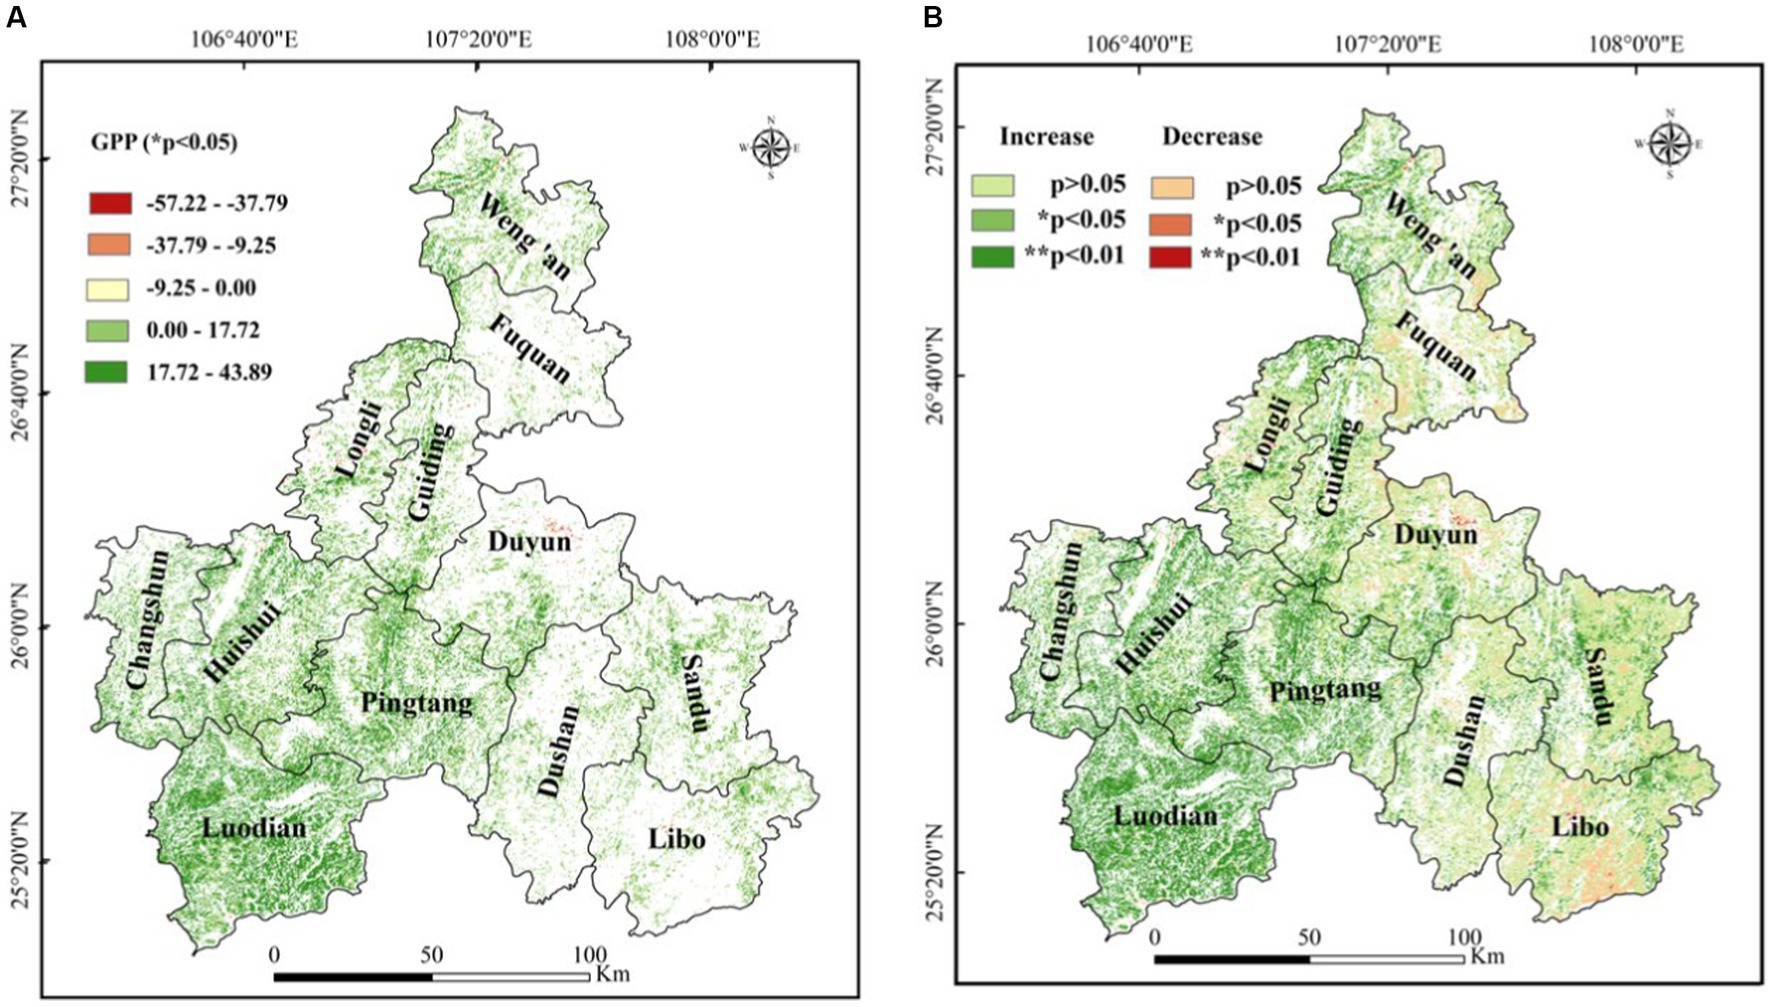
Figure 10. Spatial change trend of GPP (A) and its significance (B) in Qiannan during 2000–2020.
To further determine whether there was a significant trend in the above regions, we first conducted the Mann–Kendall (M-K) test and divided the results of the significance test into strong changes (p < 0.01), significant changes (0.01 ≤ p ≤ 0.05) and nonsignificant changes (p > 0.05). The change in GPP at the grid scale was calculated by overlaying the results of the Sen median with the significance results of the M–K test and further dividing the results into six levels (Figure 10B). The results demonstrated that the trend in GPP in most of Qiannan increased significantly biased from 2000 to 2020, and the areas with significant changes accounted for 52.3% of the whole study area. On the other hand, 47.8% of the areas exhibited an insignificant change, including 40.9% that exhibited an insignificant improvement and only 0.4% (northwest of Duyun city) that significant degradation. The areas with extremely significant increases were mainly in Luodian, Pingtang and Huishui Counties. The areas with significant increases in GPP were mainly distributed in the eastern part of the whole area. In general, the whole region showed a trend towards continuously increasing GPP improvement, and the trend in the west was greater than that in the east.
4.2.2 Trend of future changes in GPP in Qiannan
We estimated the Hurst index of GPP in Qiannan from 2000 to 2020 to estimate the future trend of environmental change. The Hurst index in Qiannan was between 0.12 and 0.85, and the mean Hurst index was 0.44 (Figure 11). The Hurst index was less than 0.50 in 72.3% of pixels in study area, indicating that the region where GPP switched frequently from high values to low values was larger than the area GPP values stayed high or low for longer periods of time. Pixels with Hurst index values between 0.43 and 0.48 accounted for 50.4% of the total, those with Hurst index values less than 0.48 accounted for 86.6%, and those with Hurst index values greater than 0.51 accounted for 7.1%. The regions with a low Hurst index (0.43–0.48) were mainly distributed in Luodian County, Huishui County, Changshun County and eastern Sandu County, whereas the regions with a high index values (0.51–0.85) were mainly distributed in central Pingtang County, northwestern Libo County and northwestern Luodian County. To better reveal the future trend and sustainability of GPP in Qiannan, this study overlaid the current GPP change trend and the Hurst index results. Approximately 5.3% of the study area is predicted to transition from degradation to improvement, especially in southern Libo County and on the edge of Guiding County and Duyun city. The areas with continuous improvement accounts for 18.7% of the total area, be distributed mainly in central Pingtang County, northwestern Libo County and northwestern Luodian County. Moreover, approximately 1.9% of the region exhibits a continuous decline of GPP. These phenomena illustrates that the trend will reverse in the future. Most show a trend of switching from improvement to degradation, which is basically in line with the fluctuation trend from 2016 to 2020.
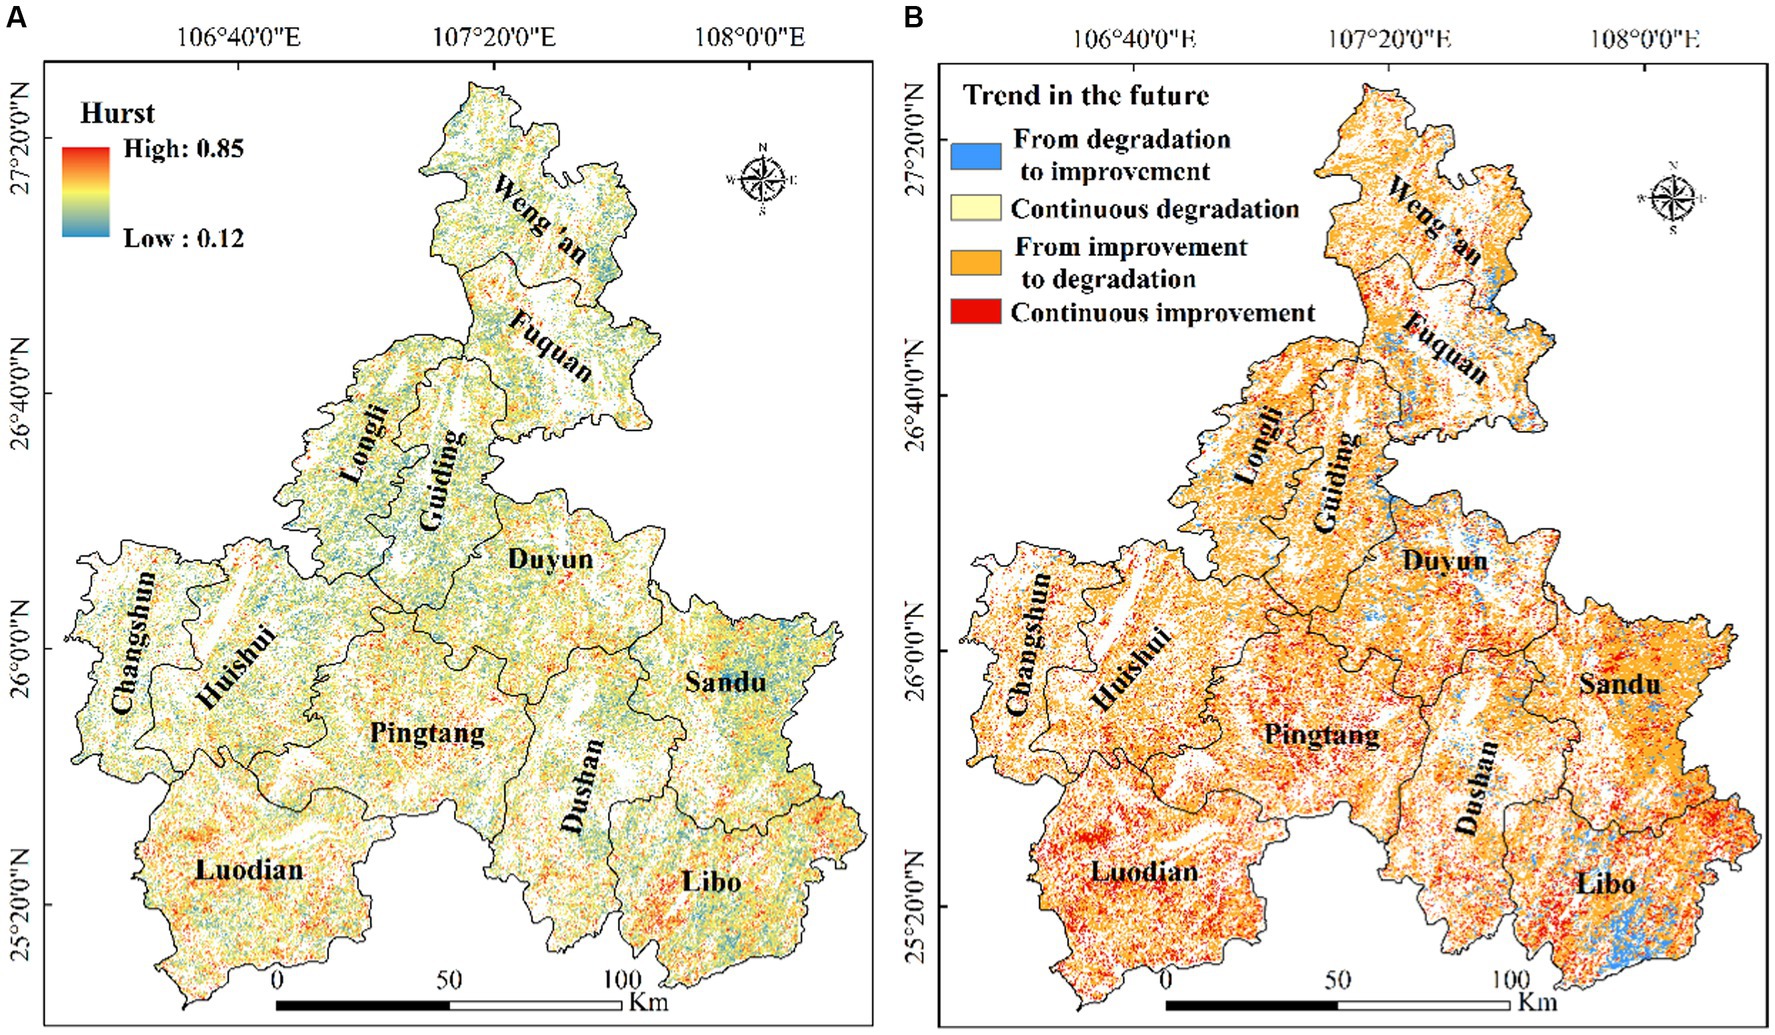
Figure 11. Hurst index and future trend of GPP in Qiannan during 2000–2020.
4.3 Spatiotemporal variability in GPP in response to climate factors
4.3.1 Spatial variations in GPP in response to temperature
The spatiotemporal variations in GPP in response to changing temperature were investigated, and the results showed that the partial correlation coefficient between GPP and temperature was between −0.578 and 0.863 (Figure 12A). A total of 64.1% of the study area was positively correlated with temperature. Further analysis revealed that the regions with a positive correlation with temperature were mainly distributed in high-elevation areas where the temperature was relatively low. Higher temperatures can promote photosynthesis, accelerate the growth of plants, and thus fix more CO2. The region with positive correlations were mainly in Changshun, Huishui, Sandu, and Libo Counties, while the areas with negative correlations were mainly concentrated in Guiding, Fuquan, and the northern part of Pingtang County. The region with the highest partial correlation coefficients (0.20–0.50) accounted for 53.8%, and these areas were mainly distributed in Longli, Pingtang, Huishui, Libo, northeastern Sandu County, and Duyun city. The region with the lowest partial correlation coefficients (−0.58 to −0.30) accounted for 33.8%, and these areas were mainly distributed in Fuquan, Changshun, and Dushan Counties. To determine whether there was a significant trend in the above areas, we first calculated the partial correlation coefficients for the whole region, the results of the significance test were divided into significant values and nonsignificant values; with a confidence level was 0.05 (Figure 12B). Specifically, the percentage of pixels with of strong positive correlation was 4.3%, and the correlation was mainly distributed in Luodian County, which was related to the rapid increase in forests in Luodian County. However, the percentage of pixels with strong negative correlation was only 0.9%. In summary, forest GPP in the study area was positively correlated with temperature. This was also consistent with the results of Yang (2009), who studied the response of primary productivity to climate change in Guizhou Province, and of Gao et al. (2022), who studied the response of GPP to climate change in China.
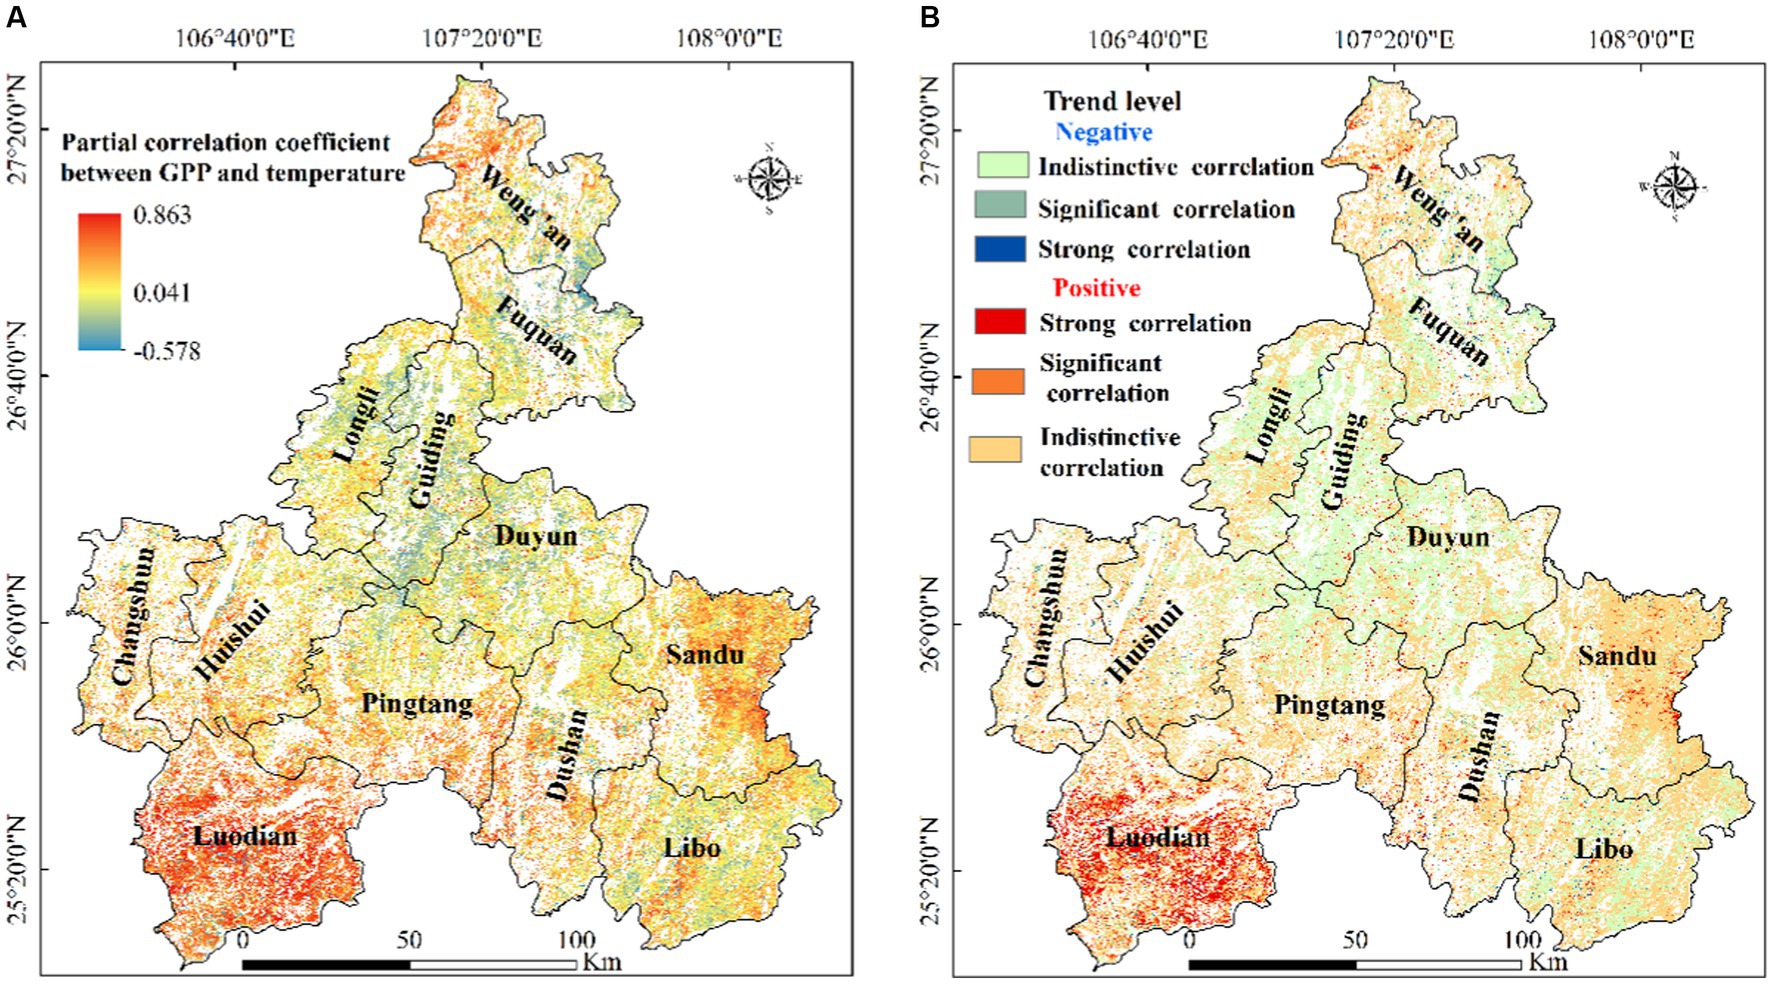
Figure 12. The partial correlation coefficients between GPP and temperature (A) and the degree of significance (B) in Qiannan.
4.3.2 Spatial variations in GPP in response to precipitation
The partial correlation coefficients between GPP and precipitation ranged from −0.6 to 0.8 (Figure 13A), and the area with a positive correlations accounted for 70.5% of pixels; these areas were distributed mostly in Pingtang, Guiding, Longli and Sandu Counties. The regions with negative correlations accounted for 29.6% of the total area and were mainly distributed in the southern part of Dushan County, the southwestern part of Libo County and a small part of Luodian County. Only 6.8% of pixels in the area passed the significance test, yielding 5.8% of the study area with significant positive values, and these areas were mainly distributed in Fuquan city and Weng’an County (Figure 13B). Overall, there was no significant positive correlation between change in GPP and temperature or precipitation. The partial correlation coefficients were 0.10 (p < 0.05) and 0.11 (p < 0.05), respectively. These findings indicate that the impact of temperature on GPP change was slightly weaker than that of precipitation, which was similar to the results of other studies (Wang et al., 2021; Yang, 2022).
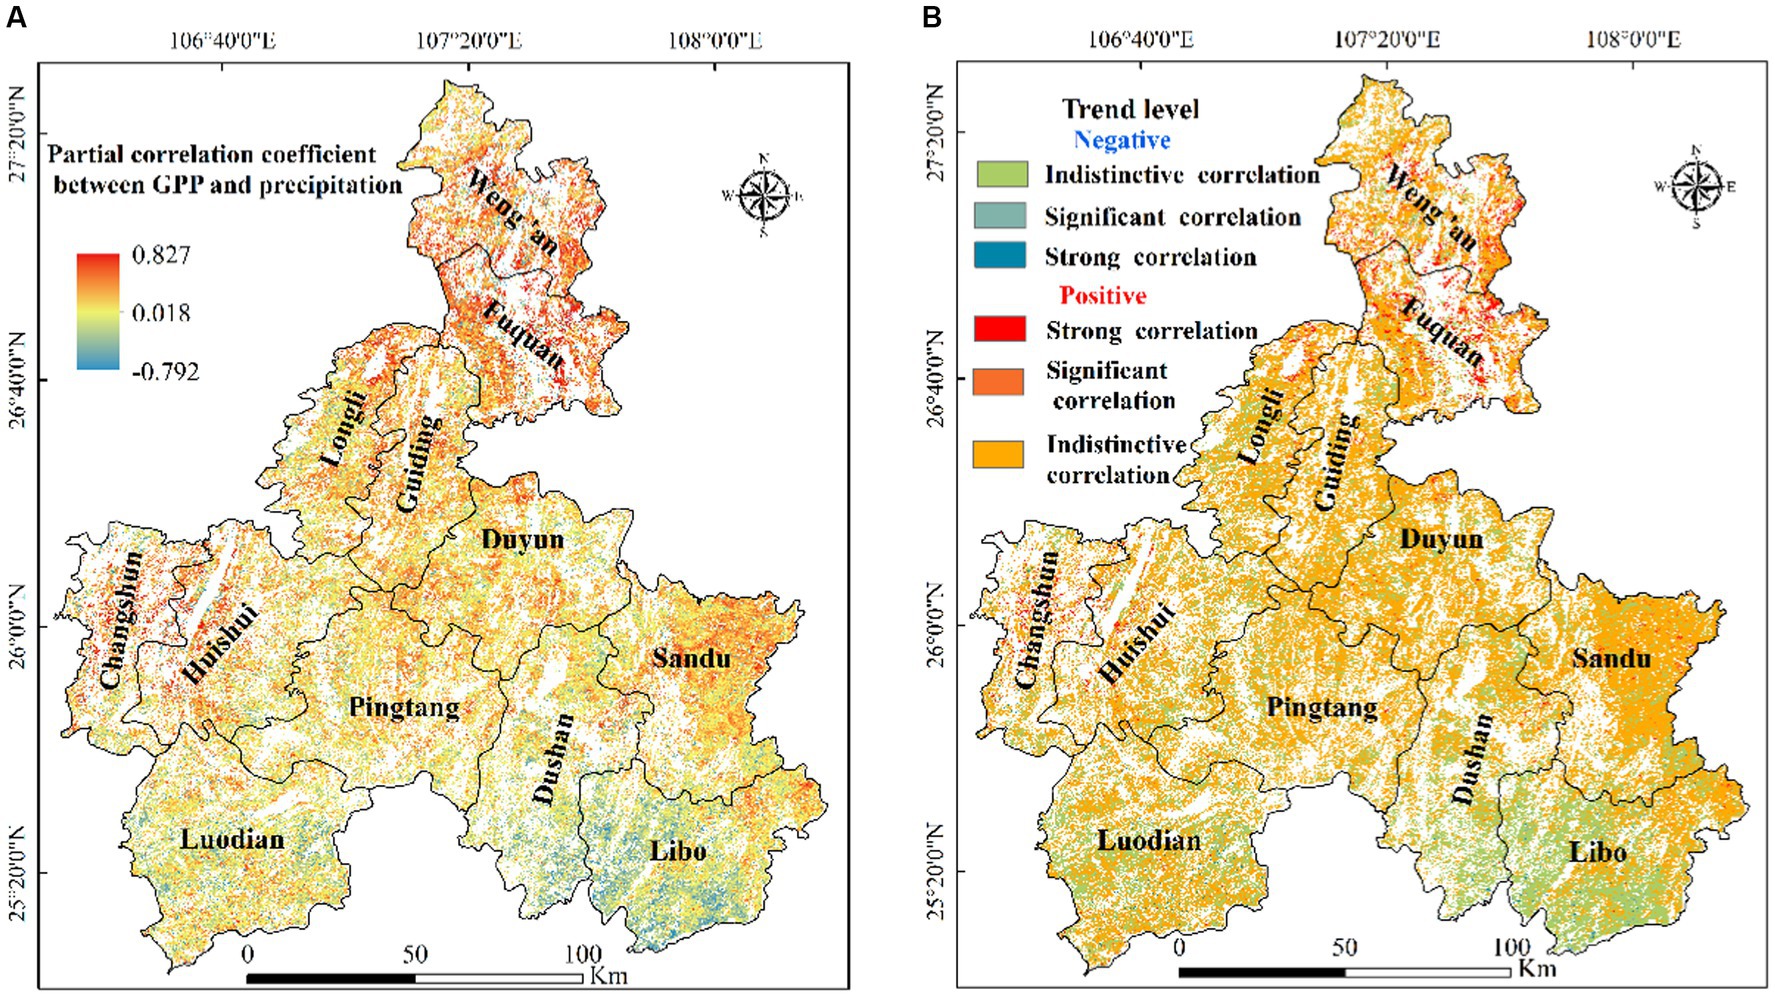
Figure 13. Spatial variability in the partial correlation coefficient between GPP and precipitation (A) and their correlation significance (B) in Qiannan.
4.3.3 Spatial variations in GPP in response to VPD
We further examined the partial correlation coefficient between the GPP and VPD. The results showed that the partial correlation coefficient between GPP and VPD was between −0.9 and 0.8 (Figure 14A). A total of 48.6% of pixels in the areas exhibited a positive correlations, 85.6% were not significant (mainly distributed in Guiding, Longli and Huishui Counties). A total of 51.4% of pixels in the areas exhibited a negative correlation of which 91.1% were not significant and were mainly distributed in Luodian, Pingtang, Dushan and Libo Counties. In these areas, the vegetation GPP decreased with increasing VPD, indicating that water shortage had an inhibitory effect on GPP. In addition, 3.9% of the area exhibited a significant negative correlation (p < 0.05), and 3.2% exhibited a strong negative correlation (p < 0.01) (Figure 14B). In general, the correlations between the GPP and VPD were mainly distributed in the north, which was almost consistent with the conclusions of other scholars studying the relationship between GPP and VPD. The influence of the VPD on the spatiotemporal distribution of GPP was different from that of temperature and precipitation because the exhibited more regular differences in spatial distribution, with a negative correlation in the southern region. The spatial pattern of a positive correlation in the northern region was mainly caused by the difference in vegetation distribution and the application strategy of water and temperature (Hou et al., 2022). Overall, the correlation between the GPP and VPD changes was not significantly negative (p > 0.05), and the significance decreased from the northern to central areas and from the southern to central areas.
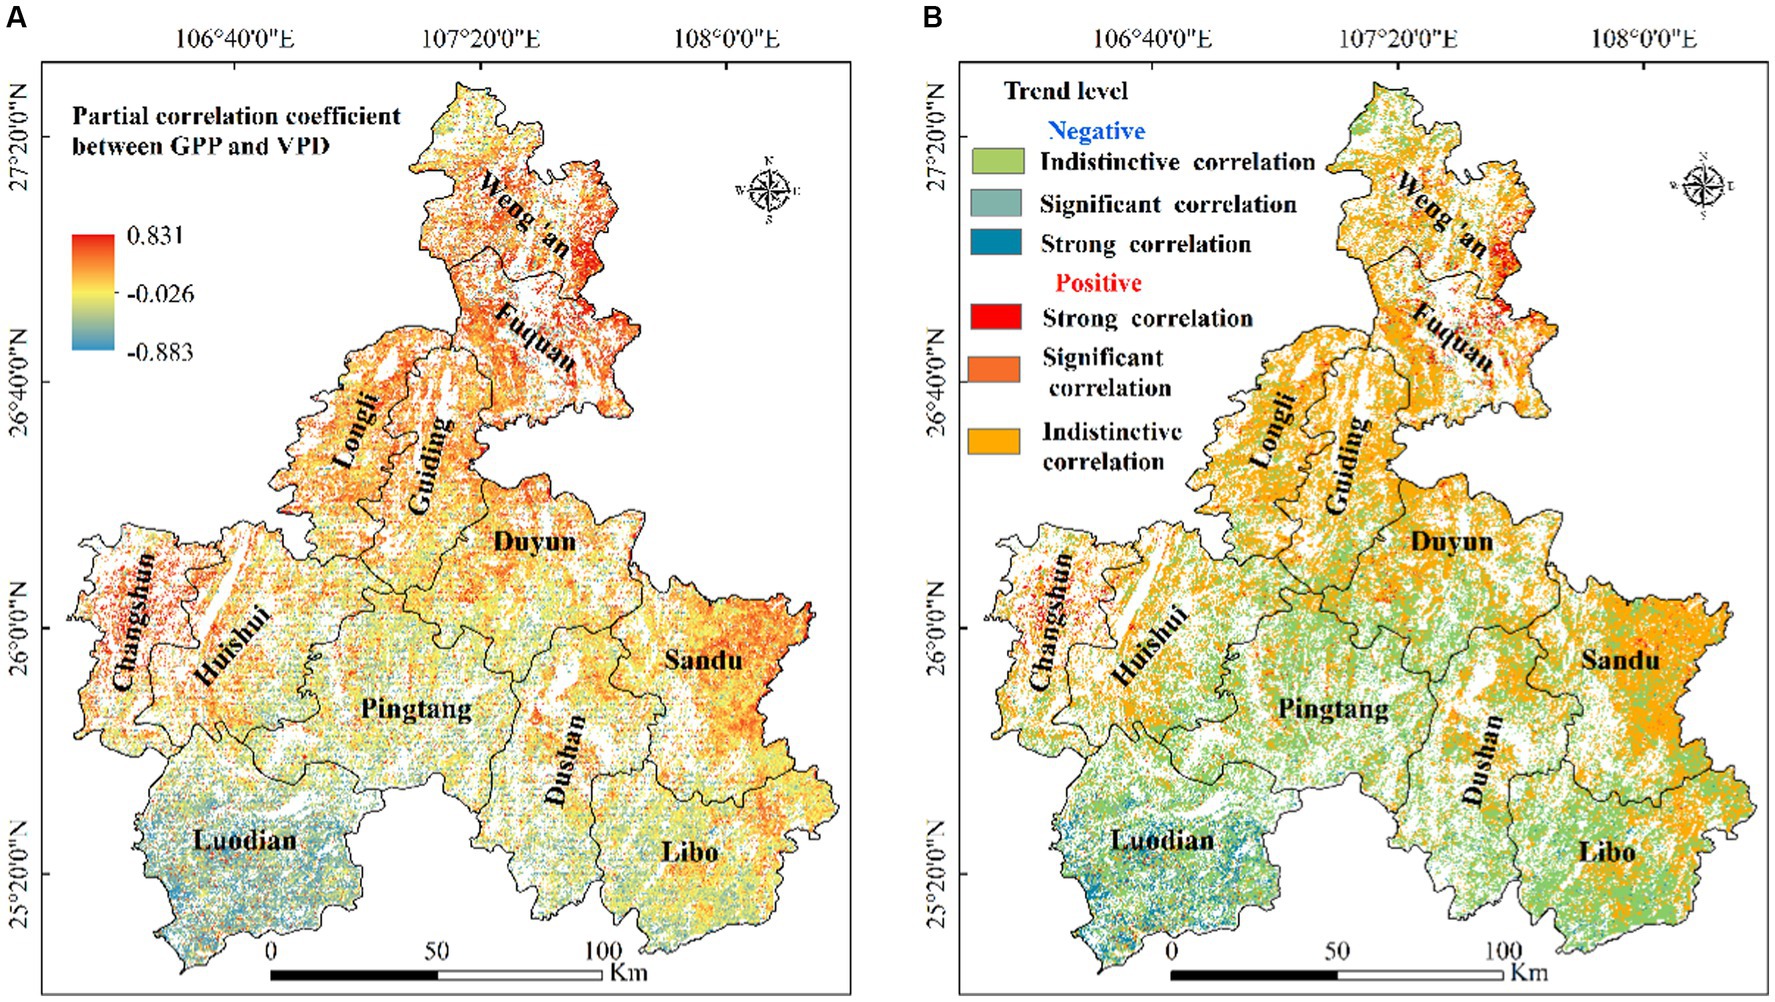
Figure 14. Spatial variability in the partial correlation coefficient between GPP and VPD (A) and their significance (B) in Qiannan.
5 Discussion
Qiannan is a typical forest ecosystem. In recent years, the continuous increase in forest coverage has had many beneficial effects on carbon absorption in this region. Considering the important ecological status, we estimated the GPP in the region from 2000 to 2020 and analysed the spatiotemporal distribution of GPP in this region and its response to climate change. These results provide support for carbon absorption assessment and forestry resource management under global climate change in the future. Also can helps us meet the goal of “carbon peak, carbon neutral” and provide data and suggestions for the development of carbon neutral accounting and the formulation of local carbon emission reduction policies.
5.1 Spatiotemporal distribution of GPP in Qiannan
The GPP in Qiannan has increased over time, reflecting the effect of returning farmland to forest for ecological restoration (Zhang et al., 2021). Forest GPP in the growing season was greater than that in the nongrowing season. The increase in GPP was mainly due to the increase in GPP in the nongrowing season (Figure 8), possibly because climate change caused the growing season to start earlier or end later, leading to an increase in GPP during the nongrowing season. The GPP in October was still at a medium-high level (Figure 7), which supports the view that the growing season was prolonged. In 2001, China launched two Eastern Ecological Protection Projects and the Western Natural Forest Protection Project to return farmland to forests. At first, the area of arable land increased, and the area of forest decreased until 2006. After 2006, the ecological projects began to pay off, as the area of arable land decreased and the area of forest increased, which is consistent with the results of previous studies (Xu et al., 2019). After the drought in 2010, there was a certain drought legacy effect that was similar to the results of Frank et al. (2015).
This may be because precipitation was not a limiting factor at the beginning of the drought, and plants were able to utilize water retained in the soil or groundwater, even though precipitation greatly decreased. DBF had the fastest growth rate among the four vegetation types, with an increase of 8.7 gC m−2 year−1. The growth rate of GPP in the four forest types was consistent with the results of a study in Southwest China (Shao, 2021). The main reason for this result is that DBF can increase its GPP during a longer growing season caused by climate change, while leaf loss in the nongrowing season can reduce forest respiration. Furthermore, the growth of young leaves can maintain a higher LUE. These findings are consistent with the view that the photosynthetic use efficiency of DBF is higher at the beginning of the growing season (Wu et al., 2016; Wei et al., 2017). Compared with those in other forest types, ENF had the greatest interannual fluctuations in GPP. Although it is the vegetation type with the lowest average annual growth rate among the four plant cover types, the maximum average annual growth rate of this vegetation type in the past 21 years was 1,554 gC m−2 year−1 in 2013. The main reason for this result was that during the 2011 drought event, the ENF effectively reduced water consumption and maintained relatively stable photosynthetic rates by adjusting plant water distribution. After the improvement of water and heat conditions, plants quickly resumed normal photosynthetic rates. It is likely the undecomposed layer of evergreen coniferous forest litter has a higher water retention rate than the litter layers of other forest types (Yang et al., 2014). In arid or semiarid regions, the response to reduced precipitation is less pronounced (Zhang, 2011). The specific changes are shown in Table 2.
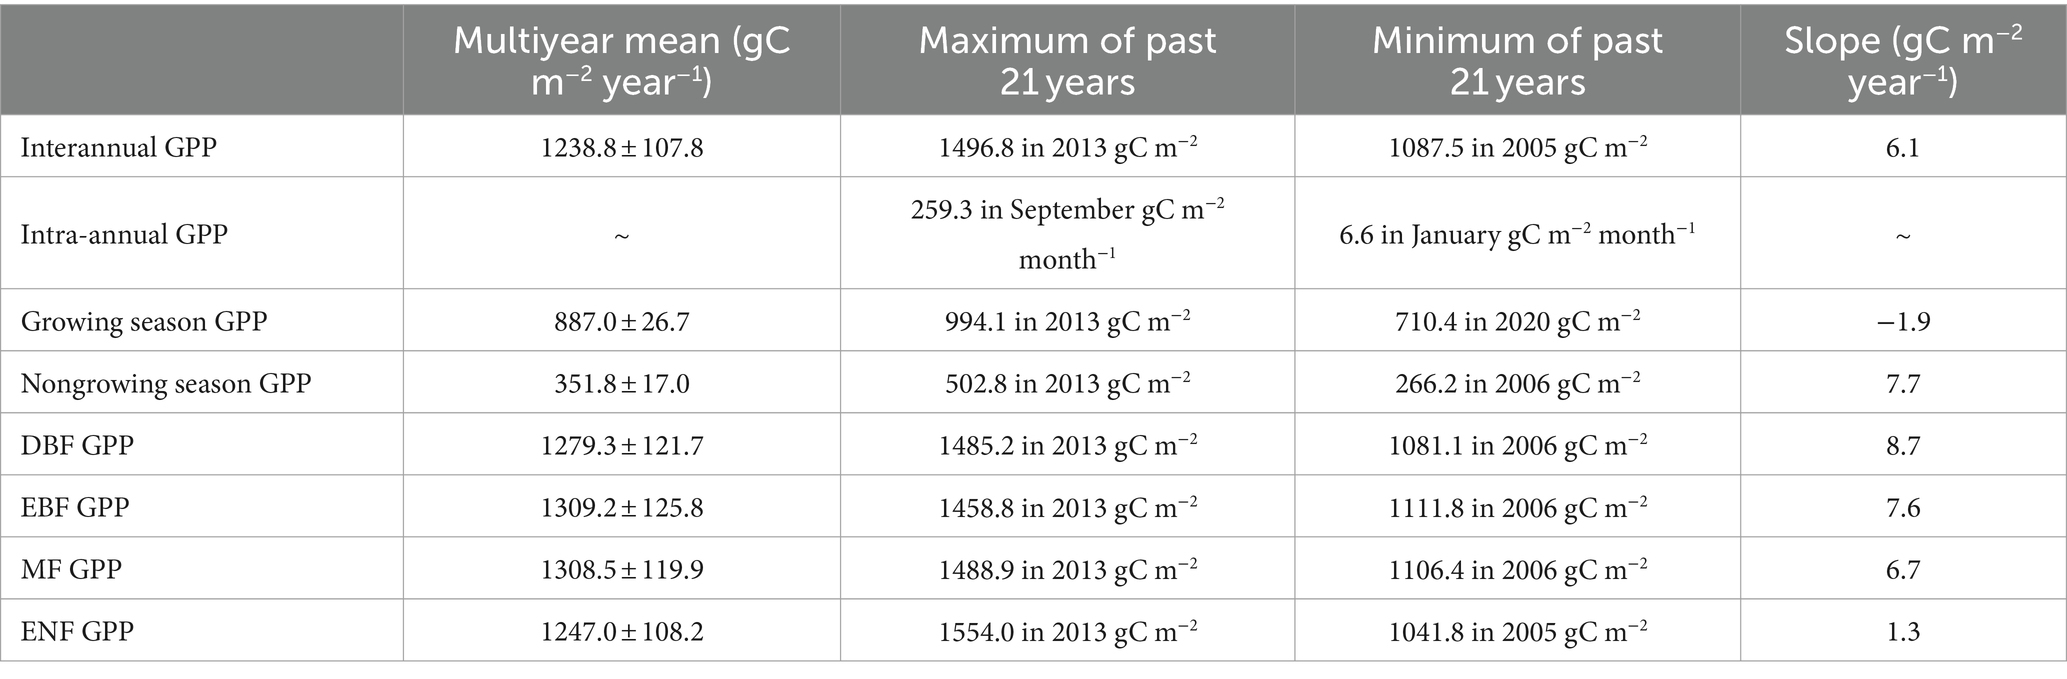
Table 2. Changes in GPP at different time scales over the past 21 years.
5.2 Changes and future trends in GPP
GPP in Qiannan was higher in the southeast and lower in the northwest. These areas are covered by EBF, DBF and MF. The humid monsoon climate and good hydrothermal conditions of the study area in the subtropical humid zone favours the growth of vegetation. However, the ecological environment in many areas exhibited a weak downward trend. Most of the decline in GPP was due to declines in vegetative cover. For example, the area of green vegetation in Qiannan showed a downward trend from 2000 to 2006, and the fluctuation in the area of green vegetation coverage was more noticeable after 2006. Afforestation in most locations has increased the area of needle-leaf forest, but the area of some broadleaf forests has decreased, resulting in a relative decrease in forest GPP. The areas where GPP increased significantly over the past 21 years were mainly distributed in western Qiannan, where the forest cove increased significantly after 2010. From 2000 to 2020, the GPP exhibited an increasing trend. However, based on our use of the Hurst index to predict the change trend in GPP, we found that in the future, most areas will no longer maintain a high rate of increase in GPP. We speculate that (1) the capacity of water and availability to support GPP in this area will gradually reach saturation (Xu et al., 2020). (2) The dividend of GPP growth resulting from the rapid of forest area in Qiannan over the past 21 years will be weakened, indicating that GPP production will reach a threshold and will not increase indefinitely with increasing forest area.
5.3 GPP response to climate change
To investigate the influence of meteorological factors on GPP, we analysed the spatial and temporal characteristics of three climate factors considered to affect vegetative growth in the natural environments (Ma et al., 2019; Ren et al., 2020; Tripathi et al., 2020). At present, the main climate factors affecting GPP are controversial but often include temperature and precipitation. Most studies show a stronger correlation between precipitation and primary productivity than between precipitation and temperature (Nemani et al., 2003; Tian Y. et al., 2019; Wang et al., 2021), but other studies have shown a stronger correlation between temperature and GPP (Wen and Fu, 2001; Li et al., 2006; He et al., 2007). There are two main reasons for this difference. On the one hand, the duration of study differs; on the other hand, the methods used to obtain the data also differ. However, studies on the correlation between water vapour pressure and GPP in Qiannan are rare. The VPD is an important input parameter of the P model. In this study, temperature, precipitation and VPD were selected as the main climate factors for studying the response of spatial and temporal changes in GPP to each climate factor.
The results showed that temperature was positively correlated with GPP change in 2000–2002 and 2010–2017, precipitation was positively correlated with GPP change in 2001–2009 and 2014–2019, and VPD was significantly negatively correlated with GPP change in 2004–2009 and 2016–2020. These results may demonstrate the sensitivity of GPP to precipitation and temperature. The GPP generally increased under wet conditions and declined under dry conditions, which is consistent with the results of previous studies at regional and global scales (Kwon and Larsen, 2013; Zhang et al., 2014; He et al., 2018). Previous research has indicated that variation in GPP will depend on water availability in the future, especially in tropical and temperate (humid and semihumid) climates (Kayiranga et al., 2020, 2021a,b). Generally, variation in global temperature affect both photosynthesis and autotrophic respiration (Giardina et al., 2003). Previous research has suggested that autotrophic respiration of vegetation increases exponentially with absorbed water (precipitation) and temperature (Gifford, 2003; Jeong et al., 2017). Hence, autotrophic respiration can be considered to increase proportionally with increasing GPP. Precipitation in Qiannan was the main climatic factor affecting GPP change because the range of temperatures in Qiannan was small, only approximately 4°C, while the precipitation change was more remarkable, reaching 260.19 mm. When temperature fluctuations are not large, precipitation naturally becomes the dominant influence on GPP change in this region. Generally, high temperatures indirectly cause damage to plants by increasing the VPD, making the air drier and decreasing the vegetation photosynthetic capacity, thereby reducing the GPP output. However, as a typical karst geological and geomorphological area, the unique geological structure of the Qiannan region in Guizhou leads to severe soil moisture loss. Other studies have also shown that under a low soil moisture supply (Meng et al., 2020), there is a significant negative correlation between the VPD and GPP. Our research revealed that there was no significant negative correlation between GPP and VPD, which may be due to the gradual increase in VPD caused by the simultaneous increase in summer rain and high temperatures. However, at this time, a high VPD also promoted vegetation’s ability to absorb carbon dioxide, as the GPP increased with increasing VPD, which was a positive correlation. However, in the other three seasons, it inhibited the absorption of carbon dioxide, especially in winter, when there was a negative correlation. Both within and between years, in karst landforms with a low soil moisture supply, there was almost no significant negative correlation between GPP and VPD. Vegetation growth is also constrained by the length of the growing season. Higher precipitation rates and increasing temperatures could extend the growing season length and significantly increase GPP (Figures 8, 15) (Kang et al., 2016). In the rainy season, the sensitivity of GPP to temperature increases, while the respiration decreases (Wang, 2015). This argument was clearly supported by our results, in which the highest GPP values from the modelled GPP were obtained during the rainy season, indicating that the vegetation productivity could reach its maximum only when the hydrothermal conditions were optimal.
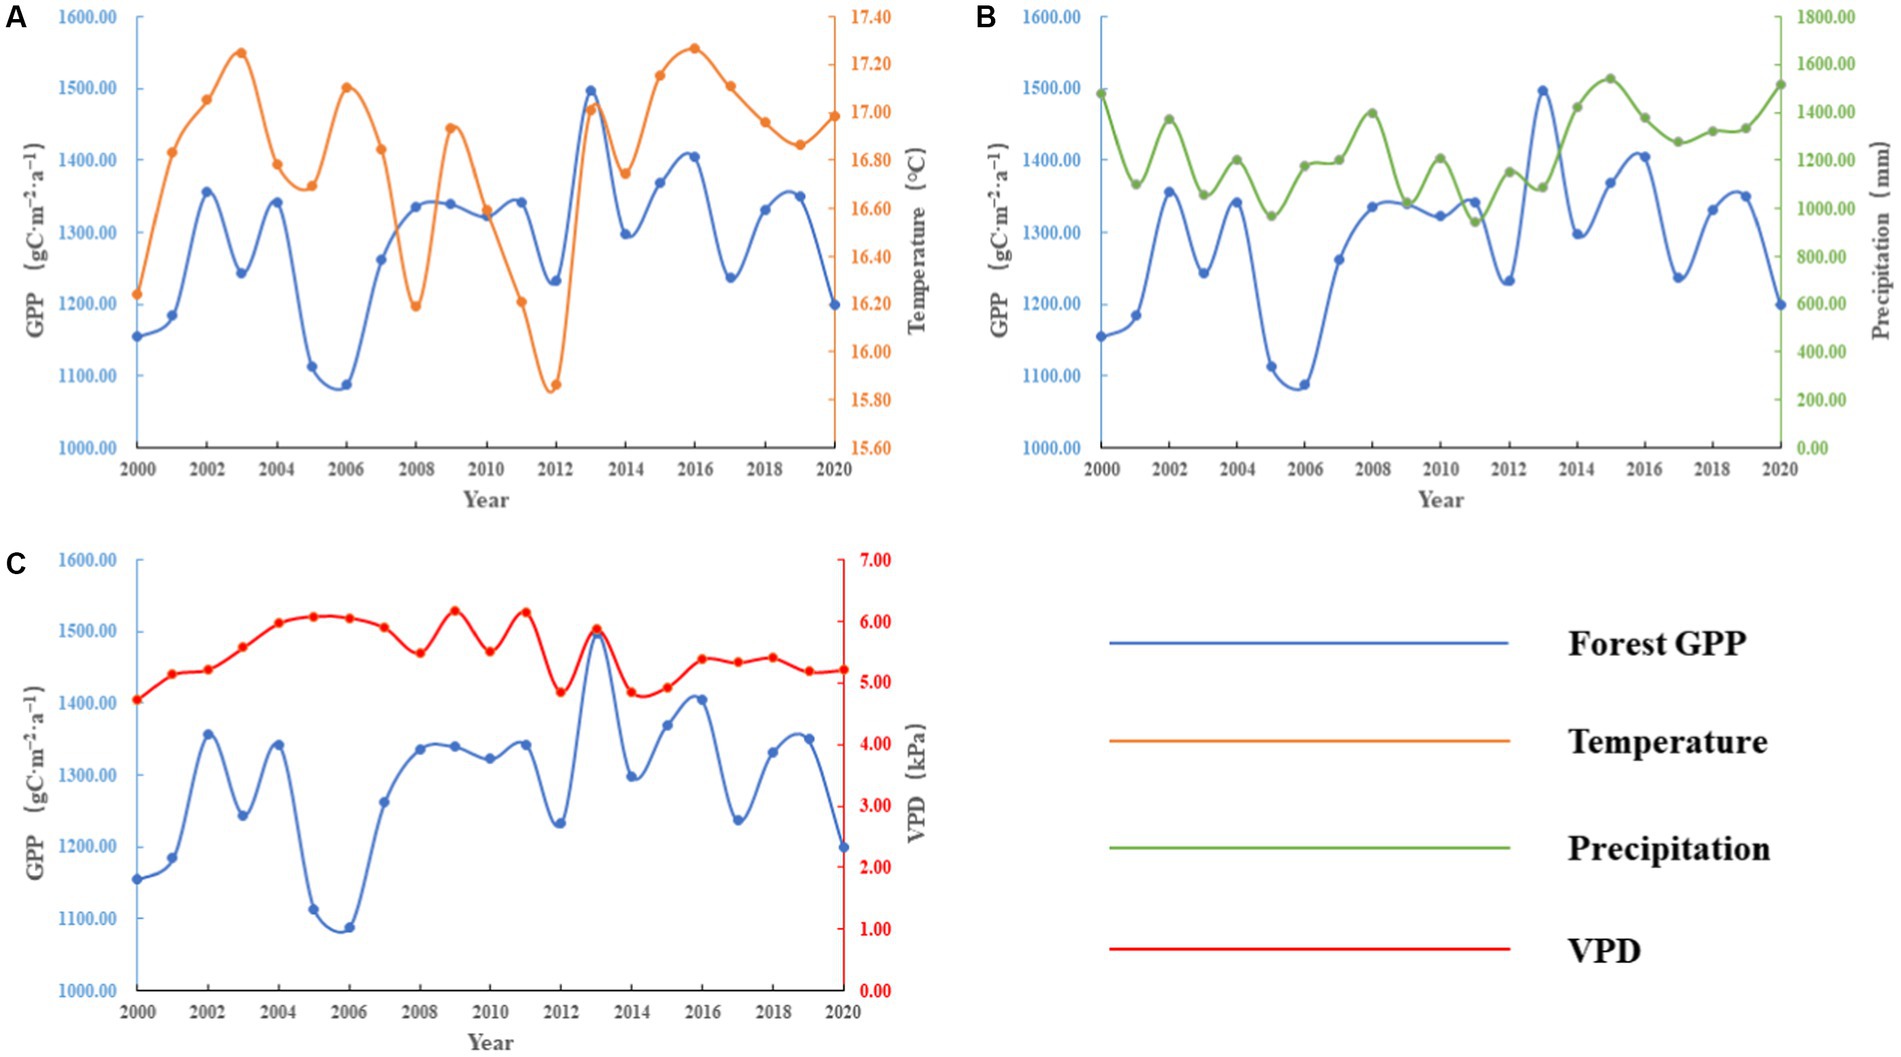
Figure 15. Comparison of temporal variations in GPP and climate factors. (A) The annual mean temperature, (B) the annual mean precipitation, (C) the annual mean VPD and (D) the annual mean GPP.
6 Conclusions and prospects
6.1 Conclusion
Based on remote sensing, meteorological and phenological data, the verified P model was applied to estimate the GPP of terrestrial ecosystems in Qiannan from 2000 to 2020. The LUCC data used to determine the composition of the vegetation, the data included four vegetation types. The results showed that the total amount of GPP in Qiannan was 1.9 × 10⁴ ± 2.1 × 10³ MgC ha−1 year−1, and the annual average GPP was 1238.8 ± 107.8 gC m−2 year−1 over the last 21 years; the highest value was 1496.8 gC m−2 year−1, which occurred in 2013, with an average rate of 6.1 gC m−2 year−1 (especially during the periods 2005 to 2008 and 2011 to 2013). GPP showed a slow positive trend, although there were several fluctuations, such as sharp declines in 2003–2005 and 2008–2013, due to the impact of drought. Furthermore, GPP in Qiannan showed a gradual decreasing trend from south to north and from east to west.
The Sen–Mann–Kendall trend and Hurst index demonstrated that the overall GPP presented a nonsignificant increasing trend from 2000 to 2020. Only 19.46% of the area still exhibited a significant increasing trend (mainly in southern Huishui County, Sandu County and the middle and eastern parts of Libo County). In the future, the area of Qiannan with a decline in GPP will be larger than those with an increase in GPP regions undergoing continuous declines and continuous increases in GPP will account for 2.9 and 18.7%, respectively, of the total area, and these areas are distributed in Luodian County and southwestern Libo County. Finally, the temperature and precipitation in the study areas had similar positive impacts on GPP, while the influence of VPD on the trend in GPP showed a large area with a negative correlation, which indicated that a changing climate (i.e., warming, drought) may weaken forest GPP and carbon sequestration.
6.2 Prospects
(1) Currently, remote sensing data are uncertain, which may be due to the ageing of sensors or interference from influential factors such as cloud cover, which may affect the accuracy of the upstream input data of the model. As a result, the model simulation results differ. Moreover, the model parameterization scheme needs to be optimized according to the actual situation of in different research areas. This study lacked actual monitoring data in the study area. Instead, MODIS GPP products and flux GPP data from stations in the same climate region were used to verify the accuracy of the model. In future research, it is necessary to continuously improve/optimize the model parameters and perform inversion estimations based on the development of multidata fusion, multimodal coupling and machine learning combined with measured data, which are popular research hotspots to topics for further improving the ability of model inversion to estimate vegetation GPP. As a result, uncertainties associated with the inputs to the LUE model may create sub-optimal performance or mismatch problems in the model parameter tuning and may slightly affect the GPP results of the simulation in some ways. These uncertainties might be avoided when better cloud screening, composite techniques, full spectral coverage, higher resolution and field-based datasets are available to the public in future studies (Kayiranga et al., 2020, 201b).
(2) In this paper, the partial correlation coefficient was used to reveal the response of GPP to changes in climate factors. In fact, GPP was not affected by a single climate factor but by the interaction of multiple factors, including not only temperature, precipitation and VPD but also common effects such as radiation and soil nutrients. In subsequent work, as many drivers as possible should be considered, as well as data relevant to national policies (Xu et al., 2021).
(3) There are limitations to any research, and in future research, we hope that scholars can delve deeper into the mechanism of GPP spatiotemporal changes in GPP in response to climate factors. In the process of photosynthesis, understanding how various factors promote/restrict chloroplast activity for photosynthesis can be further expanded from individual mechanism research to ecosystem research. Based on these findings, effective estimates of light energy utilization efficiency and the vegetation canopy photosynthetic radiation absorption ratio can be determined, further to further improve the accuracy of the model simulation and involve all vegetation types as much as possible to achieve accurate estimations of regional/global GPP.
Data availability statement
The original contributions presented in the study are included in the article/supplementary materials, further inquiries can be directed to the corresponding author.
Author contributions
ZL: Data curation, Formal analysis, Funding acquisition, Software, Writing – original draft, Writing – review & editing. X-HF: Writing – original draft, Writing – review & editing. BZ: Methodology, Visualization, Writing – review & editing. JZ: Investigation, Validation, Writing – review & editing. HJ: Data curation, Project administration, Writing – review & editing. WC: Formal analysis, Resources, Writing – review & editing. RC: Methodology, Writing – review & editing. PX: Validation, Writing – review & editing. WL: Writing – review & editing.
Funding
The author(s) declare financial support was received for the research, authorship, and/or publication of this article. This study was supported by the Science and Technology Research Project of Guizhou Province, China [Qian Kehe Foundation (2020)1Y073]; the Guizhou Provincial Science and Technology Development Project [QKZYD (2022)4022]; the National Natural Science Foundation of China (32160290); the Science and Technology Planned Project in Guizhou Province [Qian Kehe Support (2022) General 209]; the Cultivation Project of Natural Science of Guizhou University, China [(2019)69]; the Opening Fund for Guizhou Province Key Laboratory of Ecological Protection and Restoration of Typical Plateau Wetlands [No. Bikelianhezi Guigongcheng (2021)07]; the Special Research Fund of Natural Science (Special Post) of Guizhou University, China [(2018) 29]; and Open Project of Guizhou Provincial Double Carbon and Renewable Energy Technology Innovation Research Institute (DCRE-2023-10).
Acknowledgments
The authors thank all the staff and technicians of the Guizhou Libo Observation and Research Station for Karst Forest Ecosystem, the Guizhou Karst Environmental Ecosystems Observation and Research Station, the Ministry of Education, and the Ailaoshan Station for Subtropical Forest Ecosystem Studies for their invaluable contributions to the maintenance, fieldwork and data collection of the instruments.
Conflict of interest
The authors declare that the research was conducted in the absence of any commercial or financial relationships that could be construed as a potential conflict of interest.
Publisher’s note
All claims expressed in this article are solely those of the authors and do not necessarily represent those of their affiliated organizations, or those of the publisher, the editors and the reviewers. Any product that may be evaluated in this article, or claim that may be made by its manufacturer, is not guaranteed or endorsed by the publisher.
Footnotes
References
Beer, C., Reichstein, M., Tomelleri, E., Ciais, P., Jung, M., Carvalhais, N., et al. (2010). Terrestrial gross carbon dioxide uptake: global distribution and covariation with climate. Science 329, 834–838. doi: 10.1126/science.1184984
Chapin, F. S., Woodwell, G. M., Randerson, J. T., Rastetter, E. B., Lovett, G. M., Baldocchi, D. D., et al. (2006). Reconciling carbon-cycle concepts, terminology, and methods. Ecosystems 9, 1041–1050. doi: 10.1007/s10021-005-0105-7
Du, W., Sun, S., Wu, Y., and Song, Z. (2020). The responses of gross primary production of drought in terrestrial ecosystems of China during 1980–2013. Chin. J. Ecol. 39, 23–35. doi: 10.13292/j.1000-4890.202001.011
Fernández-Martínez, M., Vicca, S., Janssens, I. A., Sardans, J., Luyssaert, S., Campioli, M., et al. (2014). Nutrient availability as the key regulator of global forest carbon balance. Nat. Clim. Change 4, 471–476. doi: 10.1038/nclimate2177
Frank, D., Reichstein, M., Bahn, M., Thonicke, K., Frank, D., Mahecha, M. D., et al. (2015). Effects of climate extremes on the terrestrial carbon cycle: concepts, processes and potential future impacts. Glob. Change Biol. 21, 2861–2880. doi: 10.1111/gcb.12916
Friedlingstein, P., Cox, P., Betts, R., Bopp, L., von Bloh, W., Brovkin, V., et al. (2006). Climate-carbon cycle feedback analysis: results from the C4MIP model intercomparison. J. Clim. 19, 3337–3353. doi: 10.1175/JCLI3800.1
Gao, Z., Jian, Y., Huiren, D., Tang, H., Zhou, H., Li, C., et al. (2022). Response of vegetation gross primary productivity to climate change in China. Res. Soil Water Conserv. 29, 394–414. doi: 10.13869/j.cnki.rswc.2022.04.012
Gerlitz, J.-Y., Macchi, M., Brooks, N., Pandey, R., Banerjee, S., and Jha, S. K. (2017). The multidimensional livelihood vulnerability index—an instrument to measure livelihood vulnerability to change in the Hindu Kush Himalayas. Clim. Dev. 9, 124–140. doi: 10.1080/17565529.2016.1145099
Giardina, C. P., Ryan, M. G., Binkley, D., and Fownes, J. H. (2003). Primary production and carbon allocation in relation to nutrient supply in a tropical experimental forest. Glob. Change Biol. 9, 1438–1450. doi: 10.1046/j.1365-2486.2003.00558.x
Gifford, R. M. (2003). Plant respiration in productivity models: conceptualisation, representation and issues for global terrestrial carbon-cycle research. Funct. Plant Biol. 30, 171–186. doi: 10.1071/FP02083
Guanter, L., Zhang, Y., Jung, M., Joiner, J., Voigt, M., Berry, J. A., et al. (2014). Global and time-resolved monitoring of crop photosynthesis with chlorophyll fluorescence. Proc. Natl. Acad. Sci. U.S.A. 111, E1327–E1333. doi: 10.1073/pnas.1320008111
He, Y., Dong, W., Guo, X., and Dan, L. (2007). The terrestrial growth and its relationship with climate in China based on the MODIS data. Acta Ecol. Sin. 27, 5086–5092. doi: 10.1016/S1872-2032(08)60015-3
He, Y., Piao, S., Li, X., Chen, A., and Qin, D. (2018). Global patterns of vegetation carbon use efficiency and their climate drivers deduced from MODIS satellite data and process-based models. Agric. For. Meteorol. 256–257, 150–158. doi: 10.1016/j.agrformet.2018.03.009
Hou, Q., Pei, T., Yu, X., Chen, Y., Ji, Z., and Xie, B. (2022). The seasonal response of vegetation water use efficiency to temperature and precipitation in the Loess Plateau, China. Glob. Ecol. Conserv. 33:e01984. doi: 10.1016/j.gecco.2021.e01984
Hu, Z., Shi, H., Cheng, K., Wang, Y.-P., Piao, S., Li, Y., et al. (2018). Joint structural and physiological control on the interannual variation in productivity in a temperate grassland: a data-model comparison. Glob. Change Biol. 24, 2965–2979. doi: 10.1111/gcb.14274
Jeong, S.-H., Eom, J.-Y., Lee, J.-h., and Lee, J.-S. (2017). Effect of rainfall events on soil carbon flux in mountain pastures. J. Ecol. Environ. 41:37. doi: 10.1186/s41610-017-0056-x
Jia, B., Luo, X., Cai, X., Jain, A., Huntzinger, D. N., Xie, Z., et al. (2020). Impacts of land use change and elevated CO2 on the interannual variations and seasonal cycles of gross primary productivity in China. Earth Syst. Dynam. 11, 235–249. doi: 10.5194/esd-11-235-2020
Kang, X., Hao, Y., Cui, X., Chen, H., Huang, S., Du, Y., et al. (2016). Variability and changes in climate, phenology, and gross primary production of an alpine wetland ecosystem. Remote Sens. 8:391. doi: 10.3390/rs8050391
Kayiranga, A., Chen, B., Guo, L., Measho, S., Hirwa, H., Liu, S., et al. (2021b). Spatiotemporal variations of forest ecohydrological characteristics in the Lancang-Mekong region during 1992–2016 and 2020–2099 under different climate scenarios. Agric. For. Meteorol. 310:108662. doi: 10.1016/j.agrformet.2021.108662
Kayiranga, A., Chen, B., Trisurat, Y., Ndayisaba, F., Sun, S., Tuankrua, V., et al. (2020). Water use efficiency-based multiscale assessment of Ecohydrological resilience to ecosystem shifts over the continent of Africa during 1992–2015. J. Geophys. Res. Biogeosci. 125:e2020JG005749. doi: 10.1029/2020JG005749
Kayiranga, A., Chen, B., Zhang, H., Nthangeni, W., Measho, S., and Ndayisaba, F. (2021a). Spatially explicit and multiscale ecosystem shift probabilities and risk severity assessments in the greater Mekong subregion over three decades. Sci. Total Environ. 798:149281. doi: 10.1016/j.scitotenv.2021.149281
Keenan, T. F., and Williams, C. A. (2018). The terrestrial carbon sink. Annu. Rev. Environ. Resour. 43, 219–243. doi: 10.1146/annurev-environ-102017-030204
Kumar, M., Savita,, Singh, H., Pandey, R., Singh, M. P., Ravindranath, N. H., et al. (2019). Assessing vulnerability of forest ecosystem in the Indian Western Himalayan region using trends of net primary productivity. Biodivers. Conserv. 28, 2163–2182. doi: 10.1007/s10531-018-1663-2
Kwon, Y., and Larsen, C. P. S. (2013). Effects of forest type and environmental factors on forest carbon use efficiency assessed using MODIS and FIA data across the eastern USA. Int. J. Remote Sens. 34, 8425–8448. doi: 10.1080/01431161.2013.838711
Li, X., Liang, S., Yu, G., Yuan, W., Cheng, X., Xia, J., et al. (2013). Estimation of gross primary production over the terrestrial ecosystems in China. Ecol. Model. 261–262, 89–92. doi: 10.1016/j.ecolmodel.2013.03.024
Liu, L., Gao, X., Cao, B., Ba, Y., Chen, J., Cheng, X., et al. (2022). Comparing different light use efficiency models to estimate the gross primary productivity of a cork oak plantation in northern China. Remote Sens. 14:5095. doi: 10.3390/rs14225905
Luo, X., Croft, H., Chen, J. M., He, L., and Keenan, T. F. (2019). Improved estimates of global terrestrial photosynthesis using information on leaf chlorophyll content. Glob. Change Biol. 25, 2499–2514. doi: 10.1111/gcb.14624
Ma, X., and Li, H. (2010). An approach to dynamic asymptotic estimation for Hurst index of network traffic. Int. J. Commun. Netw. Syst. Sci. 3, 167–172. doi: 10.4236/ijcns.2010.32023
Ma, J., Xiao, X., Miao, R., Li, Y., Chen, B., Zhang, Y., et al. (2019). Trends and controls of terrestrial gross primary productivity of China during 2000–2016. Environ. Res. Lett. 14:084032. doi: 10.1088/1748-9326/ab31e4
Meng, Y., Jiang, P., and Fang, Y. (2020). Contrasting impacts of vapor pressure deficit on gross primary producticity in two typical grassland ecosystems in China. Chin. J. Ecol. 39, 3633–3642. doi: 10.13292/j.1000-4890.202011.011
Nemani, R. R., Keeling, C. D., Hashimoto, H., Jolly, W. M., Piper, S. C., Tucker, C. J., et al. (2003). Climate-driven increases in global terrestrial net primary production from 1982 to 1999. Science 300, 1560–1563. doi: 10.1126/science.1082750
Pei, Y., Dong, J., Zhang, Y., Yuan, W., Doughty, R., Yang, J., et al. (2022). Evolution of light use efficiency models: improvement, uncertainties, and implications. Agric. For. Meteorol. 317:108905. doi: 10.1016/j.agrformet.2022.108905
Piao, S., Sitch, S., Ciais, P., Friedlingstein, P., Peylin, P., Wang, X., et al. (2013). Evaluation of terrestrial carbon cycle models for their response to climate variability and to CO2 trends. Glob. Change Biol. 19, 2117–2132. doi: 10.1111/gcb.12187
Potter, C. S., Randerson, J. T., Field, C. B., Matson, P. A., Vitousek, P. M., Mooney, H. A., et al. (1993). Terrestrial ecosystem production a process model based on global satellite and surface data. Global Biogeochem. Cycles 7, 811–841. doi: 10.1029/93GB02725
Ren, H., Shang, Y., and Zhang, S. (2020). Measuring the spatiotemporal variations of vegetation net primary productivity in Inner Mongolia using spatial autocorrelation. Ecol. Indic. 112:106108. doi: 10.1016/j.ecolind.2020.106108
Running, S. W., Nemani, R. R., Heinsch, F. A., Zhao, M., Reeves, M., and Hashimoto, H. (2004). A continuous satellite-derived measure of global terrestrial primary production. BioScience 54:547. doi: 10.1641/0006-3568(2004)054[0547:ACSMOG]2.0.CO;2
Shao, H. (2021). “Climate extreme change and its relationship with vegetation growth and productivity in southwest China” in Master Thesis (Chinese Academy of Forestry)
Sharma, J., Upgupta, S., Jayaraman, M., Chaturvedi, R. K., Bala, G., and Ravindranath, N. H. (2017). Vulnerability of forests in India: a national scale assessment. Environ. Manag. 60, 544–553. doi: 10.1007/s00267-017-0894-4
Singh, R. K., Sinha, V. S. P., Joshi, K., and Kumar, M. (2019). Use of Savitzky–Golay filters to minimize multi-temporal data anomaly in land use land cover mapping. Forestry 42, 362–368. doi: 10.54207/bsmps1000-2019-650ST3
Sjöström, M., Zhao, M., Archibald, S., Arneth, A., Cappelaere, B., Falk, U., et al. (2013). Evaluation of MODIS gross primary productivity for Africa using eddy covariance data. Remote Sens. Environ. 131, 275–286. doi: 10.1016/j.rse.2012.12.023
Stocker, B. D., Wang, H., Smith, N. G., Harrison, S. P., Keenan, T. F., Sandoval, D., et al. (2020). P-model v1.0: an optimality-based light use efficiency model for simulating ecosystem gross primary production. Geosci. Model Dev. 13, 1545–1581. doi: 10.5194/gmd-13-1545-2020
Tang, X., Li, H., Huang, N., Li, X., Xu, X., Ding, Z., et al. (2015). A comprehensive assessment of MODIS-derived GPP for forest ecosystems using the site-level FLUXNET database. Environ. Earth Sci. 74, 5907–5918. doi: 10.1007/s12665-015-4615-0
Tang, X., Zhao, X., Bai, Y., Tang, Z., Wang, W., Zhao, Y., et al. (2018). Carbon pools in China’s terrestrial ecosystems: new estimates based on an intensive field survey. Proc. Natl. Acad. Sci. U.S.A. 115, 4021–4026. doi: 10.1073/pnas.1700291115
Tian, Y., Huang, Y., Zhang, Q., Tao, J., Zhang, Y., and Huang, H. (2019). Spatiotemporal distribution of net primary productivity and its driving factors in the Nanliu River basin in the Beibu gulf. Acta Ecol. Sin. 39, 8156–8171. doi: 10.5846/stxb201810182256
Tian, Z., Zhang, D., He, X., Guo, H., and Wei, H. (2019). Spationtemporal variations in vegetation net primary productivity and their driving factors in Yellow River basin from 2000 to 2015. Res. Soil Water Conserv. 26, 255–262. doi: 10.13869/j.cnki.rswc.2019.02.037
Tripathi, P., Behera, M. D., Behera, S. K., and Sahu, N. (2020). Investigating the contribution of climate variables to estimates of net primary productivity in a tropical deciduous forest in India. Environ. Monit. Assess. 191:798. doi: 10.1007/s10661-019-7684-9
Trumbore, S., Brando, P., and Hartmann, H. (2015). Forest health and global change. Science 349, 814–818. doi: 10.1126/science.aac6759
Turner, D. P., Ritts, W. D., Cohen, W. B., Gower, S. T., Zhao, M., Running, S. W., et al. (2003). Scaling gross primary production (GPP) over boreal and deciduous forest landscapes in support of MODIS GPP product validation. Remote Sens. Environ. 88, 256–270. doi: 10.1016/j.rse.2003.06.005
Wang, J. (2015). “Research on CO2 exchange characteristics and influencing factors in the high-altitude wetland ecosystem of Qinghai Lake” in Qinghai Normal University, Master’s degree Master Thesis
Wang, J., He, H., Dong, J., and Guo, B. (2021). Spatio-temporal distribution of vegetation net primary productivity in the Yellow River Basin in 2000–2019 and its natural driving factors. J. Desert Res. 41, 213–222. doi: 10.7522/j.issn.1000-694X.2021.00116
Wang, C., Jiang, Q.’o., Deng, X., Lv, K., and Zhang, Z. (2020). Spatio-temporal evolution, future trend and phenology regularity of net primary productivity of forests in northeast China. Remote Sens. 12:3670. doi: 10.3390/rs12213670
Wang, X., Ma, M., Li, X., Song, Y., Tan, J., Huang, G., et al. (2013). Validation of MODIS-GPP product at 10 flux sites in northern China. Int. J. Remote Sens. 34, 587–599. doi: 10.1080/01431161.2012.715774
Wang, H., Prentice, I. C., Keenan, T. F., Davis, T. W., Wright, I. J., Cornwell, W. K., et al. (2017). Towards a universal model for carbon dioxide uptake by plants. Nat. Plants 3, 734–741. doi: 10.1038/s41477-017-0006-8
Wang, Y. B., Zhao, Y. H., Han, L., and Ao, Y. (2018). Spatio temporal variation of vegetation net primary productivity and its driving factors from 2000 to 2015 in Qinling-Daba Mountains China. Chin. J. Appl. Ecol. 29, 2373–2381. doi: 10.13287/j.1001-9332.201807.010
Wang, Y., Zhou, G., and Jia, B. (2008). Modeling SOC and NPP responses of meadow steppe to different grazing intensities in northeast China. Ecol. Model. 217, 72–78. doi: 10.1016/j.ecolmodel.2008.05.010
Wei, S., Yi, C., Fang, W., and Hendrey, G. (2017). A global study of GPP focusing on light-use efficiency in a random forest regression model. Ecosphere 8:e01724. doi: 10.1002/ecs2.1724
Wen, G., and Fu, C. (2001). Large-scale characteristics of the response of seasonal changes in vegetation phenology to climate in the eastern monsoon region of China: an interannual comparison. Clim. Environ. Res. 1, 1–11. doi: 10.3878/j.issn.1006-9895.2000.05.12
Wohlfahrt, G., and Gu, L. (2015). The many meanings of gross photosynthesis and their implication for photosynthesis research from leaf to globe. Plant Cell Environ. 38, 2500–2507. doi: 10.1111/pce.12569
Wu, J., Albert, L. P., Lopes, A. P., Restrepo-Coupe, N., Hayek, M., Wiedemann, K. T., et al. (2016). Leaf development and demography explain photosynthetic seasonality in Amazon evergreen forests. Science 351, 972–976. doi: 10.1126/science.aad5068
Wu, W. X., Wang, S. Q., Xiao, X. M., Yu, G. R., Fu, Y. L., and Hao, Y. B. (2008). Modeling gross primary production of a temperate grassland ecosystem in Inner Mongolia, China, using MODIS imagery and climate data. Sci. China Ser. D 51, 1501–1512. doi: 10.1007/s11430-008-0113-5
Xiao, X. M., Hollinger, D., Aber, J., Goltz, M., Davidson, E. A., Zhang, Q., et al. (2004). Satellite-based modeling of gross primary production in an evergreen needleleaf forest. Remote Sens. Environ. 89, 519–534. doi: 10.1016/j.rse.2003.11.008
Xiao, X., Hollinger, D., Aber, J., Goltz, M., Davidson, E. A., Zhang, Q., et al. (2005). Modeling seasonal dynamics of gross primary production of evergreen needleleaf forest using MODIS images and climate data. Ecol. Soc. Am. 15:969. doi: 10.1890/04-0470
Xu, L., Du, H., and Zhang, X. (2021). Driving forces of carbon dioxide emissions in China’s cities: an empirical analysis based on the geodetector method. J. Clean. Prod. 287:125169. doi: 10.1016/j.jclepro.2020.125169
Xu, X., Liu, H., Lin, Z., Jiao, F., and Gong, H. (2019). Relationship of abrupt vegetation change to climate change and ecological engineering with multi-timescale analysis in the Karst region, southwest China. Remote Sens. 11:1564. doi: 10.3390/rs11131564
Xu, Y., Xiao, F., and Yu, L. (2020). Review of spatio-temporal distribution of net primary productivity in forest ecosystem and its responses to climate change in China. Acta Ecol. Sin. 40, 4710–4723.
Yang, Y. (2009). “Spatio-temporal change of net primary productivity in Guizhou and its correlationship with meteorologic factors” in Master Thesis (Southwest University)
Yang, M. (2022). “Spatiotemporal distribution of gross primary productivity and its response to drought change in Guizhou Province” in Master Thesis (Guizhou Normal University)
Yang, Y., Ma, X., Wu, Q., Zhang, C., Liu, T., Liu, Q., et al. (2014). Accumulation amount of litters and their water-holding characteristics under main forest types in Longmen Mountains Fault Zone. Bull. Soil Water Conserv. 34, 69–74. doi: 10.13961/j.cnki.stbctb.2014.03.014
Yao, Y., Li, Z., Wang, T., Chen, A., Wang, X., Du, M., et al. (2018). A new estimation of China’s net ecosystem productivity based on eddy covariance measurements and a model tree ensemble approach. Agric. For. Meteorol. 253–254, 84–93. doi: 10.1016/j.agrformet.2018.02.007
Yuan, W., Cai, W., Liu, D., and Dong, W. (2014). Satellite-based vegetation production models of terrestrial ecosystem: an overview. Adv. Earth Sci. 29, 541–550. doi: 10.11867/j.issn.1001-8166.2014.05.0541
Yuan, W. P., Liu, S., Zhou, G. S., Zhou, G., Tieszen, L. L., Baldocchi, D., et al. (2007). Deriving a light use efficiency model from eddy covariance flux data for predicting daily gross primary production across biomes. Agric. For. Meteorol. 143, 189–207. doi: 10.1016/j.agrformet.2006.12.001
Zan, M., Zhou, Y., Ju, W., Zhang, Y., Zhang, L., and Liu, Y. (2018). Performance of a two-leaf light use efficiency model for mapping gross primary productivity against remotely sensed sun-induced chlorophyll fluorescence data. Sci. Total Environ. 613–614, 977–989. doi: 10.1016/j.scitotenv.2017.09.002
Zhang, X. (2011). “Light and water-use efficiency of subtropical Evergreen coniferous Forest in Qianyangzhou Experimental Station of Jiangxi Province” in Doctoral Thesis (Beijing Forestry University)
Zhang, H., Sun, R., Peng, D., Yang, X., Wang, Y., Hu, Y., et al. (2021). Spatiotemporal dynamics of net primary productivity in China’s urban lands during 1982–2015. Remote Sens. 13:400. doi: 10.3390/rs13030400
Zhang, Y., Yu, Q., Jiang, J., and Tang, Y. (2008). Calibration of Terra/MODIS gross primary production over an irrigated cropland on the North China Plain and an alpine meadow on the Tibetan Plateau. Glob. Change Biol. 14, 757–767. doi: 10.1111/j.1365-2486.2008.01538.x
Zhang, Y., Yu, G., Yang, J., Wimberly, M. C., Zhang, X. Z., Tao, J., et al. (2014). Climate-driven global changes in carbon use efficiency. Glob. Ecol. Biogeogr. 23, 144–155. doi: 10.1111/geb.12086
Zhao, M., Running, S. W., and Nemani, R. R. (2006). Sensitivity of moderate resolution imaging Spectroradiometer (MODIS) terrestrial primary production to the accuracy of meteorological reanalyses. J. Geophys. Res. Biogeosci. 111, 2156–2202. doi: 10.1029/2004JG000004
Zhao, X., Zhou, W., Tian, L., He, W., Zhang, J., Liu, D., et al. (2018). Effects of land-use changes on vegetation net productivity in the three gorges reservoir area of Chongqing. Acta Ecol. Sin. 38, 7658–7668. doi: 10.5846/stxb201712022167
Keywords: P model, forest ecosystem, spatiotemporal distribution pattern, climate factors, remote sense
Citation: Liao Z, Fei X-H, Zhou B, Zhu J, Jia H, Chen W, Chen R, Xu P and Li W (2024) Spatiotemporal variation and response of gross primary productivity to climate factors in forests in Qiannan state from 2000 to 2020. Front. For. Glob. Change. 7:1293541. doi: 10.3389/ffgc.2024.1293541
Edited by:
Mohammad Ibrahim Khalil, University College Dublin, IrelandReviewed by:
Fubo Zhao, Xi’an Jiaotong University, ChinaManoj Kumar, Forest Research Institute (FRI), India
Ned Fetcher, Wilkes University, United States
Copyright © 2024 Liao, Fei, Zhou, Zhu, Jia, Chen, Chen, Xu and Li. This is an open-access article distributed under the terms of the Creative Commons Attribution License (CC BY). The use, distribution or reproduction in other forums is permitted, provided the original author(s) and the copyright owner(s) are credited and that the original publication in this journal is cited, in accordance with accepted academic practice. No use, distribution or reproduction is permitted which does not comply with these terms.
*Correspondence: Xue-Hai Fei, feixuehai@gzu.edu.cn
†ORCID: Xuehai Fei, https://orcid.org/0000-0002-1730-759X