A climate analog approach to evaluate seed transfer and vegetation transitions
 Bryce A. Richardson
 Gerald E. Rehfeldt
 Cuauhtémoc Sáenz-Romero
 Elizabeth R. Milano
- 1Rocky Mountain Research Station, USDA Forest Service, Moscow, ID, United States
- 2Independent Researcher, Moscow, ID, United States
- 3Instituto de Investigaciones sobre los Recursos Naturales, Universidad Michoacana de San Nicolás de Hidalgo (INIRENA-UMSNH), Morelia, Michoacán, Mexico
Introduction: There is growing recognition that restoring species diversity is crucial to maintaining ecological functions and services. Increasing the diversity of species used in restoration programs has placed greater emphasis on determining the seed transfer needs for a wider array of plants. However, many plants, outside of commercial forestry, lack information that would provide guidance on seed transfer for current or future climates. Generalized seed transfer approaches use climate partitioning to approximate adaptive differentiation among populations and provide an estimation of seed transfer distance for such species.
Methods: Herein, we describe a generalized seed transfer approach that uses Euclidean distance of 19 climate variables within North America (from northern Honduras to the Arctic). Euclidean distances are used to identify climate analogs from vegetation databases of about 685,000 plots, an average density of 1 plot per 32 km2. Analogs are classified into three thresholds (strong, moderate, and weak) that correspond to altitudinal climate gradients and are guided by the scientific literature of observed adaptive variation of natural tree populations and seed transfer limits.
Results: For strong threshold observations, about 97% of the analogs had climate distances equivalent to ≤300 m elevation, whereas for the weak threshold observations, 53% had an elevation equivalence of ≤300 m. On average 120, 267, and 293 m elevation separated two points under strong, moderate, and weak thresholds, respectively. In total, threshold classification errors were low at 13.9%.
Discussion: We use examples of plot data identified from a reference period (1961–1990) and mid-century (2056–2065) analogs across North American biomes to compare and illustrate the outcomes of projected vegetation change and seed transfer. These examples showcase that mid-century analogs may be located in any cardinal direction and vary greatly in spatial distance and abundance from no analog to hundreds depending on the site. The projected vegetative transitions will have substantial impacts on conservation programs and ecosystem services. Our approach highlights the complexity that climate change presents to managing ecosystems, and the need for predictive tools in guiding land management decisions to mitigate future impacts caused by climate change.
1 Introduction
There is a growing appreciation for restoration that encompasses proactive planning and broadening species diversity (Erickson and Halford, 2020), but genetic information remains scarce for many ecologically important plant species, especially in countries with high biodiversity like México, creating a dilemma for restoration and reforestation programs. On one hand, focusing restoration on well-researched restoration species can limit species diversity and ecological function (Cadotte et al., 2011); on the other hand, expanding the number of restoration species to those that lack genetic information could lead to misguided seed transfer, resulting in maladaptation or outbreeding depression (McKay et al., 2005). Decision support tools that recognize the risks and limitations of seed transfer and broaden the palette of under-utilized species can augment restoration and ecosystem service outcomes by increasing flora and fauna diversity.
Defining the climate space that reflects genetic adaptation is integral to seed transfer and assisted migration. To provide seed transfer guidance for species lacking genetic information, researchers have developed varied approaches using partitioned climate data. One approach defines temperature and aridity thresholds for climatic surfaces to delimit zones for seed transfer (Bower et al., 2014; Castellanos-Acuña et al., 2018; Pike et al., 2020). Another approach uses climate-based Euclidean distance, hereafter referred to as climate distance, to provide a calculation of climate (dis)similarity. Climate distance has been used to identify climate appropriate crops (e.g., Ramírez-Villegas et al., 2011), future refugia (Michalak et al., 2018), and seed transfer zones for wildland restoration (Doherty et al., 2017; Shryock et al., 2018; St Clair et al., 2022). For example, Seedlot Selection Tool (SST, St Clair et al., 2022) is an interactive webtool that calculates climate distance based on user-specified locations. This webtool provides guidance to species seed transfer for which genetic information is not necessarily available, enabling the development of restoration programs for ecologically important species. However, SST requires user-selected climate variables and transfer limits. User-selected variables and limits could lead to either under or over estimation of seed transfer limits depending on the user’s knowledge of the species, climate, and climate variation occupied by the species. Because plants can be adapted to seasonal temperature, precipitation, and their interactions (e.g., Putz et al., 2021; Richardson et al., 2021), defining seed transfer limits with a few climate variables can lead to an overestimation of seed transfer limits. More precision in defining climate is needed when considering wide-ranging species and assisted migration due to climate change.
We offer an approach for calculating climate distances to identify future climate analogs—sites with contemporary climate similar to the future climate at a target location. Analogs are drawn from biome and plant inventory databases which provide projections of potential future vegetation for developing strategic seed transfer and proactive restoration plans. The approach is species-independent, operating entirely in climate space, incorporating 19 climate variables, and projections for three Representative Concentration Pathways (RCPs) from three general circulation models (GCMs) for future mid-century climates (IPCC, 2014). We take into consideration a large amount of variation that accompanies future climate projections and simplify the decision process by averaging large climate variability into a single criterion to determine climate analogs. As such, the approach has broad applicability, from land use management to municipal planning. Thus, we hope that our work might contribute to fill an information gap between complex research papers showing the large extent of diverse combinations of GCMs, scenarios of accumulated greenhouse gas emissions and projected climate futures, and on the opposite spectrum, an urgent need for tools to guide practical forest management decisions by foresters and conservationist practitioners. The need to move on from the academic rumination to specific forest management decisions to face climatic change impacts, is becoming more urgent, due to the current acceleration of climatic change (Hansen et al., 2023; Sáenz-Romero, 2023).
We define three analog classes, referred to as thresholds, as an interpretative aid by relating Euclidean climate distances to documented genetic responses to climate. To do this, we note that historic case studies of geographic variation in forest trees, patterns of genetic variation invariably were related to either latitude or elevation, promoting the conclusion that clines in intraspecific genetic effects were largely controlled by temperature (Sorensen, 1992, 1994). Recent climate-based genecological studies (e.g., St Clair et al., 2005; Joyce and Rehfeldt, 2013, 2017; Leites and Benito-Garzón, 2023) have verified this conclusion, although clines occurring along temperature gradients can either be steep (adaptive specialists, Rehfeldt, 1994a,b; St Clair et al., 2005) or shallow (adaptive generalists, Rehfeldt, 1986; Leites and Benito-Garzón, 2023). In specialists, for instance, the interval across which genetic differentiation is first detected can be as small as 300 m elevation, while in generalists, the interval can be 500 m or higher. Indeed, adiabatic effects govern elevation’s negative correlation with temperature and positive relationship with precipitation, and these relationships have pronounced effects on ecology (Dobrowski et al., 2009). Therefore, to provide context to Euclidean climate distances, we use elevation to link climate distances, temperature, and genecology. We argue that climate distance thresholds can be defined from the relationship between climate distances and elevation, that is, their equivalence.
Altitudinal clines are well documented, but the interval across which differentiation can be detected varies between specialist and generalist species (e.g., Rehfeldt, 1994a,b). Yet, there are almost no cases where documented clines have been so steep that climate-induced genetic differences could be expected at altitudinal intervals <300 m (e.g., Sorensen, 1992, 1994; Rehfeldt et al., 2020). Adiabatic lapse rates, which are depicted in mean annual temperature estimates from spline surfaces [see Sáenz-Romero et al. (2010)], suggest further that annual temperatures should change by only 1.5°C across a 300 m interval. We reason that climate distances equivalent to an altitudinal difference of 300 m would make a biologically reasonable upper threshold for defining analogous climates. We reason further that a logical upper limit for the strong analog class would be a climate distance equivalent to a 200 m elevation difference, also equivalent roughly to MAT = 1°C. Temporal fluctuations in weather and topographic effects such as aspect seemingly dwarf subtle climate differences at scales less than 200 m (Holden et al., 2011; Rehfeldt et al., 2015) and, therefore, finer resolution of climate distances would be a false precision. For subtending the moderate analog class, we simply use the climate distance midway between that for the strong and weak analog classes.
Our goals are to: (1) present and illustrate a climate distance approach to locating reference period climates (1961–1990) that are climate analogs to projected mid-century climates (decade centered in 2060: 2056–2065) for target locations, (2) define climate analog thresholds by relating climate distances to elevation differences along altitudinal clines at a random selection of geographic points, and (3) infer vegetative changes to plant communities, potential impacts to conservation, and the climatic factors affecting these changes using target locations examples from a wide array of contrasting North American ecosystems.
2 Materials and methods
2.1 Analytic overview
Euclidean distances between a targeted location and reference period climates were calculated with the ‘yaImpute’ (Crookston and Finley, 2007) and ‘gower’ (Gower, 1971) packages for R (R Development Core Team, 2021) using 19 climate variables. The yaImpute algorithm calculates nearest neighbor statistics between all observations in the reference period dataframe with each observation in the target dataframe, defined below (see 2.1.1). All climate variables were standardized before analysis to assure that climate distances calculated from disparate databases and disparate geographic localities would be derived from the same statistical distributions and, therefore, be comparable. Because standardization was done prior to analysis, yaImpute’s ‘raw’ option was used to calculate Euclidean distances. Examples of the R code for the methods described here and below can be found at https://github.com/ermilano-fs/ClimDist.
2.1.1 Reference period climates
All climate estimates used herein are from the thin plate splines of Rehfeldt (2006) and Sáenz-Romero et al. (2010), available online at https//charcoal2.cnre.vt.edu/climate/. We use the term ‘reference period climate’ for 1961–1990 normals from this climate model. The reference period, therefore, is not only incipient to anthropomorphic climate change but also approximates the climate when much of the current plant communities became established. Additionally, the ‘target’ is the site for which reference period or mid-century climate analogs are desired.
Nearest neighbor climate analogs for target locations are drawn from a pool of locations within five reference period vegetation databases (Table 1). Four of these databases contain ground plot species identifications; one contains North American biomes. Together, these databases contain 1961–1990 climate normals from about 685,000 locations in North America, a density of approximately 1 plot per 32 km2.
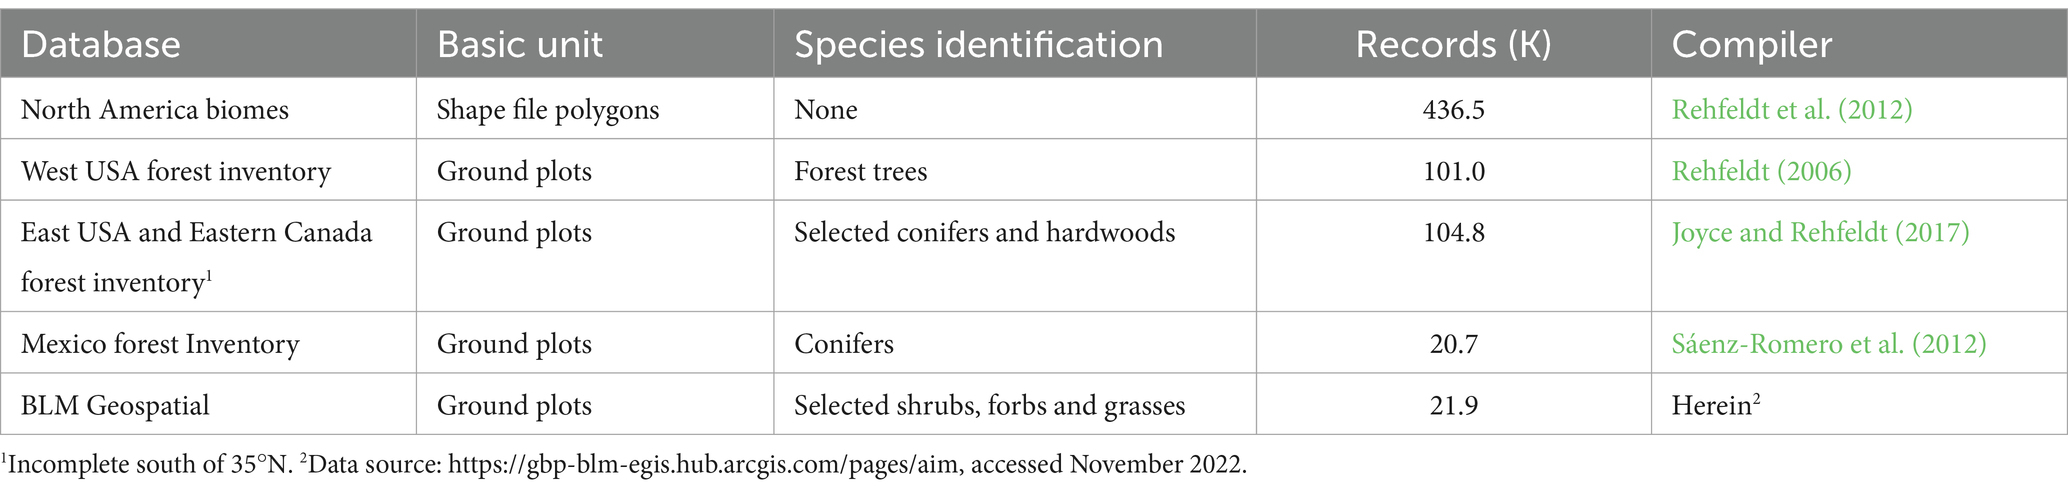
Table 1. Climate databases used as reference period (1961–1990) files.
2.1.2 Future target climates
Target dataframes consist of mid-century climate estimates for locations where contemporary analogs are desired. Nearest neighbors are those locations with 1961–1990 climates most similar to the future climate of the target. Future climate estimates of target locations were calculated as the mean of 13 projections of 2060 climates. The projections include five GCMs and 3 RCP scenarios (Supplementary Table S1). See Van Vuuren et al. (2011) for supporting documentation.
2.1.3 Climate variables
Euclidean distances are based on 19 climate variables (Supplementary Table S2) and are of documented utility in studies of plant responses to climate (e.g., Sáenz-Romero et al., 2010; Rehfeldt et al., 2012; Chaney et al., 2017; Worrall and Rehfeldt, 2021). Climate variables include six variables of temperature, seven precipitation variables, and six variables involving temperature-precipitation interactions. Temperature was selected to depict winter cold, summer heat, continentality, and the onset of spring; precipitation variables express the amount and periodicity of precipitation; and temperature-precipitation interactions (e.g., aridity indices) concentrate on the balance between heat and moisture both seasonally and annually.
While collinearity is of no consequence in calculation of the climate distances, surrogates could unduly bias estimates of climate distances. To be sure, on a continental scale, several of our variables show strong simple correlations. Yet, because of this geographic scale, the coefficients are misleading. According to the biome database (Table 1) for instance, the correlation between DD5 and MAT is r = 0.91; yet the relationship is pronouncedly non-linear. For D100 and MAT the correlation is r = −0.94, but for D100 = 200, MAT can range from −15oC to 3oC. We maintain that the array of climate variables we use refines the climatic breadth of reference and target sites to provide a necessary specificity for choosing analogs.
2.1.4 Standardization
Nearest neighbor analyses frequently employ standardizing procedures to convert variables to a distribution with a mean of zero and a variance of 1, thereby providing equal weights to the variables. Because operative climate variables are not known for most species, we transformed climate variables to standard normal deviates before analysis. First, a climate dataset was built by randomly selecting 988 locations (Figure 1) from the North American biome database between 14° to 60° latitude and 250 m to 3,200 m elevation. Our goal was to provide a broad range of climates representative of the continent’s vegetation (Figure 1, insert). However, the biome database was built by sampling shapefiles at a rate inversely proportional to their size, so our sample was concentrated in mountainous regions where climate heterogeneity is greatest. Elevation restrictions were imposed to facilitate the definition of climate distance thresholds (see section 2.2). Then, target and reference dataframes were standardized by subtracting the means and dividing by the standard deviations (Supplementary Table S2) for climate of Figure 1 locations. This process assures that Euclidean distance output from our analyses are comparable despite disparate input. Because our calculations occur entirely within climate space, the lack of a quasi-systematic geographic sample is immaterial.
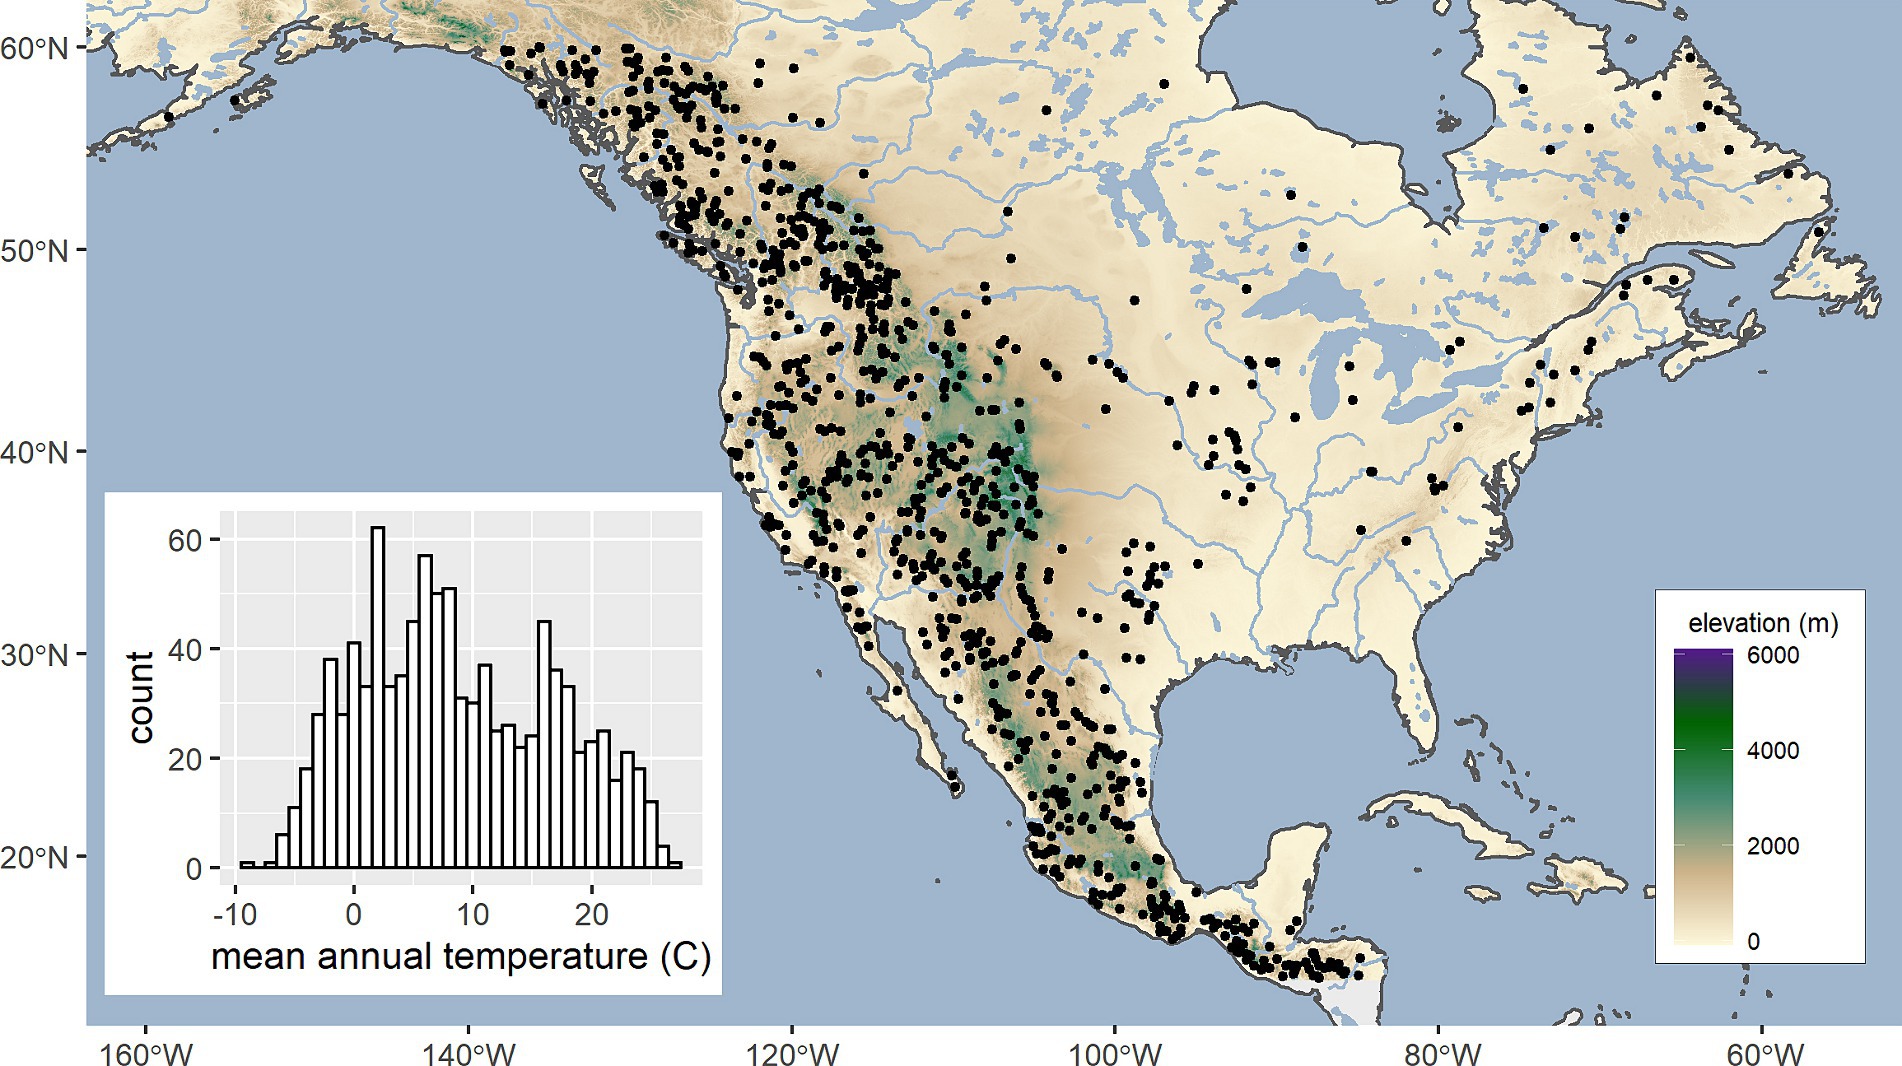
Figure 1. Geographic distribution of 988 locations (points) and their mean annual temperature distribution (histogram inset) used to construct a dataset for defining analog thresholds.
2.2 Thresholds
To calculate thresholds for the Euclidean climate distances, we constructed a series of synthetic altitudinal clines of 500 m centered on each of the 988 locations of Figure 1. Each cline was then sampled at a 10 m interval. Because the spline climate model uses latitude, longitude, and elevation as predictors, climate estimates produced for this dataset consisted of 51 observations with the same coordinates but differing elevations for each of the 988 locations.
Euclidean climate distances were calculated between the 51 observations in the same cline to produce ≈1.25 million climate distances between pairs of observations at known differences in elevation but with the same geographic coordinates. Because the altitudinal clines consisted of 51 data points, the elevation differences within each cline consisted of only 50 unique values with a highly disproportionate number of observations having the same elevation difference. There were, for instance, 48,410 observations in this dataset with an elevation difference of 10 m, but only 988 observations with an elevation difference of 500 m. As a result, the variance in climate distance was directly proportional to the elevation difference (Supplementary Figure S1). Therefore, to relate climate distances to elevation differences, we used the mean climate distance for each value of elevation differences in a linear regression (R base, R Development Core Team, 2021) of climate distance on elevation difference with 48 degrees of freedom. Predicted climate distances at 200 m and 300 m established the upper thresholds for strong and weak analogs, respectively. Moderate analogs were equated to the climate distance midpoint.
To evaluate the effectiveness of these thresholds, we selected at random 25,000 data points from 15° ≤ latitude ≤ 60° and −130° ≤ longitude ≤ −90° from the biome database and calculated climate distances from each point to that of all other data points lying within ±0.025° in latitude and longitude. The maximum geographic distance between observations in this dataset was 3.1 km, assuring low impacts of geographic distance on climatic differences. After discarding all observations with climate distances of zero, the resulting dataset contained about 48,500 observations. However, the observations were highly skewed toward low differences in elevation: nearly 60% involved data points <100 m apart, and about 30% were of locations within 25 m of each other. To create a balanced dataset for verification analyses, we obtained a random sample of about 5,000 observations from each of 4 classes of elevation differences: 0–100, 100–200, 200–300, and >300 m. The sample for the 0–100 class was composed of 25% from 0 to 25 m, 25% from 25 to 50 m; and 50% from 50 to 100 m. We then tallied the number of strong, moderate, and weak climate analogs for the classes of elevation differences to produce a confusion matrix.
2.3 Illustrating climate distance analogs
For mapping, we used the digitized elevation model of the GLOBE Task Team (1999) and R packages ‘ggplot2’ (Wickham, 2016) and ‘terra’ (Hijmans et al., 2022) to illustrate for numerous geographic locations (Supplementary Table S3) having applications in restoration or reforestation. In the case studies below, all climate analogs are mapped across geographic window, North America. Rasters of analog predictions used the climate grids at https//charcoal2.cnre.vt.edu/climate/. When compiling potential species composition for contemporary analogs to the contemporary climate of a target, we use ≥30 strong analogs per target location. Species composition for the future climate of a target is dependent on the number of analogs found.
3 Results
3.1 Analog class thresholds
The regression of climate distance on elevation differences had 48 degrees of freedom and produced a fit that was nearly perfect (R2 = 0.9999, Supplementary Figure S1). Predicted values of climate distance for 200 and 300 m of elevation difference produced a threshold of 0.60 for strong analogs and 0.84 for weak analogs with a midpoint of 0.72 for moderate analogs. On average, strong analogs had an elevation equivalency between 0 and 214 m; moderate analogs between 214 and 268 m; and weak analogs between 268 and 302 m.
An empirical assessment of the efficacy of our thresholds is summarized in Supplementary Table S4. Cumulative distributions within analog thresholds showed that for strong analogs, 50% of the analogous pairs fell within 100 m of each other and 98% were within 300 m. Pairs within this class differed in altitude by 120 m on average. For moderate analogs, the average elevation difference between pairs was 267 m, and 68% of the pairs were within 300 m of each other. Weak analogs averaged 293 m separation on average with 53% of pairs being less than 300 m apart (Supplementary Table S4). False positives arise from the variances within classes (Supplementary Figure S1), which are attributable to imperfect relationships between climate model estimates and adiabatic lapse rates, particularly for locations lacking topographic diversity.
The confusion matrix (Table 2) produced from an independent evaluation of classification errors allowed quantification of the risks associated with each threshold. Errors of commission (false positives) are observations classified as analogs but involve elevation differences >300 m. For observations classified as strong analogs, only 410 out of 12,201 (3.4%) involved locations separated by more than 300 m elevation. Therefore, strong analogs at target locations are correctly classified at 96.6% below 300 m elevation and 76% below 200 m. Moderate analog target locations were correctly classified at 65.9% below 300 m, while weak analogs dropped to 45.3% below 300 m. The summaries suggest high confidence in the strong analog classification, but low confidence in weak analogs, as their error was more than 50%. In total, errors of commission amount to 11.8%, and errors of omission (false negatives) are 6.9%. Together, the errors produced by our classification system were 13.9%.
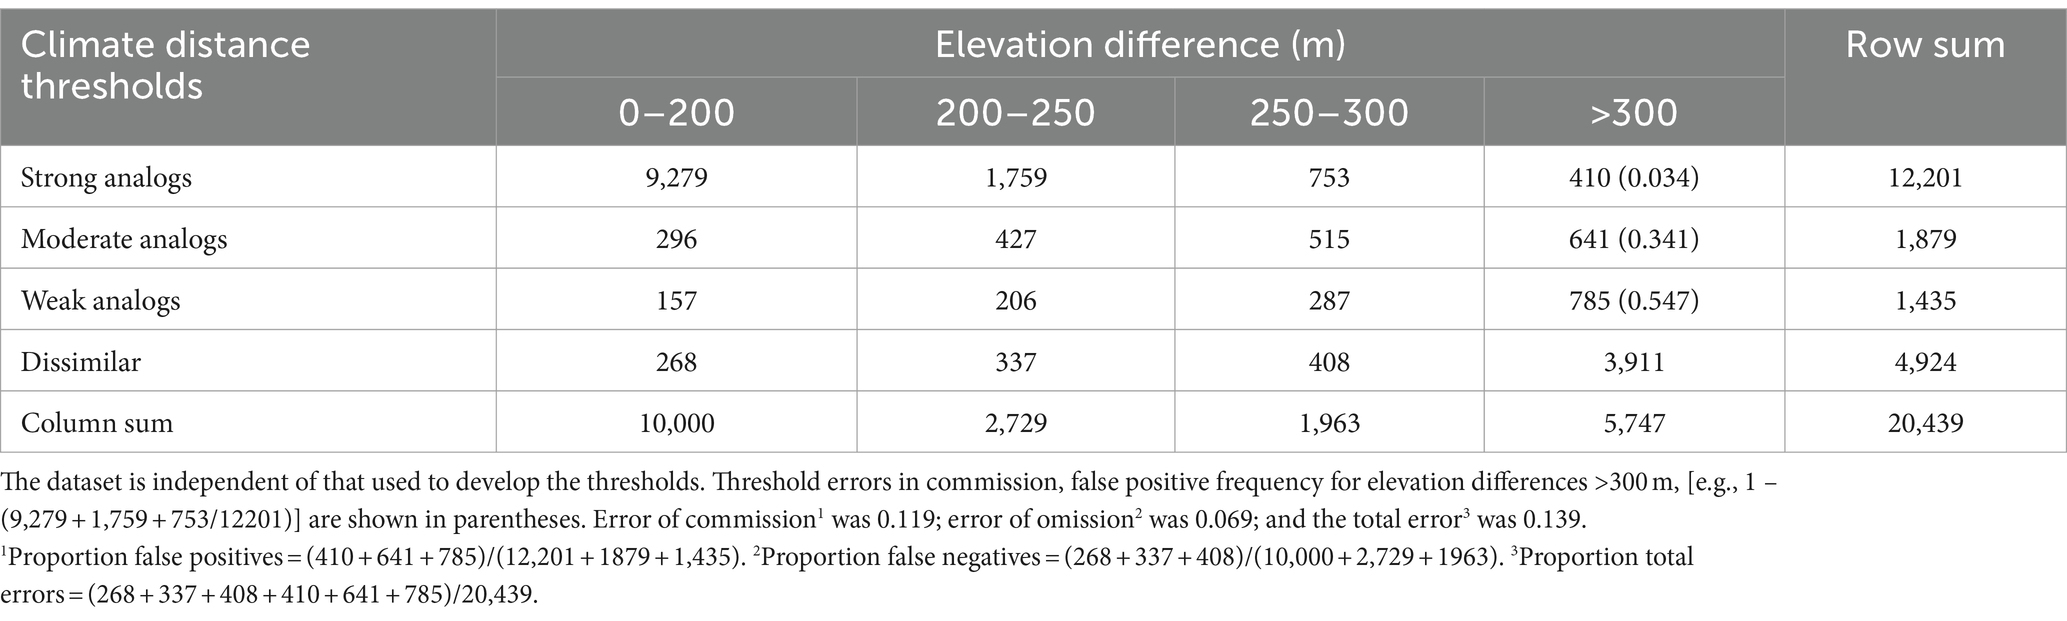
Table 2. Confusion matrix showing the error structure when climate distances are classified by analog thresholds and segregated according to elevation differences between pairs of point locations.
3.2 Focal point climate analogs
We chose two target locations, Moscow Mountain (northern Idaho, United States) and Tiger Mountain (northwestern Washington, United States), to illustrate our approach. First, at Moscow Mountain mapped mid-century analogs (Figure 2A) depict a downward shift in elevation compared to the reference period shown in the elevation profiles (Figure 2B). This example also shows the relationship between climate distance thresholds and elevational breadth. Weak thresholds (dark blue), representing adaptive generalists, span wider ranges of elevation (e.g., 1,000 m under the reference period), whereas strong thresholds (red), representing adaptive specialists, span the narrowest ranges of elevation (e.g., 600 m). At Tiger Mountain our analyses detected numerous climate analogs to this site for the reference period, 164 of which were strong (red dots, Figure 3A). The strong analogs surround the site in both elevation and geographic distance. Only six analogs were found for the mid-century climate, and only one of them was strong (Figure 3B). The strong analog is ~200 km to the south and ~250 m lower in elevation than the target location. In addition to the single strong analog, the algorithm located two moderate analogs (violet dots) and three weak analogs (dark blue dots, Figure 3B). Nearest neighbors with climate distances outside the 0.84 threshold are plotted as white dots, which we use occasionally in subsequent maps. In addition to mapping analog point locations from plot data, we predict the location of analogs on a 1 km grid of climate variables. In Figure 3, gridded predictions of all three analog classes are colored green. The green encapsulates the plot data supporting the low levels of classification errors.
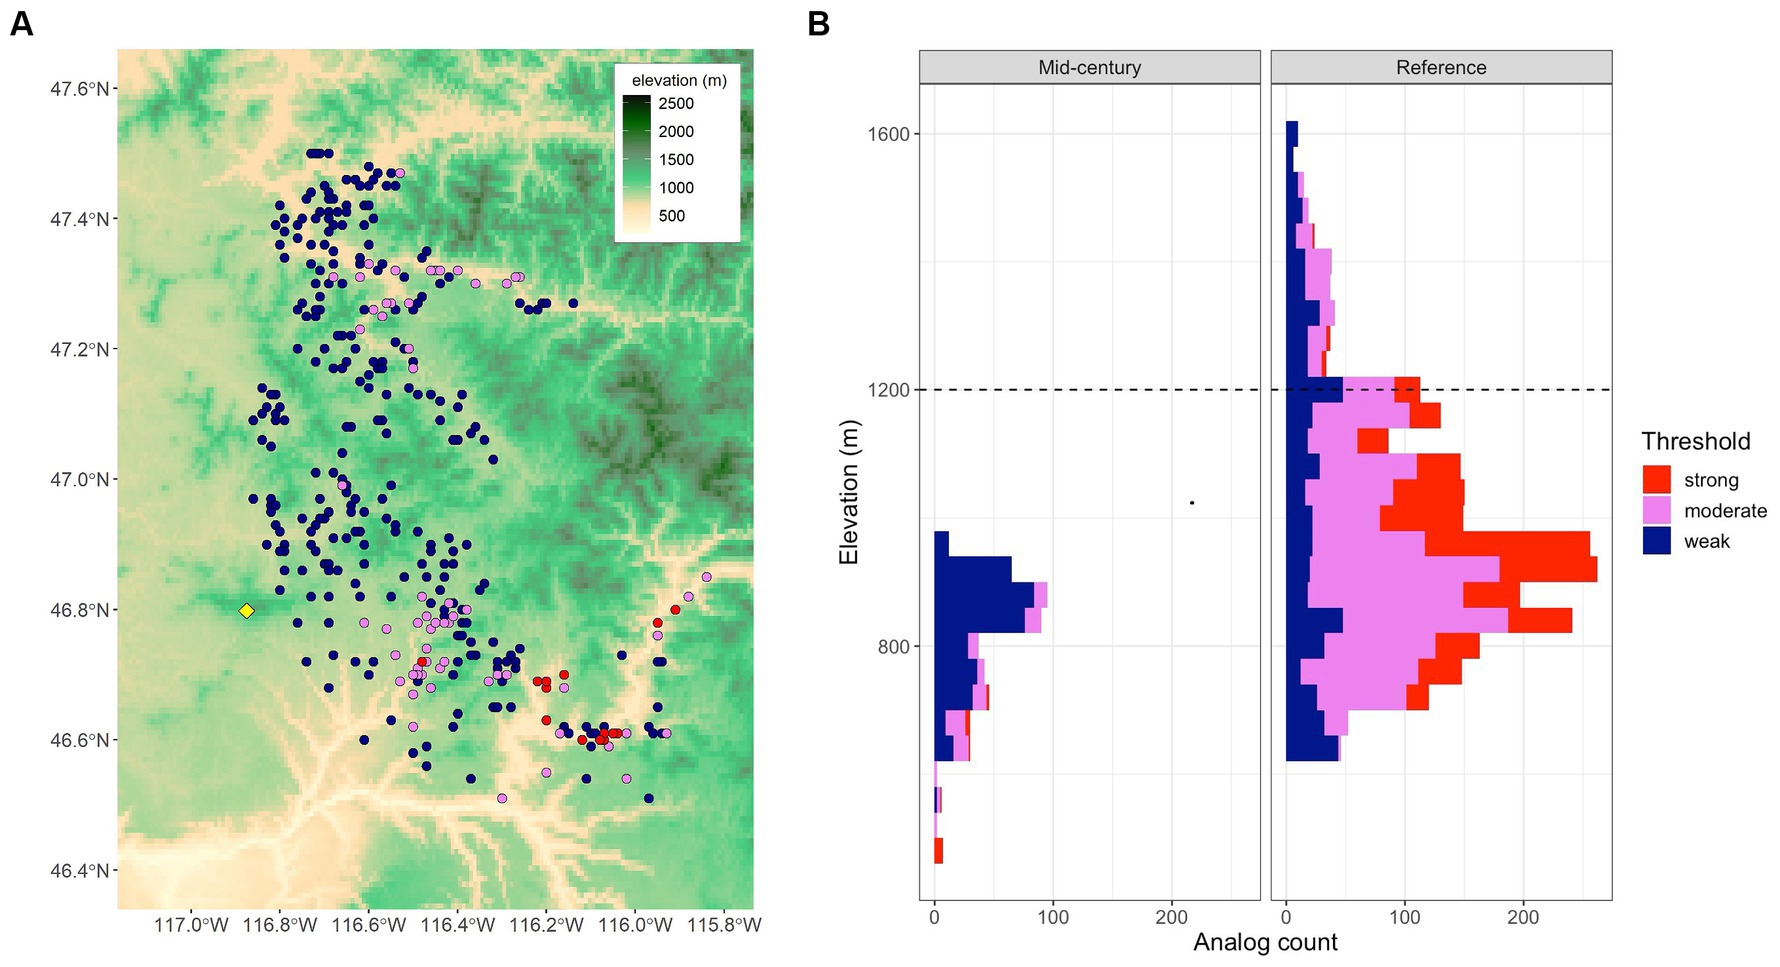
Figure 2. (A) Map of mid-century (2055–2065) climate analogs for the Moscow Mountain target location (yellow diamond) in northern Idaho, United States. (B) An elevation profile of analog counts for the mid-century (shown in A). A reference period (1961–1990) analog elevation profile is shown for comparison. The dashed horizontal line indicates the elevation of the target location.
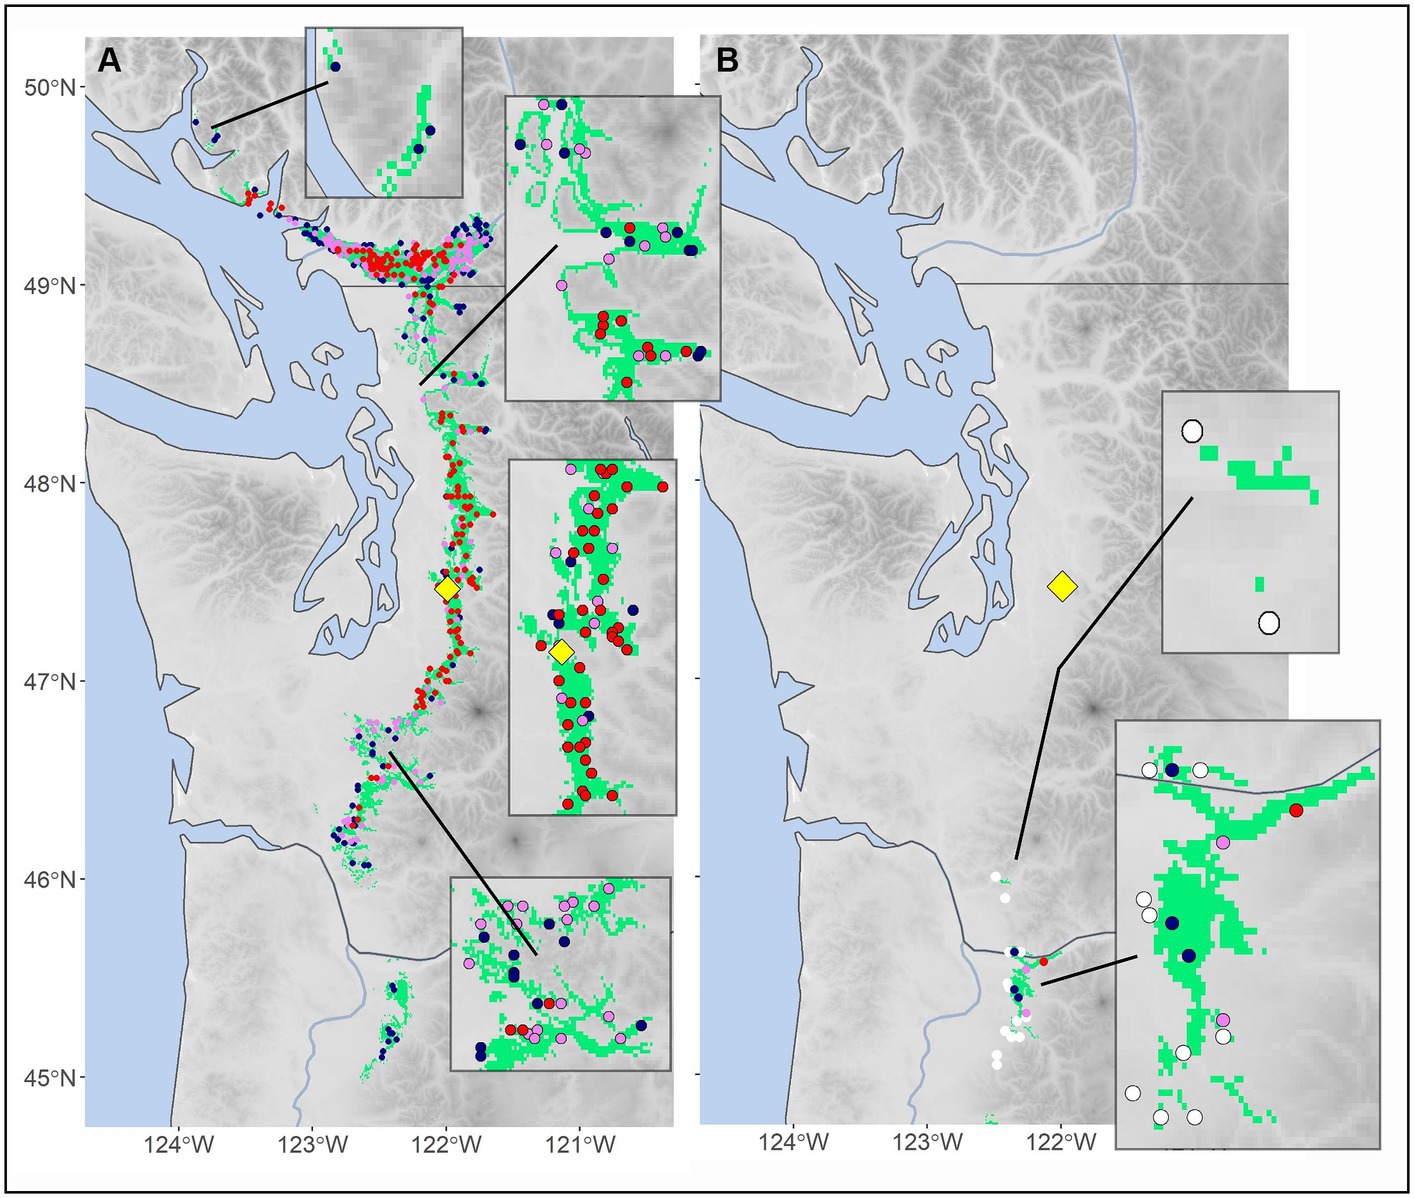
Figure 3. (A) Reference period climate (1961–1990) and (B) mid-century (2055–2065) analogs (colored circles) for the target location, Tiger Mountain, in the Pacific Northwest (Oregon and Washington, United States). The yellow diamond indicates the target location, with strong, moderate, and weak analogs represented as red, violet, and blue colored circles, respectively. In (B), white circles show nearest neighbors too distant to be considered analogs. The green gridded polygon represents areas under all three classes (i.e., weak to strong threshold).
The single strong analog to the future climate of the Tiger Mountain target offers a glimpse at the internal functioning of the climate distance function. During the reference period, the target had a mean annual temperature (MAT) = 9.7°C and a mean annual precipitation (MAP) = 1,664 mm. According to the mean of 13 GCM climates for 2060, the future climate at this site would have MAT = 12.9°C and MAP = 1,683 mm. Our algorithm locates the strongest climate analog (red dot, Figure 3B) to this site at 211 km to the south and 250 m lower in elevation, having a reference period MAT = 11.7°C and MAP = 1,676 mm. The future climate of the target and the reference period climate of the closest neighbor have a climate distance of 0.591, slightly beneath the strong analog threshold for two sites differing by 1.2°C in MAT and 19 mm in MAP.
By assessing the vegetation components of analog sites, we would conclude that at Tiger Mountain, the reference period vegetation that is dominated by Pseudotsuga menziesii and Thuja plicata would continue to be suited to the future climate. Yet, it is probable that the most suitable populations for the mid-century climate would originate from the south and lower elevations. Further examples from other biomes with varied analog outputs are provided in the Supplementary Figures S2–S5.
4 Discussion
We present a climate distance–nearest neighbor approach to locating mid-century climate analogs by searching biome and species inventory databases containing climate estimates for point locations. The approach is independent of species genetic information. Populations of all species occurring at the analog site should be suited to the mid-century climate of the target location. This species independence is a distinguishing feature of our approach from trait-based seed transfer approaches (e.g., Rehfeldt et al., 2014; Richardson and Chaney, 2018) and carries advantages and disadvantages for developing seed transfer guidance. The advantage is that the approach can be applied without genetic information, which would benefit many research limited plant species, especially in regions or countries with high biodiversity. The disadvantage is that this approach can potentially be excessively specific to generalists, species that have broad adaptive clines [e.g., Pinus monticola (Richardson et al., 2009) and Thuja plicata (Rehfeldt et al., 2020)]. For instance, the analogs found for an Ontario, Canada location (Supplementary Figure S4) are closely consistent with results of niche models coupled with genecology estimates made for two species of the region, Pinus strobus (Joyce and Rehfeldt, 2013) and Picea mariana (Joyce and Rehfeldt, 2017), but the species-specific models provide land managers with greater flexibility in obtaining seed. Nonetheless, our analog approach can be guided using lower thresholds (moderate or weak) for species that are thought to be generalist.
We take the rationale that GCMs and RCPs largely vary in the timing of climate change (Rehfeldt et al., 2012, 2014; Joyce and Rehfeldt, 2013), rather than if climate change will occur. Accordingly, given the variability among climate model projections and carbon emission scenarios, we chose to provide a consensus based on an average of 13 GCMs. Our focus is mid-century, as these projections would have higher certainty than longer timeframes (Fitzpatrick et al., 2018) and are within long-term timeframes of land management planning and lifespans of the organisms that occupy existing ecosystems.
As a basis for discussing our approach, we consider case studies for four themes: management implications for the high latitudes of Canada’s boreal forest where climate change is projected to be most pronounced, climate novelty in the Great Basin of western United States, conservation concerns in Mexico’s Transvolcanic region, and assisted migration to accommodate shifts in forest composition. Maps contained in the Supplementary Material provide additional natural resource implications for diverse geographic regions.
4.1 High latitude analogs
High latitudes (>58°N) target locations showcase the pronounced and varied vegetation transitions predicted from mid-century climate change. Two target locations that illustrate this variation in spatial distances required to accommodate climate-adapted plant species and populations are found in northern British Columbia (Figure 4)—Muncho Lake and Fort Nelson. These two locations are at similar latitudes and separated by 175 km, but the former is in Canada’s Western Cordilleran Physiographic Province, while the latter is in the Interior Plains Province and is 450 m lower in elevation. Our analog analysis, using the biome database (Table 1), suggested that the reference period at Muncho Lake was suited to vegetation from the Canadian taiga tending toward transition with tundra vegetation (Supplementary Table S5). Mid-century strong analogs indicated boreal vegetation without tundra and were found ~150 m lower and ~ 500 km southeast of the site (Figure 4A). At Fort Nelson, reference period analogs were boreal, but mid-century analogs suggested that the vegetation could transition from boreal to northern temperate hardwoods, currently occurring about 1,900 km to the southeast (Figure 4B). Further analyses using the eastern inventory database (Table 1) suggested that eastern species such as Acer rubra, Fraxinus nigra and Quercus species would be suited to the future climate at Fort Nelson. Although boreal species such as Betula papyrifera, Picea mariana, and Abies balsamea should continue to persist at Fort Nelson, the populations most suited to the mid-century climate currently occur far to the southeast.
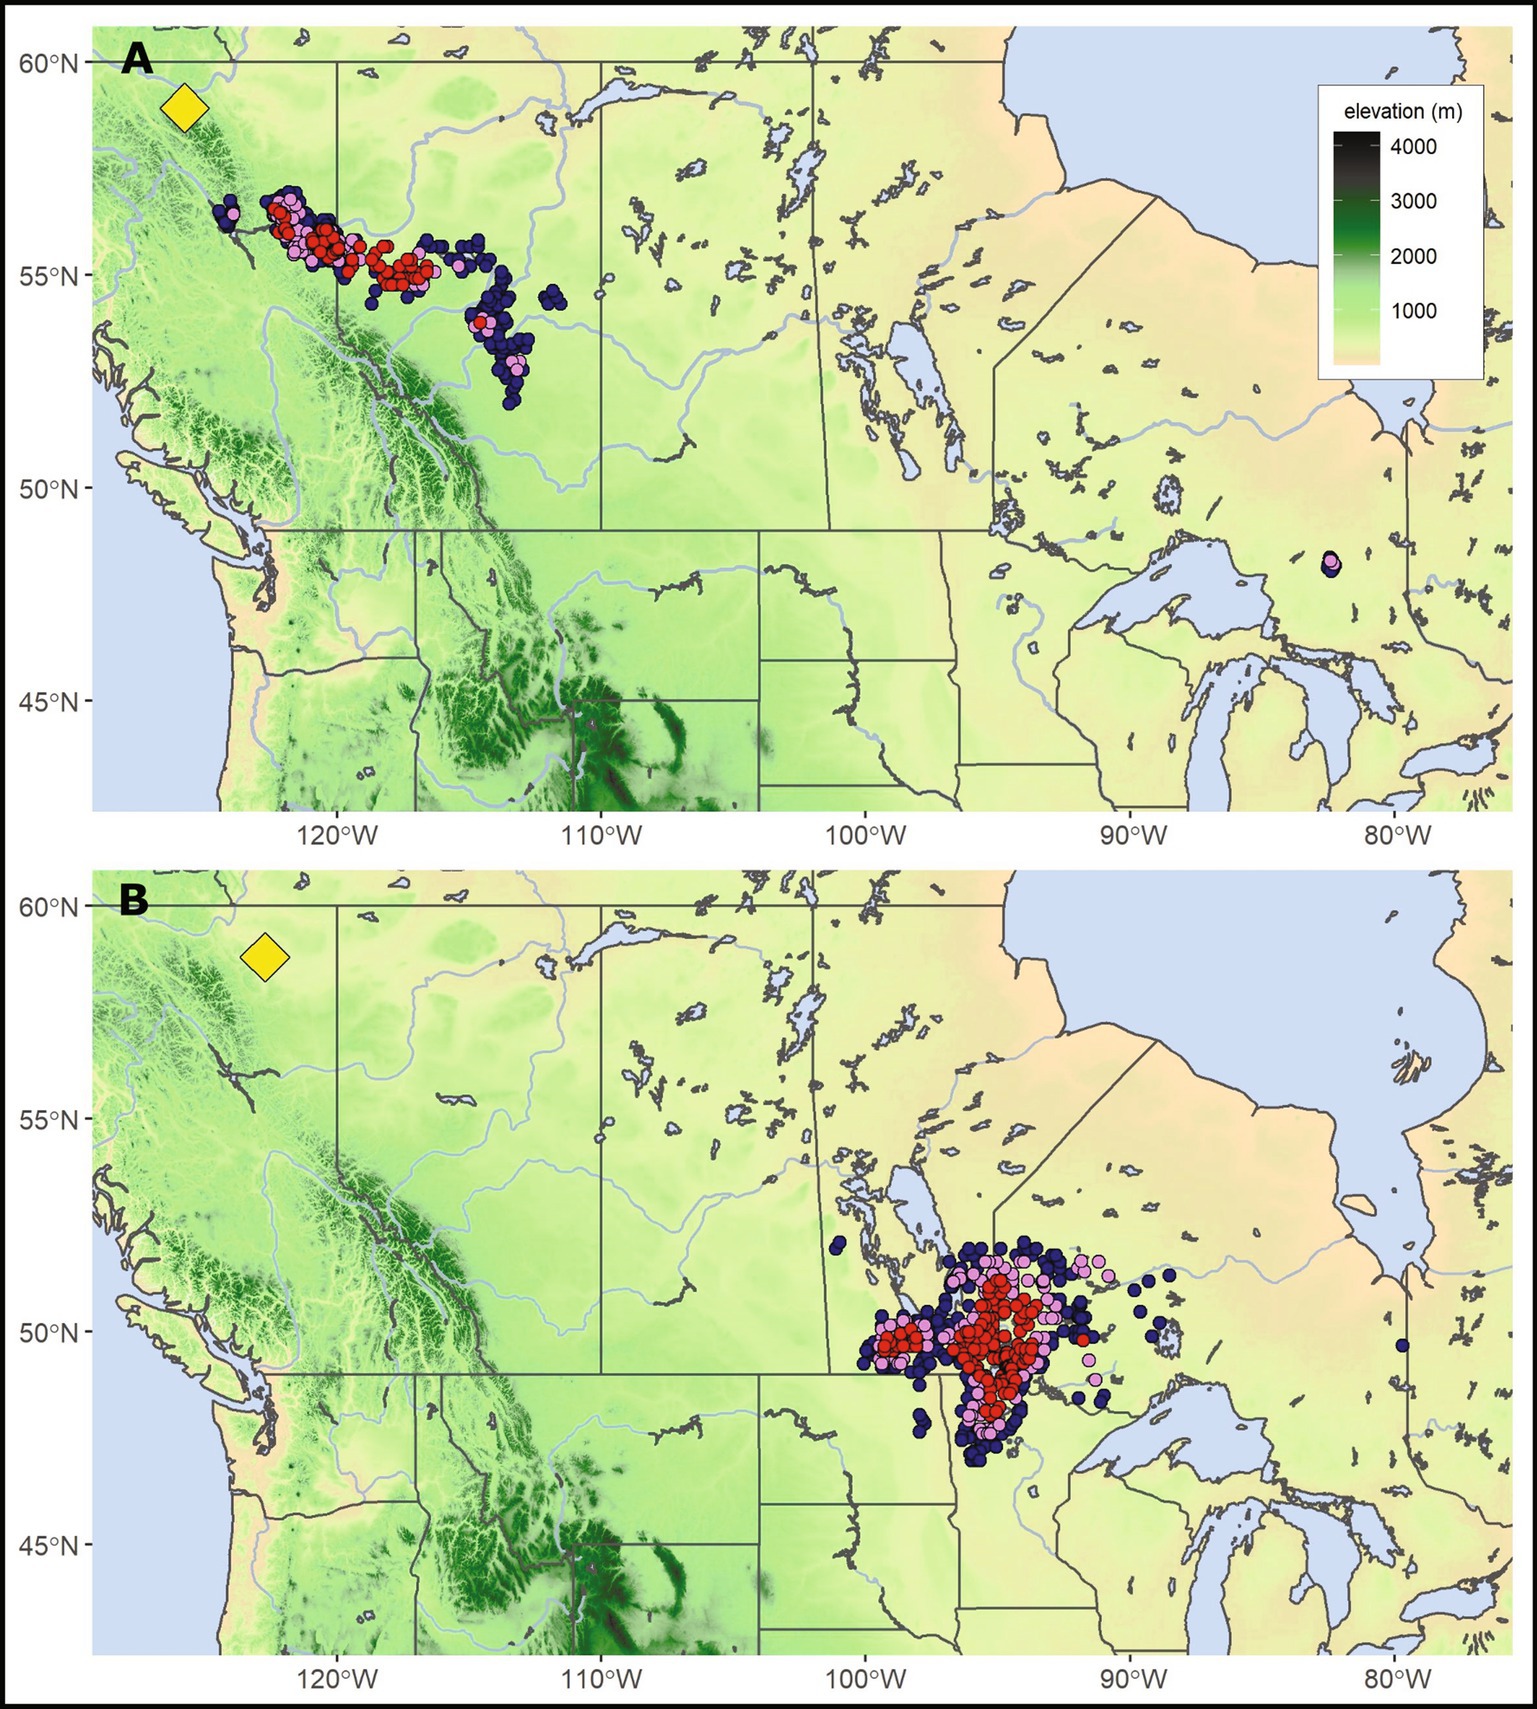
Figure 4. A comparison of boreal forest analog variation under mid-century climate. Target locations Muncho Lake (A) within the Western Cordilleran Physiographic Province and Fort Nelson (B) within the Interior Plains Province are boreal forest sites separated by 175 km and 450 m in elevation. The yellow diamond indicates the target location with mid-century strong, moderate, and weak analogs represented as red, violet, and blue circles, respectively.
4.2 Challenges to restoration in the Great Basin
Sagebrush ecosystems are widespread plant communities in the cold deserts of western North America. Target locations of sagebrush indicated decreasing availability of mid-century analogs with decreasing elevation. Low elevation sites (<1,400 m) trended toward no analogs (e.g., Figures 5A,B), while higher elevation sites (>2,000 m) maintained or gained analogs (Figures 5C,D). Using a broader examination of 60 sagebrush sites, we found that target locations abruptly decreased from abundant analogs to no analogs as summer dryness index (SDI, Supplementary Table S2) increased >0.2 (Figure 6). The relationship between SDI and analog abundance suggested that the warmest and driest Great Basin sagebrush sites could have climate novelty by mid-century. Given the general geographic overlap between our predicted climate novelty, regions of low sagebrush resistance and resilience (Chambers et al., 2023), predicted range contraction of big sagebrush (Artemisia tridentata, Still and Richardson, 2015), and the occurrence of invasive cheatgrass (Bromus tectorum, Bradley and Mustard, 2006), it is plausible that invasive species could be both a predictor and outcome of climate novelty at least in Great Basin. Elsewhere, these trends may be more unpredictable (Bradley et al., 2010). Further examples of locations with varying abundance of mid-century analogs are shown in the Southeast (Supplementary Figure S5) and Pacific Northwest, United States (Supplementary Figure S6). The areas surrounding these no-analog locations have been identified in other studies as regions with novel future climates (Rehfeldt et al., 2012; Mahony et al., 2017).
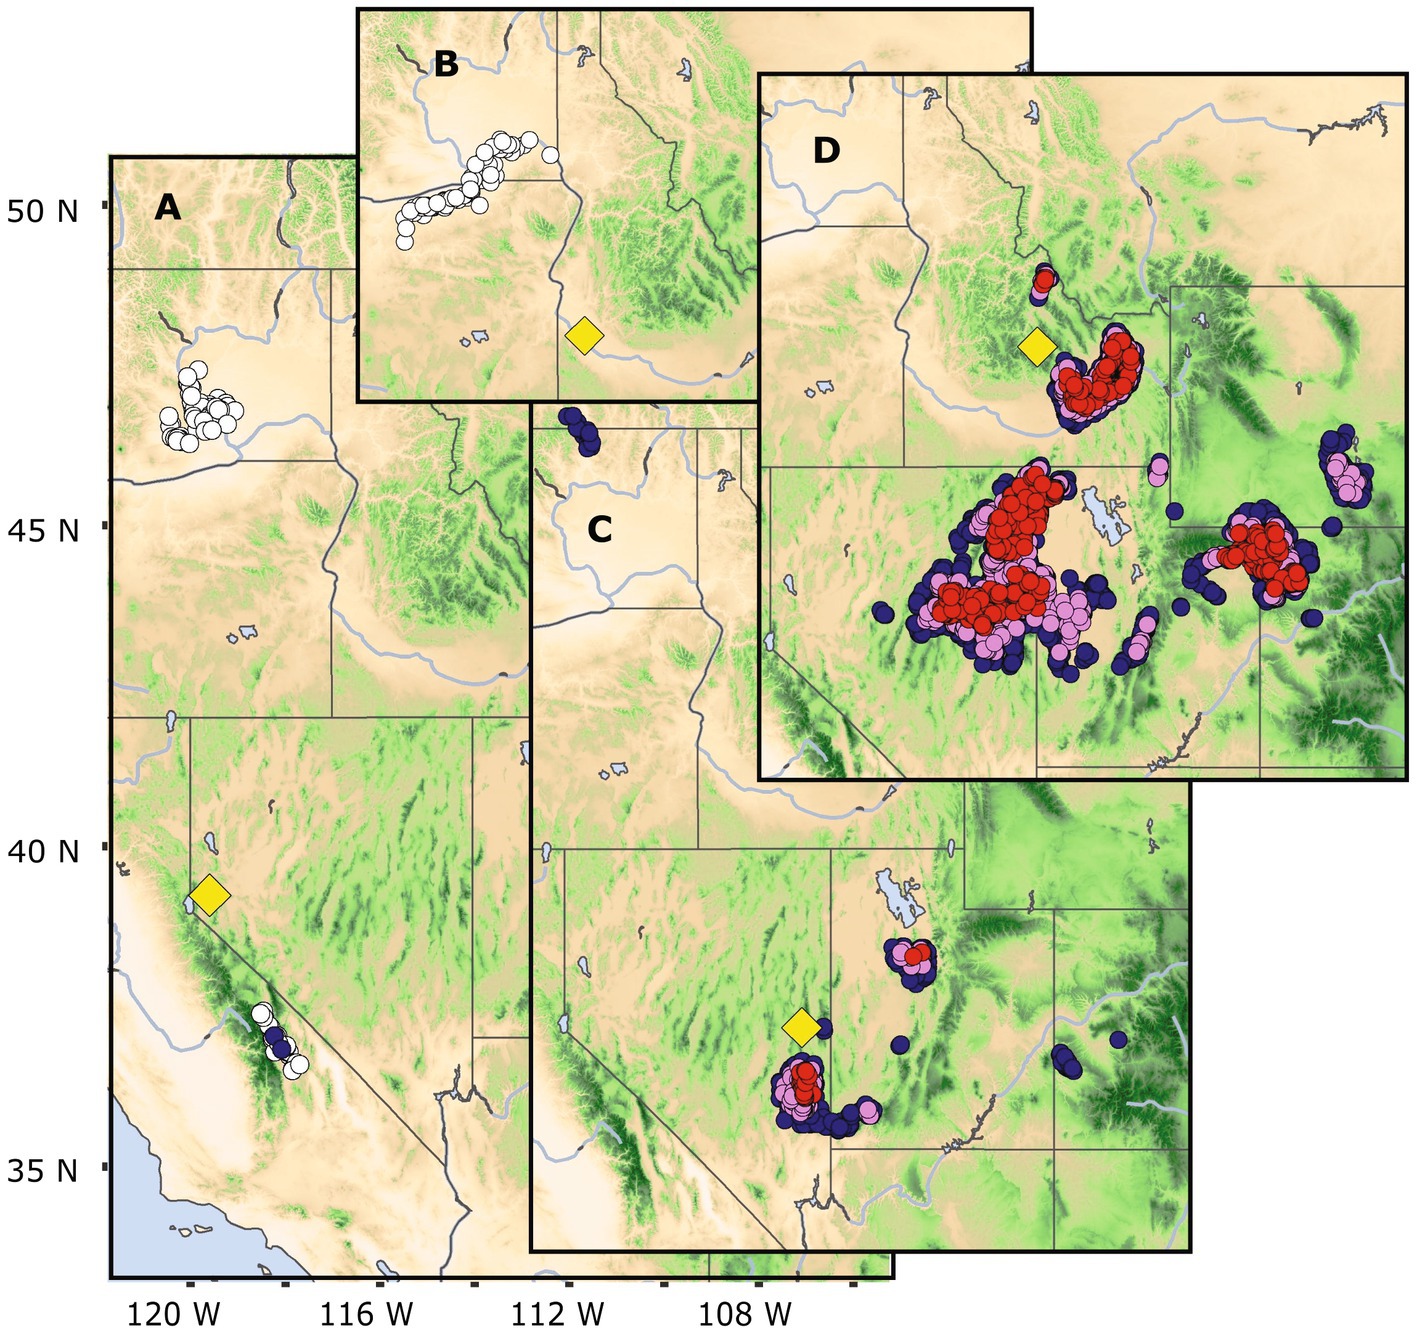
Figure 5. Sagebrush target locations, Dayton (A), Birds of Prey (B), Conner Canyon (C), and Trail Creek (D) in the USA intermountain region, showing mid-century analogs sites. Lower elevation sagebrush sites, (A,B) have few to no analogs, respectively. Higher elevation sagebrush sites, (C,D) have numerous analogs during the mid-century. The yellow diamonds indicate the target locations, with strong, moderate, and weak analogs represented as red, violet, and blue colored circles, respectively. White circles show nearest neighbors >0.84 threshold, too distant to be considered analogs.
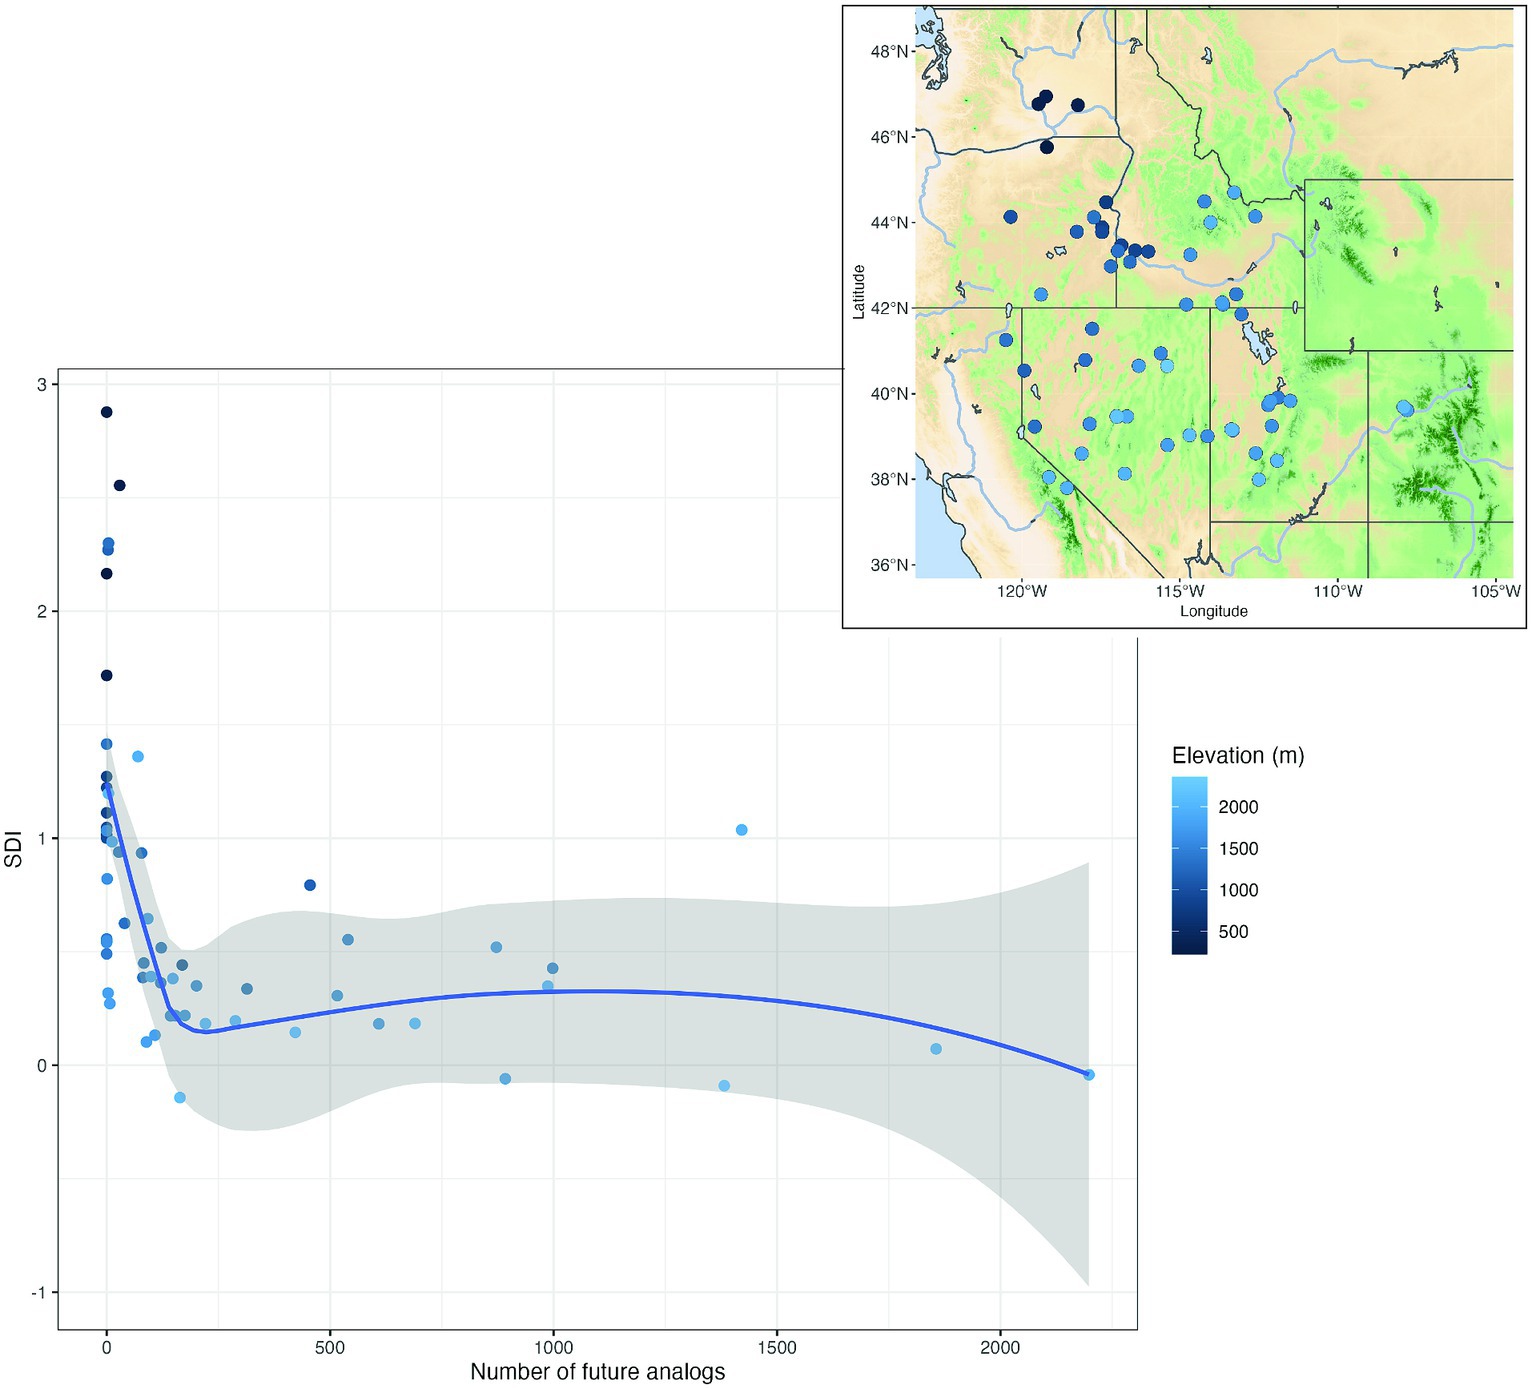
Figure 6. Plotted relationship between the number of mid-century analogs (strong, moderate, and weak) at 60 target locations and summer dryness index (SDI, Supplementary Table S2). The grayed area surrounding the fitted line represents the 95% confidence interval. Target locations are displayed in the map inset. Target locations are shown on the map inset and elevations (m) of the targets are shown in a blue gradient.
Management actions suitable for no analog climates are largely unexplored. As shown repeatedly in the paleoecologic record (e.g., Ackerly, 2003), plant associations change as, presumably, competitive interactions among species readjust. Perhaps, therefore, a ‘wait and see’ or ‘let nature take its course’ approach would be the most reasonable. However, these strategies would have to be weighed against risks to threatened and endangered species and ecosystem services. Assisted migration may be a critical component to ecosystem restoration for novel climates, but with no recent historical ecological context to the predicted climates [see Burke et al. (2018)], information is extremely limited to guide management (Mahony et al., 2017).
4.3 Conservation of Mexico’s transvolcanic region
Mexico’s transvolcanic region (an east–west mountain range of high elevations at central Mexico, also known as Trans-Mexican Volcanic Belt) provides examples of analog analyses useful for conservation planning (Figure 7). Forest species, such as Pinus hartwegii and Abies religiosa that occur near timberline in Mexico’s transvolcanic forests, face diminishing opportunities for range expansion, as these species already occur on mountain tops during the reference period. At Nevado de Toluca (examined site at 3,827 m elevation; summit of the volcano at 4,680 m elevation; Figure 7C), the present vegetation is pure P. hartwegii. Analogs to the future climate support the decline of P. hartwegii dominance from 86 to 50%, while A. religiosa and several pine species should be suited to the new climate increases from absent to 67% (Supplementary Table S6).
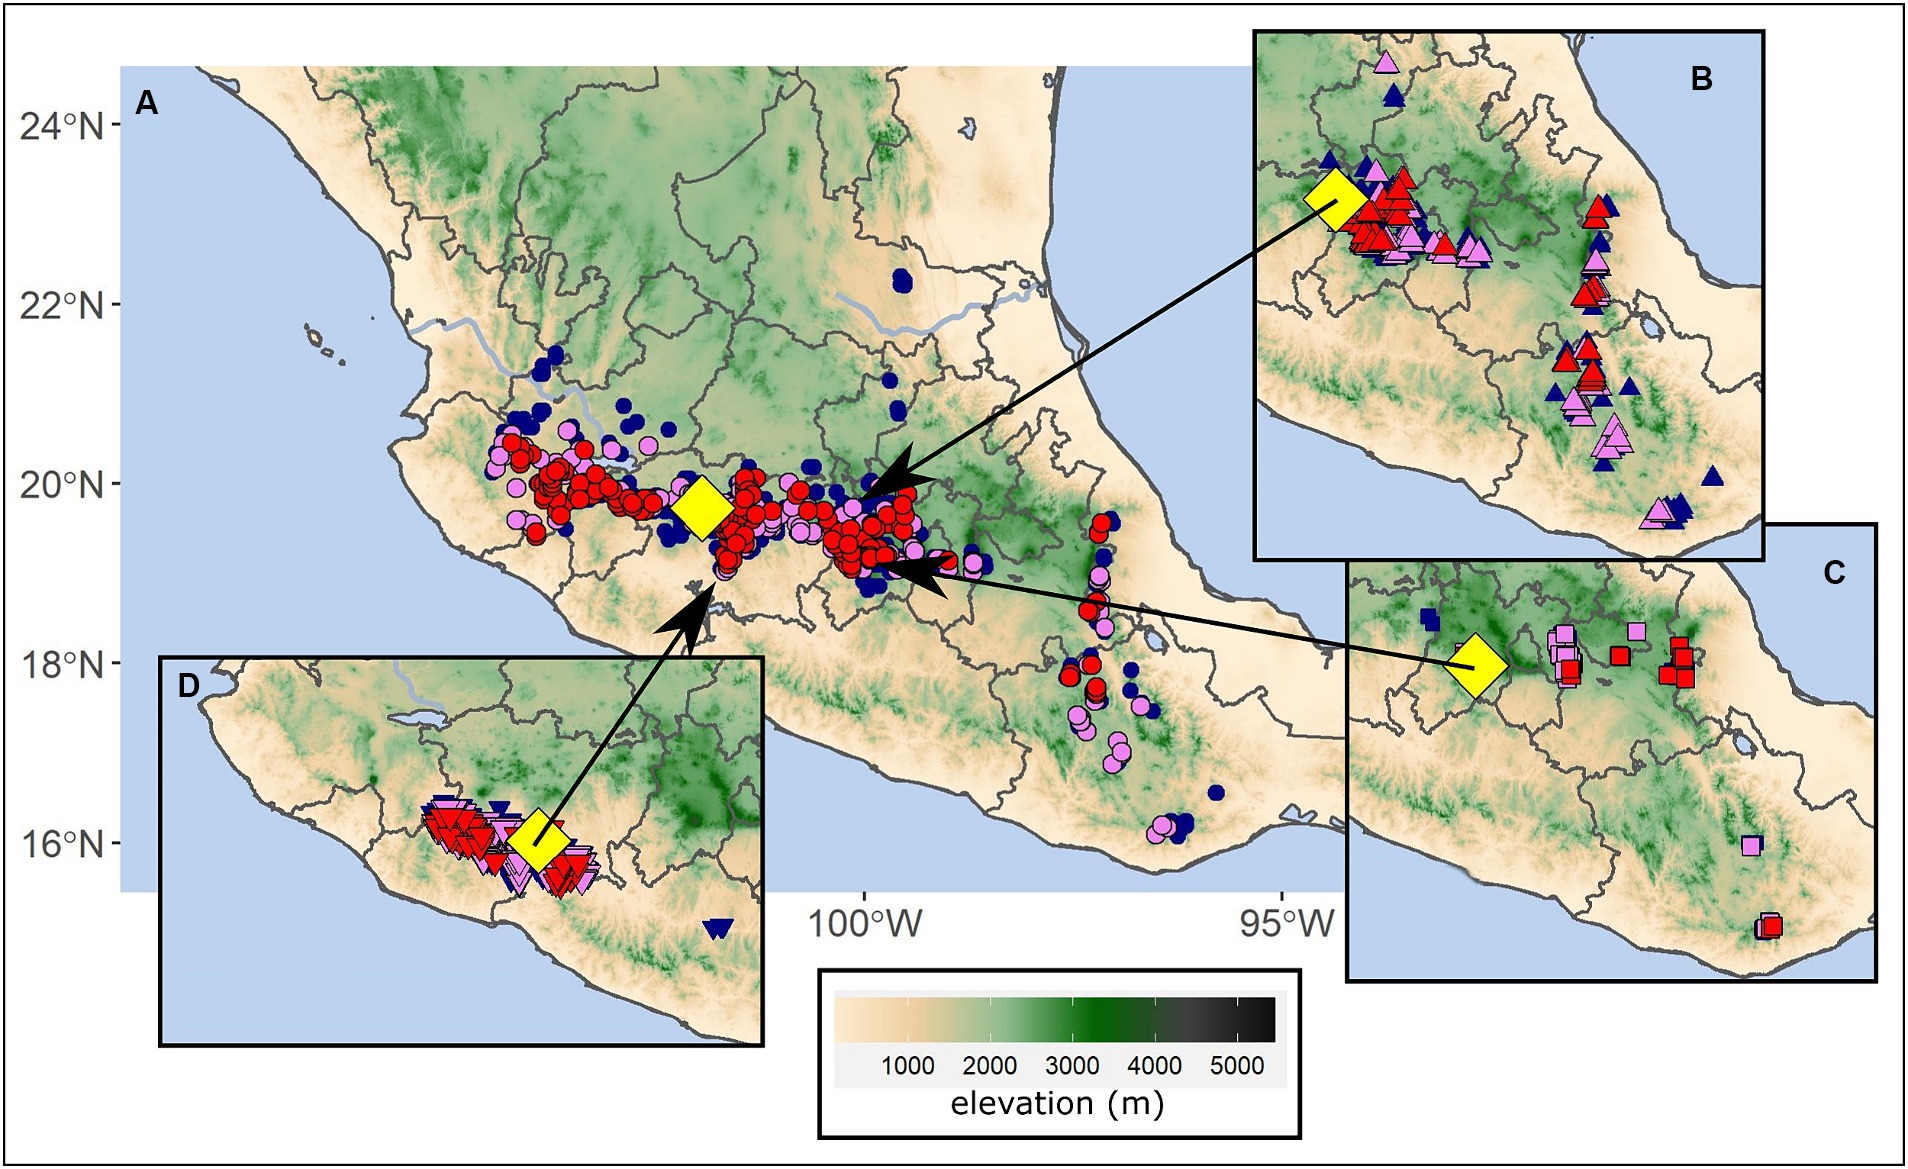
Figure 7. Forest commercial (A) and conservation (B–D) target locations of concern in Mexico. Mid-century analogs are shown for target locations (A) Cherán, (B) Monera Alta (Monarch Butterfly Biosphere Reserve), (C) Nevado de Toluca volcano, and (D) El Chocolate. The yellow diamonds indicate the target locations with strong, moderate, and weak analogs represented as red, violet, and blue colored circles, respectively.
As the primary host of overwintering migratory Monarch butterfly populations (Sáenz-Romero et al., 2012), A. religiosa replacement is of utmost concern at Monera Alta (Figure 7B), which is located within the core area of the Monarch Butterfly Biosphere Reserve, at the border of Michoacán and México states. Mid-century analogs suggest A. religiosa will have reduced presence, from 83% occurrence at the reference period to 47% occurrence at mid-century. Suitability of species from warmer habitats, particularly Pinus pseudostrobus, will likely increase with the strong analogs 500 m lower in elevation (Supplementary Table S6).
Meanwhile, 98 km to the east, P. hartwegii currently inhabits the Nevado de Toluca site at 3,800 m, slightly below the timberline at 4,000 m (Figure 7C). At mid-century this site is expected to provide suitable habitat for the populations of A. religiosa currently at Monera Alta (Supplementary Table S6). Transfer of A. religiosa from Monera Alta to Nevado de Toluca would be a change in elevation of approximately 400 m (Figure 7C).
Similarly, El Chocolate, Michoacán state, is a tropical dry forest site at low elevation (851 m) supporting a complex mixture of dry tropical forest species. The highly biodiverse forest composition is currently a critical habitat for guacamayas (Ara militaris), a migratory macaw. Our analysis shows that mid-century strong analogs are limited in number (78) compared to the reference period (224), are quite local, and average 550 m below the El Chocolate site (Figure 7D), where the species composition is primarily thornscrub species (Supplementary Table S7). Given the endemism of guacamayas to their habitat and the endemic, biodiverse Mexican dry tropical forests (Cué-Bär et al., 2006a,b), a change in composition from dry tropical to thornscrub will likely have considerable and unforeseen effects on guacamayas foraging opportunities and other dependent fauna.
4.4 Vegetation change and assisted migration
Shifts in vegetation observed through climate analogs illustrate the potential downstream effects on ecosystem services. In Mexico, Pinus pseudostrobus is the dominant and most important commercial pine species in the Trans-Mexican Volcanic Belt. The mid-century analogs for pine forests at Cherán, Michoacán state (Figure 7A) were relatively abundant, with a total of 399 strong analogs (Supplementary Table S7), occurring at lower elevations on the slopes of the surrounding mountains mainly in the volcanic belt but also in the Sierra Madre Occidental and Sierra Madre Oriental (Figure 7A). The vegetation is currently dominated by Pinus pseudostrobus with Pinus montezumae in the colder sites, which was reflected in the reference period analogs. Mid-century analogs, however, suggest a change in composition to species suited to warmer and drier habitats, such as Pinus devoniana and even the nearly tropical Pinus oocarpa, and decreased prevalence of P. pseudostrobus (Supplementary Table S6).
Forest species composition changes are projected elsewhere in North America. Target locations, Blanca Peak and Uinta River, in the Rocky Mountains, United States, show a shift from cool- to warm-adapted species. At the Blanca Peak site, subalpine species (e.g., Pinus contorta and Picea engelmannii) are projected to decline or disappear based on the species composition of mid-century analogs. Analogs are found 569 m on average below the target location, supporting an increasing prevalence of species typically occupying warmer habitats (e.g., Pinus ponderosa, Pinus edulis, and Quercus gambelii; Supplementary Figure S7 and Supplementary Table S8). Along the Uinta River, an elevational transect of four target locations plotted between 1,800 and 2,800 m, similar species shifts emerged (Supplementary Figure S8). A declining presence of mid- and upper-montane species (e.g., Pinus contorta and Abies lasiocarpa) were projected (Supplementary Table S9), and there was a decline in the abundance of analogs, especially strong analogs (Supplementary Figure S8), at high elevation. The current species are projected to be replaced by juniper woodlands at mid-elevations (Supplementary Table S9).
4.5 Pros, cons and assumptions
Our approach simplifies seed transfer by standardizing a large set climate variables that generalizes plant-climate adaptation. As a result, it is ideally suited to species for which genecological principles are unknown, at least until result of provenance tests on climatically disparate sites would be available. However, it is important to note that generalized approaches cannot provide the species-specific accuracy of genecology studies or species distribution models where particular variables have greater importance in defining trait variation in the case of genecology or presence or absence of a species in a particular region. All climate variables have equal weight, making our seed transfer approach broadly applicable to plants, but a degree of species-specific precision is lost. Further study will be needed to assess the nuances between species-specific versus generalized seed transfer. Analogs are defined according to genecological patterns of genetic variation in species with the steepest clines. For many species, therefore, our definitions will be overly conservative which, on the one hand, could unduly handicap managers, but, on the other, greatly reduces the risks associated with seed transfer and assisted migration.
As discussed repeatedly, climate-based research carries two caveats when applied to plant ecology. While climate is the primary driver of plant adaptation, other environmental, evolutionary, and ecological factors can play important roles potentially affecting the persistence or transition of vegetation (e.g., Renne et al., 2019). This means that implementation of practical programs requires personnel intimately familiar with local topography, soils, and ecological requirements of the target species (e.g., Winder et al., 2021). Also, ecological impacts projected from GCMs and their scenarios carry the risks associated with the uncertainty of such predictions (IPCC, 2014). Yet, managers have little recourse but to plow ahead.
5 Conclusion
We demonstrate a climate distance approach that effectively reflects the altitudinal clines that shape adaptive variation in plants. Coupled with biome and plant inventory data, our approach can provide generalized seed transfer guidance for species of restoration concern. Our case studies show that mid-century analogs range from 0 to 825 m lower in elevation and eventually can be found in all cardinal directions from the target location. The case studies illustrate: the varied effects mid-century climates can have on plant populations, that regions and local areas may be prone to novel climates, and the potential broad impacts to conservation and ecosystem services. Our goal is to highlight the dynamic changes that will impact plant communities, develop the analytical components for a decision support tool, and identify species and seed sources needed to mitigate mid-century climates.
Data availability statement
The datasets presented in this study can be found in online repositories. The names of the repository/repositories and accession number(s) can be found in the article/Supplementary material.
Author contributions
BR: Conceptualization, Funding acquisition, Methodology, Writing – original draft, Writing – review & editing, Formal analysis. GR: Conceptualization, Data curation, Formal analysis, Methodology, Writing – original draft, Writing – review & editing. CS-R: Conceptualization, Funding acquisition, Writing – original draft, Writing – review & editing. EM: Data curation, Formal analysis, Methodology, Writing – review & editing.
Funding
The author(s) declare financial support was received for the research, authorship, and/or publication of this article. This research was partially funded by the USDA Forest Service, Bipartisan Infrastructure Law Project ERR29 to BR and from the Monarch Butterfly Fund (Madison, Wisconsin, United States) and the Coordinación de la Investigación Científica of the UMSNH to CS-R.
Acknowledgments
We thank Nicholas Crookston and James Worrall for technical assistance, Cameron Amos for helpful suggestions on the manuscript; Arnulfo Blanco-García and Verónica Osuna-Vallejo for information about El Chocolate and Cherán, respectively; and Marcus Warwell for providing site information.
Conflict of interest
The authors declare that the research was conducted in the absence of any commercial or financial relationships that could be construed as a potential conflict of interest.
Publisher’s note
All claims expressed in this article are solely those of the authors and do not necessarily represent those of their affiliated organizations, or those of the publisher, the editors and the reviewers. Any product that may be evaluated in this article, or claim that may be made by its manufacturer, is not guaranteed or endorsed by the publisher.
Supplementary material
The Supplementary material for this article can be found online at: https://www.frontiersin.org/articles/10.3389/ffgc.2024.1325264/full#supplementary-material
References
Ackerly, D. D. (2003). Community assembly, niche conservatism, and adaptive evolution in changing environments. Int. J. Plant Sci. 164, S165–S184. doi: 10.1086/368401
Bower, A. D., St. Clair, J. B., and Erickson, V. (2014). Generalized provisional seed zones for native plants. Ecol. Appl. 24, 913–919. doi: 10.1890/13-0285.1
Bradley, B. A., Blumenthal, D. M., Wilcove, D. S., and Ziska, L. H. (2010). Predicting plant invasions in an era of global change. Trends Ecol. Evol. 25, 310–318. doi: 10.1016/j.tree.2009.12.003
Bradley, B. A., and Mustard, J. F. (2006). Characterizing the landscape dynamics of an invasive plant and risk of invasion using remote sensing. Ecol. Appl. 16, 1132–1147. doi: 10.1890/1051-0761(2006)016[1132:CTLDOA]2.0.CO;2
Burke, K. D., Williams, J. W., Chandler, M. A., Haywood, A. M., Lunt, D. J., and Otto-Bliesner, B. L. (2018). Pliocene and Eocene provide best analogs for near-future climates. Proc National Acad Sci 115, 13288–13293. doi: 10.1073/pnas.1809600115
Cadotte, M. W., Carscadden, K., and Mirotchnick, N. (2011). Beyond species: functional diversity and the maintenance of ecological processes and services. J. Appl. Ecol. 48, 1079–1087. doi: 10.1111/j.1365-2664.2011.02048.x
Castellanos-Acuña, D., Vance-Borland, K. W., St Clair, J. B., Hamann, A., López-Upton, J., Gómez-Pineda, E., et al. (2018). Climate-based seed zones for Mexico: guiding reforestation under observed and projected climate change. New For. 49, 297–309. doi: 10.1007/s11056-017-9620-6
Chambers, J. C., Brown, J. L., Bradford, J. B., Board, D. I., Campbell, S. B., Clause, K. J., et al. (2023). New indicators of ecological resilience and invasion resistance to support prioritization and management in the sagebrush biome, United States. Front. Ecol. Evol. 10:1009268. doi: 10.3389/fevo.2022.1009268
Chaney, L., Richardson, B. A., and Germino, M. J. (2017). Climate drives adaptive genetic responses associated with survival in big sagebrush (Artemisia tridentata). Evol. Appl. 10, 313–322. doi: 10.1111/eva.12440
Crookston, N. L., and Finley, A. O. (2007). yaImpute: an R package for kNN imputation. J. Stat. Softw. 23:16. doi: 10.18637/jss.v023.i10
Cué-Bär, E. M., Villaseñor, J. L., Amezcua, L. A., Tenorio, G. C., and Manríquez, G. I. (2006a). La flora arbórea de Michoacán, México. Bol. Soc. Bot. Méx. 78, 47–81. doi: 10.17129/botsci.1721
Cué-Bär, E. M., Villaseñor, J. L., Morrone, J. J., and Ibarra-Manríquez, G. (2006b). Identifying priority areas for conservation in Mexican tropical deciduous forest based on tree species. Interciencia 31, 712–719.
Dobrowski, S. Z., Abatzoglou, J. T., Greenberg, J. A., and Schladow, S. G. (2009). How much influence does landscape-scale physiography have on air temperature in a mountain environment? Agric. For. Meteorol. 149, 1751–1758. doi: 10.1016/j.agrformet.2009.06.006
Doherty, K. D., Butterfield, B. J., and Wood, T. E. (2017). Matching seed to site by climate similarity: techniques to prioritize plant materials development and use in restoration. Ecol. Appl. 27, 1010–1023. doi: 10.1002/eap.1505
Erickson, V. J., and Halford, A. (2020). Seed planning, sourcing, and procurement. Restor. Ecol. 28, S219–S227. doi: 10.1111/rec.13199
Fitzpatrick, M. C., Blois, J. L., Williams, J. W., Nieto-Lugilde, D., Maguire, K. C., and Lorenz, D. J. (2018). How will climate novelty influence ecological forecasts? Using the quaternary to assess future reliability. Glob. Chang. Biol. 24, 3575–3586. doi: 10.1111/gcb.14138
GLOBE Task Team . (1999). The Global Land One-kilometer Base Elevation (GLOBE) Digital Elevation Model, Version 1.0. National Oceanic and Atmospheric Administration, National Geophysical Data Center, Broadway, Boulder, Colorado, U.S.A.
Gower, J. C. (1971). A general coefficient of similarity and some of its properties. Biometrics 27, 857–874. doi: 10.2307/2528823
Hansen, J. E., Sato, M., Simons, L., Nazarenko, L. S., Sangha, I., Kharecha, P., et al. (2023). Global warming in the pipeline. Oxford Open Climate Change 3:kgad008. doi: 10.1093/oxfclm/kgad008
Hijmans, R. J., Bivand, R., Pebesma, E., and Sumner, M. D. (2022). Terra: spatial data analysis. Available at: https://cran.r-project.org/web/packages/terra/
Holden, Z. A., Crimmins, M. A., Cushman, S. A., and Littell, J. S. (2011). Empirical modeling of spatial and temporal variation in warm season nocturnal air temperatures in two North Idaho mountain ranges, USA. Agric. For. Meteorol. 151, 261–269. doi: 10.1016/j.agrformet.2010.10.006
IPCC , (2014). Climate change 2014: synthesis report. Contribution of working groups I, II and III to the fifth assessment report of the intergovernmental panel on climate change. eds. Core Writing Team, R. K. Pachauri and L. A. Meyer (Geneva, Switzerland), 151.
Joyce, D. G., and Rehfeldt, G. E. (2013). Climatic niche, ecological genetics, and impact of climate change on eastern white pine (Pinus strobus L.): guidelines for land managers. For. Ecol. Manag. 295, 173–192. doi: 10.1016/j.foreco.2012.12.024
Joyce, D. G., and Rehfeldt, G. E. (2017). Management strategies for black spruce (Picea mariana (mill.) B.S.P.) in the face of climate change: climatic niche, clines, climatypes, and seed transfer. Forestry 90, 594–610. doi: 10.1093/forestry/cpx018
Leites, L., and Benito-Garzón, M. (2023). Forest tree species adaptation to climate across biomes: building on the legacy of ecological genetics to anticipate responses to climate change. Glob. Chang. Biol. 29, 4711–4730. doi: 10.1111/gcb.16711
Mahony, C. R., Cannon, A. J., Wang, T., and Aitken, S. N. (2017). A closer look at novel climates: new methods and insights at continental to landscape scales. Glob. Chang. Biol. 23, 3934–3955. doi: 10.1111/gcb.13645
McKay, J. K., Christian, C. E., Harrison, S., and Rice, K. J. (2005). “How local is local?”—a review of practical and conceptual issues in the genetics of restoration. Restor. Ecol. 13, 432–440. doi: 10.1111/j.1526-100x.2005.00058.x
Michalak, J. L., Lawler, J. J., Roberts, D. R., and Carroll, C. (2018). Distribution and protection of climatic refugia in North America. Conserv. Biol. 32, 1414–1425. doi: 10.1111/cobi.13130
Pike, C., Potter, K. M., Berrang, P., Crane, B., Baggs, J., Leites, L., et al. (2020). New seed-collection zones for the eastern United States: the eastern seed zone forum. J. For. 118, 444–451. doi: 10.1093/jofore/fvaa013
Putz, T. R., Urza, A. K., Hankin, L. E., and Bisbing, S. M. (2021). Seasonal water availability drives trait variation in isolated basin and range Pinus ponderosa. For. Ecol. Manag. 488:119022. doi: 10.1016/j.foreco.2021.119022
R Development Core Team . (2021). R: A language and environment for statistical computing. R Foundation for Statistical Computing, Vienna, Austria.
Ramírez-Villegas, J., Lau, C., Köhler, A.-K., Signer, J., Jarvis, A., Arnell, N., et al. (2011). Climate analogues: finding tomorrow’s agriculture today. Working paper no. 12. Cali, Colombia: CGIAR research program on climate change, Agriculture and Food Security (CCAFS). Available at: www.ccafs.cgiar.org
Rehfeldt, G. E. (1986). Adaptive variation in Pinus ponderosa from intermountain regions. I Snake and Salmon River basins. For. Sci. 32, 79–92. doi: 10.1093/forestscience/32.1.79
Rehfeldt, G. E. (1994a). Adaptation of Picea engelmannii populations to the heterogeneous environments of the intermountain west. Can. J. Bot. 72, 1197–1208. doi: 10.1139/b94-146
Rehfeldt, G. E. (1994b). “Evolutionary genetics, the biological species and the ecology of the interior cedar-hemlock forests,” in Proceedings of the symposium: interior cedar-hemlock-white pine forests: ecology and management. eds. D. M. Baumgartner, J. E. Lotan, and J. R. Tonn. Spokane, WA, USA, 2–4.
Rehfeldt, G. E. (2006). A spline model of climate for the Western United States. Gen. Tech. Rep. RMRS-GTR-165. Fort Collins, CO: U.S. Department of Agriculture, Forest Service, Rocky Mountain Research Station. 21 p., 165.
Rehfeldt, G. E., Crookston, N. L., Saenz-Romero, C., and Campbell, E. M. (2012). North American vegetation model for land-use planning in a changing climate: a solution to large classification problems. Ecol. Appl. 22, 119–141. doi: 10.1890/11-0495.1
Rehfeldt, G. E., Jaquish, B. C., Sáenz-Romero, C., Joyce, D. G., Leites, L. P., Clair, J. B. S., et al. (2014). Comparative genetic responses to climate in the varieties of Pinus ponderosa and Pseudotsuga menziesii: reforestation. For. Ecol. Manag. 324, 147–157. doi: 10.1016/j.foreco.2014.02.040
Rehfeldt, G. E., Warwell, M. V., and Monserud, R. A. (2020). Species, Climatypes, climate change, and Forest health: a conversion of science to practice for inland northwest (USA) forests. Forests 11:1237. doi: 10.3390/f11121237
Rehfeldt, G. E., Worrall, J. J., Marchetti, S. B., and Crookston, N. L. (2015). Adapting forest management to climate change using bioclimate models with topographic drivers. Forestry 88, 528–539. doi: 10.1093/forestry/cpv019
Renne, R. R., Bradford, J. B., Burke, I. C., and Lauenroth, W. K. (2019). Soil texture and precipitation seasonality influence plant community structure in north American temperate shrub steppe. Ecology 100:e02824. doi: 10.1002/ecy.2824
Richardson, B. A., and Chaney, L. (2018). Climate-based seed transfer of a widespread shrub: population shifts, restoration strategies, and the trailing edge. Ecol. Appl. 28, 2165–2174. doi: 10.1002/eap.1804
Richardson, B. A., Germino, M. J., Warwell, M. V., and Buerki, S. (2021). The role of genome duplication in big sagebrush growth and fecundity. Am J Bot 108, 1405–1416. doi: 10.1002/ajb2.1714
Richardson, B. A., Rehfeldt, G. E., and Kim, M. S. (2009). Congruent climate-related Genecological responses from molecular markers and quantitative traits for Western white pine (Pinus monticola). Int. J. Plant Sci. 170, 1120–1131. doi: 10.1086/605870
Sáenz-Romero, C. (2023). Arriving at a tipping point for worldwide forest decline due to accelerating climatic change. For. Chron. 99, 1–3. doi: 10.5558/tfc2024-003
Sáenz-Romero, C., Rehfeldt, G. E., Crookston, N. L., Duval, P., St-Amant, R., Beaulieu, J., et al. (2010). Spline models of contemporary, 2030, 2060 and 2090 climates for Mexico and their use in understanding climate-change impacts on the vegetation. Clim. Chang. 102, 595–623. doi: 10.1007/s10584-009-9753-5
Sáenz-Romero, C., Rehfeldt, G. E., Duval, P., and Lindig-Cisneros, R. A. (2012). Abies religiosa habitat prediction in climatic change scenarios and implications for monarch butterfly conservation in Mexico. For. Ecol. Manag. 275, 98–106. doi: 10.1016/j.foreco.2012.03.004
Shryock, D. F., DeFalco, L. A., and Esque, T. C. (2018). Spatial decision-support tools to guide restoration and seed-sourcing in the desert southwest. Ecosphere 9:e02453. doi: 10.1002/ecs2.2453
Sorensen, F. C. (1992). “Genetic variation and seed transfer guidelines for lodgepole pine in Central Oregon” in Research paper PNW-RP-453 (Portland, OR: USDA Forest Service, Pacific Northwest Research Station).
Sorensen, F. C. (1994). “Genetic variation and seed transfer guidelines for ponderosa pine in Central Oregon” in Research paper PNW-RP-472 (Portland, OR: USDA Forest Service, Pacific Northwest Research Station).
St Clair, J. B., Mandel, N. L., and Vance-Borland, K. W. (2005). Genecology of Douglas fir in Western Oregon and Washington. Ann. Bot. 96, 1199–1214. doi: 10.1093/aob/mci278
St Clair, J. B., Richardson, B. A., Stevenson-Molnar, N., Howe, G. T., Bower, A. D., Erickson, V. J., et al. (2022). Seedlot selection tool and climate-smart restoration tool: web-based tools for sourcing seed adapted to future climates. Ecosphere 13:e4089. doi: 10.1002/ecs2.4089
Still, S. M., and Richardson, B. A. (2015). Projections of contemporary and future climate niche for Wyoming big sagebrush (Artemisia tridentata subsp. wyomingensis): a guide for restoration. Nat. Areas J. 35, 30–43. doi: 10.3375/043.035.0106
Van Vuuren, D. P., Edmonds, J., Kainuma, M., Riahi, K., Thomson, A., Hibbard, K., et al. (2011). The representative concentration pathways: an overview. Clim. Chang. 109, 5–31. doi: 10.1007/s10584-011-0148-z
Winder, R. S., Kranabetter, J. M., and Pedlar, J. H. (2021). Soils and landscape restoration. Academic Press. 275–297.
Keywords: assisted migration, climate change, decision support tool, Euclidean distance, novel climates, reforestation, restoration, vegetative transition
Citation: Richardson BA, Rehfeldt GE, Sáenz-Romero C and Milano ER (2024) A climate analog approach to evaluate seed transfer and vegetation transitions. Front. For. Glob. Change. 7:1325264. doi: 10.3389/ffgc.2024.1325264
Edited by:
Alison D. Munson, Laval University, CanadaReviewed by:
Catherine Périé, Ministère des Ressources Naturelles et des Forêts du Québec, CanadaSilvio Schueler, Austrian Research Centre for Forests (BFW), Austria
Kevin M. Potter, United States Department of Agriculture, United States
Copyright © 2024 Richardson, Rehfeldt, Sáenz-Romero and Milano. This is an open-access article distributed under the terms of the Creative Commons Attribution License (CC BY). The use, distribution or reproduction in other forums is permitted, provided the original author(s) and the copyright owner(s) are credited and that the original publication in this journal is cited, in accordance with accepted academic practice. No use, distribution or reproduction is permitted which does not comply with these terms.
*Correspondence: Bryce A. Richardson, bryce.richardson2@usda.gov