Estimating carbon sequestration potential and optimizing management strategies for Moso bamboo (Phyllostachys pubescens) forests using machine learning
 Shaofeng Lv1,2,3
  Ning Yuan1,2,3 Xiaobo Sun1,2,3 Xin Chen1,2,3
  Yongjun Shi1,2,3 Guomo Zhou1,2,3 Lin Xu1,2,3*
- 1State Key Laboratory of Subtropical Silviculture, Zhejiang A&F University, Hangzhou, Zhejiang, China
- 2Key Laboratory of Carbon Cycling in Forest Ecosystems and Carbon Sequestration of Zhejiang Province, Zhejiang A&F University, Hangzhou, China
- 3School of Environmental and Resources Science, Zhejiang A&F University, Hangzhou, China
Estimating the carbon sequestration potential of Moso bamboo (Phyllostachys pubescens) forests and optimizing management strategies play pivotal roles in enhancing quality and promoting sustainable development. However, there is a lack of methods to simulate changes in carbon sequestration capacity in Moso bamboo forests and to screen and optimize the best management measures based on long-term time series data from fixed-sample fine surveys. Therefore, this study utilized continuous survey data and climate data from fixed sample plots in Zhejiang Province spanning from 2004 to 2019. By comparing four different algorithms, namely random forest, support vector machine, XGBoost, and BP neural network, to construct aboveground carbon stock models for Moso bamboo forests. The ultimate goal was to identify the optimal algorithmic model. Additionally, the key driving parameters for future carbon stocks were considered and future aboveground carbon stocks were predicted in Moso bamboo forests. Then formulated an optimal management strategy based on these predictions. The results indicated that the carbon stock model constructed using the XGBoost algorithm, with an R2 of 0.9895 and root mean square error of 0.1059, achieved the best performance and was considered the optimal algorithmic model. The most influential driving parameters for vegetation carbon stocks in Moso bamboo forests were found to be mean age, mean diameter at breast height, and mean culm density. Under optimal management measures, which involve no harvesting of 1–3 du bamboo, 30% harvesting of 4 du bamboo, and 80% harvesting of bamboo aged 5 du and above. Our predictions show that aboveground carbon stocks in Moso bamboo forests in Zhejiang Province will peak at 36.25 ± 8.47 Tg C in 2046 and remain stable from 2046 to 2060. Conversely, degradation is detrimental to the long-term maintenance of carbon sequestration capacity in Moso bamboo forests, resulting in a peak aboveground carbon stock of 29.50 ± 7.49 Tg C in 2033, followed by a continuous decline. This study underscores the significant influence of estimating carbon sequestration potential and optimizing management decisions on enhancing and sustaining the carbon sequestration capacity of Moso bamboo forests.
1 Introduction
Bamboo is a significant component of forest resources, belonging to the bamboo subfamily within the grass family (Gramineae). There are about 87 genera and 1,500 species in the world (Ramakrishnan et al., 2020). Bamboo forests hold significant economic, ecological, and social values in tropical and subtropical regions (Terefe et al., 2019). Despite the decline of forests in many countries, bamboo forest acreage is steadily growing (Yang et al., 2021). China boasts the world’s most abundant and widely distributed bamboo resources. According to the Ninth National Forest Resources Inventory, bamboo forests across the country covers a total area of 6,411,600 ha, with Moso bamboo forests accounting for 4,677,800 ha, representing 72.96% of all bamboo forests (Xu Y. et al., 2023). Moso bamboo (Phyllostachys pubescens) is a bamboo species widely distributed in southern China, and it has evolved into a crucial forest resource in the region owing to its rapid growth and exceptional carbon sequestration capability (Li et al., 2015; Yen, 2015). It stands out as one of the most promising plants for carbon sequestration. Moreover, amid the rapid growth of the modern bamboo industry, bamboo products are gaining popularity among a wider audience. They play a distinctive role in poverty alleviation and the revitalization of rural areas that produce bamboo (Pan et al., 2023). Moso bamboo forests play a vital role in the carbon cycle of forest ecosystems. Therefore, it is essential to assess their carbon sequestration potential and implement optimal management strategies to ensure long-term maintenance of carbon sequestration capacity.
In previous studies (Mao et al., 2017b; Lv et al., 2023; Zhou et al., 2023; Kaam et al., 2024), the majority relied on a variety of remote sensing techniques and ecosystem process models to estimate the carbon stock of Moso bamboo forests, often employing standardized and singular approaches. Most of these studies used Landsat or Landsat TM remote sensing data, along with imagery and ground measurements, to explore the spatial and temporal dynamics and distribution of carbon stocks in Moso bamboo forests using remote sensing techniques and spatial analysis (Xu et al., 2011; Han et al., 2013; Shang et al., 2013; Li Y. et al., 2018). Landsat data offer numerous advantages for estimating carbon stocks in Moso bamboo forests, including multispectral information, global coverage, time-series analysis capabilities and open accessibility. These characteristics make it an effective tool for studying changes in carbon stocks within Moso bamboo forests (Li et al., 2019; Qi et al., 2022). Other researchers have integrated ecosystem models, including growth and carbon cycle models, into Moso bamboo forests (Liu et al., 2021; Camargo García et al., 2023; Yu et al., 2023). They integrated the collected climatic, geographic, growth, and mortality data to parameterize the chosen models, ultimately enabling predictions of ecological processes and carbon stocks within simulated Moso bamboo forests (Li et al., 2016; Mao et al., 2016, 2017b; Kang et al., 2022). However, model accuracy is highly dependent on data quality and model selection, where data quality and model parameterization directly impact simulation accuracy. Combining remote sensing data with process models also allows for predicting aboveground carbon dynamics in bamboo forests (Du et al., 2018). Simulating carbon stocks using extensive remote sensing monitoring data and process modeling introduces a high level of uncertainty and may not precisely represent the production status of bamboo forests. Currently, numerous statistical methods are available for predicting forest carbon stocks. Traditional regression analysis methods may not be sufficient, and the use of machine learning algorithms can quickly and accurately assess the current carbon stock status in Moso bamboo forests (Poorazimy et al., 2020; Zhou et al., 2022; Li et al., 2023).
To accurately predict aboveground carbon stock in Moso bamboo forests and determine the optimal management strategy, long-term fixed-sample plot surveys and climate data were used. At the same time, a variety of machine learning algorithms were used to build aboveground carbon stock models for Moso bamboo forests and aimed to identify the most accurate model for estimation. To predict carbon stock, machine learning algorithms are employed to identify relevant features such as topography, climate conditions, and vegetation indices. Parameters are optimized and adjusted after creating the model, and the algorithm that achieves the highest accuracy is selected for prediction (Silatsa et al., 2020; Reiersen et al., 2022; Uniyal et al., 2022). Different machine learning algorithms produce different levels of accuracy with the same dataset. Previous research on Moso bamboo forest biomass and carbon storage has indicated that models constructed using the XGBoost algorithm are more precise (Li X. et al., 2018, 2023; Gomes et al., 2019). Concurrently, selective harvesting of Moso bamboo forests serves as a crucial strategy to maintain productivity and production levels, leading to enhanced carbon sequestration and the preservation of aboveground productivity (Kuehl et al., 2013; Zheng et al., 2022). Nevertheless, limited reports provide insights into the extent of harvesting intensity and comprehensive management strategies. As a result, this study developed various management approaches and compared them with abandoned Moso bamboo forests. The best management strategies are further determined by predicting future changes in carbon stocks. The main objectives of this study are: (1) To compare aboveground carbon stock models constructed using different machine learning algorithms and select the optimal model. (2) To identify the key drivers influencing aboveground carbon stocks in Moso bamboo forests and predict future parameters. (3) To use the optimal model for predicting carbon stock under various management measures in the future, highlighting the significance of effective management practices for bamboo forest productivity.
2 Materials and methods
2.1 Study site
This research was conducted in Zhejiang Province, China, situated on the southeastern coast and south of the Yangtze River Delta. The study area spans from 27°02′N to 31°11′N in latitude and from 118°01′E to 123°10′E in longitude (Figure 1). Although Zhejiang Province is among China’s smallest provinces, it boasts an impressive forest cover of 61%, ranking it among the highest in the country in terms of both forest cover and Moso bamboo area. Zhejiang Province had an uneven topography, characterized by numerous mountains and limited water bodies. The western region was mountainous, whereas the east-central part consists of hills and plains. Zhejiang Province was situated in the subtropical belt and features a monsoon humid climate characterized by moderate temperatures, four distinct seasons, and abundant sunlight and rainfall. The region’s average annual temperature ranges from 15 to 18°C, with annual sunshine hours varying between 1,100 and 2,200 h, and an average annual precipitation range of 1,100–2,000 mm (Yin et al., 2019). January marks the lowest temperatures of the year, while July records the highest temperatures. Additionally, May and June were characterized by concentrated rainfall. Zhejiang Province possesses abundant vegetation resources, featuring a generally medium to high level of forest ecosystem diversity. This encompasses a wide array of forest vegetation types, forest categories, and age groups of trees. Due to its unique geographic location and climatic conditions, Zhejiang Province provides an ideal environment for the thriving of Moso bamboo forests.
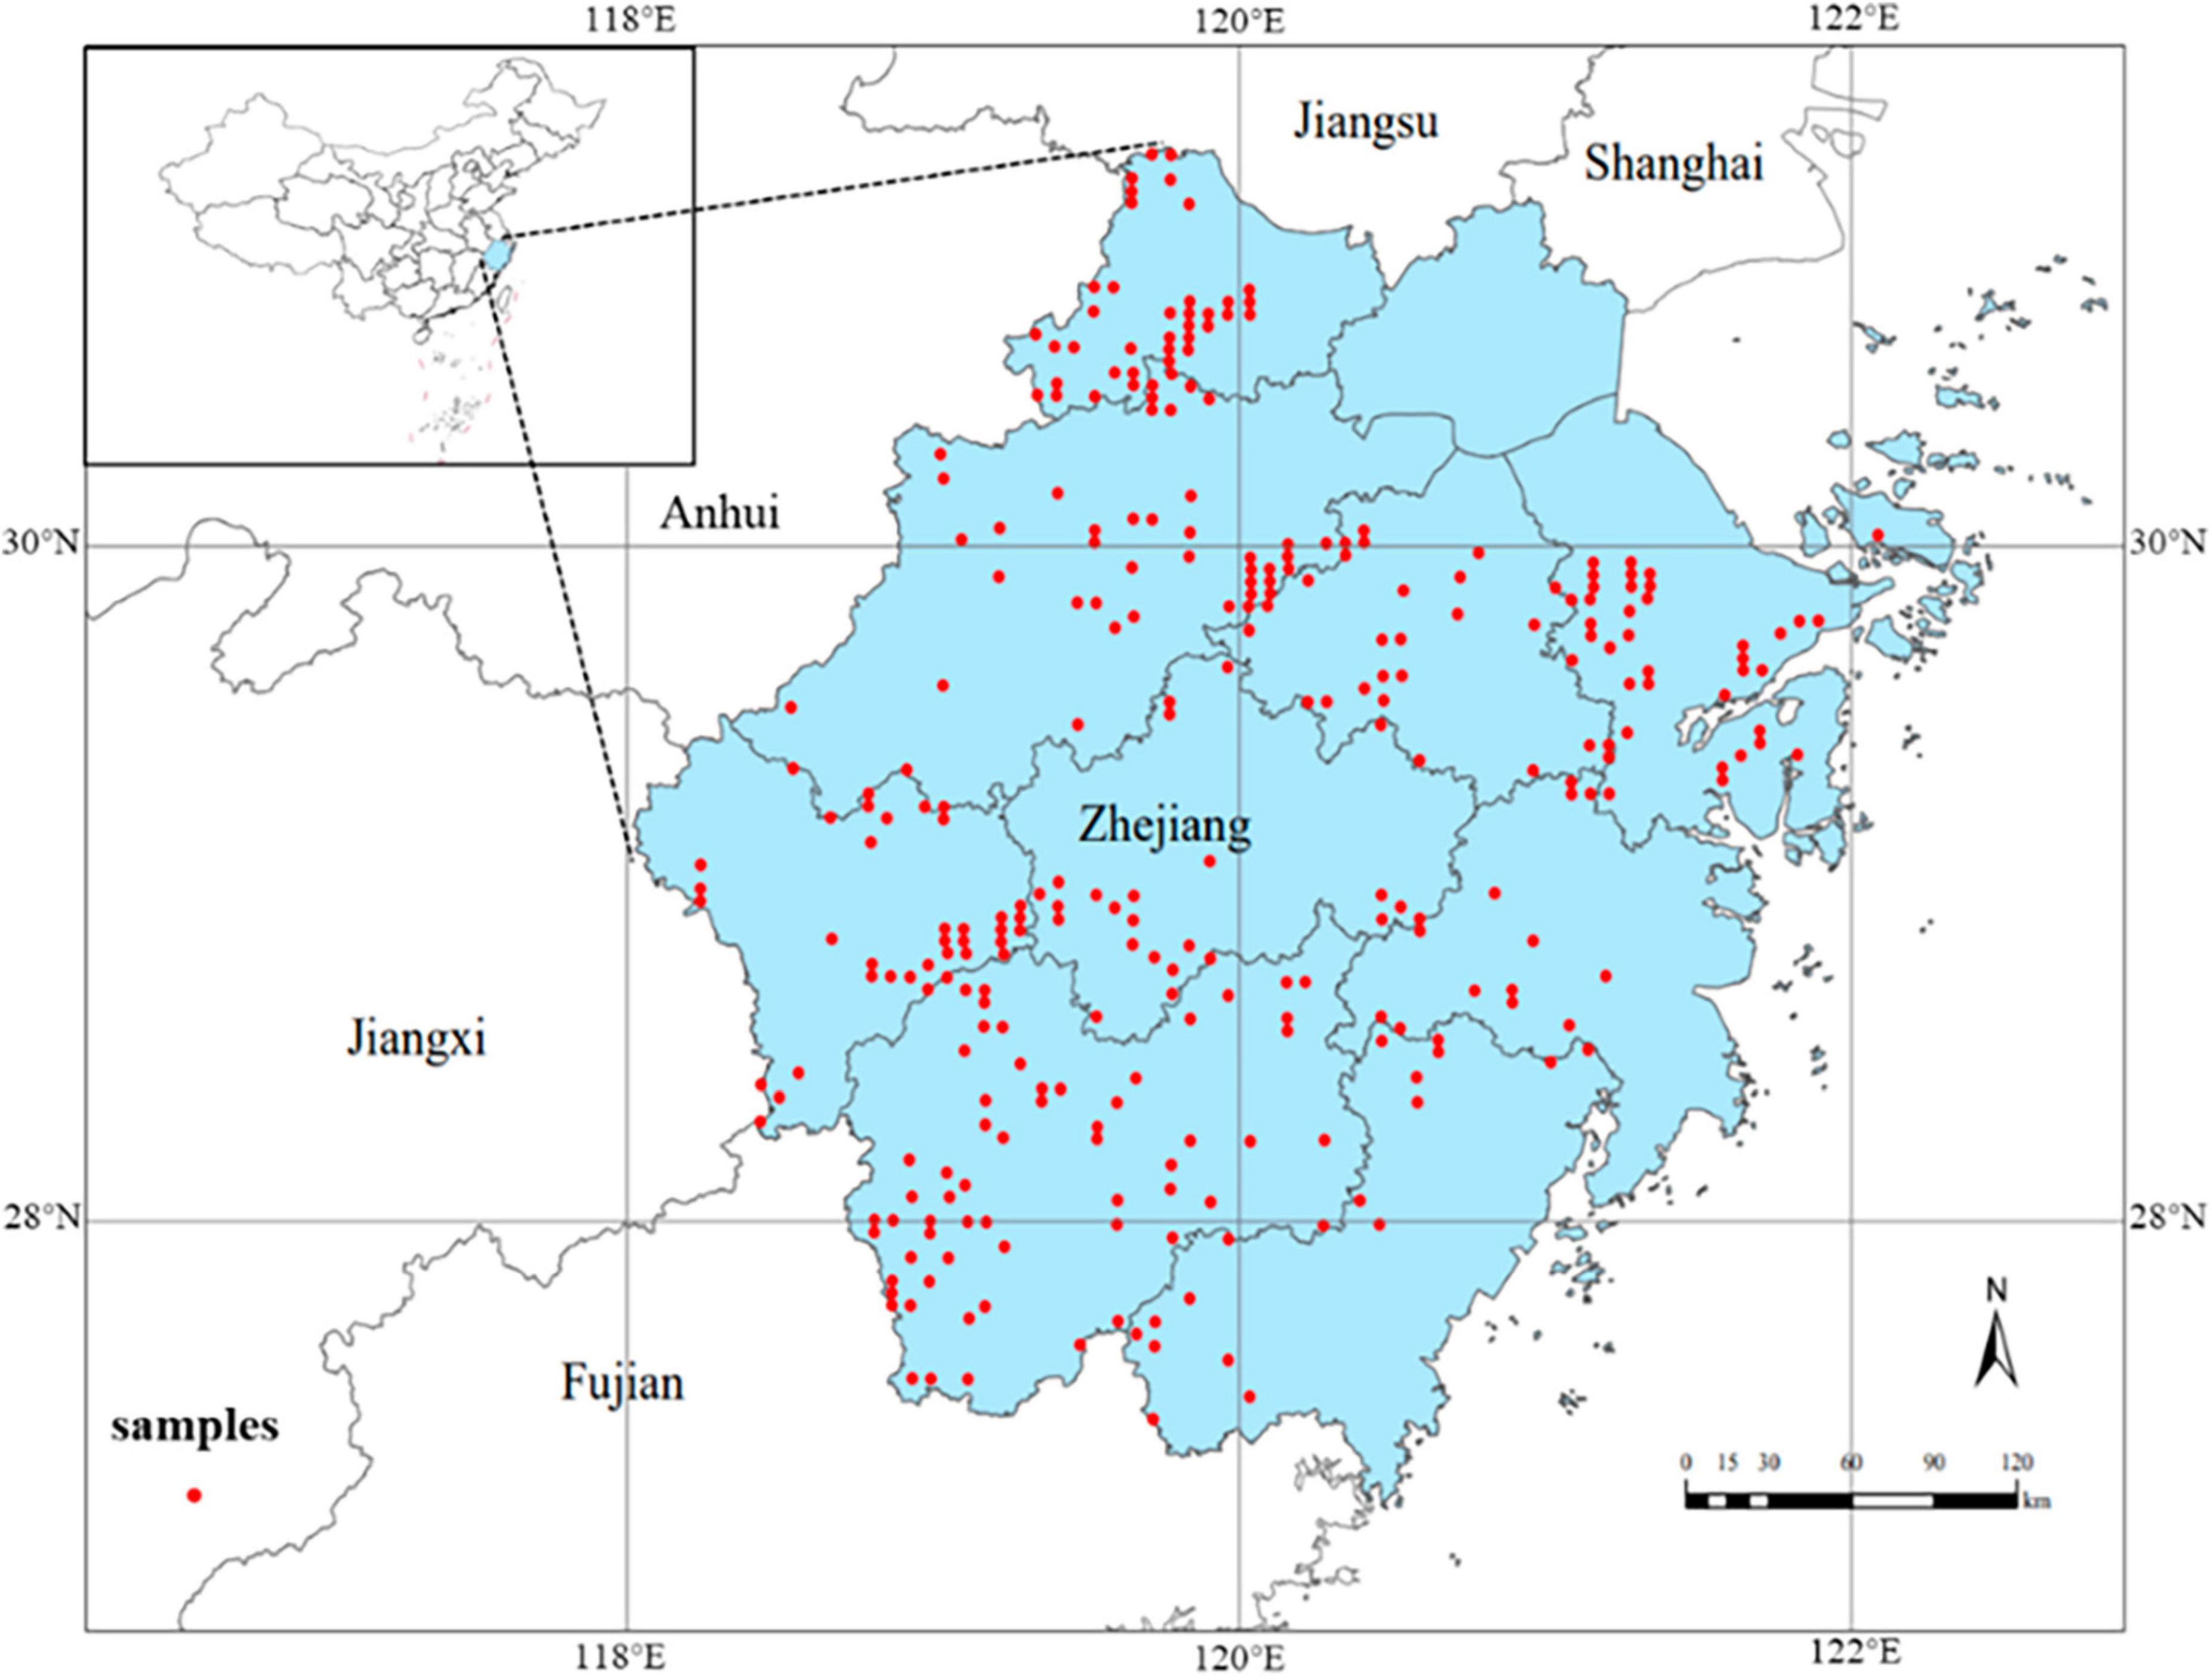
Figure 1. The locations of 293 permanent Moso bamboo forests sample plots in Zhejiang, China, which denoted by red circles.
2.2 Data collection
2.2.1 Fixed sample data
Zhejiang Province established a continuous forest inventory system in 1979, conducting repeated surveys at 5-year intervals. A total of 4,250 fixed plots were established, evenly spaced at 4 km intervals from north to south and 6 km intervals from east to west. These plots were square, each with a side length of 28.28 m (Xu et al., 2018). For this study, we used continuous survey data collected from these fixed sample plots spanning from 2004 to 2019. For the sample plots, 293 plots primarily consisting of pure Moso bamboo forests were selected. For each plot, we recorded various factors including elevation, slope, diameter at breast height (DBH), bamboo age, and the number of bamboo culms. Elevation, slope, and slope direction for the sample plots were measured using handheld GPS devices, total stations, and compass meters. Culms from the current year and those aged 1 year were categorized as 1 du, culms aged 2–3 years as 2 du, and culms aged 3–4 years as 3 du, and so on.
2.2.2 Climate data collection
The climate data used in this study were sourced from the ClimateAP software, a standalone MS Windows application that downscales unscaled data as a baseline for historical and future climate variables spanning from 1901 to 2100 (Wang et al., 2017). This software can generate climate data for multiple locations and time periods. For our research, we acquired historical climate data from 2004 to 2019 and future climate data from 2024 to 2060. This dataset included key parameters such as mean annual temperature, mean annual precipitation, and annual heat and humidity index for all 293 Moso bamboo forest sample plots.
2.3 Methods steps
The research process of this study is as follows: Firstly, the continuous survey data and climate data from fixed sample sites were organized and divided into a training set and a test set in a 7:3 ratio. Four algorithms, namely, random forest (RF), support vector machine (SVM), XGBoost, and BP neural network (BPNN), were used to construct the aboveground carbon stock model of Moso bamboo forests. These models were trained and validated to select the optimal model. The main driving parameters of aboveground carbon stocks in Moso bamboo forests were then selected based on the model. The data from the fixed sample plots were combined to fit the relationship between the driving parameters of Moso bamboo forests under standard management practices over time, and to predict the future values. By inputting all parameters into the model, carbon stocks under various management measures in the future were predicted, followed by an analysis and comparison of the results (Figure 2).
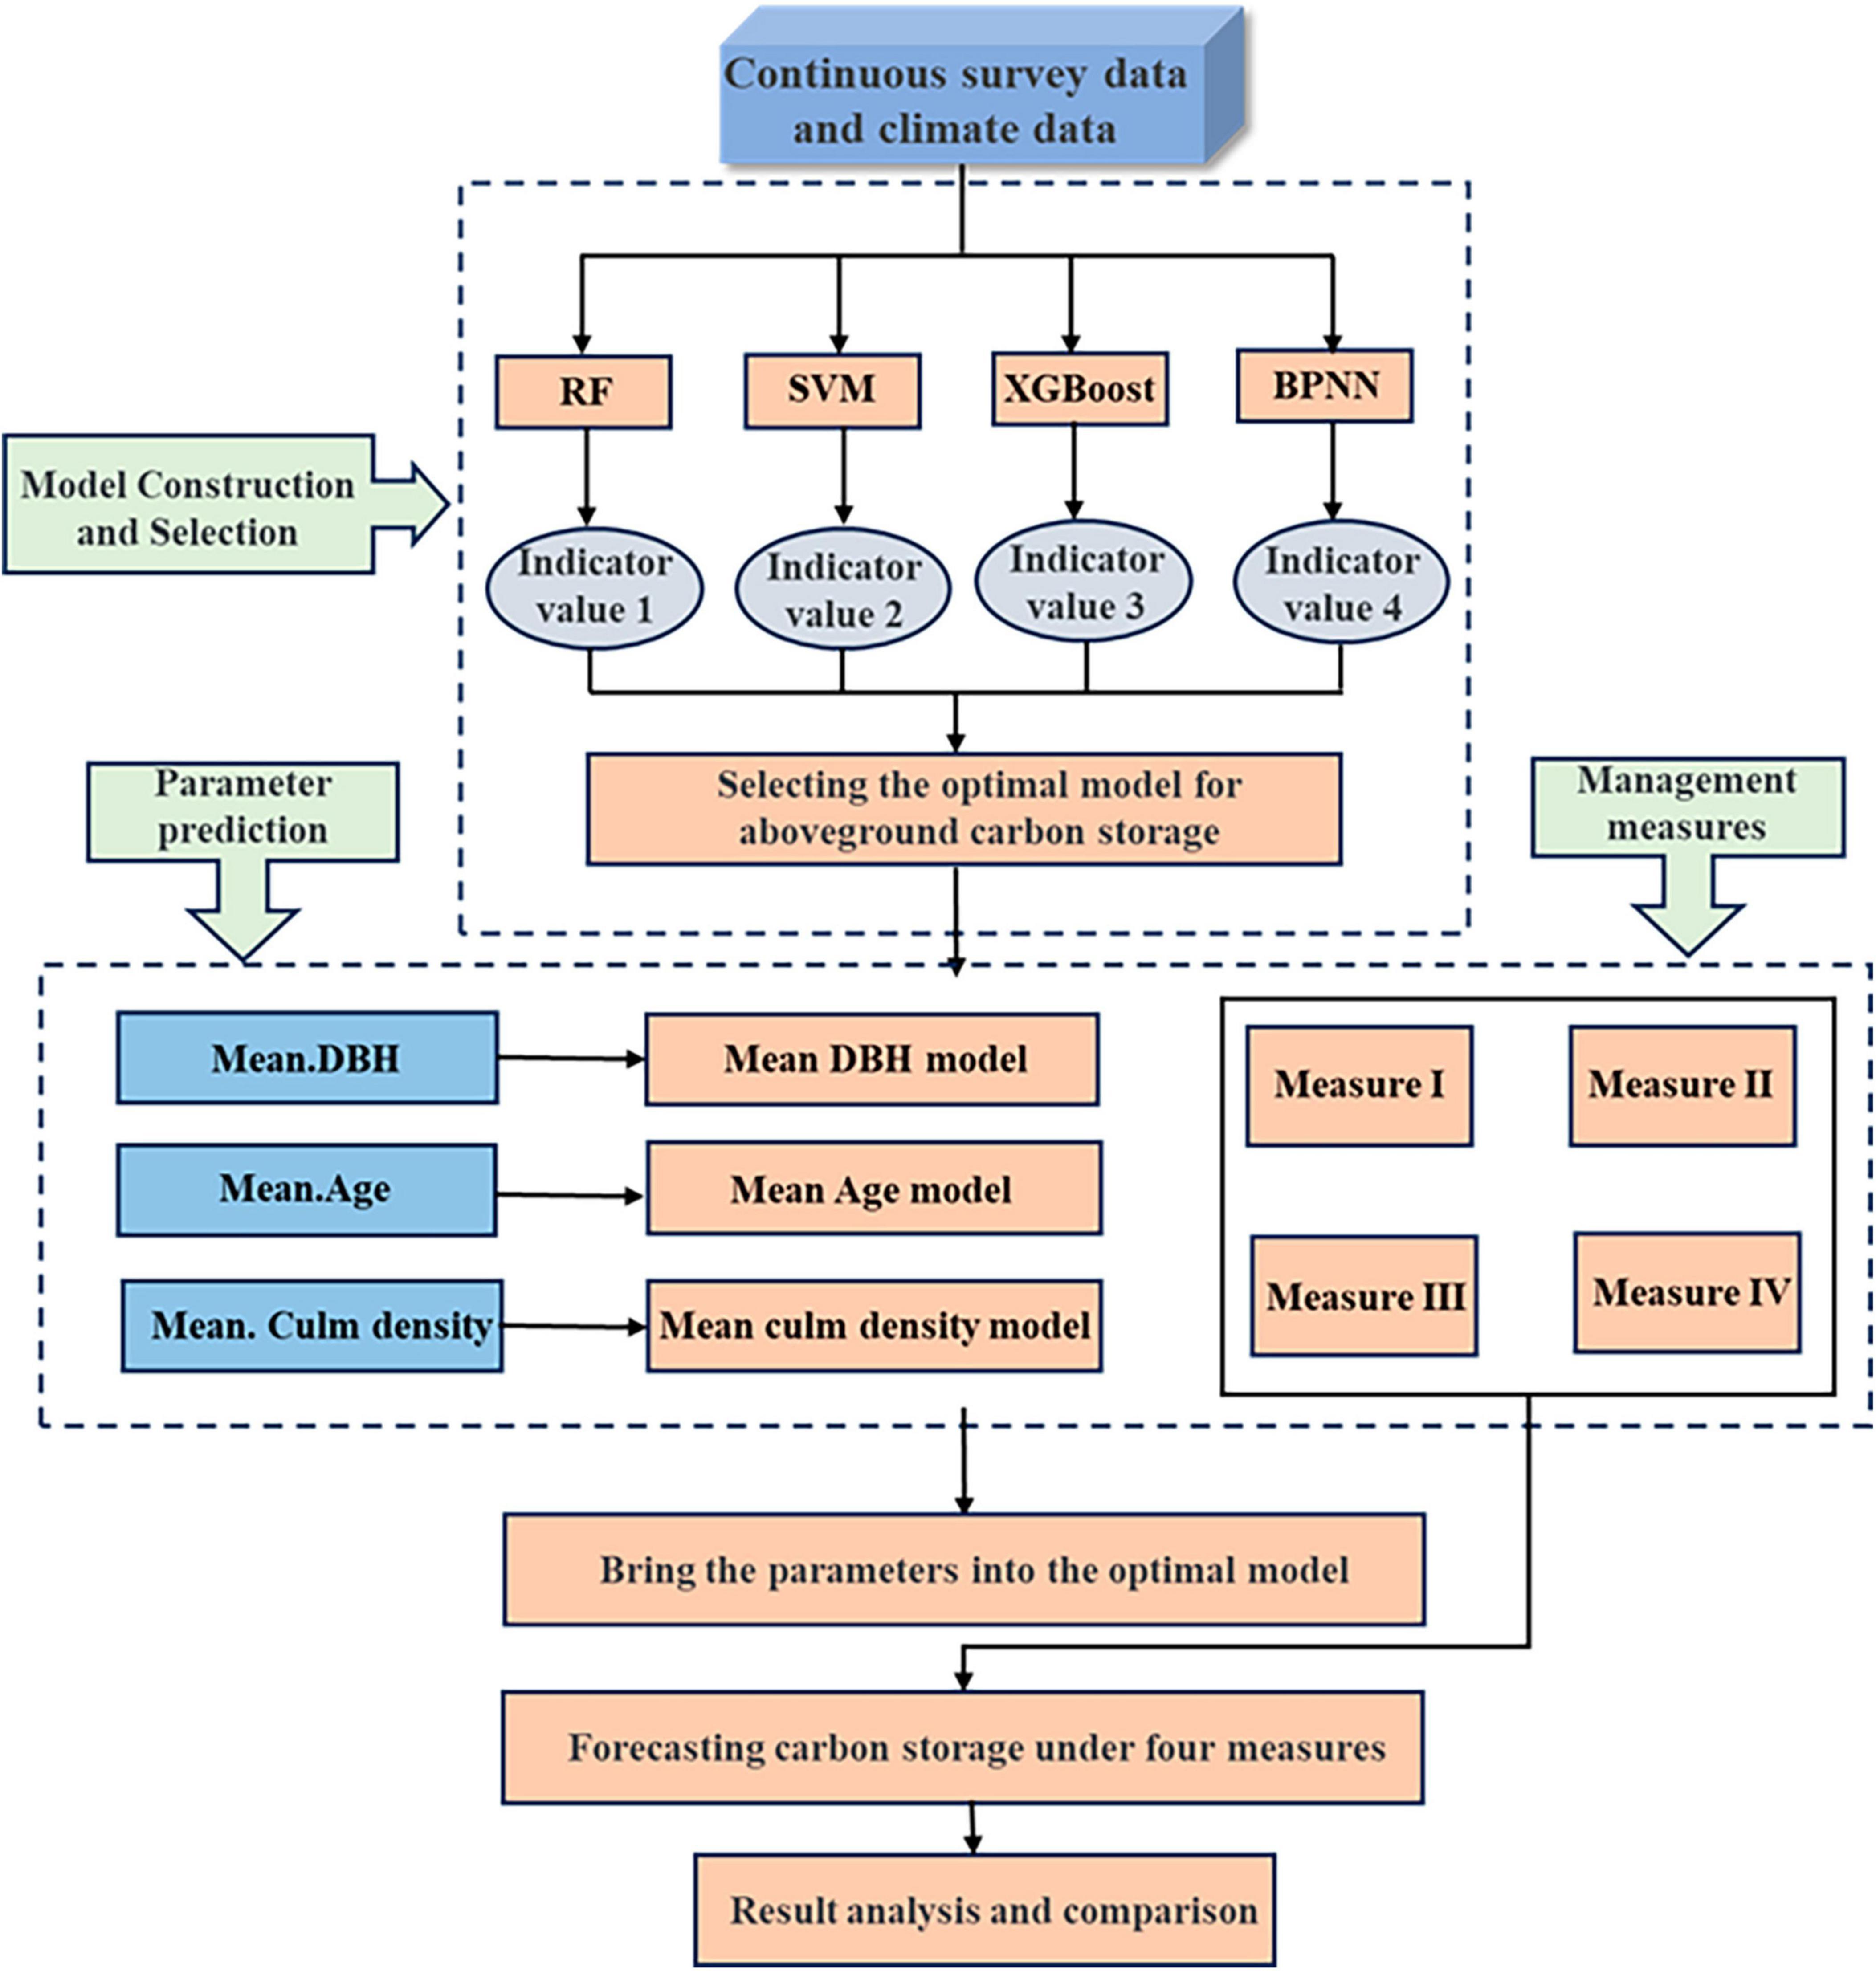
Figure 2. Workflow of aboveground carbon stock estimation and optimal selection of management measures in Moso bamboo forests.
2.4 Model selection and construction
2.4.1 Random forest
Random forest (RF), proposed by Breiman (2001), is a supervised integrated learning method based on decision trees. It can be used for both classification and regression (Zamani Joharestani et al., 2019). RFs employed two important techniques: bagging and random feature selection. The first step involved constructing multiple decision trees using bootstrapped sampling of the training set. This was followed by random feature and sample selection, where some features were drawn from the original training dataset to train the model. In each decision tree, nodes were split to create new nodes, with this process subject to conditions such as tree height and minimum leaf node count, etc. In the case of the regression, when multiple decision trees were constructed, the final prediction was obtained by averaging the predictions. This reduced the high correlation and overfitting among the features and enabled better model adaptability and representativeness.
This study mainly used RF for regression analysis to assess the influence of different factors on aboveground carbon storage in Moso bamboo forests. Fixed sample plot data and climate data were used as training data, and different training subsets were used to construct different decision trees. Finally, the average of the internal prediction of carbon storage from the trees were adopted as the final estimate of aboveground carbon storage in the sample plots.
2.4.2 Support vector machine
Support vector machines were introduced by Vapnik in 1995 (Joachims, 1998). Support vectors are used for classification, but they are referred to as support vector regression (SVR) when applied to regression problems. SVR presupposes that the loss function was computed assuming that the absolute value of the difference between the output value of the model and the true value exists. SVR was akin to creating an interval band centered around the sample, where the training sample was considered accurately predicted if it falls within this band. However, points outside the spacer band incur a loss, with the magnitude of the loss represented by the length of the red line. The degree of flexibility can vary on either side of the spacer band (Awad et al., 2015). The SVR problem can be formulated as follows (Eq. 1):
where C is a regularization constant and lϵ is the insensitive loss of ϵ.
In this study, due to the considerably larger number of samples compared to the feature dimensions, a nonlinear kernel SVM was employed. Fixed sample plot data were used as input, and a regression model was used to predict carbon storage values. The goal was to minimize the absolute difference between these predicted values and the actual carbon storage value. This approach aimed to make the aboveground carbon storage of the sample plots as close as possible to the true values.
2.4.3 XGBoost
XGBoost is an open source machine learning project developed by Chen et al. (2015). It efficiently implements the GBDT algorithm, maked algorithmic and engineering improvements, and was widely used in many contests and machine learning competitions, delivering impressive results (Chen and Guestrin, 2016). It used the gradient boosting method, which differs from GBDT in the definition of the objective function. Its ultimate goal is to make the predicted values of the tree population, representing the carbon stock, more closely match the true values. Each time a new tree is added, it undergoes a new function learning process, continuously fitting the residuals between the last prediction and the true value. Ultimately, the scores corresponding to the leaf nodes of each tree were summed to obtain the predicted value for the sample. The objective function consists of two components: the loss function, which explains the gap between the predicted value and the true value, and the regularization term, which defines complexity (Eqs. 2, 3) (Chen et al., 2015; Figure 3).
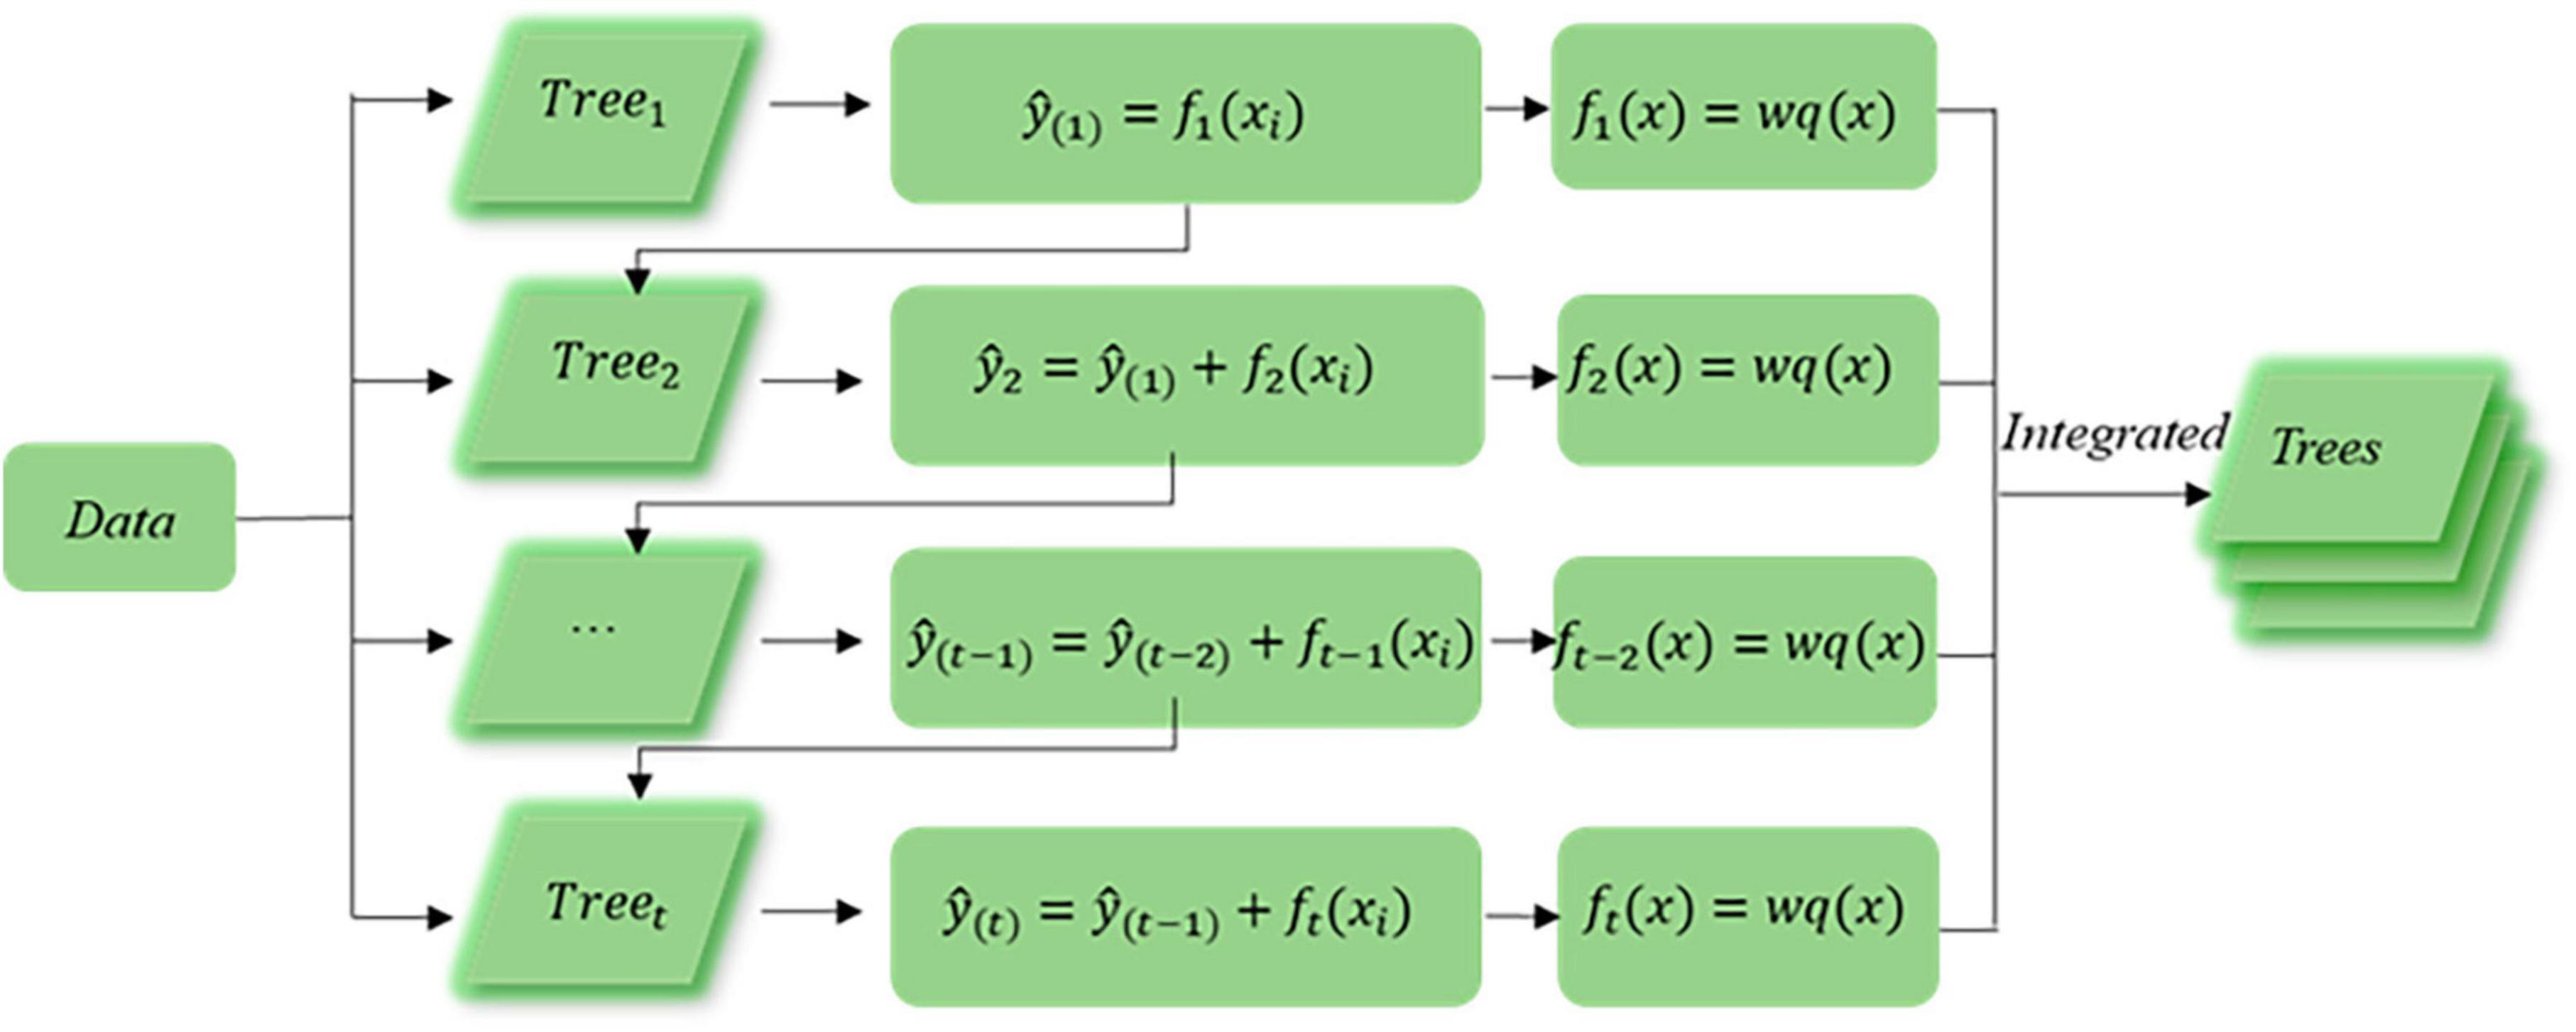
Figure 3. Structural framework of the XGBoost algorithm.
Where yi is the actual value, yi is the predicted value, denotes the prediction result of the previous t − 1 tree, constant is a constant, Ω(ft) denotes the complexity of the weak learner, and L(∅) denotes the loss function.
In this study, fixed sample plot data and climate data were initially fed into the model. As each new decision tree was incorporated, the goal was to fit the residuals between the ground-predicted carbon storage from the previous iteration. This iterative process aimed to consistently minimize the loss function, resulting in carbon storage values that closely approximated the true values.
2.4.4 BP neural network
Rumelhart proposed the error reversal back propagation BP (Back Propagation) learning algorithm for BP networks in 1958. The principle involved using the error in the output layer to estimate the error in the immediate preceding layer, and then using this error to estimate the error in the subsequent layer, and so on, until an estimate of the error in each of the other layers was obtained (Li et al., 2012). The error was distributed to each cell, adjusting the weights of each cell, and iterations continue until an acceptable error was reached or a specified number of iteration was achieved. The BP neural network (BPNN) had three or more layers: input, output, and hidden layers. Each neuron in the three-layer network was fully connected to every neuron in the previous layer. There was no direct connectivity between neurons within the same layer (Figure 4).
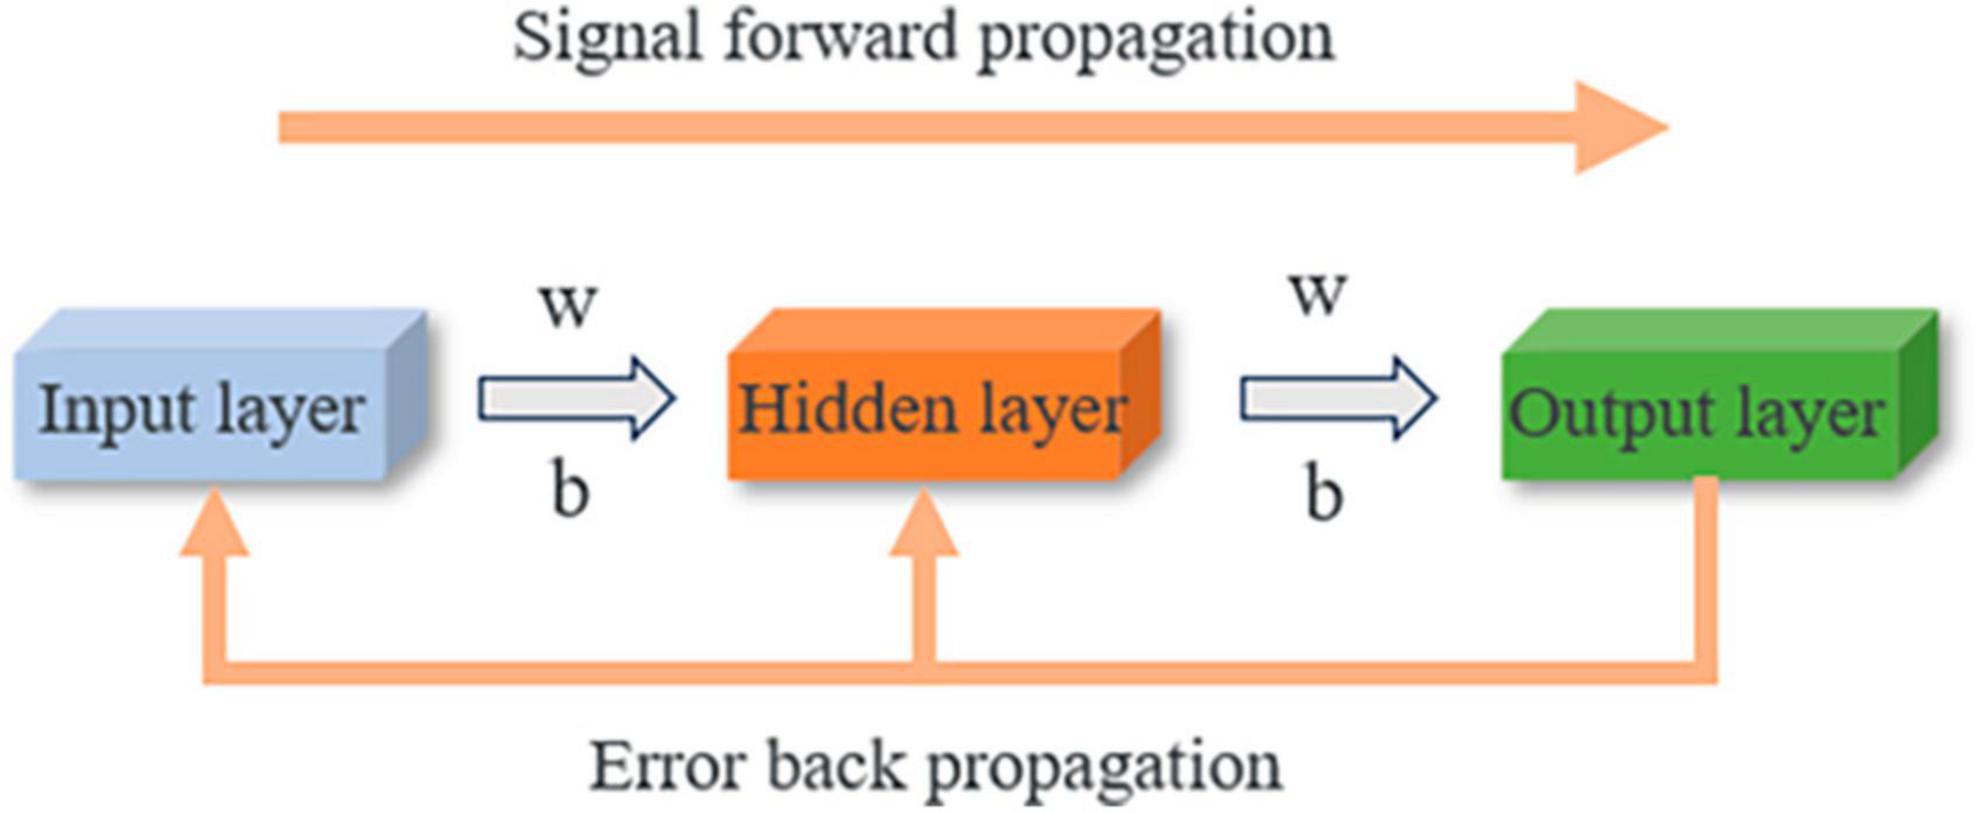
Figure 4. Framework of the main process of the BP neural network.
In this study, the input layer consisted of eight parameters: plot data, climate data, and topography data. These parameters included average culm density, average diameter at breast height, average age, annual average temperature, annual average precipitation, annual humidity index, slope, and elevation. These eight parameters were fed into the input layer, underwent backpropagation process, and ultimately contributed to the calculation of aboveground carbon storage.
2.5 Model validation and carbon stock calculation
This study utilized four different machine learning algorithms, namely, random forest, support vector machine, XGBoost, and BP neural network, to construct different models for aboveground biomass carbon stock. Model effectiveness was assessed on the test set through a comparison of four regression performance metrics: R-squared value, mean square error (MSE), root mean square error (RMSE), and mean absolute error (MAE). This assessment was validated through training simulations on the dataset (Saltelli, 2002; Liemohn et al., 2018). The formulas for each of the four regression performance assessment metrics were as follows (Eqs. 4–7):
Where m is the number of test set samples, yi is the true value of the test set samples, is the predicted value of the test set samples, and is the mean of the true values of the test set samples.
The biomass of individual Moso bamboo plant in the sample plots was calculated according to the single plant biomass model. The aboveground biomass of each Moso bamboo plant in the sample plots was then summed to obtain the aboveground portion of the biomass of each sample plot. Finally, this biomass was multiplied by the conversion factor of 0.5042 to obtain the aboveground carbon stock in the Moso bamboo forests (Eq. 8) (Zhou, 2006).
Where CMoso is the aboveground carbon stock of Moso bamboo (Kg), D is the diameter at breast height of Moso bamboo (cm), and A is the age of Moso bamboo (du).
2.6 Future parameter forecasts and management measures
The relationship between mean DBH and mean culm density of Moso bamboo forests under typical management over time was fitted using data collected from 293 sample plots spanning the period of 2004–2019. The models for mean diameter at breast height and mean culm density were used to estimate these parameters for each year under different management scenarios. To align with the typical growth patterns of Moso bamboo, we predicted these parameters by setting a threshold of 13.0 cm for diameter at breast height and 4,500 culms/ha for culm density. We assumed no further increase once these values were reached. We assumed that the elevation and slope of the sample site remained relatively stable, and we obtained future mean annual temperature and mean annual precipitation through ClimateAP software. The model for each parameter of the sample plots under the abandonment measure was adopted from the model developed by Yin et al. (2019). All the predicted parameters were incorporated into the aboveground carbon stock model constructed using the XGBoost algorithm to predict the annual aboveground carbon stock.
Currently, the generally recognized harvesting practice for Moso bamboo forests was to refrain from harvesting bamboos of 1–3 du bamboos and focus on harvesting those of 4 du and above. However, there was no well-defined harvesting strategy specifically for bamboos of 4 du and above. To study and optimize the harvesting strategy of Moso bamboo forests, we have refined the harvesting strategy of 4 du bamboos and above. At the same time, the aboveground carbon storage situation of degraded Moso bamboo forests was compared to reflect the importance of management measures on the aboveground carbon storage of Moso bamboo forests.
We established management scenarios with three different levels of selective harvesting measures and an abandonment management approach. Measure I: no harvesting of bamboos of 1–3 du, with all bamboos of 4 du and above to be cut. Measure II: no harvesting of bamboos of 1–3 du, with 50% harvesting of bamboos of 4 du and above. Measure III: no harvesting of bamboos of 1–3 du, with 30% harvesting of bamboos 4 du and 80% harvesting of bamboos of 5 du and above. Measure IV: abandonment management.
2.7 Data analysis
Pycharm programmer software (Pycharm 3.10) and Excel 2021 were used for statistical analysis. We multiplied the average vegetation carbon stock of the sample site by the area of Moso bamboo forest to determine the total carbon stock of Moso bamboo forest in Zhejiang Province. Then the XGBoost algorithm was used to implement carbon stock predictions. The Python XGBoost package was utilized to build the aboveground carbon stock model, and Bayesian bayes_opt was used for parameter tuning and fivefold cross-validation. Finally, the predictions were obtained by averaging the results of all individual regressions. The matplotlib package in Pycharm was utilized for creating visualizations, including comparisons of predicted and true values, box plots, correlation analysis of factors, and correlation heat system plots. Each variable was normalized, and feature importance was calculated using the feature importance property in Python’s scikit-learn library. The results were visualized using matplotlib. Predicted parameters of all sample plots, including mean diameter at breast height, mean culm density, age and climate, were used as input values for the carbon stock model, and the outputs were carbon stock values to analyze the variations under different management measures.
3 Results
3.1 Construction and prediction effects of different machine learning carbon stock models
To enhance model accuracy, a Bayesian optimizer was employed to fine-tune each model. Leveraging a Gaussian process, previous parameter information was considered and continually refined to identify the optimal parameters. This approach is favored for its efficiency in minimizing iterations and facilitating rapid updates. When employing the support vector mechanism for modeling, Bayesian tuning was conducted, and the model underwent fivefold cross-validation. At the 20th iteration, the model achieved its lowest mean square error, corresponding to parameter values of 0.1029 for “c” and 0.2253 for “gamma.” When constructing the model using the RF algorithm based on decision trees, the hyperparameters “n_estimators,” “max_depth,” and “min_samples_leaf” have a significant impact on model effectiveness. Therefore, the focus of parameter adjustment primarily lies on these two hyperparameters. During parameter tuning, “n_estimators” was varied in the range of 100–500 with increments of 10, “max_depth” in the range of 2–10 with increments of 1, and “min_samples_leaf” in the range of 5–10 with increments of 1. After an exhaustive search of parameter combinations, the optimal configuration was determined, resulting in values of 309 for “n_estimators,” 9 for “max_depth,” and 5 for “min_samples_leaf.” The XGBoost algorithm, known for its efficient implementation of gradient boosting trees, is highly sensitive to the “n_estimators” and “max_depth” hyperparameters, which significantly influence model effectiveness. Following Bayesian tuning, the optimal configuration was determined as 100 for “n_estimators” and 3 for “max_depth.” In the context of the BPNN, the number of neurons in the hidden layer units and the number of training iterations (epochs) hold a certain degree of influence over model effectiveness. Following Bayesian tuning, the optimal parameterization was identified, resulting in values of 37 for “epochs” and 46 for “units.”
The evaluation data of each regression performance index of the four models on the test set showed that the aboveground carbon stock prediction model of Moso bamboo forest constructed using the XGBoost algorithm, exhibited clear advantages over other models. The model using the XGBoost algorithm achieved an R2 of 0.9895, an MSE of 0.0104, an RMSE of 0.1059, and an MAE of 0.0665 (Table 1). Loss function curves for the training and test sets in the XGBoost algorithm show a decreasing RMSE that eventually levels off as the number of iterations increases (Figure 5). To visualize the predicted and true values of the samples, a line graph is plotted to compare the true values with the predicted values (Figure 6). The results also showed that the model constructed based on the XGBoost algorithm was more accurate in predicting aboveground carbon stock in Moso bamboo forests (Figure 6C).
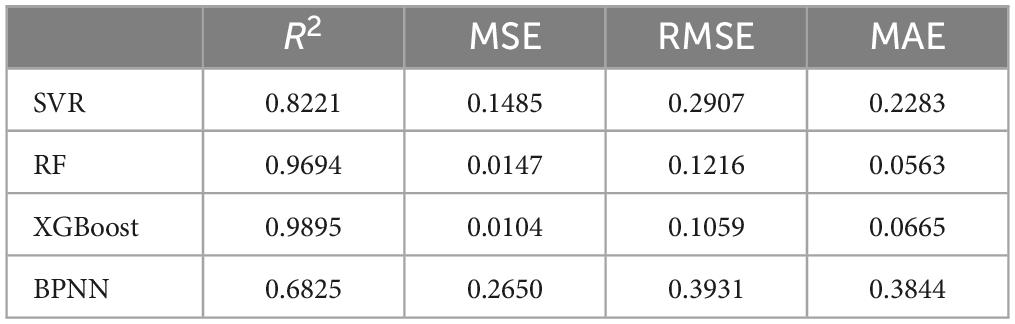
Table 1. Indicators and results of regression performance evaluation of different carbon stock models on the test sets.
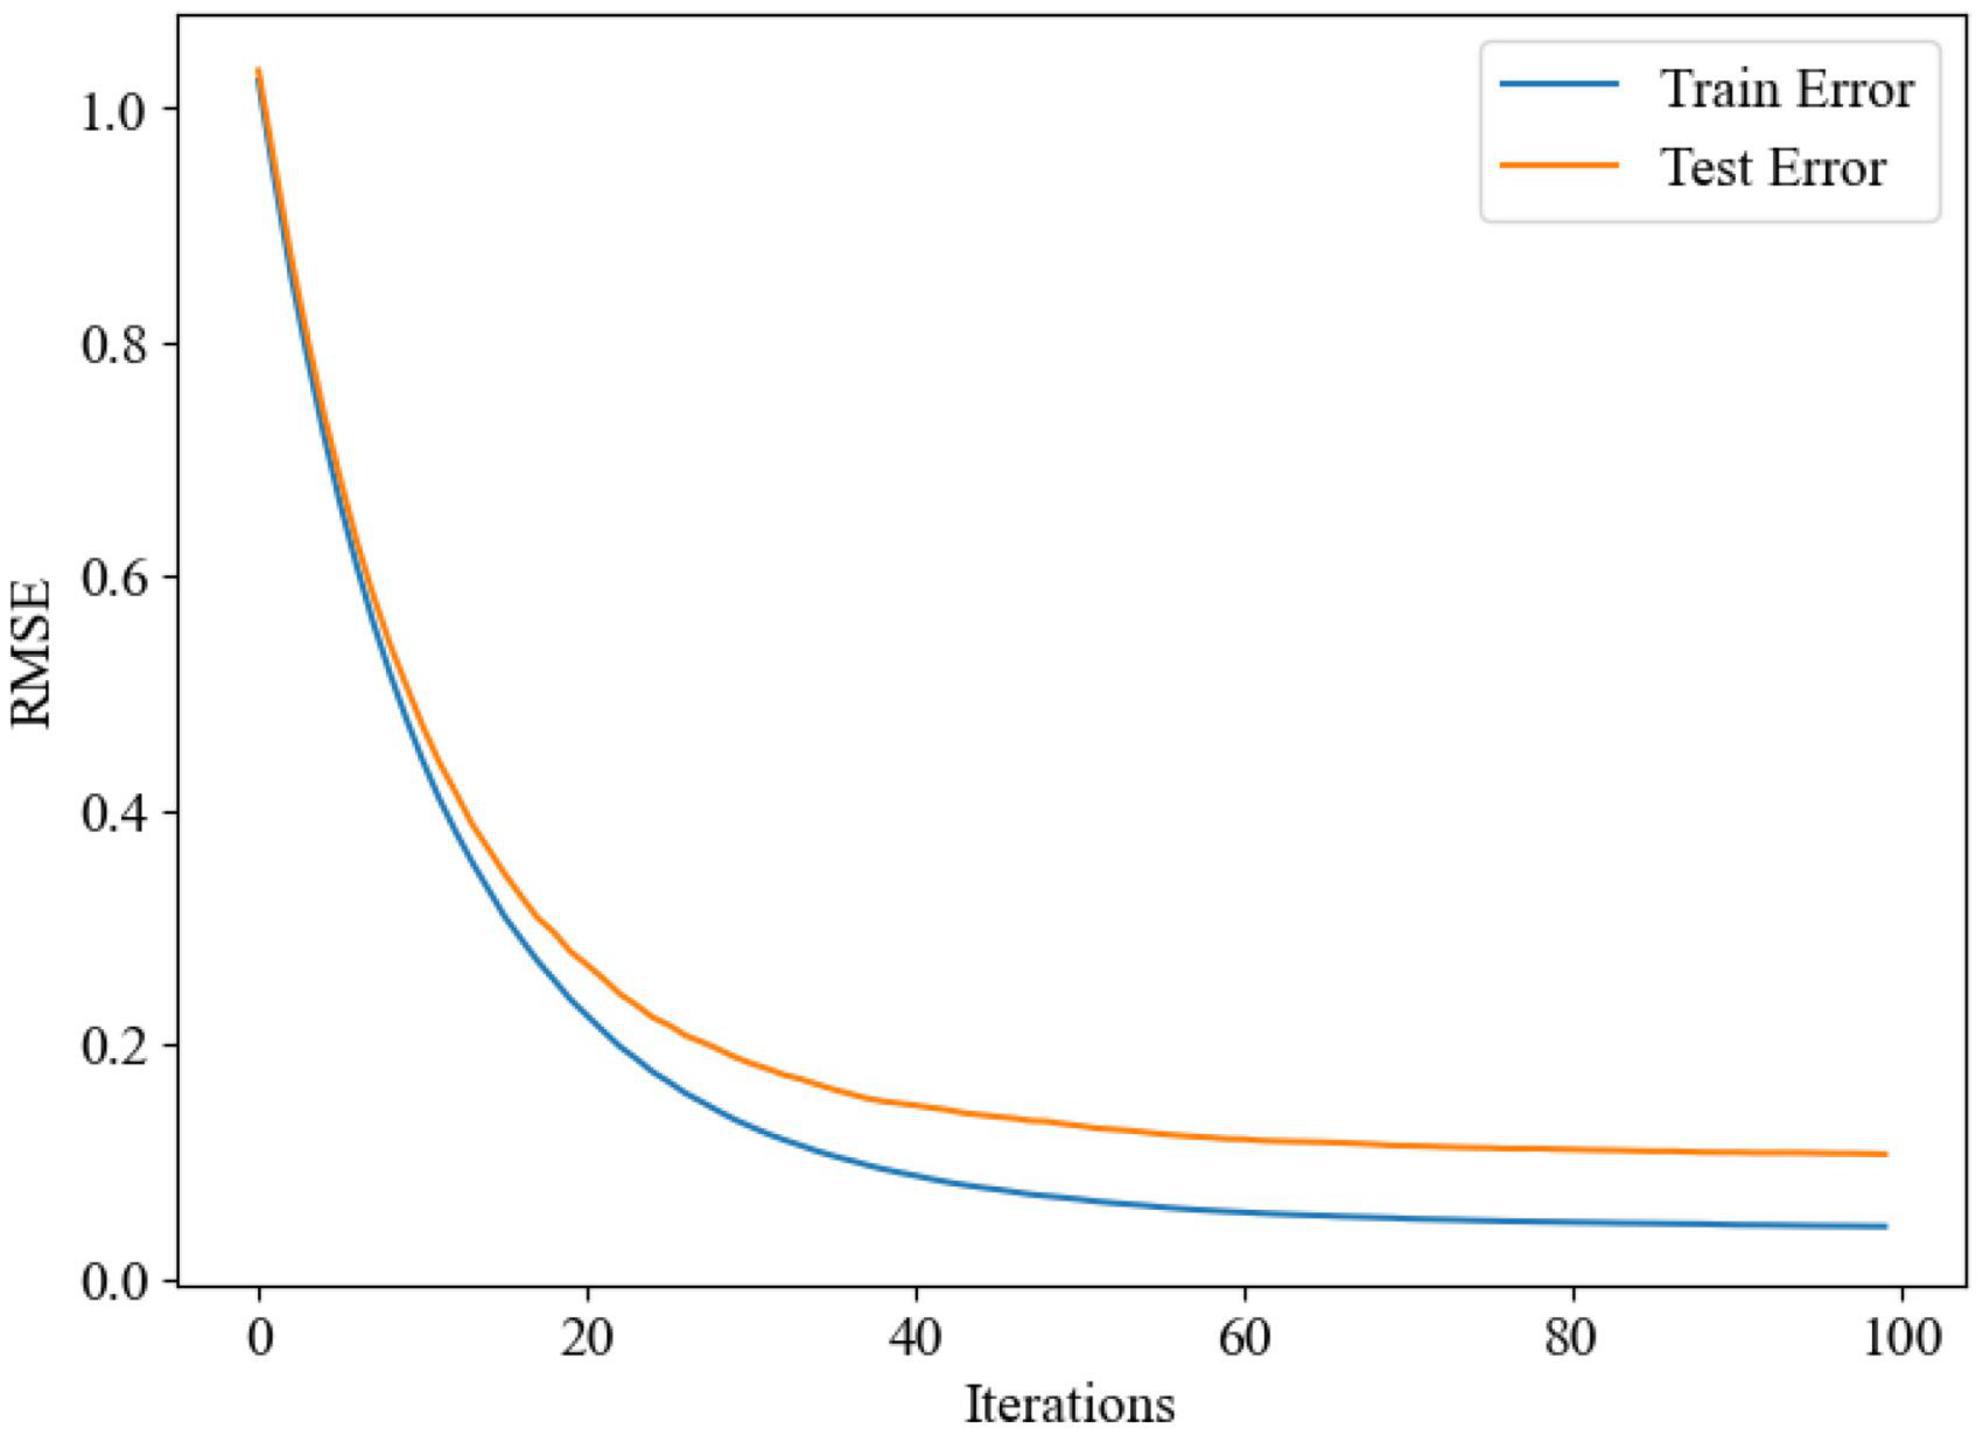
Figure 5. Loss function curve of the aboveground carbon stock model of Moso bamboo forest constructed using the XGBoost algorithm.
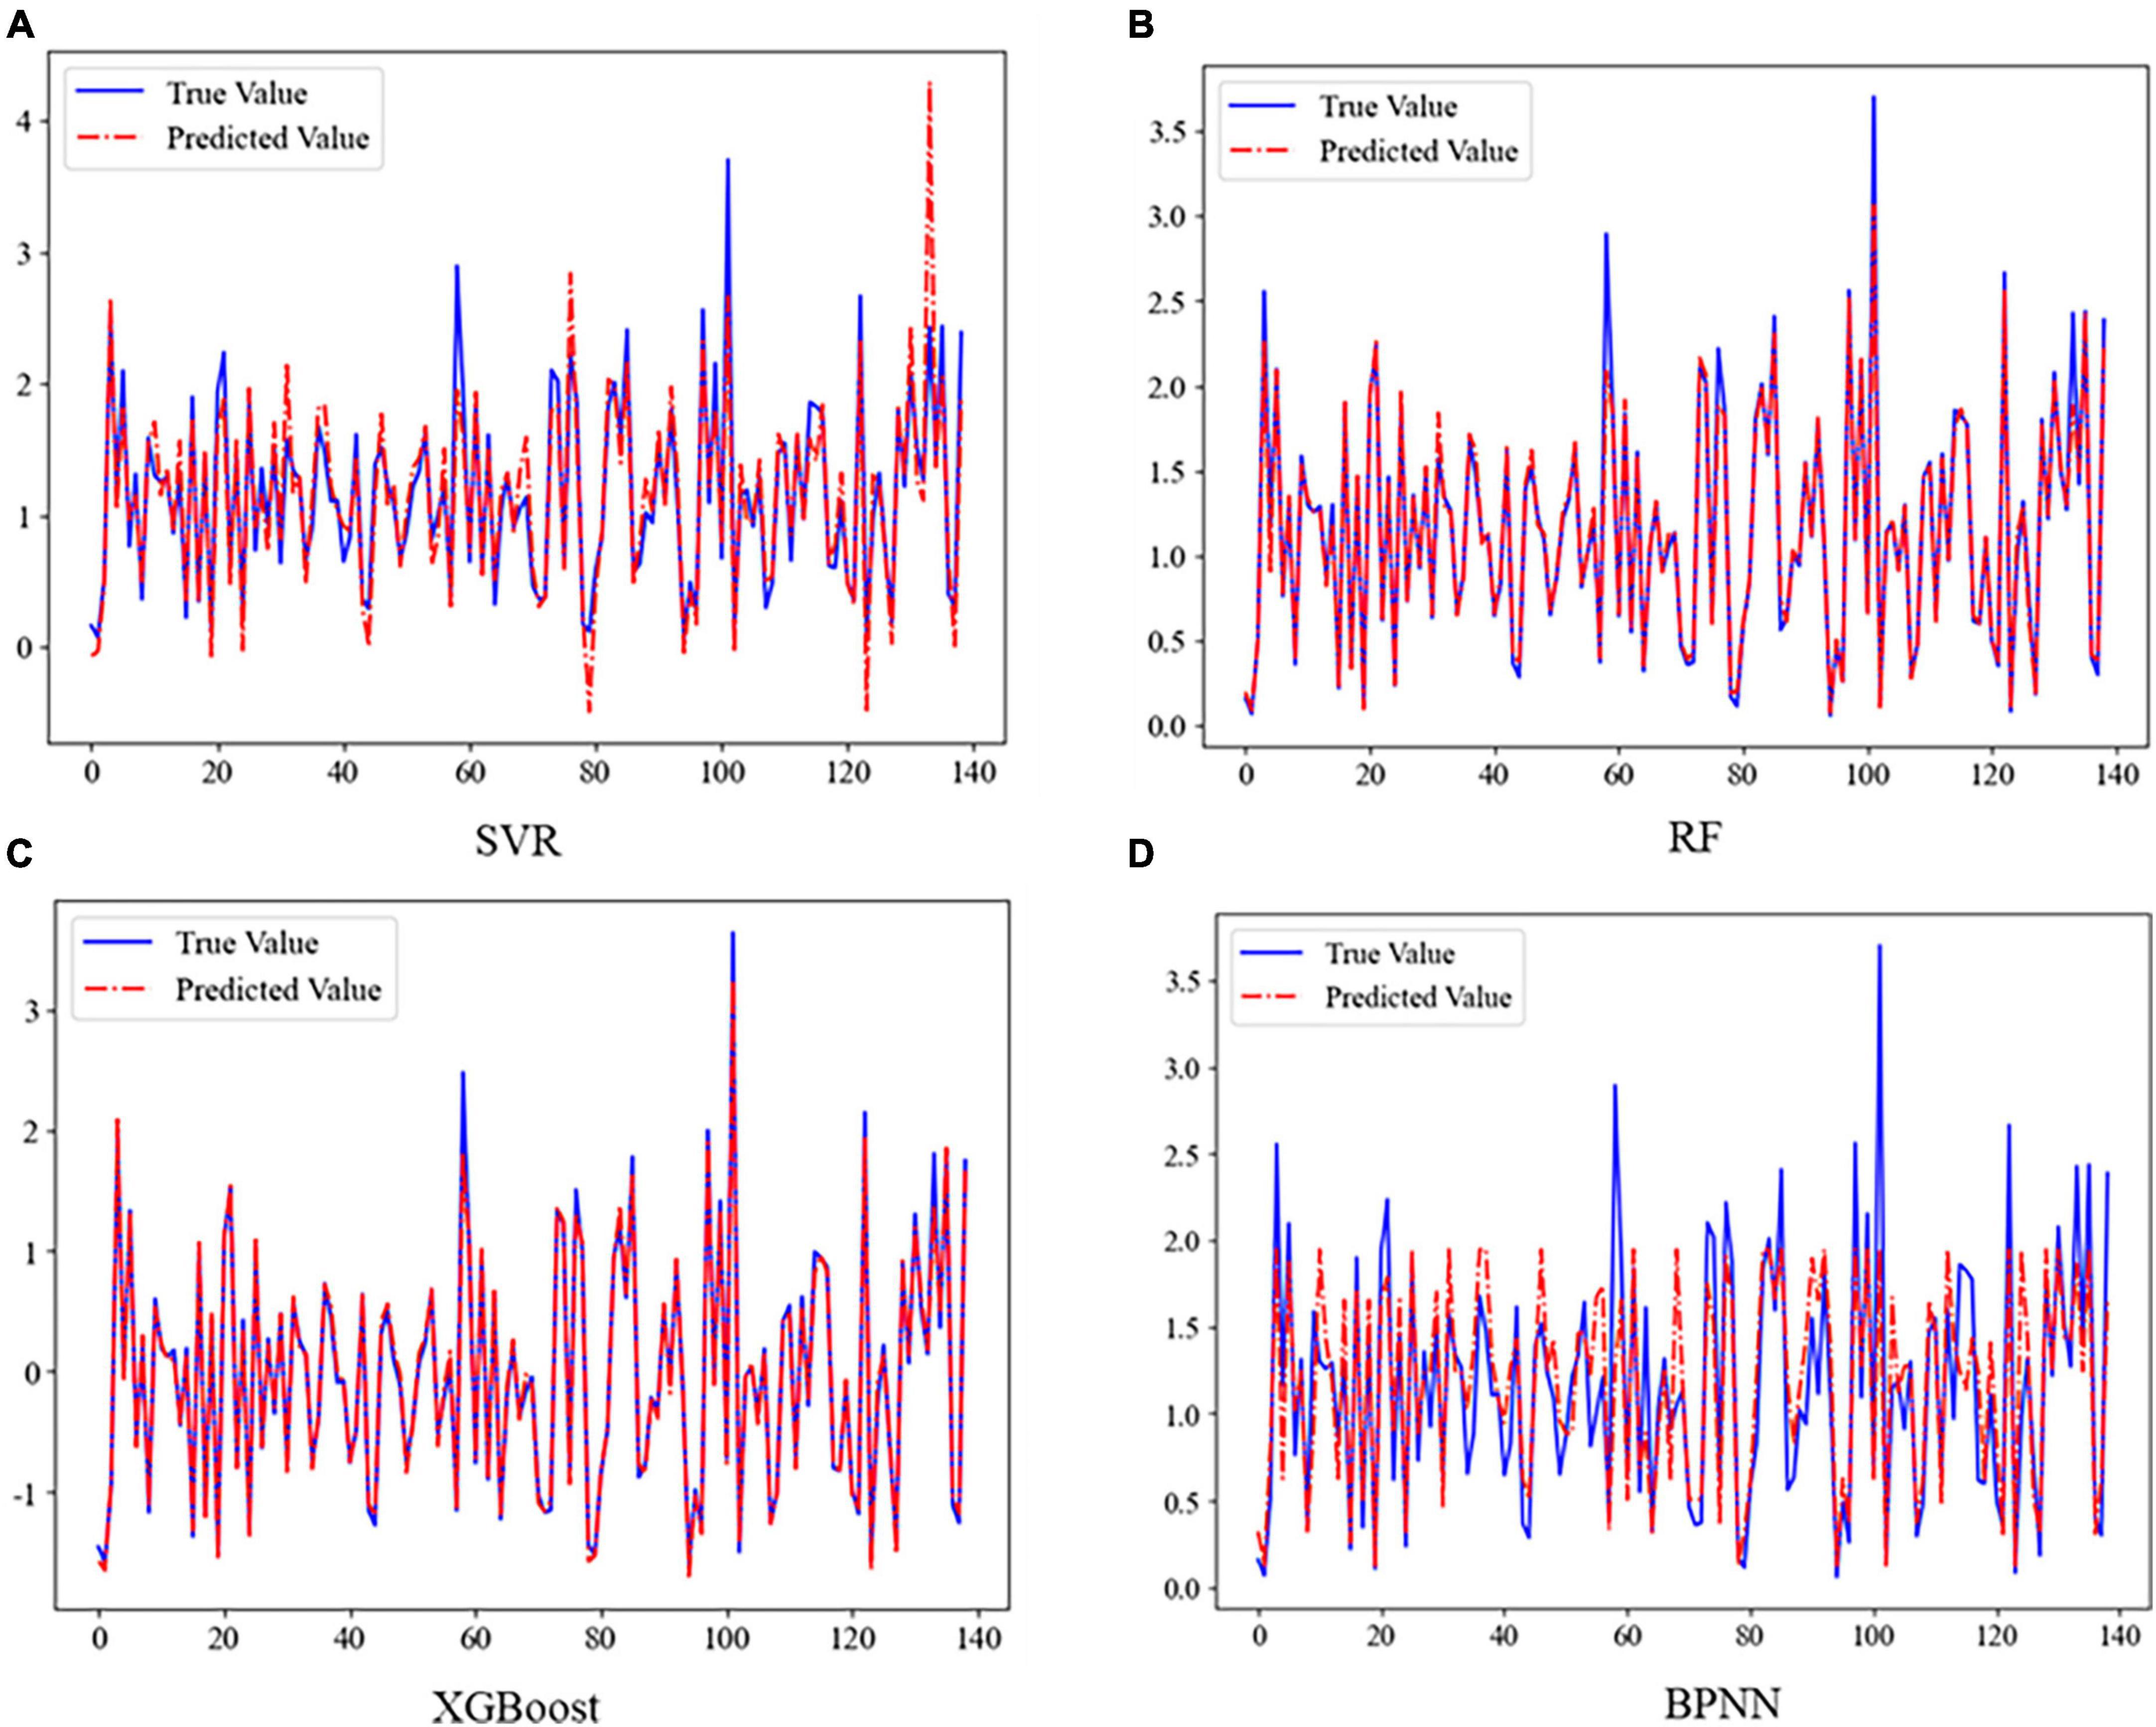
Figure 6. A comparison of models constructed by four different machine learning methods, namely support vector machines (A), random forests (B), XGBoost (C), and BP neural networks (D). The red dashed line indicates the predicted values and the blue solid line indicates the true values.
3.2 Main driving factors and future parameter models of aboveground carbon stocks in Moso bamboo forests
We used a total of eight variables, including topography, sample plots, and climate, to assess the impact of each variable on aboveground carbon stocks in Moso bamboo forests. We also examined the correlation between these variables and their association with aboveground carbon stocks through the model constructed with the XGBoost algorithm. The correlation coefficients were as follows: 0.85 between culm density and carbon stock, 0.47 between diameter at breast height and carbon stock, and 0.22 between age and carbon stock (Figure 7A). The factors influencing aboveground carbon stocks in Moso bamboo forests, ranked from highest to lowest importance, were as follows: mean culm density > mean DBH > mean age > mean annual precipitation > mean annual air temperature > mean annual heat and humidity index > slope > elevation (Figure 7B). Culm density, DBH and age were the primary factors influencing aboveground carbon stocks in Moso bamboo forests, with stand conditions and climate having a minor impact. We also found that the carbon stock in these plots increased progressively with the average DBH and mean culm density of Moso bamboo within the sample plots (Figure 8).
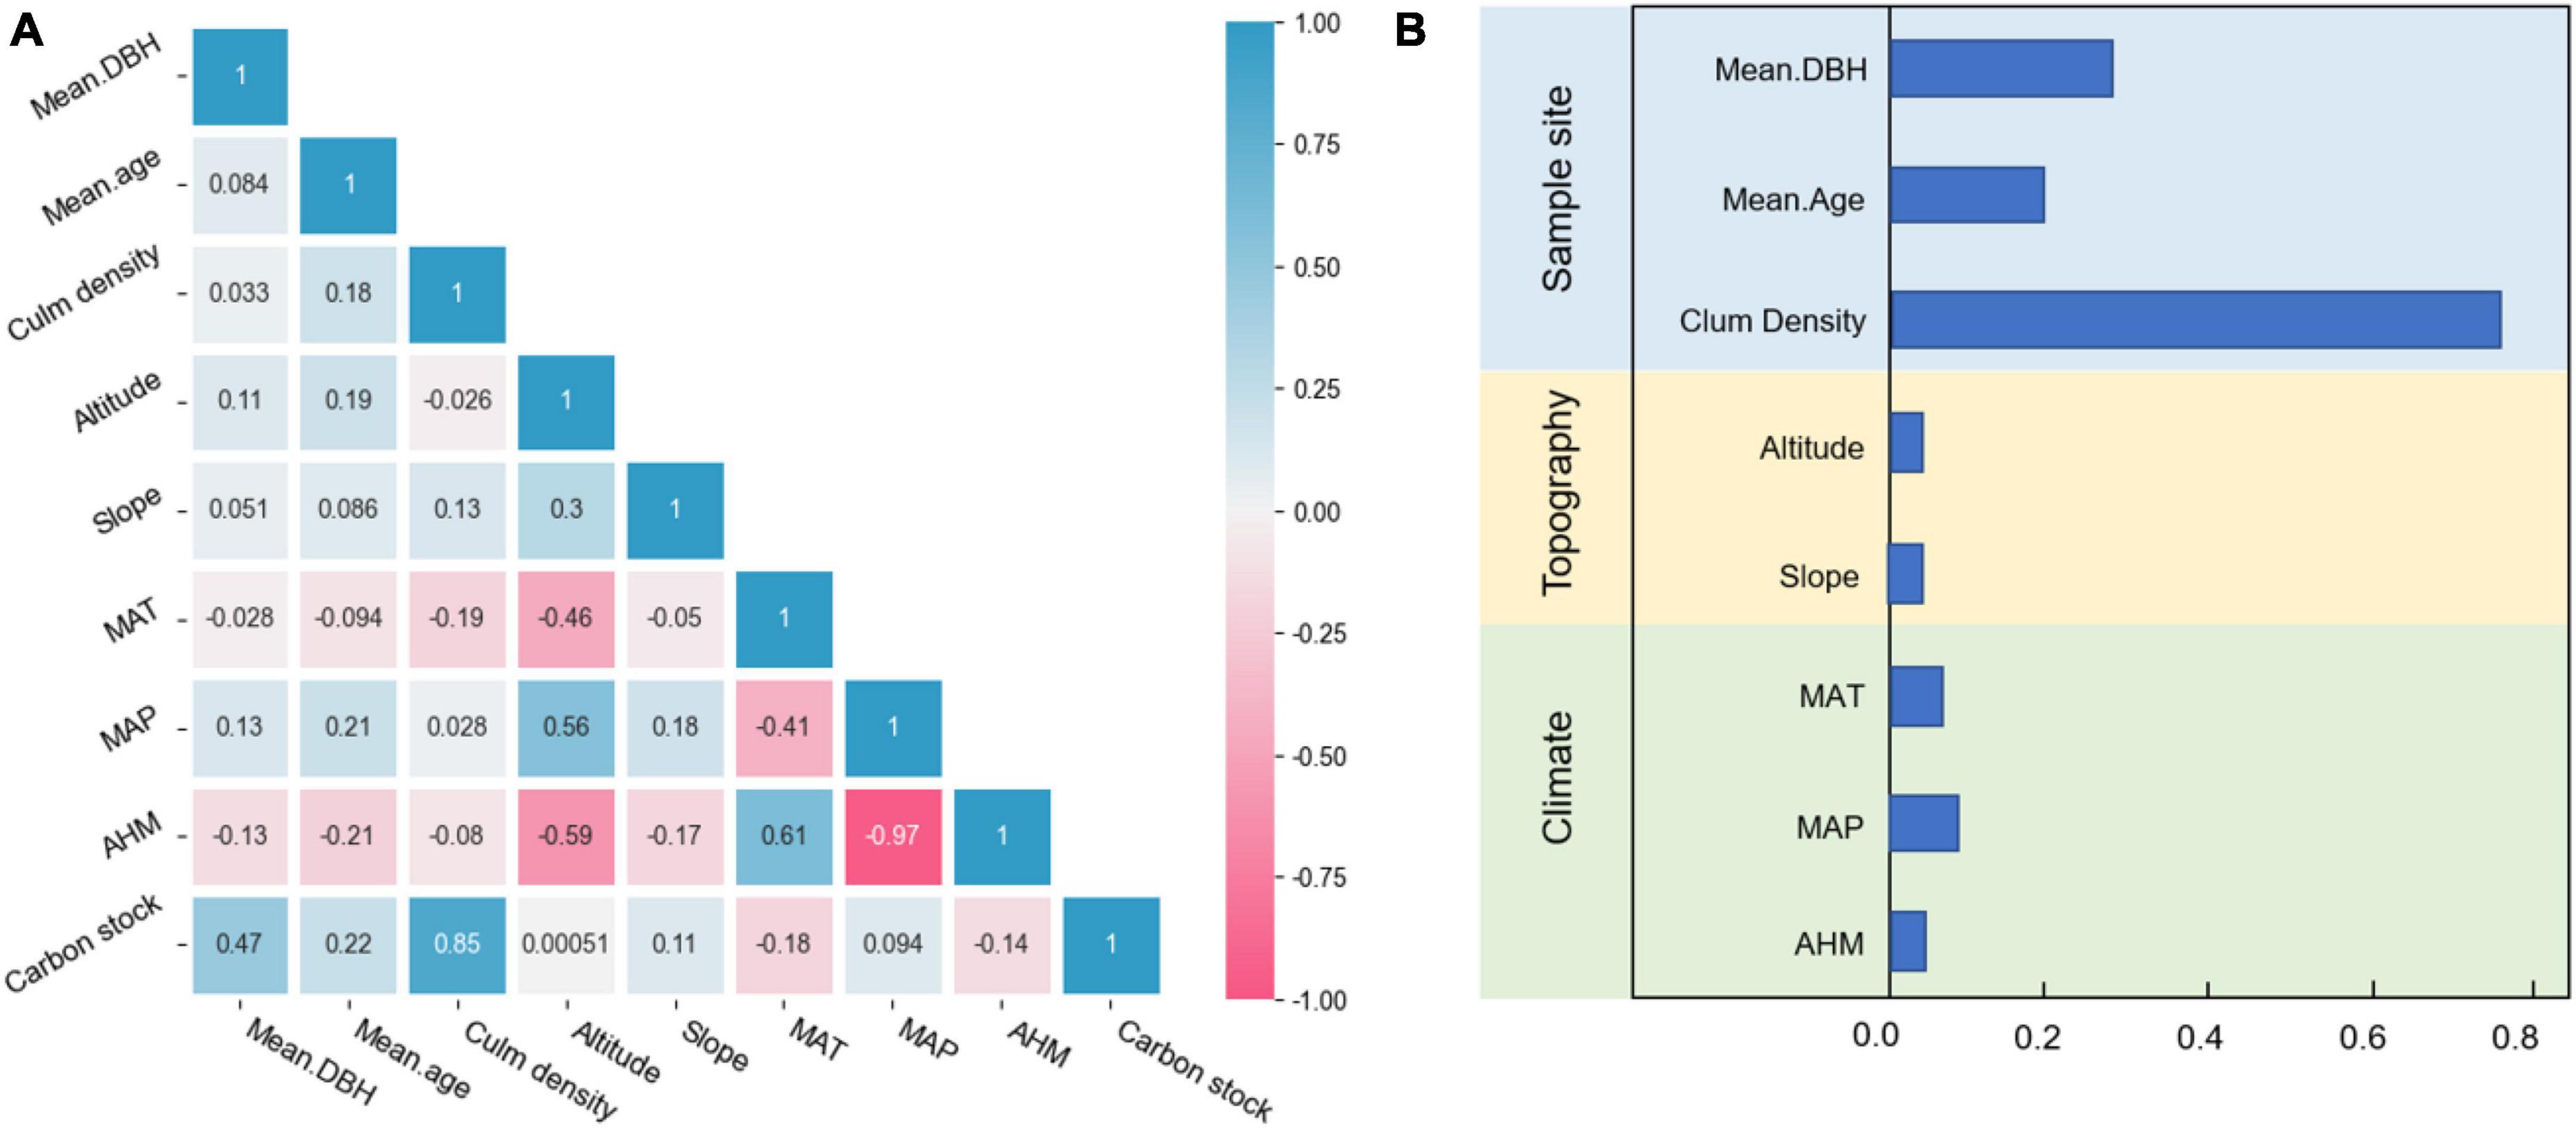
Figure 7. Correlations between aboveground carbon stocks in Moso bamboo forests and factors, along with the characteristic importance of each factor. (A) Different colors represent correlation values: red represents a negative correlation and blue represents a positive correlation. (B) Different lengths represent different values, with longer length indicating higher characteristic importance.
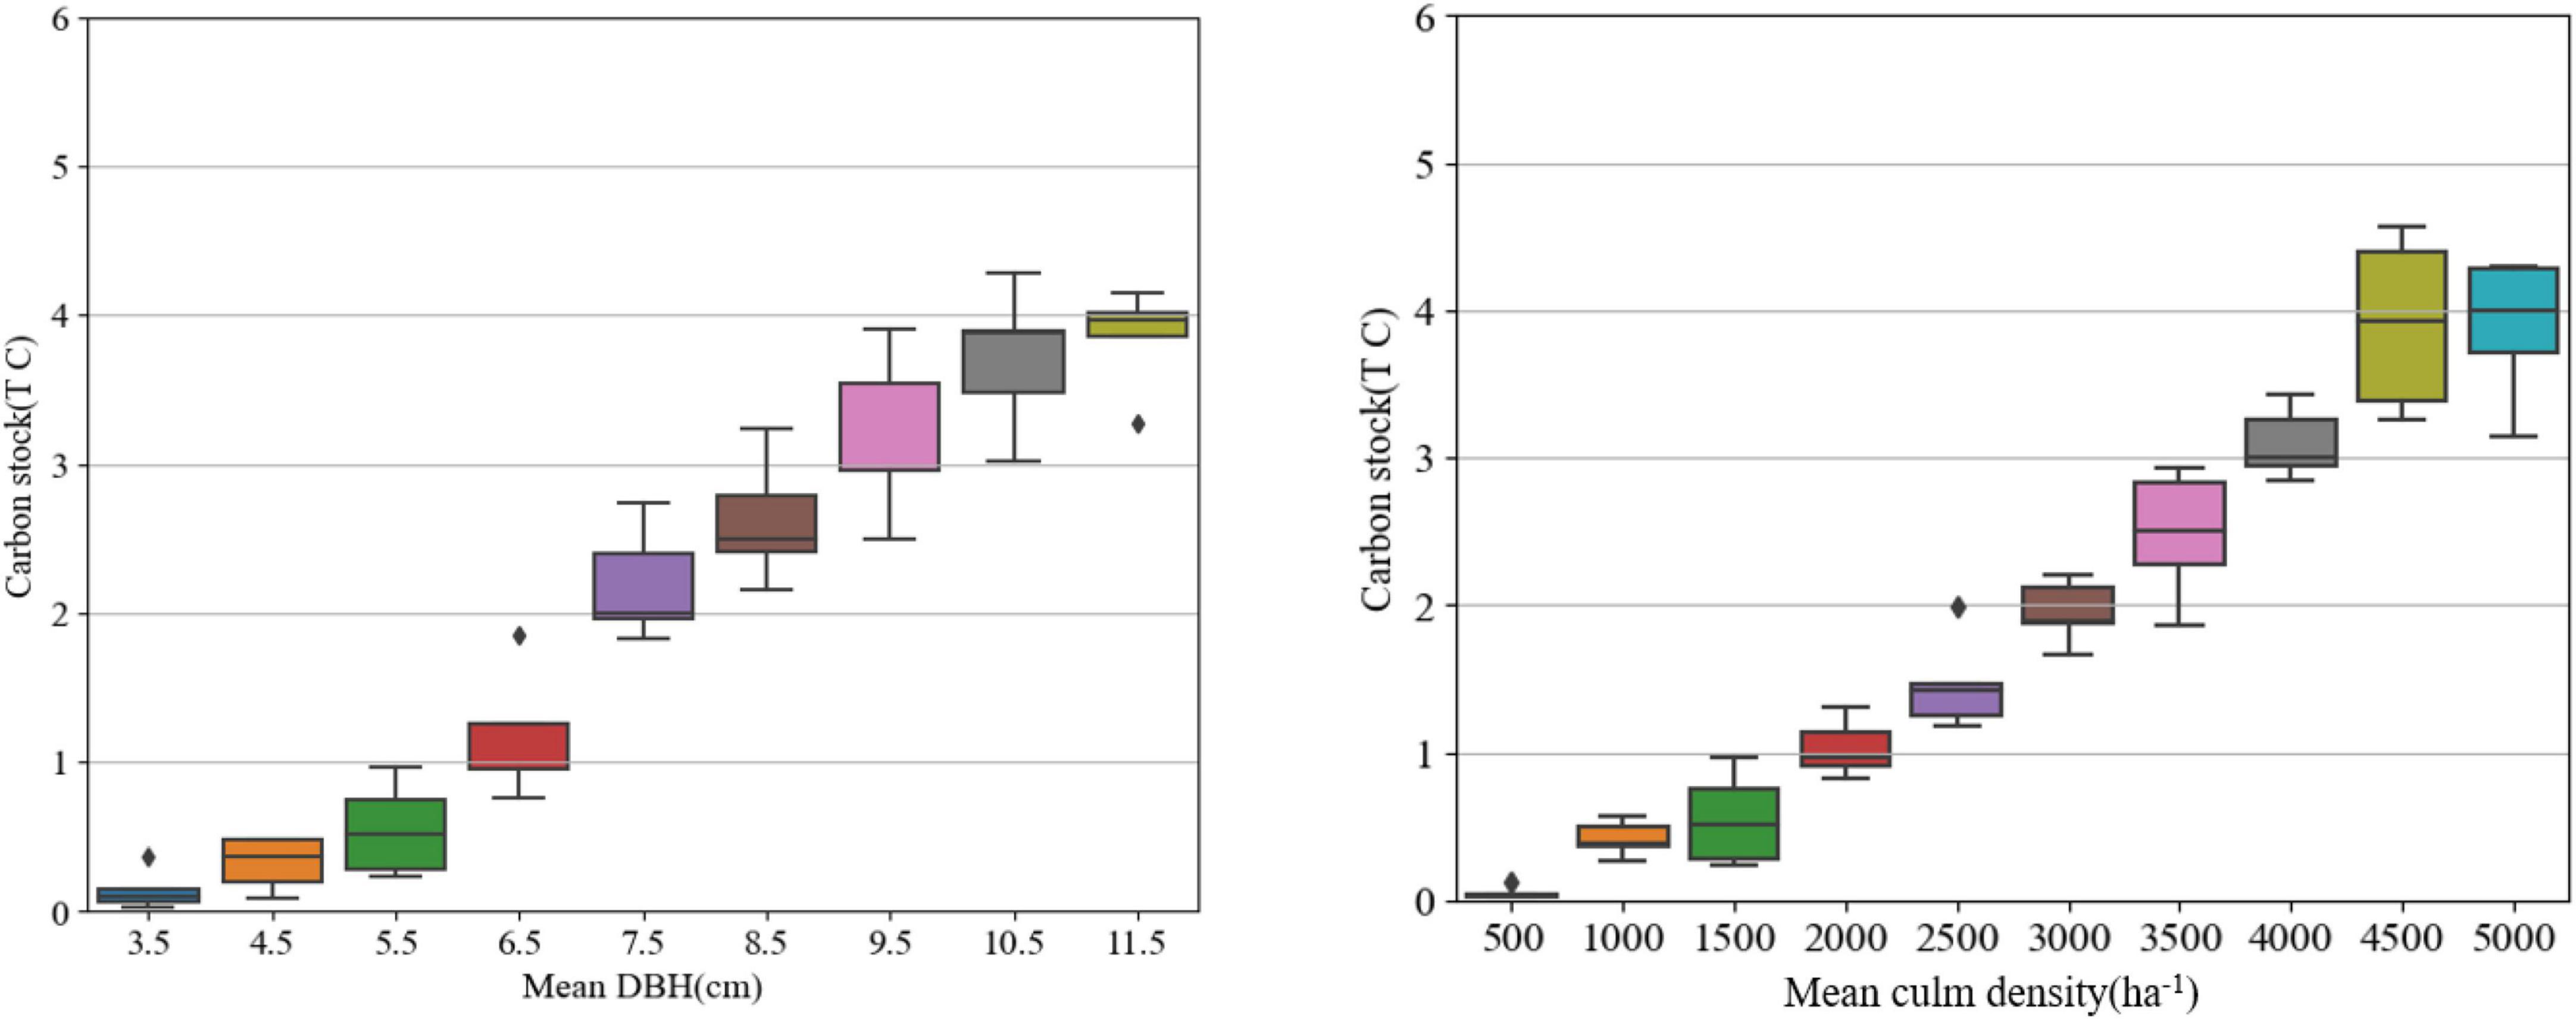
Figure 8. Relationship between carbon stocks in the sample plots and the average breast diameter of the sample plots. Different colors represent the values of the average breast diameter of the sample plots, and the black dots indicate the outliers.
Based on the data from the previous four periods, growth curves were fitted to the Moso bamboo forest sample plots under normal management. The trends observed were as follows: the average DBH of the sample plots followed the equation y = 170.78 ln x − 1290.4 (R2 = 0.9964) (Figure 9A) and the average culm density in sample plots followed the equation y = 188,781 ln x − 1 × 10⁶ (R2 = 0.9985) (Figure 9B). The age-class ratio of Moso bamboo forests remained largely stable with normal management harvesting, and the average age-class of the sample plots showed relative stability. When abandonment of Moso bamboo forests began, there was a strong linear relationship between culm density and the number of years of abandonment: y = 340.66x + 2272.763 (R2 = 0.700, p < 0.01). With increased abandonment management time of, the average breast diameter of the sample plots decreased: y = −0.098x + 10.414 (R2 = 0.378), while the average age class of the sample plots continued to rise: y = 0.069x + 2.261 (R2 = 0.598).
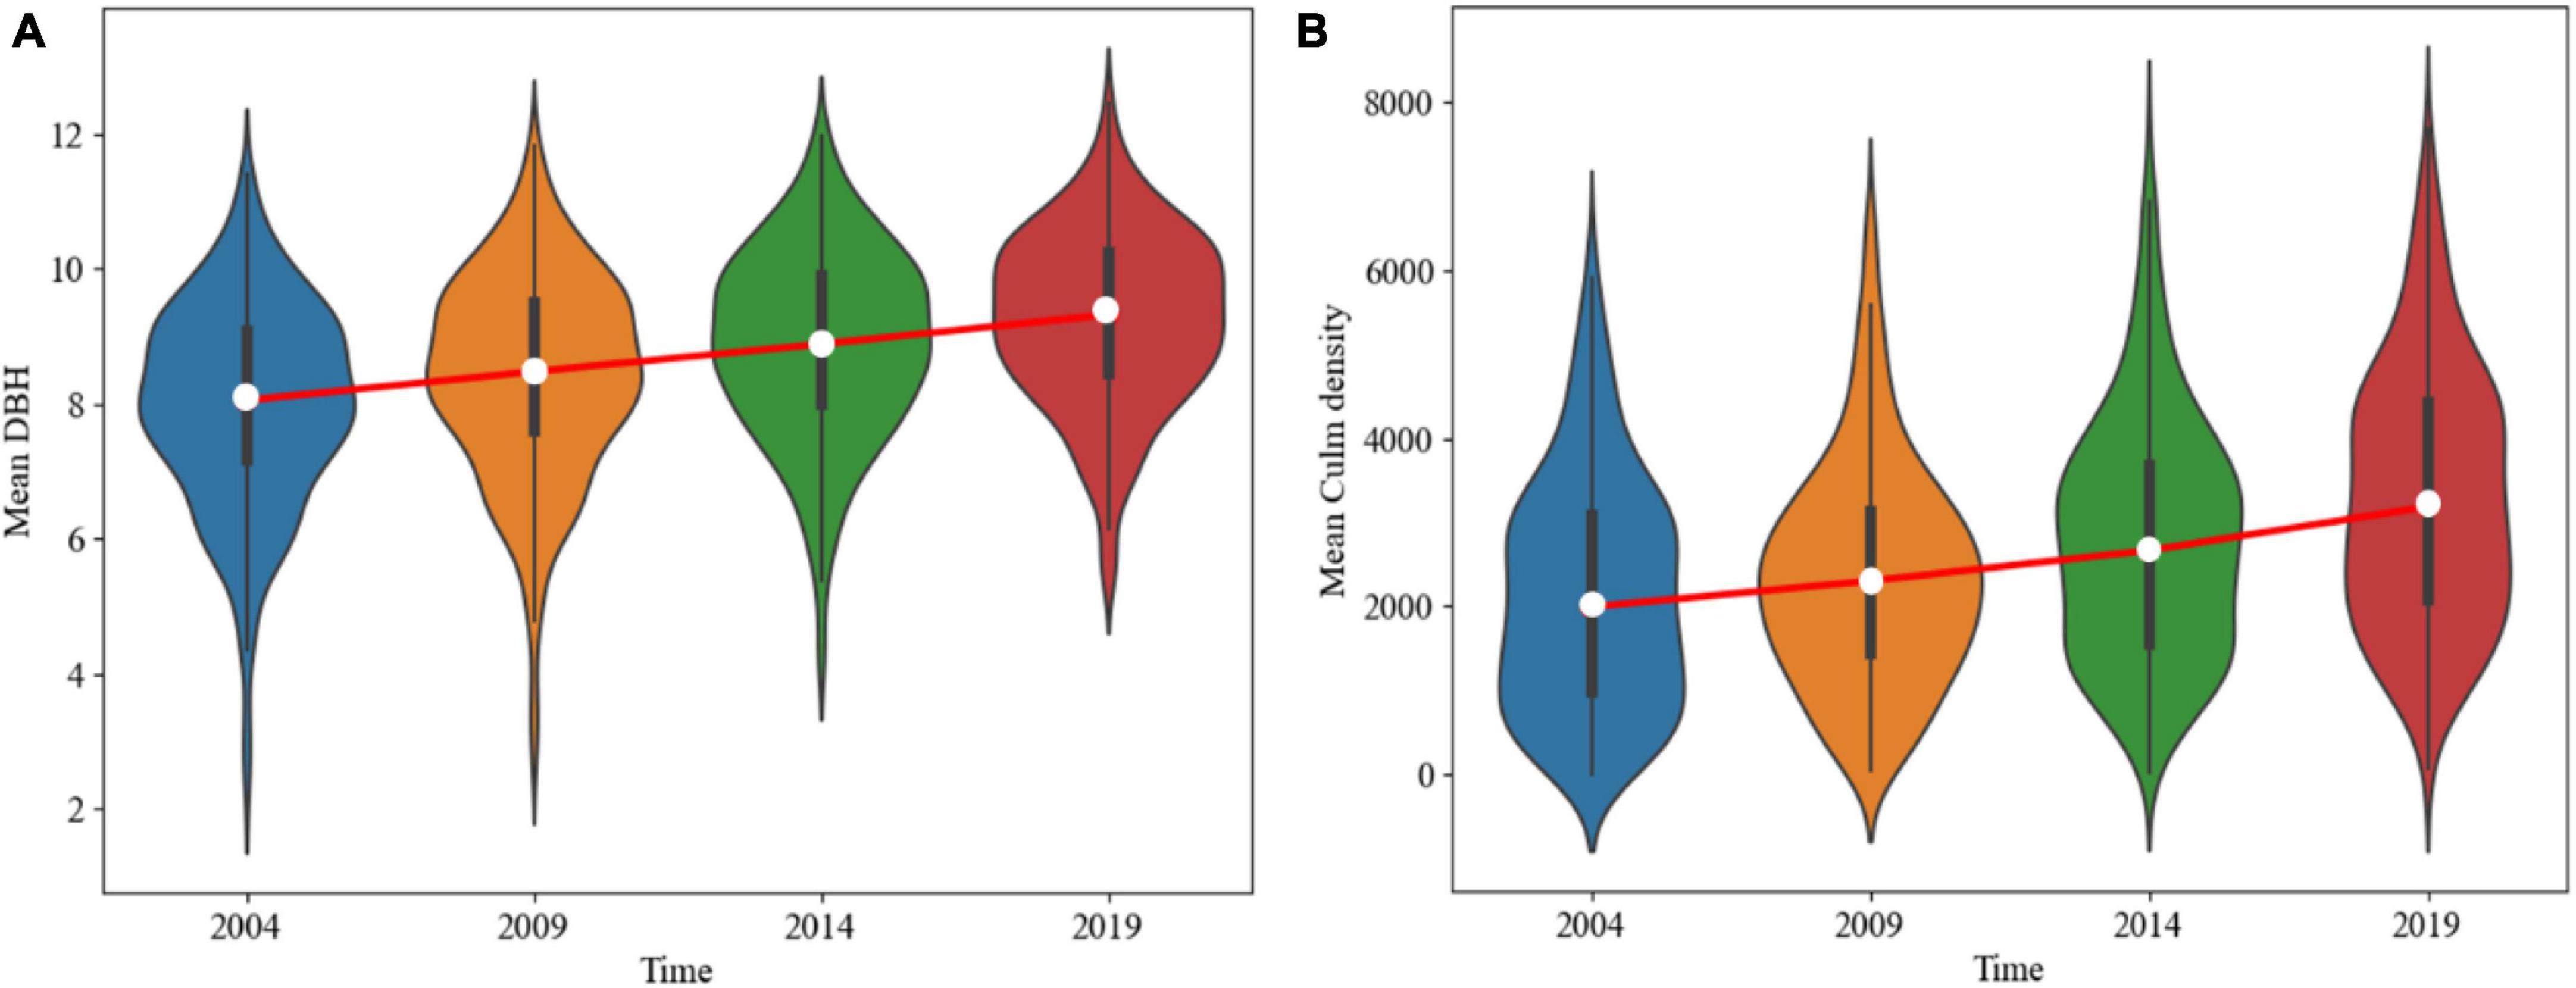
Figure 9. Relationship between stand factors and time for all Moso bamboo forests under normal management. Panel (A) is the average diameter at breast height of all Moso bamboo forest samples over time, and panel (B) is the average culm density of all Moso bamboo forest samples over time. White dots indicate mean values and black lines indicate the standard deviations.
3.3 Dynamic prediction of aboveground carbon stock in Moso bamboo forests in Zhejiang Province under different management measures
According to the Announcement on the Value of Forest Resources and Their Ecological Functions in Zhejiang Province, the areas of Moso bamboo forests in Zhejiang Province were 653,500 ha in 2004, 727,000 ha in 2009, 775,800 ha in 2014, and 814,300 ha in 2019. These figures were used to estimate the aboveground carbon stocks, resulting in the values of 8.51 ± 4.68 Tg C, 9.36 ± 5.37 Tg C, 12.80 ± 6.89 Tg C, and 17.00 ± 8.35 Tg C, respectively. Since there is an annual expansion in the Moso bamboo forest land area, the growth rate of Moso bamboo forest area is projected to be 0.88% based on the reported area of Moso bamboo forest in previous years. We incoproated the values of each parameter into the aboveground carbon stock model constructed by the XGBoost algorithm and predicted the aboveground carbon stock of Moso bamboo forests in Zhejiang Province under different management measures from 2024 to 2060.
As shown in Table 2, under the management scenarios – Measure I, II, and III – the aboveground carbon stock of Moso bamboo forests in Zhejiang Province initially increases continuously, reaching a peak after 40 years, and then stabilizes with minor fluctuations. However, the time taken to reach the peak and the peak’s magnitude vary among these distinct management measures. In the case of Measure I, the aboveground carbon stock of Moso bamboo forest in Zhejiang Province increases continuously, peaking at 31.54 ± 9.60 Tg C in 2053 (Figure 10A). In the case of Measure II, the aboveground carbon stock of Moso bamboo forests in Zhejiang Province increases continuously, peaking at 33.56 ± 7.53 Tg C in 2050 (Figure 10B). In the case of Measure III, the aboveground carbon stock of Moso bamboo forest in Zhejiang Province increases continuously, peaking at 36.25 ± 8.47 Tg C in 2046 (Figure 10C). The time required to reach the peak differs among the measures, with the sequence being Measure I > Measure II > Measure III, and the magnitude of the carbon stock peak follows the order: Measure III > Measure II > Measure I. It is clear that the management measures, involving no harvesting of 1–3 du bamboo, 30% harvesting of 4 du bamboo, and 80% harvesting of 5 du and above, lead to a quicker rise in aboveground carbon stock of Moso bamboo forests in Zhejiang Province. In contrast, under Measure IV, which involves the abandonment of management, the aboveground carbon stock of Moso bamboo forests in Zhejiang Province initially rises and then declines, peaking at 29.50 ± 7.49 Tg C in 2033. However, the aboveground carbon stock continued to decrease over time, and in 2060, it reaches only 26.35 ± 4.42 Tg C in Moso bamboo forests in Zhejiang Province. This value is significantly lower than that observed under the other three management measures during the same period (Figure 10D).
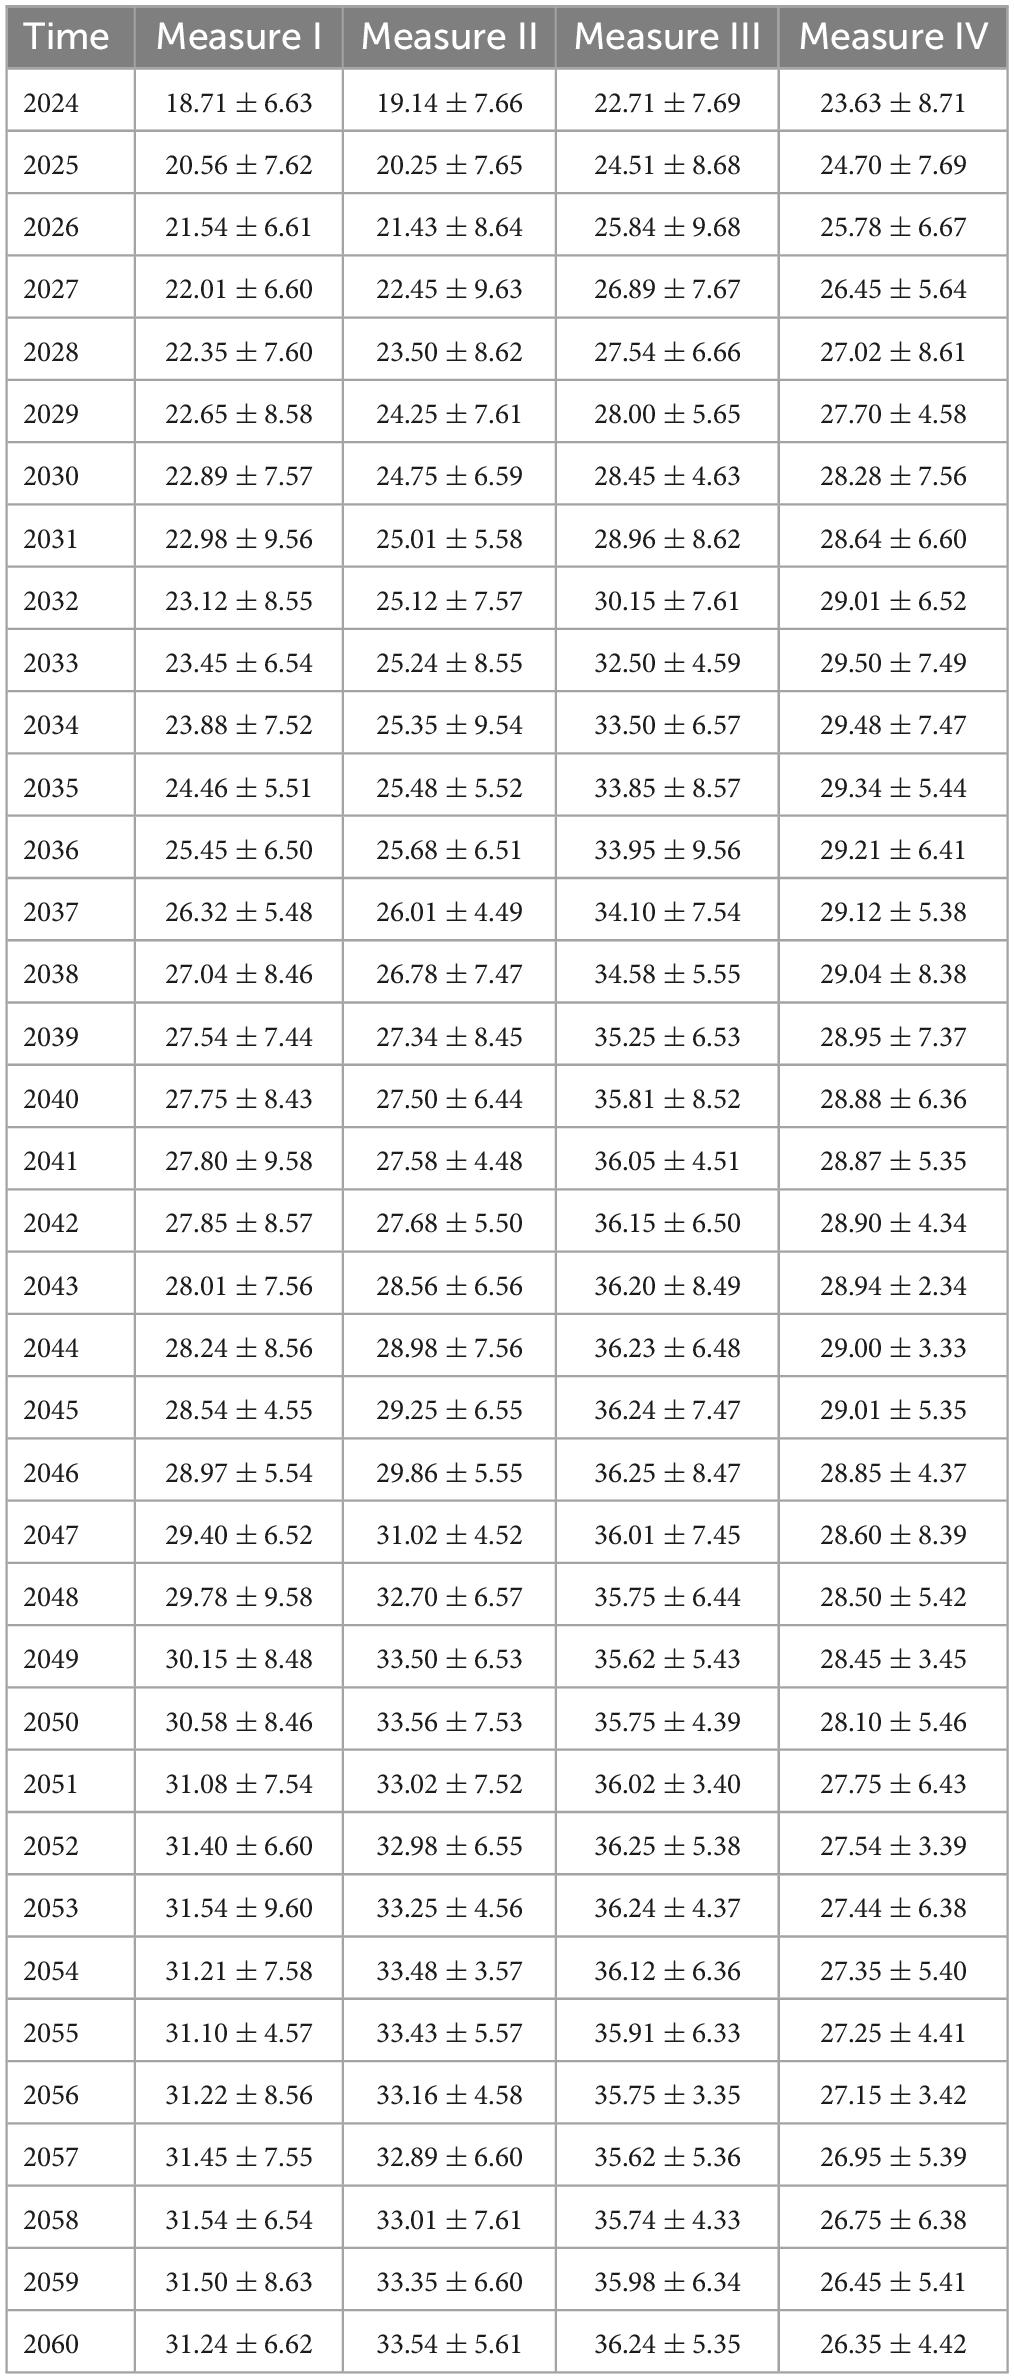
Table 2. Predicted aboveground carbon stocks (Tg C) in Moso bamboo forests in Zhejiang Province, 2024–2060.
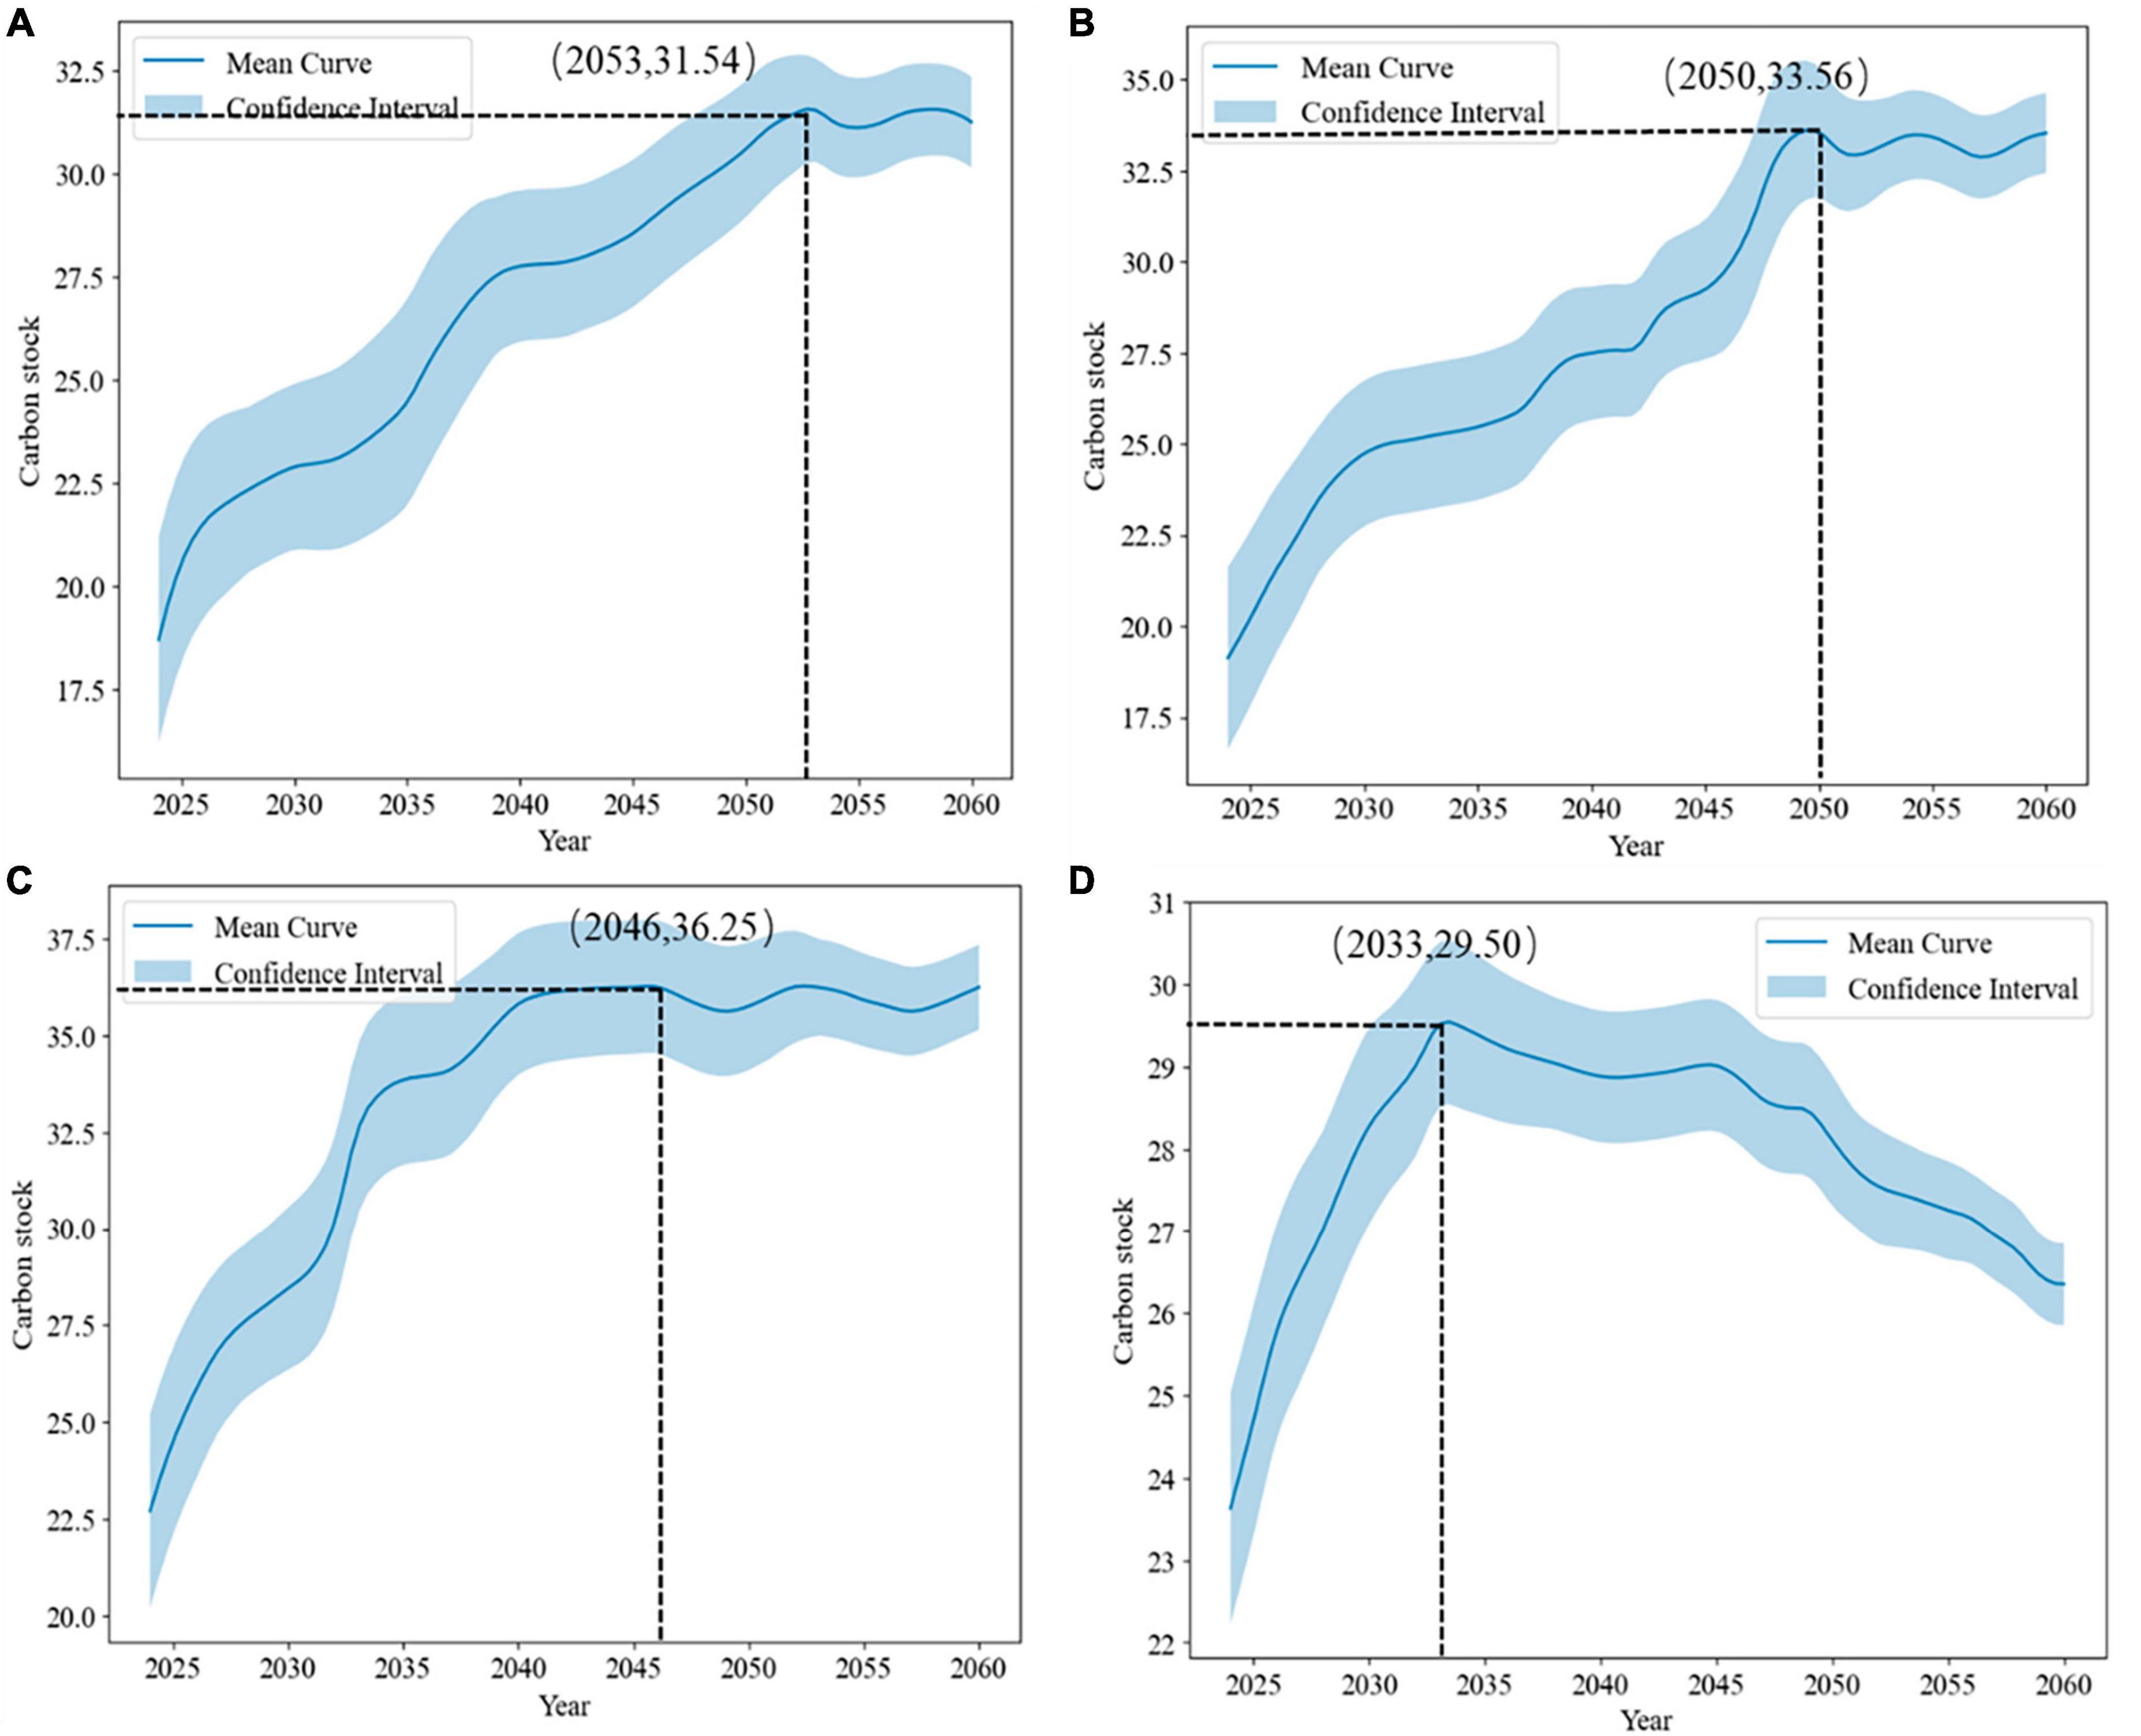
Figure 10. Estimated aboveground carbon stocks in Moso bamboo forests in Zhejiang Province from 2024 to 2060. Measures (A–D) are the predicted aboveground carbon stocks under four different measures, respectively. The blue interval is the 95% confidence interval, and the points corresponding to the black dashed lines are various time points and peak carbon stocks.
4 Discussion
4.1 Evaluation and validation of machine learning for carbon stock prediction in Moso bamboo forests
While assessment methods for current forest carbon stocks at the regional scale are well-established, the prediction of future carbon stocks and sequestration in forests, particularly for aboveground carbon stocks in Moso bamboo forests, remains underexplored (Ni, 2013; Hu et al., 2015; Tang et al., 2018). In this study, we aim to predict future carbon stocks using an XGBoost algorithm-based carbon stock optimization model. This model relies on continuous monitoring data from fixed sample plots in forest inventory, while also considering factors such as area expansion, management measures, and their interactions with forest stand characteristics, topography, and climate. Hu et al. (2015) used a deep learning network to predict the distribution of soil organic carbon stocks under future climate and land use change scenarios up to 2050; Bulut (2023) predicted aboveground biomass in the Mediterranean region using SVMs. However, Xu M. et al. (2023) used RF, SVM, and XGBoost algorithms to predict changes in mangrove soil area and soil carbon stock. Their findings indicated that RFs perform best in fitted regressions, which is not consistent with our results. The reason for this phenomenon may be that we have a large amount of fixed sample data, and the XGBoost algorithm offers quicker training and prediction speed than RFs, which excel at obtaining predictions for smaller datasets (Vlachogiannis et al., 2023). Furthermore, machine learning also has many applications in carbon emissions prediction modeling, Zhao et al. (2023) describes five different machine learning principles and their applications in various domains. In predicting carbon stock in Moso bamboo forests, this study diverges from traditional statistical analysis. It uses machine learning algorithms capable of addressing nonlinear problems without requiring extensive model testing (Grange et al., 2018). The XGBoost algorithm performed well in both test and training sets and successfully predicted future changes in aboveground carbon stocks in Moso bamboo forests.
4.2 Impact of stand structure factors on aboveground carbon stocks in Moso bamboo forests
Our results showed that average culm density, average diameter at breast height, and average age of Moso bamboo were important factors influencing carbon storage, while slope, elevation, and climate do not have a substantial impact on carbon storage. Liu et al. (2013) pointed out that plant count and the average DBH of the stand were the main factors influencing the carbon stock of Moso bamboo forests, which is consistent with our results. In contrast, Fan et al. (2012) argued that the carbon stock in Moso bamboo forest samples is significantly influenced by slope and aspect. The disparity may be attributed to the dominance of stand structure factors on carbon stocks, overshadowing the influence of topographic factors, thus diminishing the effect of slope and aspect on carbon stocks. Culm density is considered to be one of the most important structural factors in Moso bamboo forests (Yu, 2011; Alam et al., 2012), while the DBH of Moso bamboo ranks among the critical parameters for estimating aboveground biomass and carbon stocks (Bond-Lamberty et al., 2002; Ouimet et al., 2008). Xu et al. (2017, 2018) indicated that changes in aboveground carbon stocks in Moso bamboo forests do not correlate with any environmental factors but rather increase with increasing culm density, diameter at breast height, and culm age. These findings show that culm density, DBH, and culm age are strongly correlated with variations in aboveground carbon stocks in Moso bamboo forests. Under normal management, the average DBH and culm density of Moso bamboo forest samples increases, consistent with the findings of Wang et al. (2013) and Yen (2016). However, upon abandonment of the Moso bamboo forest, the average diameter at breast height, average age class, and culm density of Moso bamboo had a strong linear relationship with the duration of abandonment (Yin et al., 2019). Consequently, we can use these relationships to simulate the future stand structure parameters of sample plots under various management scenarios. By integrating these parameters into the carbon stock model developed using the XGBoost algorithm, we can predict aboveground carbon stocks in Moso bamboo forests under different harvesting and abandonment conditions.
4.3 Estimating the aboveground carbon storage potential of Moso bamboo forests
Our estimation reveals an increase in the aboveground carbon stock of Moso bamboo forests in Zhejiang Province over four phases, utilizing data from continuous forest inventory and the area covered by Moso bamboo forests in the region. Liu et al. (2019) simulated the total aboveground carbon stock in Zhejiang Province from 1984 to 2014, ranging from 9.94 to 17.19 Tg C, with an average value of 13.73 Tg C. The total aboveground culm carbon stock of Moso bamboo in Zhejiang Province was 10.75 Tg C in 2009 (Ji et al., 2012) and increased to 14.11 Tg C in 2014 (Xu et al., 2017), which closely aligns with our estimates. Predictions of aboveground carbon stocks in Moso bamboo forests based on data from fixed sample plots have been scarce in previous studies. In our study, we employed four different measures and predicted future changes in aboveground carbon stocks in Moso bamboo forests under each approach. From the prediction results, the carbon stocks under Measure I, II, and III are increasing and eventually stabilizing. Under Measure IV, the carbon stock peaked in 2033, and the aboveground carbon stock of Moso bamboo forests in Zhejiang Province gradually declined, falling below that of the previous three measures after 2034. This phenomenon may be attributed to the absence of management and cutting in the sample plots during the previous period. As the duration of abandonment management increased, it led to a much higher culm density than in normal management practices. Consequently, this led to higher carbon stocks compared to those observed in the previous three measures (Yin et al., 2019). However, in the long run, the increasing culm density in the sample plot will reduce the space available for individual bamboos and intensify competition (Yu, 2011; Inoue et al., 2018). This condition is unfavorable for the development and growth of new bamboos. The average diameter at breast height of the sample plot will consistently decrease, leading to a lower carbon stock in the entire sample plot compared to that under normal management. For the Moso bamboo forests under Measure I, Measure II, and Measure III, we did not harvest the bamboos of 3 du and below (Chunxia and Xingcui, 1997; Zheng and Hong, 1998), because these bamboos have strong photosynthetic capacity, which is important for the growth of new bamboos in the second year in the sample plots (Wu, 1984; Lin and Xiaoyong, 1993). Nevertheless, there is no established criterion for the age ratio of Moso bamboo above 3 du. In our study, Measure III, which involved no harvesting of 1–3 du bamboos, 30% harvesting of 4 du bamboos, and 80% harvesting of 5 du bamboos and above, had superior carbon sequestration capacity compared to the other three measures. One possible reason for this is that a reasonable age-ratio harvesting approach can optimize light exposure within the Moso bamboo forest, promoting photosynthesis and the growth and development of Moso bamboo. Additionally, harvesting also helps alleviate congestion within the Moso bamboo forests, enhancing air circulation, which, in turn, facilitates Moso bamboo respiration and metabolism. Furthermore, rational harvesting can also promote the nutrient circulation and renewal in the soil, improving soil fertility and providing favorable nutrient conditions for Moso bamboo growth (Zeng et al., 2019; Zheng et al., 2022).
Our study suggests that in the initial years following abandonment, the Moso bamboo forest density was still within acceptable levels, enabling rapid bamboo growth due to optimal utilization of light and water on the forest floor without human interference (Inoue et al., 2018). Over extended periods of management abandonment, excessive bamboo heights lead to reduced light availability and increased mortality in bamboo forests (Bell, 1997), leading to a decline in aboveground carbon stocks. Previous related studies have shown that the productivity and carbon sequestration capacity of Moso bamboo forests are related to management measures. Selective harvesting of Moso bamboo is an essential method of maintaining the productivity of Moso bamboo (Kuehl et al., 2013; Mao et al., 2017b). By adjusting the age-class composition of Moso bamboo forests, it is possible to optimize aboveground carbon stocks and achieve sustainable development in Moso bamboo forests. Mao et al. (2017a) proposed that a high-quality management model suggesting that no harvesting bamboo aged 1–5 years, harvesting 30% of 6 years old bamboo, 80% of 7 years old bamboo, and fully harvesting of 8 years old bamboo can theoretically boosting the existing carbon stock of bamboo forests by 74.63%, with an additional 20% increase in aboveground carbon stock. Our study concludes that implementing management measures such as not harvesting 1–3 du bamboo, harvesting 30% of 4 du bamboo, and 80% of 5 du and above will lead to a faster peak of aboveground carbon stock in Moso bamboo forests while effectively enhancing aboveground carbon stock. In addition, the ecosystem management of Moso bamboo forests must be adapted to local conditions, aligning with local policies, maintaining suitably low levels of human interference, and incorporating a comprehensive approach to bamboo forest management. At the same time, the utilization of data-driven intelligent tools and scientific forecasting and assessment instruments offers a new perspective for ensuring the sustainability and multi-targeting optimization of Moso bamboo forest management and development.
4.4 Uncertainty analysis of carbon stock predictions
The main uncertainties in this study arise from three areas: data collection, model predictions, and predictions of future parameter. There are unavoidable human errors in the data survey of fixed sample plots, such as the measurement of the diameter at breast height of Moso bamboo and the estimation of its age, which introduce some biases. At the same time, the climate data are obtained from the ClimateAP software, which has a high degree of uncertainty regarding the origins of historical and future climate data. The selection of model parameters in different machine learning algorithms and the optimization introduce random errors, impacting the accuracy of the model and resulting in uncertainty in carbon stock predictions (Liu et al., 2022). In addition, Moso bamboo forests are a special type of forest with large and small years. We predicted stand parameters such as mean diameter at breast height, mean culm density, and age. These predictions were simulated by discarding anthropogenic disturbances, environmental influences, and completely ideal conditions. These factors directly influence the aboveground carbon stock of Moso bamboo forests, contributing significantly to the overall uncertainty in predicting aboveground carbon stock of Moso bamboo forests. When defining the four different management strategies, factors such as normal mortality within the Moso bamboo forests and anthropogenic harvesting were not considered to optimize the forest environment. Our efforts solely focused on the implemented harvesting measures aiming at minimizing uncertainty in carbon stock prediction. However, the shortcomings of this study were that it did not consider the carbon stock of the underground part and did not integrate the carbon stock of the aboveground and underground parts. Meanwhile, the time series was not too long and the amount of data should be larger, and future studies should consider the whole Moso bamboo forest ecosystem and explore methods to estimate the dynamics of its carbon stock.
4.5 Management implications for Moso bamboo forests
Moso bamboo forests are unique and distinct from other forest types. Their exceptionally high carbon sequestration capacity and the products derived from them makes it critical for carbon cycling and utilization (Li et al., 2015). Previous studies have found that the productivity and carbon sequestration capacity of Moso bamboo forests are related to management measures (Li et al., 2017). Selective harvesting is a necessary approach to ensure the sustainability of Moso bamboo forests. Although abandonment of management may result in a rapid initial increase in carbon stocks in the sample plots. Nonetheless, over time, aboveground carbon stocks will continue to decrease due to high culm density and small DBH of the new bamboos caused by the absence of management (Yin et al., 2019). In our study, bamboos of 3 du and below were retained in harvesting measure I, and bamboos of 4 du and above were entirely harvested. However, related studies found that bamboo of 4 du also has a certain level of photosynthetic capacity. Complete harvesting of the parent bamboo resulted in the inability to supply nutrients directly to the new bamboos, impeding their growth and development, leading to a gradual increase in aboveground carbon stock. Therefore, in Measure II we opted to harvest only 50% of the bamboos of 4 du and above. However, the results were not very promising. Possible reasons for this might be excessive retention of old bamboos, intensive competition within the forest, limited light exposure, unfavorable soil conditions, reduced bamboo forest productivity, and a negligible increase in carbon stocks. The maximum aboveground carbon stock was obtained in the shortest duration by using a strategy of not harvesting of 3 du bamboos and below, while harvesting 30% of 4 du bamboos, and 80% of 5 du bamboos and above. This approach, based on age-class ratios, aligns better with sustainable management of Moso bamboo forests, facilitating healthy competition and efficient utilization of light and water resources to maximize Moso bamboo forest productivity. In line with previous studies, changes in aboveground carbon stocks exhibited positive correlations with rising mean culm density, mean diameter at breast height, and culm age, and largely unaffected by other factors (Shi et al., 2018). By continuously adjusting the age structure and harvesting different ratios of bamboo culms in the Moso bamboo forests, the aboveground carbon stock can be increased. Our results demonstrate that different management measures can lead to different carbon stocks in Moso bamboo forests. Proper and well-planned management measures can help comprehend carbon stock dynamics in Moso bamboo forests, provide guidance for large-area management, and provide impetus for achieving China’s dual-carbon goals.
5 Conclusion
In this study, we constructed the optimal model of aboveground carbon stock in Moso bamboo forests in Zhejiang Province. This was achieved by utilizing continuous fine survey data and climate data from fixed sample plots in Zhejiang Province spanning from 2004 to 2019, along with the application of machine learning algorithms. This study predicted the aboveground carbon stock in Moso bamboo forests in Zhejiang Province under different management measures and identified optimal management strategies. The optimal management measures included no harvesting of 1–3 du bamboo, 30% harvesting of 4 du bamboo, and 80% harvesting of 5 du and above. Under the optimal management strategy, the aboveground carbon stock of Moso bamboo forests in Zhejiang Province is projected to peak in 2046, and carbon sequestration capacity can be maintained at a stable level. Furthermore, our findings indicate that the carbon sequestration capacity of degraded Moso bamboo forests can experience short-term increases but cannot be sustained in the long run. This situation is not conducive to achieving the goal of carbon neutrality. In addition, we found that climate did not solely determine carbon stock changes. Changes in aboveground carbon stocks were found to be strongly correlated with mean culm density, mean diameter at breast height, and mean age. Our study uses machine learning algorithms in conjunction with fixed-sample large datasets and climate data to provide a more precise and efficient approach for evaluating the carbon sequestration capacity of aboveground carbon stocks in regional Moso bamboo forests. However, we did not account for carbon stocks in the underground portion, nor did we integrate aboveground and belowground components. Future research should consider the entire Moso bamboo forest ecosystem and explore methods to estimate the dynamics of its carbon stock.
Data availability statement
The original contributions presented in this study are included in this article/supplementary material, further inquiries can be directed to the corresponding author.
Author contributions
SL: Writing – original draft, Writing – review & editing. NY: Writing – review & editing. XS: Writing – review & editing. XC: Writing – review & editing. YS: Writing – review & editing. GZ: Writing – review & editing. LX: Writing – review & editing.
Funding
The author(s) declare financial support was received for the research, authorship, and/or publication of this article. This study was supported by the National Natural Science Foundation of China (grant number: 32001315).
Acknowledgments
We thank the editor and reviewers for their contribution to the peer reviews of our study.
Conflict of interest
The authors declare that the research was conducted in the absence of any commercial or financial relationships that could be construed as a potential conflict of interest.
Publisher’s note
All claims expressed in this article are solely those of the authors and do not necessarily represent those of their affiliated organizations, or those of the publisher, the editors and the reviewers. Any product that may be evaluated in this article, or claim that may be made by its manufacturer, is not guaranteed or endorsed by the publisher.
References
Alam, A., Kilpeläinen, A., and Kellomäki, S. (2012). Impacts of initial stand density and thinning regimes on energy wood production and management-related CO 2 emissions in boreal ecosystems. Eur. J. For. Res. 131, 655–667. doi: 10.1007/s10342-011-0539-8
Awad, M., Khanna, R., Awad, M., and Khanna, R. (2015). Support vector regression. Effic. Learn. Mach. Theor. Concepts Appl. Eng. Syst. Des. 4, 67–80. doi: 10.1007/978-1-4302-5990-9_4
Bell, D. T. (1997). Eighteen years of change in an Illinois streamside deciduous forest. J. Torrey Bot. Soc. 124, 174–188. doi: 10.2307/2996583
Bond-Lamberty, B., Wang, C., and Gower, S. T. (2002). Aboveground and belowground biomass and sapwood area allometric equations for six boreal tree species of northern Manitoba. Can. J. For. Res. 32, 1441–1450. doi: 10.1139/x02-063
Bulut, S. (2023). Machine learning prediction of above-ground biomass in pure Calabrian pine (Pinus brutia Ten.) stands of the Mediterranean region. Türkiye. Ecol. Inform. 74, 101951. doi: 10.1016/j.ecoinf.2022.101951
Camargo García, J. C., Arango Arango, A. M., and Trinh, L. (2023). The potential of bamboo forests as a carbon sink and allometric equations for estimating their aboveground biomass. Environ. Dev. Sustain. 26, 1–29. doi: 10.1007/s10668-023-03460-1
Chen, T., and Guestrin, C. (2016). “Xgboost: A scalable tree boosting system,” in Proceedings of the 22nd Acm Sigkdd International Conference on Knowledge Discovery and Data Mining, (New York, NY: ACM), 785–794. doi: 10.1145/2939672.2939785
Chen, T., He, T., Benesty, M., Khotilovich, V., Tang, Y., Cho, H., et al. (2015). Xgboost: Extreme gradient boosting. R Package Version 0.4-21.4 1, 1–4.
Chunxia, Z., and Xingcui, D. (1997). Studies on yield of Phyllostachys heterocycla var. pubesens stands. J. Bamboo Res. 16, 31–36.
Du, H., Mao, F., Zhou, G., Li, X., Xu, X., Ge, H., et al. (2018). Estimating and analyzing the spatiotemporal pattern of aboveground carbon in bamboo forest by combining remote sensing data and improved biome-bgc model. IEEE J. Sel. Top. Appl. Earth Obs. Remote Sens. 11, 2282–2295. doi: 10.1109/JSTARS.2018.2817344
Fan, Y., Zhou, G., Shi, Y., Dong, D., and Zhou, Y. (2012). Relationship of slope aspect and position on biomass and carbon storage in a Phyllostachys edulis stand. J. Zhejiang A&F Univ. 29, 321–327.
Gomes, L. C., Faria, R. M., de Souza, E., Veloso, G. V., Schaefer, C. E. G. R., and Fernandes Filho, E. I. (2019). Modelling and mapping soil organic carbon stocks in Brazil. Geoderma 340, 337–350. doi: 10.1016/j.geoderma.2019.01.007
Grange, S. K., Carslaw, D. C., Lewis, A. C., Boleti, E., and Hueglin, C. (2018). Random forest meteorological normalisation models for Swiss PM 10 trend analysis. Atmos. Chem. Phys. 18, 6223–6239. doi: 10.5194/acp-18-6223-2018
Han, N., Du, H., Zhou, G., Xu, X., Cui, R., and Gu, C. (2013). Spatiotemporal heterogeneity of Moso bamboo aboveground carbon storage with Landsat Thematic Mapper images: A case study from Anji County, China. Int. J. Remote Sens. 34, 4917–4932. doi: 10.1080/01431161.2013.782115
Hu, H., Wang, S., Guo, Z., Xu, B., and Fang, J. (2015). The stage-classified matrix models project a significant increase in biomass carbon stocks in China’s forests between 2005 and 2050. Sci. Rep. 5:11203. doi: 10.1038/srep11203
Inoue, A., Sato, M., and Shima, H. (2018). Maximum size-density relationship in bamboo forests: Case study of Phyllostachys pubescens forests in Japan. For. Ecol. Manage. 425, 138–144. doi: 10.1016/j.foreco.2018.05.044
Ji, B., Tao, J., Zhang, G., Yao, H., and Xu, J. (2012). Zhejiang Province’s forest vegetation biomass assessment for guaranteed accuracy. J. Zhejiang A&F Univ. 29, 328–334.
Joachims, T. (1998). Making Large-Scale SVM Learning Practical. German: Technische Universität Dortmund.
Kaam, R., Tchamba, M., Nfornkah, B. N., and Djomo, C. C. (2024). Remote sensing, allometry, and carbon stocks of Phyllostachys aurea in the Western Highlands of Cameroon. Adv. Bamboo Sci. 6:100055. doi: 10.1016/j.bamboo.2023.100055
Kang, F., Li, X., Du, H., Mao, F., Zhou, G., Xu, Y., et al. (2022). Spatiotemporal evolution of the carbon fluxes from bamboo forests and their response to climate change based on a BEPS Model in China. Remote Sens. 14:366. doi: 10.3390/rs14020366
Kuehl, Y., Li, Y., and Henley, G. (2013). Impacts of selective harvest on the carbon sequestration potential in Moso bamboo (Phyllostachys pubescens) plantations. For. Trees Livelihoods 22, 1–18. doi: 10.1080/14728028.2013.773652
Li, C., Zhou, G., Shi, Y., Zhou, Y., Xu, L., Fan, Y., et al. (2017). Effects of different management measures on the net carbon sequestration capacity of moso bamboo forest ecosystem. Sci. Silvae Sin. 53, 1–9.
Li, J., Cheng, J., Shi, J., and Huang, F. (2012). Brief introduction of back propagation (BP) neural network algorithm and its improvement. Adv. Comput. Sci. Inform. Eng. 2, 553–558. doi: 10.1007/978-3-642-30223-7_87
Li, L., Li, N., Lu, D., and Chen, Y. (2019). Mapping Moso bamboo forest and its on-year and off-year distribution in a subtropical region using time-series Sentinel-2 and Landsat 8 data. Remote Sens. Environ. 231:111265. doi: 10.1016/j.rse.2019.111265
Li, L.-E., Lin, Y.-J., and Yen, T.-M. (2016). Using allometric models to predict the aboveground biomass of thorny bamboo (Bambusa stenostachya) and estimate its carbon storage. Taiwan J. Sci. 31, 37–47.
Li, P., Zhou, G., Du, H., Lu, D., Mo, L., Xu, X., et al. (2015). Current and potential carbon stocks in Moso bamboo forests in China. J. Environ. Manage. 156, 89–96. doi: 10.1016/j.jenvman.2015.03.030
Li, X., Du, H., Mao, F., Zhou, G., Chen, L., Xing, L., et al. (2018). Estimating bamboo forest aboveground biomass using EnKF-assimilated MODIS LAI spatiotemporal data and machine learning algorithms. Agric. For. Meteorol. 256, 445–457. doi: 10.1016/j.agrformet.2018.04.002
Li, Y., Han, N., Li, X., Du, H., Mao, F., Cui, L., et al. (2018). Spatiotemporal estimation of bamboo forest aboveground carbon storage based on Landsat data in Zhejiang, China. Remote Sens. 10, 898. doi: 10.3390/rs10060898
Li, Y., Xu, Z., Hao, Z., Yao, X., Zhang, Q., Huang, X., et al. (2023). A comparative study of the performances of joint RFE with machine learning algorithms for extracting Moso bamboo (Phyllostachys pubescens) forest based on UAV hyperspectral images. Geocarto Int. 38:2207550. doi: 10.1080/10106049.2023.2207550
Liemohn, M. W., McCollough, J. P., Jordanova, V. K., Ngwira, C. M., Morley, S. K., Cid, C., et al. (2018). Model evaluation guidelines for geomagnetic index predictions. Sp. Weather 16, 2079–2102. doi: 10.1029/2018SW002067
Lin, H., and Xiaoyong, H. (1993). Rational age structure and growth regularity during shooting period of Phyllostachys pubescens forest for shoot. J. Bamboo Res. 12, 52–56.
Liu, E., Ren, Z., Yao, H., and Zhou, G. (2021). Multi-scale estimation of carbon storage for moso bamboo (Phyllostachys edulis) based on the mixed weibull density function. Glob. Ecol. Conserv. 31:e01856. doi: 10.1016/j.gecco.2021.e01856
Liu, E., Shi, Y., Li, Y., Zhou, G., and Yang, D. (2013). Non spatial structural characteristic of moso bamboo forest and its dynamics in Zhejiang province. Sci. Silvae Sin. 49, 1–7.
Liu, T. Y., Mao, F. J., Li, X. J., Xing, L. Q., Dong, L. F., Zheng, J. L., et al. (2019). Spatiotemporal dynamic simulation on aboveground carbon storage of bamboo forest and its influence factors in Zhejiang Province, China. J. Appl. Ecol. 30, 1743–1753.
Liu, W., Chen, Z., and Hu, Y. (2022). XGBoost algorithm-based prediction of safety assessment for pipelines. Int. J. Press. Vessel. Pip. 197:104655. doi: 10.1016/j.ijpvp.2022.104655
Lv, Y., Han, N., and Du, H. (2023). Estimation of bamboo forest aboveground carbon using the RGLM model based on object-based multiscale segmentation of SPOT-6 imagery. Remote Sens. 15:2566. doi: 10.3390/rs15102566
Mao, F., Du, H., Zhou, G., Li, X., Xu, X., Li, P., et al. (2017a). Coupled LAI assimilation and BEPS model for analyzing the spatiotemporal pattern and heterogeneity of carbon fluxes of the bamboo forest in Zhejiang Province, China. Agric. For. Meteorol. 242, 96–108. doi: 10.1016/j.agrformet.2017.03.022
Mao, F., Zhou, G., Li, P., Du, H., Xu, X., Shi, Y., et al. (2017b). Optimizing selective cutting strategies for maximum carbon stocks and yield of Moso bamboo forest using BIOME-BGC model. J. Environ. Manage. 191, 126–135. doi: 10.1016/j.jenvman.2017.01.016
Mao, F., Li, P., Zhou, G., Du, H., Xu, X., Shi, Y., et al. (2016). Development of the BIOME-BGC model for the simulation of managed Moso bamboo forest ecosystems. J. Environ. Manage. 172, 29–39. doi: 10.1016/j.jenvman.2015.12.013
Ni, J. (2013). Carbon storage in Chinese terrestrial ecosystems: Approaching a more accurate estimate. Clim. Change 119, 905–917. doi: 10.1007/s10584-013-0767-7
Ouimet, R., Camire, C., Brazeau, M., and Moore, J.-D. (2008). Estimation of coarse root biomass and nutrient content for sugar maple, jack pine, and black spruce using stem diameter at breast height. Can. J. For. Res. 38, 92–100. doi: 10.1139/X07-134
Pan, C., Zhou, G., Shrestha, A. K., Chen, J., Kozak, R., Li, N., et al. (2023). Bamboo as a Nature-Based Solution (NbS) for climate change mitigation: Biomass. Prod. Carbon Credits Clim. 11:175. doi: 10.3390/cli11090175
Poorazimy, M., Shataee, S., McRoberts, R. E., and Mohammadi, J. (2020). Integrating airborne laser scanning data, space-borne radar data and digital aerial imagery to estimate aboveground carbon stock in Hyrcanian forests, Iran. Remote Sens. Environ. 240:111669. doi: 10.1016/j.rse.2020.111669
Qi, S., Song, B., Liu, C., Gong, P., Luo, J., Zhang, M., et al. (2022). Bamboo forest mapping in China using the dense Landsat 8 image archive and Google Earth Engine. Remote Sens. 14:762. doi: 10.3390/rs14030762
Ramakrishnan, M., Yrjälä, K., Vinod, K. K., Sharma, A., Cho, J., Satheesh, V., et al. (2020). Genetics and genomics of moso bamboo (Phyllostachys edulis): Current status, future challenges, and biotechnological opportunities toward a sustainable bamboo industry. Food Energy Secur. 9:229. doi: 10.1002/fes3.229
Reiersen, G., Dao, D., Lütjens, B., Klemmer, K., Amara, K., Steinegger, A., et al. (2022). “ReforesTree: A dataset for estimating tropical forest carbon stock with deep learning and aerial imagery,” in Proceedings of the AAAI Conference on Artificial Intelligence, (Washington, DC: AAAI Press), 12119–12125. doi: 10.1609/aaai.v36i11.21471
Saltelli, A. (2002). Making best use of model evaluations to compute sensitivity indices. Comput. Phys. Commun. 145, 280–297. doi: 10.1016/S0010-4655(02)00280-1
Shang, Z., Zhou, G., Du, H., Xu, X., Shi, Y., Lü, Y., et al. (2013). Moso bamboo forest extraction and aboveground carbon storage estimation based on multi-source remotely sensed images. Int. J. Remote Sens. 34, 5351–5368. doi: 10.1080/01431161.2013.788260
Shi, Y., Xu, L., Zhou, Y., Ji, B., Zhou, G., Fang, H., et al. (2018). Quantifying driving factors of vegetation carbon stocks of Moso bamboo forests using machine learning algorithm combined with structural equation model. For. Ecol. Manage. 429, 406–413. doi: 10.1016/j.foreco.2018.07.035
Silatsa, F. B. T., Yemefack, M., Tabi, F. O., Heuvelink, G. B. M., and Leenaars, J. G. B. (2020). Assessing countrywide soil organic carbon stock using hybrid machine learning modelling and legacy soil data in Cameroon. Geoderma 367:114260. doi: 10.1016/j.geoderma.2020.114260
Tang, X., Zhao, X., Bai, Y., Tang, Z., Wang, W., Zhao, Y., et al. (2018). Carbon pools in China’s terrestrial ecosystems: New estimates based on an intensive field survey. Proc. Natl. Acad. Sci. U. S. A. 115, 4021–4026. doi: 10.1073/pnas.1700291115
Terefe, R., Jian, L., and Kunyong, Y. (2019). Role of bamboo forest for mitigation and adaptation to climate change challenges in China. J. Sci. Res. Rep. 24, 1–7. doi: 10.9734/jsrr/2019/v24i130145
Uniyal, S., Purohit, S., Chaurasia, K., Rao, S. S., and Amminedu, E. (2022). Quantification of carbon sequestration by urban forest using Landsat 8 OLI and machine learning algorithms in Jodhpur, India. Urban For. Urban Green. 67:127445. doi: 10.1016/j.ufug.2021.127445
Vlachogiannis, D. M., Moura, S., and Macfarlane, J. (2023). Intersense: An XGBoost model for traffic regulator identification at intersections through crowdsourced GPS data. Transp. Res. Part C Emerg. Technol. 151:104112. doi: 10.1016/j.trc.2023.104112
Wang, B., Wei, W. J., Liu, C. J., You, W. Z., Niu, X., and Man, R. Z. (2013). Biomass and carbon stock in Moso bamboo forests in subtropical China: Characteristics and implications. J. Trop. For. Sci. 25, 137–148.
Wang, T., Wang, G., Innes, J. L., Seely, B., and Chen, B. (2017). ClimateAP: An application for dynamic local downscaling of historical and future climate data in Asia Pacific. Front. Agric. Sci. Eng. 4, 448–458. doi: 10.15302/J-FASE-2017172
Wu, B. S. (1984). A preliminary analysis of the relationship between the underground structure of a Phyllostachys pubescens forest and its yield. J. Bamboo Res. 3, 49–58.
Xu, L., Shi, Y., Zhou, G., Xu, X., Liu, E., Zhou, Y., et al. (2017). Temporal change in aboveground culms carbon stocks in the Moso bamboo forests and its driving factors in Zhejiang Province, China. Forests 8:371. doi: 10.3390/f8100371
Xu, L., Shi, Y., Zhou, G., Xu, X., Liu, E., Zhou, Y., et al. (2018). Structural development and carbon dynamics of Moso bamboo forests in Zhejiang Province, China. For. Ecol. Manage. 409, 479–488. doi: 10.1016/j.foreco.2017.11.057
Xu, M., Sun, C., Du, Z., and Zhu, X. (2023). Impacts of aquaculture on the area and soil carbon stocks of mangrove: A machine learning study in China. Sci. Total Environ. 859:160173. doi: 10.1016/j.scitotenv.2022.160173
Xu, X., Du, H., Zhou, G., Ge, H., Shi, Y., Zhou, Y., et al. (2011). Estimation of aboveground carbon stock of Moso bamboo (Phyllostachys heterocycla var. pubescens) forest with a Landsat Thematic Mapper image. Int. J. Remote Sens. 32, 1431–1448. doi: 10.1080/01431160903551389
Xu, Y., Ge, X., Gao, G., Yang, Y., Hu, Y., Li, Z., et al. (2023). Divergent contribution of microbial-and plant-derived carbon to soil organic carbon in Moso bamboo forests left unmanaged. CATENA 233:107481. doi: 10.1016/j.catena.2023.107481
Yang, C., Wang, A., Zhu, Z., Lin, S., Bi, Y., and Du, X. (2021). Impact of extensive management system on soil properties and carbon sequestration under an age chronosequence of Moso bamboo plantations in subtropical China. For. Ecol. Manage. 497:119535. doi: 10.1016/j.foreco.2021.119535
Yen, T.-M. (2015). Comparing aboveground structure and aboveground carbon storage of an age series of moso bamboo forests subjected to different management strategies. J. For. Res. 20, 1–8. doi: 10.1007/s10310-014-0455-0
Yen, T.-M. (2016). Culm height development, biomass accumulation and carbon storage in an initial growth stage for a fast-growing moso bamboo (Phyllostachy pubescens). Bot. Stud. 57, 1–9. doi: 10.1186/s40529-016-0126-x
Yin, J., Ge, Z., Deng, X., Shi, Y., Xu, L., Zhou, G., et al. (2019). Abandonment lead to structural degradation and changes in carbon allocation patterns in Moso bamboo forests. For. Ecol. Manage. 449:117449. doi: 10.1016/j.foreco.2019.117449
Yu, L. (2011). Study on Density Effect of Phyllostachys edulis Stands in Southern Anhui Province. Beijing: Chinese Academy.
Yu, L., Wei, J., Li, D., Zhong, Y., and Zhang, Z. (2023). Explaining landscape levels and drivers of Chinese Moso bamboo forests based on the plus model. Forests 14:397. doi: 10.3390/f14020397
Zamani Joharestani, M., Cao, C., Ni, X., Bashir, B., and Talebiesfandarani, S. (2019). PM2. 5 prediction based on random forest, XGBoost, and deep learning using multisource remote sensing data. Atmosphere 10:373. doi: 10.3390/atmos10070373
Zeng, X., Su, W., Fan, S., and Jin, Y. (2019). Qualitative recovery characteristics of Moso bamboo forests under strip clearcutting. Acta Bot. Boreali-Occidentalia Sin. 39, 917–924.
Zhao, Y., Liu, R., Liu, Z., Liu, L., Wang, J., and Liu, W. (2023). A review of macroscopic carbon emission prediction model based on machine learning. Sustainability 15:6876. doi: 10.3390/su15086876
Zheng, Y., Fan, S., Zhou, X., Zhang, X., and Guan, F. (2022). Dynamics of stand productivity in Moso bamboo forest after strip cutting. Front. Plant Sci. 13:1064232. doi: 10.3389/fpls.2022.1064232
Zheng, Y., and Hong, W. (1998). A study on age structure model of bamboo stand and its application. Sci. Silvae Sin. 34, 32–39.
Zhou, G. (2006). Carbon Storage, Fixation and Distribution in Moso Bamboo (Phyllostachy pubescens) Stands Ecosystem (in Chinese). Hangzhou: ZheJiang University
Zhou, G., Ni, Z., Zhao, Y., and Luan, J. (2022). Identification of bamboo species based on extreme gradient boosting (XGBoost) Using Zhuhai-1 orbita hyperspectral remote sensing imagery. Sensors 22:5434. doi: 10.3390/s22145434
Keywords: Phyllostachys pubescens, machine learning, climate change, management optimization, carbon sequestration capacity
Citation: Lv S, Yuan N, Sun X, Chen X, Shi Y, Zhou G and Xu L (2024) Estimating carbon sequestration potential and optimizing management strategies for Moso bamboo (Phyllostachys pubescens) forests using machine learning. Front. For. Glob. Change 7:1338795. doi: 10.3389/ffgc.2024.1338795
Received: 15 November 2023; Accepted: 08 March 2024;
Published: 04 April 2024.
Edited by:
Yashwant Singh Rawat, Federal Technical and Vocational Education and Training Institute (FTVETI), EthiopiaReviewed by:
Shiferaw Abebe, Assosa University, EthiopiaSelim Reza, International Network for Bamboo and Rattan (INBAR), China
Jayaraman Durai, International Network for Bamboo and Rattan (INBAR), China
Copyright © 2024 Lv, Yuan, Sun, Chen, Shi, Zhou and Xu. This is an open-access article distributed under the terms of the Creative Commons Attribution License (CC BY). The use, distribution or reproduction in other forums is permitted, provided the original author(s) and the copyright owner(s) are credited and that the original publication in this journal is cited, in accordance with accepted academic practice. No use, distribution or reproduction is permitted which does not comply with these terms.
*Correspondence: Lin Xu, xul1210@163.com