Effects of forest type on carbon storage in the hilly region of Loess Plateau, China
 Zhihua Song1,2
  Peng Shi
- 1State Key Laboratory of Eco-hydraulics in Northwest Arid Region of China, Xi’an University of Technology, Xi’an, China
- 2Key Laboratory of National Forestry Administration on Ecological Hydrology and Disaster Prevention in Arid Regions, Xi’an University of Technology, Xi’an, China
- 3Shaanxi Coalbed Methane Development Co., Ltd., Xi’an, China
- 4Shaanxi Ecological Industry Co., Ltd., Xi’an, China
- 5Northwest Institute of Forest Inventory, Planning and Design, National Forestry and Grassland Administration, Xi’an, China
The hilly region of the Loess Plateau has lush vegetation and high carbon sequestration potential. However, previous studies have not focused on differences in carbon storage of different forest types and their causes. This study aimed to explore the carbon storage of forest and identify the main influencing factors of carbon storage to provide basis for improving the carbon fixation capacity of planted forest in the region. Broad-leaved, coniferous, and mixed forests at different altitudes were selected from the Ziwuling Mountains in the Loess hilly region. The carbon storage as well as physical and chemical characteristics of the vegetation and soil samples from different soil layers were measured. The vegetation factor, terrain factor, and soil factor of the sample plot were evaluated by Mantel test and redundancy analysis (RDA). The carbon storage of the mixed forest (138.87 MgC hm−2) showed the highest carbon storage compared to broad-leaved forest (131.97 MgC hm−2) and coniferous forest (113.62 MgC hm−2) in the loess hilly region. The carbon storage of different components followed the order of soil carbon storage, vegetation carbon storage, and litter carbon storage. The soil organic carbon content and forest type had the highest explanations for total carbon storage, accounting for 57 and 26.9% of the variance, respectively. This indicates that forest type is an important factor affecting carbon storage, and selecting mixed forests can achieve better results when creating and transforming carbon sink forests.
1 Introduction
Climate change and global warming are among the greatest global challenges in the world today. Recently, the rate of global temperature has substantially increased. In July 2023, the global average temperature reached historical highs. The destructive impact caused by the greenhouse effect is increasing annually, causing a series of climate disasters such as melting glaciers and forest fires. Currently, solving climate issues to sustain the environment is urgently needed.
Forests play an important role in mitigating the greenhouse effect and are among the most important carbon sinks in the global carbon cycle. Research showed that forest ecosystems store 50–60% of land carbon in one-third of the land area (Reich et al., 2006). More than 60% of the organic carbon in terrestrial ecosystems is fixed in forest ecosystems every year (Kramer, 1981). Forests can sufficiently offset 12% of fossil fuel emissions during the same period (Pan et al., 2011), indicating that they play an important role in regulating the global carbon balance, mitigating and adapting to climate change, maintaining global climate stability, and reducing global carbon emissions. Globally, research on the natural mechanisms of forest carbon sequestration has attracted considerable attention owing to its outstanding performance in reducing atmospheric CO2. Studying forest carbon sinks has important practical significance for understanding and responding to global climate change and for protecting and managing forest ecosystems.
The carbon sequestration capacity of forests depends on many factors, including external factors, such as precipitation, temperature, altitude, and terrain (Stegen et al., 2011; Peter et al., 2014), as well as internal factors, such as forest age, tree species composition, and vegetation density, which can affect plant biomass and carbon exchange (Stegen et al., 2010; Dapao et al., 2014). The exploration of forest biomass began at the end of the 19th century, and the main research content was about predicted the change of forest productivity by measuring the biomass of branches, leaves and wood (Ebermeryer, 1876). With the gradual deepening of theoretical research, research on understory vegetation, roots, and forest soil carbon pools has expanded (Schulze et al., 1999). Differences in carbon sequestration capacity of different forests and influencing factors, assessment of the current status and potential of forest carbon sinks, optimization of forest carbon sink estimation models, and determination of the spatiotemporal distribution pattern of forest carbon sinks have become the focus of scholarly attention (Chou et al., 2023). Relevant research results indicate that external factors, such as climate, have more considerable impact on forest carbon sinks than that of non-climate factors such as soil variables (Ali et al., 2020; Bennett et al., 2020). The combined effect of precipitation and temperature is an important factor affecting the carbon allocation model of forest ecosystems (Taylor et al., 2017). An increase in precipitation leads to an increase in forest vegetation and soil CO2 fluxes (Afreen and Singh, 2019). High temperatures negatively affect the forest vegetation and soil carbon sinks (Dai et al., 2018). According to Paquette and Messier (2011), the main factors driving differences in forest species diversity and carbon sequestration capacity vary across climatic regions. In temperate forests, competition between species outweighs complementarity because of the environment is favorable for species growth, whereas in the more stressful environment of boreal forests, beneficial interactions between species may be more important. This indicates that the biological characteristics of forests can also lead to differences in their carbon sequestration capacity (Paquette and Messier, 2011).
As for internal factors, tree age is an important factor affecting carbon storage. The carbon sequestration capacity of the forests exhibits a slow, rapid, and slow increase pattern with increasing tree age, and the rate of carbon sequestration in forests is highest in middle-aged forest ecosystems. Owing to the basic cessation of biomass growth in mature and over-mature forests, the absorption and release of CO2 are balanced (Sobrado, 1994; Yin et al., 2020). Different species composition affects forest productivity, and a positive correlation between productivity and species richness before reaching species saturation was observed. An increase in biodiversity increases the functionality of species in the community (such as vegetation root depth, canopy height, growth speed, competitiveness, and tolerance to adverse environments), thereby maximizing resource utilization and improving ecosystem function (Clark and McLachlan, 2003). The adaptability of different tree species to the environment and the cumulative rate of tree biomass are different, resulting in differences in carbon sequestration capacity among different forest types. A study on carbon sequestration of seven typical vegetation types in the Xiaoxing’an Mountains region of China shows that because of short growth cycle, planted forests have great potential for carbon sink; nevertheless, natural forest have higher forest quality and strong carbon absorption capacity (Hu et al., 2015).
In addition to plant factors, soil differences are also the reasons for the differences in carbon sequestration rates of different forest types. According to previous studies, soil carbon storage content varies greatly among different stand types, which is related to stand site type, climatic conditions, and forest property, etc. Previous studies have found that SOC storage of the 0–60 cm layer of the six soils was Picea asperata Mast > Quercus aliena var acuteserrata (Matoutan forest farm) > Pine-oak mixed forest > for Pinus armandii Franch > Quercus aliena var acuteserrata (Xinjiashan forest farm) > Pinus tabulaeformis Carr. There was a significant positive correlation between soil organic carbon content and soil total nitrogen content (Wang et al., 2015). Under the same climatic conditions, Wang et al.’s (2012) research in Jiufeng area of Beijing showed that broad-leaved forest was more able to accumulate soil organic carbon than coniferous forest (Wang et al., 2012).
The Loess Plateau is the largest loess sedimentary area in the world, with a total area of 648,700 km2, which accounts for 6.7% of the total area of China. Due to human interference, the local native vegetation has suffered serious damage. The Loess Plateau is well known for its fragile ecological environment and severe soil erosion. To preserve the fragile ecological environment and improve the lives of local residents, the Chinese government has been conducting soil and water conservation work on the Loess Plateau since the 1960s. The comprehensive management of small watersheds and projects, such as returning farmland to forests, has significantly increased vegetation coverage and reduced sediment deposition in the Yellow River. The Ziwuling forest area, located in the central part of the Loess Plateau, has dense vegetation and diverse forest structures including coniferous, broad-leaved, and mixed forests. Currently, research on forest carbon storage has mainly focused on analyzing factors such as climate and terrain on a large scale; however, the analysis of factors affecting forest carbon storage in a small range is lacking. Forest type has an important effect on community structure, is the most substantial feature of forests and may affect carbon sink storage. Previous studies have not looked at differences in carbon storage in different forest types and the reasons for them. Therefore, the study of forest carbon pool in Ziwuling forest area has played a good demonstration role in improving the stand structure and enhancing the carbon sink capacity of the Loess Plateau.
This study aimed to address the following issues by studying the factors influencing planted forests in the Ziwuling forest area: (1) quantify the carbon storage of each component in the planted forest ecosystem under different forest stand structures, including vegetation carbon storage, soil carbon storage, and litter carbon storage; (2) evaluate the main factors influencing carbon storage in the forest ecosystem on the Loess Plateau; (3) Determine a suitable carbon sink forest structure on the Loess Plateau.
2 Materials and methods
2.1 Study area
This study was conducted in the Ziwuling Mountains in the hinterland of the Loess Plateau. The sample site is located in Shuanglong Forest Farm, Huangling County, Yan’an City, Shaanxi Province (108.9752E–108.9975E, 35.6211N–35.6409N). The total area of the research region is 506 hm2, with an altitude distribution range of 900–1,400 m. The climate of the forest area is a warm temperate continental monsoon climate, with an average temperature of 3.42–11.90°C. The temperature is relatively low in summer and persists for a short time. The average annual rainfall is 609.5 mm, which is mainly concentrated in July, August, and September, with an annual evaporation of 1,202 mm. The annual sunshine duration is approximately 2,528 h, and the frost-free period is 190–225 d. The main vegetation type of the forest is the tree species, and the forest coverage rate reaches 99.62%. The distribution area of Pinus tabuliformis Carr in forested areas accounted for 19.42% of the total area of forests, whereas the area of Quercus acutissima Carruth accounted for 80.58% of the total forest area. Therefore, coniferous and broad-leaved forests were chosen as the research subjects for this experiment.
We divided the distribution areas of coniferous, broad-leaved, and mixed forests through on-site investigations and set up survey plots for the three types of forests. According to the survey, the landform of the study area is characterized by low elevation hills, the altitude distribution range is 900–1,400 m. Every 100 m difference in altitude results in considerable changes in environmental factors, such as forest slope and temperature, which in turn affect vegetation growth and forest tree species composition. Therefore, sample plots were set up on hillsides with vertical elevation 100 m apart. Sample plots were set up between above sea level 940–1,040 m, 1,040–1,140 m, and 1,140–1,240 m. Hills with coniferous, broad-leaved, and mixed forest types were selected on the sunny side. The sample plots for each forest type were selected based on the altitude required for the study. Each plot had a length and width of 20 m, and three consecutive plots were used as replicates for each altitude gradient. The research data were taken based on the average of three plots. Sample plots of the coniferous forest are categorized into three, C1 (940–1,040 m), C2 (1,040–1,140 m), and C3 (1,140–1,240 m). Similarly, broad-leaved forests were categorized as B1 (length of 940–1,040 m), B2 (length of 1,040–1,140 m), and B3 (1,140–1,240 m). Lastly, mixed forests were categorized as M1 (940–1,040 m), M2 (1,040–1,140 m), and M3 (1,140–1,240 m) (Figure 1). Most of the tree species in this area are planted forests, and the tree age is close. Therefore, tree age is not considered as the main variable.
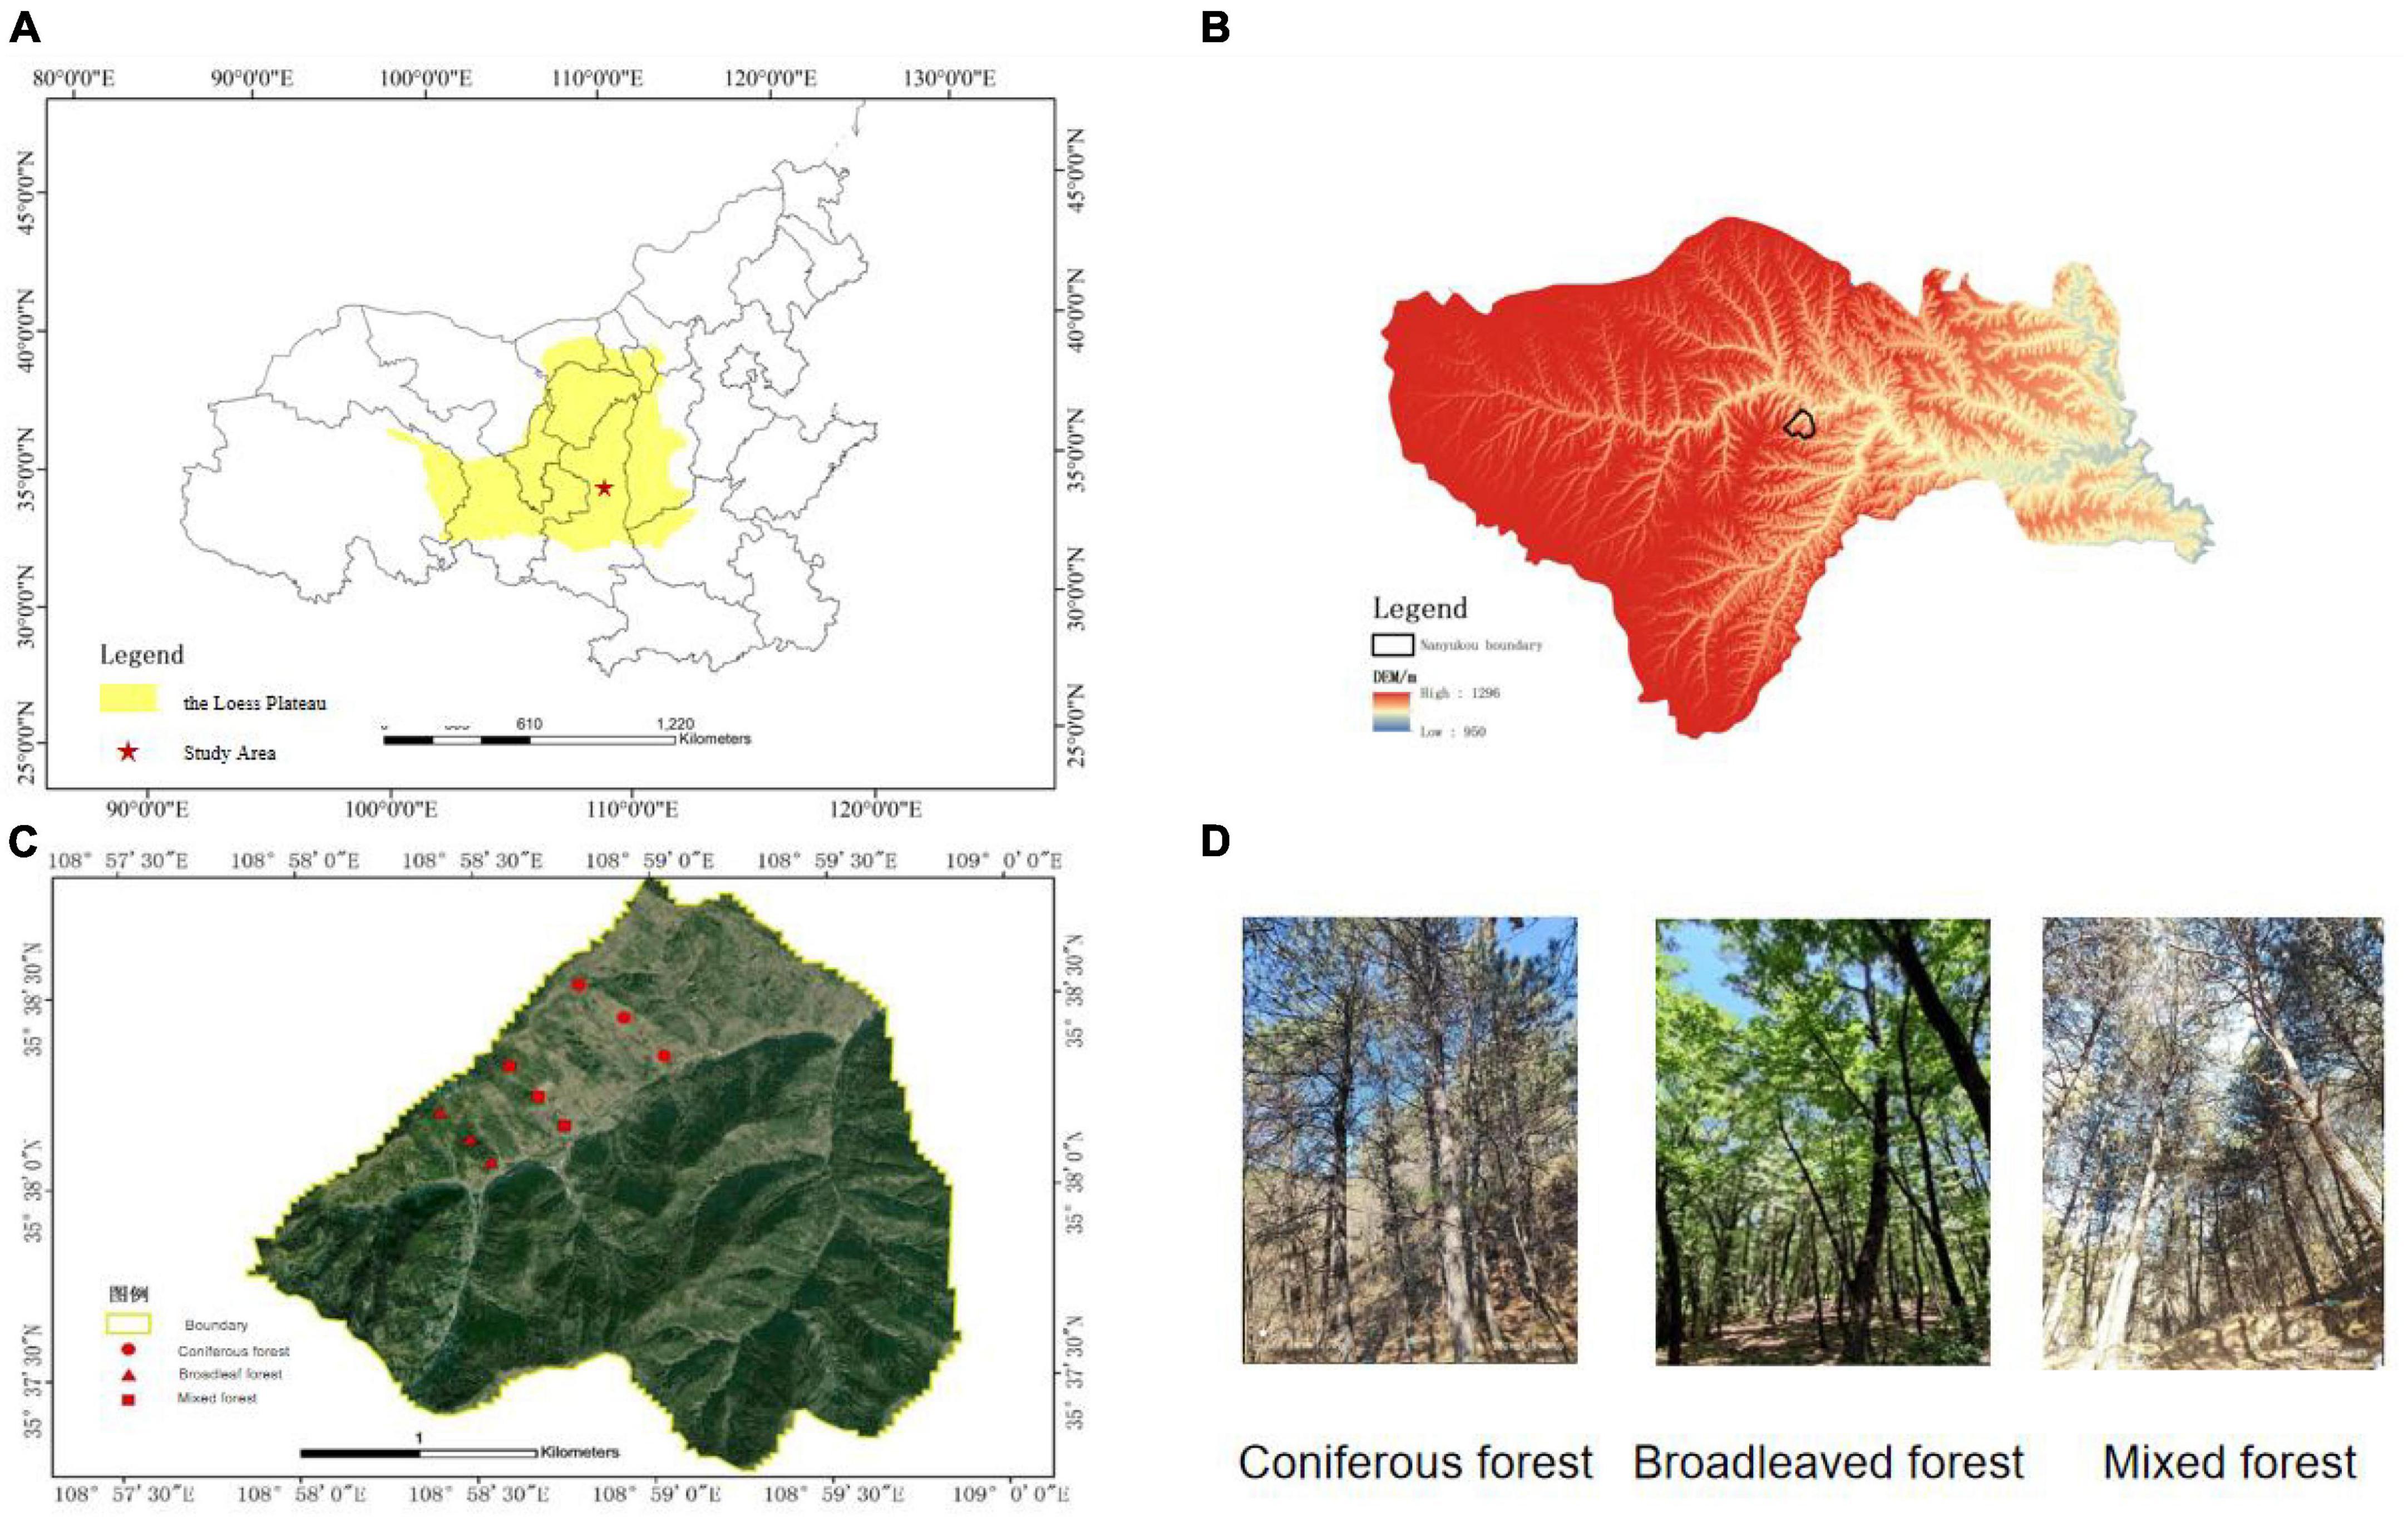
Figure 1. Location of study area and plots. (A) The location of the study area in the Loess Plateau. (B) DEM of study area mountain ranges. (C) Plots location. (D) Photos of plots.
2.2 Forest biomass survey
Trees were marked with diameter at breast height (DBH) ≥ 5 cm in the sample plot and their species names were recorded. Each marked tree was measured using a ruler, the diameter at breast height using a caliper, and the height of the tree was measured using a height gauge SRC-I/30. Three trees with good growth in each sample plot were selected and their ages were measured using a Swedish Haglof growth cone. After on-site investigation, shrubs were observed to be lacking in the planted forest in this area. Therefore, the carbon storage of the shrub species was not considered in this study. The tree biomass was calculated using an allometry equation (Table 1) which is based on the standard prescribed by the State Forestry Administration of China (Li and Bao, 2007; State Forestry Administration, 2017). The allometric equations are as follows (Table 1):
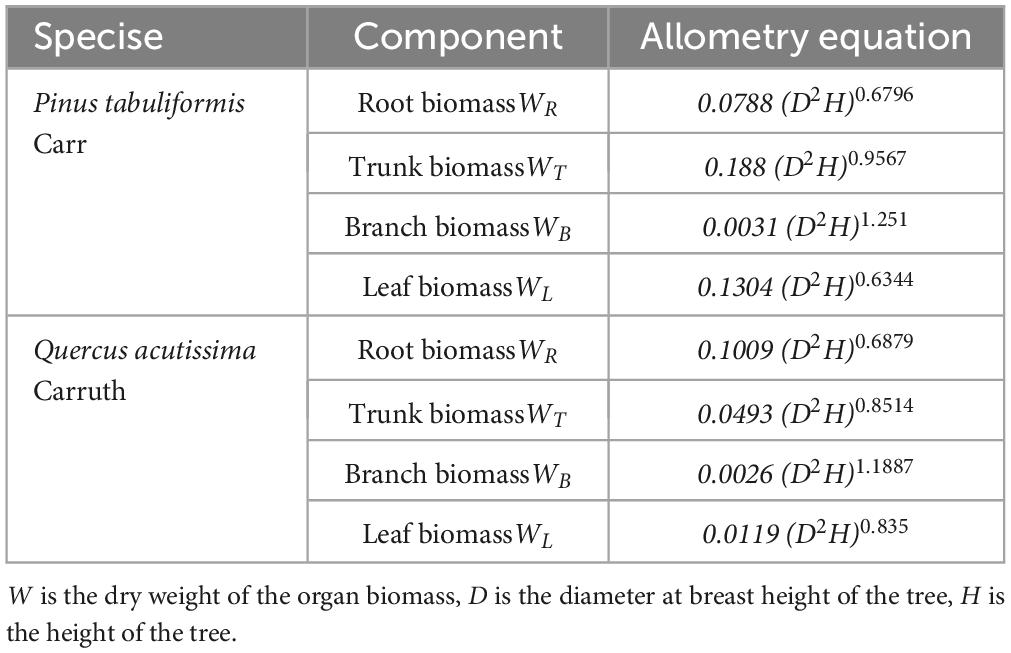
Table 1. Biomass equation.
2.3 Forest plant carbon storage survey
Three trees were selected in each plot, and the tree core was drilled with growth cone for the determination of trunk carbon content. 30 cm branch was clipped from each of the four directions of the tree, and all the leaves were collected. The samples of branches and leaves from the same tree were collected separately for the determination of organ carbon content. The fine roots in 0–20 cm soil under the tree were dug up, and all the fine roots of the same plant were mixed for the determination of root carbon content. The carbon content of plant organs was determined by total organic carbon (TOC) analyzer in laboratory. The formula for calculating plant storage is as follow (Eq. 1):
Where Dt is carbon density of plot trees (t hm−2), Wti is the dry weight of the organ biomass, Cti is the carbon content of the corresponding organ of the corresponding tree species, and AP is the sample plot area (m2).
2.4 Forest litter carbon storage survey
Within each sample plot for vegetation biomass investigation, we randomly divided it into three 1 m plots × collected all litter samples from the surface at a 1 m sampling point and weighed them. Subsequently, approximately 300 g of samples were selected, weighed in the laboratory, air-dried, crushed, and sieved through a 0.25 mm sieve. TOC analyzer was used to determine the carbon content of litter. The formula for calculating litter storage is as follows (Eq. 2):
Where Dl is the carbon storage of the litter in the sample plot (t hm−2), Wl is the standing amount of litter in the sample plot (t), Cli is the average carbon content of the litter in various plots (%), and AP is the sample plot area (m2).
2.5 Forest soil carbon storage survey
Three samples with a length and width of 1 m were selected from each sample plot. In each sample plot, a shovel was used to dig the soil pit to a depth of 1 m. The soil pit was divided into 10 sections with a boundary of 10 cm, ranging from 0 to 10 cm, 10 to 20 cm, up until 90 to 100 cm. Three samples from each layer were taken, mixed the three samples from each layer into one portion, placed in a sealed plastic bag, correctly labeled, and brought them back to the laboratory for further analysis. Individual undisturbed soil samples were collected from each depth using a ring knife (undisturbed), wrapped in plastic film, and were brought back to the laboratory. Subsequently, they were dried to a constant weight in a 48°C oven, and the soil bulk density was calculated as the ratio of dry soil mass to volume. The soil properties were determined by air drying the sample at room temperature, passing the sample through a 0.15 mm sieve, using a TOC analyzer to measure the soil organic carbon content, and an intermittent analyzer to measure the total nitrogen content. The formula for calculating the soil carbon storage is as follows (Eq. 3):
Where Ds is the soil storage (t hm−2), Ci is the organic carbon content of the soil (g kg−1), Pi is the soil bulk density (g cm−3), and Ti is the thickness of the soil layer (cm).
2.6 Determination of stability of forest soil aggregates
After natural air drying, the soil samples mentioned in 2.4 are sieved and weighed through 2, 1, 0.5, and 0.25 mm sieves, respectively, to calculate the average weight diameter (MWD) of the aggregates (Eq. 4).
Where is the average diameter of each soil particle (mm), and Wi is the mass percentage of each soil particle (%).
2.7 Forest soil moisture content survey
The sampled soil was returned to the laboratory, and the wet weight (g) was measured accurately. Subsequently, it was dried in a 48°C oven to constant weight, and measured its dry weight (g). The expression for soil moisture content (%) is as follows (Eq. 5):
Where W is the soil moisture content (%), WW is the soil wet weight (g), and WT is the soil dry weight (g).
2.8 Statistical analysis
Descriptive statistical tools were used to calculate the means and standard deviations of the datasets. Single-factor analysis of variance (ANOVA) and Pearson’s correlation analysis were used to compare the differences and correlations of carbon storage in vegetation, soil, and litter carbon pools among the different stands and altitudes. After square-difference homogeneity testing, the least significant difference (LSD) method was used for significance testing (p < 0.05). Use R 4.2.2 to test the correlation between the carbon storage of vegetation, litter, soil, and environmental factors such as forest type, altitude, stand density, average tree age, and soil moisture content, and to identify the most important factors affecting the carbon storage of each component in planted forests. The redundancy analysis (RDA) module of Canoco5 was used to analyze the explanatory power of the environmental variables on the carbon storage of each component.
3 Results
3.1 Vegetation carbon storage
Forest development indicators, such as vegetation density, diameter class distribution, and biomass, showed significant differences among the different habitats. In the planted forests in this area, the DBH index showed that trees with diameter of 15–20 cm were the most distributed, whereas trees with diameter of 5–10 cm were the least distributed (Figure 2). Between different altitude gradients, trees between 1,040 and 1,140 m had the highest average diameter at DBH, while trees between 940 and 1,040 m had the lowest average diameter at DBH. Significant differences were observed in tree diameter at breast height across different forest types, wherein mixed forests exhibited the largest average diameter at breast height, while broad-leaved forests showed the lowest average diameter at breast height.
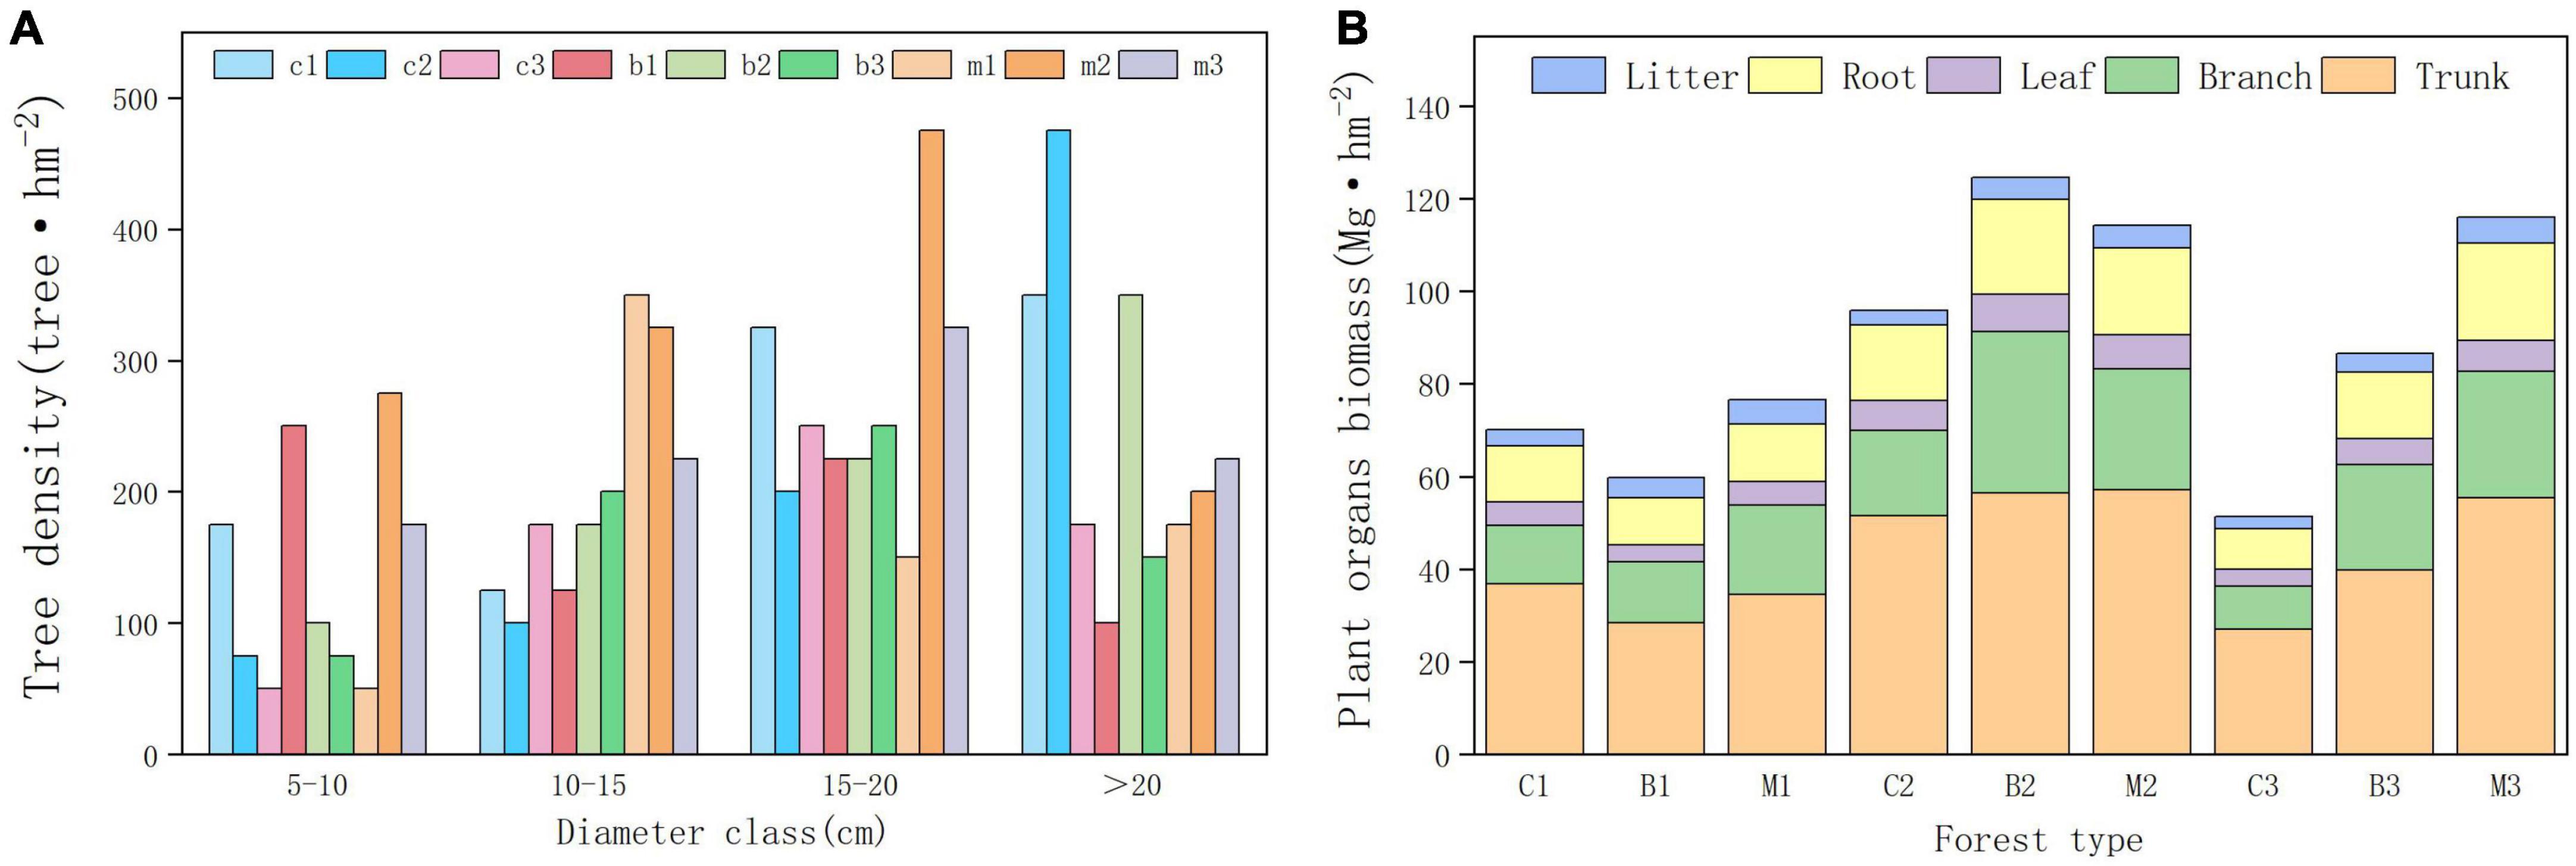
Figure 2. Forest development indicators. (A) Tree density in different diameter class. (B) Tree organs biomass in different plots.
The results of the planted forest biomass survey indicated significant differences in biomass between the plots. The average vegetation carbon storage of the mixed forest was the highest (84.96 Mg hm−2), whereas the coniferous forest was the lowest (56.9 Mg hm−2). The total biomass between 940 and 1,040 m was the lowest, whereas between 1,040 and 1,140 m was the highest. The biomass of coniferous and broad-leaved forests initially increased and decreased with increasing altitude, reaching a maximum at an altitude gradient of 1,040–1,140 m. The biomass of mixed forests increased with altitude, reaching its maximum between 1,140 and 1,240 m. Within the altitude range of 1,140–1,240 m, the density and purity of pure forests decreased and pure forests gradually transformed into mixed forests.
Differences in the distribution of plant carbon storage was also observed in the organs between different regions (Figure 2B). Moreover, the highest proportion of biomass was observed in the trunk, followed by the branch, root, leaf, and litter. Tree trunk biomass, accounts for more than 50% of the total biomass, was the most important component of forest biomass. Among the three forest types, coniferous forests had the highest proportion of trunk biomass, whereas broad-leaved forests had the lowest proportion of trunk biomass. However, they had the smallest proportion of branch biomass than that of the broadleaf forests. The biomass contained in the litter was close to that of the leaves, accounting for 3–7% of the total biomass. Mixed forests had the highest litter biomass and coniferous forests had the lowest.
Vegetation growth is significantly influenced by environmental factors, and differences were observed in the biomass of tree components of different habitats. The results of the correlation analysis between the biomass of the tree components and environmental factors are shown in Table 2. Forest type and density were the main factors affecting the component biomass. The carbon storage of tree branches and litter in the mixed forests was higher than that in the pure forests. As forest density increased, the carbon storage of the roots, trunks, and leaves increased considerably.
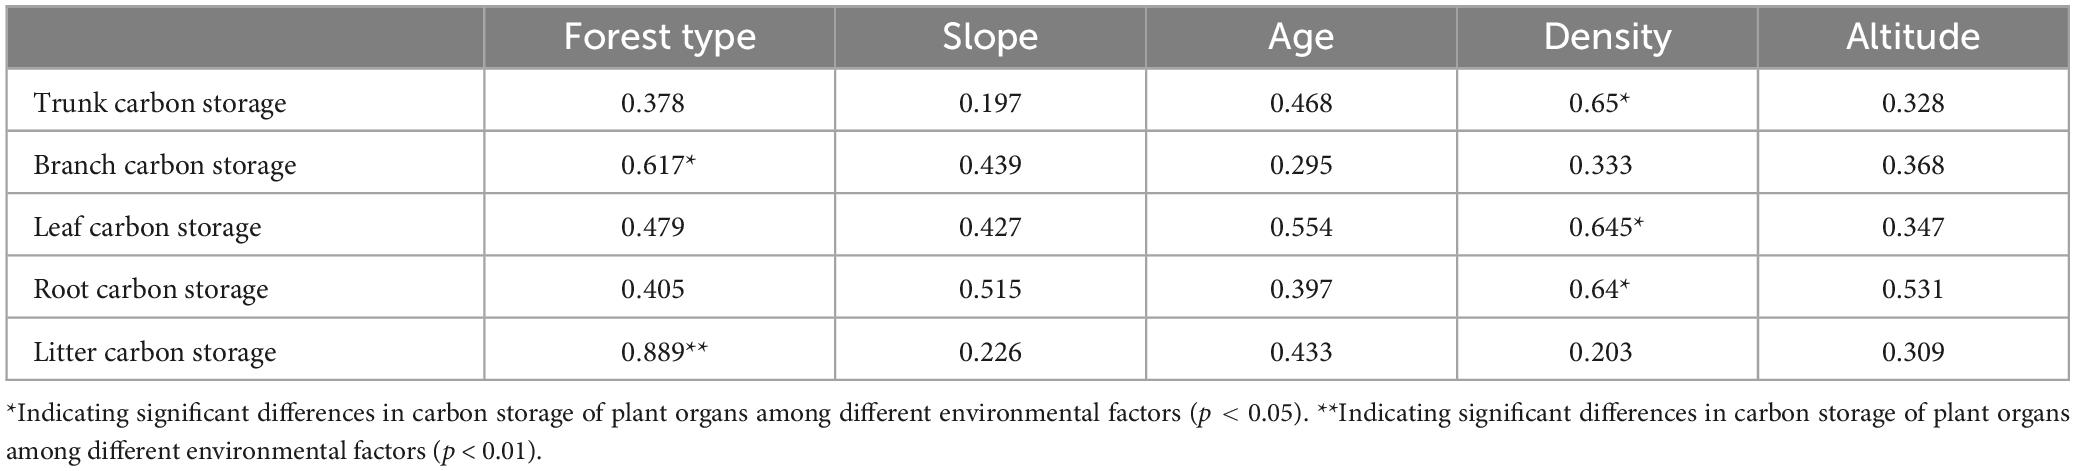
Table 2. Correlation between carbon storage of tree organs and environmental factors.
3.2 Soil carbon storage
Analysis of the soil physicochemical properties at a depth of 1 m above the surface showed significant differences between plots (Table 3). Coniferous forests showed the highest average soil bulk density (1.52 g cm−3), while broad-leaved forests was the lowest (1.42 g cm−3). The soil bulk density of the pure forests decreased with increasing altitude, whereas that of the mixed forests initially decreased and increased with higher altitude. Mixed forests had the highest organic carbon content (5.89 g kg−1), while coniferous forests showed the lowest (5.31 g kg−1). broad-leaved forests had the highest total nitrogen content (1.31 g kg−1), whereas coniferous forests showed the lowest (1.17 g kg−1). The total nitrogen and organic carbon contents of the soil decreased and increased in different forest stands with increasing altitude. The stability of soil aggregates in broad-leaved and mixed forests varied slightly at different altitudes. Coniferous forests had the lowest stability of aggregates (1.87), and significant differences between the different altitude gradients were observed. A significant difference in the soil moisture content among the different altitudes, the soil moisture content of all stand types showed a trend of decreasing and then increasing with rising altitude.
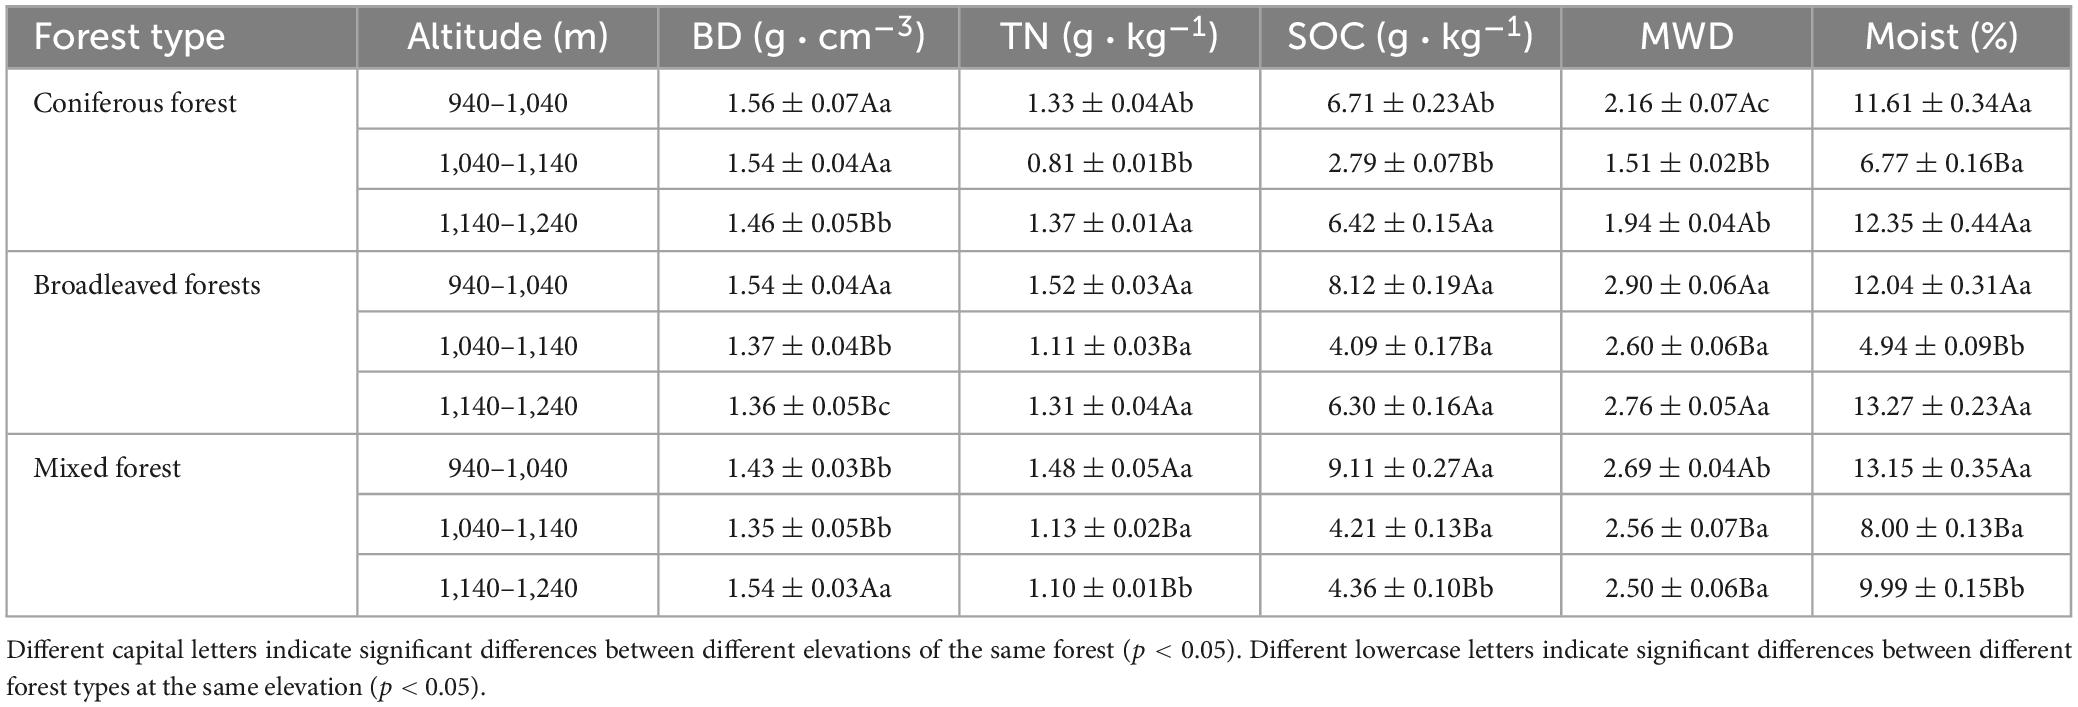
Table 3. Average value in soil properties (0–100cm).
There are also significant differences in enzyme activity in different soils (Figure 3). Four enzymes showed the same distribution characteristics in different forest types. The activity of NAG was the highest and that of glycoside hydrolases (EG) was the lowest. Soil enzyme activity was highest in mixed forest and lowest in coniferous forest.
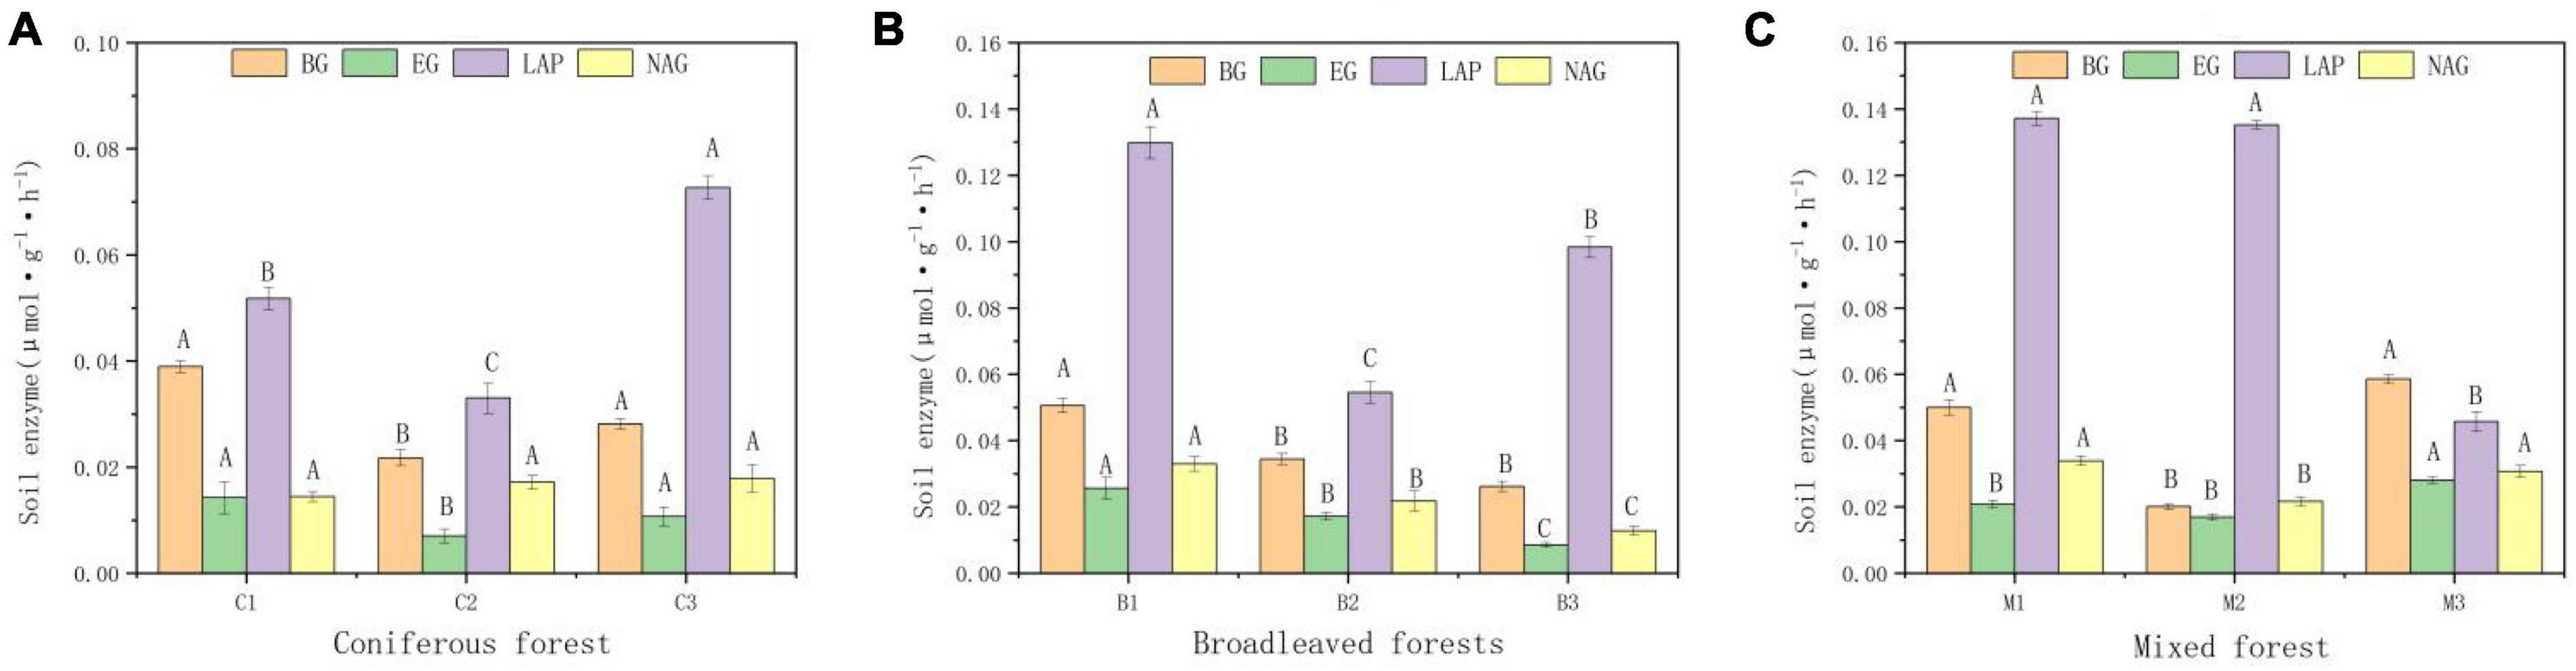
Figure 3. Activities of b-glucosidase (BG), Glycoside hydrolases, (EC), leucine aminopeptidase (LAP), N-acetyl-β-glucosidase (NAG) of soil. (A) Soil enzymes in Coniferous forest. (B) Soil enzymes in Broadleaved forest. (C) Soil enzymes in Mixed forest. Different capital letters indicate that the soil enzyme is significantly different at different elevations (p < 0.05).
Forest type and altitude had significant impacts on soil carbon storage. Within a depth of 0–100 cm, the average soil organic carbon content of coniferous forests was the lowest (76.64 MgC hm−2), while the average organic carbon content of broad-leaved forests was the highest (87.78 MgC hm−2). Organic carbon storage decreased significantly among by depth, with the highest density found in the surface soil. Among all forest types, the organic carbon storage of the surface soil (0–40 cm) accounted for 40–60% of the total organic carbon storage in the 0–100 cm soil layer. Altitude is also an important factor affecting organic carbon storage. The soil organic carbon storage of all forest types initially decreased and increased with altitude (Figure 4). The soil organic carbon storage was the highest between 940 and 1,040 m (110.77 MgC hm−2), and the soil organic carbon storage was the lowest between 1,040 and 1,140 m (58.85 MgC hm−2).
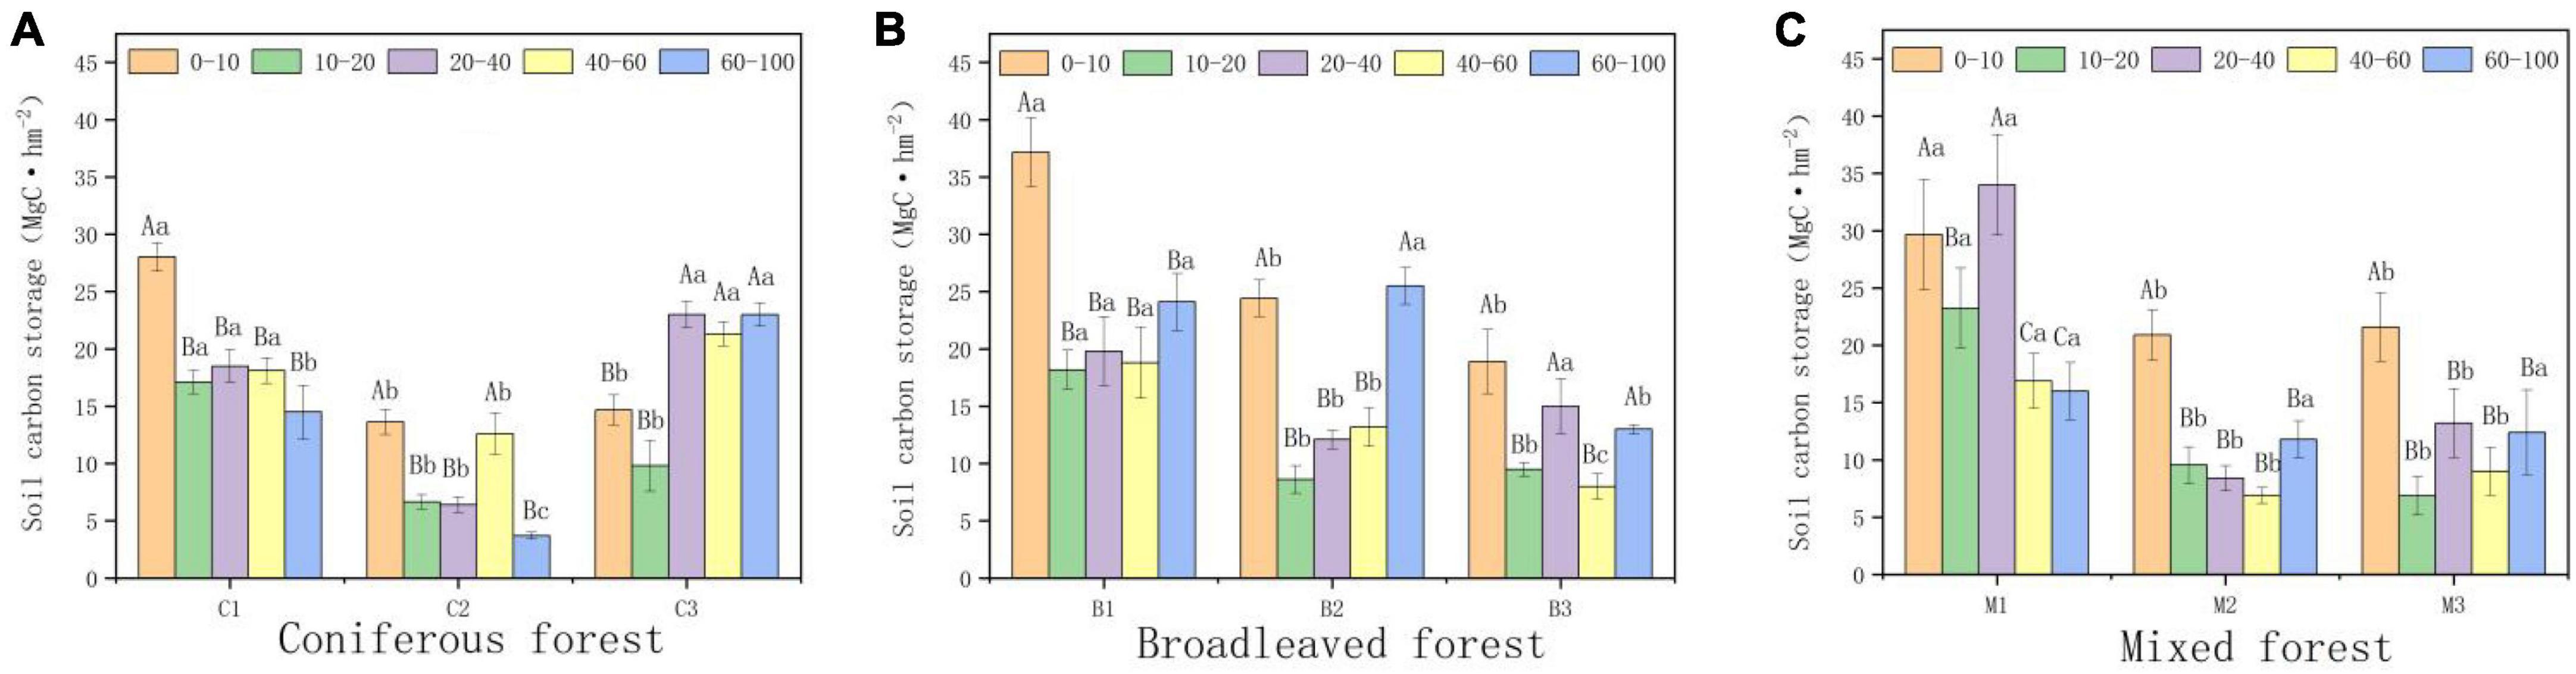
Figure 4. Variations in soil organic carbon (SOC) storage (0–100 cm). (A) SOC in Coniferous forest. (B) SOC in Broadleaved forest. (C) SOC in Mixed forest. Different capital letters indicate significant differences in organic carbon storage between soils at different depths at the same elevations (p < 0.05). Different lowercase letters indicate significant differences in organic carbon storage in the same soil depth at different elevations (p < 0.05).
3.3 Total carbon storage and distribution of carbon storage
The total carbon storage of an ecosystem was calculated by adding all the carbon densities of its main components (vegetation, litter, and soil). Since the subjects of the study were concentrated planted plantations, there was little difference in tree age. Owing to environmental factors, significant differences were observed in total carbon storage among the different habitats (Table 4). The measurement results indicated that the mixed forest had the highest carbon storage (135.87 Mg hm−2), and the carbon storage of the coniferous forest was smaller than that of the other two (113.62 Mg hm−2). The distribution of total carbon storage at altitude showed that the carbon storage was the highest between 940 and 1,040 m, while the carbon storage was the lowest between 1,040 and 1,140 m.
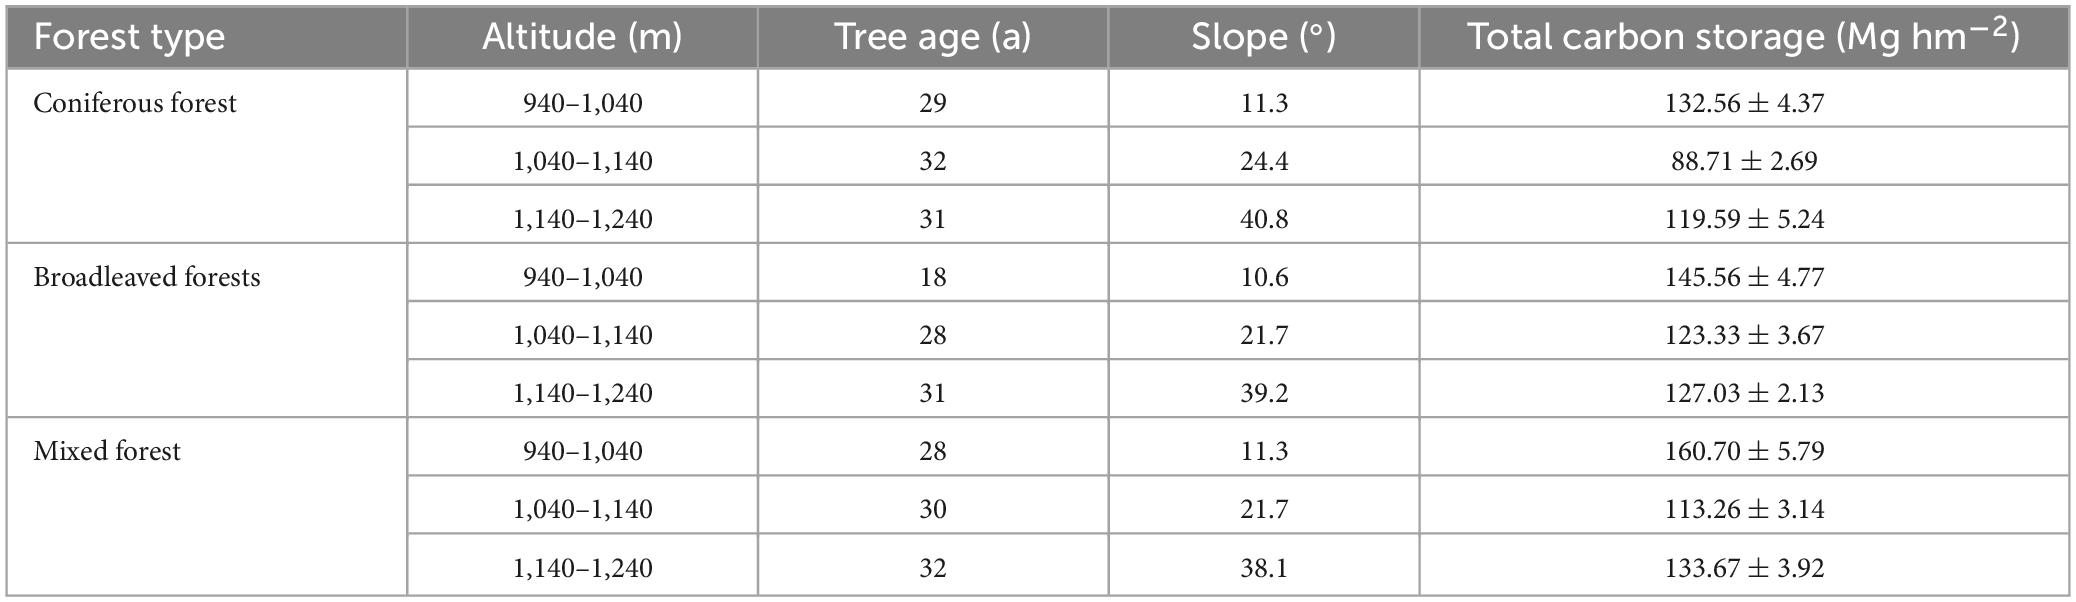
Table 4. Basic situations and total carbon storage in different plots.
The distribution characteristics of the carbon storage above and below the ground are shown in Figure 5. Regarding the carbon pool composition of forest ecosystems, the average soil organic carbon densities in coniferous, broad-leaved, and mixed forests were 76.64, 87.78, and 80.67 Mg hm−2, respectively. The proportion of soil carbon storage in all plots ranges from 55.84 to 83.88%, making it the main storage site for carbon in the planted forests. The soil carbon pool accounts for the largest proportion of the main carbon pools in forest ecosystems, followed by the vegetation carbon storage. The average carbon storage of vegetation in coniferous, broad-leaved forests, and mixed forests were 28.47, 35.81, and 42.48 Mg hm−2, respectively, accounting for 24.92, 27.08, and 30.90% of the total carbon storage. The carbon storage of the soil carbon pool was approximately 2–3 times that of vegetation, and the proportion showed a trend of first decreased and then increased with rising altitude.
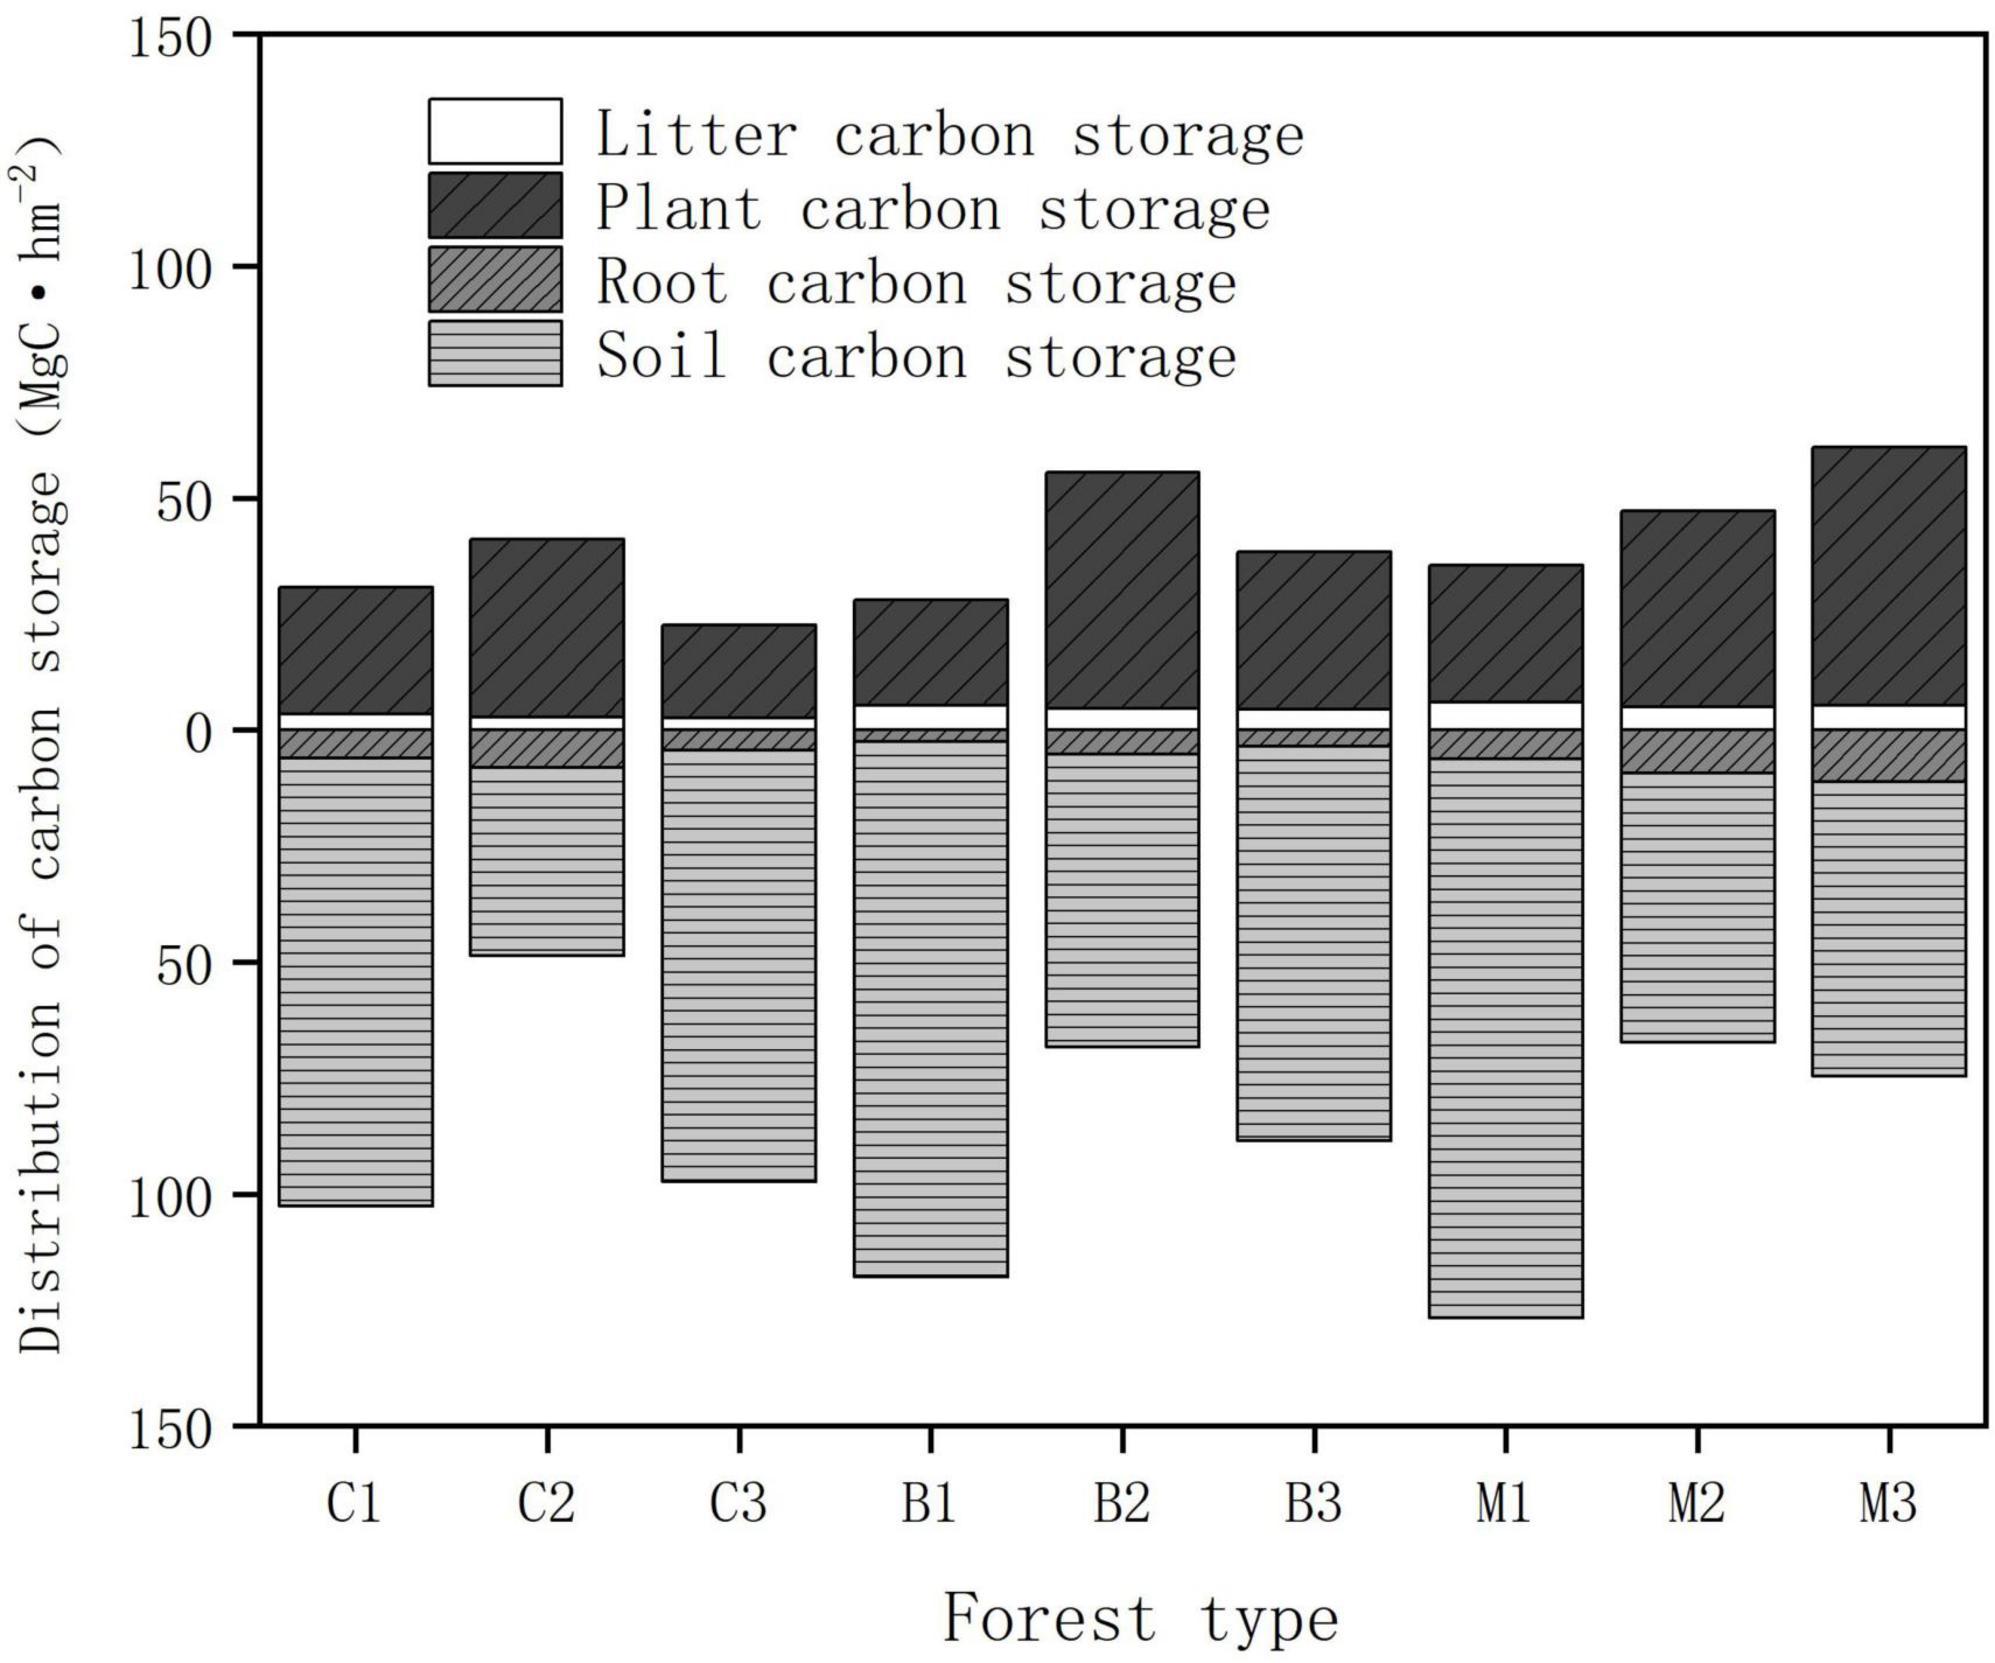
Figure 5. The distribution of forest carbon storage in different components.
3.4 Response of carbon storage to environmental factors
The Mantel test was used to identify the main driving factors affecting carbon storage changes in the Ziwuling forest. The relationship between the ecosystem environmental variables was determined using the Pearson coefficient, and the relationship between the carbon storage of each component in the ecosystem and its environmental variables was calculated using the Mantel test (Figure 6).
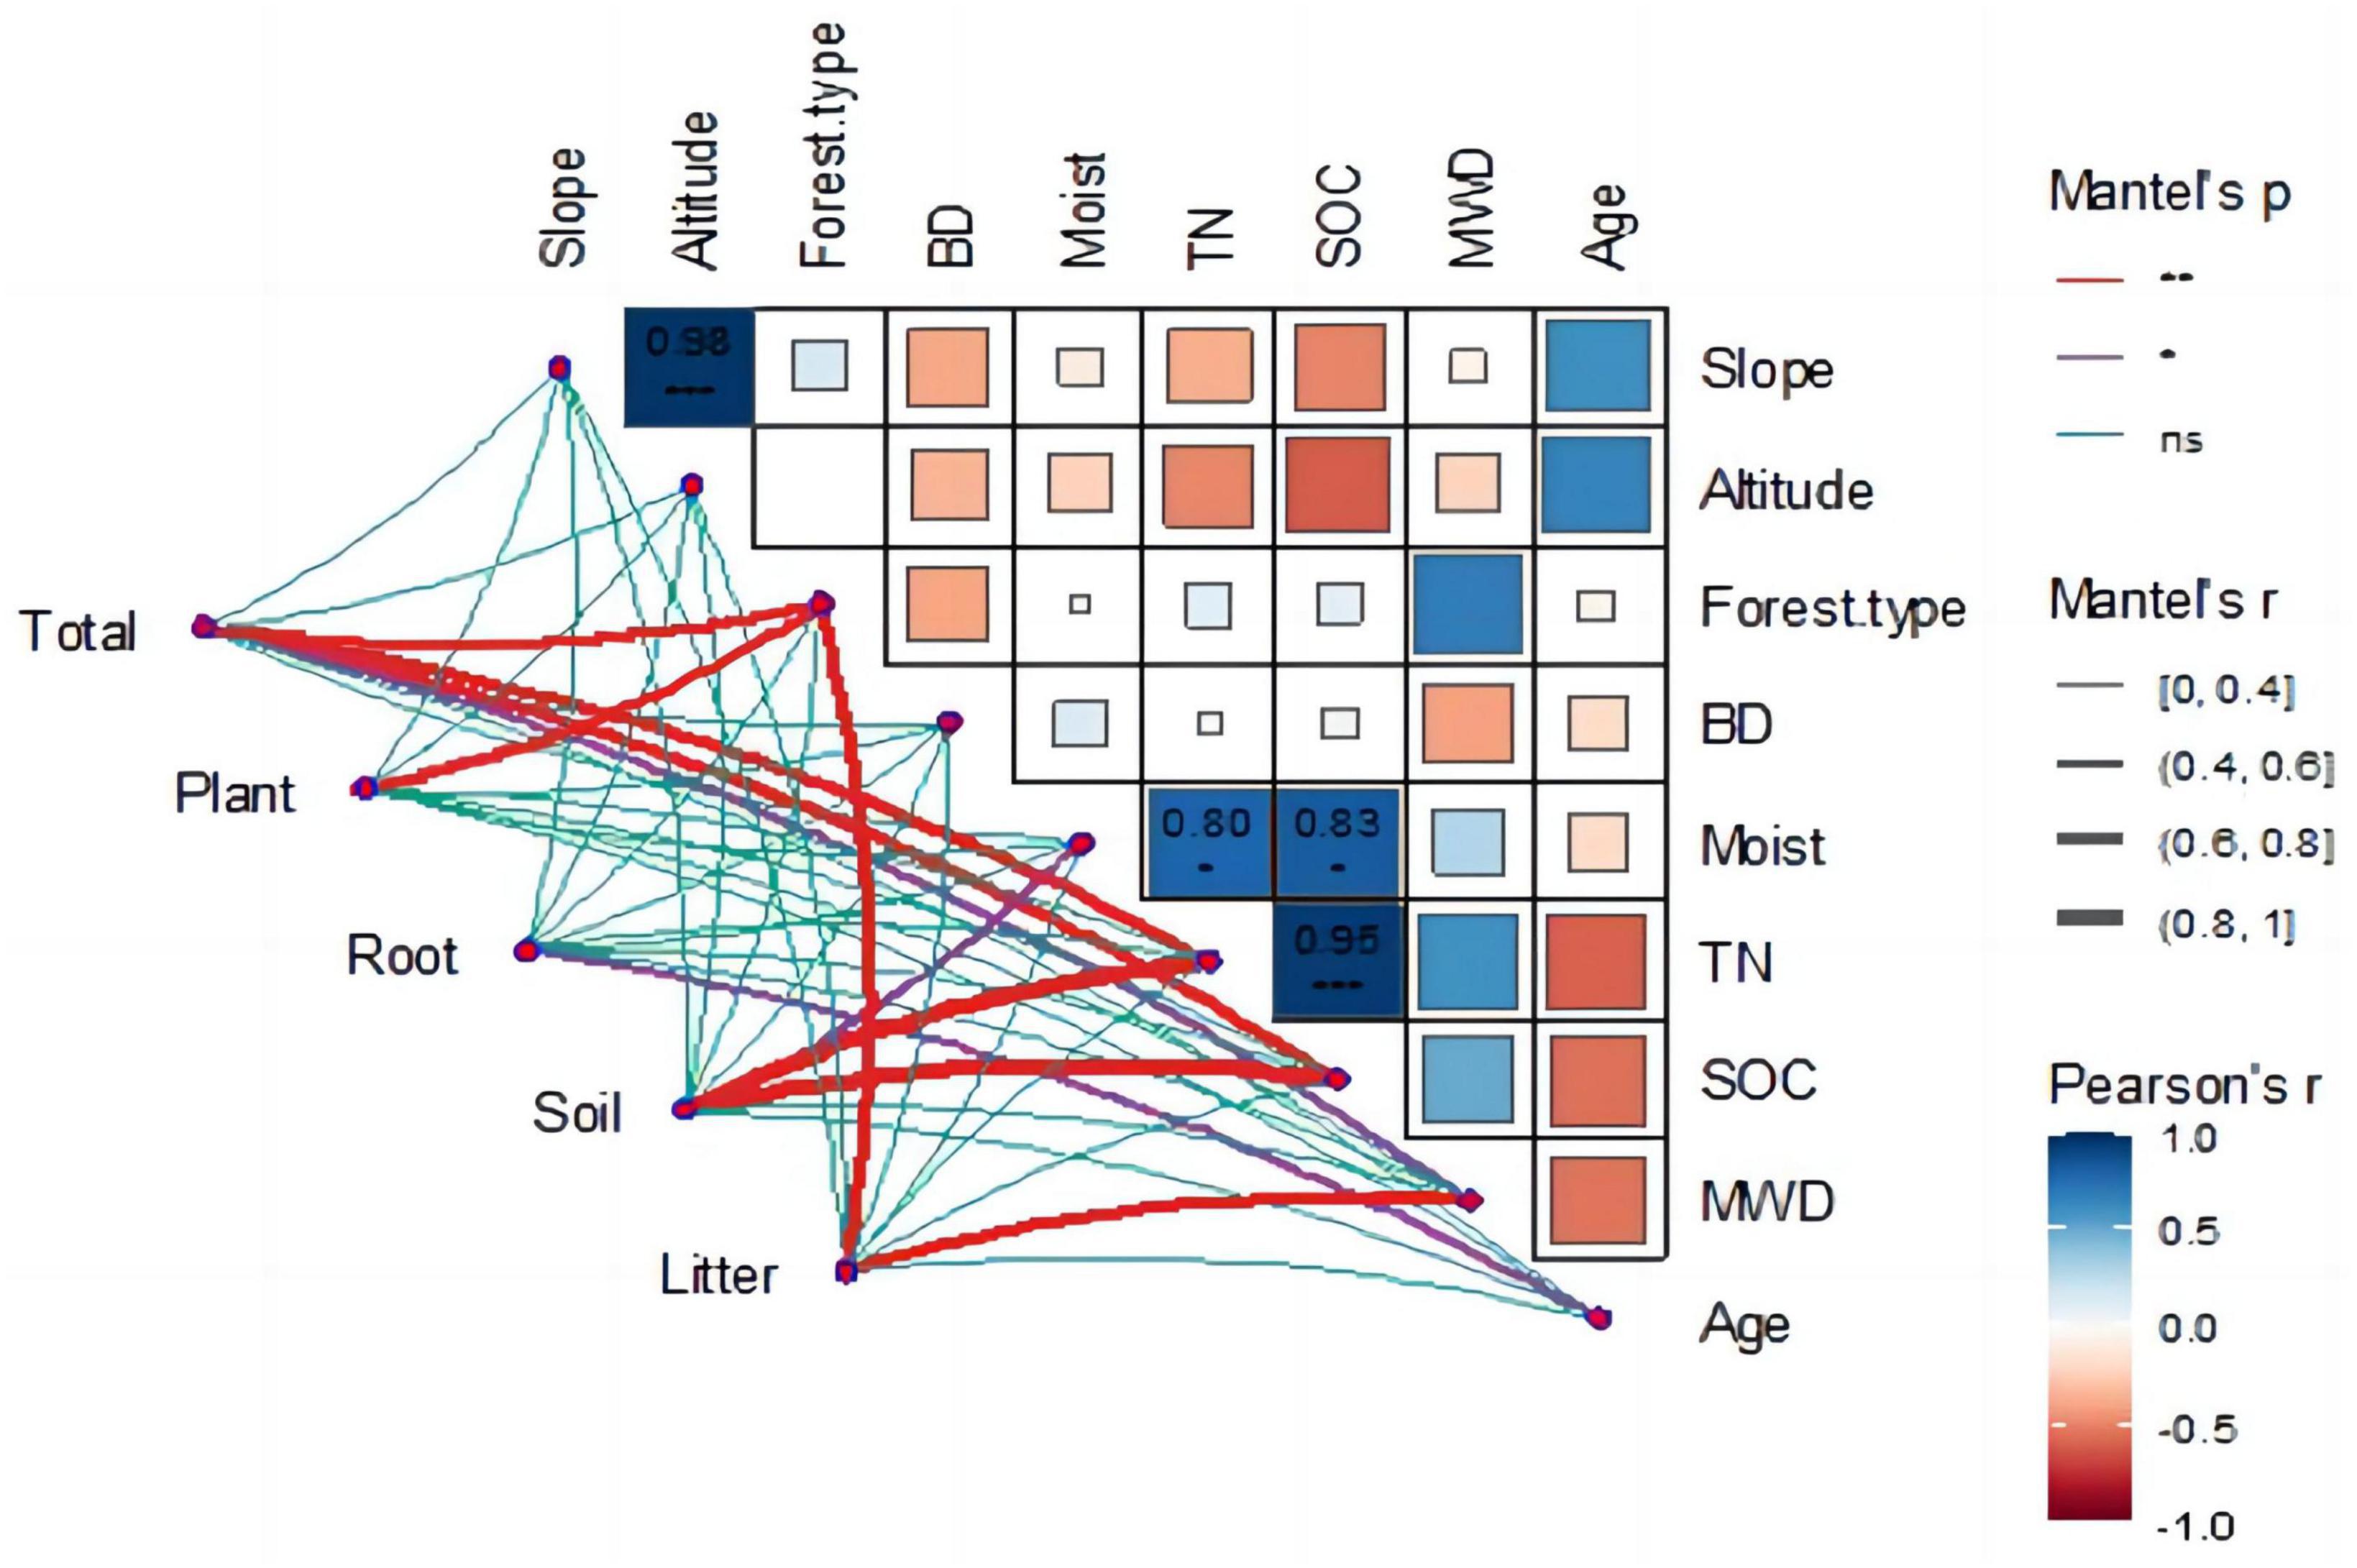
Figure 6. Correlation between carbon storage and environmental variables.
The heat map (Figure 6) shows the correlation between ecological environments. Forest type was the main factor affecting soil aggregate stability (r = 0.69, p < 0.05), with coniferous forests having the worst soil aggregate stability and mixed forests having the strongest. A highly significant positive correlation was found between altitude and slope (r = 0.98, p < 0.01); as altitude increased, the slope became steeper. The environmental factors that affected soil organic carbon included altitude (r = −0.61, p < 0.05), soil moisture content (r = 0.82, p < 0.05), and total nitrogen (r = 0.95, p < 0.01).
The correlation graph also emphasized the correlation between the ecosystem carbon storage and environmental factors. A significant positive correlation was found between total carbon storage and forest type (r = 0.69, p < 0.01), total nitrogen (TN) (r = 0.78, p < 0.01), and SOC (r = 0.68, p < 0.01). The carbon storage of vegetation was mainly influenced by forest type (r = 0.61, p < 0.01) and average tree age (r = 0.68, p < 0.01), with average tree age having the greatest effect on vegetation carbon storage. The main factors influencing soil carbon storage were soil humidity (r = 0.54, p < 0.05), TN (r = 0.91, p < 0.01), and SOC (r = 0.96, p < 0.01). A strong correlation between TN and SOC was observed, which simultaneously affected soil carbon content. The factors influencing the root and litter carbon densities were tree age (r = 0.51, p < 0.05) and forest type (r = 0.64, p < 0.01).
The quadrant where the arrow is located represents a positive and negative correlation between the factor and the sorting axis. The projection length of the environmental factors on the species factors represents the degree of correlation between a certain environmental factor and the carbon storage of each component. The longer the line, the greater the correlation and vice versa. The angle between the arrow and the sorting axis represents the correlation between a certain environmental factor and the sorting axis. The smaller the angle, the higher the correlation and the lower the correlation. Figure 7 shows that the first coordinate axis 1 contributed 60.68%, whereas the second coordinate axis contributed 29.88%. SOC, TN, and forest type had the highest correlation with total carbon storage, and all showed a positive correlation. Tree age was the main factor influencing vegetation carbon storage and soil moisture content. There was a significant positive correlation among SOC, TN, and soil carbon storage.
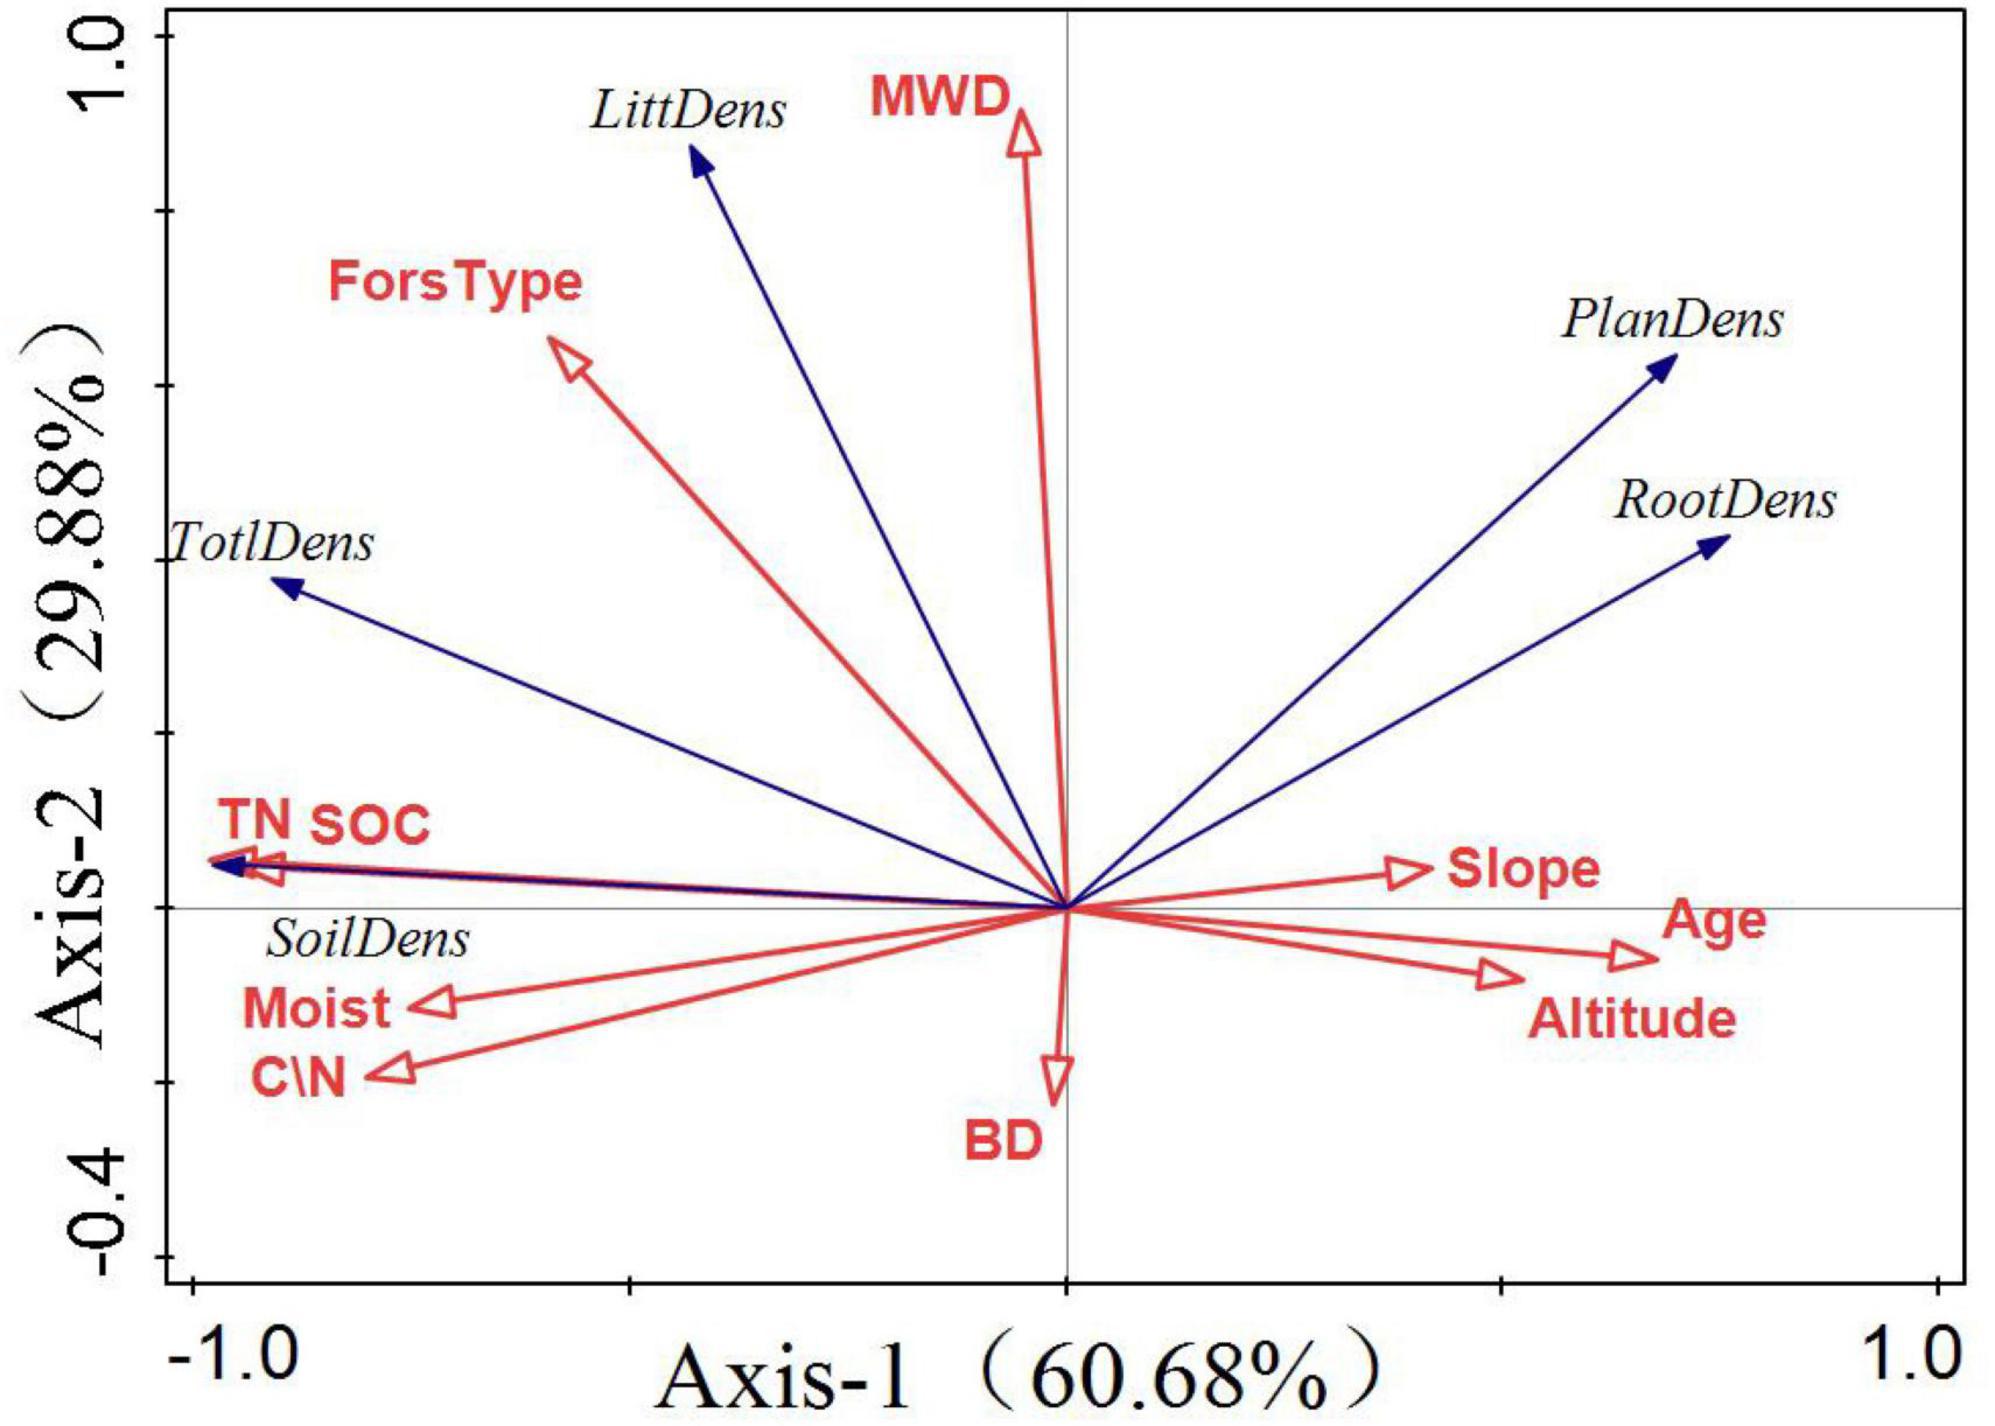
Figure 7. Redundancy analysis (RDA) of factors influencing forest carbon storage. The first principal component as the horizontal axis and the second principal component as the vertical axis. The blue and red arrows represent carbon storage and environmental factors, respectively.
Soil organic carbon and forest type have the highest correlation for forest carbon storage, accounting for 57 and 26.9%, respectively, and play a major role in influencing forest carbon storage.
4 Discussion
4.1 Effect of forest types on carbon storage
Forest type is an important factor that affects forest carbon storage, and tree vegetation is the most important component of forests. Different tree species have different adaptability to habitats, resulting in differences in the cumulative rate of vegetation biomass and feedback processes with soil organic carbon. As a result, the carbon sequestration capacity of different forest types is different.
The research results show that the carbon storage of mixed forests is 20% higher than that of pure forests. This phenomenon can be explained by the differences in tree species and soil.
Boundary survival competition is a theme of plant growth, and resource acquisition ability is a key factor in determining the success or failure of plant survival competition. In the process of adapting to the environment, plants can adjust their phenotypic characteristics to develop in a direction that is conducive to survival and minimize the adverse effects of extreme environments on the survival of species. This response is important for plants to improve their resource-acquisition abilities (Valladares et al., 2006; Kunstler et al., 2016). Therefore, by analyzing changes in the morphological traits of plants in different habitats, understanding the adaptive strategies of plants in response to changes in their living environment is possible, and accordingly create more suitable planted forests (Herr-Turoff and Zedler, 2007; Schiffers et al., 2011).
The diameter at breast and tree height are the main functional traits that reflect the growth status of plants. Plant growth is inhibited under competitive pressure (Roig-Villanova and Martinez-Garcia, 2016). The distribution characteristics of tree DBH and tree height in the study area indicated that the average DBH and tree height of coniferous tree species in the pure forest were higher than those of broad-leaved trees. However, DBH and height of the coniferous trees were lower than those of the broad-leaved trees in the mixed forest. Indicates that coniferous is at a disadvantage in the interspecific competition of broad-leaved.
By comparing and analyzing the biomass of different forest types, the proportion of stem biomass of coniferous trees in this area was larger than that of broad-leaved trees, whereas the proportion of branch and leaf biomass was smaller than that of broad-leaved trees. This can be explained by the optimal allocation theory. This theory suggests that plants can respond to resource competition by regulating the allocation of aboveground and underground biomass, thereby ensuring maximum absorption of restricted resources (Chapin et al., 1987; Wang et al., 2008). Under survival stress, plants allocate more resources to limited resource-absorbing organs (Callaway et al., 2003). The biomass allocation of coniferous tree species indicates that when faced with survival stress, the growth strategy adopted by coniferous tree species is to concentrate nutrients on the trunk while reducing the nutrient supply to the branches and leaves. The reason for adopting this growth strategy was adopted because the allocation of leaf biomass plays a crucial role in the competition between coniferous and broad-leaved species. The larger the specific leaf area, the higher is the efficiency of plants in obtaining light resources (Schöb et al., 2013; Amanullah, 2015). Therefore, when competition intensity increases, broad-leaved trees increase their specific leaf area to improve their ability to obtain light. Biomass investment is optimized to ensure their own survival of coniferous trees, because their specific leaf area is smaller than that of broad-leaved trees; hence, they are at a disadvantage with broad-leaved trees. The redistributed biomass reduces the acquisition of ineffective or weaker growth resources by trees and instead invests more energy and resources to obtain more important resources for survival, such as tree trunks and roots (Zamora et al., 2007). This also explains why the proportion of root biomass in coniferous trees was higher than that in broad-leaved trees. In summary, trees in mixed forests possess morphological indicators that are easier to accumulate biomass than those in pure forests, and thus have more plant carbon storage.
The differences in soil aggregates also explain the variations in vegetation growth among the forest types. The quantity and distribution of soil aggregates are important indicators of soil structure, fertility, and erosion resistance. The stronger the soil stability, the larger the soil pores and surface area, the stronger the water- and fertilizer-holding capacity of the soil. In contrast, the poor the soil stability, the smaller the pore size, the stronger the permeability, and the weaker the drought resistance and fertility (Shengqiang et al., 2021). The stability of soil aggregates showed the following distribution characteristics: broad-leaved forest (2.75) > mixed forest (2.58) > coniferous forest (1.88). On the one hand, the better aggregate stability of mixed forest is due to the high content of carbon and nitrogen enzymes in the soil, which can decompose organic substances and increase the content of cementing substances in the soil, which promote the formation of aggregates by binding with soil particles to form junctions. On the other hand, the increase of litter in mixed forest increased the content of soil organic carbon and nutrients, and these organic substances promoted the activity of soil microorganisms and the formation of soil aggregates. Consequently, based on the difference of soil structure, nutrient content and vegetation growth. The mixed forest is a better tree species structure to increase forest carbon sink.
4.2 Effect of environmental factors on carbon storage
Vegetation and soil carbon pools accounted for the largest proportion of the forest carbon pools and interacted closely with each other. The physical and chemical properties of the soil cause differences in the growth process of different types of vegetation, which in turn affect vegetation biomass. Vegetation increases soil carbon content through the input of aboveground litter, and it provides C to the soil through roots in the form of stubbles and sediment. Simultaneously, microbial products secreted by plant roots can form stable SOC through adsorption of soil minerals (Huang et al., 2011).
The main source of organic carbon in forest soil is litter, and significant differences in the carbon storage of litter under different forest types can also have an impact on soil carbon storage (Huang et al., 2011). The results indicate that coniferous forests have the least litter content, the poorest soil stability, and the least SOC content, which is strong evidence of this conclusion.
The results also showed a negative correlation between the vegetation carbon storage and soil carbon storage. This may be because of the rapid growth period of early vegetation, which requires a large amount of accumulated organic carbon for growth. As the largest source of carbon for early vegetation, soil accumulates more biomass and consumes more corresponding soil carbon. As early vegetation produces less litter and returns less organic carbon to the soil, the soil carbon storage is inversely proportional to the vegetation carbon storage. When vegetation reaches maturity and growth slows, soil carbon storage also increases (Rawat, 2005; Qasba, 2015). Owing to the steep slope and limited growth of vegetation at high altitudes, the morphological maturity of vegetation at high altitudes occurs earlier than that at medium and low altitudes, which is also the reason for the increase in soil carbon storage at high altitudes.
The response of altitude to carbon storage was not significant; however, according to the data, significant differences were observed in carbon storage among the different altitudes. The carbon storage of the soil at low and high altitudes was significantly higher than that at medium altitudes. By analyzing the stability of soil aggregates, the following conclusions can be drawn: the stability of soil aggregates located on the slope of 1,040–1,140 m is the worst, leading to more severe soil erosion and a large amount of soil organic matter loss. Water conditions in the area are also poor, which is not conducive to soil microbial activity or soil organic matter accumulation.
4.3 Suggestions for plantation of planted forests in loess hilly areas
The carbon sequestration rates of different forests vary depending on factors such as forest type, growth status, and soil quality. Existing forest carbon sequestration studies have shown that the average carbon storage of the forest ecosystem of China is about 258.83 MgC hm−2, the average level of forest vegetation is 57.07 MgC hm−2, the average carbon storage of forest soil is about 193.55 MgC hm−2, and the ratio of forest soil carbon storage to vegetation carbon storage is about 2.78 (Yurong et al., 2000). Hence, the loess hilly area has a high carbon sequestration potential, and by creating suitable planted forests, carbon sequestration can be increased significantly.
The research results indicate that planting mixed forests avoids the decrease in photosynthetic efficiency caused by insufficient leaf area in coniferous forests, and also avoids the growth limitation of broad-leaved forests in arid areas due to water limitations. Mixed forests have a higher carbon storage, which improves soil nutrient conditions, and resists pests and diseases to a certain extent. Therefore, the transformation of mixed forests into hilly loess areas has important practical significance.
5 Conclusion
In the loess hilly region, the composition of tree species has a great impact on the carbon sequestration capacity of forests. The carbon storage of coniferous broad-leaved mixed forest increased by 20% compared with pure forest. At the same elevation, the broadleaf forest had the highest soil carbon storage, and the mixed forest had the highest vegetation carbon storage. Mixed forest has the highest soil enzyme activity and the best aggregate stability, so vegetation can grow better in mixed forest. During the process of natural succession, forests at higher altitudes gradually develop into a mixed forest dominated by broadleaf trees, indicating that the mixed forest structure had stronger adaptability to the change of habitat. From the perspective of forest management and carbon sink management. For vegetation restoration in loess hilly region, coniferous and broad-leaved mixed forest dominated by native broad-leaved tree species can play a better ecological benefit in the selection of plantation tree species.
Data availability statement
The raw data supporting the conclusions of this article will be made available by the authors, without undue reservation.
Author contributions
ZS: Writing – original draft. PS: Writing – review & editing. PL: Writing – review & editing. ZL: Writing – review & editing. HN: Writing – review & editing. PZ: Writing – review & editing. MC: Writing – review & editing. YJ: Writing – review & editing.
Funding
The authors declare that financial support was received for the research, authorship, and/or publication of this article. This work was supported by the Natural Science Foundation of China (Grants 42373063 and 42077073).
Conflict of interest
HN was employed by Shaanxi Coalbed Methane Development Co., Ltd. PZ and MC were employed by Shaanxi Ecological Industry Co., Ltd.
The remaining authors declare that the research was conducted in the absence of any commercial or financial relationships that could be construed as a potential conflict of interest.
Publisher’s note
All claims expressed in this article are solely those of the authors and do not necessarily represent those of their affiliated organizations, or those of the publisher, the editors and the reviewers. Any product that may be evaluated in this article, or claim that may be made by its manufacturer, is not guaranteed or endorsed by the publisher.
References
Afreen, T., and Singh, H. (2019). Does change in precipitation magnitude affect the soil respiration response? A study on constructed invaded and uninvaded tropical grassland ecosystem. Ecol. Indic. 102, 84–94. doi: 10.1016/j.ecolind.2019.02.022
Ali, A., Sanaei, A., Li, M., Nalivan, O., Ahmadaali, K., Pour, M., et al. (2020). Impacts of climatic and edaphic factors on the diversity, structure and biomass of species-poor and structurally-complex forests. Sci. Total Environ. 706:135719. doi: 10.1016/j.scitotenv.2019.135719
Amanullah. (2015). Specific leaf area and specific leaf weight in small grain crops wheat, rye, barley, and oats differ at various growth stages and NPK source. J. Plant Nutr. 38, 1694–1708. doi: 10.1080/01904167.2015.1017051
Bennett, C. A., Penman, D. T., Arndt, K. S., Roxburgh, S. H., and Bennett, L. T. (2020). Climate more important than soils for predicting forest biomass at the continental scale. Ecography 43, 1692–1705. doi: 10.1111/ecog.05180
Callaway, R. M., Pennings, S. C., and Richards, C. L. (2003). Phenotypic plasticity and interactions among plants. Ecology 84, 1115–1128. doi: 10.1890/0012-9658(2003)084[1115:PPAIAP]2.0.CO;2
Chapin, F. S., Bloom, A. J., Field, C. B., and Waring, R. (1987). Plant responses to multiple environmental factors. Bioscience 37, 49–57. doi: 10.2307/1310177
Chou, J., Hao, Y., Xu, Y., Zhao, W., Li, Y., and Jin, H. (2023). Forest carbon sequestration potential in china under different SSP-RCP scenarios. Sustainability 15:7275. doi: 10.3390/su15097275
Clark, J. S., and McLachlan, J. S. (2003). Stability of forest biodiversity. Nature 423, 635–638. doi: 10.1038/nature01632
Dai, W., Fu, W., Jiang, P., Zhao, K., Li, Y., and Tao, J. (2018). Spatial pattern of carbon stocks in forest ecosystems of a typical subtropical region of southeastern China. For. Ecol. Manag. 409, 288–297. doi: 10.1016/j.foreco.2017.11.036
Dapao, Y., Xiaoyu, W., You, Y., Zhan, J., Lewis, B., Tian, J., et al. (2014). Estimates of forest biomass carbon storage in Liaoning province of northeast China: A review and assessment. PLoS One 9:e89572. doi: 10.1371/journal.pone.0089572
Ebermeryer, E. (1876). Die gesamte lehre der waldstreu mit rucksicht auf die chemische statik des waldbaues. Berlin: Springer, 116. doi: 10.1007/978-3-642-91491-1
Herr-Turoff, A., and Zedler, J. B. (2007). Does morphological plasticity of the Phalaris arundinacea canopy increase invasiveness? Plant Ecol. 193, 265–277. doi: 10.1007/s11258-007-9264-2
Hu, H., Luo, B., Wei, S., Wei, S., Sun, L., and Luo, S. (2015). Biomass carbon storage and carbon sequestration capacity of seven typical forest types in the Xiaoxing’an Mountains. J. Plant Ecol. 39, 140–158. doi: 10.17521/cjpe.2015.0014
Huang, Y. H., Li, Y. L., Xiao, Y., Wenigmann, K. O., Zhou, G., Zhang, D., et al. (2011). Controls of litter quality on the carbon sink in soils through partitioning the products of decomposing litter in a forest succession series in South China. For. Ecol. Manag. 261, 1170–1177. doi: 10.1016/j.foreco.2010.12.030
Kramer, P. J. (1981). Carbon dioxide concentration, photosynthesis, and dry matter production. Bioscience 1, 29–33. doi: 10.2307/1308175
Kunstler, G., Falster, D., Coomes, D. A., Hui, F., Kooyman, R., Laughlin, D., et al. (2016). Plant functional traits have globally consistent effects on competition. Nature 529, 204–207. doi: 10.1038/nature16476
Li, W., and Bao, W. (2007). Biomass composition and influencing factors of young plantation of Pinus tabulaeformis in Dagou basin, upper reaches of Minjiang River. J. Mountain Sci. 2, 236–244.
Pan, Y., Birdsey, R., Fang, J., Houghton, R., Kauppi, P., Kurz, W., et al. (2011). A large and persistent carbon sink in the world’s forests. Science 333, 988–993. doi: 10.1126/science.1201609
Paquette, A., and Messier, C. (2011). The effect of biodiversity on tree productivity: From temperate to boreal forests. Glob. Ecol. Biogeogr. 20, 170–180. doi: 10.1111/j.1466-8238.2010.00592.x
Peter, B., Yunjian, L., John, B. B., and Jacek, O. (2014). Temperature drives global patterns in forest biomass distribution in leaves stems roots. Proc. Natl. Acad. Sci. U.S.A. 111, 13721–13726. doi: 10.1073/pnas.1216053111
Qasba, S. S. (2015). Effect of altitude and aspect on vegetation structure, carbon storage and soil nutrients in Shankaracharya Forest. Nat. Resourc. Manag. Ecol. Perspect. 5, 585–596. doi: 10.18782/2320-7051.2650
Rawat, R. S. (2005). Studies on interrelationsidp of woody vegetation density and soil characteristics along an altitudinal gradient in a Montane forest of Garhwal Himalayas. Indian For. 131:487.
Reich, P., Hobbie, S., Lee, T., Ellsworth, D., West, J., Tilman, D., et al. (2006). Nitrogen limitation constrains sustainability of ecosystem response to CO2. Nat. Int. Wkly. J. Sci. 440, 922–925. doi: 10.1038/nature04486
Roig-Villanova, I., and Martinez-Garcia, J. F. (2016). Plant responses to vegetation proximity: A whole life avoiding shade. Front. Plant Sci. 7:236. doi: 10.3389/fpls.2016.00236
Schiffers, K., Tielbörger, K., Tietjen, B., and Jeltsch, F. (2011). Root plasticity buffers competition among plants: Theory meets experimental data. Ecology 92, 610–620. doi: 10.1890/10-1086.1
Schöb, C., Armas, C., Guler, M., Prieto, I., and Pugnaire, F. I. (2013). Variability in functional traits mediates plant interactions along stress gradients. J. Ecol. 101, 753–762. doi: 10.1111/1365-2745.12062
Schulze, E.-D., Lloyd, J., Kelliher, F. M., Wirth, C., Rebmann, C., Lühker, B., et al. (1999). Productivity of forests in the Eurosiberian boreal region and their potential to act as a carbon sink – a synthesis. Glob. Change Biol. 6:5. doi: 10.1046/j.1365-2486.1999.00266.x
Shengqiang, W., Yongzhen, H., and Shaoming, Y. (2021). Distribution of organic carbon and nutrients in soil aggregates under different stand types of; Cunninghamia lanceolata; in southern Guangxi of China. Soil Sci. Plant Nutr. 67, 427–438. doi: 10.1080/00380768.2021.1932585
Sobrado, A. M. (1994). Leaf age effects on photosynthetic rate, transpiration rate and nitrogen content in a tropical dry forest. Physiol. Plant. 90, 210–215. doi: 10.1111/j.1399-3054.1994.tb02213.x
State Forestry Administration. (2017). LY/T 2658-2016, biomass model of standing trees and carbon metering parameters: Quercus. Beijing: China Standard Press.
Stegen, J. C., Swenson, N. G., Enquist, B. J., White, E. P., Phillips, O. L., Jørgensen, P. M., et al. (2011). Variation in above-ground forest biomass across broad climatic gradients. Glob. Ecol. Biogeogr. 20, 744–754. doi: 10.1111/j.1466-8238.2010.00645.x
Stegen, J. C., Swenson, N. G., Valencia, R., Enquist, B., and Thompson, J. (2010). Above-ground forest biomass is not consistently related to wood density in tropical forests. Glob. Ecol. Biogeogr. 18, 617–625. doi: 10.1111/j.1466-8238.2009.00471.x
Taylor, P., Cleveland, C., Wieder, W., Sullivan, B., Doughty, C., Dobrowski, S., et al. (2017). Temperature and rainfall interact to control carbon cycling in tropical forests. Ecol. Lett. 20, 779–788. doi: 10.1111/ele.12765
Valladares, F., Sanchez-gomez, D., and Zavala, M. A. (2006). Quantitative estimation of phenotypic plasticity: Bridging the gap between the evolutionary concept and its ecological applications. J. Ecol. 94, 1103–1116. doi: 10.1111/j.1365-2745.2006.01176.x
Wang, D., Geng, Z. C., She, D., He, W., and Hou, L. (2015). Soil organic carbon storage and vertical distribution of carbon and nitrogen across different forest types in the Qinling Mountains. Acta Ecol. Sin. 35, 5421–5429. doi: 10.5846/stxb201311032655
Wang, J., Yu, D., and Wang, Q. (2008). Growth, biomass allocation, and autofragmentation responses to root and shoot competition in Myriophyllum spicatum as a function of sediment nutrient supply. Aquat. Bot. 89, 357–364. doi: 10.1016/j.aquabot.2008.04.001
Wang, X., Yuqing, G., and Xinxiao, Y. (2012). Quercus variabilis forest and community slightly study of soil organic carbon and its components. J. Soil Bull. 3, 604–609.
Yin, G., Verger, A., Filella, I., Descals, A., and Peñuelas, J. (2020). Divergent estimates of forest photosynthetic phenology using structural and physiological vegetation indices. Geophys. Res. Lett. 47:e2020GL089167. doi: 10.1029/2020GL089167
Yurong, Z., Yu, Z., and Zhao, S. (2000). Carbon storage and carbon balance of major forest ecosystems in China. J. Plant Ecol. 5, 518–522.
Keywords: carbon storage, Loess Plateau, forest types, soil carbon storage, vegetable carbon storage
Citation: Song Z, Shi P, Li P, Li Z, Niu H, Zu P, Cao M and Jia Y (2024) Effects of forest type on carbon storage in the hilly region of Loess Plateau, China. Front. For. Glob. Change 7:1349047. doi: 10.3389/ffgc.2024.1349047
Received: 04 December 2023; Accepted: 04 March 2024;
Published: 26 March 2024.
Edited by:
Kaibo Wang, Chinese Academy of Sciences (CAS), ChinaReviewed by:
Xin Zhongbao, Beijing Forestry University, ChinaLei Jiao, Shaanxi Normal University, China
Copyright © 2024 Song, Shi, Li, Li, Niu, Zu, Cao and Jia. This is an open-access article distributed under the terms of the Creative Commons Attribution License (CC BY). The use, distribution or reproduction in other forums is permitted, provided the original author(s) and the copyright owner(s) are credited and that the original publication in this journal is cited, in accordance with accepted academic practice. No use, distribution or reproduction is permitted which does not comply with these terms.
*Correspondence: Peng Shi, shipeng015@163.com