Evapotranspiration and its partitioning during and following a mountain pine beetle infestation of a lodgepole pine stand in the interior of British Columbia, Canada
 Shaorong Hao1,2,3,4
  Xin Jia1,3,4* Hongxian Zhao1,3,4 Xinhao Li1,3,4 Yanmei Mu1,3,4
  Tianshan Zha1,3,4
  Peng Liu1,3,4 Charles P.-A. Bourque2,4*
- 1State Key Laboratory of Efficient Production of Forest Resources, Beijing Forestry University, Beijing, China
- 2Faculty of Forestry and Environmental Management, University of New Brunswick, Fredericton, NB, Canada
- 3Key Laboratory for Soil and Water Conservation, National Forestry and Grassland Administration, Beijing Forestry University, Beijing, China
- 4Yanchi Research Station, School of Soil and Water Conservation, Beijing Forestry University, Beijing, China
Introduction: Massive tree mortality events in western Canada due to widespread infestation by mountain pine beetle (MPB) are expected to impact local-to-regional evapotranspiration (ET) dynamics during and after a disturbance. How ecosystem-level ET and its components may vary with canopy-tree mortality (treefall) and subsequent understory recovery remains unclear.
Methods: We used 10 years of continuous eddy-covariance and remote-sensing data (2007–2016) and machine-learning models based on random forest and xgboost to determine forest- and climate-driven effects at temporal scales appropriate for a lodgepole pine-dominated stand following a major, five-year MPB disturbance initiated in the summer of 2006.
Results: Total annual ET over the 10 years ranged from 207.2 to 384.6 mm, with annual plant transpiration (T) contributing to 57 ± 5.4% (mean ± standard deviation) of annual ET. Annual ET initially declined (2007–2011) and then increased (2011–2016), with ET and T/ET increasing at statistically non-significant rates of approximately 3.2 and 1.2% per year from 2007 to 2016. Air temperature (Ta) and vapor pressure deficit (VPD) were the most important predictors of seasonal variation in ET and T/ET during the 10-year period, with high Ta, VPD, and photosynthetically active radiation (PAR) causing ET and T/ET to increase. Annual ET increased with both increasing spring Ta and decreasing VPD. Annual T/ET was shown to increase with increasing VPD and decrease with increasing volumetric soil water content at a 5-cm depth (VWC5). Enhanced vegetation index (EVI, an indicator of canopy greenness) lagged T and overstory tree mortality, whereas previous- and current-year values of EVI were shown to be poor predictors of annual ET and T/ET.
Discussion and conclusions: These findings suggest that the promotion of climate factors on forest ecosystem-level water vapor fluxes may offset reductions promoted by MPB outbreaks. Climate processes affected water vapor fluxes more than biotic factors, like stand greenness, highlighting the need to include climate-regulatory mechanisms in predictive models of ET dynamics during and subsequent to stand disturbance. Climate and forest-greenness effects on water vapor fluxes need to be explored at even longer time scales, e.g., at decadal scales, to capture long-drawn-out trends associated with stand disturbance and its subsequent recovery.
1 Introduction
Evapotranspiration (ET) rates and transpiration fraction (or T/ET, where T denotes plant transpiration) reflect the water balance of ecosystems and the strength to which carbon- and water-specific processes couple at the ecosystem level (Austin et al., 2004; Sun et al., 2019). Variable T/ET reflects forest-climate feedback of coupled ecosystems (Tong et al., 2019). Water vapor fluxes are frequently affected by stand-replacing disturbances, including those associated with wildfire (Mack et al., 2021), insect outbreak (Bright et al., 2020), strong wind events (Bourque et al., 2020), severe wildfire (Caldwell et al., 2013), and harvesting (Masek et al., 2011) that cause significant divergences in carbon-water relations in forest ecosystems (Brown et al., 2012; Meyer et al., 2017; Knowles et al., 2023). Prior studies have focused on clarifying the dynamics of carbon-water relations in recovering ecosystems, such as ecosystem gross and net primary production and water use efficiency (Meyer et al., 2017, 2018). Few studies have investigated the seasonal to interannual variations in ET and its partitioning associated with abiotic-driven evaporation and transpiration (i.e., E and T) during and subsequent to disturbance. Understanding how forest-ecosystem water vapor fluxes respond to environmental factors at multiple time scales after non-stand-replacing disturbances is crucial to disentangle the mechanisms that control water use strategies in plants and regional cycling of water by recovering forest ecosystems.
Mountain pine beetle (MPB, Dendroctonus ponderosae) is one of the most devastating forest-disturbance agents, other than wildfire, in the province of British Columbia (BC), Canada, where more than 54% of merchantable lodgepole pine (Pinus contorta var. latifolia) has been lost due to a recent MPB infestation (Meyer et al., 2017). The MPB disrupts water and nutrient transport by introducing xylem-blocking, blue-stain fungi (e.g., Ceratocystis dryocoetidis Kendrick & Molnar), affecting tree growth processes almost immediately (within days), with subsequent host-tree mortality resulting over the following months to years (McDowell et al., 2011; Raffa et al., 2015). The needles of infected trees turn red within the first three years after being attacked (Hubbard et al., 2013; Frank et al., 2014), and grey during the following 3–5 years (Wulder et al., 2006). Needles start to fall during the red-color phase within 1–2 years following infestation (Meyer et al., 2018).
Tree mortality due to MPB infestation results in variable and potentially interactive outcomes with respect to variations in water balance (Hubbard et al., 2013; Knowles et al., 2023). As for individual trees, studies have verified that T usually begins to decline within 3–10 days of infestation, and effective water transport to the canopy usually declines by as much as 60% relative to neighboring, healthy trees (Hubbard et al., 2013). However, ecosystem-level variation in ET and its component fluxes often deviate from trends observed at the individual tree-level (Biederman et al., 2014, 2015), due to the presence of both living and dead trees in an insect-disturbed forest ecosystem. Most studies have found that a reduction in summer ecosystem-level ET normally occurred after disturbance based on forest-health assessments employing remote sensing (RS) data (Maness et al., 2012; Vanderhoof and Williams, 2015). It is reasonable to expect that T in the outbreak area should decrease with increased tree mortality (treefall) and loss of functional leaf area (Zhou et al., 2016). However, some studies have reported no net change or in some instances a minor increase in ecosystem-level ET following a major forest-insect disturbance in Colorado, United States (Biederman et al., 2014, 2015). Understory vegetation can contribute more to T following disturbance due to diminished competition for available growing space, sunlight, soil moisture, and nutrients. In addition, increased abiotic E can serve to offset reductions in T associated with the decline in overstory trees (Biederman et al., 2014, 2015). In general, uncertainty remains as to how ecosystem-level water vapor fluxes may change with forest disturbance and subsequent recovery. Understanding the dynamics of ET and T/ET is fundamental to modeling ecohydrological responses of newly disturbed forest ecosystems.
Recent studies have highlighted the importance of climate factors to particular undisturbed ecosystems. For instance, air temperature (Ta) has been noted to have played a significant role in regulating ET in boreal forests by affecting the growing-season length (Zha et al., 2010). Energy inputs usually constrained the variation in ET in high-latitudinal regions of the world (Launiainen, 2010). Atmospheric drought, soil water availability, and precipitation were the principal factors affecting variations in T/ET in shrub-, grass-, and woodlands, where water shortages are more likely to occur (Scott et al., 2021; Hao et al., 2023). Canopy characteristics, i.e., canopy structure and amount of functional leaf area, are also responsible for a share of the observed seasonal and interannual variations in ET and T/ET in undisturbed ecosystems (Zhou et al., 2016; Mu et al., 2022; Hao et al., 2023). However, prior studies of disturbed sites have attributed year-to-year variations in water vapor fluxes to forest-related factors, including canopy greenness (Jin et al., 2017). Research directed to the study of warm pinelands in southern New Jersey, United States, demonstrated the importance of leaf area index (LAI) in regulating the recovery of daily water vapor fluxes from fire and insect disturbance based on two years of data (Clark et al., 2012). The degree to which and how each of these biophysical factors controls ET and its partitioning during forest recovery remains an important question (Knowles et al., 2023). Climatic and biotic factors vary over the course of disturbance and subsequent recovery of forest ecosystems. A significant challenge is to unravel the factors’ relative roles in regulating ET and its component fluxes.
Prior studies at the same lodgepole pine site where the present study was conducted have reported an increase in net ecosystem and gross primary production (NEP and GPP, respectively) following the MPB disturbance (Brown et al., 2012; Meyer et al., 2018). Few studies have described the biophysical controls on water vapor fluxes (ET and its component fluxes, E and T) at the stand/ecosystem-level during and following disturbance. In this study, we used 10 years of continuous measurements of eddy-covariance (EC) and RS data. The analysis of the data was facilitated with data-driven modeling techniques in assessing forest- and weather-driven controls on T/ET at seasonal and interannual time scales for an evergreen needle forest (ENF) stand following disturbance by MPB. The objectives of the study were to explore: (i) the temporal dynamics of ET and T/ET from 2007 to 2016; and (ii) the relative effects of biophysical factors on controlling ET and its component fluxes during stand disturbance and recovery. Two hypotheses were considered in this study, namely that (i) ET and T/ET should initially decrease during early infestation, and progressively increase as the stand undergoes structural change associated with canopy-tree mortality, treefall, and subsequent recovery; and (ii) forest characteristics, including canopy greenness, are important predictors of ET and its components during stand succession.
2 Materials and methods
2.1 Site description
The study was conducted in a lodgepole pine-dominated stand (55°06′42.8″ N, 122°50′28.5″ W; 751 m above mean sea level, asl) in the northern interior of BC, centered at the AmeriFlux Site, CA-LP1. The stand is about 3 km × 3 km, located in the sub-boreal spruce bio-geoclimatic zone, at Kennedy Siding, approximately 35 km southeast of the Town of Mackenzie. This area is characterized by a temperate climate with dry, hot summer (type Csa based on the Köppen-Geiger climate classification), and with a mean annual temperature of 2°C and precipitation of 570 mm. A large-scale MPB attack on the approximately 80-year-old stand caused about 50% of the living canopy trees to be infected by MPB in August 2006, 10% in June 2007, 19% in October 2007, 5% in August 2008, 2% in August 2009, and 2% in August 2010 (Brown et al., 2012). By August 2012, about 86% of the living canopy trees had been infected by MPB (Meyer et al., 2017). No further attack had taken place following the 5-year infestation (Meyer et al., 2018). Within the first five and eight years after the start of the MPB infestation (2006), 7 and 44% of dead trees had fallen to the ground, with an additional 55% after a decade (Meyer et al., 2017). Moreover, photographs taken around the site’s EC-tower revealed that canopy openness increased from 30.8% in 2007 to 43.3% in 2015 (Meyer et al., 2017). The stand in question was never harvested. This site had few non-pine species in the overstory, and the understory consisted of mostly pine seedlings, scattered shrubs, and a ground cover of moss and lichen (Brown et al., 2012). The site was located on flat, coarse-textured, gravelly soils of glacial-fluvial origin. The soil bulk density and coarse fragment content were approximately 1,180 kg m−3 and 34%, respectively. In 2007, at the start of the measurement period, stand density and basal area were approximately 1,235 stems ha−1 and 16.20 ± 3.10 m2 ha−1, including all living and standing dead trees with heights >10 m and diameters at breast height (DBH) > 8.60 cm (Brown et al., 2014). Modeled stand density showed a sharp decline in living trees from 900 to about 150 stems ha−1 from 2006 to 2007, and slight decreases in every consecutive year from 2007 to 2010 (Meyer et al., 2017).
2.2 Flux and hydrometeorological measurements
Carbon dioxide (CO2) and water vapor fluxes between the forest canopy and atmosphere were measured beginning in July 2007, using an open-path infrared gas analyzer (LI-7500 IRGA, LI-COR Inc., Lincoln, Nebraska) placed at the top of a 32-m tall scaffold tower, with a base length of 2.10 m and width of 1.50 m. A 3-dimensional sonic anemometer [CSAT3, Campbell Scientific Inc. (CSI), Logan, Utah] was used to measure the three components of the wind vector. Signals were recorded with a CR1000 datalogger (CSI) with a synchronous-device-for-measurement connection. At the site, EC sensors were mounted at a height of 26 m, which was approximately 8 m above the top of the forest canopy. Following Webb et al. (1980), CO2 and latent heat fluxes (Fc and LE, respectively) were calculated as the product of the dry air density and the covariance of Fc and water vapor mixing ratios measured at 10-Hz.
Flux data quality control procedures included rejection of flux data when a 30-min period had more than 30% of an individual trace with an instrument diagnostic warning flag that indicated a corrupt measurement and setting minimum (300 mol mol−1) and maximum (1,000 mol mol−1) bounds on Fc concentrations as measured by the IRGA (Brown et al., 2012). Fluxes were not rejected based on wind direction since the fetch was >1 km in all directions around the tower. When the wind passed through the tower and sonic anemometer, which seldom happened, there were no appreciable distortions in the wind field. An additional quality control procedure was applied to winter flux data to address the issue of wintertime Fc-uptake commonly observed with the LI-7500 IRGA. Additional details regarding the measurement system and data-processing protocols employed in this study are provided in an article by Brown et al. (2012).
The energy balance closure at the site for the same study period was reported to be 0.81 (Black, 2021). This value fell within the range reported for other FLUXNET sites worldwide, i.e., between 0.53 and 0.99 (Wilson et al., 2002; Li et al., 2005). Partial energy balance closure may be responsible for an underestimation of ET by about 19%. Adjusting ET (or T/ET) for energy balance closure is controversial (Rungee et al., 2019; Mu et al., 2022) and was, thus, not considered here. Also, an imperfect energy balance closure had negligible influence on the temporal patterns observed in either ET or T/ET (Hao et al., 2023).
Hydrometeorological variables measured at the site included: (i) above-canopy upwelling and downwelling shortwave and longwave radiation and photosynthetically active radiation (PAR) at a 30-m height, including below-canopy incident PAR at a 3-m height; (ii) precipitation (PPT) at the canopy height (model 2,501, Sierra Misco, Berkeley, California, United States); (iii) air temperature (Ta), and relative humidity (RH) at a 25-m height (probe consisting of a platinum-resistance temperature sensor and a Vaisala Oyj Humicap 180 capacitive sensor, model HMP45C, CSI); (iv) soil temperature at 5-, 10-, 20-, and 50-cm depths (chromel-constantan, 30-gauge thermocouple wire, Omega Engineering Stamford, Connecticut, United States); (v) soil heat flux at a 5-cm depth; and (vi) volumetric soil water content (VWC) at 5- and 40-cm depths (designated as VWC5 and VWC40; via CS616 sensors, CSI). All hydrometeorological measurements were acquired every second, from which 30-min means were derived.
2.3 Enhanced vegetation index
Enhanced vegetation index (EVI), as an index of plant greenness and forest health, was used to analyze how changes in canopy structure may influence ET and its component fluxes during and after disturbance. Rasters of EVI used in the study were based on Moderate Resolution Imaging Spectroradiometer (MODIS)-acquired images (i.e., MOD13Q1, Level 3 products at 250-m resolution) summarized as 16-day composites. The EVI data were downloaded from https://ladsweb.modaps.eosdis.nasa.gov, and subsequently averaged across a 3 × 3-pixel moving-window (Yuan et al., 2022). According to data-quality flags in MOD09A1 reporting, data eliminated due to cloud or aerosol contamination were subsequently filled with a three-step procedure outlined by Jin et al. (2013). The gap-filled images were then aggregated to generate a chronological sequence of images of monthly and annual EVI from which point time series were generated at the location of the EC-tower.
2.4 Zhou et al.’s uWUE method for ET partitioning
Zhou et al.’s (2016) method is based on the concept of underlying ecosystem water use efficiency (uWUE), defined by GPP × VPD0.5/ET. The potential uWUE (uWUEp) was determined by applying a 95th-quantile regression of GPP × VPD0.5 against T employing half-hourly daytime values. The actual uWUE (uWUEa) was determined as the slope of a linear regression between GPP × VPD0.5 and ET fixed at the origin. The T/ET-ratio was then calculated as uWUEa/uWUEp. The related code can be acquired from https://github.com/jnelson18/ecosystem-transpiration. This code was validated by Zhou et al. (2016) based on several healthy ecosystems, including several additional ENFs, deciduous broadleaved forests, grasslands, and croplands throughout North America.
2.5 Transpiration estimation algorithm
The ‘transpiration estimation algorithm’ (TEA) proposed by Nelson et al. (2018), provides a data-driven modeling technique to facilitate the partitioning of ET into its abiotic and biotic components, i.e., E and T. The approach is commonly used in forest ecological research because of its simplicity, convenience, and improved accuracy (Nelson et al., 2020; Paul-Limoges et al., 2022). The approach initially filters periods in a dataset when E from the soil and canopy surfaces is small, particularly during periods when surfaces are likely to be dry. The approach then trains a machine-learning model, based on the random forest algorithm, using ecosystem water use efficiency (eWUE or the ratio GPP/ET) as the response variable and corresponding eco-hydrometeorological data as drivers of eWUE during the filtered, dry-surface periods. Values of eWUE higher than the 75th percentile of random forest-generated estimates were considered to be dominated by T. The 75th percentile was used here, as it gave the best overall performance when synthetic data from three terrestrial biosphere models were used in a prior assessment of the procedure (Nelson et al., 2018). The trained model was subsequently used to predict plant water use efficiency (i.e., WUEp or GPP/T). Transpiration was finally determined as a ratio of GPP/WUEp. A flow chart describing the transfer of information between the components that make up TEA is provided in Supplementary Figure S1. Related Python script can be obtained by going to https://github.com/jnelson18/ecosystem-transpiration.
In Supplementary Figure S1, CWSI represents a shallow bucket model used to remove data from the high surface moisture period. The bucket itself represents the surface water storage component (i.e., S) for each half-hourly timestep “t” relative to the last precipitation event (St), i.e. Equations 1, 2
where Pt (in mm) is PPT at time t, and Smax the maximum allowable water storage (mm) or bucket size. Here, Smax was set to 5 mm (after Nelson et al., 2018). Conditions were considered sufficiently dry when CWSI < −0.5 (Nelson et al., 2018).
In validating TEA, the underlying water use efficiency (uWUE) at the leaf scale (uWUEi) in non-tropical forests varies marginally, typically between 8.56 and 19.15 g C hPa0.5/kg H2O (Lloyd and Farquhar, 1994; Zhou et al., 2016), giving a mean of 13.86 ± 7.49 g C hPa0.5/kg H2O. From the individual leaf to ecosystem level, VPD is nearly the same, especially in a well-mixed, uniform environment. Carbon (C) assimilation is represented by GPP, which is determined from the net ecosystem exchange (NEE) and respiration (RE) estimated from in-situ EC data (Meyer et al., 2018). Variable uWUEp can be used as a proxy of uWUEi, which can be taken as the potential uWUE at the ecosystem scale. Term uWUEp was calculated as Equation 3
where TTEA is the ecosystem-level transpiration estimated with TEA.
2.6 Data analysis
Half-hourly means of ET were calculated as the quotient of LE and λ, where the latent heat of vaporization (λ) represents the amount of energy required to evaporate a unit mass of water (λ = 2.45 × 10⁻⁶ MJ kg−1), and LE is the latent heat flux (W m−2; Tang et al., 2014). Daily values of ET and T (both in mm) were estimated by summing their half-hourly estimates over a 24-h daily cycle. Daily ET and T were further integrated over time to produce monthly and annual estimates. Here, we defined spring as the period from March to May, summer from June to August, autumn from September to November, winter from December to February (Xie et al., 2016), and the growing season from May to September (Brown et al., 2012).
We estimated the long-term trend of annual variables using the function ‘mkttest’ in the ‘modifiedmk’ R-package. We used regression analysis to verify pairwise relationships of ET and T/ET as primary response variables with the suite of eco-hydrometeorological variables, namely Ta, VPD, PAR, VWC, PPT, and EVI. The extreme gradient boosting (xgboost) option in the ‘caret’ R-package was used to determine the relative importance of each forcing variable on the two response variables, ET and T/ET. Analyses of ET and T/ET dynamics were applied on partial datasets created by randomly selecting 70% of available 16-day records from the entire dataset. The created xgboost models were subsequently evaluated on the remaining 30% of the data. Relative importance of the different forcing variables was gauged in terms of the variables’ respective gain factors calculated during the training of the xgboost-based models (Jin et al., 2023). All data analyses were performed using diagnostic packages optimized for the R-platform v. 4.3.0 (The R Development Core Team) and Anaconda3.
3 Results
3.1 Validation of TEA
In our study, uWUEp ranged from 12.85 to 19.12 g C hPa0.5/kg H2O, which is well within the range of reported values of uWUEi in Zhou et al. (2016). Comparing uWUEp across years, with the midrange in uWUEi noted above (see Section 2.5), the differences ranged from 5 to 27% (Table 1). We compared results derived with the Zhou et al. (2016) method and TEA (Supplementary Figure S2). Both methods exhibited the same overall patterns in T over the study period, with the former values being slightly lower than those generated with TEA.
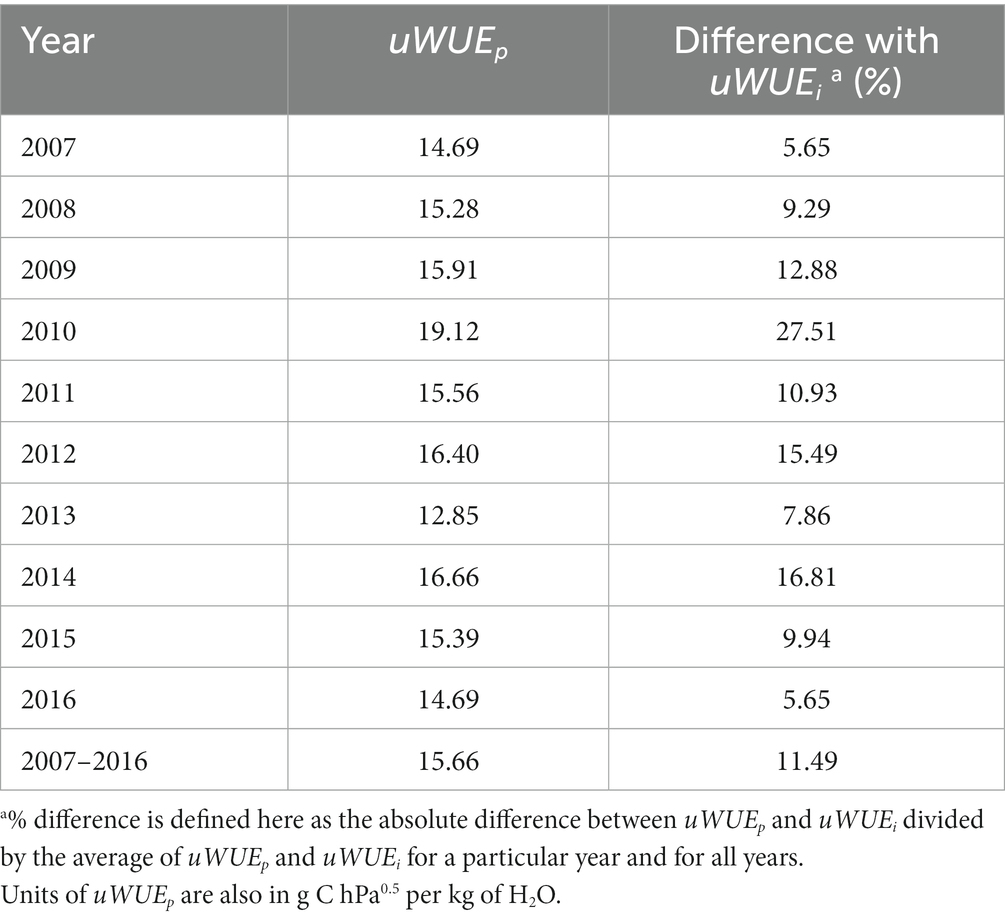
Table 1. Year-specific and across-year comparisons of estimated uWUEp at the ecosystem scale and uWUEi at the leaf scale [i.e., 13.86 g C hPa0.5 per kg of H2O, after the work of Lloyd and Farquhar, 1994].
3.2 Site eco-hydrometeorology and water vapor fluxes
Variables Ta, VPD, PAR, and EVI increased from early spring of each year, reaching their respective maximum during summer, and decreasing soon thereafter (Figures 1A–C,F). Daily mean Ta varied over individual years, being frequently below −10°C in winter, and reaching ~25°C in mid-summer (Figure 1A). The maxima of daily mean daytime VPD varied from 12.51 hPa (DOY 221) in 2011 to 22.87 hPa in 2014 (DOY 194) (Figure 1C). Daily mean PAR reached a maximum in summer (~350 W m−2) and a minimum in winter (typically <5 W m−2; Figure 1C). Daily mean VWC5 and VWC40 fluctuated with PPT, ranging from 1.90 to 17.14% and 2.70 to 12.20%, respectively (Figure 1D). Daily PPT showed clear seasonal pattern and varied from 0 to 1.16 mm day−1 (Figure 1E). Monthly mean EVI peaked in either June or July and was low most of the time in winter (Figure 1F). Daily values of ET and T were near zero in winter, with both variables reaching their respective maxima during the mid-growing seasons. Peak values of ET and T varied from 2.25 to 3.17 mm day−1 in 2009 and 2016, respectively, and 1.34–2.73 in 2008 and 2015 (Figure 2A). Daily T/ET was closed to 1.0 in summer and zero in winter (Figure 2B).
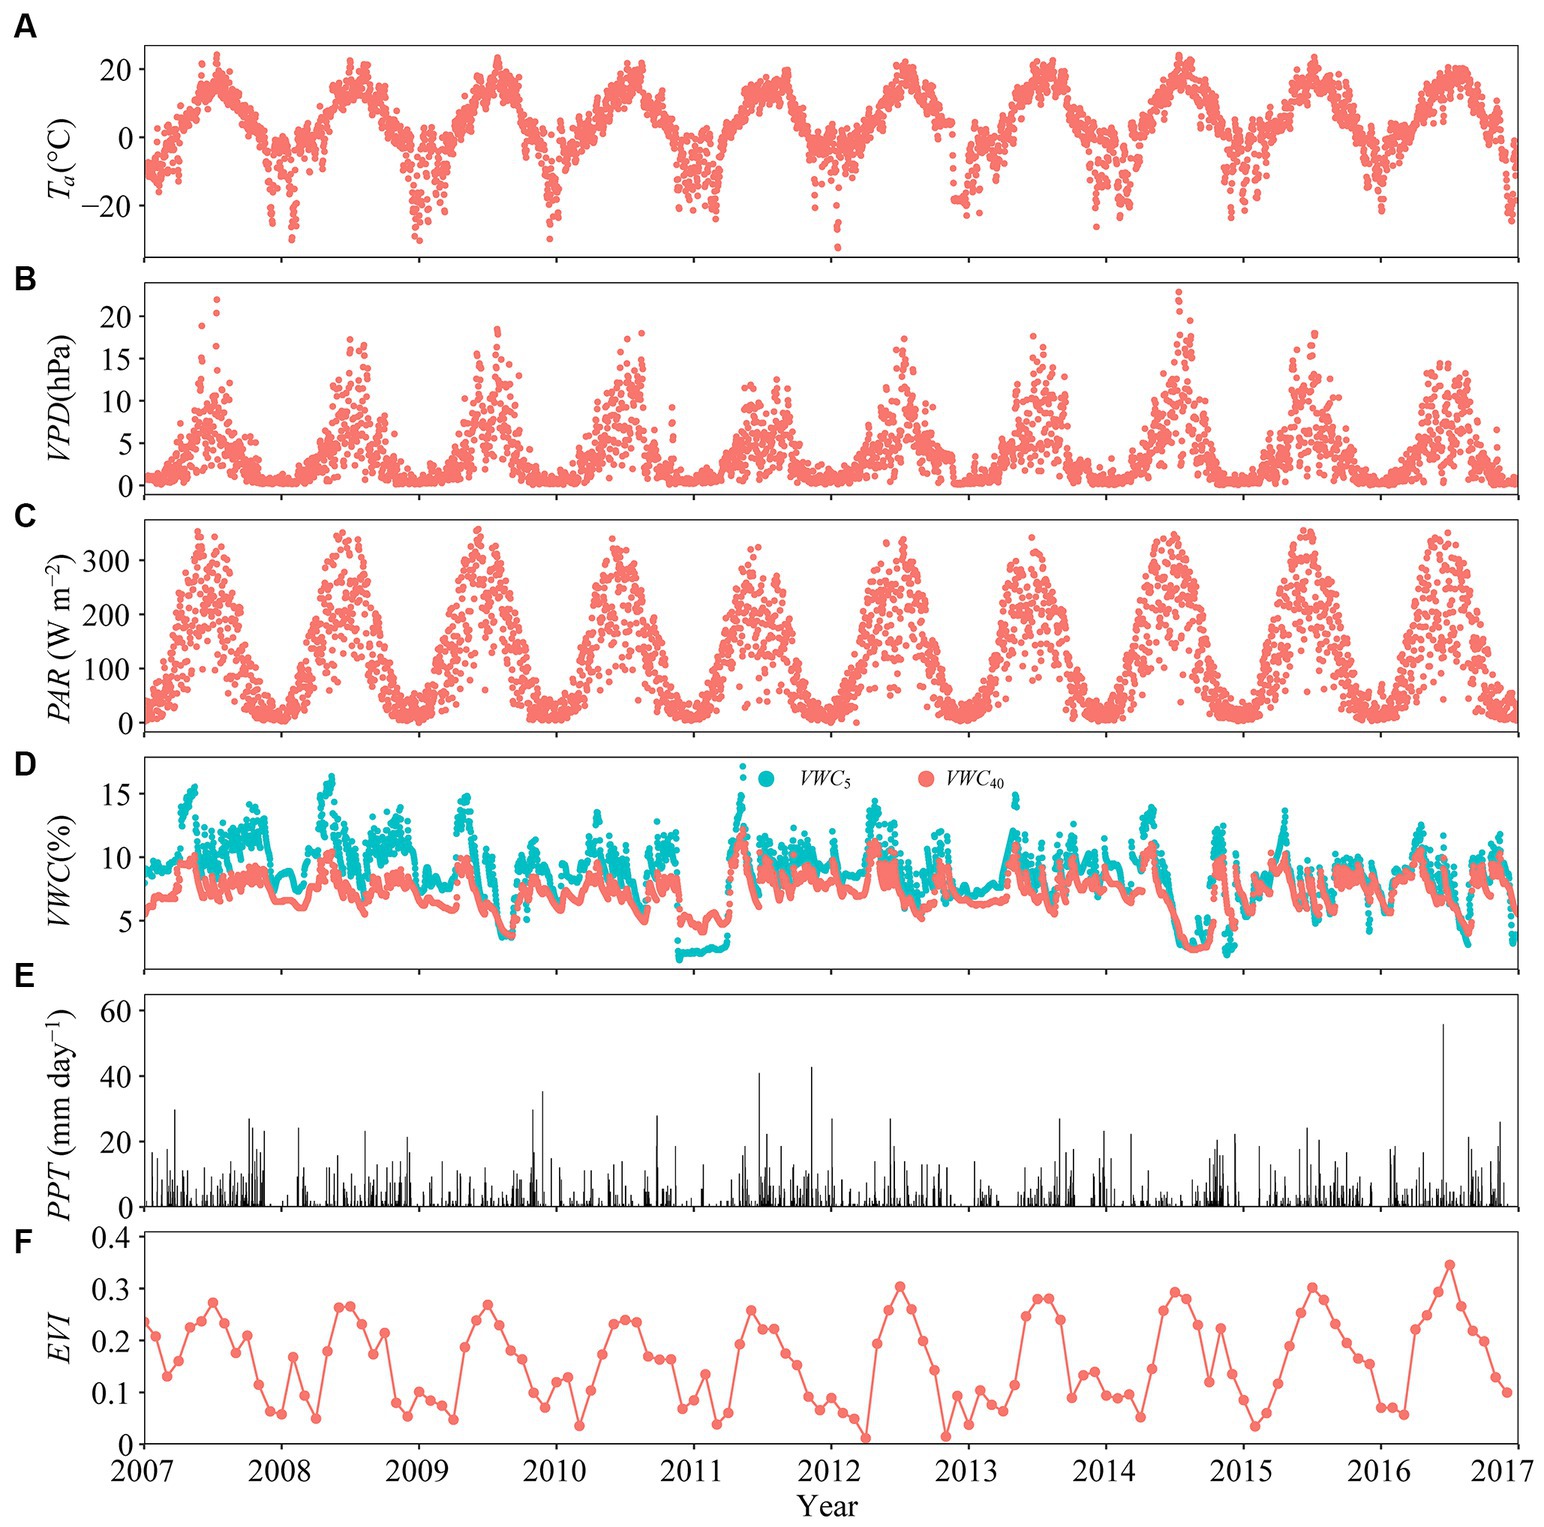
Figure 1. Temporal variation in daily mean (A) air temperature (Ta, °C), (B) daytime vapor pressure deficit (VPD, hPa), (C) photosynthetically active radiation (PAR, W m−2), (D) volumetric soil water content at 5- and 40-cm depths (i.e., VWC5 and VWC40, respectively, in %), (E) total precipitation (PPT, mm day−1), and (F) enhanced vegetation index (EVI). Daytime was defined whenever shortwave irradiance was greater than 100 W m−2.
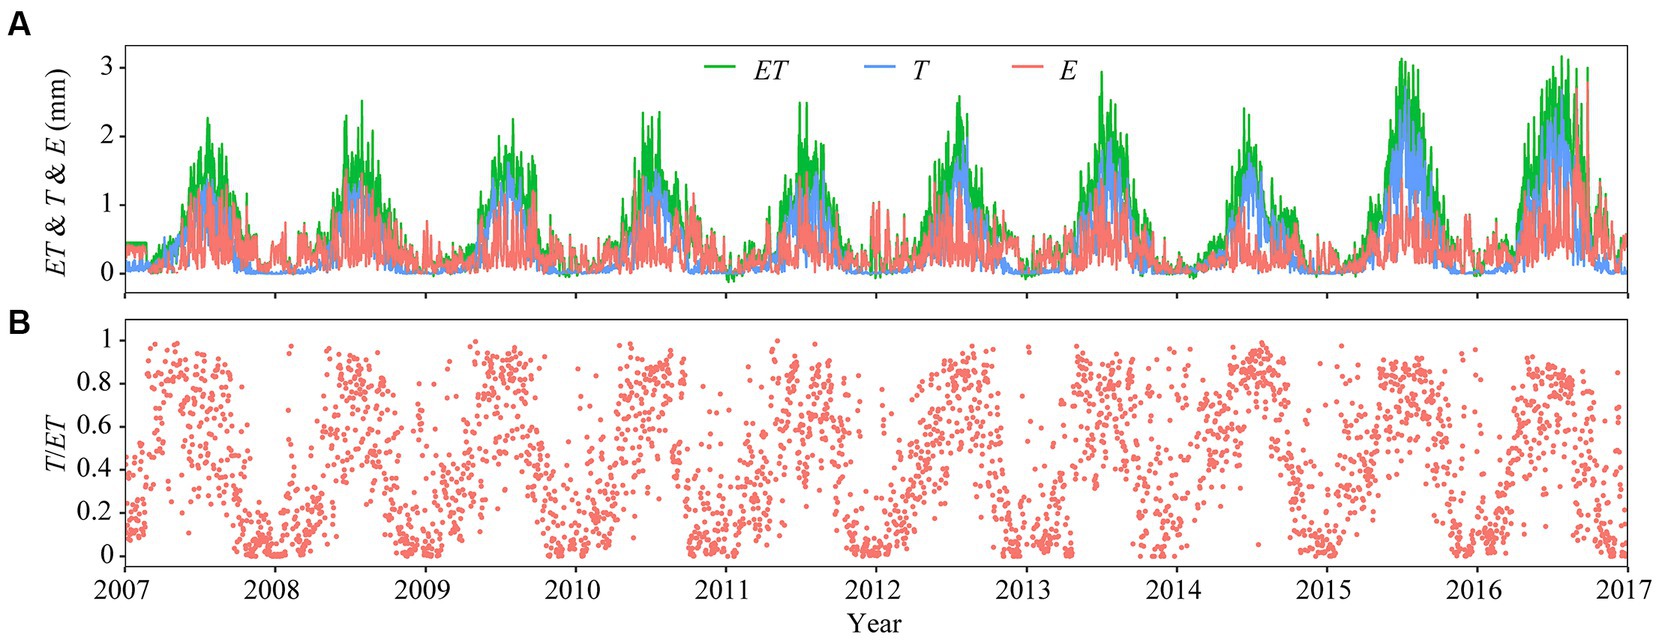
Figure 2. Temporal variation in (A) daily total evapotranspiration (ET, mm day−1), transpiration (T, mm day−1), and abiotic evaporation (E, mm day−1), and (B) daily mean transpiration fraction (or T/ET).
Interannual variations in Ta, VPD, PAR, VWC5, VWC40, PPT, and EVI for 2007–2016 are displayed in Figure 3, yielding coefficients of variation (CV) of 25.78, 8.63, 5.23, 12.03, 6.12, 18.85, and 10.60%, respectively. Annual mean Ta exhibited a clear increasing trend over the 10 years (Figure 3A), whereas the volumetric soil water content at a 5-cm depth (i.e., VWC5) showed a pronounced decreasing trend. No significant trend was noted in annual VWC40 (Figure 3D). Variables VPD and PAR slightly increased during the 10 years, but at statistically non-significant rates (Sen’s slope of 0.071 and 0.45 for VPD and PAR, respectively, with p-values >0.05; Figures 3B,C). Annual PPT varied from 412.92 mm in 2010 to 724.47 mm in 2007, with a mean value of 532.00 mm year−1 (Figure 3E). Variations in annual EVI suggest two stages, with the first stage (designated as Stage I, from 2007 to 2011) exhibiting a gradually decreasing trend, and then a gradually increasing trend with the onset of Stage II in 2011 (Figure 3F).
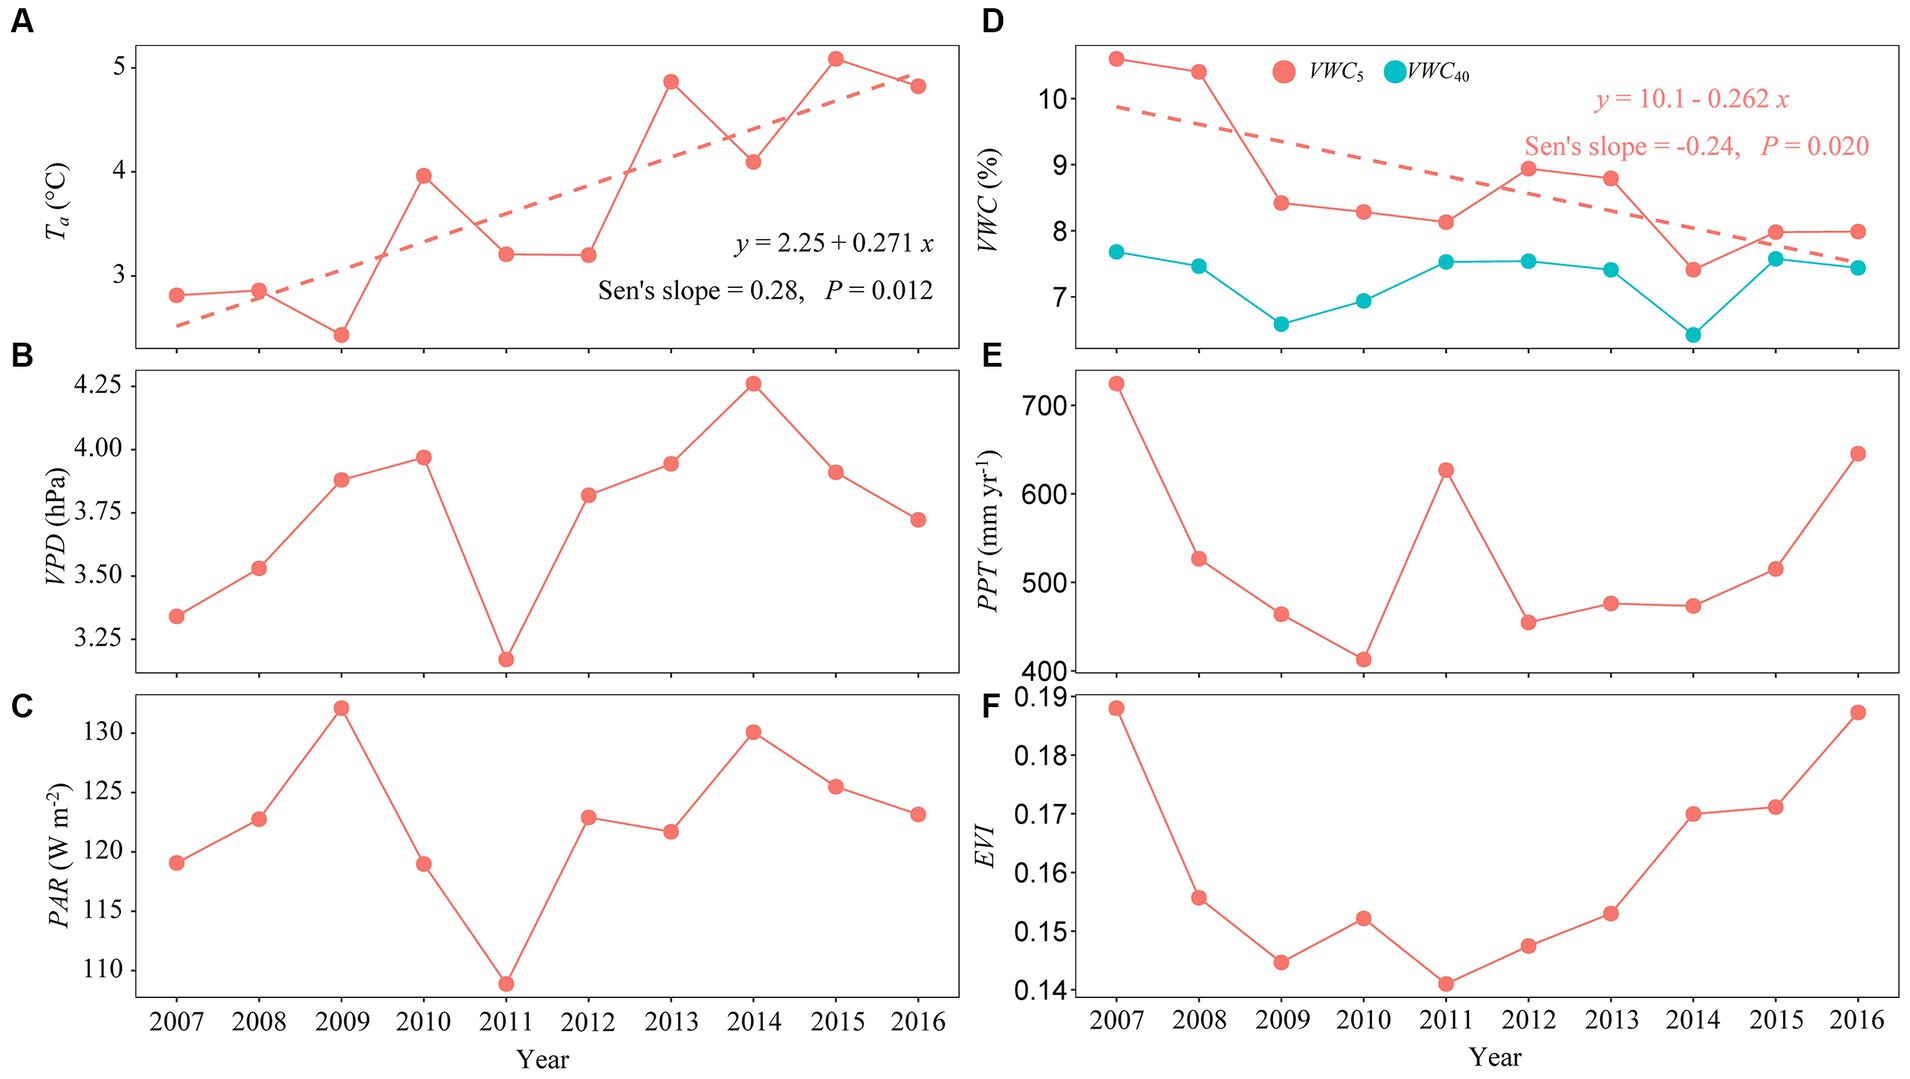
Figure 3. Interannual variation in annual mean (A) air temperature (Ta, °C), (B) vapor pressure deficit (VPD, hPa), (C) photosynthetically active radiation (PAR, W m−2), (D) volumetric soil water content at 5- and 40-cm depths (i.e., VWC5 and VWC40, %), (E) total precipitation (PPT, mm year−1), and (F) enhanced vegetation index (EVI) from 2007 to 2016.
Annual ET, T, and E fell by 9.41, 1.62, and 17.92% during Stage I and increased by 79.08, 72.55, and 90.77% during Stage II, ranging from 207.18 to 384.57, 117.49 to 208.19, 68.92 to 183.20 mm (Figure 4A). Annual T/ET increased by 8.59% during Stage I and decreased by 3.65% during Stage II (Figure 4B). The T/ET-ratio was shown to increase during the first eight years, suddenly decreasing from 2015 to 2016 (Figure 4B). Annual T/ET ranged from 0.50 to 0.68, producing a 10-year mean of 57 ± 5.42%, and CV of 9.58% (Figure 4B). Variables ET and T/ET increased at statistically non-significant rates of 3.24 and 1.72% per year during the 10-year period. A noticeable, statistically significant trend was detected in annual T (Sen’s slope = 6.71, p < 0.05), but not in annual ET, E, or T/ET (Figure 4).
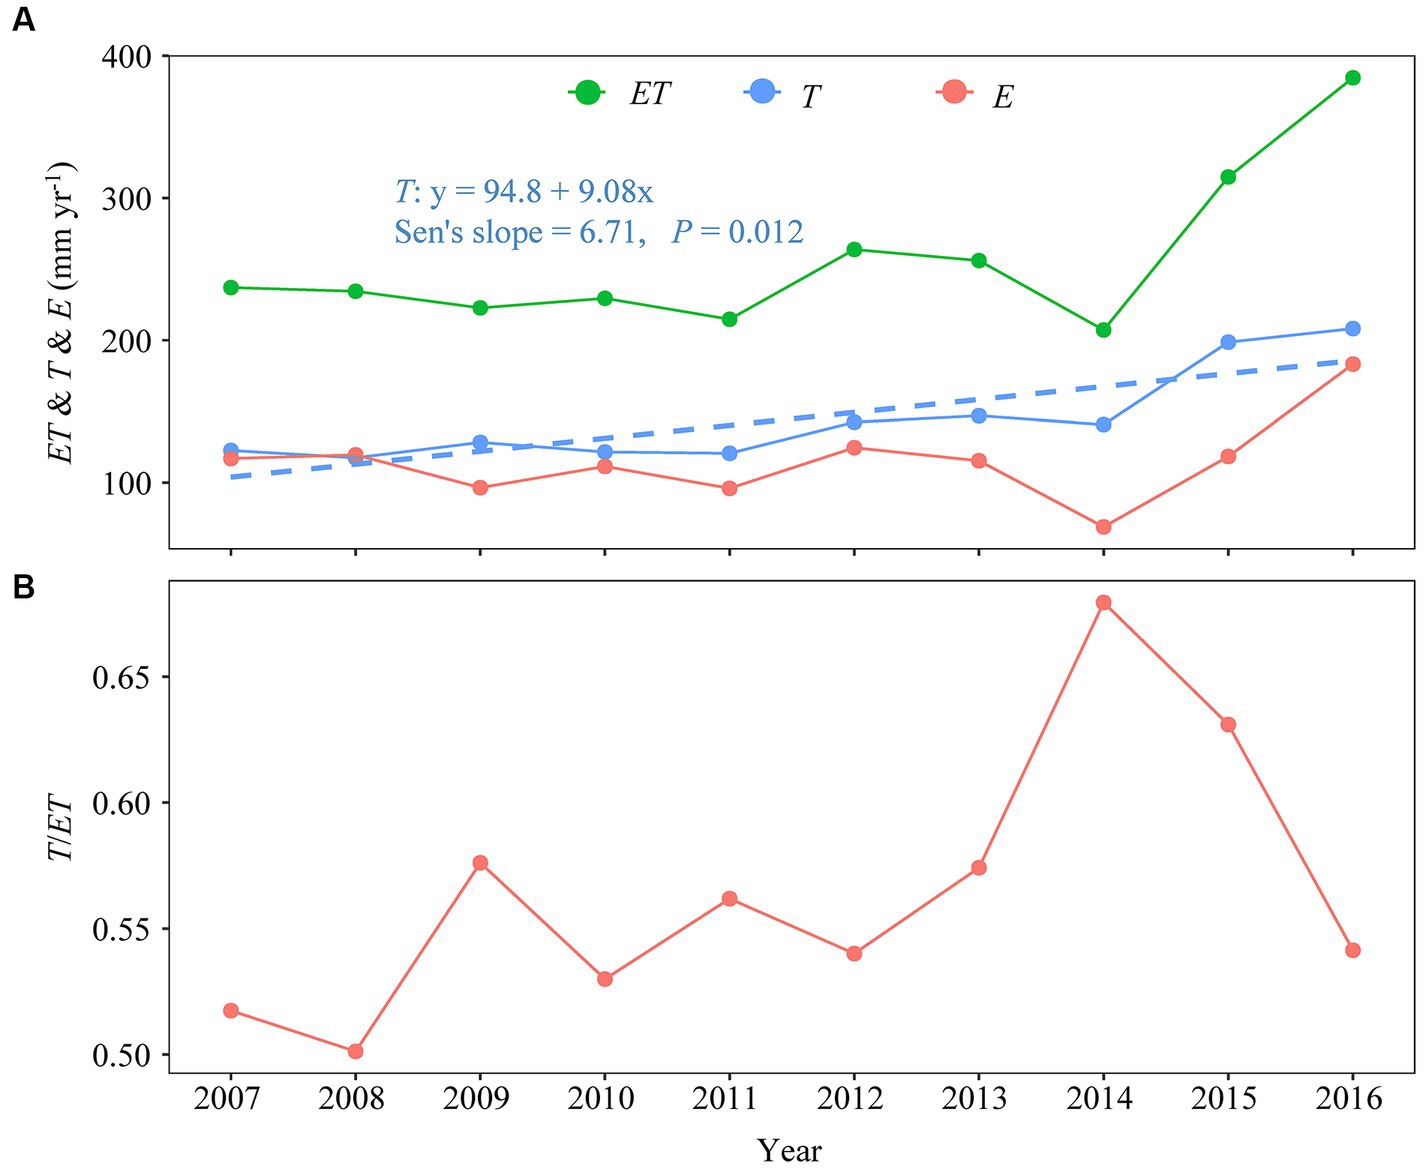
Figure 4. Interannual variation in annual total (A) evapotranspiration (ET, mm year−1), transpiration (T, mm year−1), abiotic evaporation (E, mm year−1), and annual mean (B) transpiration fraction (or T/ET). The dashed line in (A) provides the Sen’s slope for changes in annual transpiration (T).
3.3 Forest greenness and climatic controls on ET and T/ET
Monthly ET significantly increased with increasing Ta, VPD, PAR, PPT, and EVI (Figure 5). Monthly T/ET increased linearly with increasing Ta, PAR, and EVI and asymptotically with increasing VPD (Figure 6).
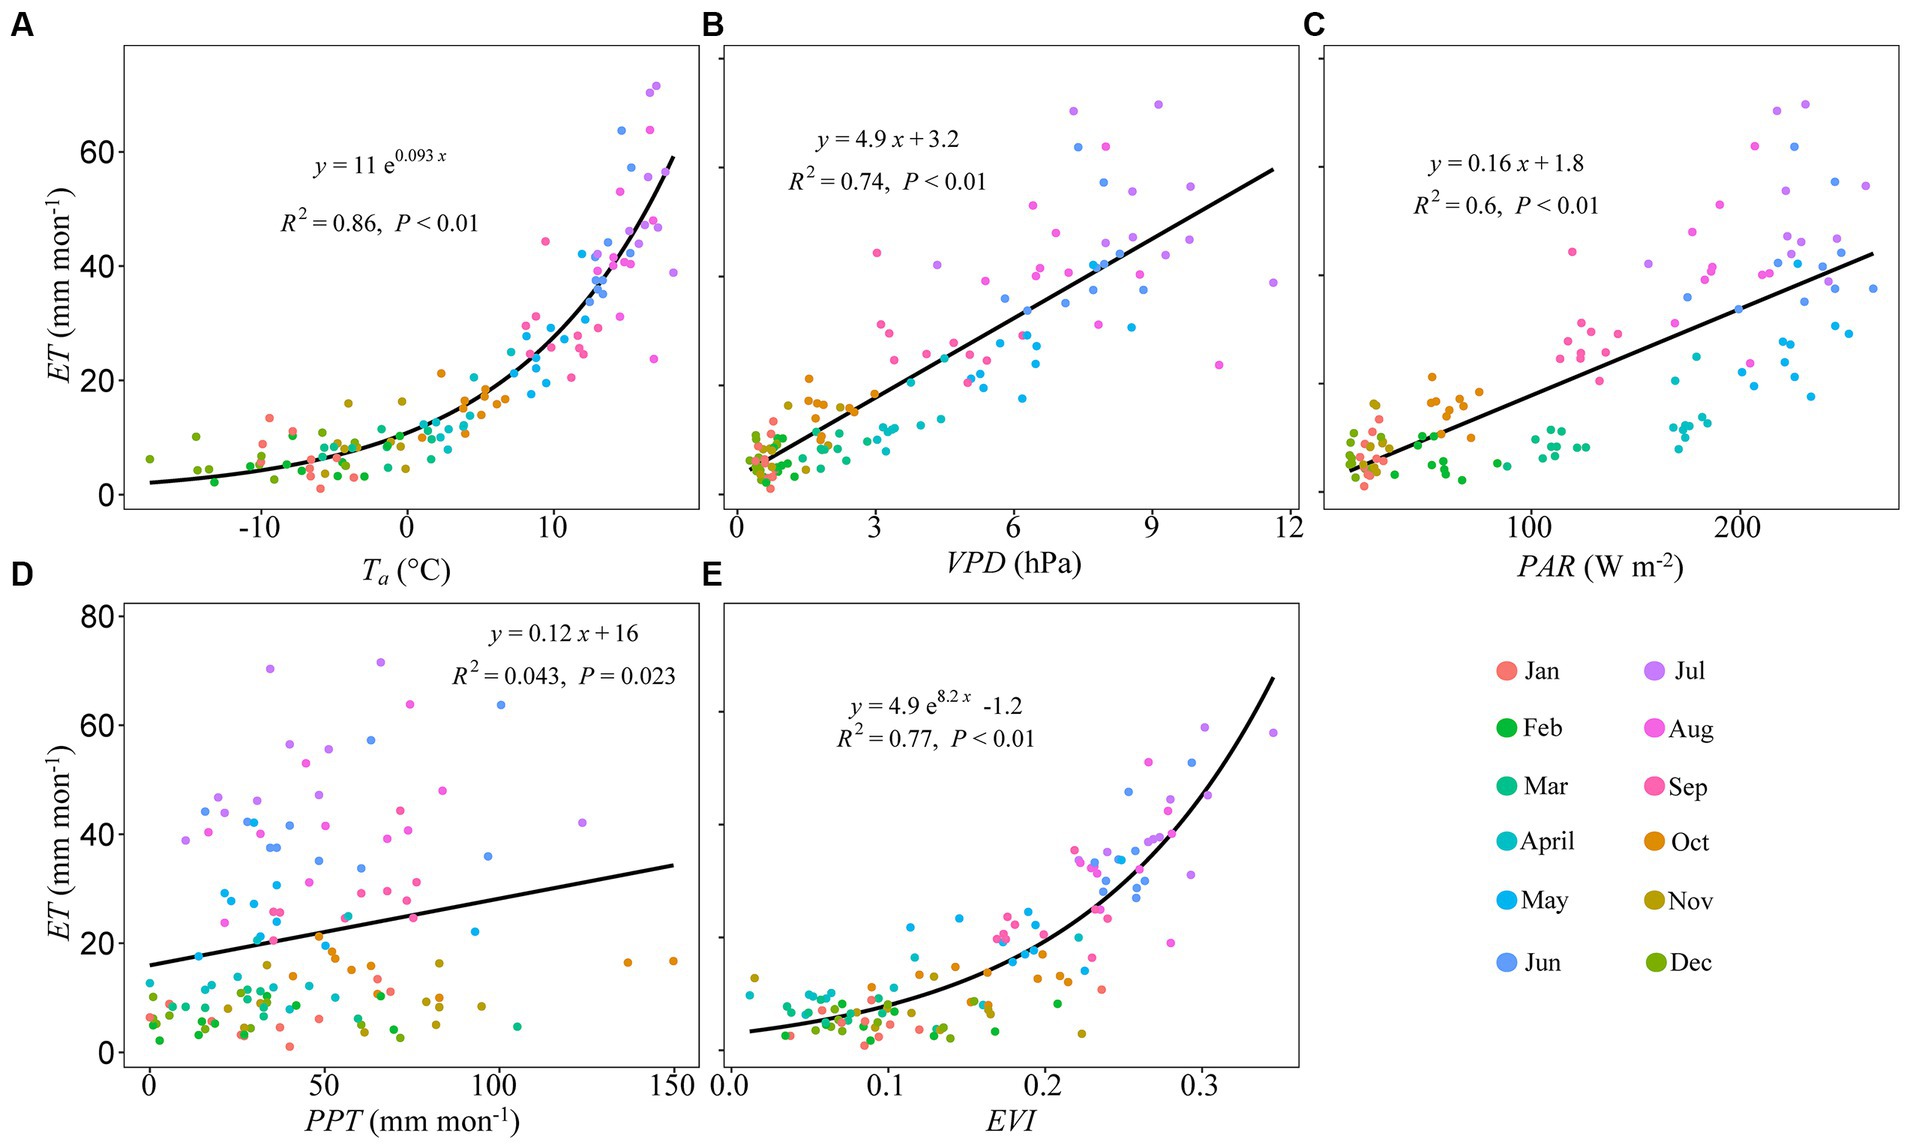
Figure 5. Pairwise relationships between monthly total evapotranspiration (ET) and monthly mean (A) air temperature (Ta, °C), (B) vapor pressure deficit (VPD, hPa), (C) photosynthetically active radiation (PAR, W m−2), (D) total precipitation (PPT, mm month−1), and (E) enhanced vegetation index (EVI). Curvilinear fits are applied across months (legend).
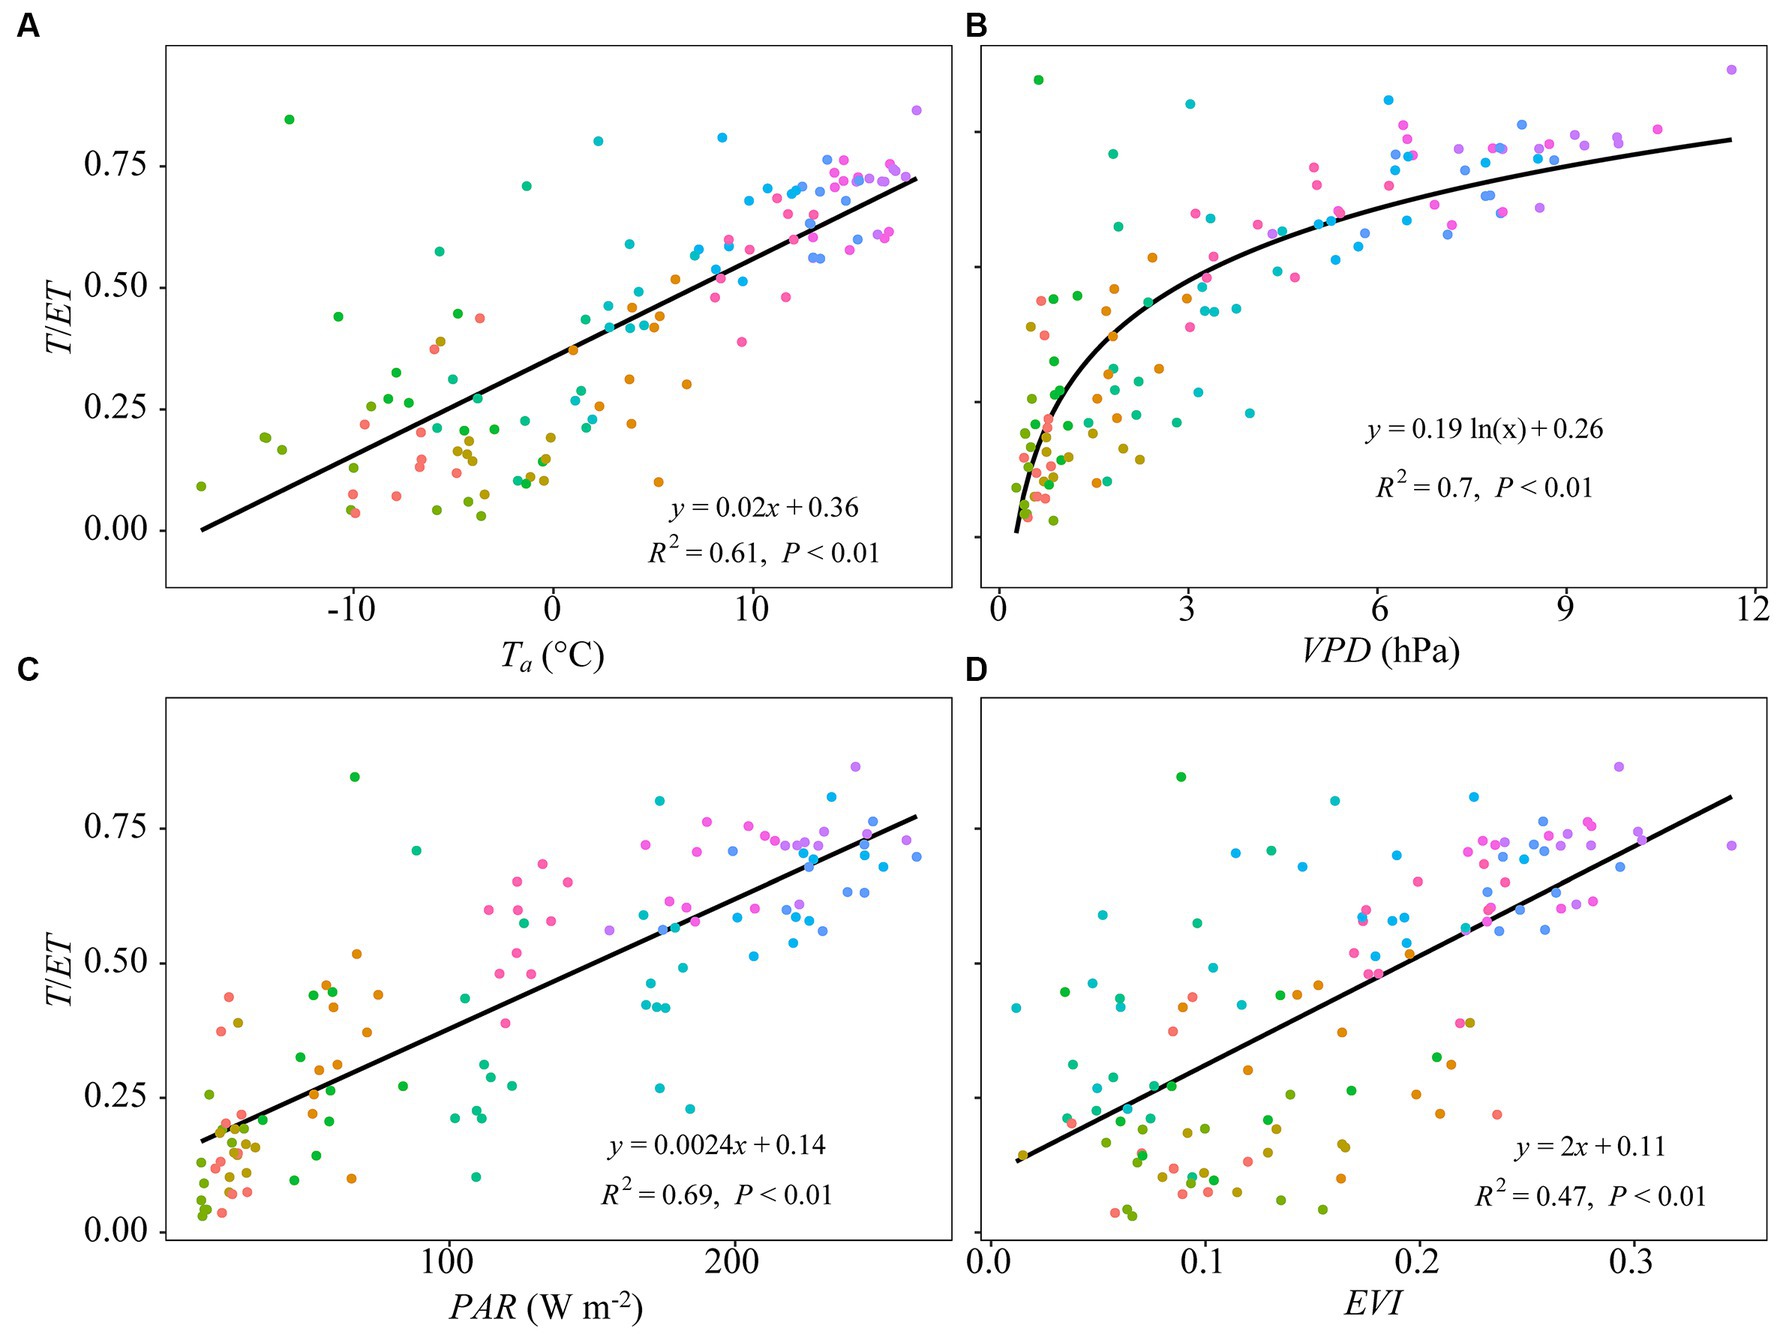
Figure 6. Pairwise relationships between monthly mean transpiration fraction (or T/ET) and monthly mean (A) air temperature (Ta, °C), (B) vapor pressure deficit (VPD, hPa), (C) photosynthetically active radiation (PAR, W m−2), and (D) enhanced vegetation index (EVI). Curvilinear fits are applied across months (legend, Figure 5).
Figure 7 summarizes the relative importance of stand greenness (EVI) and climate factors on the seasonal variation in water vapor fluxes. Air temperature was shown to be the most important predictor of ET over the study period, achieving a feature importance score (gain) of 93.08%, followed by EVI, PPT, VPD, and PAR, with feature importance scores of 2.59, 1.83, 1.73, and 0.77%, respectively (Figure 7A). Variable VPD was the most important predictor of T/ET over the 10 years, with a feature importance score of 63.73%, followed by Ta, PAR, and EVI, with scores of 19.13, 15.88, and 1.26%, respectively (Figure 7B).
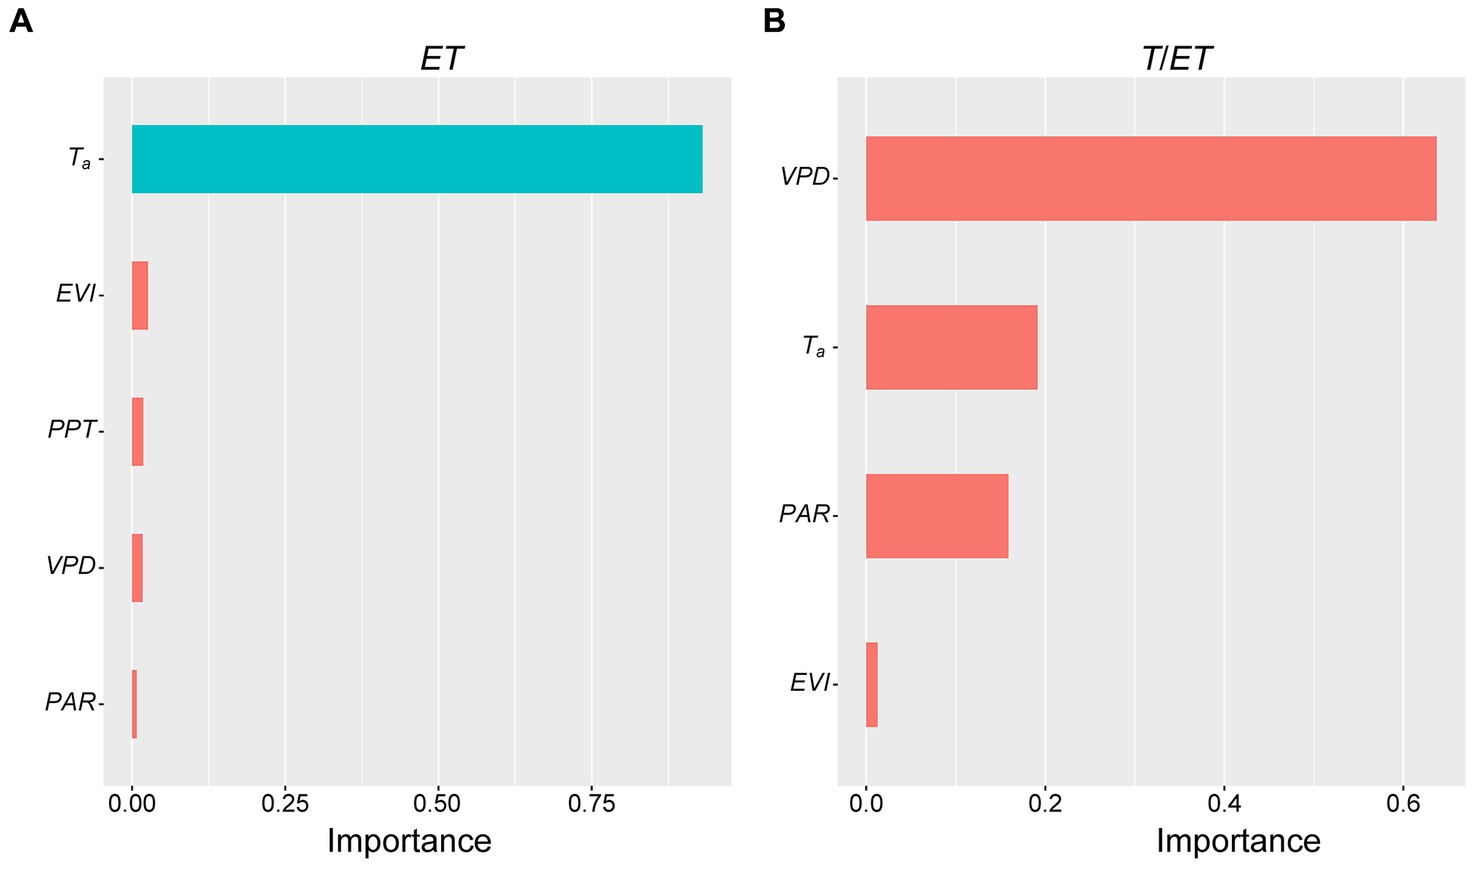
Figure 7. Feature importance scores for the suite of predictor variables for (A) ET and (B) T/ET over 10 years (2007–2016); Ta stands for air temperature (°C), VPD vapor pressure deficit (hPa), PAR photosynthetically active radiation (W m−2); PPT precipitation (mm day−1); and EVI enhanced vegetation index (non-dimensional).
At the interannual scale, ET increased with spring Ta (R2 = 0.73, p < 0.01; Figure 8A) and VPD (R2 = 0.54, p < 0.05; Figure 8B) but showed no correlation with annual mean Ta and VPD (Supplementary Figure S10). Interannual variations in T/ET were strongly co-regulated by VPD (R2 = 0.71, p < 0.05; Figure 8C) and VWC5 (R2 = 0.73, p < 0.05; Figure 8D). Variables ET and T/ET were not correlated with PPT or EVI (data not shown).
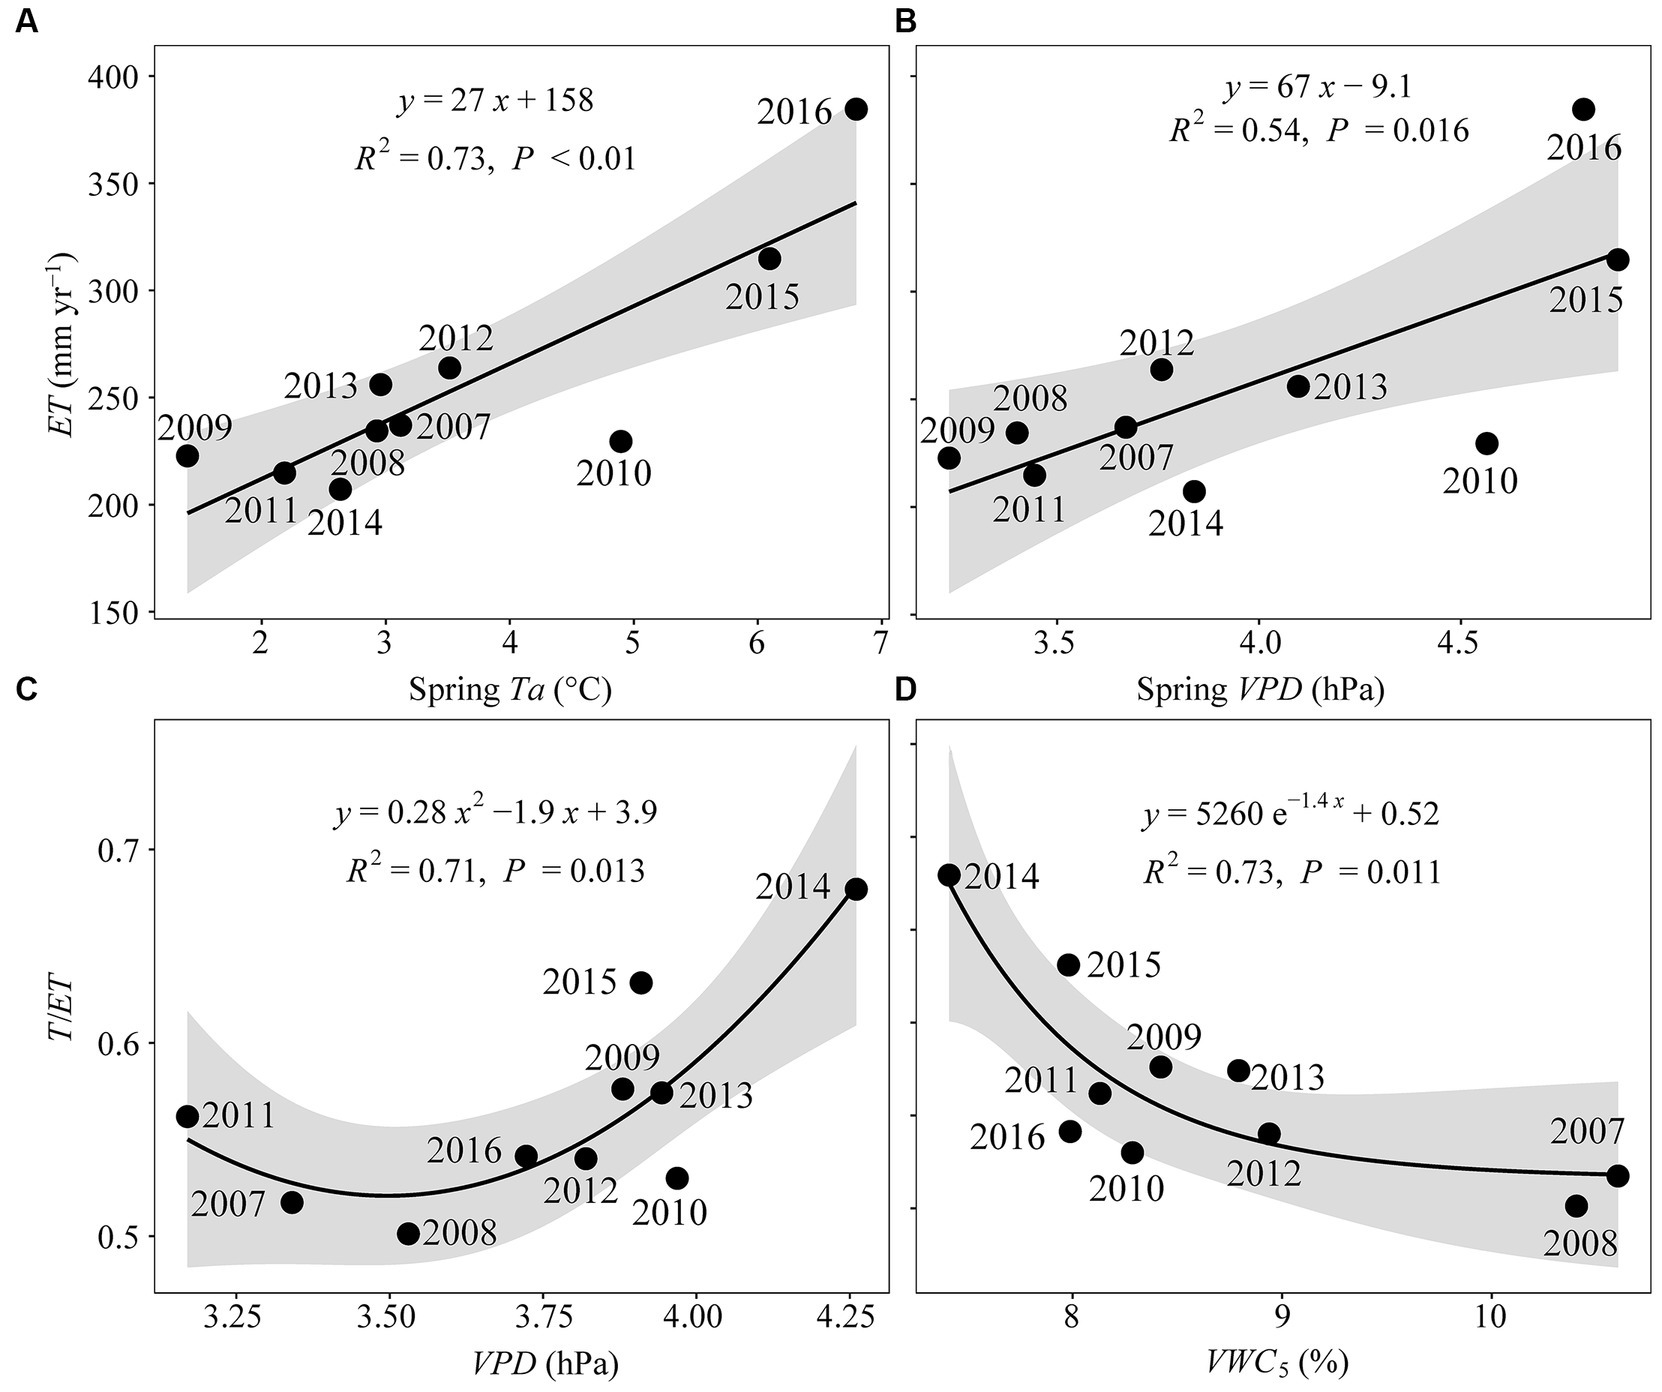
Figure 8. Pairwise relationships between annual total evapotranspiration (ET) and spring (A) temperature (spring Ta, °C) and (B) vapor pressure deficit (spring VPD, hPa), and between annual mean transpiration fraction (T/ET) and (C) VPD (hPa) and (D) volumetric soil water content at a 5-cm depth (VWC5, %). Shaded areas give the 95% confidence interval.
4 Discussion
4.1 Variability in ET and T/ET
Our process for validating ET partitioning is like that described by Zhou et al. (2016). Though there were differences between the results of this study and those of Lloyd and Farquhar (1994), the differences were minor compared to the evaluation performed by Zhou et al. (2016) using the same leaf-level data for comparison. Past studies have pointed out the tendency for Zhou et al.’s method to underestimate T (e.g., Ma et al., 2020; Paul-Limoges et al., 2022). Specifically, 5 and 25% of the results in the two-dimensional space defined by GPP*VPD0.5 and ET based on both the Zhou et al.’s and TEA method (after wet-period data were removed in the latter treatment; Nelson et al., 2018) for comparable conditions were revealed to be dominated by T. Despite these differences, the close tracking of the results over the 10-year period would not have led to vastly different conclusions, regarding the relationship between the study’s suite of environmental variables and T/ET.
Annual mean ET (256.47 mm year−1) reported here is generally lower than those reported for other ENF-sites distributed in temperate climates, with means typically in the range between 477 and 525 mm year−1 (Chen et al., 2018). Widespread tree mortality was shown to decrease ET momentarily. Interestingly, annual ET during the active disturbance phase remained relatively uniform over the first five years during the MPB outbreak and then abruptly increased by 79.08% in Stage II compared to the minimum associated with the first five years (Figure 4). This finding partially disagrees with our first hypothesis. This may be due to an initial increase in T during the first five years because of the response of the few remaining healthy, overstory trees and recovery of the understory vegetation, e.g., seedlings, saplings, shrubs, and any resident herbaceous plants present, associated with a diminishing overstory canopy and improved understory illumination (Brown et al., 2014). Furthermore, by opening the overstory canopy, the added sunlight to the forest floor would have caused abiotic evaporation rates (i.e., E) to display less fluctuation. Previous studies have found that healthy canopy trees can increase their growth during and after a MPB attack, with younger trees benefiting more than older trees due to the decrease in tree competition. This age-related growing pattern has been shown to vary among tree species (Hawkins et al., 2013). In addition, compensatory responses to MPB attacks were also observed by Collins et al. (2011), who found that understory trees grew faster, and more new seedlings were established after the start of an infestation. Emmel et al. (2014) showed that the understory and secondary structure contributed significantly to CO2 uptake after an MPB attack. At this site, the modeled LAI of the overstory canopy by Meyer et al. (2017) was shown to increase slightly after the initial MPB attack in 2006, while the understory vegetation continued to grow after infestation (Meyer et al., 2017). This detail provides the basis for why ET and T/ET remained relatively uniform during Stage I and why it abruptly increased soon afterward (Figure 4A). The relative contribution of the overstory and understory canopies to above-canopy water vapor fluxes, however, need further examination. Meyer et al. (2017) found that modeled ET at the same site based on the 3-PG model was reduced by about 62% from 2005 to 2007, and then increased from 2007 to 2015. This outcome cannot exclude the effects of errors in model-parameter specification regarding this effort. Some studies have found patterns in ET to vary, from no change at all to decreases in similarly disturbed forest ecosystems over a 10-year period during and after disturbance (e.g., Maness et al., 2012; Biederman et al., 2014, 2015; Vanderhoof and Williams, 2015). This implies that recovery patterns in ET may be affected by prevailing site-environmental conditions associated with overstory breakup and climate variability. This notion is further explored in Sections 4.2 and 4.3.
Our multiyear mean annual T/ET (0.57 ± 0.054, mean ± standard deviation) for an ENF ecosystem in a temperate climate zone (with dry, hot summer) is comparable to global estimates based on a synthesis of field data (0.61; Schlesinger and Jasechko, 2014), empirical models (0.57; Wei et al., 2017), and isotopic methods (0.64; Good et al., 2015). In addition, our evaluation of mean T/ET is within the range reported for ENF ecosystems globally, namely between 0.25 and 0.79 (Gu et al., 2018; Yu et al., 2022). Compared with estimates of T/ET for other sites, our estimate of T/ET reproduced those reported for ENFs across North America (i.e., 0.56; Zhou et al., 2016) and Qinghai-Tibet Plateau, China (i.e., 0.5; Sun et al., 2019). However, the value reported here was low compared to that reported for spruce forests in Russia (i.e., 0.80; Liu P. et al., 2022; Liu Y. J. et al., 2022). These comparisons suggest that differences in site conditions, measurement methods, and spatial scales can contribute to minor variations in reported T/ET-values (Scott and Biederman, 2017; Hao et al., 2023). Unlike the first hypothesis, long-term trends, even in areas of massive tree mortality, T/ET may be less affected during the transition, disturbance-to-recovery period, as uncovered during the first eight years of our study. This suggests that increases in T can outpace the changes detected in ET. Also, the effects of post-disturbance on T may have been weaker than on ET, which is consistent with findings from studies conducted in the Southern Rocky Mountain Ecoregion of western United States (Knowles et al., 2023). Decreases in T/ET in 2015 and 2016 may have been due to significant increases in abiotic evaporation (E) associated with prevailing weather conditions, i.e., elevated air temperatures, decreased VPD, and variation in rainfall intensity and timing during these two years (Figures 1, 4).
In contrast to the first hypothesis, trends in water vapor fluxes appeared to have been minimally affected by the MPB infestation. Previous studies based on flux data from ENFs in temperate-climate zones have reached similar conclusions, even in the context of climate change (Chen et al., 2018). Unfortunately, pre-disturbance fluxes are not available to assess the differences, if any, in water vapor fluxes between pre- and post-MPB-infestation. As a substitute, combining our results with water vapor fluxes from other similarly aged, undisturbed ENFs nearby (Colorado State, United States, for example) could help characterize the global response of pine forest ecosystems after disturbance.
4.2 Biotic drivers of water vapor fluxes
Most studies found that forest greenness played an important positive role in regulating water vapor fluxes across spatiotemporal scales, i.e., from regional to global and seasonal to interannual scales (Wang et al., 2014; Berkelhammer et al., 2016; Fatichi and Pappas, 2017; Hayat et al., 2020). Dense canopies not only provide a large surface area for T, but also provide shade to the underlying forest floor, suppressing abiotic E (Hu et al., 2008; Scott and Biederman, 2017). In this study, we found that monthly values of ET and T/ET increased with increasing EVI (Figures 5,6, Supplementary Figures S3–S6), which partly corroborated our second hypothesis. The current relationship between T/ET and EVI at the seasonal scale was different from those observed in other studies focusing on diverse forest ecosystem types, where reported saturated response in T/ET tracked increases in surface greenness (Wei et al., 2017; Scott and Biederman, 2017). However, this relationship was more closely aligned with the results generated from studies focused on scrub-dominated ecosystems in arid to semiarid environments (Hao et al., 2023). These trends may be attributed to the high post-disturbance treefall rate, about 98% of the observed treefall by 2016 (Meyer et al., 2018), and the resulting narrowing of the greenness range assessable at the study site. The feature importance of EVI at the seasonal scale was assessed as being exceptionally low at 1.74% for ET and 0.89% for T/ET, compared to the importance scores generated for some of the abiotic variables (Figure 7).
Although partial changes in EVI were synchronized with changes in ET and T/ET at the seasonal scale, its contribution at the annual scale was considerably constrained. Interannually, previous- or current-year values of EVI failed to correlate with either ET or T/ET (Supplementary Figure S8). Variable EVI revealed two distinct response-phases, one of decline and another of recovery and growth (Figure 3). No such pattern was observed in either ET or T/ET over the 10 years (Figure 4). During the declining phase (i.e., Stage I), standing MPB-affected trees, notwithstanding their compromised T-rate (Hubbard et al., 2013), may have contributed partly to the evaluation of EVI, since needles of affected trees turn color (from green to red to grey) much later during the initial infestation (Brown et al., 2012). Also, affected trees can take time to drop to the forest floor once infected, such that an extended delay can exist between reductions in T, needle color change, and eventual treefall. During the recovery phase, EVI responded quickly to the recovery of understory vegetation associated with the opening of the overstory canopy. Due to a lag in changes in EVI relative to tree mortality, treefall, and understory regeneration and growth (Reed et al., 2014), variation in EVI was not immediately correlated with variation in ecosystem-level water vapor fluxes. Recovery in understory vegetation tended to proceed at a much faster rate than in overstory vegetation, and as a result, EC and stand-level datasets should ideally be longer than 10 years to understand the wide-ranging role of understory dynamics in multilayered vegetation systems after disturbance.
4.3 Abiotic drivers of water vapor fluxes
Water vapor fluxes in forest ecosystems undergoing environmental stress are usually constrained by abiotic factors, such as air and soil temperatures, solar radiation, and soil moisture (Zha et al., 2010; Biederman et al., 2018). Previous studies have reported that tree growth at mid-northern latitudes is often limited by low temperatures and short growing seasons, leading to high-temperature sensitivity (Liu P. et al., 2022; Liu Y. J. et al., 2022). We found Ta to correlate well with ET on the seasonal scale (Figure 7, Supplementary Figures S3, S4). Air temperature contributed the most to explaining variations in ET (Figure 7, Supplementary Figure S7). This is consistent with observations by Meyer et al. (2017), where it was shown that Ta and VPD were important variables in the recovery of ET. Elevated Ta may have led to increases in ET by accelerating physiological processes in leaves, as the growing season is typically characterized by high VPD. Many studies have suggested that high ET is usually associated with high Ta, as the “water-holding capacity” of the atmosphere increases exponentially with linear increases in Ta (Pan et al., 2011). Reductions in ET can also be associated with high Ta through temperature effects’ on stomatal conductance (Helman et al., 2017). It is likely that the effect of high Ta at the site may have yet to reach the threshold needed to trigger the closing of the stomates. Spring Ta and VPD were shown to influence the interannual variation in ET (Figure 8). This may be because spring warming leads to an earlier start of the growing season, which in turn extends the length of the growing season. In addition, though annual mean Ta exhibited a significant increasing trend over the 10 years, spring Ta did not (Supplementary Figure S11), which is consistent with the interannual variation observed in ET. Additionally, rising ambient CO2 concentrations may have been responsible for a decoupling between ET and annual mean Ta. Atmospheric CO2 concentration is generally viewed as the second most important controlling factor of variation in water vapor fluxes (Chen et al., 2018). Plants assimilate atmospheric CO2 for photosynthesis. In the process of CO2 uptake, plants lose water to the atmosphere. Although we did not observe CO2 concentrations directly, global CO2 concentrations are known to be increasing (IPCC, 2014). It is possible that rising CO2 concentrations may have suppressed water vapor fluxes locally by inducing partial stomatal closure, so ET may not have been totally responsive to rising Ta over the 10 years. Climate variables are projected to show increasing or decreasing trends with anticipated future climate change, and thus are expected to have a measurable impact on ET (Buermann et al., 2013; Huang et al., 2016; Yuan et al., 2019).
Most studies reported that abiotic factors displayed a vital role in regulating T/ET across spatiotemporal scales (Scott et al., 2021; Xu et al., 2021; Gao et al., 2022). In this study, VPD showed the largest importance score at the seasonal scale (Figure 7B), with high VPD promoting T/ET in an asymptotic manner (Figure 6B). This finding is consistent with other ecosystem-level studies of forests (Zhu et al., 2015) and riparian woodland (Scott et al., 2021), suggesting atmospheric evaporative demand has significant control over seasonal plant water-use dynamics (Scott et al., 2021). Other studies, however, have described negative effects of VPD on T/ET (Scott et al., 2021; Hao et al., 2023), particularly in situations where Ta tend to be high and soil moisture availability is low. At the interannual scale, T/ET correlated well with both VPD and VWC5 (Figures 8C,D). The net effect of high VPD and low soil water on T/ET can vary, depending on the relative response of E and T to variation in the two controlling variables (Scott et al., 2021; Hao et al., 2023). In moderately humid forest ecosystems, vegetation may increase T in response to increasing VPD to sustain vital plant processes. Consequently, T may be more sensitive to VPD than either its companion processes of E or ET. Moreover, increases in VPD is often associated with increases in air temperature that encourage vegetation to grow and cause T/ET to increase and E/ET to decrease (Zhao et al., 2022). This asymmetrical outcome may lead to an increase in WUE through an improved T/ET. This enhancement is supported by the observed increase in GPP at the site (Meyer et al., 2017).
At our site, high annual VPD may have caused T/ET to increase, as the lodgepole pine trees are adapted to a low-temperature environment due to their high-latitude position, and high VPD supports high T-rates. In the future, increased VPD may limit T/ET due to partial stomatal closure (Yuan et al., 2019). In addition, asynchronous response in T and ET to changes in shallow, subsurface water may lead to: (i) a negative relationship between T/ET and VWC (Figure 8); (ii) a drop in the water availability of the soil (Figure 4); (iii) a larger portion of VWC being directed to maintaining E; (iv) a drop in meteoric water available for infiltration and plant T; and (v) soil water replenishment by snowmelt may affect the relationship between VWC and ET, as well as that of T.
There were no significant correlations between annual ET, T/ET, and PPT. This was most likely attributable to soil water carryover effects and hydrological losses causing annual ET and PPT to decouple (Biederman et al., 2018; Mu et al., 2022). Due to the study area’s temperate climate, there was usually less plant T and abiotic E during the non-growing season, notwithstanding the abundance of precipitation (Figure 1). Consequently, PPT during the non-growing season was usually stored in the soil complex, making it available for plant uptake during the following growing season (Mu et al., 2022). This trend was consistent with variations in soil moisture, with VWC being greatest during the non-growing season and lowest during the growing season (Figure 1). Correspondingly, ET may not be limited by PPT, as PPT on most occasions exceeded ET (Supplementary Figure S9). Many studies found weak to no correlation between PPT and T/ET (Raz-Yaseef et al., 2012; Hao et al., 2023). The regulation of T/ET by shallow, subsurface soil water suggests that T/ET may be affected by temporal patterns in PPT because VWC tended to increase during events of PPT (Figure 1). Changes in PPT regime in general may affect the ecosystem water balance (Knapp et al., 2008; Donat et al., 2016; Thackeray et al., 2022), and as a result further observations are needed.
5 Conclusion
We examined the variations in water vapor fluxes (e.g., ET, T/ET) in an ENF ecosystem over a 10-year period (2007–2016). The forest stand, predominantly of lodgepole pine, succumbed to a large-scale MPB infestation from 2006 through 2010, with the summer of 2006 providing the greatest number of trees infected by MPB. The investigation focused on understanding the variation and drivers of ET and T/ET after a MPB attack. At the seasonal and interannual scales, ET and T/ET were mainly regulated by climate factors (e.g., Ta, VPD, VWC5). As a result of tree mortality and understory vegetation recovery being largely synchronized, the lag in post-disturbance EVI relative to reductions in T suggests that RS-based indices of canopy greenness can perform poorly when used to describe ecosystem-level trajectories of annual ET and T/ET in recovering multilayered forests. Since the recovery of understory vegetation occurs at a much faster rate than in overstory vegetation, understory vegetation contributes more to an instantaneous estimate of EVI during the initial stages of recovery, causing EVI to decouple from ET and T/ET.
The study stresses the importance of climate in regulating forest-ecosystem water vapor fluxes and the need to incorporate related regulatory mechanisms in predictive models of forest recovery subsequent to landscape-level disturbance by MPB. As the climate continues to warm, water depletion in high-latitude lodgepole pine-dominated forests is expected to increase. The relative effects of stand greenness and climatic factors on forest-ecosystem-level water vapor fluxes need further scrutiny, particularly as forest ecosystems undergo disturbance-recovery cycles, subject to the short- to long-term influences of changing global weather patterns.
Data availability statement
The datasets presented in this study can be found in online repositories. The names of the repository/repositories and accession number(s) can be found in the article/Supplementary material.
Author contributions
SH: Conceptualization, Methodology, Software, Writing – original draft, Data curation, Formal Analysis. XJ: Funding acquisition, Supervision, Writing – review & editing. HZ: Data curation, Software, Writing – review & editing. XL: Data curation, Methodology, Writing – review & editing. YM: Methodology, Writing – review & editing. TZ: Funding acquisition, Supervision, Writing – review & editing. PL: Funding acquisition, Supervision, Writing – review & editing. CB: Supervision, Writing – review & editing.
Funding
The author(s) declare financial support was received for the research, authorship, and/or publication of this article. This study was partially supported by the National Key Research and Development Program of China (2023YFF0805604), National Natural Science Foundation of China (NSFC, No. 32071843, 32071842, and 32101588), the Fundamental Research Funds for the Central Universities (no. PTYX202324 and PTYX202325), China Scholarship Council (no. 202206510025), the University of New Brunswick in the logistical support of the study, and the Natural Science and Engineering Council of Canada (NSERC) in the form of a Discovery Grant to Dr. CB. The collection of eddy-covariance and ancillary data for the CA-LP1 site was supported by funding provided by the BC Ministry of Forests, Lands, Natural Resource Operations and Rural Development and by an NSERC Discovery Grant to Dr. T.A. Black. The data were available via AmeriFlux and FLUXNET online data archives. The U.S.-China Carbon Consortium (USCCC) promoted this work by providing opportunities for discussion and exchange of ideas.
Conflict of interest
The authors declare that the research was conducted in the absence of any commercial or financial relationships that could be construed as a potential conflict of interest.
Publisher’s note
All claims expressed in this article are solely those of the authors and do not necessarily represent those of their affiliated organizations, or those of the publisher, the editors and the reviewers. Any product that may be evaluated in this article, or claim that may be made by its manufacturer, is not guaranteed or endorsed by the publisher.
Supplementary material
The Supplementary material for this article can be found online at: https://www.frontiersin.org/articles/10.3389/ffgc.2024.1352853/full#supplementary-material
References
Austin, A. T., Yahdjian, L., Stark, J. M., Belnap, J., Porporato, A., Norton, U., et al. (2004). Water pulses and biogeochemical cycles in arid and semiarid ecosystems. Oecologia 141, 221–235. doi: 10.1007/s00442-004-1519-1
Berkelhammer, M., Noone, D. C., Wong, T. E., Burns, S. P., Knowles, J. F., Kaushik, A., et al. (2016). Convergent approaches to determine an ecosystem’s transpiration fraction. Global Biogeochem. Cycles 30, 933–951. doi: 10.1002/2016GB005392
Biederman, J. A., Harpold, A. A., Gochis, D. J., Ewers, B. E., Reed, D. E., Papuga, S. A., et al. (2014). Increased evaporation following widespread tree mortality limits streamflow response. Water Resour. Res. 50, 5395–5409. doi: 10.1002/2013WR014994
Biederman, J. A., Scott, R. L., Arnone, J. A. III, Jasoni, R. L., Litvak, M. E., Moreo, M. T., et al. (2018). Shrubland carbon sink depends upon winter water availability in the warm deserts of North America. Agric. For. Meteorol. 249, 407–419. doi: 10.1016/j.agrformet.2017.11.005
Biederman, J. A., Somor, A. J., Harpold, A. A., Gutmann, E. D., Breshears, D. D., Troch, P. A., et al. (2015). Recent tree die-off has little effect on streamflow in contrast to expected increases from historical studies. Water Resour. Res. 51, 9775–9789. doi: 10.1002/2015WR017401
Black, T. A. (2021). AmeriFlux FLUXNET-1F CA-LP1 British Columbia-Mountain pine beetle-attacked lodgepole pine stand, Ver. 3-5, AmeriFlux AMP, (dataset). doi: 10.17190/AMF/1832155
Bourque, C. P.-A., Gachon, P., MacLellan, B. R., and MacLellan, J. I. (2020). Projected wind impact on Abies balsamea (balsam fir)-dominated stands in New Brunswick (Canada) based on remote sensing and regional modelling of climate and tree species distribution. Remote Sens. 12:1177. doi: 10.3390/rs12071177
Bright, B. C., Hudak, A. T., Meddens, A. J. H., Egan, J. M., and Jorgensen, C. L. (2020). Mapping multiple insect outbreaks across large regions annually using Landsat time series data. Remote Sens. 12:1655. doi: 10.3390/rs12101655
Brown, M. G., Black, T. A., Nesic, Z., Foord, V. N., Spittlehouse, D. L., Fredeen, A. L., et al. (2014). Evapotranspiration and canopy characteristics of two lodgepole pine stands following mountain pine beetle attack. Hydrol. Process. 28, 3326–3340. doi: 10.1002/hyp.9870
Brown, M. G., Black, T. A., Nesic, Z., Fredeen, A. L., Foord, V. N., Spittlehouse, D. L., et al. (2012). The carbon balance of two lodgepole pine stands recovering from mountain pine beetle attack in British Columbia. Agric. For. Meteorol. 153, 82–93. doi: 10.1016/j.agrformet.2011.07.010
Buermann, W., Bikash, P. R., Jung, M., Burn, D. B., and Reichstein, M. (2013). Earlier springs decrease peak summer productivity in North American boreal forests. Environ. Res. Lett. 8:024027. doi: 10.1088/1748-9326/8/2/024027
Caldwell, M. K., Hawbaker, T. J., Briggs, J. S., Cigan, P. W., and Stitt, S. (2013). Simulated impacts of mountain pine beetle and wildfire disturbances on forest vegetation composition and carbon stocks in the southern Rocky Mountains. Biogeosciences 10, 8203–8222. doi: 10.5194/bg-10-8203-2013
Chen, Y., Xue, Y., and Hu, Y. (2018). How multiple factors control evapotranspiration in North America evergreen needleleaf forests. Sci. Total Environ. 622-623, 1217–1224. doi: 10.1016/j.scitotenv.2017.12.038
Clark, K. L., Skowronski, N., Gallagher, M., Renninger, H., and Schäfer, K. (2012). Effects of invasive insects and fire on forest energy exchange and evapotranspiration in the New Jersey pinelands. Agric. For. Meteorol. 166-167, 50–61. doi: 10.1016/j.agrformet.2012.07.007
Collins, B. J., Rhoades, C. C., Hubbard, R. M., and Battaglia, M. A. (2011). Tree regeneration and future stand development after bark beetle infestation and harvesting in Colorado lodgepole pine stands. For. Ecol. Manage. 261, 2168–2175. doi: 10.1016/j.foreco.2011.03.016
Donat, M. G., Lowry, A. L., Alexander, L. V., O’Gorman, P. A., and Maher, N. (2016). More extreme precipitation in the world’s dry and wet regions. Nat. Clim. Chang. 6, 508–513. doi: 10.1038/nclimate2941
Emmel, C., Paul-Limoges, E., Bowler, R., Black, T. A., and Christen, A. (2014). Vertical distribution of carbon dioxide sources and sinks in a recovering mountain pine beetle attacked lodgepole pine stand. Agric. For. Meteorol. 195–196, 108–122. doi: 10.1016/j.agrformet.2014.04.014
Fatichi, S., and Pappas, C. (2017). Constrained variability of modeled T:ET ratio across biomes. Geophys. Res. Lett. 44, 6795–6803. doi: 10.1002/2017GL074041
Frank, J. M., Massman, W. J., Ewers, B. E., Huckaby, L. S., and Negron, J. F. (2014). Ecosystem CO2/H2O fluxes are explained by hydraulically limited gas exchange during tree mortality from spruce bark beetles. J. Geophys. Res. Biogeosci. 119, 1195–1215. doi: 10.1002/2013JG002597
Gao, G., Wang, D., Zha, T., Wang, L., and Fu, B. (2022). A global synthesis of transpiration rate and evapotranspiration partitioning in the shrub ecosystems. J. Hydrol. 606:127417. doi: 10.1016/j.jhydrol.2021.127417
Good, S. P., Noone, D., and Bowen, G. (2015). Hydrologic connectivity constrains partitioning of global terrestrial water fluxes. Science 349, 175–177. doi: 10.1126/science.aaa5931
Gu, C., Ma, J., Zhu, G., Yang, H., Zhang, K., Wang, Y., et al. (2018). Partitioning evapotranspiration using an optimized satellite-based ET model across biomes. Agric. For. Meteorol. 259, 355–363. doi: 10.1016/j.agrformet.2018.05.023
Hao, S. R., Jia, X., Mu, Y. M., Zha, T. S., Qin, S. G., Liu, P., et al. (2023). Canopy greenness, atmospheric aridity, and large rain events jointly regulate evapotranspiration partitioning in a temperate semiarid shrubland. Agric. For. Meteorol. 333:109425. doi: 10.1016/j.agrformet.2023.109425
Hayat, M., Zha, T. S., Jia, X., Iqbal, S., Qian, D. D., Bourque, C. P.-A., et al. (2020). A multiple-temporal scale analysis of biophysical control of sap flow in Salix psammophila growing in a semiarid shrubland ecosystem of Northwest China. Agric. For. Meteorol. 288–289, 107985. doi: 10.1016/j.agrformet.2020.107985
Hawkins, C. D. B., Dhar, A., and Balliet, N. A. (2013). Radial growth of residual overstory trees and understory saplings after mountain pine beetle attack in central British Columbia. For. Ecol. Manage. 310, 348–356. doi: 10.1016/j.foreco.2013.08.035
Helman, D., Osem, Y., Yakir, D., and Lensky, I. M. (2017). Relationships between climate, topography, water use and productivity in two key Mediterranean forest types with different water-use strategies. Agric. For. Meteorol. 232, 319–330. doi: 10.1016/j.agrformet.2016.08.018
Hu, Z. M., Yu, G. R., Fu, Y. L., Sun, X. M., Li, Y. N., Shi, P. L., et al. (2008). Effects of vegetation control on ecosystem water use efficiency within and among four grassland ecosystems in China. Glob. Chang. Biol. 14, 1609–1619. doi: 10.1111/j.1365-2486.2008.01582.x
Huang, M. T., Piao, S. L., Zeng, Z. Z., Peng, S. S., Ciais, P., Cheng, L., et al. (2016). Seasonal responses of terrestrial ecosystem water-use efficiency to climate change. Glob. Chang. Biol. 22, 2165–2177. doi: 10.1111/gcb.13180
Hubbard, R. M., Rhoades, C. C., Elder, K., and Negron, J. (2013). Changes in transpiration and foliage growth in lodgepole pine trees following mountain pine beetle attack and mechanical girdling. For. Ecol. Manag. 289, 312–317. doi: 10.1016/j.foreco.2012.09.028
IPCC. (2014). Climate change 2014: Impacts, adaptation, and vulnerability. Part A: Global and sectoral aspects. Contribution of working group II to the fifth assessment report of the Intergovernmental Panel on Climate Change. Cambridge, UK and New York, NY: Cambridge University Press.
Jin, C., Xiao, X., Merbold, L., Arneth, A., Veenendaal, E., and Kutsch, W. L. (2013). Phenology and gross primary production of two dominant savanna woodland ecosystems in southern Africa. Remote Sens. Environ. 135, 189–201. doi: 10.1016/j.rse.2013.03.033
Jin, C., Zha, T., Bourque, C. P.-A., Liu, P., Jia, X., Zhang, F., et al. (2023). Multi-year trends and interannual variation in ecosystem resource use efficiencies in a young mixedwood plantation in northern China. Agric. For. Meteorol. 330:109318. doi: 10.1016/j.agrformet.2023.109318
Jin, J. X., Zhan, W. F., Wang, Y., Gu, B. J., Wang, W. F., Jiang, H., et al. (2017). Water use efficiency in response to interannual variations in flux-based photosynthetic onset in temperate deciduous broadleaf forests. Ecol. Indic. 79, 122–127. doi: 10.1016/j.ecolind.2017.04.006
Knapp, A. K., Beier, C., Briske, D. D., Classen, A. T., Luo, Y. Q., Reichstein, M., et al. (2008). Consequences of more extreme precipitation regimes for terrestrial ecosystems. Bioscience 58, 811–821. doi: 10.1641/B580908
Knowles, J. F., Bjarke, N. R., Badger, A. M., Berkelhammer, M., Biederman, J. A., Blanken, P. D., et al. (2023). Bark beetle impacts on forest evapotranspiration and its partitioning. Sci. Total Environ. 880:163260. doi: 10.1016/j.scitotenv.2023.163260
Launiainen, S. (2010). Seasonal and inter-annual variability of energy exchange above a boreal scots pine forest. Biogeosciences 7, 3921–3940. doi: 10.5194/bg-7-3921-2010
Li, S. G., Asanuma, J., Eugster, W., Kotani, A., Liu, J. J., Urano, T., et al. (2005). Net ecosystem carbon dioxide exchange over grazed steppe in Central Mongolia. Glob. Chang. Biol. 11, 1941–1955. doi: 10.1111/j.1365-2486.2005.01047.x
Liu, P., Barr, A. G., Zha, T. S., Black, T. A., Jassal, R. S., Nesic, Z., et al. (2022). Re-assessment of the climatic controls on the carbon and water fluxes of a boreal aspen forest over 1996-2016: changing sensitivity to long-term climatic conditions. Glob. Chang. Biol. 28, 4605–4619. doi: 10.1111/gcb.16218
Liu, Y. J., Zhang, Y. G., Shan, N., Zhang, Z. Y., and Wei, Z. W. (2022). Global assessment of partitioning transpiration from evapotranspiration based on satellite solar-induced chlorophyll fluorescence data. J. Hydrol. 612:128044. doi: 10.1016/j.jhydrol.2022.128044
Lloyd, J., and Farquhar, G. D. (1994). International association for ecology 13C discrimination during CO2 assimilation by the terrestrial biosphere. Oecologia 99, 201–215. doi: 10.1007/BF00627732
Ma, S., Eichelmann, E., Wolf, S., Rey-Sanchez, C., and Baldocchi, D. D. (2020). Transpiration and evaporation in a Californian oak-grass savanna: Field measurements and partitioning model results. Agric. For. Meteorol. 295:108204. doi: 10.1016/j.agrformet.2020.108204
Mack, M. C., Walker, X. J., Johnstone, J. F., Alexander, H. D., Melvin, A. M., Jean, M., et al. (2021). Carbon loss from boreal forest wildfires offset by increased dominance of deciduous trees. Science 372, 280–283. doi: 10.1126/science.abf3903
Maness, H., Kushner, P. J., and Fung, I. (2012). Summertime climate response to mountain pine beetle disturbance in British Columbia. Nat. Geosci. 6, 65–70. doi: 10.1038/ngeo1642
Masek, J. G., Cohen, W. B., Leckie, D., Wulder, M. A., Vargas, R., de Jong, B., et al. (2011). Recent rates of forest harvest and conversion in North America. J. Geophys. Res. Biogeosci. 116:G00K03. doi: 10.1029/2010jg001471
McDowell, N. G., Beerling, D. J., Breshears, D. D., Fisher, R. A., Raffa, K. F., and Stitt, M. (2011). The interdependence of mechanisms underlying climate-driven vegetation mortality. Trends Ecol. Evol. 26, 523–532. doi: 10.1016/j.tree.2011.06.003
Meyer, G., Black, T. A., Jassal, R. S., Nesic, Z., Coops, N. C., Christen, A., et al. (2018). Simulation of net ecosystem productivity of a lodgepole pine forest after mountain pine beetle attack using a modified version of 3-PG. For. Ecol. Manage. 412, 41–52. doi: 10.1016/j.foreco.2018.01.034
Meyer, G., Black, T. A., Jassal, R. S., Nesic, Z., Grant, N. J., Spittlehouse, D. L., et al. (2017). Measurements and simulations using the 3-PG model of the water balance and water use efficiency of a lodgepole pine stand following mountain pine beetle attack. For. Ecol. Manag. 393, 89–104. doi: 10.1016/j.foreco.2017.03.019
Mu, Y. M., Yuan, Y., Jia, X., Zha, T. S., Qin, S. G., Ye, Z. Q., et al. (2022). Hydrological losses and soil moisture carryover affected the relationship between evapotranspiration and rainfall in a temperate semiarid shrubland. Agric. For. Meteorol. 315:108831. doi: 10.1016/j.agrformet.2022.108831
Nelson, J. A., Carvalhais, N., Cuntz, M., Delpierre, N., Knauer, J., Ogée, J., et al. (2018). Coupling water and carbon fluxes to constrain estimates of transpiration: the TEA algorithm. J. Geophys. Res. Biogeosci. 123, 3617–3632. doi: 10.1029/2018JG004727
Nelson, J. A., Pérez-Priego, O., Zhou, S., Poyatos, R., Zhang, Y., Blanken, P. D., et al. (2020). Ecosystem transpiration and evaporation: insights from three water flux partitioning methods across FLUXNET sites. Glob. Chang. Biol. 26, 6916–6930. doi: 10.1111/gcb.15314
Pan, Y., Birdsey, R. A., Fang, J., Houghton, R., Kauppi, P. E., Kurz, W. A., et al. (2011). A large and persistent carbon sink in the world's forests. Science 333, 988–993. doi: 10.1126/science.1201609
Paul-Limoges, E., Revill, A., Maier, R., Buchmann, N., and Damm, A. (2022). Insights for the partitioning of ecosystem evaporation and transpiration in short-statured croplands. J. Geophys. Res. Biogeosci. 127:e2021JG006760. doi: 10.1029/2021JG006760
Raffa, K. F., Aukema, B. H., Bentz, B. J., Carroll, A. L., Hicke, J. A., and Kolb, T. E. (2015). “Responses of tree-killing bark beetles to a changing climate” in Climate change and insect pests. eds. C. Björkman and P. Niemelä (Wallingford: CABI), 173–201.
Raz-Yaseef, N., Yakir, D., Schiller, G., and Cohen, S. (2012). Dynamics of evapotranspiration partitioning in a semi-arid forest as affected by temporal rainfall patterns. Agric. For. Meteorol. 157, 77–85. doi: 10.1016/j.agrformet.2012.01.015
Reed, D. E., Ewers, B. E., and Pendall, E. (2014). Impact of mountain pine beetle induced mortality on forest carbon and water fluxes. Environ. Res. Lett. 9:105004. doi: 10.1088/1748-9326/9/10/105004
Rungee, J., Bales, R., and Goulden, M. (2019). Evapotranspiration response to multiyear dry periods in the semiarid western United States. Hydrol. Process. 33, 182–194. doi: 10.1002/hyp.13322
Schlesinger, W. H., and Jasechko, S. (2014). Transpiration in the global water cycle. Agric. For. Meteorol. 189-190, 115–117. doi: 10.1016/j.agrformet.2014.01.011
Scott, R. L., and Biederman, J. A. (2017). Partitioning evapotranspiration using long-term carbon dioxide and water vapor fluxes. Geophys. Res. Lett. 44, 6833–6840. doi: 10.1002/2017GL074324
Scott, R. L., Knowles, J. F., Nelson, J. A., Gentine, P., Li, X., Barron-Gafford, G., et al. (2021). Water availability impacts on evapotranspiration partitioning. Agric. For. Meteorol. 297:108251. doi: 10.1016/j.agrformet.2020.108251
Sun, X., Wilcox, B. P., and Zou, C. B. (2019). Evapotranspiration partitioning in dryland ecosystems: a global meta-analysis of in situ studies. J. Hydrol. 576, 123–136. doi: 10.1016/j.jhydrol.2019.06.022
Tang, Y. K., Wen, X. F., Sun, X. M., Zhang, X. Y., and Wang, H. M. (2014). The limiting effect of deep soil water on evapotranspiration of a subtropical coniferous plantation subjected to seasonal drought. Adv. Atmos. Sci. 31, 385–395. doi: 10.1007/s00376-013-2321-y
Thackeray, C. W., Hall, A., Norris, J., and Chen, D. (2022). Constraining the increased frequency of global precipitation extremes under warming. Nat. Clim. Chang. 12, 441–448. doi: 10.1038/s41558-022-01329-1
Tong, Y. Q., Wang, P., Li, X. Y., Wang, L. X., Wu, X. C., Shi, F. Z., et al. (2019). Seasonality of the transpiration fraction and its controls across typical ecosystems within the Heihe River basin. J. Geophys. Res. Atmos. 124, 1277–1291. doi: 10.1029/2018JD029680
Vanderhoof, M. K., and Williams, C. A. (2015). Persistence of MODIS evapotranspiration impacts from mountain pine beetle outbreaks in lodgepole pine forests, south-central Rocky Mountains. Agric. For. Meteorol. 200, 78–91. doi: 10.1016/j.agrformet.2014.09.015
Wang, L., Good, S. P., and Caylor, K. K. (2014). Global synthesis of vegetation control on evapotranspiration partitioning. Geophys. Res. Lett. 41, 6753–6757. doi: 10.1002/2014GL061439
Webb, E. K., Pearman, G. I., and Leuning, R. (1980). Correction of flux measurements for density effects due to heat and water vapour transfer. Quart. J. R. Meteorol. Soc. 106, 85–100. doi: 10.1002/qj.49710644707
Wei, Z., Yoshimura, K., Wang, L. X., Miralles, D. G., Jasechko, S., and Lee, X. H. (2017). Revisiting the contribution of transpiration to global terrestrial evapotranspiration. Geophys. Res. Lett. 44, 2792–2801. doi: 10.1002/2016GL072235
Wilson, K., Goldstein, A., Falge, E., Aubinet, M., Baldocchi, D., Berbigier, P., et al. (2002). Energy balance closure at FLUXNET sites. Agric. For. Meteorol. 113, 223–243. doi: 10.1016/S0168-1923(02)00109-0
Wulder, M. A., Dymond, C. C., White, J. C., Leckie, D. G., and Carroll, A. L. (2006). Surveying mountain pine beetle damage of forests: a review of remote sensing opportunities. For. Ecol. Manag. 221, 27–41. doi: 10.1016/j.foreco.2005.09.021
Xie, J., Zha, T. S., Zhou, C. P., Jia, X., Yu, H. Q., Yang, B., et al. (2016). Seasonal variation in ecosystem water use efficiency in an urban-forest reserve affected by periodic drought. Agric. For. Meteorol. 221, 142–151. doi: 10.1016/j.agrformet.2016.02.013
Xu, Z. W., Zhu, Z. L., Liu, S. M., Song, L. S., Wang, X. C., Zhou, S., et al. (2021). Evapotranspiration partitioning for multiple ecosystems within a dryland watershed: seasonal variations and controlling factors. J. Hydrol. 598:126483. doi: 10.1016/j.jhydrol.2021.126483
Yu, L. Y., Zhou, S., Zhao, X. J., Gao, X. D., Jiang, K. T., Zhang, B. Q., et al. (2022). Evapotranspiration partitioning based on leaf and ecosystem water use efficiency. Water Resour. Res. 58:e2021WR030629. doi: 10.1029/2021WR030629
Yuan, Y., Mu, Y., Deng, Y., Li, X., Jiang, X., Gao, S., et al. (2022). Effects of land cover and phenology changes on the gross primary productivity in an Artemisia ordosica shrubland. Chinese J. Plant Ecol. 46, 162–175. doi: 10.17521/cjpe.2020.0387
Yuan, W. P., Zheng, Y., Piao, S. L., Ciais, P., Lombardozzi, D., Wang, Y. P., et al. (2019). Increased atmospheric vapor pressure deficit reduces global vegetation growth. Sci. Adv. 5:eaax1396. doi: 10.1126/sciadv.aax1396
Zha, T. S., Barr, A. G., Kamp, G. V. D., Black, T. A., McCaughey, J. H., and Flanagan, L. B. (2010). Interannual variation of evapotranspiration from forest and grassland ecosystems in western Canada in relation to drought. Agric. For. Meteorol. 150, 1476–1484. doi: 10.1016/j.agrformet.2010.08.003
Zhao, F., Ma, S., Wu, Y., Qiu, L., Wang, W., Lian, Y., et al. (2022). The role of climate change and vegetation greening on evapotranspiration variation in the Yellow River Basin, China. Agric. For. Meteorol. 316:108842. doi: 10.1016/j.agrformet.2022.108842
Zhou, S., Yu, B. F., Zhang, Y., Huang, Y. F., and Wang, G. Q. (2016). Partitioning evapotranspiration based on the concept of underlying water use efficiency. Water Resour. Res. 52, 1160–1175. doi: 10.1002/2015WR017766
Keywords: climate change, evapotranspiration partitioning, evergreen needle forest, forest disturbance, mountain pine beetle, vegetation greenness index
Citation: Hao S, Jia X, Zhao H, Li X, Mu Y, Zha T, Liu P and Bourque CP-A (2024) Evapotranspiration and its partitioning during and following a mountain pine beetle infestation of a lodgepole pine stand in the interior of British Columbia, Canada. Front. For. Glob. Change. 7:1352853. doi: 10.3389/ffgc.2024.1352853
Edited by:
Qiang Li, Northwest A and F University, ChinaReviewed by:
Fubo Zhao, Xi'an Jiaotong University, ChinaYiping Hou, University of British Columbia, Okanagan Campus, Canada
Zhipeng Xu, Northeast Forestry University, China, in collaboration with reviewer YH
Copyright © 2024 Hao, Jia, Zhao, Li, Mu, Zha, Liu and Bourque. This is an open-access article distributed under the terms of the Creative Commons Attribution License (CC BY). The use, distribution or reproduction in other forums is permitted, provided the original author(s) and the copyright owner(s) are credited and that the original publication in this journal is cited, in accordance with accepted academic practice. No use, distribution or reproduction is permitted which does not comply with these terms.
*Correspondence: Xin Jia, xinjia@bjfu.edu.cn; Charles P.-A. Bourque, cbourque@unb.ca