Temporal analysis of the state of the Gbele Resource Reserve in the Upper West Region, Ghana
 Raymond Aabeyir
 Kenneth Peprah
 Amos Amponsah1
- 1Department of Geography, SD Dombo University of Business and Integrated Development Studies, Bamahu, Ghana
- 2Department of Environment and Resource Studies, SD Dombo University of Business and Integrated Development Studies, Bamahu, Ghana
Introduction: This paper assessed the changes in the forest cover of the Gbele Resource Reserve from 1990 to 2020. This provides a basis for strengthening management decisions to protect the resources in the Gbele Resource Reserve effectively.
Methods: Landsat images for 1990, 2000, 2010 and 2020 were obtained from the United States Geological Service site. They were processed and classified in the System for Earth Observation Data Access, Processing, & Analysis for Land Monitoring (SEPAL), a web-based cloud computing platform. The accuracy of the images was assessed using 50 ground-truth points obtained from the 3-5 meter spatial and near-daily temporal resolution planet satellite images from Norway’s International Climate and Forest Initiative (NICFI). Post classification change detection was used to analyse the changes in land cover from 1990 to 2000, 2000 to 2010 and from 2010 to 2020.
Results: The analysis revealed that the total forest area was 55273.2 ha. In 1990, 74.9 % of the reserve was open forest and 24.6 % was shrubs/grass. The open forest declined to 65.8 % in 2000 and further to 62.4 % in 2010 while the shrubs/grass cover increased to 35.7 in 2010. As of 2020, the forest increased to 73.6 % while the shrub/grass cover declined to 25.8 %.
Discussion: These changes could be attributed partly to widespread charcoal production in the fringe districts and rose wood harvesting in the early 2000s. charcoal production and rosewood logging have been livelihood sources for fringe communities. The ban on the harvest and exportation of rosewood after 2010 could partly explain the sharp increase in the open forest cover from 2010 to 2020. The changes in the extent of the reserve from 1990 to 2020 revealed that the reserve can vulnerable to excessive exploitation and can also be resilient if deliberate efforts are made to protect it. It is recommended that the fringe district and municipal Assemblies should strengthen the enforcement of the ban on the logging of the rosewood and trees in the reserve for the production of charcoal.
1 Introduction
Forests are important resources for the welfare of millions of the poor and the marginalized in Africa, and if they are effectively managed, they could improve livelihoods and the quality of life in the continent and facilitate the achievement of the Sustainable Development Goals (SDGs) (Center for International Forestry Research, 2005; Oyewole et al., 2019). Forests play a role pivotal in greenhouse gas emission reduction and climate change adaptation and mitigation and are central to the attainment of SDG 13 since 77% of the carbon stored in vegetation exists within forests, and 39% of the carbon stored in soil occurs underneath the forest cover (Oyewole et al., 2019).
Besides, forests contribute to poverty reduction, food security, improved healthcare and shelter (African Natural Resources Centre, 2018). Thus, the forests are capable of playing a significant role in achieving SDGs 1 and 8, which emphasize livelihood improvement, employment opportunities and poverty alleviation (Oyewole et al., 2019). This is because over 90% of people living in extreme poverty depend on forests for their livelihood (Oyewole et al., 2019). For instance, it is estimated that Uganda’s forest reserves could generate income of more than US$ 100 million a year while the Kenya forests are estimated to provide subsistence worth more than $100 million a year to more than a quarter of the population (Emerton, 2001).
Although Ghana is making efforts toward achieving the environmental-related SDGs through policies such as Greening Ghana, Planting for Food and Jobs and the forest sector improvement policies, a lot of burden is exerted on existing forests and woodlands for livelihood adaptation against climate change. These have contributed to the poor performance of the country in the global environmental performance assessment. Ghana is ranked 170 out of 180 countries in the 2022 Environmental Performance Index (Wolf et al., 2022). Comparatively, Ghana was ranked 109 out of 163 countries in 2010 (MEST, 2012) and this shows that the country’s environment has deteriorated compared to its global peers.
Amankwah (2012) observed that the northern part of Ghana is gradually experiencing degradation of vegetation cover, particularly areas where charcoal production is rampant. This has the potential of reversing the efforts of the Ghana government to achieve the environmental-related SDGs. These negative effects on the vegetation cover of the country have contributed to the deteriorating environmental situation in the country. Parts of the woodlands in the Upper West Region (UWR) of Ghana are gradually turning into grassland, which could result in desertification in the long term if the trend continues (Amankwah, 2012; Tengapoe et al., 2023). Afriyie et al. (2021) also observed that charcoal production has severe impacts on biodiversity in protected areas including the Gbele Resource Reserve and recommended that management planning should deliberately include mechanisms to detect the charcoal production activity and its effects on protected areas.
The Forestry Commission’s 2021 inventory of rosewood across the country reported a 50% reduction in total stem numbers compared to the 2013 estimate. In the case of the rosewood, concerns were raised over excessive illegal logging, leading to intermittent bans on the felling and trade of rosewood starting in 2012. These raise questions about the impacts of these activities on the reserve and its real state, leading to arguments that management’s efforts to conserve the flora of the Gbele Resource Reserve are ineffective.
A number of studies (Yahaya and Venkateswar, 2016; Osumanu and Atia, 2017; Afriyie et al., 2021) have addressed aspects of the bigger problem of the Gbele resource Reserve. Yahaya and Venkateswar (2016) questioned the effectiveness of modern institutions in conserving the flora of the Gbele Resource Reserve in the Upper West Region of Ghana and concluded that the institutions were ineffective in trying to accomplish the goal of nature conservation. Osumanu and Atia (2017) investigated the role of communities in the management of the Gbele Reserve and concluded that communities were constrained in participating in effectively managing resource reserves and were not involved in the sharing of direct economic benefits. Afriyie et al. (2021) assessed the management effectiveness of three protected areas in Ghana, including the Gbele Resource Reserve concluded that the selected protected areas faced intense external pressures and threats from human activities which were deeply influenced by the macro-economic and social environments of the country. While these aspects are relevant for sustaining the resource reserve, no long-term land cover analysis has been conducted on the reserve to ascertain the forest cover status and substantiate such arguments. This study assessed the state and changes in the land cover of the Gbele Resource Reserve from 1990 to 2020. This is necessary because the wild resources in the reserve depend on the vegetation for habitation and food. The assessment is equally necessary amid the increasing demand for charcoal, rosewood and fertile land for crop farming in the fringe communities of the reserve, which exerts pressure on the reserve. For instance, Jachmann et al. (2011) observed that the majority of the protected areas were becoming islands surrounded by people and farmlands, with average densities of 43 people/km2 in the savanna areas. The reserve is also part of the network of corridor for the movement of wildlife from The Nazinga Reserve in Burikina Faso to the Mole National Park in Ghana. A degradation of the Gbele Resource Reserve would limit the movement of wildlife as they would be exposed to attacks.
2 Methodology
2.1 Description of the study area
The Gbele Resource Reserve (GRR) is located in the Upper West Region of Ghana and covers an area of 565 km2. It is located between latitudes 10° 20’ N and 10° 44’ N and betwen longitudes 2° 18’ W and 2° 10’ W (Figure 1). It was acquired and gazetted in 1975 to protect plants and wildlife in the area (Acheapong, 2001). The GRR lies within three political administrative districts in the Upper West Region: Sissala West, Daffiama Bussie-Issa, and Wa East Districts (Afriyie et al., 2021).
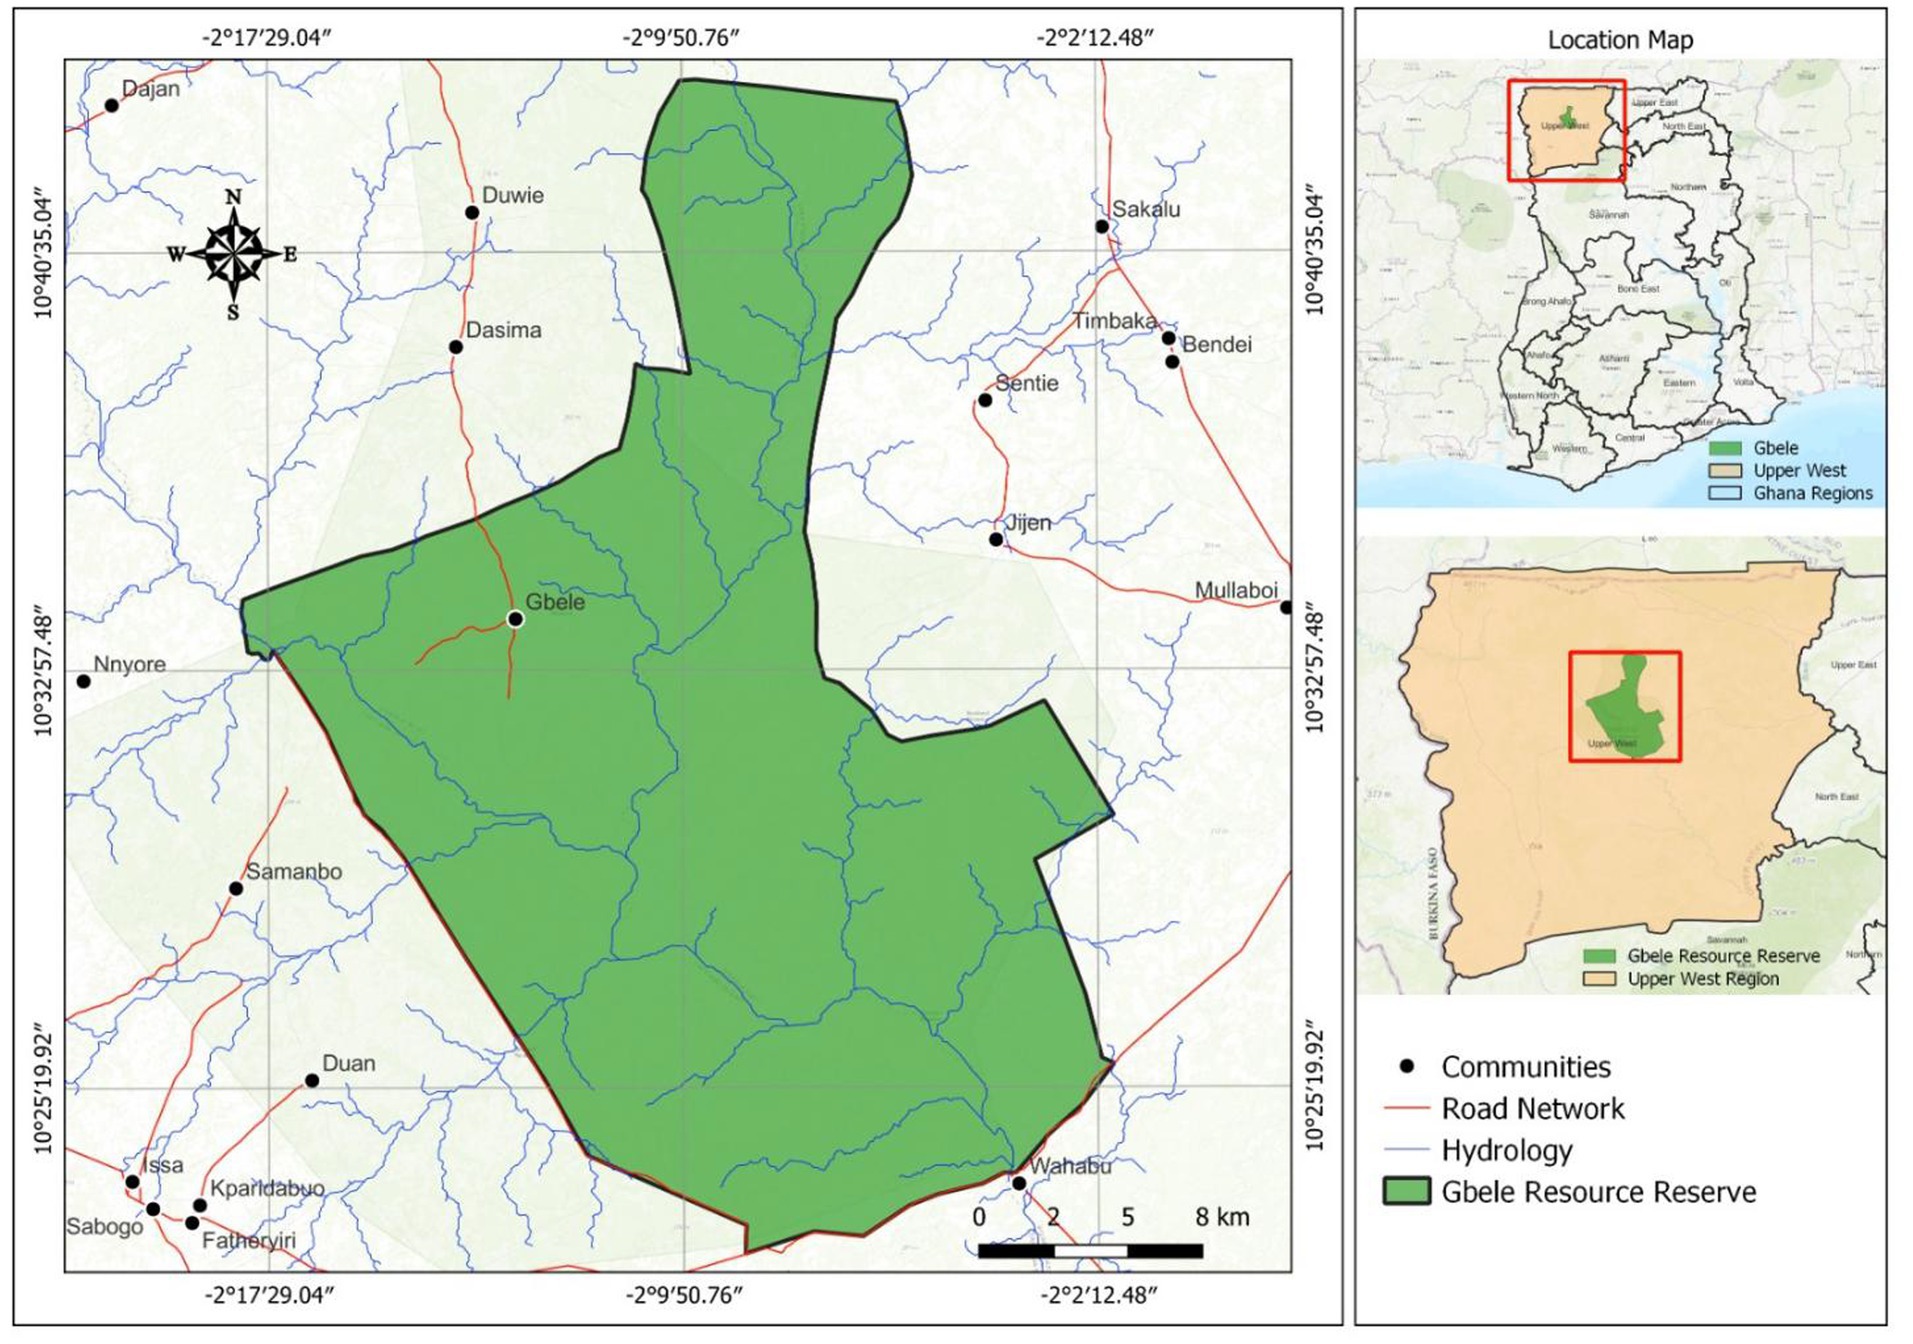
Figure 1. The Gbele Resource Reserve. Source: Authors’ Construct, (2024) based on ESRI ArcGIS online Topographic Basemap.
It has a typical Guinea Savanna vegetation dominated by Burkea africana, V. paradoxa, Parkia biglobosa, Terminalia spp., P. erinaceus, and grasses such as Hyparrhenia spp. and Pennisetum spp. The common mammals are Olive baboon Papio anubis, Patas monkey, King colobus Colobus polykomos, Roan antelope Hippotragus equinus, Bushbuck Tragelaphus scriptus, Waterbuck, Oribi, and Common warthog Phacochoerus africanus. It also contains a number of endangered wildlife species namely, Panthera leo, Loxodonta africana, Cercopithecus p., Syncerus caffer, Kobus sp. and Neotragus pygmaeus.
The Gbele community is the only community that existed in the reserve at the time it was gazetted (Acheapong, 2001) but Bouché (2007) reported that two communities were in the reserve as of 2007. It is part of the protected areas network in northern Ghana and the Western Wildlife Corridor for the migratory route for elephants the from Nazinga Game Ranch in Burkina Faso through Gbele Resource Reserve to Mole National Park (World Bank, 2014).
Charcoal production and wood logging are brisk businesses in the fringe communities of the reserve. These activities could have a negative influence on the state of the forest and undermine the purpose for which it was created. In recent years, the reserve came under pressure as a source of rosewood (Pterocarpus erinaceus) for export and wood for charcoal production.
2.2 Description of data
Cloud-free Landsat satellite images of the Gbele Resource Reserve for 1990, 2000, 2010, and 2020 were downloaded from the United States Geological Survey site (http://earthexplorer.usgs.gov). The reserve falls within row 053 and path 195 (see Table 1). To minimize the effect of seasonal variation in the different Landsat image tiles, all images were acquired for the period between October and November, the dry season.
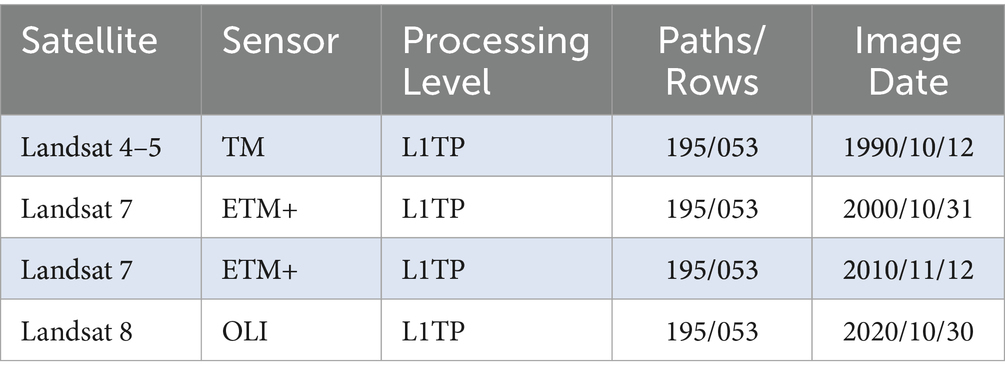
Table 1. Satellite image characteristics and their date of acquisition.
Four land cover classes were considered to reflect the dominant land cover of the Savannah ecological zone where the study site is located following the IPCC, 2022 classification scheme. The four classes include open woodland, shrub/grassland, bare land and water body (Table 2).
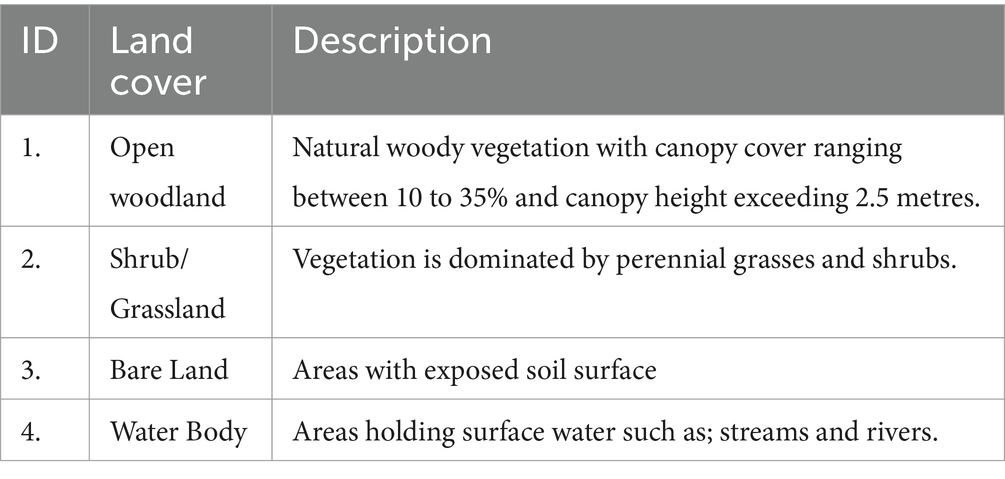
Table 2. Land cover description.
2.3 Satellite image pre-processing, classification, and analysis
The image pre-processing and analysis were performed in the System for Earth Observation Data Access, Processing, and Analysis for Land Monitoring (SEPAL) environment, a web-based cloud computing platform. The satellite images were corrected for errors due to atmospheric and radiometry effects. Varying sun angles and surface reflectance changes were corrected in SEPAL. The radiometric corrections were performed using the “use scenes atmospherically corrected surface reflectance (SR)” and “correct for bidirectional reflectance distribution function (BRDF) effects” in SEPAL.
Fifty (50) ground truth points were collected from Norway’s International Climate and Forest Initiative (NICFI) planet satellite base maps for each of the predetermined land cover classes. NICFI planet satellite base maps are of spatial resolution of 3-5 m and near-daily temporal resolution and facilitated the extraction of ground truth data. These points were used to train the Random Forest algorithm in SEPAL based on the spectral reflectance of Landsat satellite images, and the NICFI planet satellite base maps.
Random Forest Algorithm (RFA)was used to run a supervised classification of the images in SEPAL. It categorized and grouped pixels based on their likelihood of belonging to each of the land cover classes. The RFA is a machine learning technique that is increasingly used to classify images (Horning, 2010). RFA is regarded as one of the most extensively utilized algorithms for land cover classification (Jin et al., 2018). According to Xia et al. (2017), RFA offers several advantages, which include effective handling of outliers and noisy datasets, good performance with high-dimensional and multi-source datasets, higher accuracy compared to other popular classifiers, and enhanced processing speed by selecting important variables. The classified images were exported to ArcMap for the calculation of the extent of the various land cover types and the composure of the maps.
2.4 Accuracy assessment
Accuracy assessment is a tool used to evaluate the classification approach to determine whether the classified map conforms to reality based on the corresponding reference data from the ground control points (Manisha et al., 2012; Abbas and Jaber, 2020). Accuracy assessment was performed using the confusion matrix to compare the relationship between classified thematic and the reference points from ground-truthing. A total of 200 ground truth points were used to assess the accuracy of the classified image. The aspects of the accuracy assessed were producer accuracy, user accuracy, overall accuracy and kappa statistics.
2.5 Change detection
A two-date post-classification change detection was carried out to assess the landscape transition over time. Change detection analysis helps to reveal the inter-class changes between the various years and the land cover transitions. This assessment was done using the change detection algorithm in the Semi-Automatic Classification in QGIS. Final land cover maps and change maps were composed in the ArcMap version 10.8 environment.
The gain, loss and swap for each land cover type were computed using Equations 1, 2 as in Huang et al. (2012) and Pontius et al. (2004) respectively.
3 Results and discussion
3.1 Land cover of the Gbele Resource Reserve
This section shows the vegetation cover that was present in the Gbele Resource Reserve specifically in the years 1990, 2000, 2010, and 2020. Figure 2 shows the spatial distribution of the land cover across the landscape. The open woodland dominated the north, north-eastern, eastern and south parts of the reserve in 1990, accounting for 75%. Shrubs and grass, which constituted 24.5%, dominated the western, north-western and south-western parts. By 2000, the shrubs had taken over the northern part with portions of the western parts recovered from shrubs to open woodland. Figure 3 shows the extent of the land cover classes in percentage. The woodland declined to 65.8% while the shrubs and grass area increased to 32.8% with noticeable bare land, covering about 1.4% of the reserve. In 2010, the open woodland not only declined in extent, but it was fragmented by shrubs and grass. The extent of open woodland reduced to 62.3% while the shrubs and grass increased to 35.7%. By 2020, the declining trend of the open woodland had reversed, and its extent appreciated to 73.6% while the shrubs and grass declined to 25.8%. The decline in the open woodland in the reserve from 1990 to 2010 is attributable to multiple factors, namely charcoal production in the fringe districts (Aabeyir et al., 2023), excess exploitation of rosewood in the middle and northern parts of the country and management issues (Yahaya and Venkateswar, 2016; Osumanu and Atia, 2017). For instance, Aabeyir et al. (2023) noted that the majority of the charcoal transported out of the region was produced at Hain, Zini, Jeffesi, Gwollu, which are fringe communities of the GRR and could have accounted for the decline in the woodland cover in the Reserve. As noted by Osumanu and Atia (2017), if the fringe communities do not enjoy economic benefits that accrue from the management of the Reserve, they will find ways to seek livelihoods from it.
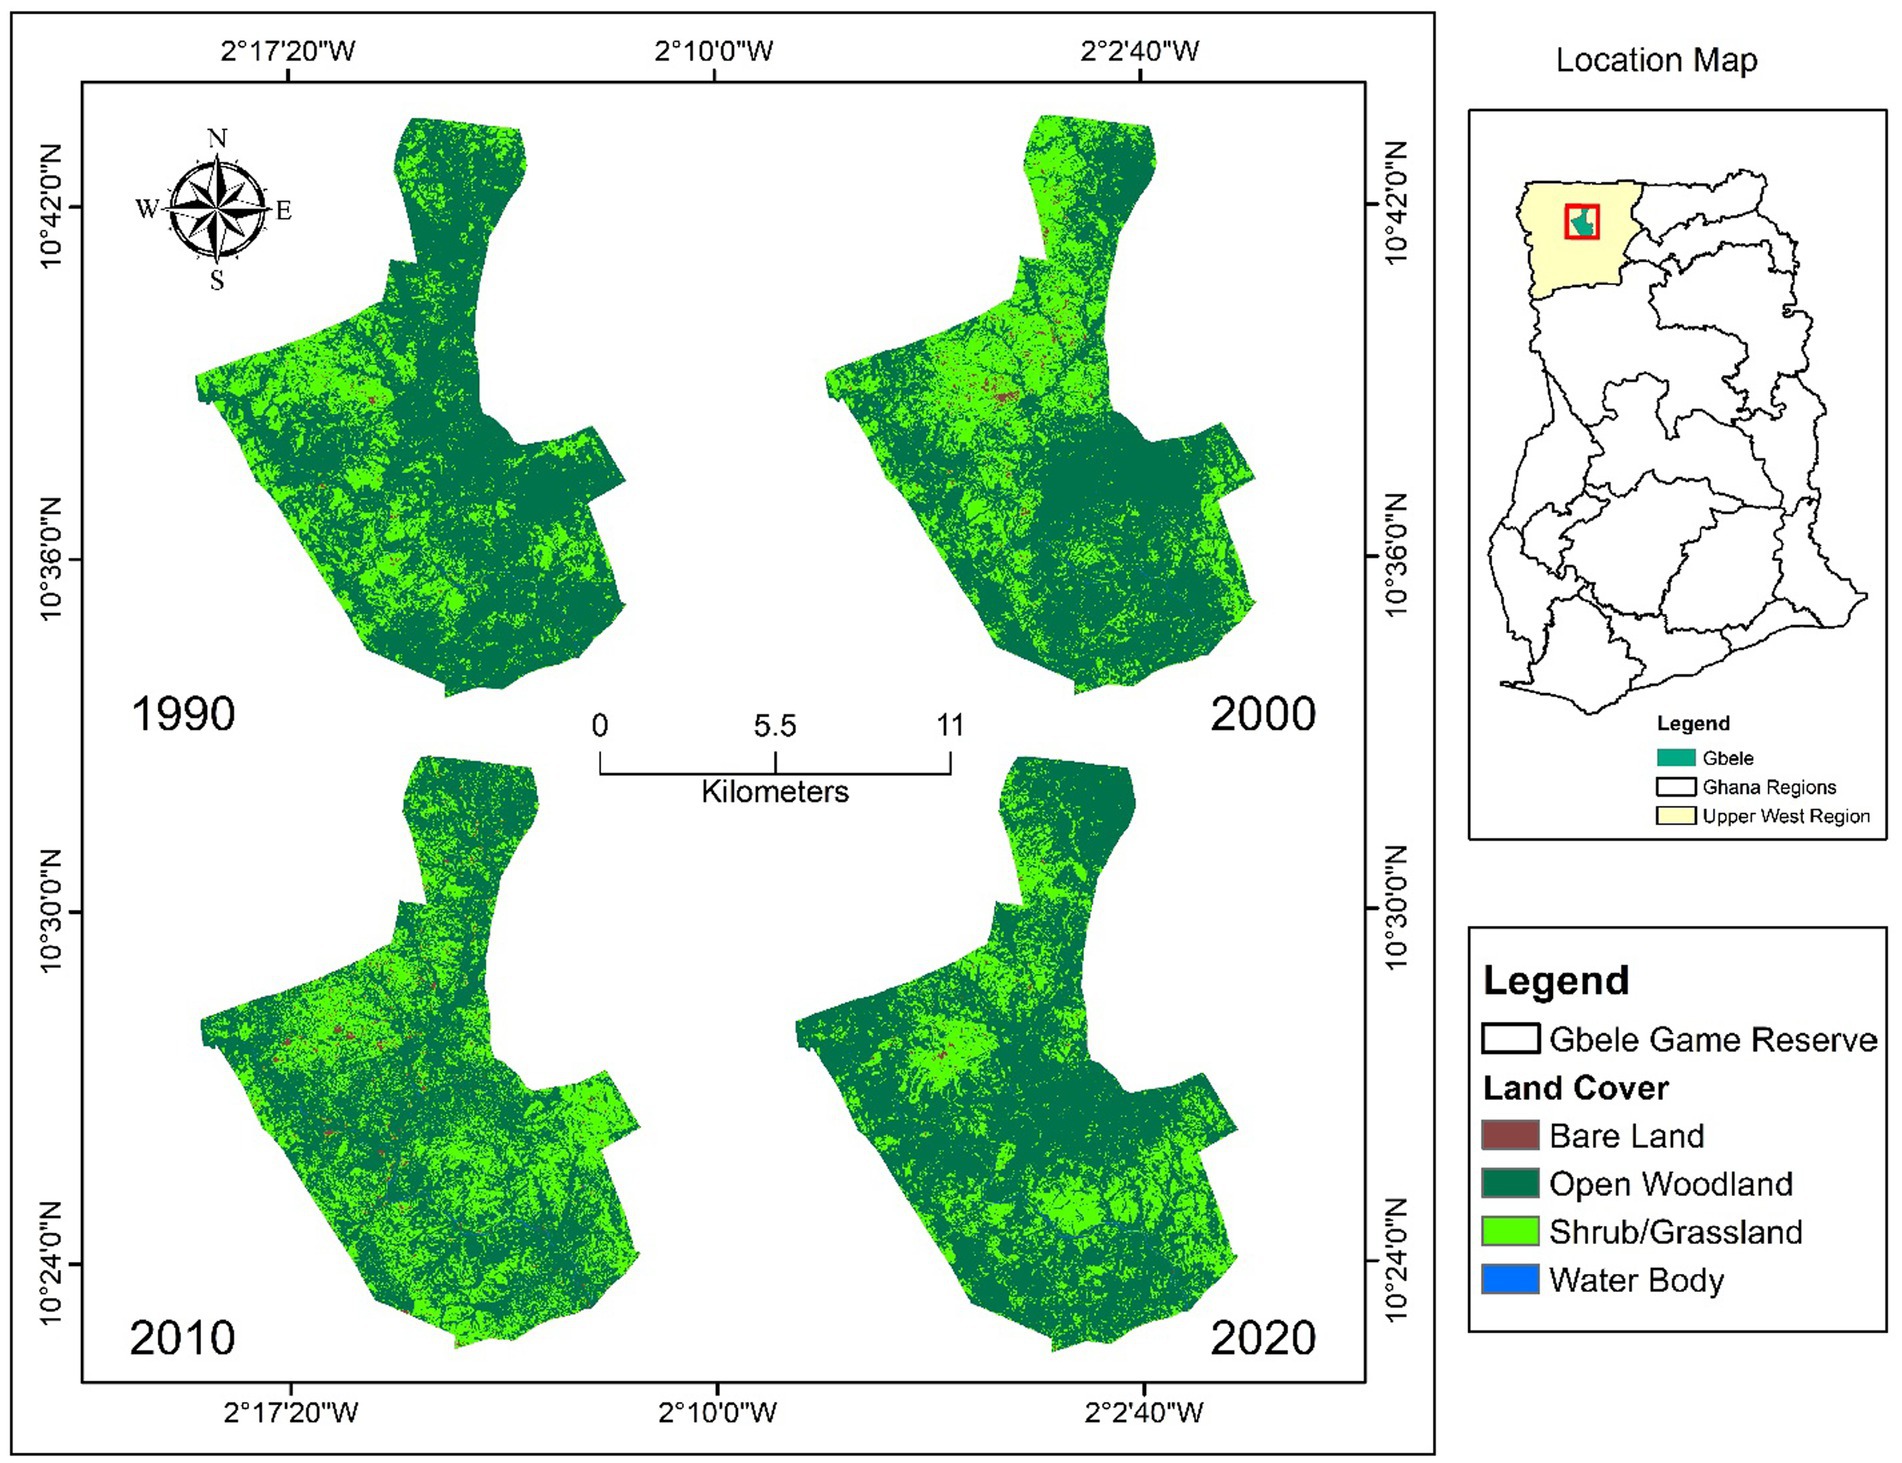
Figure 2. Spatial distribution of land cover types across the landscape of the Gbele Resource Reserve.
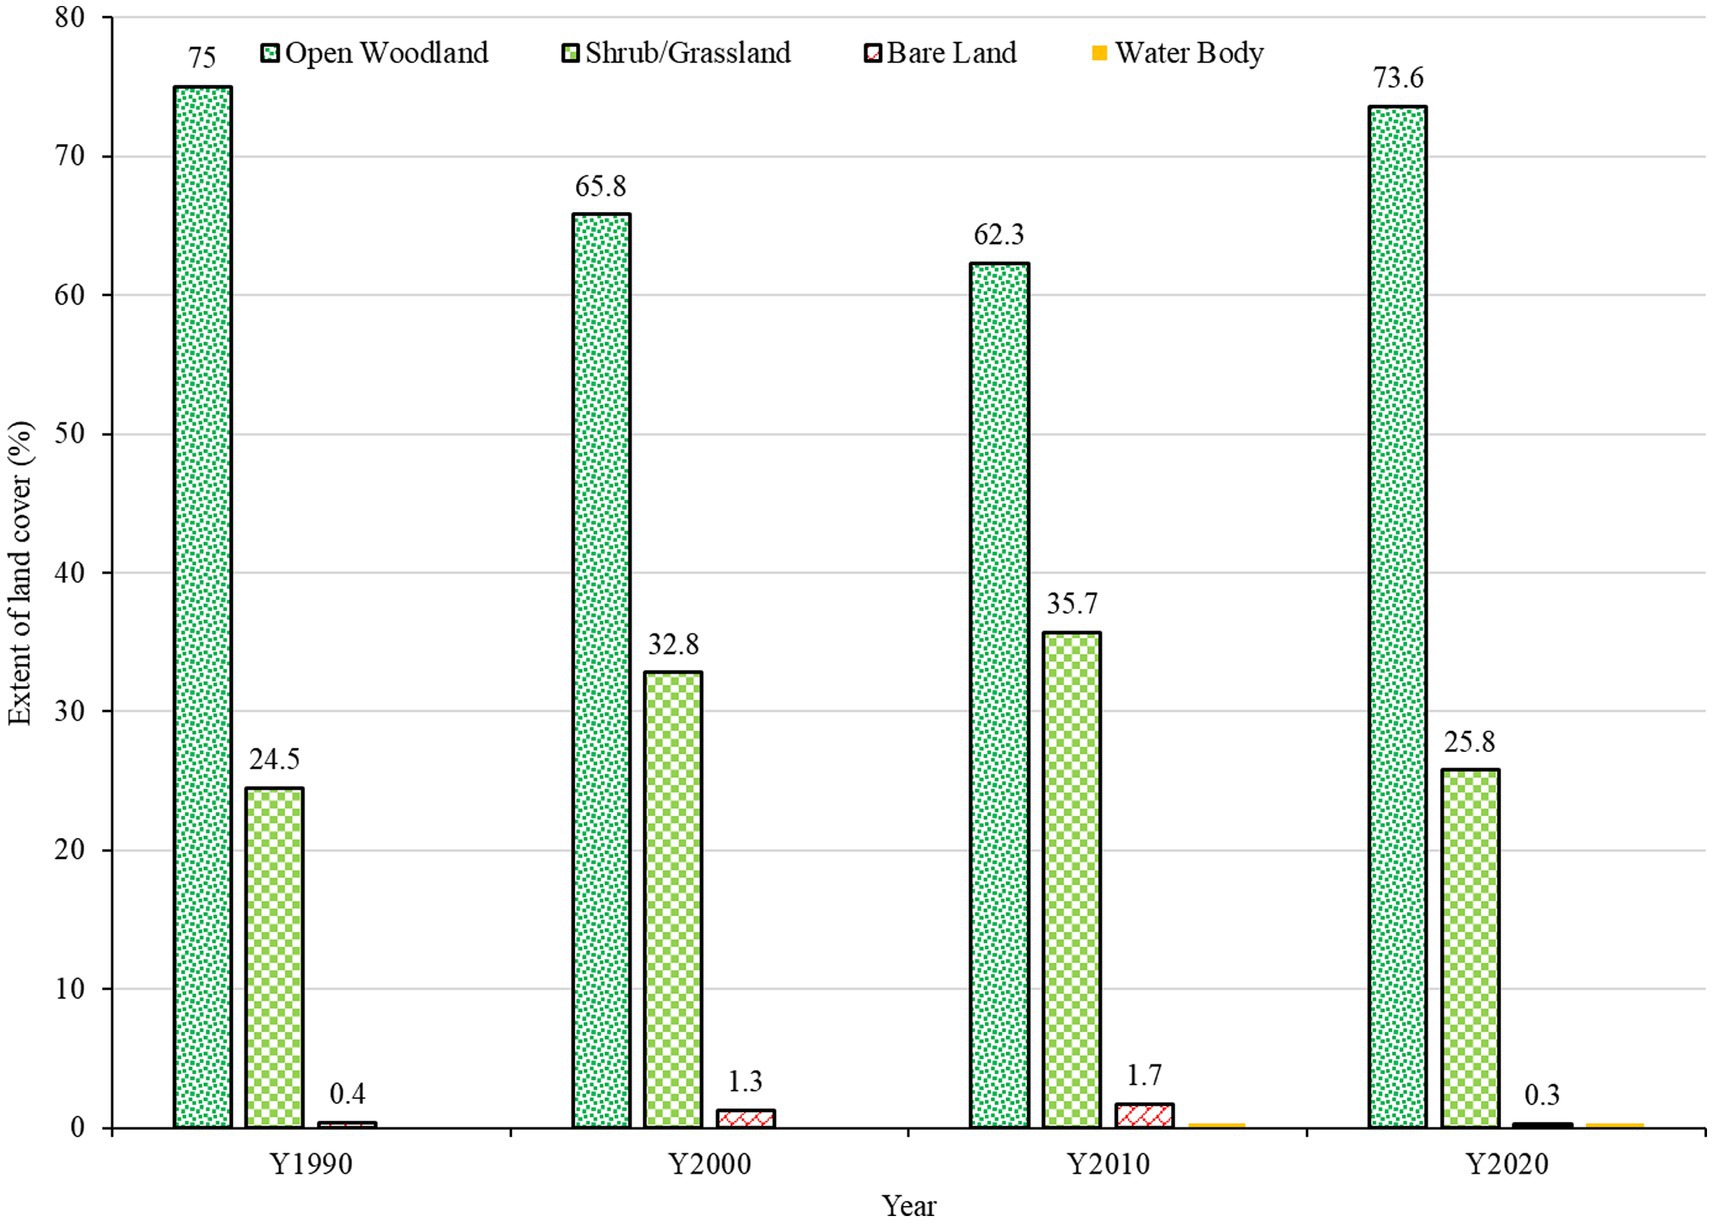
Figure 3. Changes in area of the land cover types from 1990 to 2020.
The recovery of the open woodland in the reserve could be due to the ban that was placed on the logging of rosewood by the Ghana Government in 2012. This is because, for a similar period (2011–2021), Tengapoe et al. (2023) reported a decline in woodland along the Black Volta corridor in the Nadowli District where there was no protection of the woodlands. The recovery is an indication that if the right management strategies are put in place, the vegetation of the Reserve can improve substantially. However, management of the Gbele Resource Reserve should not be complacent and neglect their responsibilities because forest fringe communities placed a greater premium on economic benefits than other benefits and, do not appreciate intangible benefits so much since they did not enhance their economic livelihood conditions (Favretto et al., 2021). This suggest that they could re-exert pressure on the reserve for their livelihood needs.
3.2 Accuracy of the maps
Post-classification accuracy assessment was performed to evaluate the relationship between classified land cover and the reference points from the ground truthing. The accuracy assessments were done using the confusion matrix to compute the overall accuracy, and kappa coefficient (Table 3). The kappa coefficient, also known as Cohen’s kappa is a statistical measure to calculate the level of agreement or reliability of a land cover theme. The kappa coefficient has become a standard means of image classification accuracy assessment (Rwanga and Ndambuki, 2017). Kappa coefficient is interpreted as 0.8 < K < 1 means there is perfect agreement; 0.4 < k < 0.80 means there is moderate classification, and K < 0.4 means the agreement is not better than expected by chance (Emam, 1999; Jansen and Di Gregorio, 2004). This suggests that the classification results are satisfactory since the Kappa coefficient values are greater than 0.4.
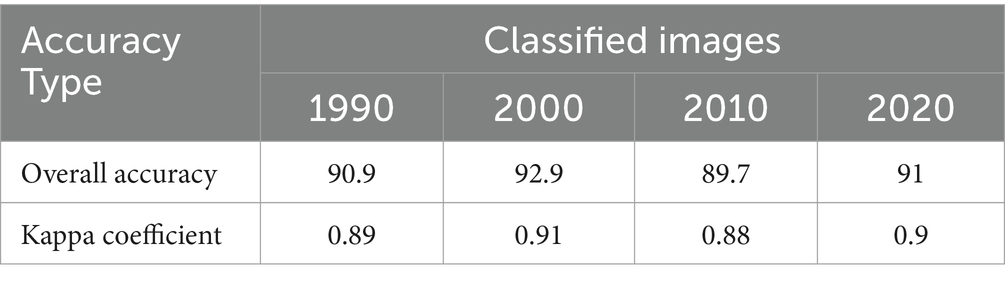
Table 3. Accuracy assessment results for the various classified images.
3.3 Land cover gains and losses
The temporal analysis of the gain and loss in the various land cover types over the different decades from 1990 to 2020 revealed significant lost in open woodland cover and significant gain in the shrub and grassland covers for the first decade. The open forest lost about 9% of its cover between 1990 and 2010 while the shrub and grassland gained 8.2% of its cover in 1990 (Figure 4). The reverse occurred in the period from 2010 to 2020. The middle decade served as a recovery period for the open woodland. For the entire period from 1990 to 2020, the open woodland experienced a net loss of 1.3% while shrub and grassland experienced a net gain of 1.2% of its extent in 1990. This suggests as of 2020, the woodland did attain its cover in 1990 despite the significant gain it made from 2010 to 2020.
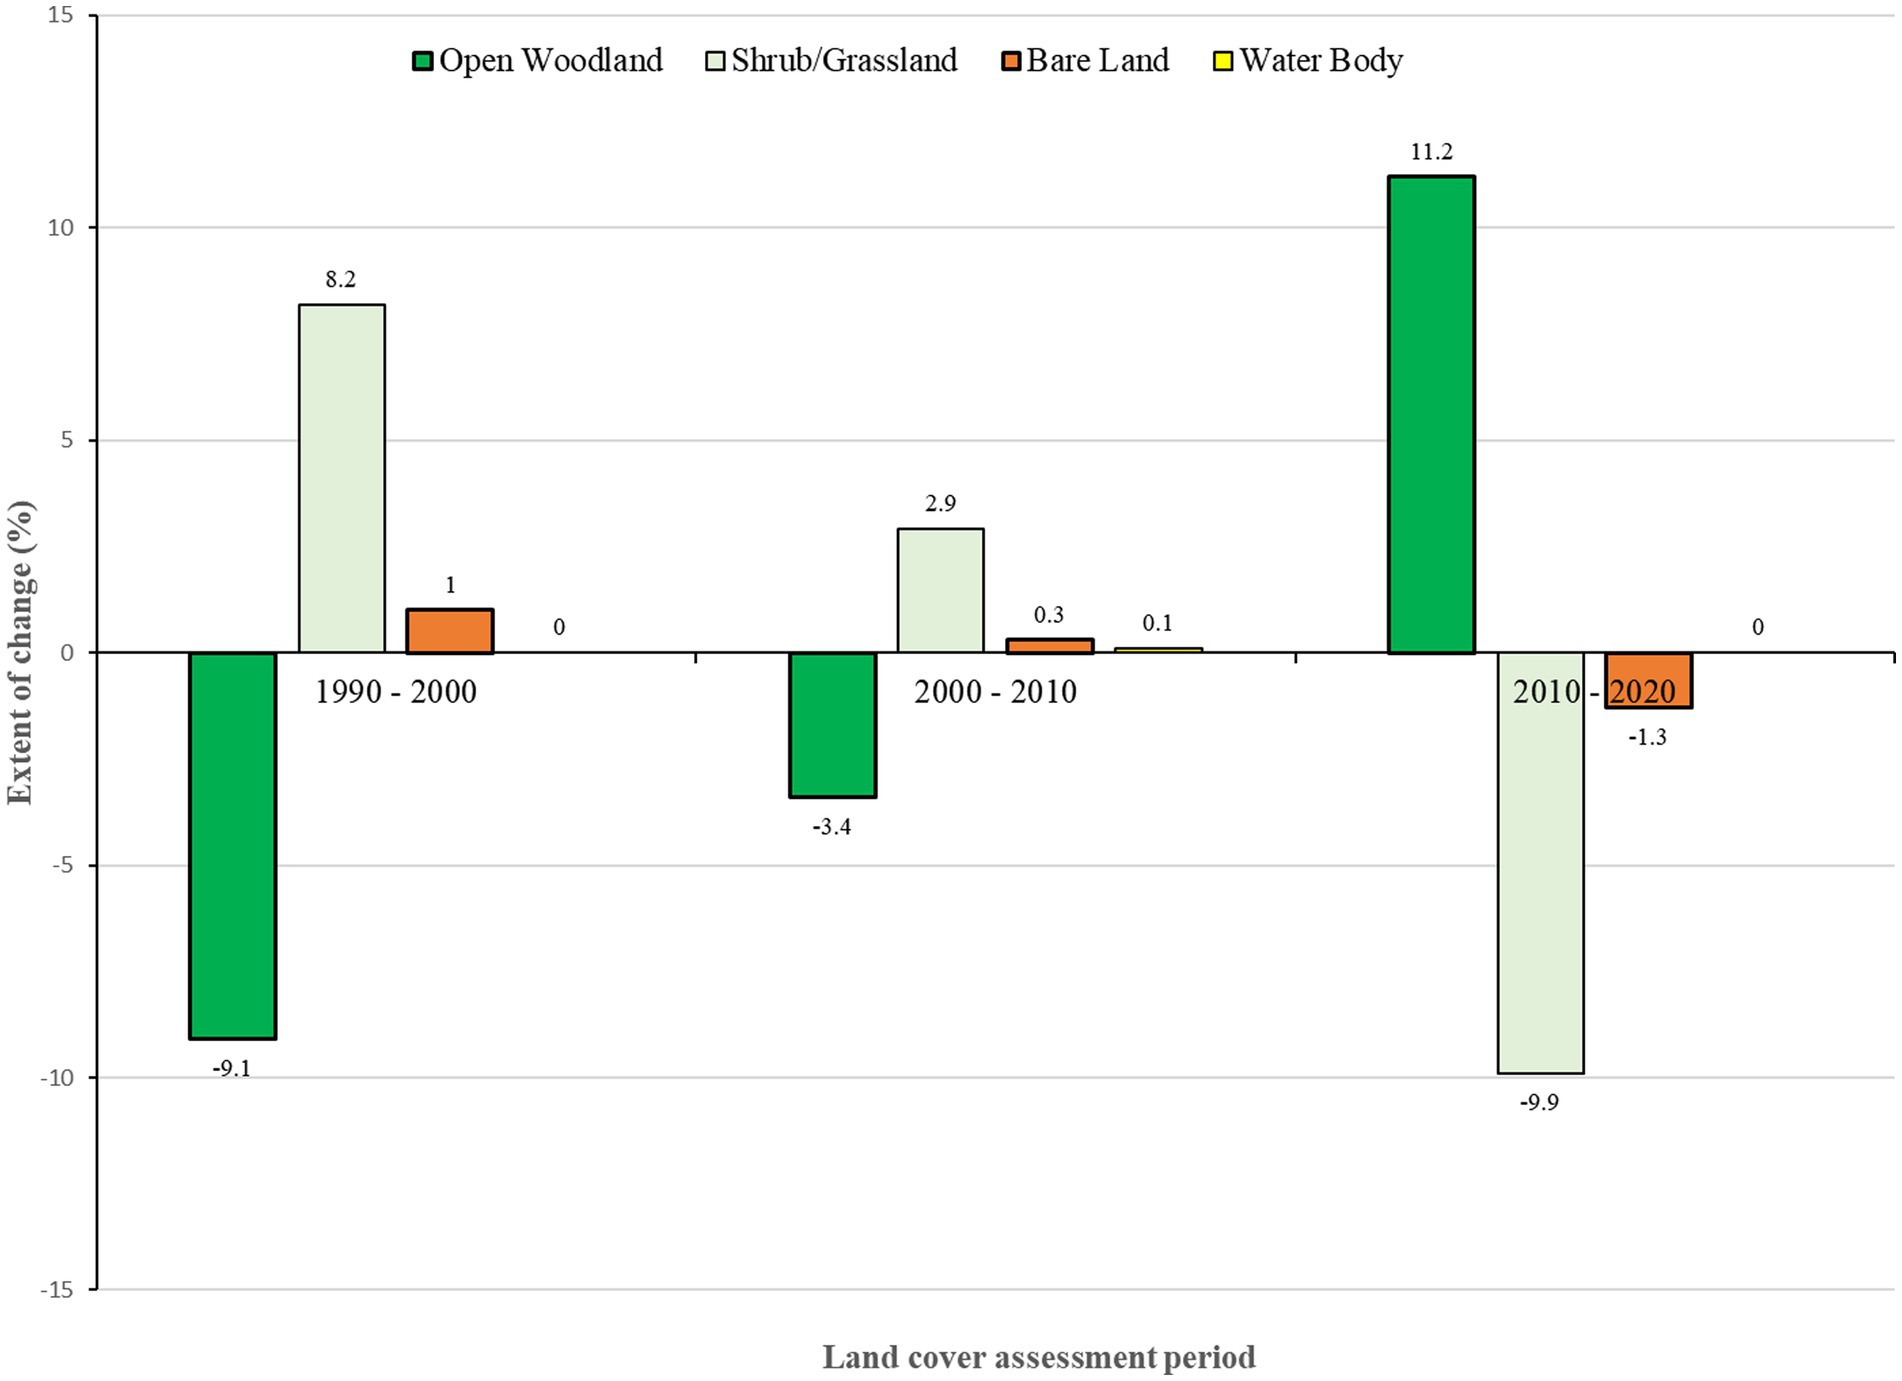
Figure 4. Land cover gain/loss in the Gbele Resource Reserve.
Negative land cover conversion has been identified as a serious threat to many protected areas and should be taken seriously in the management of protected areas. Farming and grazing contribute to the negative land cover conversion around the protected areas (UICN, 2010). In the Gbele Resource Reserve, Afriyie et al. (2021) identified logging, climate change, poaching, and grazing as the most threats to the management of the reserve. These threats to natural resource conservations still exist in the Gbele area could have contributed in no small way to decline in the overall open woodland cover in the resource reserve between 1990 and 2022. This is not surprising because the reserve is located in poverty prone area, where fringe communities resort to logging trees for charcoal production and for sale. For instance, the rosewood menace in the area is well underscored. Also, the reserve is situated in a fragile semi-arid area and the least stress on the reserve amplifies the effects of climate change on the reserve. Activities of nomadic fulbes do sometimes result in bushfires in an attempt to get fresh grass for their animals, the burn the dry grass in or around the reserve. Poachers sometimes burn the parts of the reserve so as to restrict wildlife in a particular area of the reserve where they can easily be poached. Group hunting, involving more than 50 hunters at a time, is a real threat as it takes only one or two people to initiate bush fires in reserve, which generally causes serious havoc to wildlife on an annual basis (Favretto et al., 2021).
As further noted by Afriyie et al. (2021), the effects of pressures and threats deepen with the lack of support from local communities, inadequate funding, and management resources. In the community resource protection, poverty and lack of transparency in benefit sharing are always contributor to lack of community support in resource reserve protection (see Osumanu and Atia, 2017).
3.4 Land cover transition within the Gbele Resource reserve from 1990 to 2020
The land cover transition maps are shown in Figure 5 while the extent of changes is presented in Table 4. In the period between 1990 and 2000 (light green), the main transition was the conversion of open woodland to shrub and grassland which occurred more in the northern part of the reserve.
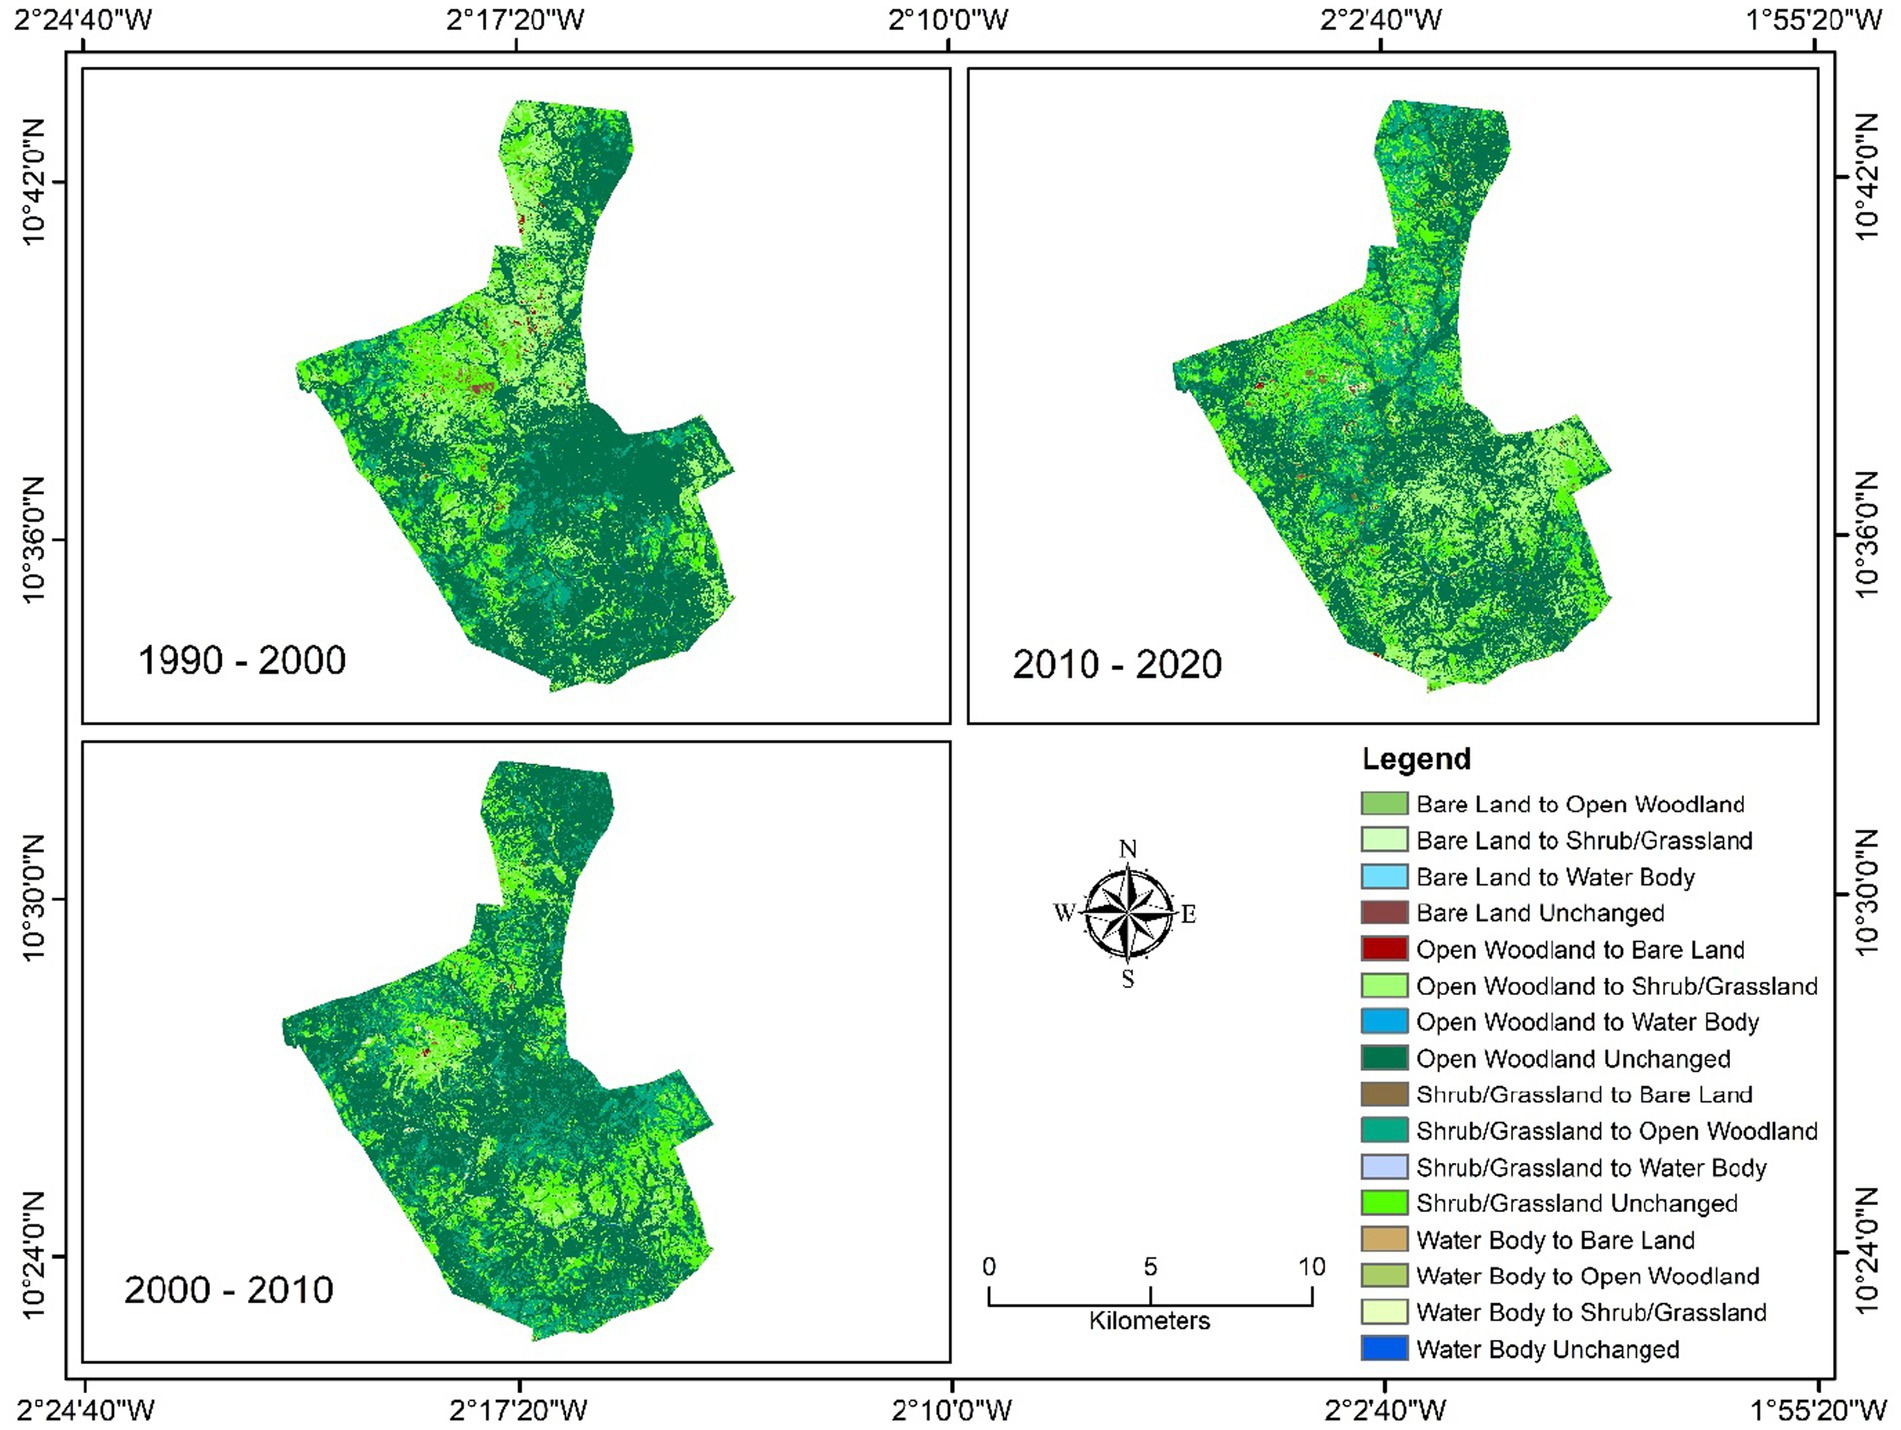
Figure 5. Spatial distribution of land cover changes across the landscape of the Gbele Resource Reserve.
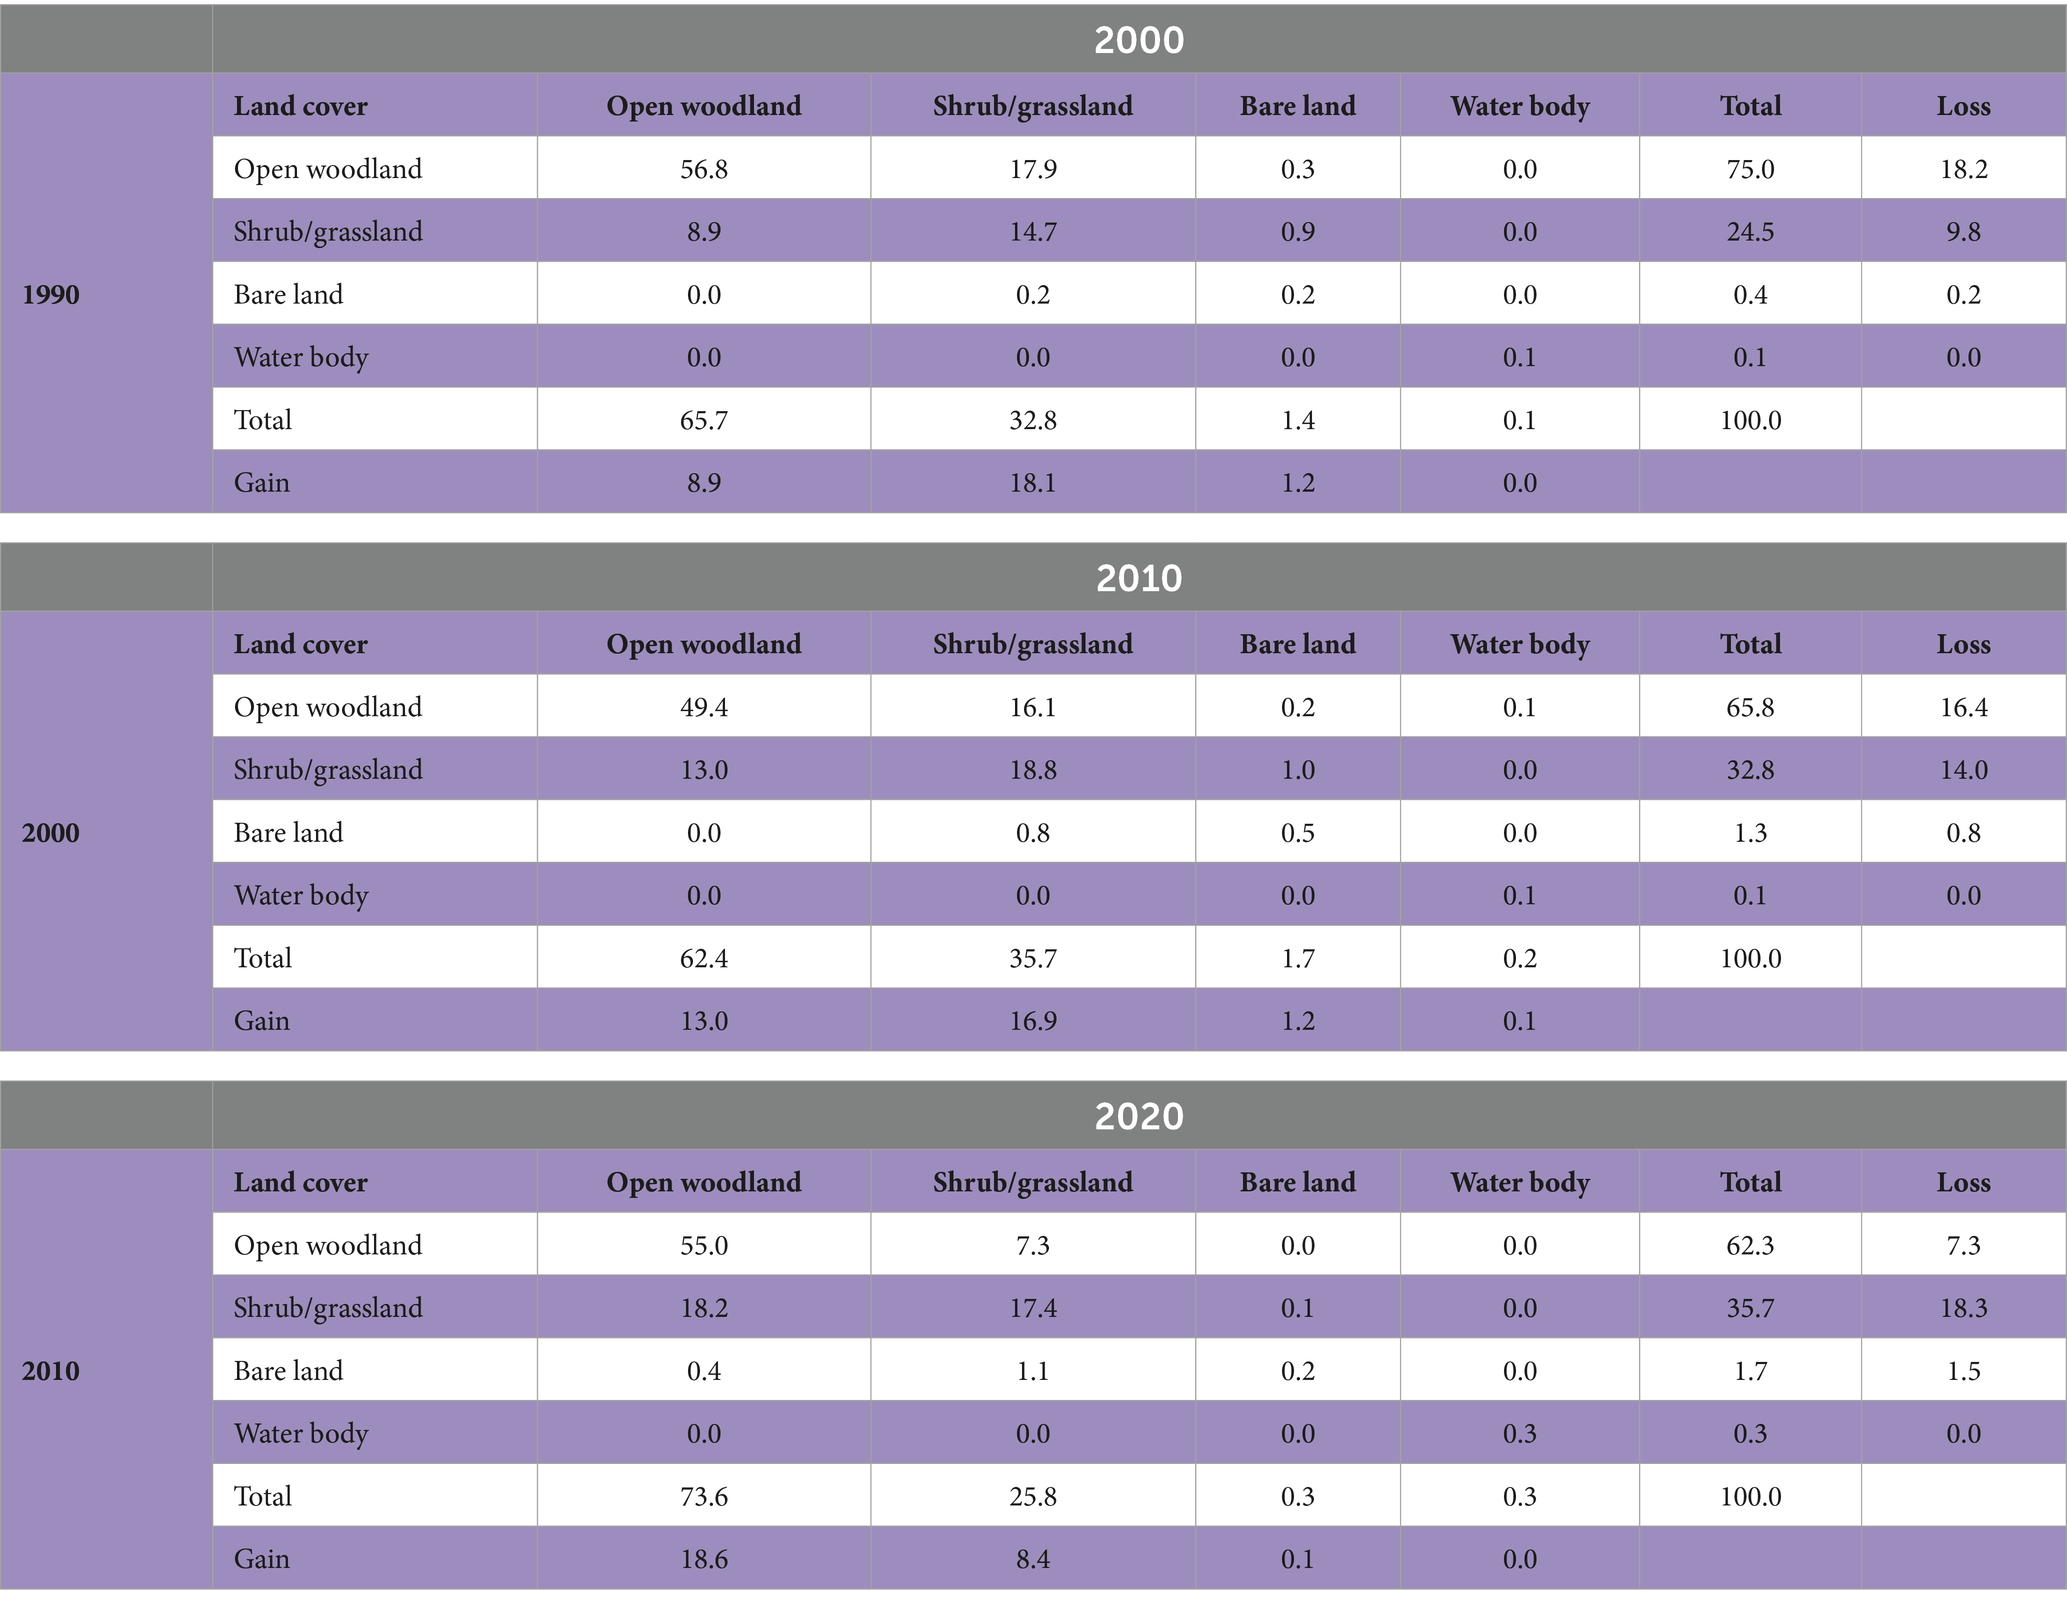
Table 4. Land cover transition matrix of the Gbele resource reserve from 1990 to 2000, 2000 to 2020 and from 2010 to 2020.
4 Conclusion and recommendations
The paper assessed the dynamics in the land cover of the Gbele Resource Reserve from 1990 to 2020 to understand the influence of recent increases in the activities of charcoal production, rosewood logging and other anthropogenic pressures in the fringe districts on the Reserve. For the period from 1990 to 2010, the woodland cover decreased by 12.5% while the shrubs and grassland increased by 11.1%. However, the woodland cover increased by 11.2% from 2010 to 2020 and the shrubs and grassland decreased by 9.9%. This is an indication that the reserve is recovering from the pressures of illegal rosewood logging that the region experienced in the early 2000. It is also an indication that the ban on the logging of rosewood in the early 2010s could have positive effect of the state of the woodland cover. It is recommended that the fringe traditional authorities and the district assembles should tighten the enforcement of the ban on logging in the reserve.
Data availability statement
The raw data supporting the conclusions of this article will be made available by the authors, without undue reservation.
Author contributions
RA: Formal analysis, Methodology, Supervision, Writing – original draft. KP: Writing – review & editing. AA: Investigation, Writing – review & editing.
Funding
The author(s) declare that no financial support was received for the research, authorship, and/or publication of this article.
Conflict of interest
The authors declare that the research was conducted in the absence of any commercial or financial relationships that could be construed as a potential conflict of interest.
Publisher’s note
All claims expressed in this article are solely those of the authors and do not necessarily represent those of their affiliated organizations, or those of the publisher, the editors and the reviewers. Any product that may be evaluated in this article, or claim that may be made by its manufacturer, is not guaranteed or endorsed by the publisher.
References
Aabeyir, R., Aduku, R., and Soyire, M. (2023). “Threats of charcoal production and consumption in Ghana on climate change. Research and Development conference 2023” in Bridging the gap between applied research, policyformulation and implimentation, 17th -19th October 2023 (WA: SD Dombo University of business and Integrated Develoment Studies)
Abbas, Z., and Jaber, H. S. (2020). Accuracy assessment of supervised classification methods for extraction land use maps using remote sensing and GIS techniques. IOP Conference Series: in Materials Science and Engineering, 745, 012166. doi: 10.1088/1757-899x/745/1/012166
Acheapong, A. B. (2001). Environmental assessment of northern savanna biodiversity conservation project (NSBCP) Republic of Ghana.
African Natural Resources Centre (2018). How Forestry contributes to the African Development Bank’s High 5 Priorities: challenges and opportunities. African Development Bank Group, Abidjan, Côte d’Ivoire.
Afriyie, J. O., Asare, M. O., Danquah, E., and Pavla, H. (2021). Assessing the management effectiveness of three protected areas in Ghana. Conserv. Soc. 19, 13–24. doi: 10.4103/cs.cs_20_28
Amankwah, E. (2012). Desertification in the Upper West Region of Ghana: causes, processes and impact. Int. J. Technol. Manag. Res. 1, 88–93. doi: 10.47127/ijtmr.v1i1.15
Bouché, P. (2007). Northern Ghana elephant survey. Pachyderm no. 42 January–June 2007, IUCN, Burkina Faso. awheaton,+10.Pachy+42_Jan–June2007_RES_Bouche_Northern+Ghana.pdf
Center for International Forestry Research (2005). Contributing to Africa’s Development Through Forests: Strategy for Engagement in sub-Saharan Africa. Center for International Forestry Research CIFOR, Indonesia.
Emam, K. E. (1999). Benchmarking kappa: interrater agreement in software process assessments. Empir. Softw. Eng. 4, 113–133. doi: 10.1023/A:1009820201126
Horning, N. (2010). “Random forests: an algorithm for image classification and generation of continuous fields data sets” in Proceedings of the international conference on Geoinformatics for spatial infrastructure development in earth and allied sciences, vol. 911 (Osaka, Japan), 1–6.
Huang, J., Pontius, R. G. Jr., Li, Q., and Zhang, Y. (2012). Use of intensity analysis to link patterns with processes of land change from 1986 to 2007 in a coastal watershed of Southeast China. Appl. Geogr. 34, 371–384. doi: 10.1016/j.apgeog.2012.01.001
Jachmann, H., Blanc, J., Nateg, C., Balangtaa, C., Debrah, E., Damma, F., et al. (2011). Protected area performance and tourism in Ghana. S. Afr. J. Wildl. Res. 41, 95–109. doi: 10.3957/056.041.0112
Jansen, L. T. M., and Di Gregorio, A. (2004). “Land cover classification system: basic concepts, main software functions and overview of the ‘land system’ approach” in Developments in strategic landscape monitoring for the Nordic countries. ed. G. Groom (Copenhagen, Denmark: Nordic Council of Ministers of Environment).
Jin, Y., Liu, X., Chen, Y., and Liang, X. (2018). Land-cover mapping using random Forest classification and incorporating NDVI time-series and texture: a case study of Central Shandong. Inter. J. Remote Sens. 39, 8703–8723. doi: 10.1080/01431161.2018.1490976
Manisha, B., Chitra, G., and Umrikar, N. (2012). Image classification tool for land use/ land cover analysis: a comparative study of maximum likelihood and minimum distance method. Int. J. Geo. Earth. Environ. 2012, 189–196.
MEST (2012). National assessment report on achievement of sustainable development goals and targets for rio+20 conference. Republic of Ghana, Accra.
Osumanu, I. K., and Atia, S. A. (2017). Collaboration and partnership in forest conservation: the role of communities in the management of the Gbele reserve in North-Western Ghana. Ghana. J. Geogr. 9, 91–124.
Oyewole, S. O., Ishola, B. F., and Aina-Oduntan, O. A. (2019). Maximizing the Role of African Forest for Climate Change Mitigation and Socioeconomic Development. World News Nat. Sci. 27, 11–21.
Pontius, G. R. Jr., Shusas, E., and McEachern, E. (2004). Detecting important categorical land changes while accounting for persistence. Agric. Ecosyst. Environ. 101, 251–268. doi: 10.1016/j.agee.2003.09.008
Rwanga, S. S., and Ndambuki, J. M. (2017). Accuracy assessment of land use/land cover classification using remote sensing and GIS. Int. J. Geosci. 8, 611–622. doi: 10.4236/ijg.2017.84033
Tengapoe, K., Baddianaah, I., and Agyemang, I. (2023). Anthropogenic induced land use land cover dynamics of the black Volta River corridor in North-Western Ghana, 2011-2021. Trees Forests People 14:100449. doi: 10.1016/j.tfp.2023.100449
UICN (2010). Parks and reserves of Ghana: management effectiveness assessment of protected areas. Ouagadougou, BF: UICN/PACO.
Wolf, M. J., Emerson, J. W., Esty, D. C., de Sherbinin, A., Wendling, Z. A., et al. (2022). 2022 Environmental Performance Index. New Haven, CT: Yale Center for Environmental Law and Policy. epi.yale.edu.
World Bank (2014). Project paper on a proposed additional grant from the global environment facility trust fund to the republic of Ghana for a sustainable land and water management project, report no: PAD978. Environment, natural resources, water and disaster risk management (AFTN3), Western Africa 1 (AFCW1), Africa Region. Available at: https://www.food-security.net/wp-content/uploads/2021/05/PAD9780PAD0P09010Box385222B00OUO090.pdf
Xia, J., Falco, N., Benediktsson, J. A., Du, P., and Chanussot, J. (2017). Hyperspectral image classification with rotation random Forest via KPCA. IEEE J. Sel. Top. Appl. Earth Obs. Remote Sens. 10, 1601–1609. doi: 10.1109/JSTARS.2016.2636877
Keywords: land cover, change detection, Sepal, image classification, open woodland
Citation: Aabeyir R, Peprah K and Amponsah A (2024) Temporal analysis of the state of the Gbele Resource Reserve in the Upper West Region, Ghana. Front. For. Glob. Change. 7:1353852. doi: 10.3389/ffgc.2024.1353852
Edited by:
Arun Jyoti Nath, Assam University, IndiaReviewed by:
Sumit Chakravarty, Uttar Banga Krishi Viswavidyalaya, IndiaKoushik Majumdar, Tripura University, India
Copyright © 2024 Aabeyir, Peprah and Amponsah. This is an open-access article distributed under the terms of the Creative Commons Attribution License (CC BY). The use, distribution or reproduction in other forums is permitted, provided the original author(s) and the copyright owner(s) are credited and that the original publication in this journal is cited, in accordance with accepted academic practice. No use, distribution or reproduction is permitted which does not comply with these terms.
*Correspondence: Kenneth Peprah, kpeprah@ubids.edu.gh