Carbon density and sequestration in the temperate forests of northern Patagonia, Argentina
 Gabriel A. Loguercio1,2
  Alois Simon3
  Ariel Neri Winter4
  Horacio Ivancich5
  Ernesto J. Reiter6
  Marina Caselli1,7
  Facundo G. Heinzle1,7
  Christoph Leuschner6
  Helge Walentowski3*
- 1Andean Patagonian Forest Research and Extension Centre (CIEFAP), Esquel, Argentina
- 2Department of Forestry, Faculty of Engineering, National University of Patagonia San Juan Bosco, Esquel, Argentina
- 3Faculty of Resource Management, HAWK University of Applied Sciences and Arts, Göttingen, Germany
- 4GIS and Remote Sensing, Department of Cartography, Institute of Geography, University of Göttingen, Göttingen, Germany
- 5Andean Forest Service (SFA) Rio Negro, El Bolsón, Argentina
- 6Department of Plant Ecology and Ecosystems Research, Albrecht von Haller Institute for Plant Sciences, University of Göttingen, Göttingen, Germany
- 7National Council for Scientific and Technical Research (CONICET), Esquel, Argentina
Introduction: Forests are a crucial part of the global carbon cycle and their proper management is of high relevance for mitigating climate change. There is an urgent need to compile for each region reference data on the carbon (C) stock density and C sequestration rate of its principal forest types to support evidence-based conservation and management decisions in terms of climate change mitigation and adaptation. In the Andean Mountains of northern Patagonia, extensive areas of temperate forest have developed after massive anthropogenic fires since the beginning of the last century.
Methods: We used a plot design along belt transects to determine reference values of carbon storage and annual C sequestration in total live (above- and belowground biomass) and deadwood mass, as well as in the soil organic layer and mineral soil (to 20 cm depth) in different forest types dominated by Nothofagus spp. and Austrocedrus chilensis.
Results: Average total carbon stock densities and C sequestration rates range from a minimum of 187 Mg.ha−1 and 0.7 Mg.ha−1.year−1 in pure and mixed N. antarctica shrublands through pure and mixed A. chilensis forests taller than 7 m and pure N. pumilio forests to a maximum in pure N. dombeyi forests with 339 Mg.ha−1 and 2.2 Mg.ha−1.year−1, respectively. Deadwood C represents between 20 and 33% of total wood mass C and is related to the amount of live biomass, especially for the coarse woody debris component. The topsoil contains between 33 and 57% of the total estimated ecosystem carbon in the tall forests and more than 65% in the shrublands, equaling C stocks of around 100–130 Mg.ha−1 in the different forest types.
Conclusion: We conclude that the northern Patagonian temperate forests actually store fairly high carbon stocks, which must be interpreted in relation to their natural post-fire development and relatively low management intensity. However, the current high stand densities of these forests may well affect their future carbon storage capacity in a warming climate, and they represent a growing threat of high-intensity fires with the risk of a further extension of burned areas in the future.
1 Introduction
Intact and sustainably managed forest ecosystems play a key role in climate change mitigation and adaptation as nature-based solutions (Tognetti et al., 2022) due to their ability to remove CO2 from the atmosphere through biomass production and C sequestration in wood and soil (Eggleston et al., 2006). Forest C reserves comprise the living biomass (above and belowground), the deadwood (standing and downed), and the organic layer and mineral soil (Eggleston et al., 2006; Janowiak et al., 2017). The carbon content per unit area for a given ecosystem or vegetation type is termed carbon density (Gower, 2003). There is a need of accurate data of the carbon storage capacities in the different compartments of forest ecosystems to improve our understanding of the key processes and mechanisms of the global carbon cycle (Pregitzer and Euskirchen, 2004; Houghton, 2005; Liu et al., 2015; Hoover and Smith, 2021). To meet each country’s emissions reduction commitments as part of the Nationally Determined Contributions to the Paris Agreement (2015) and through REDD+ projects and programs, it is necessary to have information on forest C stocks and flows in the different forest types (Gower, 2003; Bonan, 2008; Keith et al., 2009; McKinley et al., 2011; Perez-Quezada et al., 2023; Idoate-Lacasia et al., 2024). While a wealth of data is available for the northern hemisphere (Luyssaert et al., 2007; Klein and Schulz, 2011; Krüger et al., 2012; Pan et al., 2013; Janowiak et al., 2017; Glatthorn et al., 2018; Westfall et al., 2023), especially in the temperate forests of South America serious data gaps remain (Weber, 1999; Gayoso, 2001; Carmona et al., 2002; Klein et al., 2008; Schlegel and Donoso, 2008; Peri et al., 2010; González et al., 2022; Perez-Quezada et al., 2023).
In the course of forest dynamics, particularly after disturbances, succession processes have a large influence on C storage and sequestration due to species differences in net primary productivity, biomass accumulation and wood mass decomposition (Janisch and Harmon, 2002; Vargas et al., 2008; Conti and Díaz, 2012; Idoate-Lacasia et al., 2024). To battle climate change, management decisions should consider enhancing the C storage and sequestration potential of forests in biomass and soil (Gower, 2003; McKinley et al., 2011; Wang et al., 2020), and/or to increase the C storage in long-lived wood products, while favouring forest types less susceptible to massive disturbances (Perez Garcia et al., 2007; Janowiak et al., 2017). Stand-level inventories have elaborated the dependence of forest biomass C on tree diameter, height and stem density (e.g., Morin, 2015; Wu et al., 2015; Forrester and Bauhus, 2016), and tree age and time since disturbance (Pregitzer and Euskirchen, 2004; Idoate-Lacasia et al., 2024). In various forest ecosystems, it has further been observed that secondary successions that involve cohort dynamics are associated with particularly rapid C accumulation in biomass and soil (Janisch and Harmon, 2002). In turn, mature forests with high C stocks face the risk of being degraded to early-successional ecosystems such as shrublands (which can persist for many decades) as a result of large-scale disturbances such as high-intensity fires. In this context, we need a better understanding of changes in the carbon density between different woody vegetation types along forest succession trajectories. This knowledge is required to support forest management authorities in their efforts to establish more drought- and heat-resistant forests and to maximize the climate change mitigation potential of forests.
Forest soil can store large amounts of C especially in the organic layers and the mineral topsoil (Lal and Lorenz, 2012). In temperate forests, soil organic carbon (SOC) makes up as much as 60% of the ecosystem carbon stock (Lal, 2005; Scharlemann et al., 2014), and the long-term accumulation rates are comparable to those in boreal forest soils (Schlesinger, 1990). Most forest soils contain between 0.3 and 11.5% of SOC in the first 20 cm of the mineral soil (Perry, 1994), which, however, varies greatly in dependence on local natural and anthropogenic factors (Fernandez et al., 1999; Johnson and Curtis, 2001; Larionova et al., 2002). Fires and other natural disturbances reduce canopy cover and thus alter soil temperature and moisture, which affect respiration rates and SOC density especially in the organic layer (Lal, 2005). In addition, these processes influence through forest succession the quantity and quality of biomass carbon returned to the soil (Lal and Lorenz, 2012).
In northern Patagonia on the eastern slopes of the Andes Ridge, a mosaic of temperate forest types develops, with forest communities being determined by the combination of environmental gradients, mainly the reduction in west-east direction of precipitation and winter temperature, increasing rainfall and snowfall with elevation, and the prevalence of volcanic soils in a highly varied topography (Hueck, 1978; Dezotti, 2000; Kitzberger, 2012). These forests were strongly altered by massive anthropogenic fires at the beginning of the last century (Willis, 1914), initiating the formation of secondary forests which, depending on the site, density of resprouting species and seed sources of surviving trees, evolved in the course of successional processes. These include pure and mixed shrublands of Nothofagus antarctica (G. Forst.) Oerst, pure and mixed Austrocedrus chilensis (D.Don) Pic-Serm. & Bizzarri and Nothofagus dombeyi (Mirb.) Oersted forests, while at high elevations, cold-adapted pure Nothofagus pumilio (Poepp. & Endl.) Krasser forests are growing (Veblen and Lorenz, 1987; Kitzberger and Veblen, 1999; Veblen et al., 2003; Gowda et al., 2012, 2023; Tiribelli et al., 2018). Despite the ecological and economic importance of these forests, their C stock densities and C sequestration rates, as well as alteration in C sink strength with change between forest types, are still not well known.
In light of the temperature increase and precipitation reduction predicted for the Patagonian region in future (Villalba et al., 2003), the frequency and intensity of forest fires is expected to increase (Seidl et al., 2017; Kitzberger et al., 2022). The ensuing conversion of mature forests to earlier successional stages, such as N. antarctica and mixed shrublands, characterized by more fire-prone (pyrophytic) vegetation due to the accumulation of fine woody debris, would trigger a self-enforcing process leading to more frequent wildfires (Mermoz et al., 2005; Paritsis et al., 2015; Tiribelli et al., 2018; Kitzberger et al., 2022). Recurring disturbance events cause elevated CO2 emissions, ecosystem degradation and a reduced C storage capacity and C sink strength.
Quantifying the carbon density, the distribution of pools among ecosystem compartments, and the sequestration capacity of different northern Patagonian forest types will help informing forest management, restoration, and conservation strategies. These strategies should aim at increasing the ecosystem C sink strength through the build-up of C storage and the enhancement of C sequestration rate, thereby contributing significantly to local climate change mitigation and adaptation efforts (Janowiak et al., 2017; Kaarakka et al., 2021). The principal objective of this study was to establish reference values for carbon density in the main pools (living biomass, deadwood mass, and topsoil), and to give a preliminary estimate of the current C sequestration rate in the main temperate forest types of northern Argentinian Patagonia on the eastern slopes of the Andes. From this information it will be possible to characterize processes of C sequestration and release along trajectories of secondary forest development after fire. The following hypotheses were tested: (1) The carbon density in the biomass and the carbon sequestration rate increase with wood production along the post-fire successional series from mixed shrubland to tall forest communities. The N. pumilio stands, which are less affected by fires, show intermediate values in terms of C storage and sequestration. (2) In naturally developed unmanaged post-fire forests, the carbon density of deadwood is proportional to that of the living biomass, increasing along successional trajectories from shrublands to the most productive tall forests. (3) The carbon density of fine deadwood, which is linked in the form of fuel to fire risk, decreases with proceeding succession, with higher values in the shrublands and lower values in tall forest types. (4) The carbon stored in the soil organic layer and mineral topsoil increases toward later successional stages from shrubland to tall forest.
2 Materials and methods
2.1 Study area
The environment of northern Patagonia is mainly determined by a combination of climatic (precipitation and temperature), lithographic (volcanic ash deposits), and geomorphological factors (north–south orientation of the Andean Mountain ridge), locally modified by the rugged relief, soil conditions and land-use patterns, which generate characteristic vegetation mosaics (Hueck, 1978; Colmet Daage et al., 1988). On the western slopes of the Andes in Chile, species-rich wet forests (Valdivian temperate rainforests, VTR) grow at elevations of 100 to 1,400 m a.s.l., which receive 3,000 to 5,000 mm of precipitation per year (Lara et al., 2000). On the eastern slopes of the Andes in Argentina, rainfall decreases rapidly from 3,000–2,500 mm.year–1 to around 500 mm.year–1 over a distance of just 80 km (Karger et al., 2017), resulting in a distinct vegetation change along the West-East aridity gradient across the Chilean-Argentinean Andes. The climatic zonation and species turnover in West-East direction is characterized by a strong decline of VTR habitat elements and moisture-dependent species (such as epiphytes) that are replaced by various progressively drier forests, woodlands and shrublands, to finally give way to the semi-arid Patagonian steppe with scrub and grassland (Kitzberger, 2012). The longitudinal aridity gradient is interlinked with a pronounced elevational zonation and locally modified by relief factors, notably slope aspect (sunny vs. shady slopes) and locations on valley floors (depending on landscape configuration). The wet western part of the VTR Ecoregion shows a hydric elevational zonation with low-elevational laurophyllous and mid-elevational, microphyllous evergreen forests of N. dombeyi. This is in sharp contrast to the xeric elevational zonation at the eastern edge of the VTR Ecoregion, starting at mid-elevational levels with dry conifer forest dominated by the evergreen, xeric cypress A. chilensis (Dezotti, 2000). The transition zone between the western hydric and the eastern xeric sequence is occupied by mesic mixed forests of N. dombeyi and A. chilensis (Supplementary Figure 1). Toward high elevations, a continuous subalpine forest belt is dominated by the deciduous tropophyte N. pumilio. Toward the alpine timberline, where the main limiting factor is warmth, the deciduous species N. pumilio with its high morphological plasticity dominates, forming a variety of communities from high forest to dense krummholz scrub (Supplementary Figure 2) (Hildebrand-Vogel et al., 1990; Veblen et al., 2003; Tortorelli, 2009; Stecconi et al., 2010; Kitzberger, 2012; Donoso et al., 2014). This species forms not only largely different phenotypes, but it also hybridizes with N. antarctica (Marchelli et al., 2007; Burns et al., 2010; Mattera et al., 2020), and it shows vital vegetative regeneration after injury. At certain sites with N. antarctica-dominated forests, tall forest species cannot develop due to edaphic or climatic constraints, e.g., at xeric sites in the ecotone to the steppe, on broad valley bottoms with temporary water stagnation and a high probability of cold air drainage that leads to temperature inversion, at sites along streams and swamps with high water tables, and at high-altitude sites exposed to strong winds that lack protective snow cover (Veblen et al., 2003). The soils in the study region are predominantly young Andosols (IUSS Working Group WRB, 2015) with abundance of allophanes (Colmet Daage et al., 1988; Buduba et al., 2020), which are characterized by high cation exchange capacities and relatively high water storage capacities.
The mesic to dry parts of the VTR Ecoregion on the Argentinean side of the Andes are dominated by secondary forests that represent natural cohorts of mature age that have developed through different pathways after large-scale disturbance. Most of them developed after massive anthropogenic fires in the late 19th and early 20th century to clear forest for cattle ranching (Willis, 1914; Rothkugel, 1916; Kitzberger and Veblen, 1999). During the last century, the forest vegetation has recovered to variable degrees in dependence on seed availability from patches of surviving forest or trees, site conditions, environmental factors, climate trends and consecutive natural and anthropogenic disturbances (Veblen and Lorenz, 1987; Veblen et al., 2003; Kitzberger, 2012; Gowda et al., 2023).
At low and mid-elevations (<1,000 m a.s.l.), various secondary forests have developed along different pathways (Veblen and Lorenz, 1987; Veblen et al., 1996, 2003; Mermoz et al., 2005; Gowda et al., 2012, 2023; Kitzberger, 2012). For instance, on wetter sites, N. dombeyi and A. chilensis have been able to regenerate rapidly after fires in vicinity to seed sources to form young dense stands (Veblen and Lorenz, 1987; Veblen et al., 2003). However, it has been shown that especially in edaphically less favorable or more xeric sites, resprouting species, such as Lomatia hirsuta (Lam.) Diels, Schinus patagonicus (Phil.) I.M Johnst. ex Cabrera, Maytenus boaria Molina, Azara microphylla Hook.f., among others, tend to dominate in the initial postfire succession stages due to their rapid clonal growth (Veblen et al., 2003; Gowda et al., 2012, 2023; Kitzberger, 2012; Landesmann et al., 2016; Tiribelli et al., 2018). Furthermore, depending on site conditions, some mixed shrublands have turned after a long fire-free period (50–100 years) into high forests, i.e., forests with an average height of more than 7 m at maturity (CIEFAP and MAyDS, 2016). They are dominated by mid-successional tree species regenerating from seeds (e.g., N. dombeyi and/or A. chilensis) (Kitzberger, 2012; Landesmann and Morales, 2018; Tiribelli et al., 2018).
In this region, the succession from shrubland to tall forest is conditioned by post-fire dynamics, and may be suppressed, if subjected to frequent fires (Paritsis et al., 2015). Succession processes from N. antarctica/mixed scrub to N. dombeyi forests depend on the survival of N. dombeyi trees that may function as a seed source after fire. The seeds of N. dombeyi get mainly dispersed by gravity, with 95 % of the seeds occurring within 20-m distance to the mother tree (Zerbe et al., 2023), but could be dispersed by winds until 100 m (Tiribelli et al., 2018). The establishment of N. dombeyi in scrubland after a fire usually occurs up to 50 years after the bushes begin to grow back. After that, the species’ regeneration becomes increasingly unlikely due to light limitation in the dense mixed scrub (Tiribelli et al., 2018). Once the regeneration of N. dombeyi is established, it grows in height, suppressing and excluding the resprouting species by closing the canopy (Tiribelli et al., 2018). On the other hand, A. chilensis, a tree tolerant to intermediate shade, is able to regenerate in dense shrubland from fire refugia and exhibits long-distance seed dispersal, leading to a progressive expansion of recruitment which accelerates over time (Landesmann and Morales, 2018). However, it takes several decades without fire before A. chilensis can outgrow and suppress the shrubs (Landesmann et al., 2016). It has also been observed that forests dominated by A. chilensis, which are affected by Phytophthora austrocedri (cypress disease) and form canopy openings due to mortality, can be colonized by N. dombeyi, if a nearby seed source is present, and gradually transform to mixed forest (Loguercio, 1997; Amoroso et al., 2012). The faster growth of N. dombeyi compared to A. chilensis (Caselli et al., 2021) and its ability to reach taller heights are competitive advantages that favor its dominance (Loguercio, 1997; Caselli et al., 2021). Typically, N. dombeyi reaches in mixed secondary forests with A. chilensis a higher basal area and total leaf area than the conifer, even though its mean age is lower (Loguercio, 1997; Caselli et al., 2021).
At higher elevations (1,000–1,500 m a.s.l.), successional trajectories with species turn-over are rare or absent due to exposure to lower temperatures and a period of dormancy in winter. N. pumilio with its deciduous leaf habit is well adapted to this environment and dominates over other species. These forests have been less affected by fires due to the cool and wet high-elevation climate (Gowda et al., 2012, 2023). Although N. pumilio lives longer and appears to be the most competitive species, N. antarctica has an advantage in specific and unique small-scale conditions. This applies to sites subject to frequent remodeling and mechanical stress, where it profits from its typically more prostrate krummholz form, its strongly intertwined and anchored root suckers and its effective vegetative propagation by adventitious roots on partially buried or damaged branches (Veblen et al., 1996).
2.2 Sampling design
A plot design along transects was selected in order to represent the diversity of forest types with their different post-fire successional sequences in a terrain that is difficult to access and spans steep elevation and aridity gradients. Transect 1 (T1) is located in the valleys of the Lower Manso and Villegas rivers (41°34′- 41° 40′) and is approximately 50 km long. Transect 2 (T2) is located at the latitude of the towns of El Bolsón and El Maitén (41°53′- 41°59′) and is approximately 40 km long. Due to the required length of the transects and the limited accessibility of plots, we divided each transect into four sectors. The sectors are located 10–15 km distant to each other and represent different moisture conditions along the precipitation gradient (Figure 1).
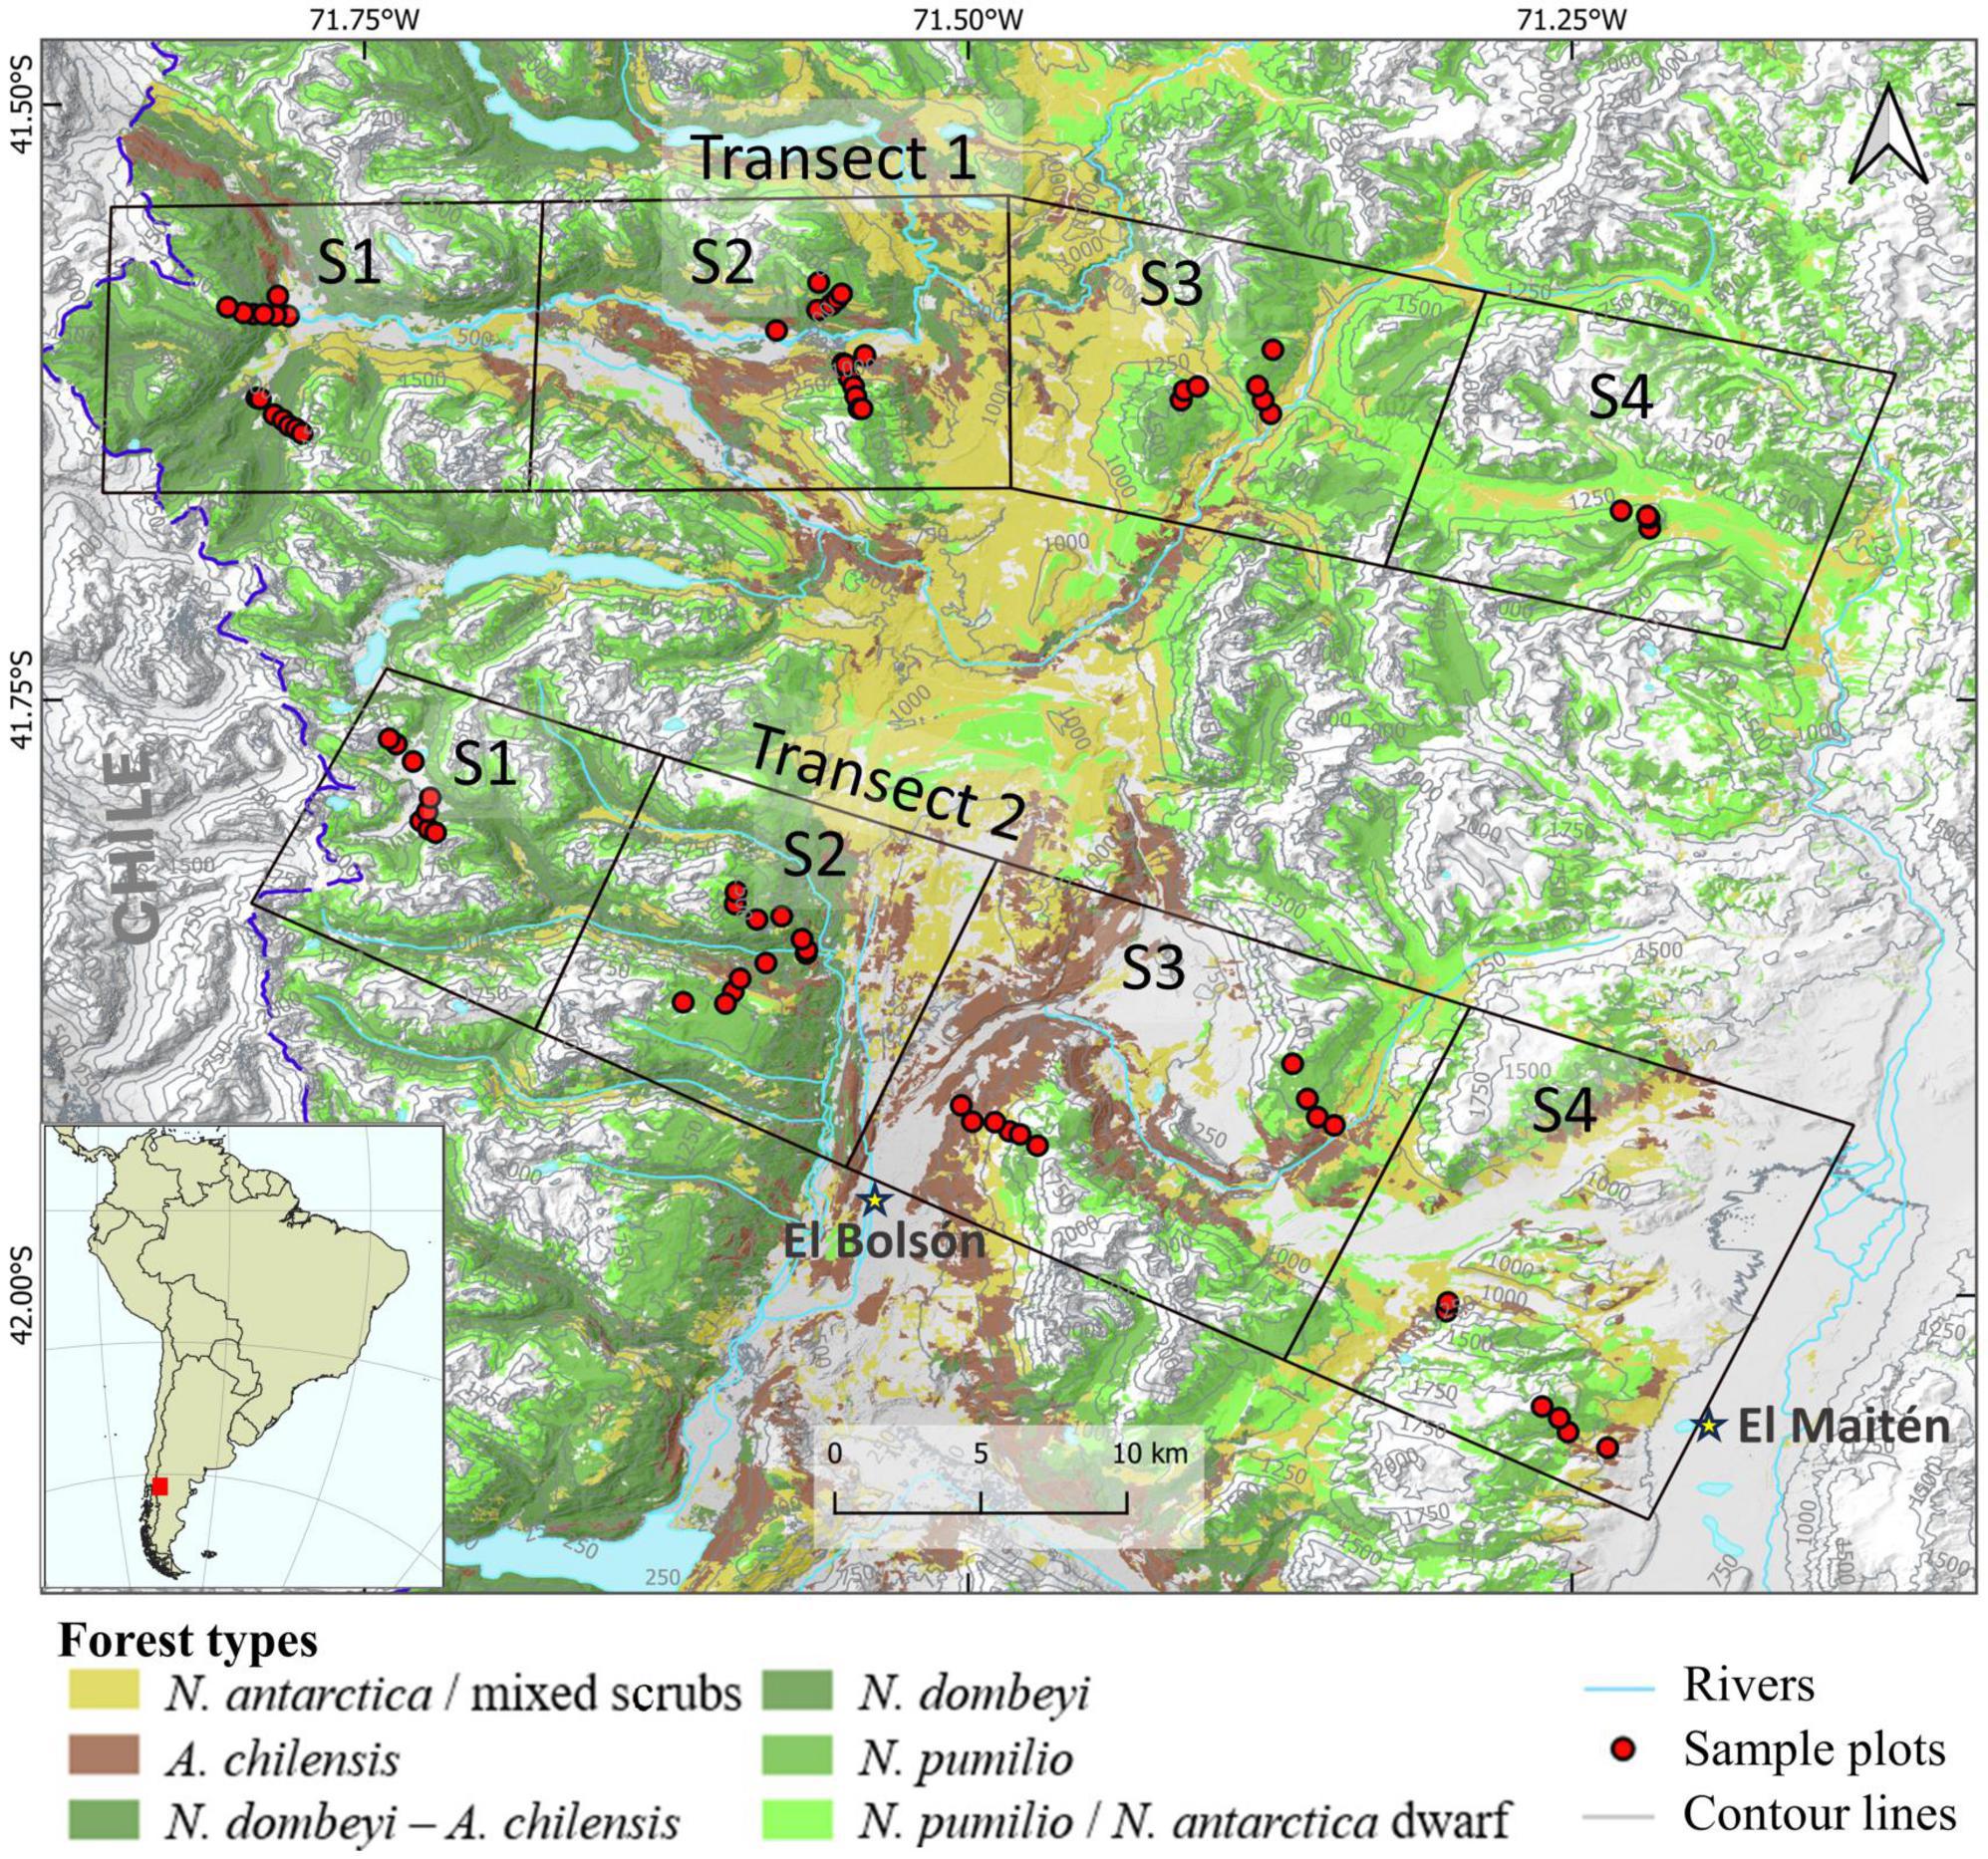
Figure 1. Location of the study region in South America with placement of the transects Manso-Villegas rivers (top) and El Bolsón-El Maitén (bottom) on the eastern slopes of the Patagonian Andes and distribution of major forest types. Each transect consists of four sectors (squares), in which the sample plots are located along elevation sub-transects.
We labeled the sectors from west to east, with sector 1 (S1) being the westernmost and wettest, and sector 4 (S4) the easternmost and driest of the gradient. Within each sector, the elevation gradient was taken into account by placing sample plots at elevation steps of 200 m from the valley floor to the tree line (from 500 to 1,600 m a.s.l.). Thus, sampling plots were established at 500, 700, 900, 1,100, 1,300, and 1,500 m a.s.l. However, the lowest and highest sampling elevation was defined by the presence of forest at these levels, i.e., in some cases, the lowest plots were placed at elevations greater than 500 m a.s.l. (e.g. 700 m a.s.l.), and the highest plots at lower elevations than 1,600 m a.s.l (e.g., 1,300 m a.s.l.). We also took into account the influence of slope by recording two elevation sub-transects in each sector, one on the north-northwestern (N–NW) slope with higher radiation intensities, which is considered the most unfavorable for forest growth (especially at low and mid elevations), and the other on the south-southeastern (S-SE) slope with lower radiation intensities, which is considered the most favorable location for tree growth in this region (Donoso et al., 2014; Figure 1).
2.3 Sampling of forest structural and soil data
2.3.1 Biomass and deadwood mass
In each sampling site along the precipitation and elevation gradients, we established two concentric plots in stand sections that were characteristic of the forest type at this site. In the first plot of 400 m2, we measured all trees (living and dead) with ≥ 7 cm diameter at breast height (DBH), and in the second one of 1,000 m2, we investigated all trees with > 60 cm DBH. We identified all tree species and classified all trees according to their social position after Kraft (dominant; codominant; intermediate, or suppressed) (Kraft, 1884), their stem shape (well-formed vs. poorly formed), and their health status (healthy, sick, or dead). We measured tree height for 100 dominant trees per ha, i.e., for four trees in the 400 m2 plots (Assmann, 1970), together with 3–4 additional trees, thereby covering the DBH range of the stems present. To determine the age of the four sampled dominant trees in the plot, we took two wood cores perpendicular to each other at breast height, placed at 45° relative to the largest diameter axis, and proceeded in clockwise direction.
For measuring the amount of C stored in the wood, we split the woody biomass into live and dead fractions. The (live) biomass was further divided into aboveground biomass (AGB) and belowground biomass (BGB, roots). The deadwood mass was split into standing aboveground deadwood mass (sdAGB) and downed aboveground deadwood mass (ddAGB). To distinguish between sdAGB and ddAGB, a trunk angle of 45° to the vertical was used. While we sampled sdAGB together with the live trees (DBH ≥ 7 cm), the amount of ddAGB was quantified with the line intersection approach (Brown, 1974; Harmon and Sexton, 1996; Woodall and Monleon, 2008; Woodall and Weiskittel, 2021). With this method, we recorded the deadwood pieces of different dimensions along three radial lines in the directions 90, 180 and 315° in the plot (Figure 2), an approach that has been tested and adjusted earlier in natural Patagonian forests (Loguercio et al., 2019).
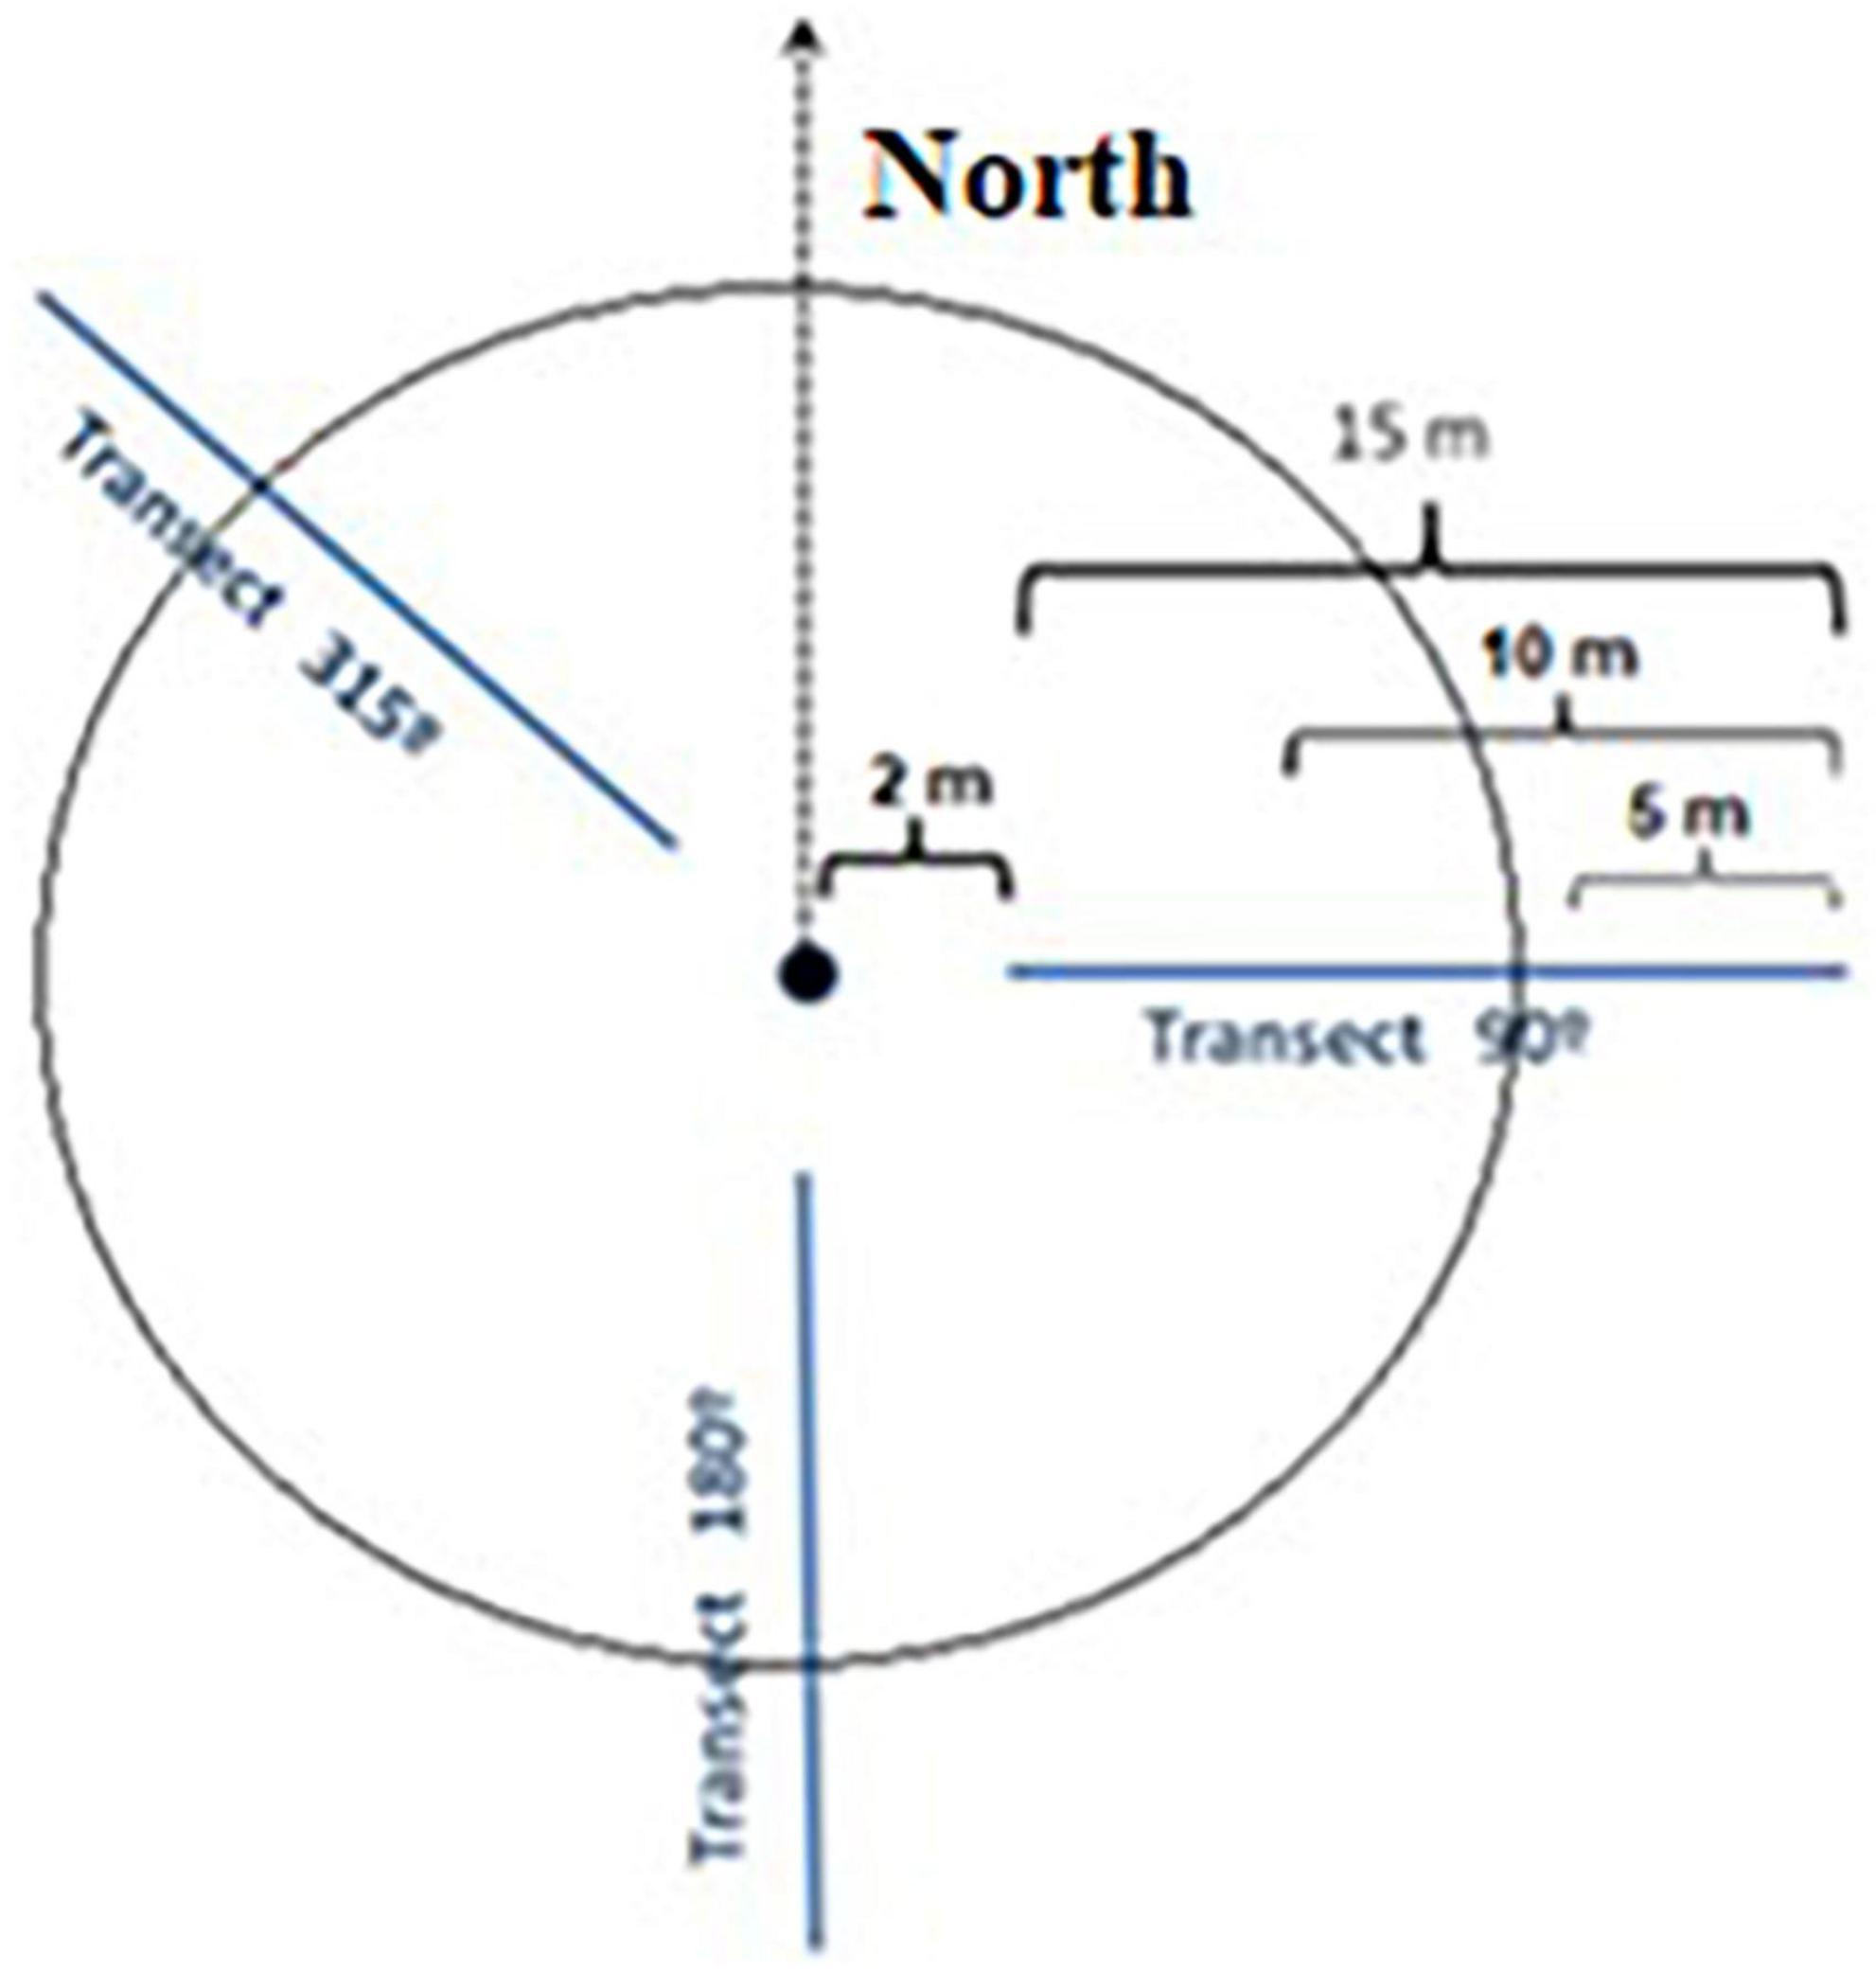
Figure 2. Sketch of a sample plot with location of the three intersecting lines along which the pieces of lying dead wood were counted.
One consequence of sampling with the line intersection method is that the length of the deadwood pieces is not considered when calculating volume and biomass. In this approach, each wood piece intersected by a line is an element to be counted, whatever its arrangement in space on both sides of the line. We distinguished fine (0–2.5 cm in diameter), medium (2.5–7.5 cm), and coarse woody debris (>7.5 cm), but we did not measure the individual diameter of small pieces (< 7.5 cm), as it is impractical, and we only counted them. On each of the three lines, we counted the fine woody debris along the first 5 m of the line, the medium debris on the first 10 m, and the coarse debris on the first 15 m. This means that we counted in each plot the fine woody debris along a total line length of 15 m, the medium debris along 30 m, and the coarse debris along 45 m. Each line started 2 m distant from the plot center to avoid autocorrelation of data between lines (Figure 2). We then defined a mean diameter for fine and medium-sized debris pieces. For coarse woody debris, we measured the diameter of each piece with a tree caliper at the point of intersection of the sampling line in perpendicular direction to the central axis of the piece. In addition, we grouped each coarse wood piece according to its degree of decomposition (Harmon and Sexton, 1996) to four classes [from lowest (I) to highest degree of decomposition (IV)]. In earlier work, the bulk density of the woody debris in these four classes has been determined for different local tree species (Loguercio et al., 2019). We considered woody debris to include logs, branches, twigs and other dead material that has fallen to the ground. Dead roots were not counted as woody debris, unless they constituted large dead roots lying on the soil surface. Woody debris oriented with its central axis on the sampling line or parallel to it was not counted and thus ignored in the calculation.
We computed the mass of each deadwood piece in the ddAGB fraction with the equation:
where W is the wood mass per unit area [kg.ha–1], L is the length of the sampling line, d is the diameter of the deadwood piece at the point of intersection, δ is the bulk density of the woody material (g.cm–3), α is the angle of the line to the horizontal, and the term π2/8 is derived by multiplying the probability of occupation by dead wood (π/2, the percent of line length intersected by the piece) with π/4 (the factor for converting the piece’s diameter into area).
2.3.2 Soil organic carbon
We sampled the humus layer and the mineral topsoil in the sampling plots at a location without topsoil disturbance in 2 m distance to the plot center, with the direction selected by random. The (ecto-) organic (humus) layer (without fresh litter) was completely sampled within a 20 × 20 cm frame. In the mineral soil, soil bulk density was determined in 100 m3 cylinders at 0–10 cm and 10–20 cm depth, and ca. 300 cm3 of soil material was collected in these two horizons to measure soil organic carbon (SOC) concentration through ignition at ca. 500°C (Davies, 1974; IUSS Working Group WRB, 2015), as is recommended for national greenhouse gas (GHG) inventories (Eggleston et al., 2006). To determine soil bulk density (in Mg.m–3) and express C per soil volume, the samples were dried at 105°C until constant weight (24 h) and then sieved at 2 mm to eliminate gravel and roots. The carbon content per depth layer [carbon density, in Mg.ha–1] was computed by multiplying soil bulk density [in Mg m–3] with the C concentration (in %), horizon depth (in m) and the factor 10,000.
2.4 Stand parameters and computation of biomass carbon density
The following parameters were calculated for each plot: number of trees per hectare [N.ha–1], cumulative basal area (BA [m2.ha–1]), and quadratic mean diameter (QMD [cm2]) for live and dead trees. For estimating the height of the unmeasured trees, negative exponential functions were fitted for each of the main species based on height and DBH data collected in all plots, using the Chapman-Richard equation:
where a, b and c are specific coefficients of the equation and DBH is given in cm.
To adjust the function of each species to each plot, we re-calculated the coefficient “a” (which defines the asymptote of the curve) using the measured dominant DBH and dominant height of the species in that plot. To determine the wood volume and the amount of carbon stored in each tree, we used specific allometric functions of aboveground and root biomass available for the species developed in previous studies. In these studies, the biomass functions of the main species N. antarctica, N. dombeyi, A. chilensis, and N. pumilio were elaborated by cutting and weighing the above-ground mass and by excavating and weighing the root mass (references in Table 1).
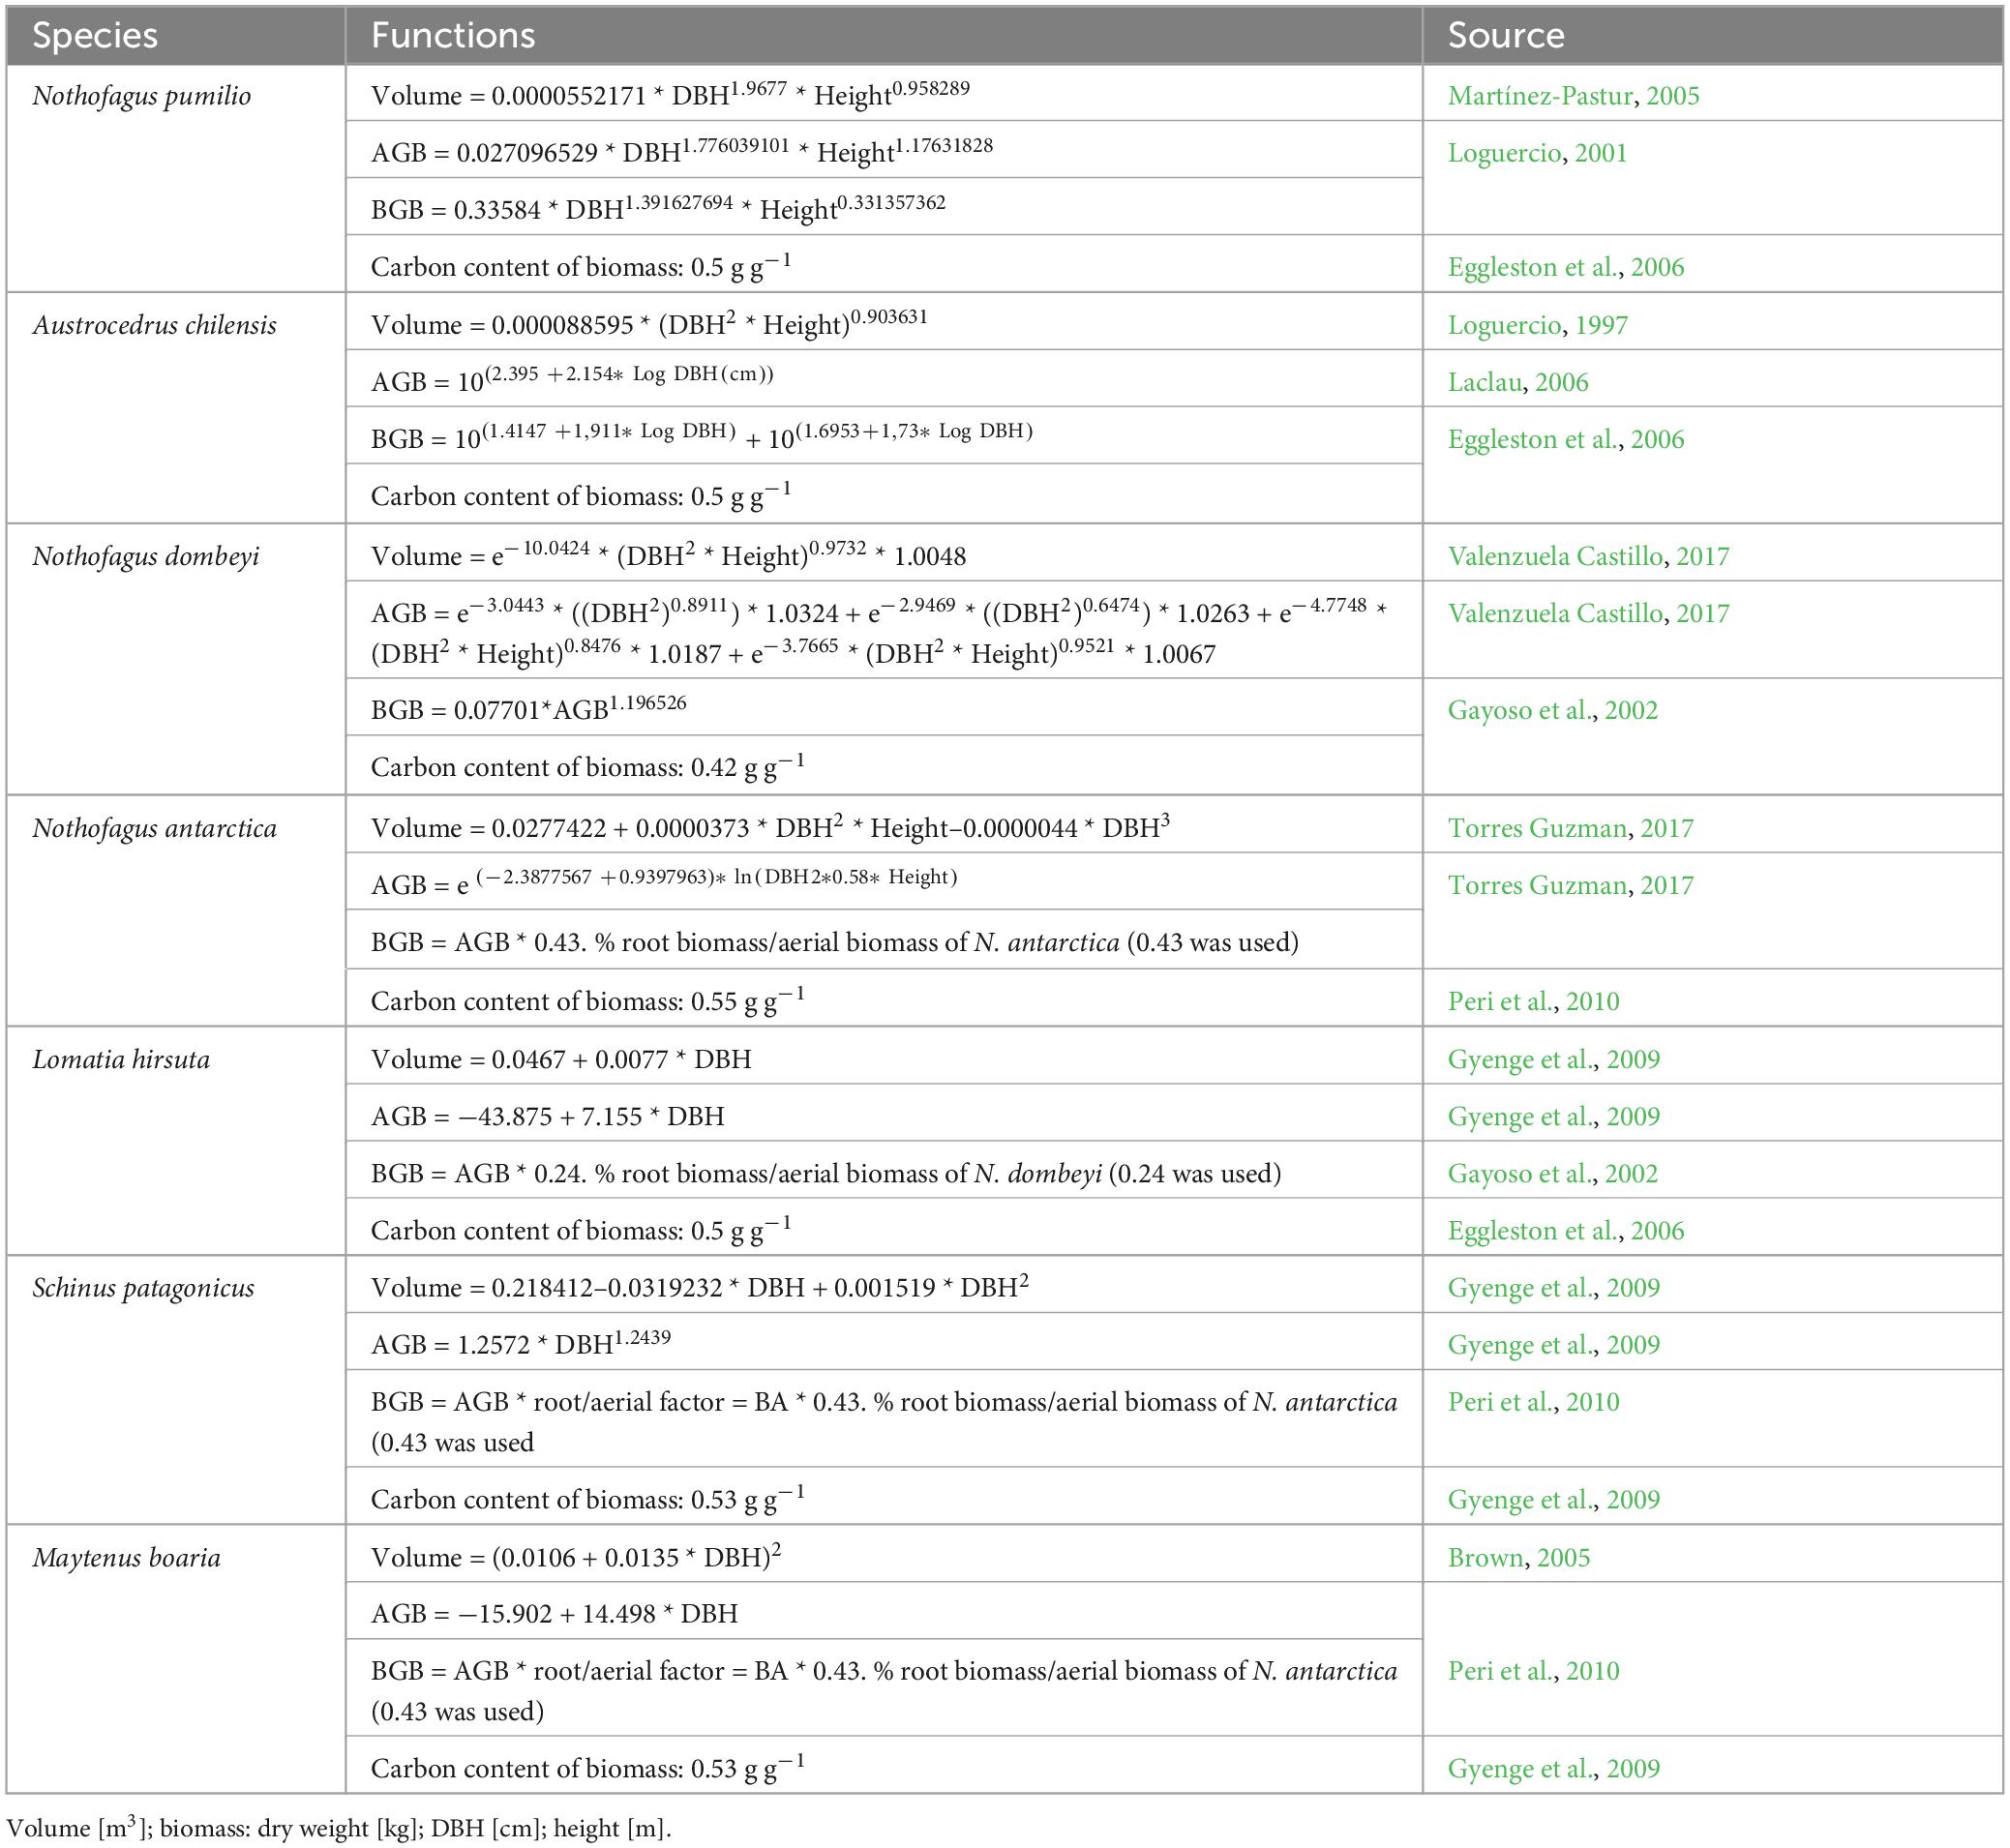
Table 1. Equations for calculating wood volume, aboveground biomass (stem+branches+leaves) (AGB), and belowground biomass (roots) (BGB) from DBH and height for individual trees of the main wood species in the plots.
We grouped the plots into six forest types, namely N. pumilio/N. antarctica dwarf forest, N. antarctica/mixed scrub, A. chilensis, N. dombeyi-A. chilensis mixed forest, and pure N. dombeyi and N. pumilio forest. The grouping was based on the criterion that the main species should contribute more than 80% of the basal area (Bravo-Oviedo et al., 2014). Only in the case of plots where A. chilensis mixed-up with shrub species, we reduced the level to about 60% of basal area, as A. chilensis will dominate the stands in the coming years due to its greater height growth and greater longevity. For each forest type, we then computed mean values per ha for all structural variables [number of trees, dominant height, site density index (SDI, Reineke, 1933), stem density relative to the maximum SDI of that forest type (RD), cumulative basal area, quadratic mean diameter (QMD), and wood volume].
2.5 Carbon sequestration rate with wood production
Due to the scarcity of information on the growth rate of the studied tree species and the lack of growth models applicable to the study area, we developed functions to describe the relationship between biomass periodic annual increment (BPAI, annual wood production rate) and the standing biomass of individual trees of the main species (N. dombeyi, A. chilensis, N. pumilio, N. antarctica and some shrub species). The main data used to fit the equations were the width of the last 10 tree rings in the wood core samples collected from the dominant trees of each plot, DBH, and the corresponding tree height. For N. pumilio, N. antarctica and the shrub species, the recorded data were supplemented with core data, and DBH and height data of trees of different sizes and social positions from forest inventories conducted in other stands in the region. For N. dombeyi and A. chilensis, we included individual periodic increment data obtained by re-inventories conducted in 50 permanent plots (24 for N. dombeyi, 7 for N. dombeyi-A. chilensis and 19 for A. chilensis) after 10 years. This approach guaranteed that the survey methodologies are consistent with those of the present study (Loguercio and Ivancich, 2019; Loguercio et al., 2022). We obtained the following total numbers of sample trees: A. chilensis: 344, N. dombeyi: 543, N. pumilio: 241, and N. antarctica/mixed shrubs: 165. Using the current DBH and height data as well as the data from the 10-year re-inventory (using the original DBH and height functions of each plot), we determined the standing biomass and wood production (BPAI) of each tree. Linear regression functions were then fitted to obtain BPAI from the corresponding biomass [kg tree–1]. The general form of the functions used was:
where Y is the periodic annual biomass increment of the tree of that species [kg. tree–1.year–1], and X is the standing biomass of the tree [kg.tree–1].
With these functions and the biomass-to-carbon conversion factors of Table 1, we estimated carbon periodic annual increment (C sequestration) in the aboveground- and belowground biomass per ha (CPAI-AGB and CPAI-BGB, respectively) for each plot.
2.6 Data processing and statistical analysis
We analyzed all data (carbon density of above- and belowground biomass, the standing and downed aboveground dead mass, carbon periodic annual increment in the above- and belowground compartments, and soil carbon density in organic layer and in 0–10 and 10–20 cm depth) using linear mixed models with forest type as a fixed effect and transect, sector and aspect as random effects. In addition, for the comparison of soil properties at the two depths (0–10 and 10–20 cm), we used depth and forest type (and its interaction) as fixed effects, with the same random effects as in the other models. We tested the normality assumption using the Shapiro-Wilk test and for homoscedasticity using an analysis of residuals. If necessary, we transformed the data and modeled the variance to meet assumptions of normal distribution and homogeneity of variances. Alternative models were compared using the likelihood-ratio test (LRT) to find the best model for each response variable. In case of significantly different means, means were compared using Fisher’s LSD (least-significant differences) test. We further performed Pearson correlation analyses between the carbon density in the downed aboveground dead mass and aboveground biomass, and between the carbon density in aboveground biomass and elevation. A significance level of p ≤ 0.05 was used throughout the paper. All analyses were performed using the statistical software Navure 1.2.0 (Navure Team, 2023).
3 Results
3.1 Structural characteristics of the forest types
According to our height functions, N. dombeyi is the species achieving the greatest mean dominant height (26.4 m), while A. chilensis and N. pumilio range at 16–17 m, and the N. antarctica/mixed scrub did not exceed 8 m (Table 2 and Supplementary Figure 4). The mean age of the dominant trees varied in the plots between 53 and 175 years in the N. antarctica/mixed shrub and N. pumilio stands, respectively (Table 2). In general, the populations showed only small age variation within and between forest types, with the highest ages in N. dombeyi and N. pumilio (Table 2), as some plots of the former and most of the latter were in old-growth forests. Mean stand density relative to the maximum SDI of the individual forest types varied between 42 and 64%, with the lowest density in A. chilensis stands and the highest in N. pumilio stands (Table 2). The mean cumulative basal area of the stands (excluding N. pumilio and N. antarctica dwarf forests) increased from 21 to 56 m2.ha–1 in the sequence N. antarctica-mixed scrub < A. chilensis stands < mixed N. dombeyi-A. chilensis stands < N. pumilio stands < N. dombeyi stands. The mean volume of living biomass increased in the same sequence from 122 to 577 m3.ha–1. Quadratic mean diameter (QMD) ranged in the N. antarctica scrub and the mixed and pure A. chilensis stands between 20 and 30 cm, and increased to > 40 cm in the N. dombeyi and N. pumilio stands (Table 2). In most forest types, the proportion of standing deadwood in total wood, measured as basal area, varied between 8 and 11%, while it was only 3% in the N. dombeyi-A. chilensis mixed forests.
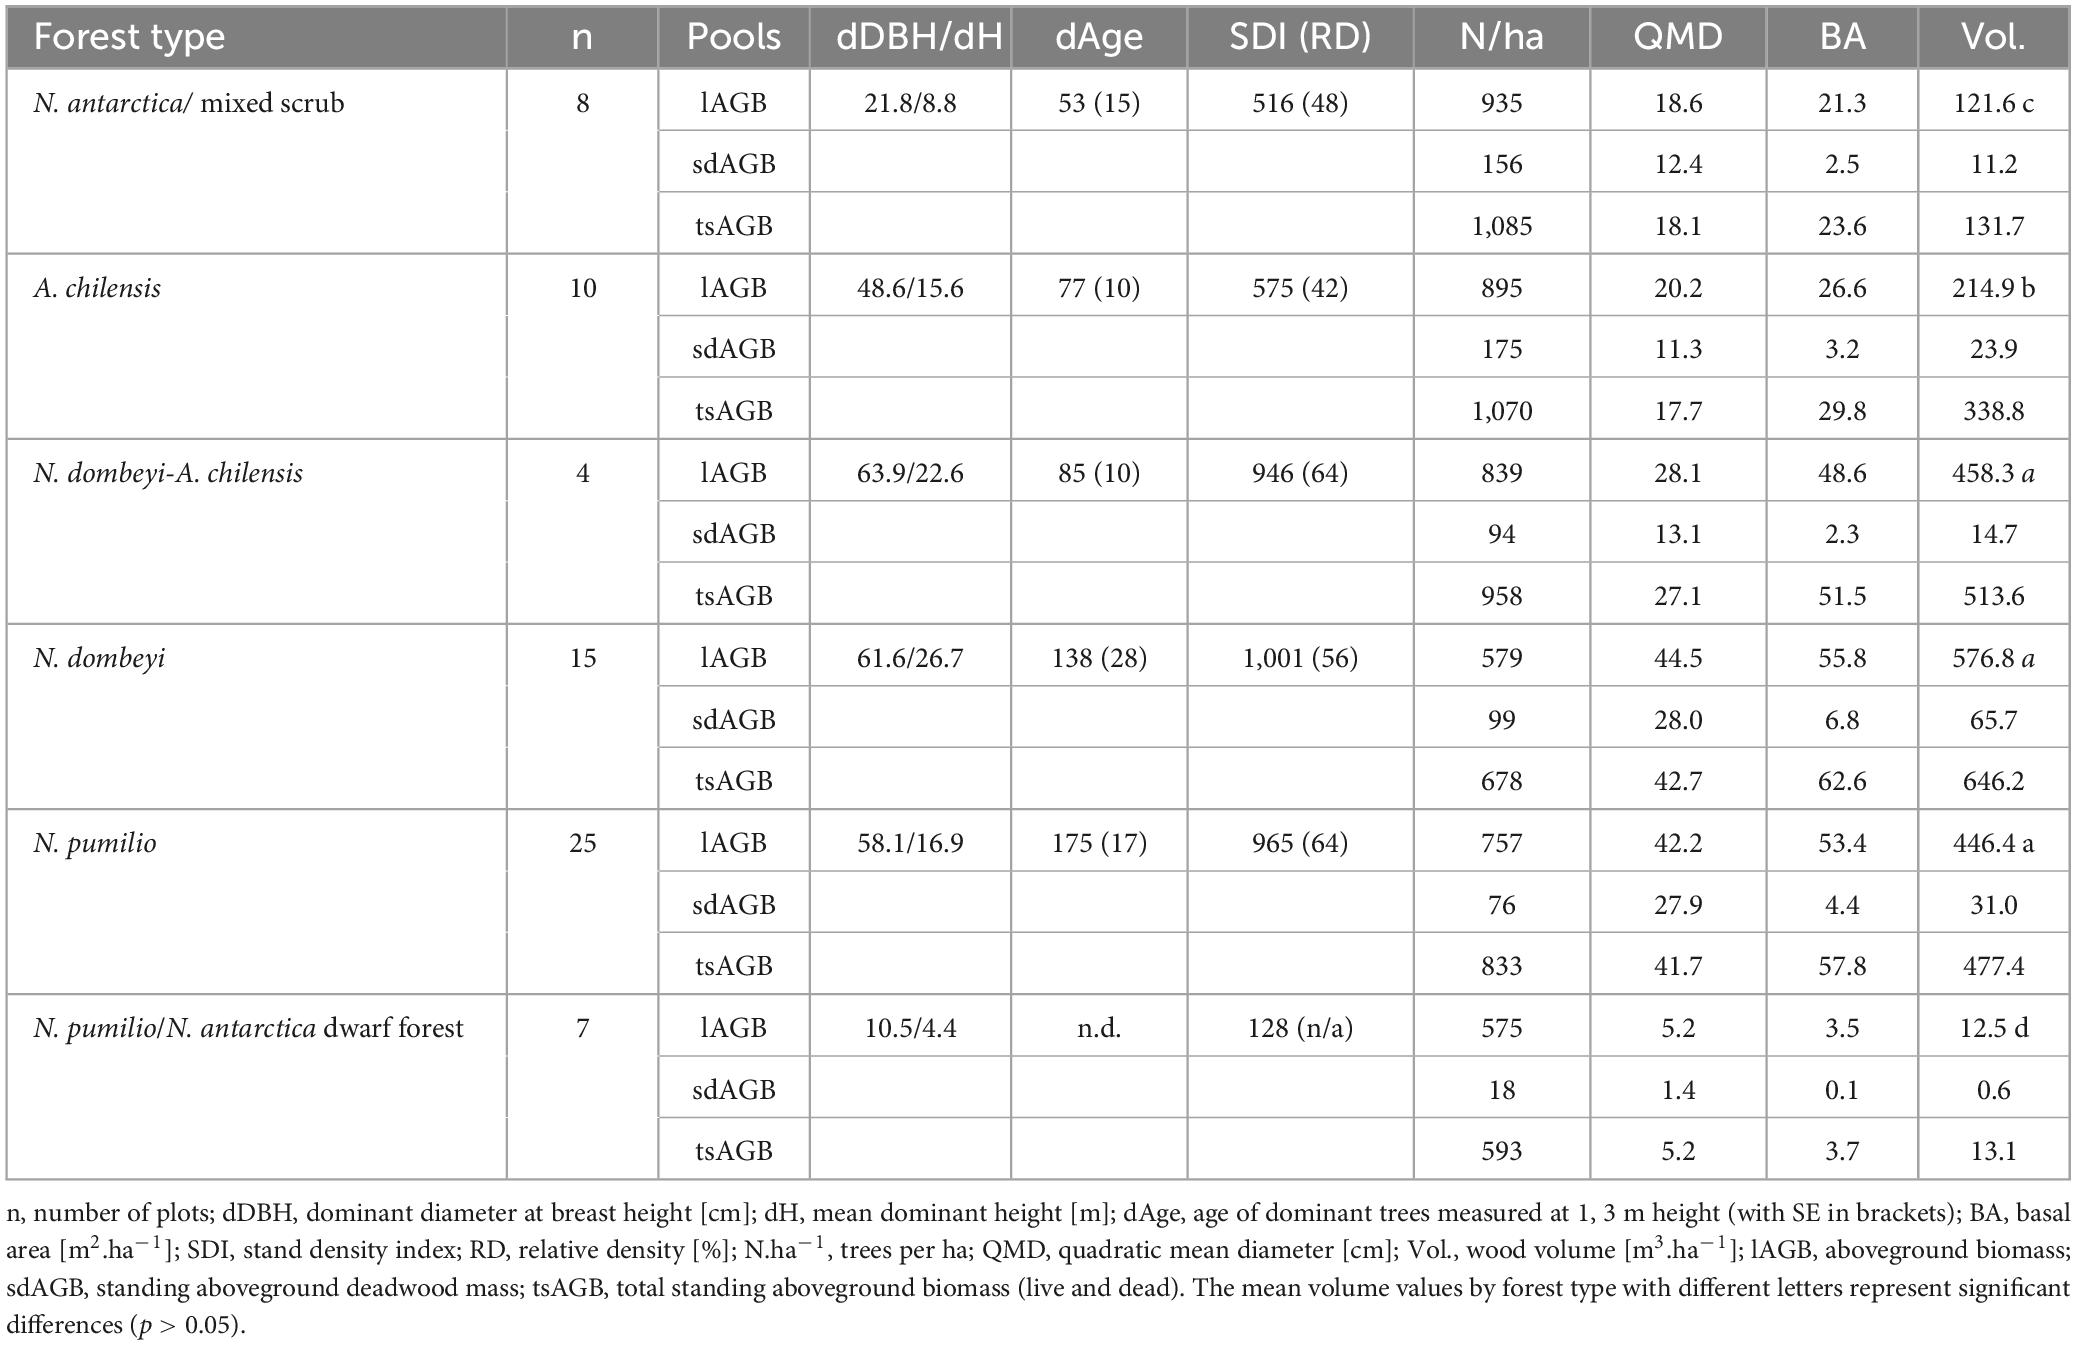
Table 2. Means of biometric stand parameters for the six forest types.
3.2 Carbon density in different compartments
3.2.1 Biomass carbon density
The carbon density in the aboveground biomass (lAGB) and belowground biomass (lBGB) varied largely between the forest types (p < 0.0001). For N. antarctica/mixed scrub, it was 41 Mg.ha–1 (76% referring to lAGB and 24% to lBGB), increasing through the A. chilensis stands to mixed N. dombeyi-A. chilensis stands, and reaching a maximum of 158 Mg.ha–1 (77% lAGB and 23% lBGB) in the pure N. dombeyi stands (Figure 3). N. pumilio stands showed an average of 122 Mg.ha–1, while N. pumilio/N. antarctica dwarf forest reached only 10 Mg.ha–1. Elevation was negatively correlated with carbon density in aboveground biomass only for the N. dombeyi forests (−0.5353; p = 0.0486) and the N. antarctica/mixed scrub (−0.8219; p = 0.0448).
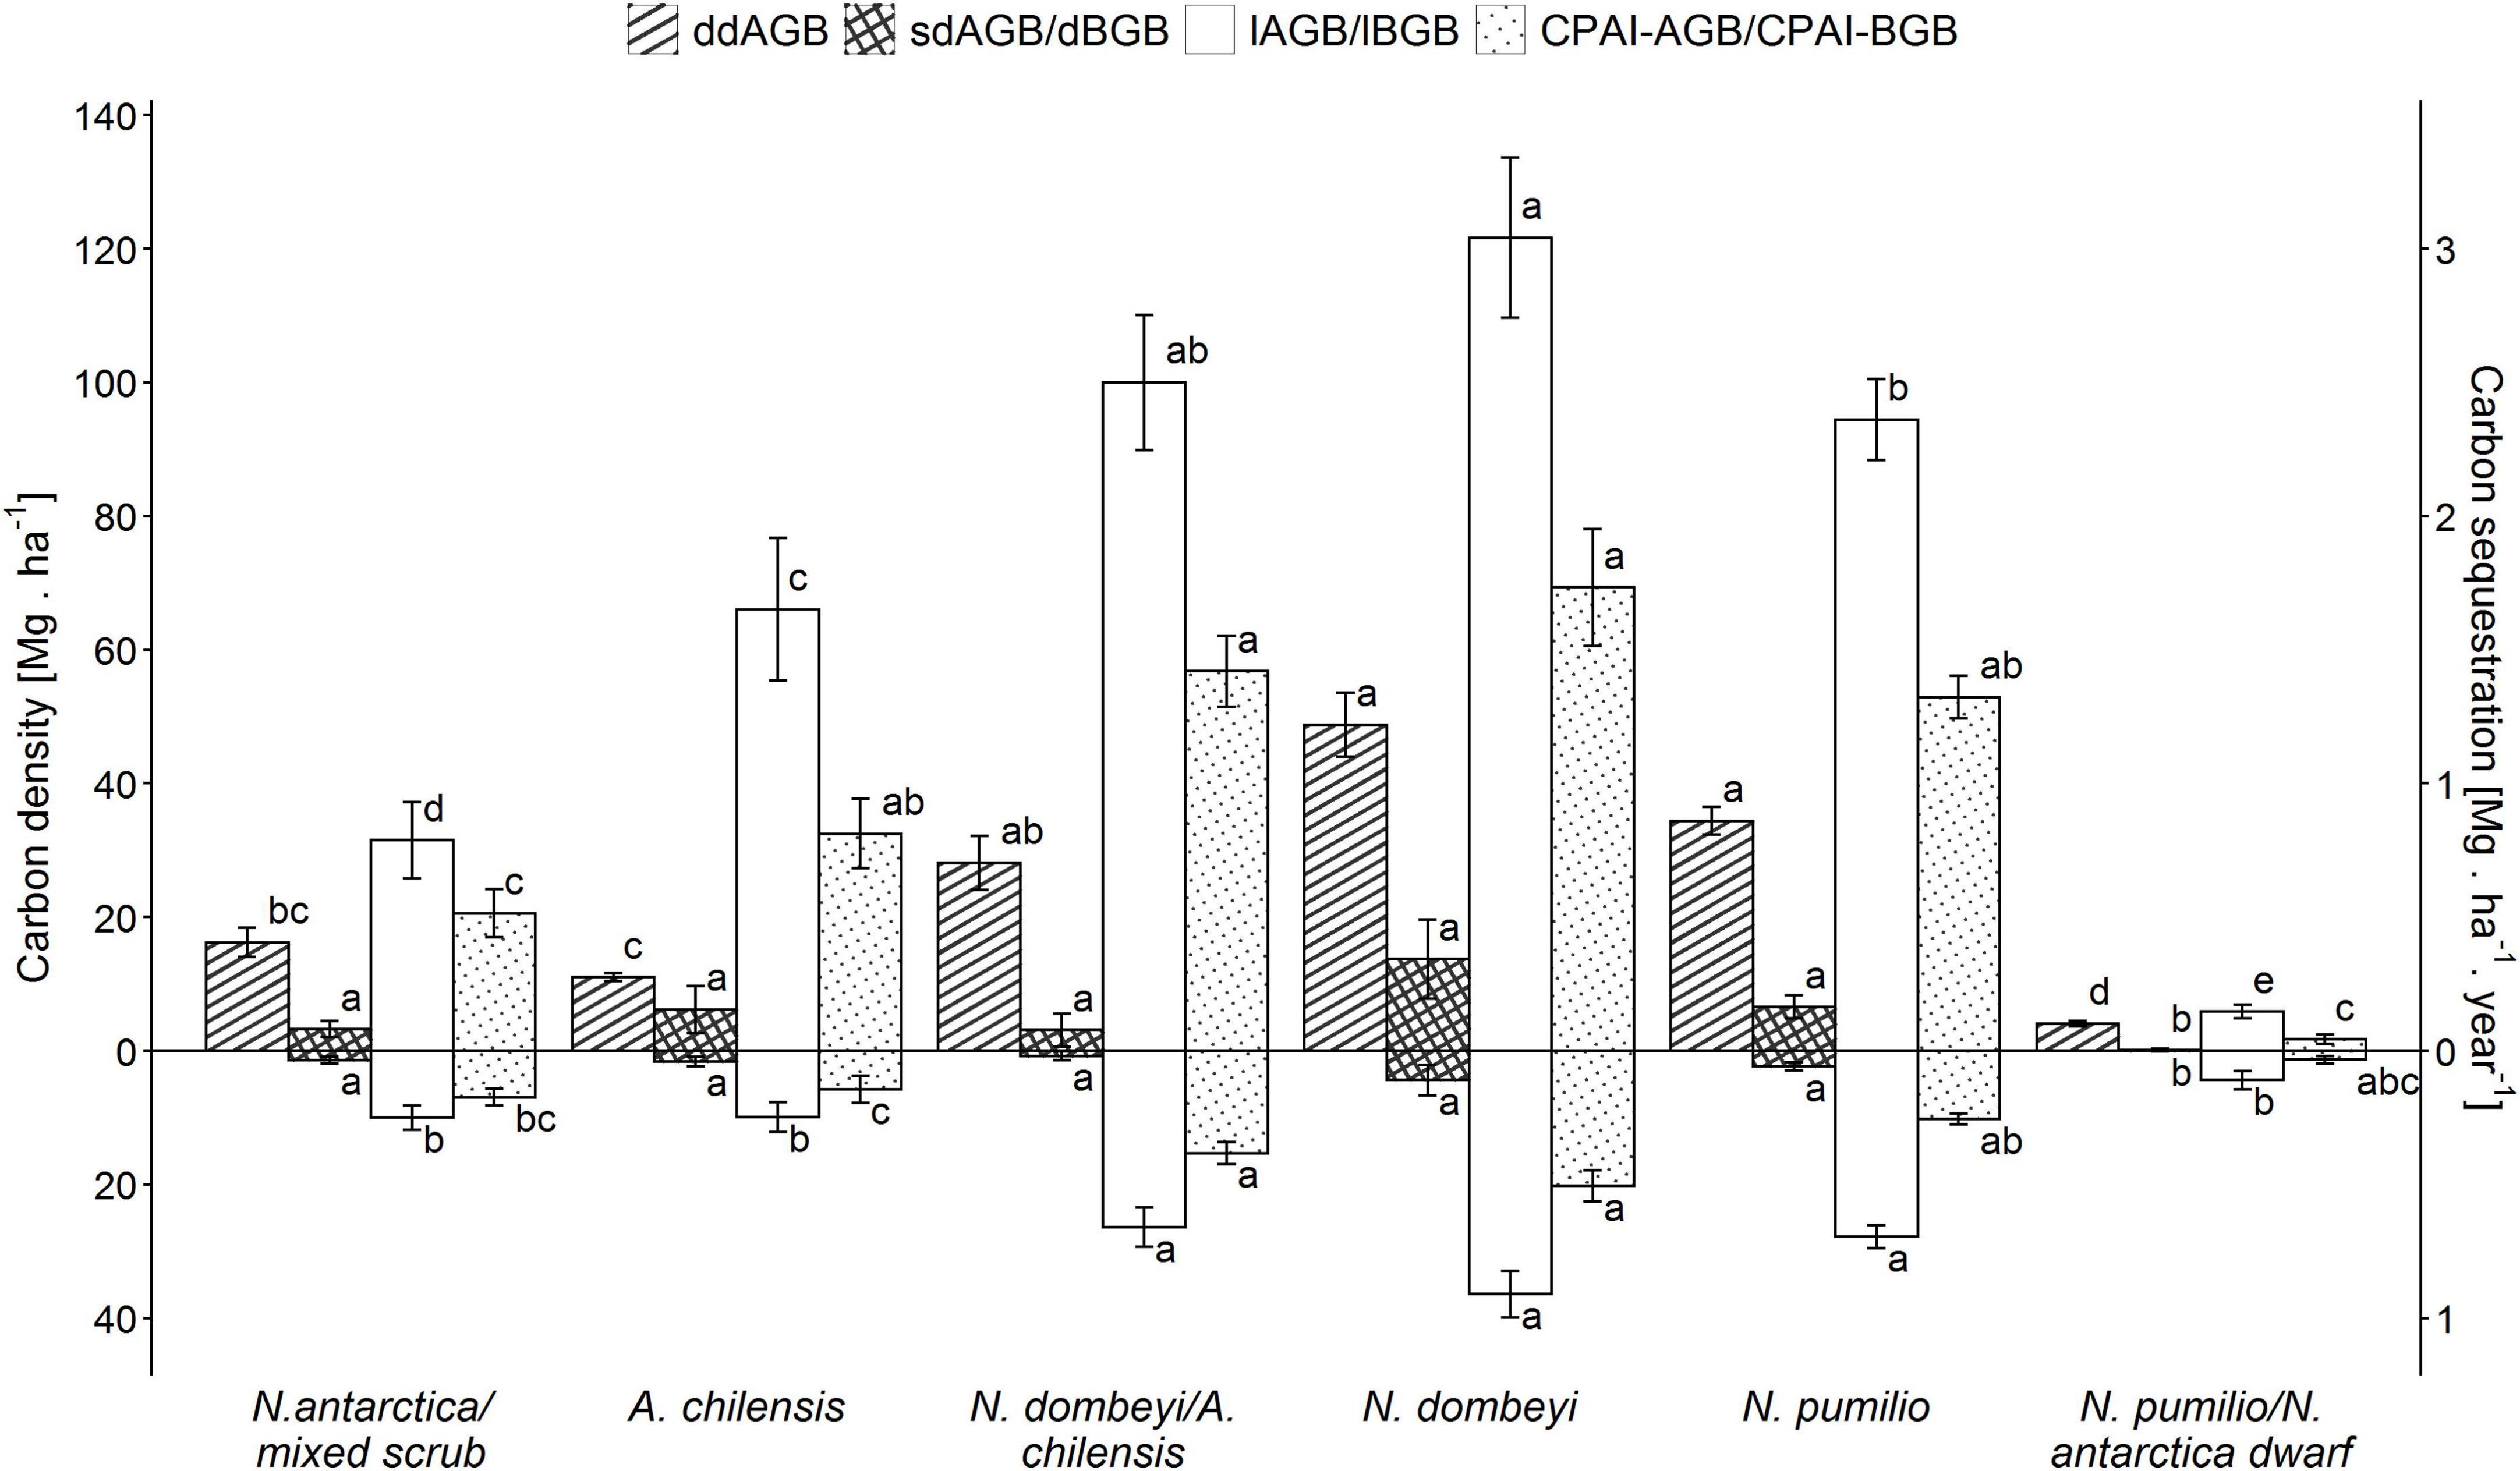
Figure 3. Means (± SE) of total carbon density (left y-axis) in above- and belowground biomass (lAGB and lBGB, respectively), standing above- and belowground deadwood mass (sdAGB and dBGB, respectively), downed aboveground deadwood mass on the forest floor (ddAGB; woody debris: fine+medium+coarse fractions) and carbon periodic annual increment (CPAI) of the above- and belowground biomass (lAGB and lBGB, respectively) (right y-axis) for the six forest types. Significantly different means (p > 0.05) are indicated by different small letters.
For carbon sequestration rate, applying the species-specific equations for the different forest types (Supplementary Table 1 and Supplementary Figure 5), we obtained average values (above- plus belowground biomass) ranging from 0.7 Mg.ha–1.year–1 in the N. antarctica/mixed scrub to 2.2 Mg.ha–1.year–1 in the pure N. dombeyi forests, while the N. pumilio forests reached about 1.5 Mg.ha–1.year–1 (Figure 3).
3.2.2 Deadwood carbon density
The carbon density of deadwood varied considerably among forest types, both in the standing aboveground dead mass (sdAGB) (p < 0.0001) and in the downed aboveground dead mass (ddAGB) (p < 0.0001) fractions, as well as in the belowground dead mass fraction (p < 0.0001). The carbon density in the total dead mass fraction (sdAGB+ddAGB+dBGB) varied with forest type from 21 Mg.ha–1 in the N. antarctica/mixed shrubs to 70 Mg.ha–1 in the pure N. dombeyi forests, with 44 Mg.ha–1 in the N. pumilio forests. The fraction of standing dead mass (sdAGB+dBGB) reached 5 Mg.ha–1 in the N. antartica/mixed scrub and 18 Mg.ha–1 in the N. dombeyi forests, with intermediate values found in the other forest types (Figure 3). The N. antarctica/mixed scrub and the N. dombeyi stands had the highest proportion of standing dead mass in total wood mass (live and dead), contributing around 10%. The carbon density of downed deadwood (ddAGB) in the N. pumilio and N. dombeyi forests reached 35 and 52 Mg.ha–1, respectively, being significantly different from A. chilensis stands and N. antarctica/mixed scrub with 10 and 15 Mg.ha–1, respectively. Mixed N. dombeyi-A. chilensis stands had intermediate values (Figures 3, 4).
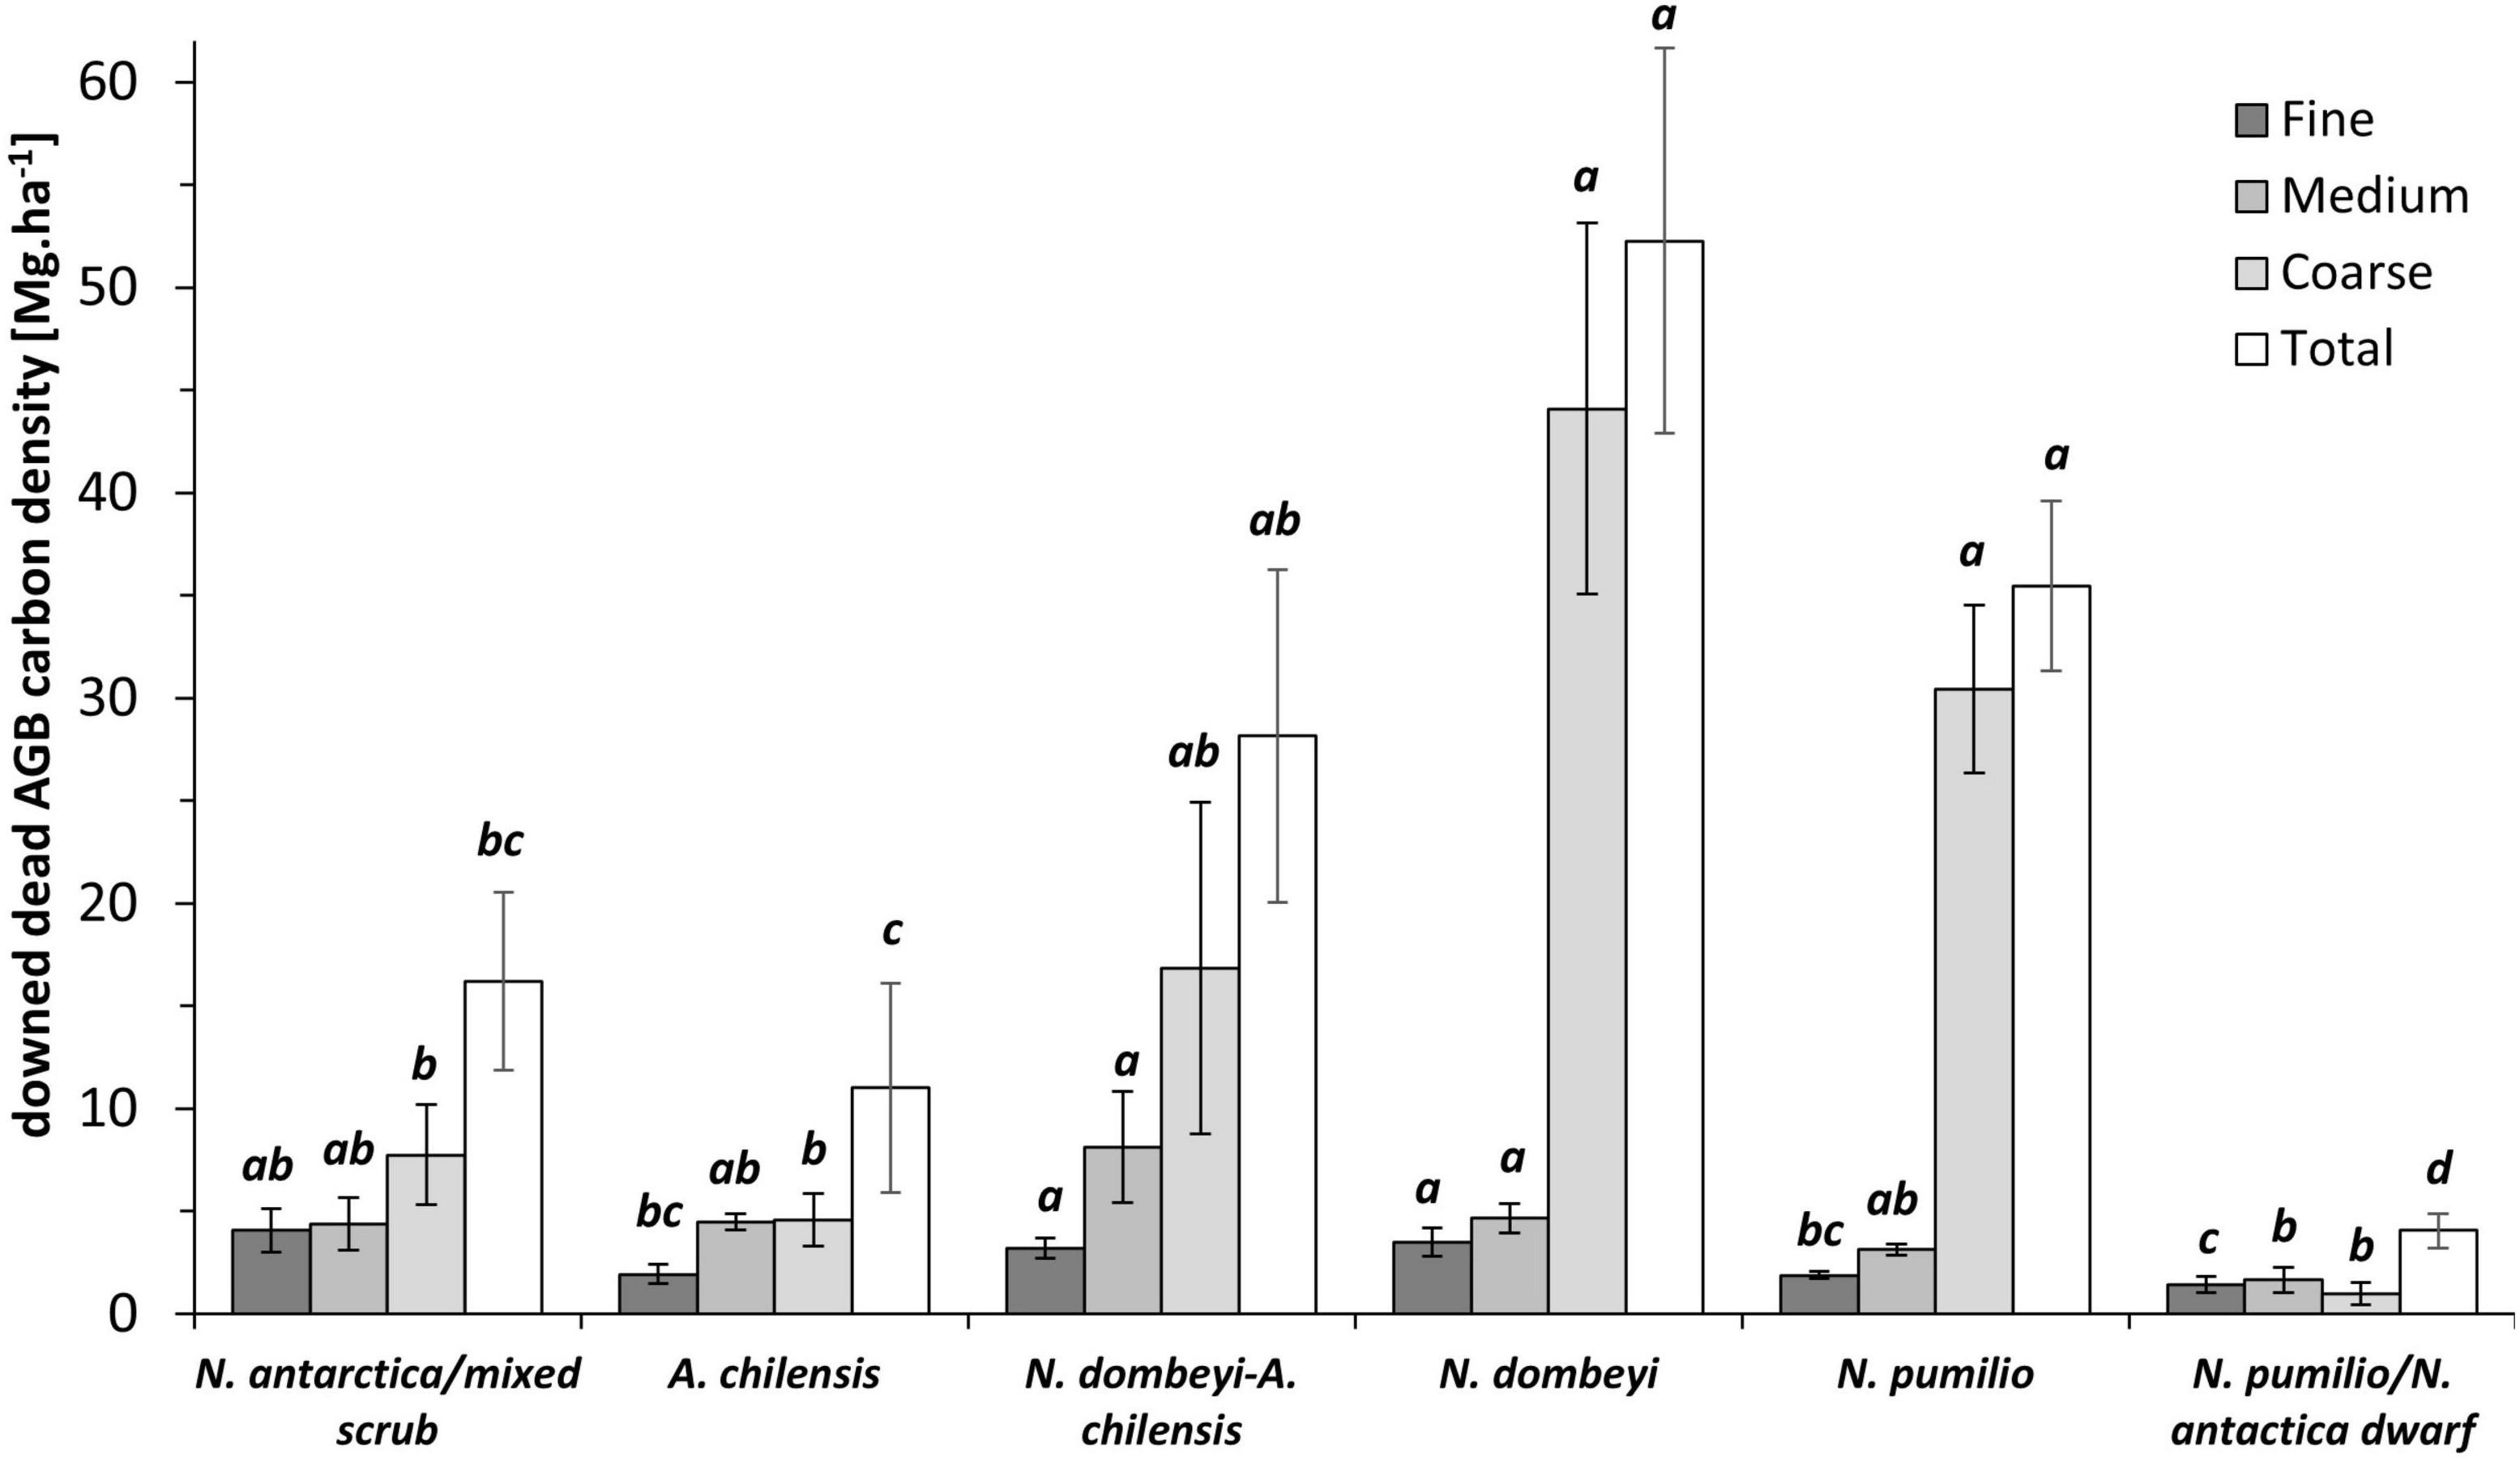
Figure 4. Means (± SE) of the carbon density in the three diameter classes and the total of downed aboveground deadwood mass (ddAGB) for the six forest types. Size classes: fine (< 2.5 cm in diameter), medium (2.5–7.5 cm), coarse (> 7.5 cm). Significantly different means (p > 0.05) are indicated by different small letters.
The carbon density of the downed deadwood assignable to the coarse, medium, and fine woody debris fractions differed significantly among the forest types (p < 0.0001, p = 0.0015 and p = 0.0001, respectively). In the fine woody debris fraction, the carbon density was not significantly different between N. antarctica/mixed scrub and the tall mixed and pure N. dombeyi stands, with 3 to 4 Mg.ha–1. The N. pumilio/N. antarctica dwarf forests had with 1.4 Mg.ha–1 the lowest contents. Similarly, the C stored in medium-sized woody debris amounted to around 5 Mg.ha–1 in the mixed and pure N. dombeyi stands, and reached somewhat lower values in the other forest types (Figure 4). In all forest types except for the N. antarctica/N. pumilio dwarf forests, we observed that the largest amount of the downed deadwood was stored in the coarse woody debris size class (Figure 4). The size of this fraction increased from 4 Mg.ha–1 in the N. antarctica/mixed scrub to 49 Mg.ha–1 in the tall N. dombeyi stands, representing 42 to 85% of the carbon in the total downed deadwood mass pool.
Regarding the distribution of coarse woody debris to the different decomposition classes, we found the highest amounts in the higher classes (III and IV) with more advanced decay, especially in the tall mixed and pure N. dombeyi and N. pumilio stands. However, in the N. antarctica/mixed scrub and the A. chilensis stands, deadwood was more evenly distributed to the decomposition classes (Table 3). In the N. antarctica/mixed scrub, and mixed N. dombeyi-A. chilensis and pure N. dombeyi stands, the size of the wood pieces in the decomposition classes tended to increase from class I to IV. In contrast, in the A. chilensis and especially the N. pumilio forests, all decomposition classes contained wood pieces of more similar size (Table 3).
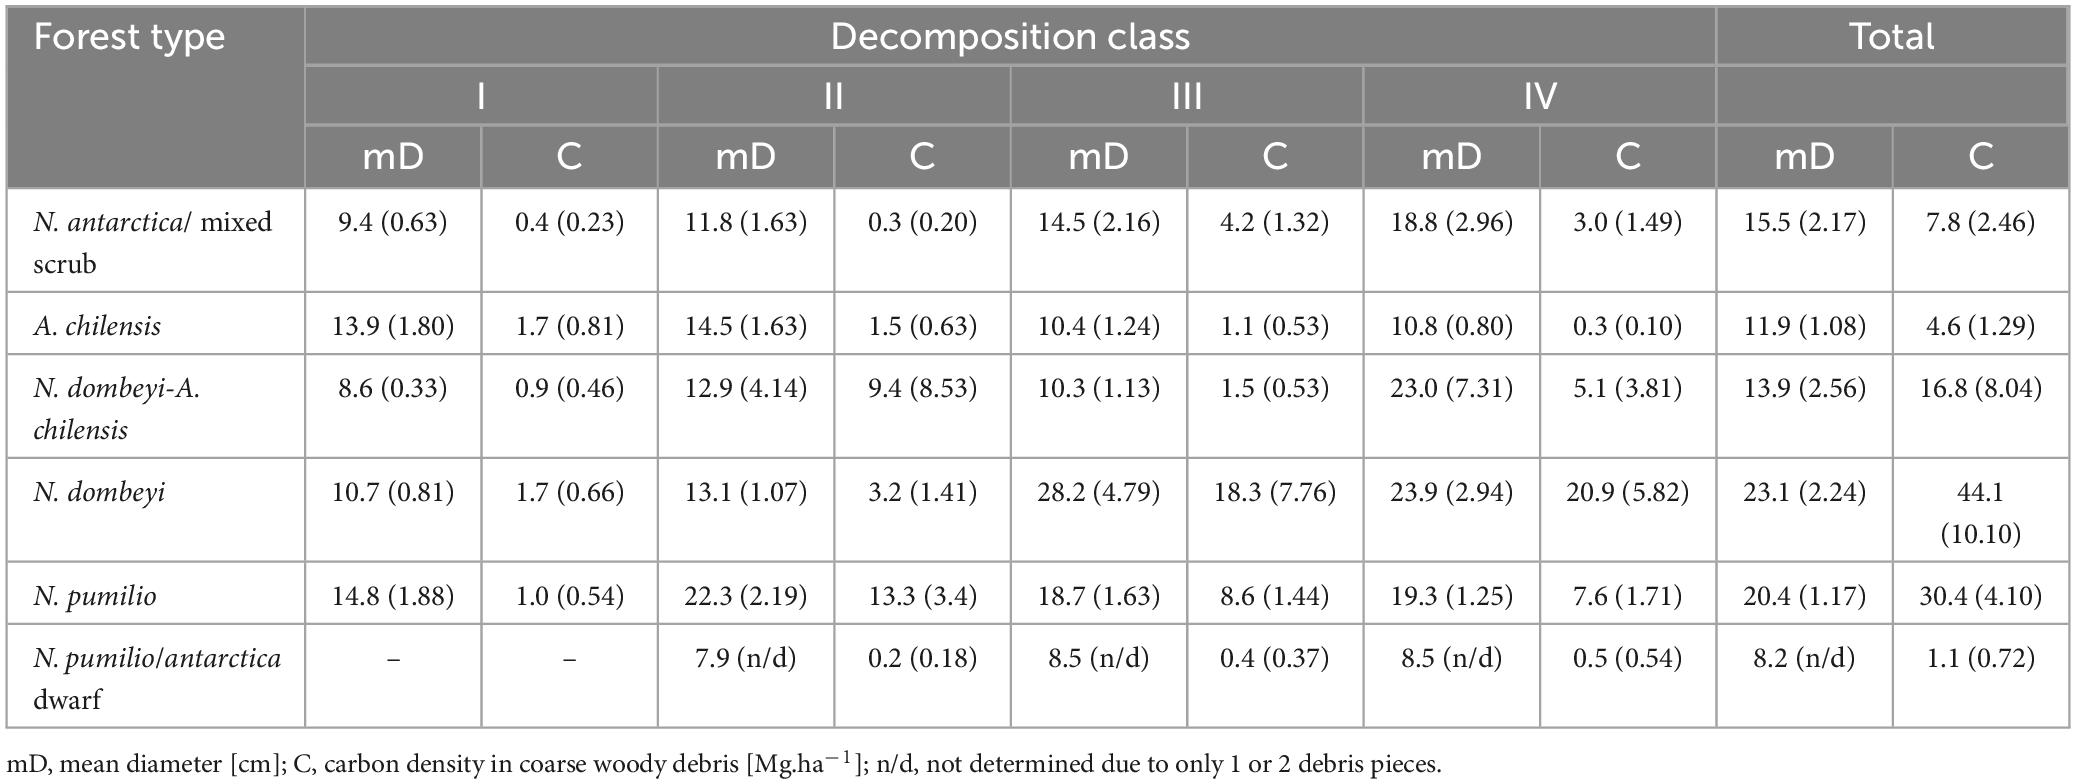
Table 3. Means (+ SE in brackets) of the diameter and carbon density of coarse woody debris (cddAGB) pieces in four decomposition classes (I to IV) in the six forest types.
We found a significant positive correlation (r = 0.53; p < 0.0001) between the carbon density in the downed aboveground deadwood fraction and the live aboveground biomass across all plots. This is largely due to the high amount of coarse woody debris in the tall mixed and pure N. dombeyi and N. pumilio stands (Figures 3, 5). The proportion of the carbon contained in deadwood (standing+downed) to that in total aboveground wood mass (live and dead) reached 62% in the N. antarctica/mixed scrub, which is the highest value of all forest types.
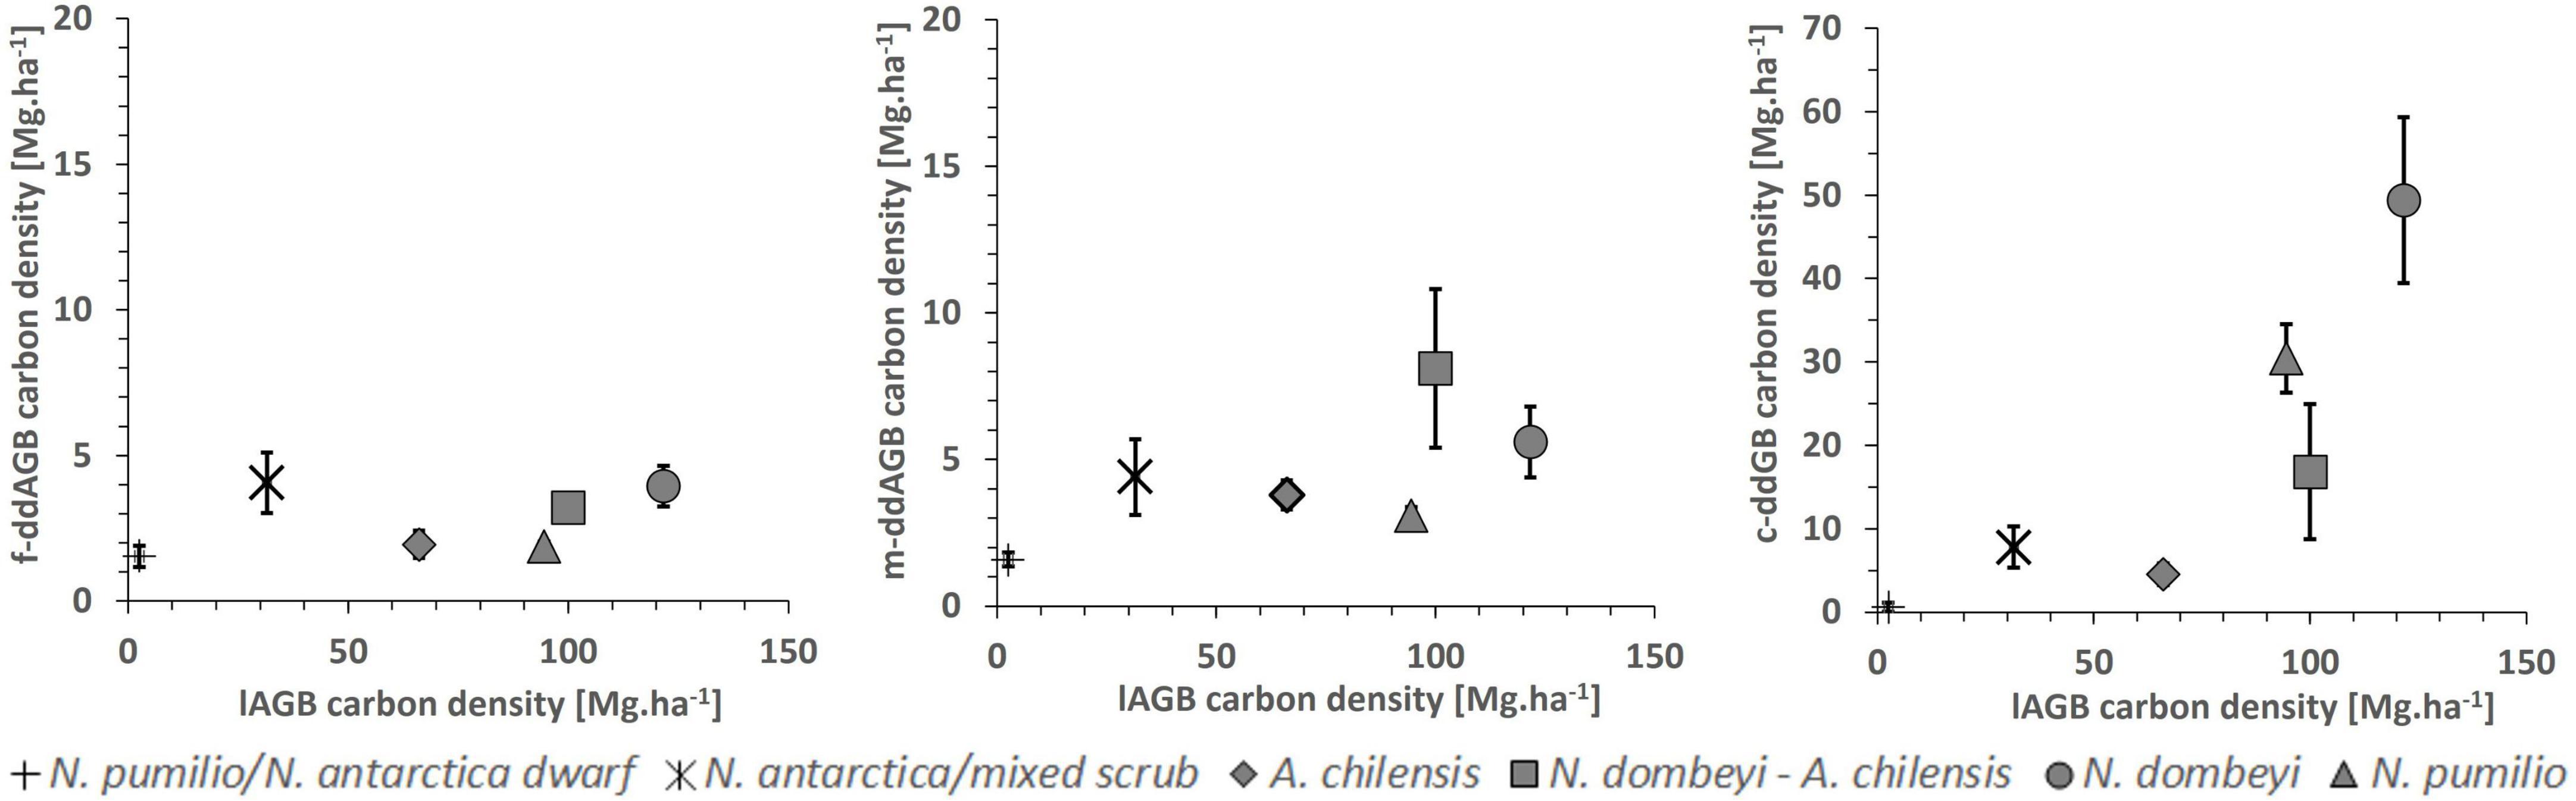
Figure 5. Carbon density in downed aboveground deadwood mass (ddAGB; means ± SE) in dependence on aboveground biomass (lAGB) in the six forest types. Left figure: fine debris fraction; center figure: medium-sized debris fraction; right figure: coarse debris fraction.
3.2.3 Topsoil carbon density
The mean carbon density in the topsoil (organic layer plus 0–20 cm mineral soil) was not significantly different between the studied forest types (p = 0.69), with values ranging from 98 to 124 Mg.ha–1 (Table 4). Regarding the carbon density of the soil organic layer, only the mixed N. dombeyi-A. chilensis forests differed significantly with 20 Mg.ha–1 (p = 0.0007) from the other forest types, which ranged between 8 and 12 Mg.ha–1. The SOC concentration in the organic layer material was higher in the mixed and pure N. dombeyi and pure N. pumilio forests (37 to 42%) than in the A. chilensis stands (28%) (Table 4). No significant differences were found between the forest types in the SOC concentration of the mineral soil in the depth layers 0–10 cm and 10–20 cm (p = 0.2072 and 0.1224, respectively), nor in the corresponding carbon density (p = 0.62 and 0.24, respectively). We measured a lower soil bulk density at 0–10 and 10–20 cm depth in the N. pumilio forests than in all other forest types, which differed not significantly from each other (Table 4).
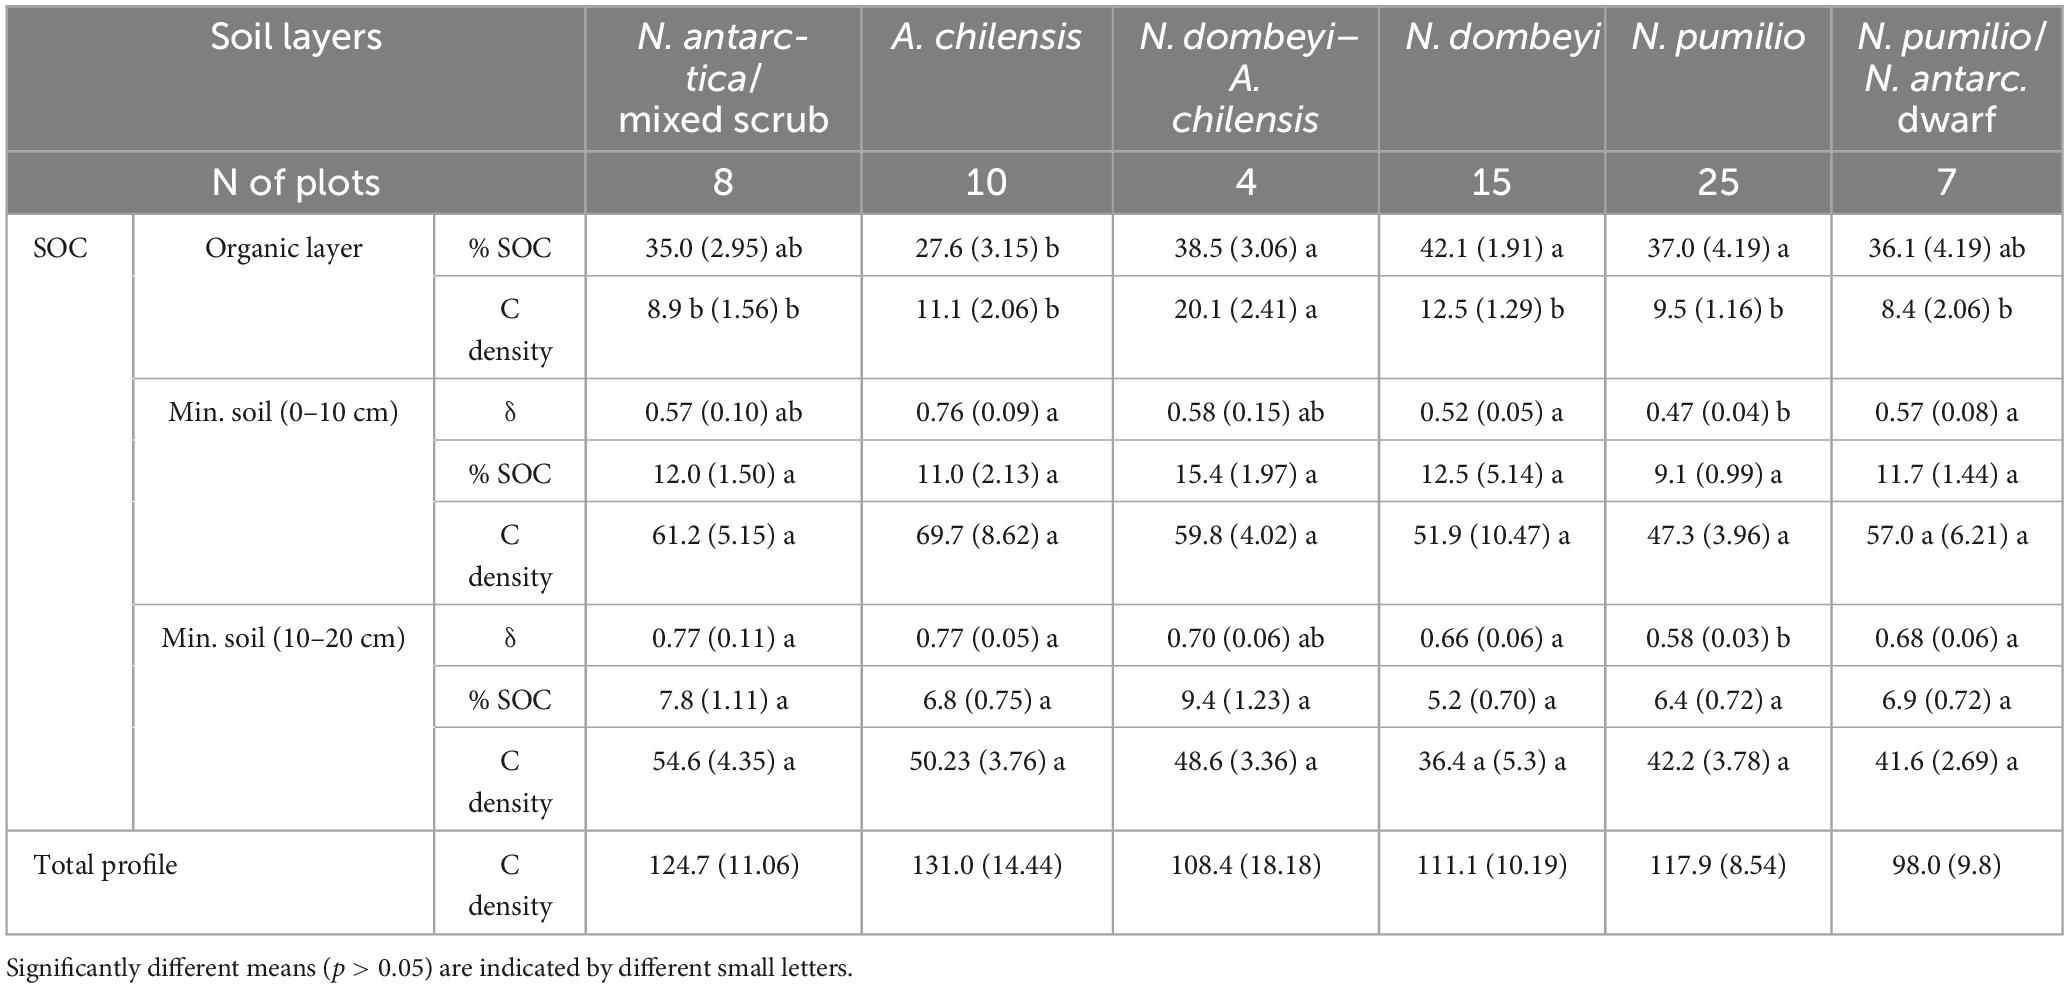
Table 4. Means (± SE) of soil organic carbon (SOC) concentrations (%), carbon density [Mg.ha–1], and of soil bulk density (δ) [g.cm–3] in the organic layer and the mineral soil layers at 0–10 cm and 10–20 cm depth.
In all forest types, the carbon density in the soil decreased from the 0–10 cm to the 10–20 cm layer by 5–19 Mg.ha–1 (p < 0.0001) (Table 4). No relationship was detected between the carbon density of the soil organic layer or the mineral topsoil and aboveground biomass (Figure 6).
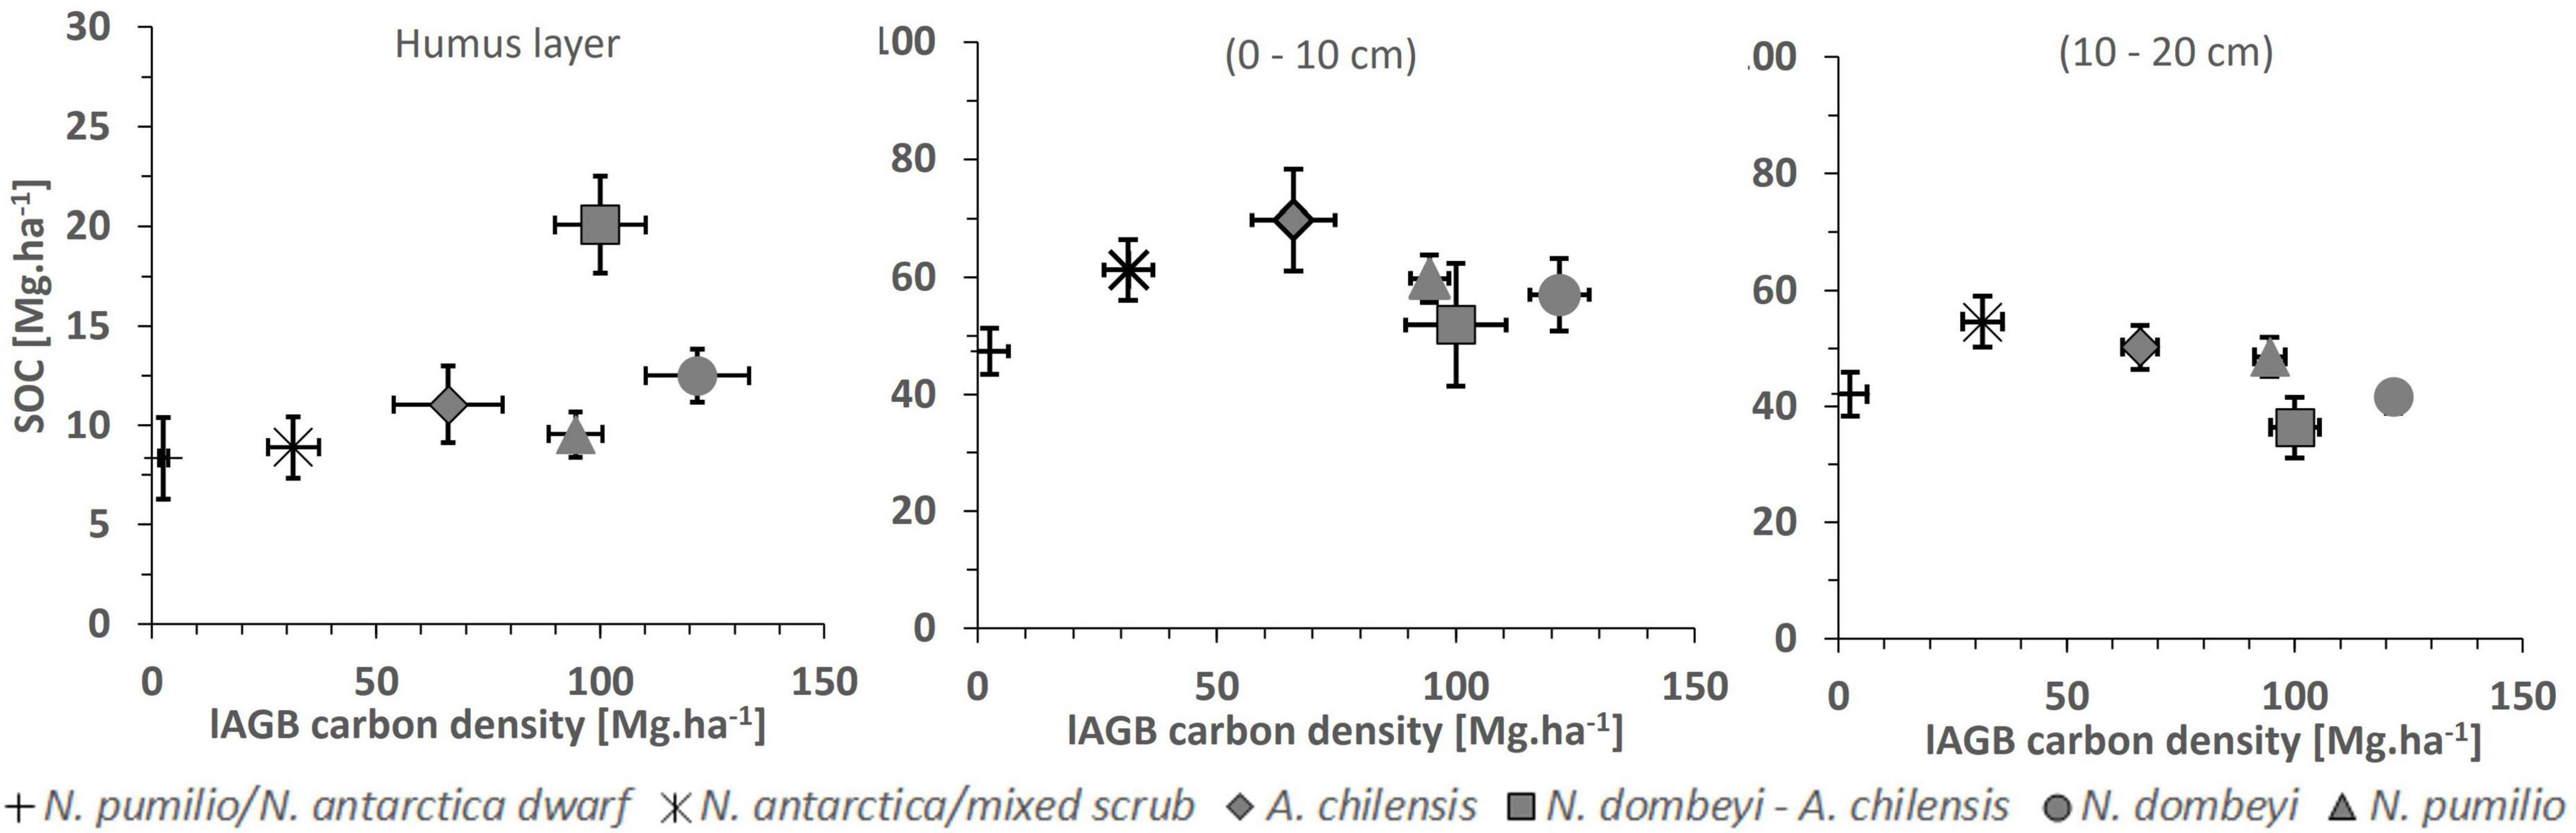
Figure 6. Soil organic carbon (SOC) density (means + SE, vertical bars) in the soil organic layer (left figure), and in the mineral soil at 0–10 cm (center figure) and 10–20 cm depth (right figure) in relation to aboveground biomass (lAGB; means + SE, horizontal bars) in the six forest types. None of the SOC-lAGB relationships is significant at p < 0.05.
4 Discussion
In the present study, we determined reference values for the carbon density in the different wood mass and soil pools and estimated the carbon sequestration rate through wood production of the main forest types of the eastern Andean slope in northern Patagonia, being the first of its kind in the region. The study design allowed us to capture the variation in forest biometric variables along the two main environmental gradients, i.e., the west-east precipitation gradient and the elevational temperature gradient. The biomass determination and its conversion to carbon were carried out with available specific allometric biomass functions and conversion factors, tools that should be improved in the future to achieve greater precision. Notably, the estimated root biomass values for A. chilensis are certainly too low with around 10% of total biomass, considering that roots typically contribute 20–29% of biomass in coniferous forests (Eggleston et al., 2006). We therefore assume that the utilized biomass function is underestimating root biomass in this species. Our knowledge about the carbon concentration in the different biomass compartments of the studied species should also be improved, as we have used the default value of 50% carbon in the dry mass (Eggleston et al., 2006) in several species. Finally, we consider the estimates of average carbon sequestration rate to be preliminary, as they are based on simple individual functions derived for each species from the limited available data (Table 1 and Supplementary Figure 2). The functions should be improved by considering the effects of site quality, tree age and stem density of the stands, the latter factor considering the impact of competition.
As mentioned earlier, most of the forests studied here established after massive anthropogenic fires at the beginning of the 20th century (Willis, 1914; Veblen and Lorenz, 1987; Kitzberger and Veblen, 1999; Veblen et al., 2003; Gowda et al., 2012, 2023; Kitzberger, 2012) and thus represent post-fire secondary forests. This is confirmed by the recorded age of the dominant trees (determined at 1.3 m height) in the naturally developed age-cohorts, which ranged below 100 years. With QMD values ranging from 18 to 44 cm, many of these stands likely are still in a late stage of the stem exclusion phase (Oliver and Larson, 1996), where intraspecific competition is intense. In contrast, the N. pumilio forests on the cooler upper slopes, and some patches of N. dombeyi forest in the humid section of the transects, had ages of the dominant trees exceeding 200 to 300 years. This suggests that they have not been reached by the fires that happened about 120 years ago.
The measured stand structural variables (dominant height, basal area, wood volume, biomass and annual biomass increment) clearly reflect higher values in tall forest types than in shrublands, which were achieved on the lower and mid-elevation slope in the course of succession processes. The values of all variables are lowest in the shrublands formed by resprouting species, increase toward the A. chilensis stands, and are highest in stands dominated by N. dombeyi (Veblen et al., 1996; Loguercio, 1997; Gowda et al., 2012; Kitzberger, 2012). However, the successional development varies locally in its direction and velocity, as tree species turnover is influenced by soil and topo-climatic conditions, seed availability, and fire return intervals (Mermoz et al., 2005; Landesmann et al., 2016; Tiribelli et al., 2018). Nevertheless, our results support our first hypothesis, as the carbon density in the biomass and the C sequestration with increment increase in postfire forest types from mixed shrubland to the tall forest types (pure and mixed A. chilensis and N. dombeyi stands), while they reach intermediate values in the N. pumilio stands.
Our mean total biomass C density values of mixed N. dombeyi-A. chilensis forests (ca. 125 Mg.C ha–1) are comparable to those obtained by Perez-Quezada et al. (2023) in Chilean mixed N. dombeyi forests (although with admixture of other Nothofagus species). In the same study, the authors reported for A. chilensis forests higher C densities than we did (108 vs. 76 Mg.C ha–1); this may be due to the fact that our plots of this forest type had only moderate stem densities. Our high living and dead biomass C density values of the N. dombeyi forests (228 Mg.C ha–1) were even smaller than values measured in Chilean Nothofagus-dominated old-growth forests (Schlegel and Donoso, 2008), probably reflecting higher precipitation and greater stand age. Similarly, evergreen broad-leaved forest on perhumid Chiloe Island reached high biomass C densities between 286 and 384 Mg C ha–1 (Battles et al., 2002; Perez-Quezada et al., 2015). Total ecosystem carbon (which includes dead mass and SOC) of broadleaved evergreen old-growth forests in Central Chile (Valdivia) reached even 607 Mg.ha–1 (Gayoso, 2001).
Our data for aboveground biomass C in the taller Nothofagus and Austrocedrus forests (ca. 60–170 Mg.ha–1) fit well to data from northern hemispheric temperate forests, which are predominantly from managed stands. Klein and Schulz (2011) reported an average carbon density in the living biomass of 130 Mg.ha–1 for managed European beech (Fagus sylvatica L.) forests in S Germany. Röhrig (1991) gives a range of 108 – 210 Mg. ha–1 for managed mature beech forests. Lal (2005) reports a range of 60 –130 Mg.ha–1 for temperate forests more generally. True virgin forests can store up to 20% more C in the biomass than mature managed forests of the same species. For example, virgin beech forests have carbon densities in the aboveground biomass of ca. 195 Mg.ha–1, while nearby managed beech forests at maturity stored ca. 160 Mg.ha–1 (Glatthorn et al., 2018). Especially the tall N. dombeyi forests in Patagonia are not only as rich in biomass C as structurally similar European beech forests, but also compare well to tropical moist forests (mean: 143 Mg.ha–1, Luyssaert et al., 2007). Given that most of our N. dombeyi forests were less than 100 years old, even higher carbon densities must occur in true old-growth N. dombeyi stands than recorded here. Particularly high biomass C densities can be found in some highly productive temperate coniferous forests in North America: Janisch and Harmon (2002) measured biomass C densities of 100 and 200 Mg.ha–1 in secondary Pseudotsuga-Tsuga forests at ages of 50 and 100 years, respectively, while old-growth stands (age of 300–500 years) stored up to 300 Mg.ha–1. This is far higher than in the Patagonian A. chilensis forests (ca. 70 Mg.ha–1) and also exceeds the most biomass-rich old N. dombeyi forests in our study. Our low estimates of biomass C for the N. antarctica/mixed scrub (ca. 35 Mg.ha–1) are similar to values reported by Peri et al. (2010) for low-quality sites (site class V) in southern Patagonia.
A characteristic of the studied forests is that the carbon density in deadwood is typically high, with most of it referring to lying trunks and branches (21 to 70 Mg.ha–1, 70–78% of deadwood C contained in the lying fraction). Our results of C in lying deadwood of N. pumilio forests (35.5 Mg.ha–1) were slightly higher than values reported from natural forests of the species in Chilean Tierra del Fuego (30 Mg.ha–1, Klein et al., 2008), but similar to data from Argentinean Tierra del Fuego by Weber (1999) (34.4 Mg.ha–1). While the proportion of deadwood in total wood mass varies across northern hemispheric forest types (including boreal and various temperate forest types) between 9 and 15% (EPA, 2010), we found a higher proportion of 20–30% in the northern Patagonian forests types (excluding N. pumilio/N. antarctica dwarf forests). Across the studied forest types (again excluding N. pumilio/N. antarctica dwarf forests), an average deadwood C stock of 29 Mg.ha–1 was recorded, which is almost double the average of 15 Mg.ha–1 given for forests in the Pacific Northwest of the USA (Woodall et al., 2008, 2013). For tropical moist forests, Pregitzer and Euskirchen (2004) give a maximum median value of 25 Mg.ha–1, which indicates that coarse woody debris amounts are typically much lower than found in Patagonia. Our values are also higher than numbers reported by Harmon et al. (1986) for North American deciduous forests (23 Mg.ha–1 at early- to mid-successional stages and 36 Mg.ha–1 in old-growth forests). However, they are lower than deadwood C stocks determined in oceanic broad-leaved evergreen forests in Chiloe (Central Chile) [89 Mg.ha–1 in early- to mid-successional stages (33% downed) and even 173 Mg.ha–1 in old-growth forests (73% downed)] (Carmona et al., 2002). Our values are also smaller than measured in Slovak beech virgin forests (ca. 40 Mg.ha–1; Glatthorn et al., 2018). The Chilean forests experience a very high precipitation (> 5,000 mm.yr–1) and thus are more productive than forests in our region. Time since the last major fire (or large-scale logging event) is another important deadwood-influencing factor. If fires were absent or rare in future times, it is likely that the deadwood amounts will still increase in our forest types.
In the Patagonian forests, the carbon density of deadwood was mainly contained in downed logs (i.e., in the coarse woody debris category with diameters ≥ 7.5 cm); the only exception was the N. pumilio/N. antarctica dwarf forest with only 27% in this category. The proportion of coarse woody debris increased from the A. chilensis and N. antarctica/mixed scrub (42 and 48%) to the N. dombeyi and N. pumilio forests (84 and 86%, respectively). The latter percentage values are even higher than those found by Woodall et al. (2013) in the productive forests of the Pacific Northwest of the USA (73%), where deadwood C stocks were only half the size of the Patagonian values.
Since downed logs are so important in the deadwood amount of northern Patagonian forests, we found a positive relation between the C density in coarse woody debris and the corresponding standing biomass across the forest types (Figure 5, right), in support of our second hypothesis. One reason for this outcome is that our forests are mostly cohort-like, mature, post-disturbance stands, that are fully stocked and subject to intensive self-thinning (Veblen et al., 2003). An exception are the A. chilensis stands, in which the number of downed logs was lower than expected, probably due to a more intensive extraction of dead wood by the local population, when located in proximity to roads. In all studied forest types, we found the size of C stocks in downed coarse woody debris to be higher in the highest decomposition classes. This may be seen as a consequence of fires in the past, that left many burnt logs which are nowadays in a stage of advanced decomposition. The effect of forest management on the abundance of downed logs is exemplified by European beech forests in Bavaria (Germany), where stands without management since 45 to 110 years had deadwood carbon densities of 12 to 32 Mg.ha–1, while nearby managed forests contained only 4.2 to 5.6 Mg.ha–1 (Krüger et al., 2012).
In rejection of our third hypothesis, we found no significant differences in the C density of fine woody debris between the N. antarctica/mixed scrub and the high forest types. On the contrary, in the diameter class <0.5 cm, which corresponds to the fuel class with a lag-time of 1 h (Woodall and Monleon, 2008), N. dombeyi forests reached the highest C density value of 0.7 Mg.ha–1 (Supplementary Figure 3). This could result from the fact that, in the self-thinning phase, the death of shrubs and trees with intermediate and suppressed social position will also contribute considerable amounts of fine dead material. This may have the consequence that these dense and tall forests in the self-thinning phase could be as fire-prone as are shrublands (Veblen et al., 2003; Mermoz et al., 2005; Tiribelli et al., 2018, 2019), if the synoptic meteorological conditions are favoring the outbreak of fires (Kitzberger et al., 2022).
Our soil analyses gave with 100 to 130 Mg.ha–1 relatively high SOC amounts, given that we investigated only the soil organic layer and the upper 20 cm of mineral soil. These C densities are slightly lower than values reported for Patagonian native forests (144 Mg.ha–1 up to 30 cm depth) in a recent country-wide assessment (Peri et al., 2024). Our results are similar to values reported by Lal and Lorenz (2012) for temperate forests, where 50–128 Mg C ha–1 were measured to a depth of 30 cm in forests with a cool humid climate, with particularly high contents (128 ± 55 Mg.ha–1) found in volcanic soils. Our SOC densities from the N. antarctica/mixed scrub are even higher than measured in the same depths at the best sites in pure N. antarctica forests in Southern Patagonia (Peri et al., 2010). Typically, SOC constitutes up to 60% of the total carbon stored in temperate forests (Lal, 2005; Scharlemann et al., 2014). With our measurements to 20 cm depth, we found highly variable SOC percental fractions in total ecosystem carbon, ranging from 33% in the N. dombeyi forests to 67% in the N. antarctica/mixed scrub, and finally to 91% in the N. pumilio/N. antarctica dwarf forests, where standing biomass is low.
In our study, the topsoil SOC pool was not significantly different between the studied forest types, and, therefore, our hypothesis that topsoil carbon density increases with advancing secondary forest succession is not confirmed. Several factors likely have contributed to this outcome. The high carbon density found in the mineral soil of the A. chilensis stands is mainly due to the higher soil bulk density (0.75 g.cm–3) at these sites, while elevated SOC values in the N. pumilio forests mirror higher C concentrations (12.5%), which might reflect higher productivity. While tree species effects on SOC stocks have been addressed in several studies (e.g., Augusto and Boèa, 2022), such effects are in our study largely superimposed by the disturbance regime. Fire commonly leads to SOC losses, because it burns both plant biomass and organic soil layers, promotes erosion and increases leaching of dissolved C, which subsequently reduces plant productivity and thus C inputs, while triggering C losses that can persist for several years to decades (Pellegrini et al., 2022). How much of the SOC in organic layers and mineral soil is lost, depends on fire intensity (Brown et al., 2003; Lal, 2005; Lorenz and Lal, 2009; Pellegrini and Jackson, 2020; Pellegrini et al., 2022). Various studies in temperate and boreal forests have shown that between 15 and, at the maximum, nearly 100% of the SOC pool can be lost in intense fires (Neff et al., 2005; Bormann et al., 2008). With respect to forest ecosystem health, it is important that not only large amounts of greenhouse gases are emitted, but the ecosystem C pool, future forest productivity and the associated C sequestration potential are reduced as well (Lal and Lorenz, 2012). From the fairly uniform SOC densities in the topsoil across the six forest types from shrubland to high forest, one may assume that historic fire intensity has been low to moderate across the study region and must have affected the sites in a rather homogeneous way. On the other hand, it is possible that fire-induced reductions in SOC are not lasting for long, since at least the SOC in the organic layer has been found to recover relatively fast with secondary succession over several decades, when litter input is sufficient. SOC recovery may be supported by the typically high carbon storage capacity of volcanic soils (Lal, 2005; Pellegrini and Jackson, 2020), which prevail in the study region.
5 Conclusion and implications for forest management, fire adaptation and climate change mitigation
According to our carbon density data, secondary forest succession from mixed shrubland to tall forests at low and mid elevations would lead over decades to an increase in the carbon storage and sequestration potential of the forest ecosystems. On the other hand, the occurrence of large-scale disturbances such as fires that revert the forest sequence to early-successional stages, would result in considerable net CO2 emissions to the atmosphere and were associated with a reduction in C sequestration capacity. Thus, in a pure or mixed mature forest of N. dombeyi and A. chilensis, which is converted to N. antarctica/mixed scrub by a wildfire, net emissions and a reduction in the C sequestration capacity may range from 100 to 150 Mg.ha–1, and 0.3 to 1.2 Mg.ha–1.yr–1, respectively. If massive fires can be excluded, and seed sources of surviving N. dombeyi and/or A. chilensis trees are available in the first decades after the fire, carbon stocks and sequestration rate could increase by the same extent in the course of secondary forest succession.
Most forest stands have developed fairly high stem densities due to the prevalence of cohort-like community structures after fire at many sites and low extraction of timber until final harvest at maturity. Without large-scale disturbance and/or forest management policy initiatives, we expect the current trends of increasing stand density to continue, if not counteracted by increasing self-thinning. Forest management activities to increase the resistance and resilience of these forest ecosystems to disturbances such wildfires and drought may need to explicitly address tree density reduction at strategic scales.
In northern Patagonia, N. antarctica/mixed scrub is more fire-prone than other forest types, as it reacts to fire with rapid clonal spread and thus an accumulation of fine debris which acts as fuel. Due to its low stature and smaller leaf area, the species also favors the development of a microclimate with higher vapor pressure deficits than in taller forests (Simon et al., 2024), thereby triggering an increasing displacement of the latter by shrubland (Mermoz et al., 2005). This may also be exacerbated by the warming and drying of climate (Kitzberger et al., 2022).
Given this scenario, forest management measures in the N. antarctica/mixed scrub that accelerate progressive succession toward high forest and reduce stand density through thinning in the growing forest appear to be appropriate climate change adaptation and mitigation strategies at sites where tall-forest species can develop (Tognetti et al., 2022). This also implies that if there is no regeneration of A. chilensis and/or N. dombeyi in the shrub stands, their establishment should be promoted through reforestation. Their subsequent release through selective thinning may accelerate their growth to reduce the time needed for forest conversion. These measures of stand conversion and density regulation could also increase the system’s carbon storage and sequestration capacity. On the other hand, maintaining the presence of early-successional species in the tall late-successional forests could increase the resilience of these forests by allowing for faster recovery after a devastating fire.
Finally, we emphasize that supporting the conversion of early- to late-successional forest types in suitable sites and with appropriate silvicultural measures could also increase the amount and quality of sawn wood produced. This includes a shift from species primarily used for firewood (N. antarctica/mixed scrub) to species suitable for producing good-quality sawn wood (A. chilensis and/or N. dombeyi). However, there is no sufficient information on the site conditions and the time frame needed for the proposed conversions to take place, either by natural development without disturbance, or supported by well-designed management. The silvicultural schemes that promote these conversions and the necessary time scales must be subject of future research.
Data availability statement
The original contributions presented in this study are included in the article/Supplementary material, further inquiries can be directed to the corresponding author.
Author contributions
GL: Conceptualization, Data curation, Formal analysis, Investigation, Methodology, Supervision, Validation, Visualization, Writing – original draft, Writing – review & editing. AS: Conceptualization, Formal analysis, Methodology, Validation, Writing – original draft, Writing – review & editing. AW: Validation, Visualization, Writing – review & editing. HI: Investigation, Validation, Writing – review & editing. ER: Investigation, Validation, Writing – review & editing. MC: Formal analysis, Validation, Writing – review & editing. FH: Validation, Visualization, Writing – review & editing. CL: Conceptualization, Validation, Writing – review & editing. HW: Conceptualization, Funding acquisition, Methodology, Project administration, Supervision, Validation, Writing – original draft, Writing – review & editing.
Funding
The authors declare that financial support was received for the research, authorship, and/or publication of this article. The project was supported by funds of the Federal Ministry of Food and Agriculture (BMEL) based on a decision of the Parliament of the Federal Republic of Germany via the Federal Office for Agriculture and Food (BLE, grant No. 28I-042-01), and by funds of CIEFAP (P71 1803), which is gratefully acknowledged.
Acknowledgments
This study is imbedded in the international and interdisciplinary research project “Sustainable forest management of temperate deciduous forests–northern and southern hemispheric beech forests” (KLIMNEM), a cooperation between the University of Göttingen (Germany), Free University of Bozen-Bolzano (Italy), and the Andean Patagonian Forest Research and Extension Centre (CIEFAP, Argentina). We thank the Nahuel Huapi National Park, the Rio Azul-Lago Escondido Protected Natural Area, as well as the land owners who granted us permits for access to the sampled forests, and to the Rio Negro Forest Service for their collaboration.
Conflict of interest
The authors declare that the research was conducted in the absence of any commercial or financial relationships that could be construed as a potential conflict of interest.
Publisher’s note
All claims expressed in this article are solely those of the authors and do not necessarily represent those of their affiliated organizations, or those of the publisher, the editors and the reviewers. Any product that may be evaluated in this article, or claim that may be made by its manufacturer, is not guaranteed or endorsed by the publisher.
Supplementary material
The Supplementary Material for this article can be found online at: https://www.frontiersin.org/articles/10.3389/ffgc.2024.1373187/full#supplementary-material
References
Amoroso, M. M., Suarez, M. L., and Daniels, L. D. (2012). Nothofagus dombeyi regeneration in declining Austrocedrus chilensis forests: Effects of overstory mortality and climatic events. Dendrochronologia 30, 105–112. doi: 10.1016/j.dendro.2010.12.005
Assmann, E. (1970). The principles of forest yield study: Studies in the organic production, structure, increment, and yield of forest stands. Oxford: Pergamon.
Augusto, L., and Boèa, A. (2022). Tree functional traits, forest biomass, and tree species diversity interact with site properties to drive forest soil carbon. Nat. Commun. 13:1097. doi: 10.1038/s41467-022-28748-0
Battles, J. J., Armesto, J. J., Vann, D. R., Zarin, D. J., Aravena, J. C., Perez, C., et al. (2002). Vegetation composition, structure, and biomass of two unpolluted watersheds in the cordillera de Piuchué, Chiloé Island, Chile. Plant Ecol. 158, 5–19. doi: 10.1023/A:1014741821292
Bonan, B. (2008). Forests and climate change: Forcings, feedbacks, and the climate benefits of forests. Science 320, 1444–1449. doi: 10.1126/science.1155121
Bormann, B. T., Homann, P. S., Darbyshire, R. L., and Morrissette, B. A. (2008). Intense forest wildfire sharply reduces mineral soil C and N: The first direct evidence. Can. J. For. Res. 38, 2771–2783. doi: 10.1139/X08-136
Bravo-Oviedo, A., Pretzsch, H., Ammer, C., et al. (2014). European mixed forests: Definition and research perspectives. For. Syst. 23, 518–533.
Brown, D. (2005). Construcción de modelos de estimación de biomasa y aérea foliar para diez especies arbóreas urbanas de la ciudad de Santiago. Valdivia: Universidad de Chile.
Brown, J. K. (1974). Handbook for Inventorying downed woody material. Ogden, UT: US Department of Agriculture, Forest Service, Intermountain Forest and Range Experiment Station.
Brown, J. K., Reinhardt, E. D., and Kramer, K. A. (2003). Coarse woody debris: Managing benefits and fire hazard in the recovering forest. Ogden, UT: US Department of Agriculture, Forest Service, Rocky Mountain Research Station.
Buduba, C., La Manna, L., and Irisarri, J. (2020). “El suelo y el bosque en la región andino patagónica,” eds P. Imbellone and O. Barbosa (Buenos Aires: Asociación Argentina de la Ciencia del Suelo), 361–390. doi: 10.24215/25456377e139
Burns, S. L., Cellini, J. M., Lencinas, M. V., Martínez Pastur, G. J., and Rivera, S. M. (2010). Description of possible natural hybrids between Nothofagus pumilio and N. antarctica at South Patagonia (Argentina). Bosque 31, 9–16.
Carmona, M. R., Armesto, J. J., Aravena, J. C., and Pérez, C. A. (2002). Coarse woody debris biomass in successional and primary temperate forests in Chiloé Island, Chile. For. Ecol. Manag. 164, 265–275. doi: 10.1016/S0378-1127(01)00602-8
Caselli, M., Loguercio, G. A., Urretavizcaya, M. F., and Defossé, G. E. (2021). Stand level volume increment in relation to leaf area index of Austrocedrus chilensis and Nothofagus dombeyi mixed forests of Patagonia, Argentina. For. Ecol. Manag. 494:119337. doi: 10.1016/j.foreco.2021.119337
CIEFAP, and MAyDS. (2016). Actualización de la clasificación de tipos forestales y cobertura del suelo de la región bosque andino patagónico. Esquel: CIEFAP.
Colmet Daage, F., Marcolin, A., Lopez, C. R., Lanciotti, M. L., Ayesa, J. A., Bran, D. E., et al. (1988). Características de los suelos derivados de cenizas volcánicas de la cordillera y precordillera del norte de la Patagonia, convenio INTA-ORSTOM. Río Negro: SC de Bariloche.
Conti, G., and Díaz, S. (2012). Plant functional diversity and carbon storage - an empirical test in semi-arid forest ecosystems. J. Ecol. 101, 18–28. doi: 10.1111/1365-2745.12012
Davies, B. E. (1974). Loss-on-ignition as an estimate of soil organic matter. Soil Sci. Soc. Am. Proc. 38, 150–151.
Dezotti, A. (2000). Subantarctic forest ecology: Case study of a coniferous-broadleaved stand in Patagonia, Argentina. Wageningen: Wageningen University.
Donoso, C., González, M., and Lara, A. (2014). Ecología forestal. Bases para el manejo sustentable y conservación de los bosques nativos de Chile. Valdivia: Ediciones UACH.
Eggleston, H. S., Buendia, L., Miwa, K., Ngara, T., and Tanabe, K. (2006). 2006 IPCC guidelines for national greenhouse gas inventories. Hayama: Institute for Global Environmental Strategies (IGES) for the IPCC.
EPA (2010). Inventory of U.S. greenhouse gas emissions and sinks: 1990-2008. EPA430-R-10-006. Washington, DC: Environmental Protection Agency.
Fernandez, I. J., Son, Y., Kraske, C. R., Rustad, L. E., and David, M. B. (1999). Soil carbon dioxide characteristics under different forest types and after harvest. Soil Sci. Soc. Am. J. 57, 1115–1121.
Forrester, D. I., and Bauhus, J. (2016). A review of processes behind diversity–productivity relationships in forests. Curr. For. Rep. 2, 45–61.
Gayoso, J. (2001). Medición de la capacidad de captura de carbono en bosques nativos y plantaciones de Chile. Rev. For. Iberoam. 1, 1–13.
Gayoso, J., Guerra, J., and Alarcón, D. (2002). Contenido de carbono y funciones de biomasa en especies nativas y exóticas. Documento N°1. Proyecto FONDEF Medición de la capacidad de captura de carbono en bosques de Chile y promoción en el mercado mundial. Valdivia: Universidad Austral de Chile Instituto Forestal.
Glatthorn, J., Feldmann, E., Pichler, V., Hauck, M., and Leuschner, C. (2018). Biomass stock and productivity of primeval and production beech forests: Greater canopy structural diversity promotes productivity. Ecosystems 21, 704–722. doi: 10.1007/s10021-017-0179-z
González, M., Lara, A., Urrutia-Jalabert, R., Bustos-Salazar, A., Aravena, J. C., and Ruiz, C. (2022). Carbon stocks across different environments, disturbance regimes and stand age in the longest-lived forests of the southern hemisphere. Front. For. Glob. Change 5:960429. doi: 10.3389/ffgc.2022.960429
Gowda, J. H., Kitzberger, T., and Gonzalez Musso, R. (2023). Modelos de cambio en cobertura forestal de la cuenca del río Manso inferior ¿Una herramienta para definir estrategias de manejo? Bosque 44, 271–282.
Gowda, J. H., Kitzberger, T., and Premoli, A. C. (2012). Landscape responses to a century of land use along the northern Patagonian forest-steppe transition. Plant Ecol. 213, 259–272. doi: 10.1007/s11258-011-9972-5
Gower, S. T. (2003). Patterns and mechanisms of the forest carbon cycle. Annu. Rev. Environ. Resour. 28, 169–204. doi: 10.1146/annurev.energy.28.050302.105515
Gyenge, J., Fernandez, M. E., Sarasola, M., Urquiza, M., and Schlichter, T. (2009). Ecuaciones para la estimación de biomasa aérea y volumen de fuste de algunas especies leñosas nativas en el valle del Río Foyel, NO de la Patagonia Argentina. Bosque 30, 95–101.
Harmon, M. E., and Sexton, J. (1996). Guidelines for measurements of woody detritus in forest ecosystems: U.S. LTER network office. Seattle, WA: University of Washington, 73.
Harmon, M. E., Franklin, J. F., Swanson, F. J., Sollins, P., Gregory, S. V., Lattin, J. D., et al. (1986). Ecology of coarse woody debris in temperate ecosystems. Adv. Ecol. Res. 15, 133–302.
Hildebrand-Vogel, R., Godoy, R., and Vogel, A. (1990). Subantarctic-Andean Nothofagus pumilio forest. Vegetatio 89, 55–68.
Hoover, C. M., and Smith, J. E. (2021). Current aboveground live tree carbon stocks and annual net change in forests of conterminous United States. Carbon Balance Manag. 16:17. doi: 10.1186/s13021-021-00179-2
Houghton, R. A. (2005). Aboveground forest biomass and the global carbon balance. Glob. Change Biol. 11, 945–958.
Idoate-Lacasia, J., Stillhard, J., Portier, J., Brang, P., Zimmermann, S., Bigler, C., et al. (2024). Long-term biomass dynamics of temperate forests in Europe after cessation of management. For. Ecol. Manag. 554:121697. doi: 10.1016/j.foreco.2024.121697
IUSS Working Group WRB (2015). World reference base for soil resources 2014, update 2015. International soil classification system for naming soils and creating legends for soil maps. World soil resources reports no. 106. Rome: FAO.
Janisch, J. E., and Harmon, M. E. (2002). Successional changes in live and dead wood carbon stores: Implications for net ecosystem productivity. Tree Physiol. 22, 77–89.
Janowiak, M., Connelly, W. J., Dante-Wood, K., Domke, G. M., Giardina, C., et al. (2017). Considering forest and grassland carbon in land management. Washington, DC: USDA.
Johnson, D. W., and Curtis, P. S. (2001). Effects of forest management on soil C and N storage: Meta analysis. For. Ecol. Manag. 140, 227–238.
Kaarakka, L., Cornett, M., Domke, G., Ontl, T., and Dee, L. (2021). Improved forest management as a natural climate solution: A review. Ecol. Solut. Evid. 2:e12090. doi: 10.1002/2688-8319.12090
Karger, D. N., Conrad, O., Böhner, J., Kawohl, T., Kreft, H., Soria-Auza, R. W., et al. (2017). Climatologies at high resolution for the earth’s land surface areas. Sci. Data 4:170122. doi: 10.1038/sdata.2017.122
Keith, H., Mackey, B. G., and Lindenmayer, D. B. (2009). Re-evaluation of forest biomass carbon stocks and lessons from the world’s most carbon-dense forests. Proc. Natl. Acad. Sci. U.S.A. 106, 11635–11640. doi: 10.1073/pnas.0901970106
Kitzberger, T. (2012). “Ecotones as complex arenas of disturbance, climate, and human impacts: The trans-Andean forest-steppe ecotone of northern Patagonia,” in Ecotones between forest and grassland, ed. R. W. Myster (New York, NY: Springer), 59–88.
Kitzberger, T., and Veblen, T. T. (1999). Fire-induced changes in northern Patagonian landscapes. Landsc. Ecol. 14, 1–15.
Kitzberger, T., Tiribelli, F., Barberá, I., Gowda, J. H., Morales, J. M., Zalazar, L., et al. (2022). Projections of fire probability and ecosystem vulnerability under 21st century climate across a trans-Andean productivity gradient in Patagonia. Sci. Total Environ. 839:156303. doi: 10.1016/j.scitotenv.2022.156303
Klein, D., and Schulz, C. (2011). Wälder und holzprodukte als kohlenstoffspeicher. LWF Aktuell 85, 40–43.
Klein, D., Schmidt, A., Heim, M., Schmidt, H., and Schulte, A. (2008). Das Totholzaufkommen in lenga (Nothofagus pumilio)-natur– und wirtschaftswäldernsowie dessen funktion als kohlenstoffspeicher. Forstarchiv 79, 8–54.
Kraft, G. (1884). Beiträge zur Lehre von den Durchforstungen. Schlagstellungen und Lichtungshiebe. Hannover: Klindworth’s Verlag.
Krüger, I., Schulz, C., and Borken, W. (2012). Totholz als Kohlenstoffsenke. Bayerische Landesanstalt für Wald und Forstwirtschaft. LWF Aktuell 87, 24–26.
Laclau, P. (2006). Fijación de carbono en ecosistemas boscosos y herbáceos del norte de la Patagonia. Bariloche: Universidad Nacional del Comahue.
Lal, R. (2005). Forest soils and carbon sequestration. For. Ecol. Manag. 220, 242–258. doi: 10.1016/j.foreco.2005.08.015
Lal, R., and Lorenz, K. (2012). “Carbon sequestration in temperate forests,” in Recarbonization of the biosphere, eds R. Lal, K. Lorenz, R. Hüttl, B. Schneider, and J. von Braun (Dordrecht: Springer), 187–201.
Landesmann, J. B., and Morales, J. M. (2018). The importance of fire refugia in the recolonization of a fire-sensitive conifer in northern Patagonia. Plant Ecol. 219, 455–466. doi: 10.1007/S11258-018-0808-4
Landesmann, J. B., Gowda, J. H., Kitzberger, T., and Michalet, R. (2016). Temporal shifts in the interaction between woody resprouters and an obligate seeder tree during a post-fire succession in Patagonia. J. Veg. Sci. 27, 1198–1208. doi: 10.1111/JVS.12430
Lara, A., Rutherford, P., Montory, C., Bran, D., Pérez, A., Clayton, S., et al. (2000). Vegetación de la ecoregión de los bosques valdivianos escala 1:500.000. informe final proyecto binacional Chile–Argentina UACh—INTAAPN–FVSA. Buenos Aires: Boletín Técnico Fundación Vida Silvestre Argentina.
Larionova, A. A., Rozanova, L. N., Evdokimov, I. V., and Ermolaev, A. M. (2002). Carbon budget in natural and anthropogenic forest-steppe ecosystems. Pochvovedenie 2, 177–185.
Liu, W. W., Wang, X. K., Fei, L. U., and Ouyang, Z. Y. (2015). Regional and global estimates of carbon stocks and carbon sequestration capacity in forest ecosystems: A review. Chin. J. Appl. Ecol. 26, 2881–2890.
Loguercio, G. A. (1997). Erhaltung der Baumart Austrocedrus chilensis (D. Don) et Boutelje durch nachhaltige Nutzung. Ph.D. thesis. Munich: University of Munich.
Loguercio, G. A. (2001). Evaluación de los bosques de N. pumilio de Tierra del Fuego: Elaboración de funciones regionales de biomasa. Consejo federal de inversiones (cfi) - provincia de tierra del fuego. Esquel: Informe Final.
Loguercio, G. A., and Ivancich, H. (2019). Prueba piloto para evaluar Bosques secundarios post-fuego de la región del BAP para aportar a la mejora del Inventario Nacional de Gases de Efecto Invernadero (GEI). CIEFAP-ONU REDD (MAyDS). Esquel: Informe final.
Loguercio, G. A., Bertoldi, G., Gianolini, S., Tolosa, J., Villena, P., Lartigau, B., et al. (2019). Estudio piloto para el muestreo de reservorios de carbono en la madera muerta y en el suelo de la región BAP. Esquel: Informe final.
Loguercio, G. A., Heinzle, M. F., Caselli, M., Ivancich, H., Perdomo, M., de Agostini, N., et al. (2022). Reservas y captura de carbono en tipos forestales sucesionales nordpatagónicos. Bariloche: Jornadas Forestales Patagónicas.
Luyssaert, S., Inglima, I., Jung, M., et al. (2007). CO2-balance of boreal, temperate and tropical forest derived from a global database. Glob. Change Biol. 13, 2509–2537. doi: 10.1111/j.1365-2486.2007.01439.x
Marchelli, P., Caron, H., Azpilicueta, M. M., and Gallo, L. A. (2007). Primer note: A new set of highly polymorphic nuclear microsatellite markers for Nothofagus nervosa and related south american species. Silvae Genetica 57, 82–85.
Martínez-Pastur, G. (2005). Biometría y producción forestal para bosques naturales de Nothofagus pumilio en Tierra del Fuego. PhD Thesis. Buenos Aires: Universidad Nacional del Sur.
Mattera, M. G., Pastorino, M. J., Lantschner, M. V., et al. (2020). Genetic diversity and population structure in Nothofagus pumilio, a foundation species of Patagonian forests: Defining priority conservation areas and management. Sci. Rep. 10:19231. doi: 10.1038/s41598-020-76096-0
McKinley, D. C., Ryan, M. G., Birdsey, R. A., Giardina, C. P., Harmon, M. E., Heath, L. S., et al. (2011). A synthesis of current knowledge on forests and carbon storage in the United States. Ecol. Appl. 21, 1902–1924.
Mermoz, M., Kitzberger, T., and Veblen, T. T. (2005). Landscape influences on occurrence and spread of wildfires in patagonian forests and shrublands. Ecology 86, 2705–2715. doi: 10.1890/04-1850
Morin, X. (2015). Species richness promotes canopy packing: A promising step towards a better understanding of the mechanisms driving the diversity effects on forest functioning. Funct. Ecol. 29, 993–994.
Navure Team (2023). Navure (1.2.0): A data-science-statistic oriented application for making evidence-based decisions. Available online at: http://www.navure.com (accessed March 26, 2024).
Neff, J. C., Harden, J. W., and Gleixner, G. (2005). Fire effects on soil organic matter content, composition and nutrients. Can. J. For. Res. 35, 2178–2187.
Pan, Y., Richard, B. A., Oliver, P. L., and Jackson, R. B. (2013). The structure, distribution and biomass of the world’s forests. Annu. Rev. Ecol. Evol. Syst. 44, 593–622. doi: 10.1146/annurev-ecolsys-110512-135914
Paritsis, J., Veblen, T. T., and Holz, A. (2015). Positive fire feedbacks contribute to shifts from Nothofagus pumilio forests to fire-prone shrublands in Patagonia. J. Veg. Sci. 26, 89–101. doi: 10.1111/jvs.12225
Pellegrini, A. F. A., and Jackson, R. B. (2020). The long and short of it: A review of the timescales of how fire affects soils using the pulse-press framework. Adv. Ecol. Res. 62, 147–171. doi: 10.1016/bs.aecr.2020.01.010
Pellegrini, A. F. A., Harden, J., Georgiou, K., et al. (2022). Fire effects on the persistence of soil organic matter and long-term carbon storage. Nat. Geosci. 15, 5–13. doi: 10.1038/s41561-021-00867-1
Perez Garcia, J., Lippke, B., Comnick, J., and Manriquez, C. (2007). An assessment of carbon pools, storage, and wood products market substitution using life-cycle analysis results. Wood Fiber Sci. 37, 140–148.
Perez-Quezada, J. F., Moncada, M., Barrales, P., Urrutia-Jalabert, R., Pfeiffer, M., Herrera, A. F., et al. (2023). How much carbon is stored in the terrestrial ecosystems of the Chilean Patagonia? Aust. Ecol. 2, 1–11. doi: 10.1111/aec.13331
Perez-Quezada, J. F., Olguín, S., Fuentes, J. P., and Galleguillos, M. (2015). Tree carbon stock in evergreen forests of Chiloé, Chile. Bosque 36, 27–39. doi: 10.4067/S0717-92002015000100004
Peri, P. L., Gaitán, J., Mastrangelo, M., Nosetto, M., Villagra, P. E., Balducci, E., et al. (2024). Soil organic carbon stocks in native forest of Argentina: A useful surrogate for mitigation and conservation planning under climate variability. Ecol. Process 13:1. doi: 10.1186/s13717-023-00474-5
Peri, P. L., Gargaglione, V., Martínez-Pastur, G. J., and Lencinas, M. V. (2010). Carbon accumulation along a stand development sequence of Nothofagus antarctica forests across a gradient in site quality in Southern Patagonia. For. Ecol. Manag. 260, 229–237.
Pregitzer, K. S., and Euskirchen, E. S. (2004). Carbon cycling and storage in worlds forests; biome patterns related to forest age. Glob. Change Biol. 10, 120–134. doi: 10.1111/j.1365-2486.2004.00866.x
Röhrig, E. (1991). “Biomass and productivity,” in Ecosystems of the World 7, eds E. Röhrig and B. Ulrich (Amsterdam: Elsevier), 165–174.
Rothkugel, M. (1916). Los bosques patagónicos. Oficina de Bosques y Yerbales. Buenos Aires: Dirección de Agricultura y Defensa Agrícola.
Scharlemann, J. P. W., Tanner, E. V. J., Hiederer, R., and Kapos, V. (2014). Global soil carbon: Understanding and managing the largest terrestrial carbon pool. Carbon Manag. 5, 81–91. doi: 10.4155/cmt.13.77
Schlegel, B. C., and Donoso, P. J. (2008). Effects of forest type and stand structure on coarse woody debris in old-growth rainforests in the Valdivian Andes, south-central Chile. For. Ecol. Manag. 255, 1906–1914. doi: 10.1016/j.foreco.2007.12.013
Schlesinger, W. H. (1990). Evidence from chronosequence studies for a low carbon-storage potential of soils. Nature 348, 232–234.
Seidl, R., Thom, D., Kautz, M., et al. (2017). Forest disturbances under climate change. Nat. Clim. Change 7, 395–402. doi: 10.1038/nclimate3303
Simon, A., Fierke, J., Reiter, E., Loguercio, G., Heinrichs, S., Putzenlechner, B., et al. (2024). The interior climate and its microclimatic variation of temperate forests in northern Patagonia, Argentina. Int. J. Biometeorol. 68, 719–730. doi: 10.1007/s00484-024-02617-5
Stecconi, M., Puntieri, J. G., and Barthélémy, D. (2010). An architectural approach to the growth forms of Nothofagus pumilio (Nothofagaceae) along an altitudinal gradient. Botany 88, 1–11.
Tiribelli, F., Kitzberger, T., and Morales, J. M. (2018). Changes in vegetation structure and fuel characteristics along post-fire succession promote alternative stable states and positive fire–vegetation feedbacks. J. Veg. Sci. 29, 147–156. doi: 10.1111/JVS.12620
Tiribelli, F., Morales, J., Gowda, J. H., Mermoz, M., and Kitzberger, T. (2019). Non-additive effects of alternative stable states on landscape flammability in NW Patagonia: Fire history and simulation modelling evidence. Int. J. Wildland Fire 28, 149–159. doi: 10.1071/WF18073
Tognetti, R., Smith, M., and Panzacchi, P. (2022). Climate-smart forestry in mountain regions. Cham: Springer.
Torres Guzman, C. I. (2017). Funciones de biomasa y volumen para Nothofagus antarctica (Forster) Oerst y Pinus contorta (Douglas) ex Loud en la comuna de coyhaique, región aysén del general carlos ibáñez del campo. Valdivia: Universidad Austral de Chile.
Valenzuela Castillo, C. M. (2017). Funciones de volumen fustal y biomasa aérea total y de componentes a nivel de árbol individual para renovales de roble, raulí y coigüe. Concepción: Universidad de Concepción.
Vargas, R., Allen, M. F., and Allen, E. B. (2008). Biomass and carbon accumulation in a fire chronosequence of a seasonally dry tropical forest. Glob. Change Biol. 14, 109–124.
Veblen, T. T., Kitzberger, T., Raffaele, E., and Lorenz, D. (2003). “Fire history and vegetation changes in northern Patagonia, Argentina,” in Fire and climatic change in temperate ecosystems of the western Americas, eds T. T. Veblen, W. Baker, G. Montenegro, and T. W. Swetnam (New York, NY: Springer), 265–295.
Veblen, T., and Lorenz, D. (1987). Post-fire stand development of Austrocedrus-Nothofagus forests in northern Patagonia. Plant Ecol. 71, 113–126.
Veblen, T., Kitzberger, T., Burns, B., and Rebertus, A. J. (1996). Natural disturbance and regeneration dynamics in Andean forests of southern Chile and Argentina. Ecología de Los Bosques Nativos de Chile. Santiago: Editorial Universitaria, 169–198.
Villalba, R., Lara, A., Boninsegna, J. A., et al. (2003). Large-scale temperature changes across the Southern Andes: 20th-century variations in the context of the past 400 years. Clim. Change 59, 177–232. doi: 10.1023/A:1024452701153
Wang, X., Guo, Z., Guo, X., and Wang, X. (2020). The relative importance of succession, stand age and stand factors on carbon allocation of Korean pine forests in the northern Mt. Xiaoxing’anling, China. Forests 11:512. doi: 10.3390/f11050512
Weber, M. (1999). Kohlenstoffvorräte eines Nothofagus-Primärwaldes auf Feuerland. Forstwiss. Centralbl. 118, 156–166.
Westfall, J. A., Coulston, J. W., Gray, A. N., Shaw, J. D., Radtke, P. J., et al. (2023). A national-scale tree volume, biomass, and carbon modeling system for the United States. Gen. Tech. Rep. 104, 1–65. doi: 10.2737/WO-GTR-104
Willis, B. (1914). El Norte de la patagonia. Tomo I: Naturaleza y riqueza. New York, NY: Scribner Press.
Woodall, C. B., and Monleon, V. J. (2008). Sampling protocol, estimation, and analysis procedures for the down woody materials indicator of FIE Program. Washington, DC: USDA Forest Service.
Woodall, C. W., and Weiskittel, A. R. (2021). Relative density of United States forests has shifted to higher levels over last two decades with important implications for future dynamics. Sci. Rep. 11:18848. doi: 10.1038/s41598-021-98244-w
Woodall, C. W., Heath, L. S., and Smith, J. E. (2008). National inventories of down and dead woody material forest carbon stocks in the United States: Challenges and opportunities. For. Ecol. Manag. 256, 221–228.
Woodall, C. W., Walters, B. F., Oswalt, S. N., Domke, G. M., Toney, C., and Gray, A. N. (2013). Biomass and carbon attributes of downed woody materials in forests of the US. For. Ecol. Manag. 305, 48–59.
Wu, X., Wang, X., Wu, Y., Xia, X., and Fang, J. (2015). Forest biomass is strongly shaped by forest height across boreal to tropical forests in China. J. Plant Ecol. 8, 559–567. doi: 10.1093/jpe/rtv001
Keywords: carbon stocks, deadwood components, woody debris, topsoil organic carbon, secondary forest succession
Citation: Loguercio GA, Simon A, Winter AN, Ivancich H, Reiter EJ, Caselli M, Heinzle FG, Leuschner C and Walentowski H (2024) Carbon density and sequestration in the temperate forests of northern Patagonia, Argentina. Front. For. Glob. Change 7:1373187. doi: 10.3389/ffgc.2024.1373187
Received: 19 January 2024; Accepted: 12 April 2024;
Published: 29 April 2024.
Edited by:
Bhupendra Singh, VCSG Uttarakhand University, IndiaReviewed by:
Kaushal Singh, Banda University of Agriculture and Technology, IndiaAndres Holz, Portland State University, United States
Sumit Chakravarty, Uttar Banga Krishi Viswavidyalaya, India
Copyright © 2024 Loguercio, Simon, Winter, Ivancich, Reiter, Caselli, Heinzle, Leuschner and Walentowski. This is an open-access article distributed under the terms of the Creative Commons Attribution License (CC BY). The use, distribution or reproduction in other forums is permitted, provided the original author(s) and the copyright owner(s) are credited and that the original publication in this journal is cited, in accordance with accepted academic practice. No use, distribution or reproduction is permitted which does not comply with these terms.
*Correspondence: Helge Walentowski, helge.walentowski@hawk.de