Response of Alnus glutinosa to Phytophthora bark infections at ambient and elevated CO2 levels
 Markéta Macháčová1*†
  Ivana Tomášková1†
  Tamara Corcobado2,3† Zoltan Nagy2†
  Slobodan Milanović4† Josef Janoušek2 Vítězslava Pešková1†
  Jaroslav Čepl1†
  Salvador Gezan5† Oto Nakládal1†
  Václav Zumr1† Alina Kalyniukova1†
  Ivan Milenković2,4†
  Thomas Jung2*†
- 1Faculty of Forestry and Wood Sciences, Czech University of Life Sciences, Prague, Czechia
- 2Phytophthora Research Centre, Department of Forest Protection and Wildlife Management, Mendel University in Brno, Brno, Czechia
- 3Austrian Research Centre for Forests, Department of Forest Protection, Unit of Phytopathology, Vienna, Austria
- 4Forest Protection, Faculty of Forestry, University of Belgrade, Belgrade, Serbia
- 5VSN International, Hemel Hempstead, United Kingdom
Introduction: Mortality of the riparian alder population caused by Phytophthora pathogens has been studied for over 20 years throughout Europe, recently gaining more importance in the context of evident climate change. The main objective of this study was to examine the pathogenicity of species from the “Phytophthora alni complex” present in the Czech Republic (P. × alni and P. uniformis) and P. plurivora to Alnus glutinosa seedlings grown at ambient and elevated CO2 concentration.
Methods: An underbark inoculation test was performed with seedlings grown from seeds collected from two Czech alder populations, one suffering from severe Phytophthora decline and the other disease-free.
Results: The results showed significant differences in lesion development and seedling mortality. After a 13-week experimental period, at both CO2 levels P. × alni and P. uniformis showed high aggressiveness to A. glutinosa seedlings causing lesions of variable sizes and mortality of 33.3%, and 45.8% of plants, respectively. In contrast, P. plurivora did not cause mortality to any plant, and lesion sizes did not differ significantly from those in control plants. Physiological measurements did not reveal any significant differences between Phytophthora species except for plants inoculated with P. plurivora showing increased values in specific physiological parameters 4 weeks post-inoculation. Net photosynthesis decreased over the measurement period in all treatments with significant differences found between measurements conducted 2 and 4 weeks after the inoculation. Transpiration showed a decreasing trend in all inoculated plants with no significant differences between Phytophthora species at both CO2 levels. Chemical analyses of root samples showed high variability in sugars and phenolic compounds related to the plant's health status.
Discussion: This is the first study to examine the response of alder seedlings to Phytophthora pathogens at different CO2 levels. The findings demonstrate high aggressiveness of P. × alni and P. uniformis and weaker aggressiveness of P. plurivora to alder seedlings regardless of the CO2 level.
Introduction
Phytophthora species are fungal-like organisms within the kingdom Stramenopiles/Chromista and SAR supergroup (Beakes et al., 2015). More than 260 species are currently described (Brasier et al., 2022; Chen et al., 2022; Jung et al., 2022, 2024; Abad et al., 2023) and most of them are pathogens causing numerous diseases and devastating epidemics of agricultural crops, ornamental plants, and natural ecosystems worldwide (Erwin and Ribeiro, 1996; Jung et al., 2018; Brasier et al., 2022; Abad et al., 2023). The Phytophthora genus contains both generalist pathogens like the notorious P. cinnamomi Rands and P. ramorum Werres, De Cock & Man in 't Veld with particularly wide host ranges (Grünwald et al., 2012; Hardham and Blackman, 2018; Jung et al., 2021) and specialists like the oak-specific P. quercina (Jung et al., 1999) or the species from the “Phytophthora alni complex” which are exclusively pathogenic to alder (Alnus spp.) trees (Brasier and Kirk, 2001; Jung et al., 2018).
Alder stands are ecologically very important and alder trees are key nitrogen-fixing riparian species due to the symbiosis with the actinomycete Frankia alni (Vor.) Von Tub., which enables them to colonize extreme sites (Claessens, 2003). Most alder species grow in riparian ecosystems stabilizing riverbanks, acting as riparian buffers and windbreaks, and reduce erosion (Bjelke et al., 2016). Although showing fast growth and strong vegetative regeneration alder trees may suffer from multiple pathogens and pests with potentially devastating effects to riparian forests. Large-scale decline of alder stands across Europe, known as “alder dieback,” is attributed mainly to root and collar infections by species from the “P. alni complex” (Brasier et al., 2004; Jung and Blaschke, 2004; Černý and Strnadová, 2010; Jung et al., 2013; Bjelke et al., 2016). All European alder species are affected by this epidemic which has caused devastating mortality of alder trees in riparian and forest stands across Europe (Gibbs et al., 1999; Streito et al., 2002; Jung and Blaschke, 2004; Jung et al., 2013, 2018; Husson et al., 2015; Kanoun-Boulé et al., 2016; Corcobado et al., 2023). The causal pathogen was first described as P. alni by Brasier et al. (2004) with three subspecies, i.e. P. alni subsp. alni, P. alni subsp. multiformis and P. alni subsp. uniformis, which were later described as three distinct species, i.e., hybrid species P. × alni (PAA) and P. × multiformis (PAM) and the non-hybrid species P. uniformis (PAU) (Husson et al., 2015). It was shown that P. × alni originated from the hybridization between P. uniformis and P. × multiformis (Ioos et al., 2006; Husson et al., 2015). Phytophthora uniformis may have been introduced to Europe from North America (Aguayo et al., 2013), whereas the origin of P. × multiformis is still unknown. Besides the “P. alni complex,” P. plurivora Jung and Burgess (PLU) was frequently isolated from alder trees, including Alnus glutinosa L. and A. viridis (Chaix.) DC (Jung and Blaschke, 2004; Májek et al., 2019; Corcobado et al., 2023), indicating that the pathogen may also contribute to alder decline. This was also indicated by several pathogenicity tests on A. glutinosa (Jung and Nechwatal, 2008; Rytkönen et al., 2012; Mrázková et al., 2013; Haque et al., 2015).
Surveys in several European countries demonstrated that PAA is the most frequently isolated species, whereas PAU and especially PAM are comparatively rare (Nagy et al., 2003; Jung and Blaschke, 2004; Aguayo et al., 2013). Accordingly, pathogenicity tests revealed significant differences between species within the “P. alni complex” with PAA being more aggressive to A. glutinosa than PAU when infecting black alder (Alnus glutinosa) (Brasier and Kirk, 2001; Santini et al., 2003). Interestingly, PAU was shown to play an increasing role in alder dieback with increasing latitude in Scandinavia and increasing altitude in the Alps which is related to the lower frost tolerance of PAA as compared to PAU (Schumacher et al., 2006; Černý and Strnadová, 2010; Redondo et al., 2015; Corcobado et al., 2023). This is particularly important in the context of ongoing climatic changes and potential spread of the aggressive PAA strains to the currently unfavorable climatic regions.
Climatic changes are characterized by shifts in annual rain patterns, increased frequencies of extreme weather events, and the increase of average annual temperatures and atmospheric CO2 concentration (Moore et al., 2015). The most rapid increase of CO2 concentration was recorded during the second half of the 20th century and the beginning of the 21st century (Belmecheri and Lavergne, 2020). According to the Intergovernmental Panel on Climate Change (IPCC) the projected concentration of CO2 in the year 2100 will range in different scenarios from 540 to 970 ppm (IPCC, 2001). Pessimistic scenarios predict an increase of CO2 levels to 900–1,000 ppm by the end of the 21st century (Van Vuuren et al., 2011).
Elevated CO2 levels can have a significant impact on host-pathogen interactions (Percy et al., 2002; McElrone et al., 2005). Generally, a stronger resistance against plant pathogens is predicted in relation to elevated CO2 level in the atmosphere, as the excess of carbon can promote the production of plant defensive secondary chemicals (Kazan, 2018). However, plants grown at elevated CO2 can often alter constitutive and induced defense-related phytohormone levels, reflecting complex and dynamic biochemical interactions (Bazinet et al., 2022). So far, existing studies reported positive, negative, and neutral effects of elevated CO2 level on plant immune responses to fungal pathogen infection (Smith and Luna, 2023). The majority of studies on plant-biotic interaction investigate above-ground plant parts and related fungal pathogens (Kazan, 2018). However, only a limited number of studies have been performed on Phytophthora pathogens and underbark or root infections. These studies showed both positive and negative effects of elevated CO2 level on disease incidence depending on the Phytophthora and host species and the length of the experiment (Jwa and Walling, 2001; Fleischmann et al., 2010; Tkaczyk et al., 2014; Oszako et al., 2016; Milanović et al., 2020).
Phytophthora-induced damage diminishes transpiration and nitrogen allocation in leaves, affecting starch allocation (Clemenz et al., 2008; Osswald et al., 2014). Before transpiration decline, reduced stomatal conductance and assimilation are observed (Clemenz et al., 2008). Water relations are more affected than photosynthesis, with rapid hydraulic conductance decrease when the pathogen colonizes up to 15% of the root system. The swift response involves down-regulated cytokinins, up-regulated ABA, and 1-aminocyclopropane-1-carboxylic acid (Osswald et al., 2014). ABA and ethylene act as stress markers, closing stomata and increasing antioxidant activity (Müller, 2021). Maximal photosynthetic rate decreases with the extent of cortex destruction from 12 to 4 μmol m−2 s−1, accompanied by a decrease of PSII electron quantum yield (Osswald et al., 2014). Successful tree defense is suppressed, as Phytophthora deactivates salicylic-acid response genes, resulting in the reduction of lignin, phenols, and PR proteins in infected roots compared to healthy ones (Osswald et al., 2014).
Changes in physiological parameters are reflected in saccharides translocation. For example, in beech seedlings inoculated by PLU, the content of total saccharides decreased significantly compared to the control plants (Corcobado et al., 2022). Even though the sugar alcohols were even higher in the roots of control plants, the differences between infected and control seedlings became less pronounced after three weeks of inoculation (Corcobado et al., 2022). There is a different response to Phytophthora attack in leaves and roots at the biochemical level (Corcobado et al., 2022).
While the influence of temperature on the activity of different species from the “P. alni complex” was discussed within previous studies (Schumacher et al., 2006; Černý and Strnadová, 2010; Redondo et al., 2015) suggesting possible further spreading due to climatic changes, studies on Phytophthora-Alnus interaction at elevated CO2 levels are, however, still missing. This study aimed to compare the responses of A. glutinosa plants to infections by PAA, PAU, and PLU at ambient and elevated CO2 levels.
Prior to the experiment, the following hypotheses were raised: (i) the survival of alders is influenced by the interaction between Phytophthora species inoculation and CO2 level, and (ii) variations in physiological and biochemical responses are expected in inoculated alders depending on the Phytophthora species and the CO2 level.
Materials and methods
Plant material and growth conditions
Alder (A. glutinosa) tree cones were collected in autumn 2020 in the Czech Republic. To achieve higher variability of alder genotypes, two different riparian populations were selected: one showing typical alder dieback and collar rot symptoms (Jung and Blaschke, 2004; Jung et al., 2018), and the second being asymptomatic (Table 1). The seedlings were grown in a ready-mixed substrate containing peat and perlite (Forestina, Czech Republic) in individual 2-liter containers. The plants were watered to field capacity with tap water once per week. Plants were fertilized 2 months before the inoculation (Osmocote, ICL Specialty Fertilizers). No fungicides were applied during the experiment.
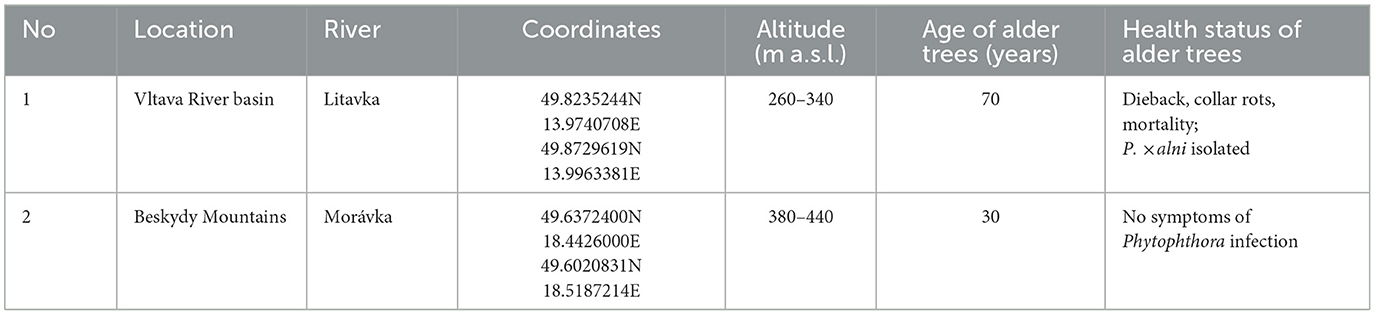
Table 1. Origin of the Alnus glutinosa seeds used in this study.
All plants were grown in Walk-In growth chambers (PSI Ltd., Drásov, Czech Republic) with the following conditions: 14/10 h photoperiod, 20/15°C, 65 % relative humidity, light spectrum 250 μmol m−2 s−1. Two chambers each were used for the ambient and elevated CO2 levels, respectively. The mean global atmospheric CO2 concentration of the year 2020 (=415 ppm; https://gml.noaa.gov/webdata/ccgg/trends/co2/co2_annmean_mlo.txt) was chosen as ambient CO2 level whereas the elevated CO2 level was twice as high (830 ppm).
Underbark inoculation test
Isolates of three Phytophthora species, PAA, PAU, and PLU were sourced from the CZU/MM Oomycetes collection (Table 2). Their identity was previously confirmed by sequence analysis of the internal transcribed spacer (ITS1-5.8S-ITS2) region of the ribosomal DNA according to Jung et al. (2019), for the PAU isolate the β-tubulin gene was also sequenced using primers TUBUF2 and TUBUR1 (Kroon et al., 2004) (Table 2). Underbark inoculation was performed in June 2021 according to Milenković et al. (2018). The bark surface of the alder saplings at a distance of 10–15 cm from the collar was cleaned with 70% ethanol. Plants were wounded using a sterilized 7-mm metal cork borer. Same-sized plugs cut from the edges of 5 to 7-day-old Phytophthora colonies grown on V8-agar medium (V8A) (Jung et al., 1996) were placed with the mycelial side onto the exposed wood. The agar plugs were covered with the removed piece of bark and cotton moistened with sterile distilled water and sealed with Parafilm and aluminum foil.
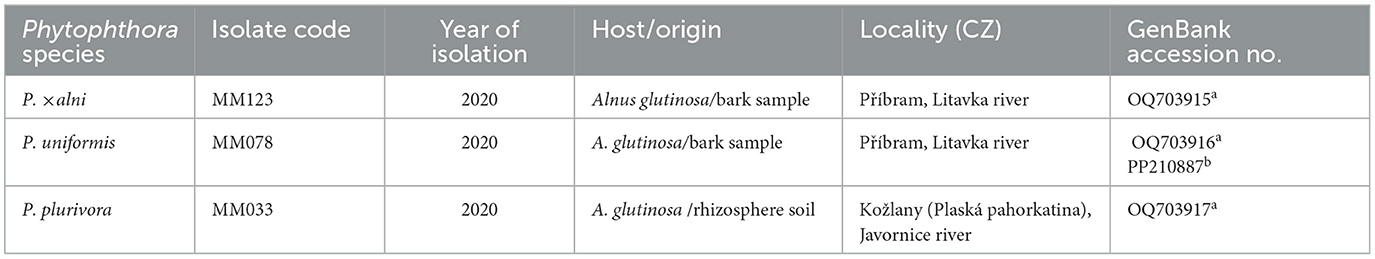
Table 2. Origin of the Phytophthora isolates used in this study and GenBank accessions of their ITS (a) and β-tubulin (b) sequences.
In total, 12 six-months-old plants per Phytophthora species and CO2 level were inoculated, including six plants originating from populations 1 and 2, respectively (Table 1). The control treatment also had 12 plants, but they were mock-inoculated with sterile V8A plugs and sealed in the same way. After the inoculation the plants were moved back to their growth chambers. The plants were inspected every 2 weeks for the appearance of symptoms, such as seedling mortality, vertical length of stem lesions and extent of girdling (Table 3). Girdling was visually evaluated on a five-point scoring system, according to Zamora-Ballesteros et al. (2017).
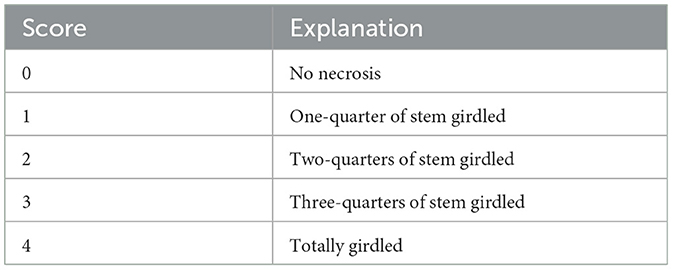
Table 3. Girdling evaluation scoring system.
Thirteen weeks after inoculation, when 50% of plants in one treatment died, the experiment was finished and evaluated. Necrosis lengths were measured using a precise ruler, while necrosis widths were measured using a flexible measurement tape. Re-isolations were made from all inoculated and control plants by plating small pieces from the upper and lower margins of necrotic lesions or, in the absence of necroses, from the margins of the inoculation points onto PARPNH selective agar medium (Jung et al., 1996). Pathogen identification was confirmed by comparing the colony morphologies on V8A with those of the original isolates.
Biomass of above- and below-ground plant tissues was weighed and expressed as the above/below-ground dry biomass ratio. The aerial tissues of each seedling were divided into stems and leaves and dried in the oven at 65°C for 48 hr. Roots were dried after thoroughly washing to remove adhering soil.
Physiological and chemical analysis
Physiological analysis
Six plants from each treatment (Phytophthora species/CO2 level) were randomly selected for the physiological measurements. These were performed six times during the experiment in 2-week intervals, always using the same plants: one measurement prior to the inoculation and five measurements after the inoculation. Physiological measurements included chlorophyll a fluorescence and gas exchange measurements.
Chlorophyll a fluorescence was measured using FluorPen FP 110 (Photon Systems Instruments, Brno, Czech Republic). Measurements were performed on adaxial surfaces of 3–4 leaves per plant. Before the fluorescence measurement, dark acclimation of the three selected leaves was assured by special leaf clips with a retractable metal plate. After 20 min of dark adaptation, the instrument was mounted to the clip and the actinic light (3,000 μmol m−2 s−1) was applied to the leaves. For statistical analysis, the following indexes were selected to estimate plant health and performance (according to Živčák et al., 2008): (a) maximum quantum yield of primary PSII photochemistry (1) and (b) performance index expressing energy conservation from absorption of light by an antenna (2). Its expressions are detailed below:
ΦPSII – maximum quantum yield of primary PSII photochemistry
FV – variable fluorescence
FM – maximum fluorescence
F0 – fluorescence intensity at 50 μs
Fj – fluorescence intensity at the J step (at 2 ms)
FM – maximal fluorescence intensity
Vj – relative variable fluorescence at 2 ms
M0 – initial slope of fluorescence kinetics.
An open portable photosynthesis system with infrared gas analyser LI-6400 XT (LICOR, Lincoln, NE, USA) was used for in situ gas exchange measurements. Net photosynthetic rate (PN), transpiration (E), stomatal conductance (Gs), and internal-to-ambient CO2 concentration ratio (Ci/Ca) were measured at photosynthetic photon flux density of 1,500 ± 1 μmol m−2 s−1 and an ambient CO2 concentration of 415/830 ± 1 μmol mol−1 (ambient/elevated CO2 treatments) which was above the saturation point measured in advance (350–400 μmol m−2 s−1). A standard leaf chamber with a red/blue LED light source was used. The samples were taken between 9 am and 5 pm. Measurements were performed on 2 leaves per plant.
Chemical analysis
Three root samples per treatment (Phytophthora species/CO2 level) were taken for chemical analysis during the final assessment. Selected plants were gently removed from the planting pots, and the root systems washed in distilled water to remove all substrate particles. Immediately after cleaning the samples were frozen and kept at −32°C until further processing. After freeze-drying and homogenization, approximately 0.03 g per sample were used for the extraction of selected sugars and phenolic compounds. The detailed method is given in Supplementary Table 1.
Data analysis
Lesion development and mortality, plant biomass
The assessment of normality within each group was conducted using the Shapiro-Wilk test. Given the observed deviation from the assumptions of normal data distribution, differences in various parameters, including lesion length and width, lesion area, above-/below-ground biomass ratio, percentage of lesion length from plant height, final plant height, and collar diameter, were subsequently analyzed using the paired samples Wilcoxon test. Significances of pairwise differences were computed by the pairwise Wilcoxon test implemented in “pairwise.wilcox.test” base R statistical software (R development CORE team, 2021) with p-value adjustment set as BH—i.e., false discovery rate adjustment (Benjamini and Hochberg, 1995). Differences between groups were investigated at the significance level α = 0.05. Hedge's g effect sizes were computed using “cohens.d” function from “effsize” package with “hedges.correction” parameter set to TRUE.
For girdling analysis, the Area Under Disease Progress Curve (AUDPC) was used for the disease assessment. The AUDPC was measured using the trapezoidal integration method, according to Madden et al. (2007), using the expression:
where: yi: initial score of girdling; yi+1: final score of girdling; ti+1: final time; ti: initial time.
AUDPC values were analyzed using ANOVA and Fisher's LSD test performed in STATISTICA 13.0 software.
Survival curves describing the relationship between the mortality rate and time after the infection were generated using the Kaplan–Meier Estimates method in STATISTICA 13.0 software. Statistical significance of survival differences among groups was assessed employing the Chi-Square Test. Pairwise comparisons were conducted using the Log Rank test with a significance threshold set at α = 0.05.
Mortality rate was evaluated using the Chi-Square Test. Correlations between mortality and selected parameters (lesion area, percentage of lesion length from plant height, final plant height, and above-/below-ground biomass ratio) were analyzed using Spearman Rank Order Correlations because of the inherent characteristics of the data. Relationships between stem girth and girdling/mortality were analyzed using either linear regression models or Welsh test, employing the R software. The data used for the analysis of the correlation between stem girth and lesion girdling are originated from an equally spaced five-point scoring system of lesion girdling, hence suitable for any kind of analysis including linear regression models.
Physiological and chemical analyses
For physiological parameters, the R software was used. Since the measurements were conducted six times, a repeated measurements approach was adopted with each plant serving as the measurement unit. The experimental design encompassed treatment groups with four levels (control, PAA, PAU, and PLU), CO2 concentration at two levels (415/830 ppm). The evaluation of physiological traits involved the application of a mixed linear model, accounting for the repeated measurements.
PAA- and PAU-inoculated plants showed gradual mortality, leading to a decrease in the number of measured plants; therefore, the measurements performed at 6, 8, and 10 weeks post inoculation (p.i.) were unsuitable for statistical analyses of gas exchange measurements.
The model was structured to assess the influence of time-varying factors and their interactions on the response variable y. The fixed effects in our model encompassed Time, Treatment, and CO2, as well as their interactions with Time, formulated as:
To adequately capture the within-subject variation typical in repeated measures designs, the model controlled variation among replicated boxes by including random effect formulated as Time:Box. Furthermore, to address the autocorrelation typically present in repeated measures data, the residual structure of the model was specified as: id(ID):cor(Time), allowing for correlations between time of the same experimental unit.
All mixed models were fitted with ASReml-R v4.1 (Butler et al., 2017), which uses restricted maximum likelihood methods to estimate variance components. In all cases, diagnostic plots were reviewed for normality and to detect potential outliers.
In the statistical analysis of chemical parameters (sugars and phenolic compounds), the Kruskal-Wallis ANOVA was used to examine intergroup differences. Prior to analysis, the normality of the data distribution was assessed, revealing a deviation from the assumption of normality. To further test significant variations among groups, a post hoc Dunn's test was conducted (significance level α = 0.05).
Results
Lesion development and survival analysis
Representative symptoms 13 weeks post inoculation (p.i.) are shown in Figure 1 and explained below. Lesions started to appear within the first 2 weeks p.i.. The lesion size varied between the Phytophthora species and among the plants within the same treatment. Lesions developed rapidly in plants inoculated with PAU and PAA. In most plants the lesions reached their final length within 4 weeks p.i. with mean lesion lengths ranging from 7.8 to 8.7 cm in PAA, 7.7 to 11.4 cm in PAU and 1.8 to 1.9 cm in PLU (Table 4, Figure 2). For PAU a statistically non-significant trend of higher average lesion lengths was recorded in the ambient as compared to the elevated CO2 level (11.43 ± 7.33 cm vs. 7.66 ± 6.87 cm, p = 0.249; Table 4, Supplementary Figure S1). For PAA a similar trend was observed (8.68 ± 7.11 cm vs. 7.76 ± 5.91 cm, p = 0.951; Table 4, Supplementary Figure S1). On the contrary, plants inoculated with PLU had only very small lesions that were not significantly different from the control (Table 4, Figure 2, Supplementary Figure S1). The re-isolations confirmed the pathogen presence in all inoculated plants (Table 4).
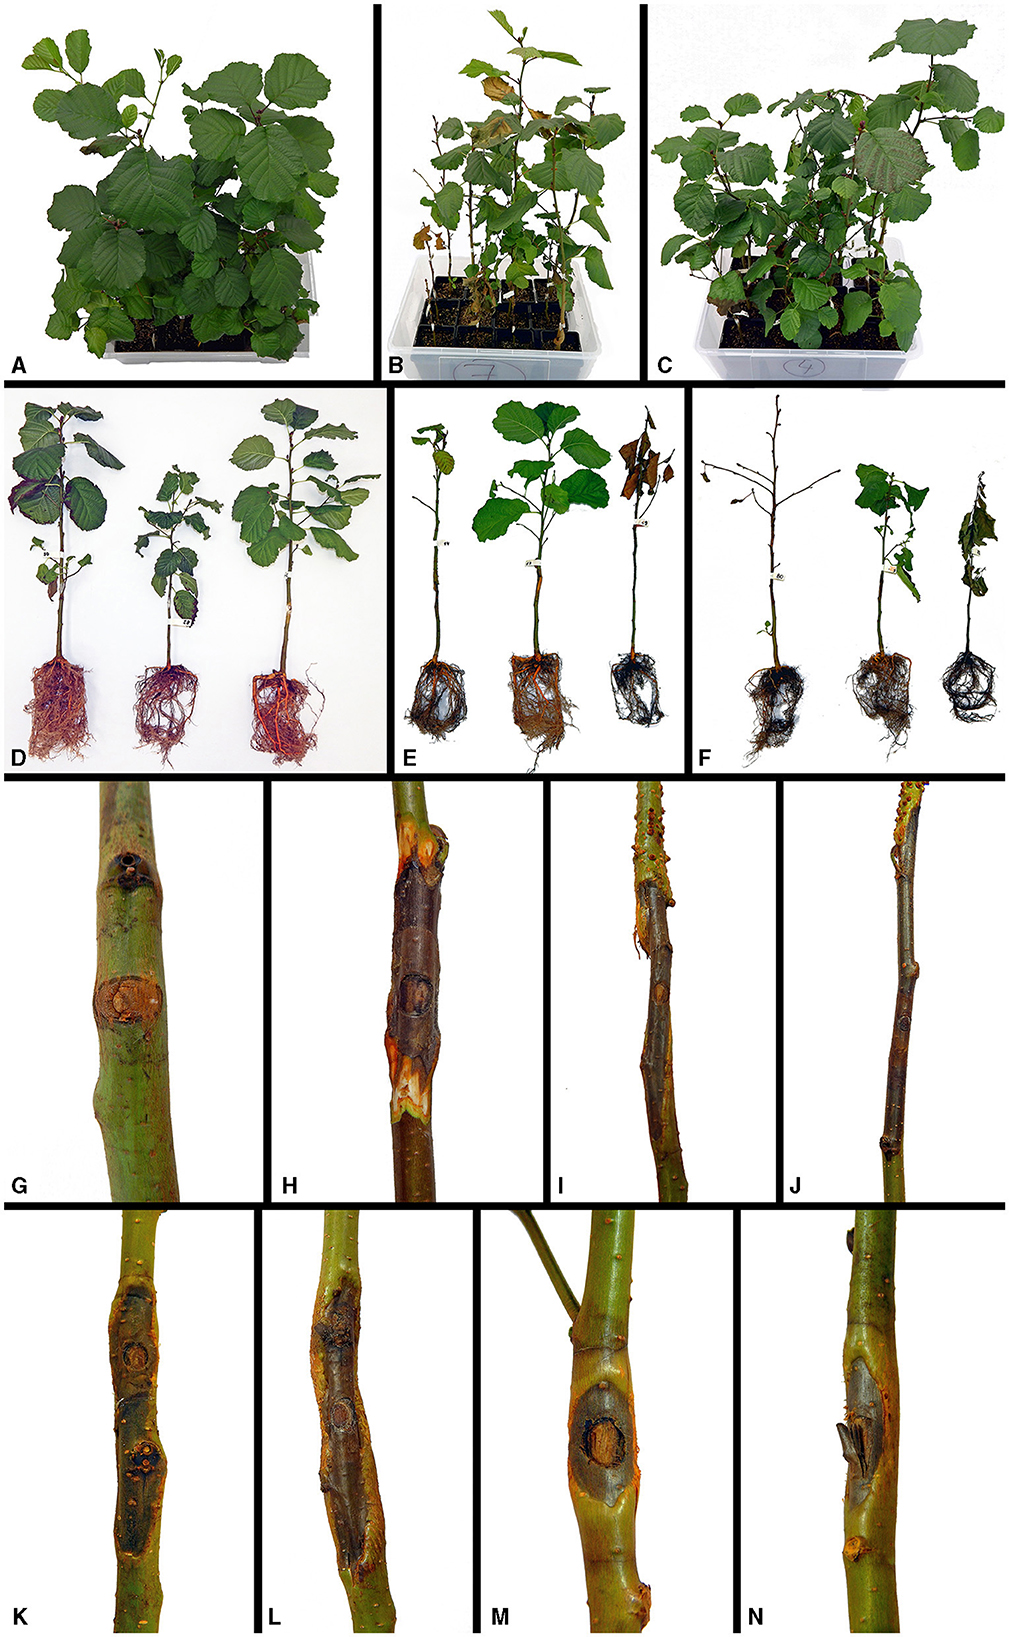
Figure 1. Representative symptoms of Alnus glutinosa seedlings caused by Phytophthora species 13 weeks after underbark inoculation at ambient (aCO2) and elevated (eCO2) levels; (A) control plants at aCO2; (B) P. uniformis–inoculated plants at eCO2; (C) P. plurivora–inoculated plants at aCO2; (D) control at eCO2; (E) P. × alni at aCO2; (F) P. uniformis at eCO2; (G) control; (H, I) P. × alni lesions at eCO2 and eCO2; (J–L) P. uniformis lesions at aCO2 (J, L) and at eCO2 (K); (M, N) small constrained lesions caused by P. plurivora at eCO2 and aCO2.
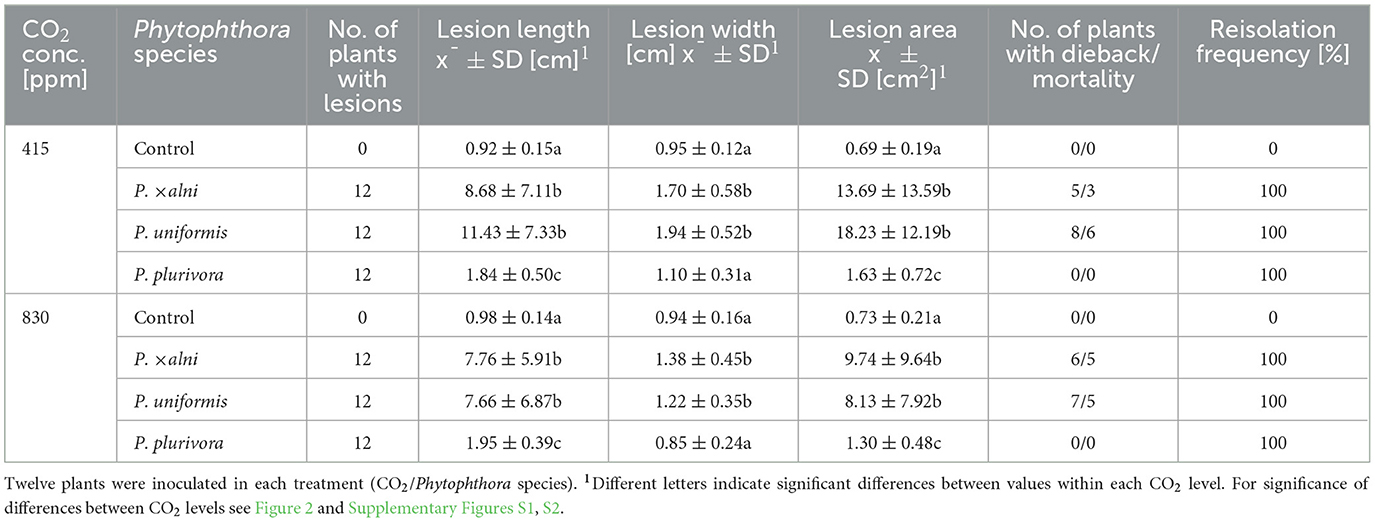
Table 4. Pathogenicity of three Phytophthora species to Alnus glutinosa seedlings in the underbark inoculation test after 13 weeks.
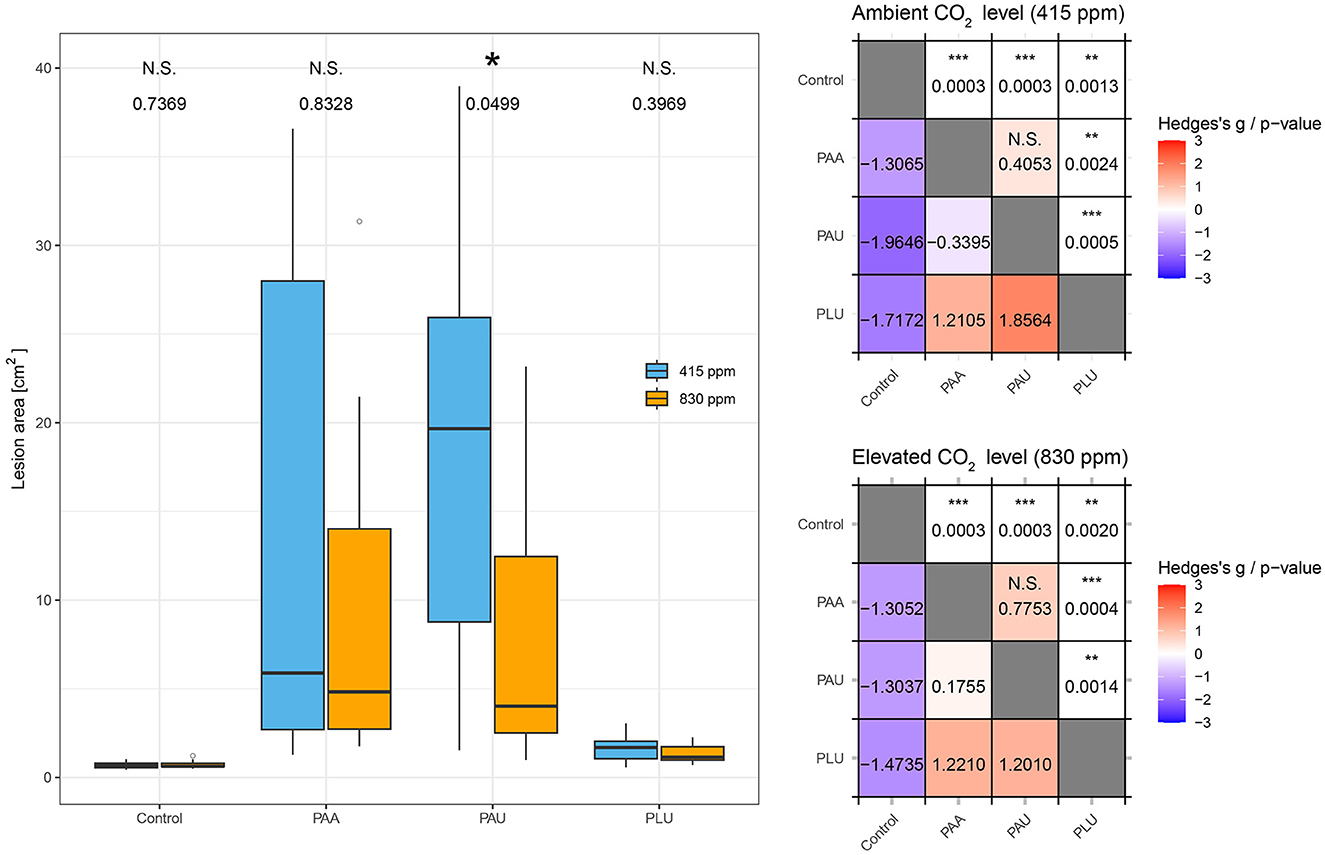
Figure 2. Comparison of lesion area in the stems of Alnus glutinosa seedlings caused by three Phytophthora species at two CO2 levels (ambient 415 ppm, elevated 830 ppm). PAA, P. × alni; PAU, P. uniformis; PLU, P. plurivora. The statistical significance of CO2 pairs comparisons is indicated by N.S. (non-significant) or an asterisk (p ≤ 0.05). The tables on the right contain all pairwise comparisons; the upper triangle represents the p-value of pairwise comparisons, the lower triangle represents the effect size of Hedges'g.
The lesion area, calculated as the ellipse area (A = πab), showed differences between the Phytophthora species and CO2 levels which were partly statistically significant (Table 4, Figure 2). At both CO2 levels, PAA and PAU caused lesions with significantly different lesion areas compared to both the control and PLU-inoculated plants (p ≤ 0.05; Table 4). In contrast to PAA-inoculated plants, in PAU-inoculated plants the effect of CO2 was statistically significant (p = 0.049) with bigger lesions found at the ambient as compared to the elevated level (18.23 ± 12.19 cm vs. 8.13 ± 7.92 cm) (Figure 2). PLU differed significantly from the control at both CO2 levels, but the variability was much lower and no significant difference existed between different CO2 levels (Table 4).
PAA and PAU had significantly different lesion width compared to both the control and PLU, whereas PLU did not differ from the control at both CO2 levels (ambient: p = 0.276, elevated: p = 0.572) (Table 4). However, the effect of CO2 was significant only in PAU (p = 0.007) with bigger lesion width at ambient compared to the elevated level (1.94 ± 0.52 cm vs. 1.22 ± 0.35 cm, respectively) (Supplementary Figure S2).
For both PAA and PAU-inoculated plants a statistically significant positive correlation was found between lesion area and mortality. A larger lesion area was consistently associated with a higher mortality rate (PAA r = 0.72; PAU r = 0.78) (data not shown).
The statistical analyses revealed significant differences in girdling caused by PAA and PAU compared to the control regardless of the CO2 level (Figure 3). The first dying plants developed lesions very quickly and complete girdling of the collar occurred within the first weeks p.i. On the contrary, PLU girdled in all plants <25% of collar circumference. Complete girdling was significantly correlated with smaller stem circumference (stem girth) in both PAA (R2 = 0.272, p = 0.0052) and PAU-inoculated plants (R2 = 0.368, p = 0.001; Figure 4). Complete girdling also induced the swelling of sleeping buds above the girdling lesions a strong reaction in several plants (Figures 1I, J).
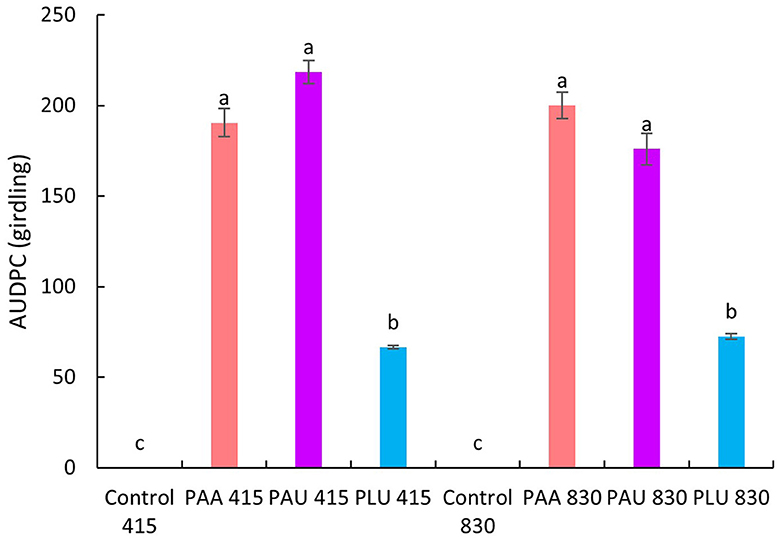
Figure 3. Comparison of area under the disease progress curve (AUDPC) in stems of Alnus glutinosa seedlings inoculated with Phytophthora × alni (PAA), P. uniformis (PAU) and P. plurivora (PLU) at two CO2 levels (415 ppm and 830 ppm). Error bars show the standard deviation. Different letters indicate significant differences (Fisher's LSD Test, p < 0.05).
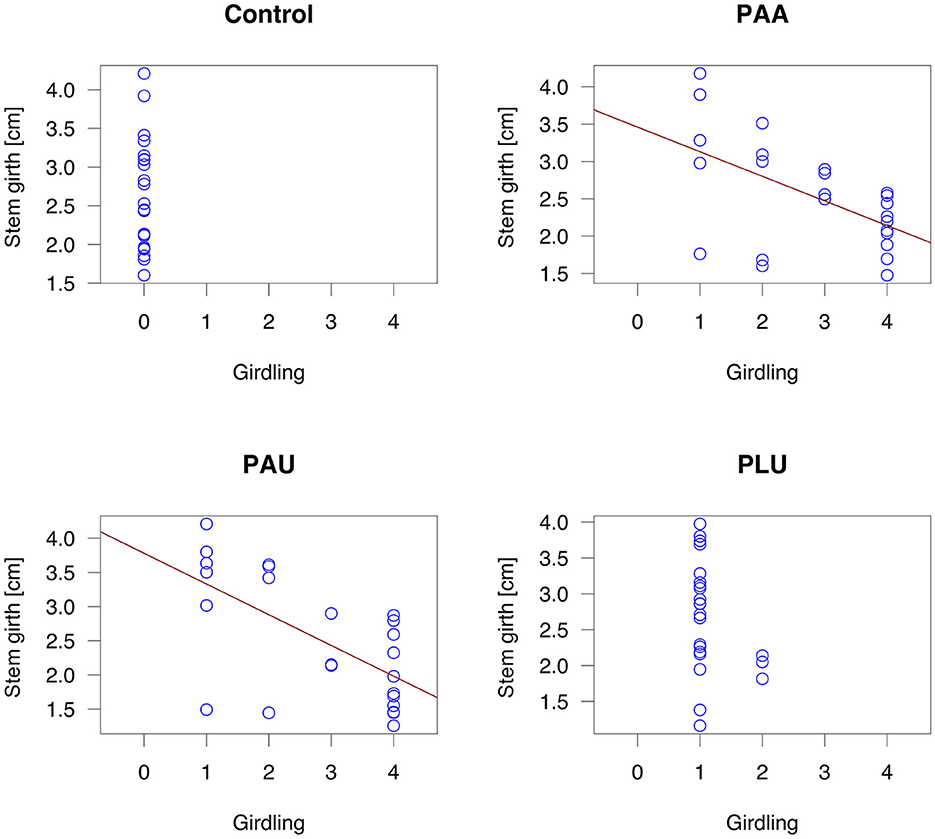
Figure 4. Relationship between the stem girth of Alnus glutinosa seedlings and girdling (PAA, P. × alni; PAU, P. uniformis; PLU, P. plurivora): Linear regression model (PAA: R2 = 0.272, p = 0.0052; PAU: R2 = 0.368, p = 0.001).
Seedling mortality
The first symptoms of severe dieback and mortality appeared in PAU-inoculated plants 2 weeks p.i., followed by PAA-inoculated plants 6 weeks p.i. All control and PLU-inoculated plants survived until the end of the experiment (Figure 1, Table 4). Overall, PAA caused mortality in 33.3% (8/24 plants) and PAU in 45.8% (11/24) of the inoculated plants (Table 4). However, there was no significant effect of the CO2 level on the mortality rates of either PAA or PAU (p > 0.05).
Log-rank test of equality from survival analysis revealed significant differences in survival probability among experimental groups (χ2 = 29.38, p < 0.001). At ambient CO2 level, survival probabilities in PAA and PAU-inoculated plants were 70% and 45%, respectively. At elevated CO2 level, both isolates had survival rates lower than 60%. First mortality associated with PAU was recorded 3 and 5 weeks after inoculation at elevated and ambient CO2 levels, respectively. The seedlings inoculated with PAA started to die 8 and 9 p.i. at elevated and ambient CO2 levels, respectively. There were no differences in seedling survival probability between PAA and PAU isolates at both ambient and elevated CO2 level. Compared to the control groups, PAU showed significant differences at ambient (χ2 = 8.67, p = 0.003) and elevated CO2 level (χ2 = 6.07, p = 0.014). Also, PAA showed a significant difference from the control groups at ambient (χ2 = 4.02, p = 0.045) and elevated (χ2 = 6.07, p = 0.014) CO2 level (Figure 5).
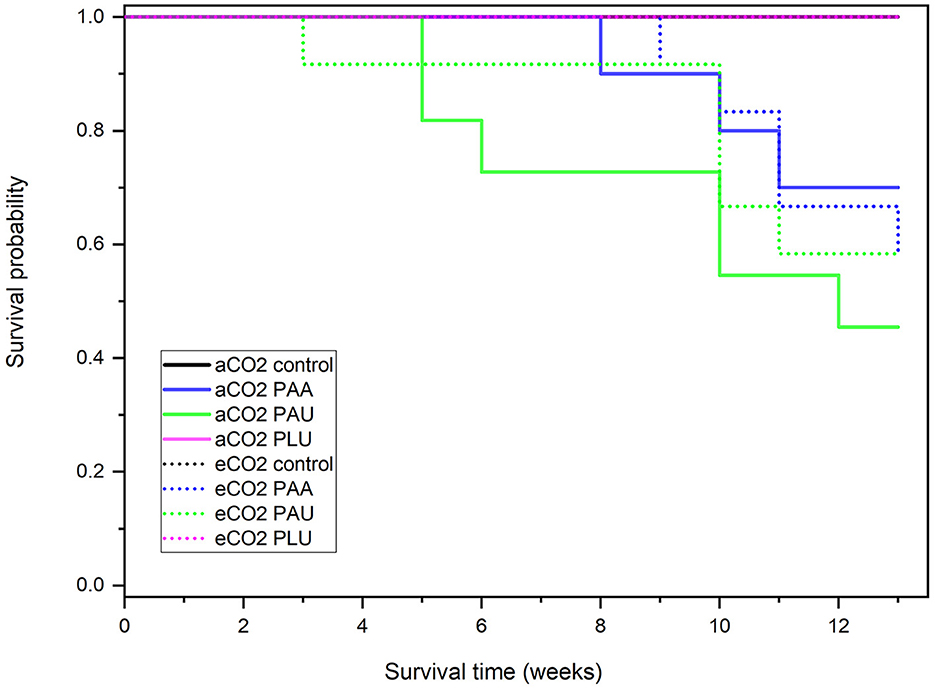
Figure 5. Survival probabilities of Alnus glutinosa seedlings 13 weeks after the inoculation: Kaplan–Meier test at ambient CO2 level (aCO2 = 415 ppm) and elevated CO2 level (eCO2 = 830 ppm). PAA, Phytophthora × alni; PAU, P. uniformis; PLU, P. plurivora.
At the beginning of the experiment, plant height and collar diameter were variable with a mean height of 47.6 ± 15.6 cm and a mean collar diameter of 0.8 ± 0.2 cm (Table 5). Wilcoxon test revealed no significant differences in plant height or collar diameter between Phytophthora species at any CO2 level (p > 0.05). The majority of plants reached their final height by the time of inoculation, with minimal height increases observed until the end of the experiment. In contrast, surviving plants exhibited a noteworthy increase in collar diameter (16–70% after 13 weeks). Conversely, plants that died first showed a decrease in collar diameter as the tissue shrunk due to water loss.
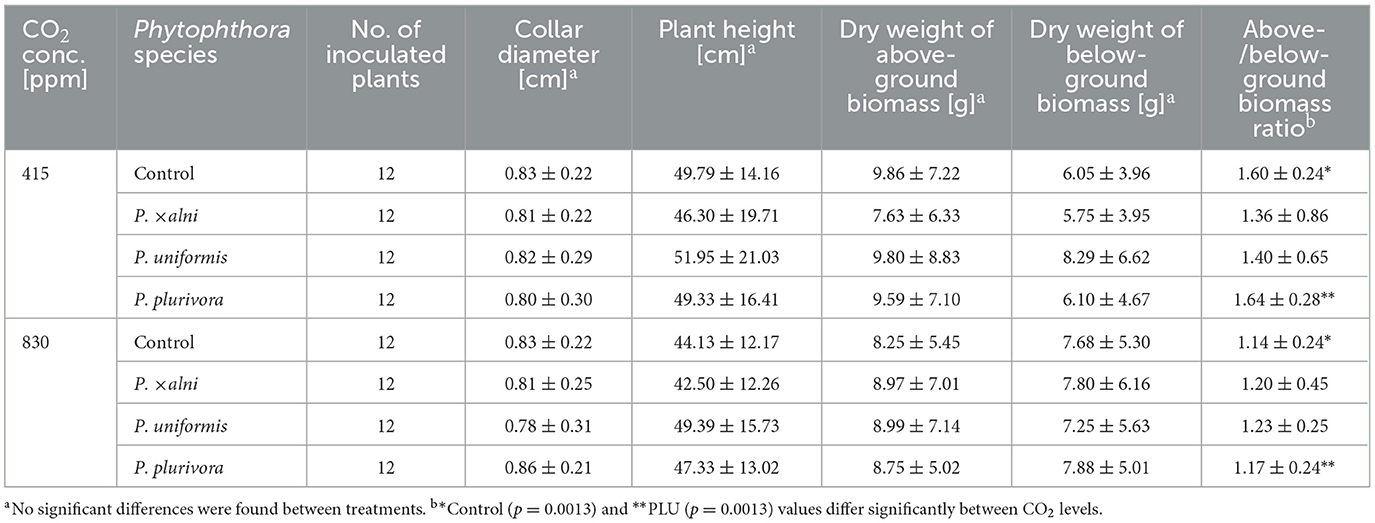
Table 5. Results from the underbark inoculation test on Alnus glutinosa seedlings with three Phytophthora species after 13 weeks.
A statistically significant negative correlation between mortality and stem girth was found for both PAA and PAU (Welsh t-test, p < 0.05), i.e., higher mortality was associated with plants of smaller stem girth (Figure 6).
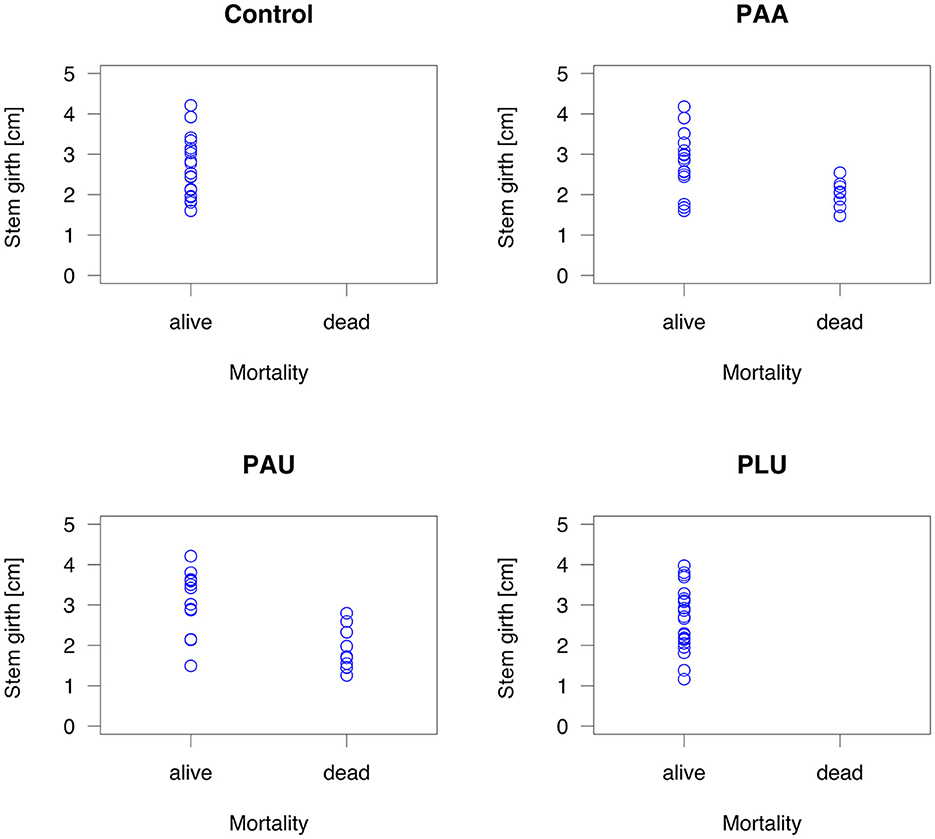
Figure 6. Relationship between the stem girth of Alnus glutinosa seedlings and mortality (PAA, Phytophthora × alni; PAU, P. uniformis; PLU, P. plurivora): Welsh t-test (PAA: p = 0.0018; PAU: p < 0.001).
The percentage of lesion length from total plant height ranged in dead plants approximately from 30% to 80%. In surviving plants, the lesions extended approximately over 1% to 31% of the total plant height. This percentage correlated significantly with the mortality in both PAA and PAU (r = 0.804 and r = 0.851, respectively) (data not shown). Moreover, plant height showed a significant negative correlation with mortality for PAA (r = −0.389), PAU (r = −0.357) and PAA-PAU combined (r = −0.27) (Figure 7), i.e., higher plants died later or survived until the end of the experiment. The first plants to die were those with the shortest height and lesion lengths exceeding 60 % of the total plant height.
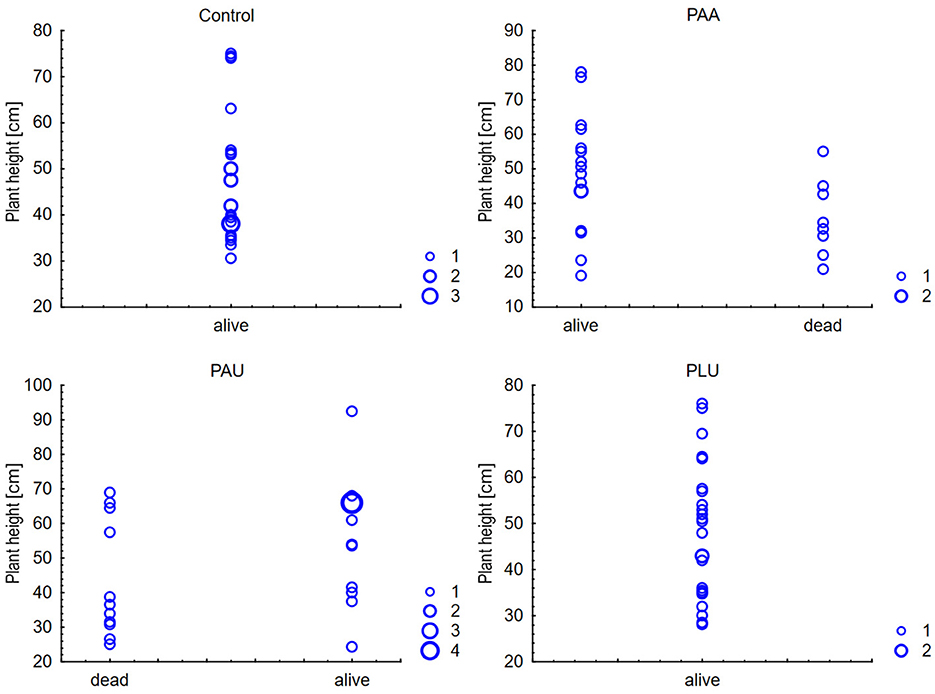
Figure 7. Correlations between plant height of Alnus glutinosa seedlings and mortality (PAA, Phytophthora × alni; PAU, P. uniformis; PLU, P. plurivora): Spearman Rank Order Correlations (PAA: r = −0.389, PAU: r = −0.357, PAA and PAU: r = −0.27).
Plant biomass
The above-ground biomass at the end of the experiment was affected by various plant reactions to the pathogen infection. In many plants, successive leaf loss occurred over the whole experiment. Symptoms, such as wilting, leaf drying, chlorosis, sudden leaf dropping, and subsequent regeneration leaf flush, caused variations in plant biomass across all treatments (Figure 1). No significant differences were observed in dry biomass between above-ground plant tissues and roots. The average values for above and below-ground biomass for all plants were 8.89 ± 6.50 g and 6.96 ± 5.06 g, respectively (Table 5).
The effect of Phytophthora species on dry biomass did not show statistical significances. However, when comparing the ratio between above- and below-ground biomass, a statistically significant negative effect of elevated CO2 was observed in control (p = 0.0013) and PLU–inoculated plants (p = 0.0013) (Supplementary Figure S3). In both cases, higher ratios were found at the ambient level compared to the elevated level (control: 1.60 ± 0.24 vs. 1.14 ± 0.24, PLU: 1.64 ± 0.28 vs. 1.17 ± 0.24). In plants inoculated with PAA or PAU the ratio between above- and below-ground biomass showed neither a significant effect of the CO2 level (p > 0.05; Supplementary Figure S3) nor a statistically significant correlation with mortality (p > 0.05; data not shown).
Physiological measurements and chemical analysis
Physiological responses of alder seedlings to the three Phytophthora species showed significant variations in time vs. CO2 levels, and their interplay across treatments for net photosynthesis (Pn), stomatal conductance (Gs), and intracellular CO2 concentration (Ci). The Ci/Ca ratio, denoting the intra- and extracellular CO2 concentration ratio, displayed differences between measurements and CO2 concentrations. Net photosynthesis (Pn) exhibited a declining trend throughout the measurement period, with no significant differences between Phytophthora species and the control, excluding CO2 concentration and week interaction. However, significant differences were found between the first and second measurements after the inoculation (two and 4 weeks p.i., respectively) in all inoculated plants at each CO2 level (p < 0.05) (Figure 8). A non-significant decrease in Pn, observed between the first and second measurements in control plants at ambient CO2 level, was induced by competition for light and space. Elevated CO2 notably increased Pn, particularly in the pre-inoculation stage, but the values in inoculated plants were gradually decreasing over the experimental period.
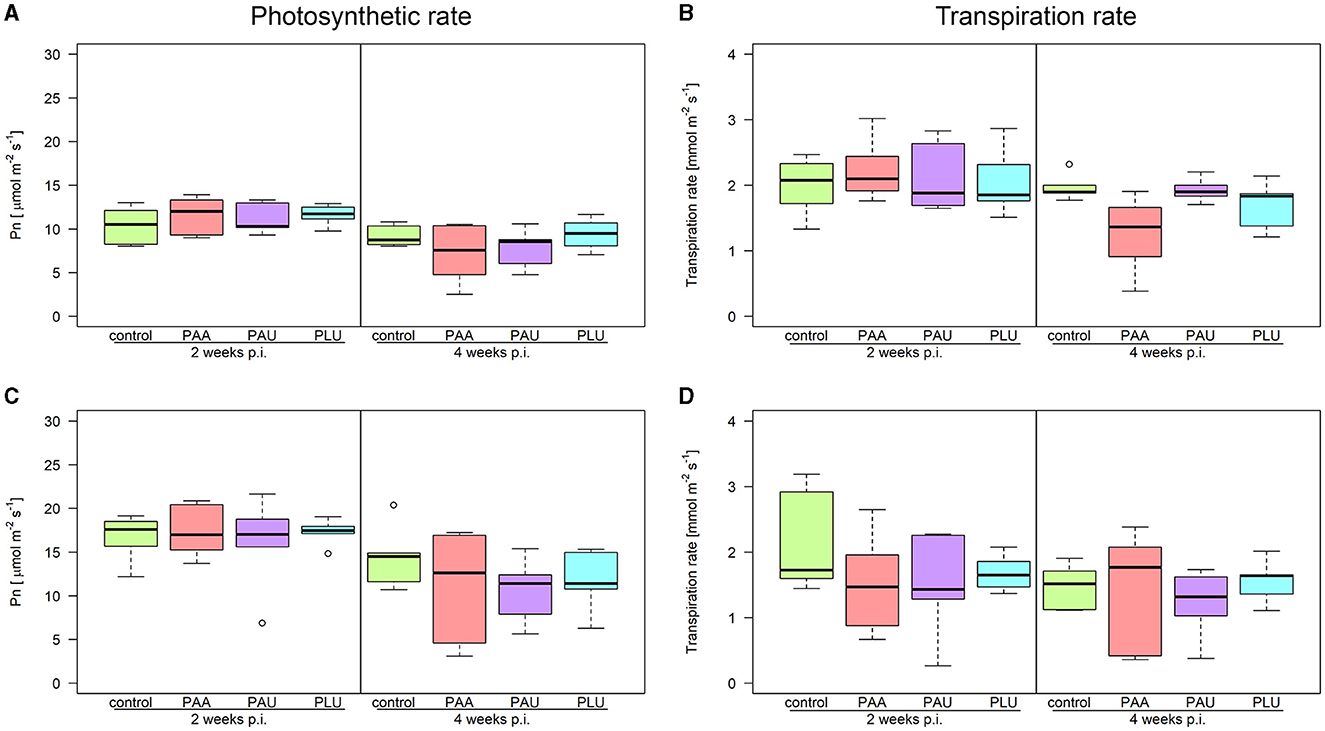
Figure 8. Physiological parameters of Alnus glutinosa seedlings inoculated with Phytophthora × alni (PAA), P. uniformis (PAU), and P. plurivora (PLU) measured 2 and 4 weeks after underbark inoculation (p.i.). Rates of net photosynthesis (Pn) measured at (A) ambient (415 ppm) and (B) elevated CO2 level (830 ppm). Transpiration rate measured at (C) ambient and (D) elevated CO2 level.
Stomatal conductance (Gs) remained stable throughout the experiment, with the control having the lowest average values (0.27 ± 0.14 mol H2O m−2 s−1) and PLU exhibiting the highest values (0.32 ± 0.18 mol H2O m−2 s−1). Elevated CO2 led to a 7% Gs reduction throughout the experimental period. Intriguingly, Ci responded to higher CO2 levels, gradually reaching its peak during the third measurement (4 weeks p.i.), while Ci/Ca ratio increased in elevated CO2. Transpiration (Tr) showed decreasing trend in all inoculated plants till 4 weeks p.i. with no significant differences among Phytophthora species within each CO2 level (p > 0.05) (Figure 8). Water use efficiency (WUE) ranged from 5.7 to 9.4 μmol CO2 per mmol H2O, with higher values at the elevated CO2 level. Fast kinetics of fluorescence indexes, quantum efficiency of PSII (Fv/Fm) and performance index (PI) exhibited common values for healthy plants. Similarly, the course of the OJIP curve did not reveal any significant differences in any step of the graph (Supplementary Figure S4).
In root samples, five sugars and eight phenolic compounds were identified, with no significant differences between treatments (Phytophthora species/CO2 level) (Supplementary Table 2). Total sugar content was lower in infected alders, but no statistical significance was found between treatments. A higher content of mannitol was recorded in both PAA- and PAU-inoculated plants which were considered dead or dying compared to living plants. In PLU-inoculated plants approximately ten times lower values of mannitol were measured at elevated as compared to ambient CO2 level. In contrast, the content of total sugars (mannitol excluded) was higher at ambient CO2 level, and glucose and fructose showed approximately double concentrations compared to the elevated CO2 level. Phenole concentrations in roots of infected and non-infected plants displayed extensive variation without significant differences (Supplementary Table 2). However, for several phenolic compounds an effect of CO2 level was recorded in both control and PLU-inoculated plants. Higher mean values of catechin, epicatechin, gallic acid, and taxifolin were found at elevated CO2 level compared to the ambient level.
Discussion
The devastating alder dieback epidemic, caused by the three species from the “Phytophthora alni complex,” was first noticed in the mid 1990s in the UK (Brasier et al., 1999; Gibbs et al., 1999) and is currently widespread along rivers and in alder plantings of most European countries (Jung et al., 2016, 2018). Phytophthora × alni (PAA) has been identified as the main causal agent of the disease in most affected regions with temperate climatic conditions but P. × multiformis (PAM) and P. uniformis (PAU) also cause bark lesions and mortality in the field (Brasier et al., 1999; Nagy et al., 2003; Jung and Blaschke, 2004; Thoirain et al., 2007; Solla et al., 2010; Aguayo et al., 2013; Jung et al., 2013, 2018; Štěpánková et al., 2013; Redondo et al., 2015; Corcobado et al., 2023). Only two of the three species, i.e., PAA and PAU, have been recorded in the Czech Republic yet, with PAA strongly prevailing in declining alder stands (88% of 59 declining alder stands studied; Štěpánková et al., 2013). In one riparian forest in the Czech Republic, PAA and PAU were isolated from the same declining A. glutinosa tree (Macháčová, unpublished). A range of other Phytophthora species can contribute to the decline of riparian alder stands, most important P. plurivora (PLU) a widespread forest pathogen in Europe with a broad host range that includes A. glutinosa, A. incana and A. viridis (Jung and Blaschke, 2004; Jung and Burgess, 2009; Jung et al., 2013, 2016, 2018; Mrázková et al., 2013; Haque et al., 2014; Corcobado et al., 2023; Tkaczyk et al., 2023).
The pathogenicity of species from the “Phytophthora alni complex” to all European alder species was demonstrated in several studies with aggressiveness of the different Phytophthora species varying between different studies (Brasier and Kirk, 2001; Santini et al., 2003; Jung and Blaschke, 2006; Černý and Strnadová, 2010; Haque and Diez, 2012; Haque et al., 2015; Bjelke et al., 2016; Chandelier et al., 2016; Romportl et al., 2016; Zamora-Ballesteros et al., 2017). Extensive bark inoculation trials with mature logs of A. glutinosa revealed high aggressiveness of multiple PAA strains and of Dutch PAM strains whereas German PAM strains and Swedish PAU strains were only moderately pathogenic (Brasier and Kirk, 2001). Pathogenicity tests from other studies indicate, however, that PAU can be quite aggressive to A. glutinosa (Corcobado et al., 2017; Zamora-Ballesteros et al., 2017) and also to the North American red alder (A. rubra; Navarro et al., 2015). In this study, both PAA and PAU caused large bark lesions and high mortality in A. glutinosa seedlings, whereas PLU produced only small lesions not leading to mortality. The lesions caused by PAA and PAU did not differ significantly from each other. However, PAU lesions led to a higher mortality rate (45.8%) compared to PAA (33.3%), although this difference was not statistically significant. In a similar underbark inoculation study by Zamora-Ballesteros et al. (2017), PAA and PAU showed similar aggressiveness to A. glutinosa with lesion lengths of ca. 35–40 mm. In their study, the survival probability at 37 weeks p.i. was 50–70% for PAA (depending on the isolate used) and 50% for PAU. Similar mortality rates were found in our study at 13 weeks p.i., but in contrast, the lesions were considerably longer reaching on average 110 mm in PAA and 117.8 mm in PAU. Lesions extended rapidly in some plants during the first 2 weeks p.i. and sometimes reached their maximum length within this time. A similar scenario was observed in other underbark inoculation studies (Zamora-Ballesteros et al., 2017; Marques Gomes et al., 2019). Gibbs (2003) reported on 15-months old A. glutinosa seedlings inoculated with species from the “Phytophthora alni complex” 3 weeks p.i. mean lesion lengths ranging from 28 to 68 mm. Comparison to results from other studies suggests a higher aggressiveness of the PAA and PAU isolates or higher susceptibility of the A. glutinosa genotypes used in our study. Isolate genotype seems to be an important factor affecting lesion development and mortality, as demonstrated by various experiments with PAA (Haque and Diez, 2012; Chandelier et al., 2016; Štochlová et al., 2016; Zamora-Ballesteros et al., 2017). The host plant susceptibility or resistance depends on many variables. Significant differences in susceptibility/tolerance of individual A. glutinosa trees to PAA were demonstrated in Belgium, Germany and the Czech Republic (Jung and Blaschke, 2006; Chandelier et al., 2016; Štochlová et al., 2016). In an extensive study including 90 genotypes of A. glutinosa sampled across the Czech Republic Štochlová et al. (2016) found that differences in susceptibility to PAA were also depending on the geographic origin and altitude of the alder genotypes. Geographic patterns of resistance could be related to past exposures to invasive Phytophthora pathogens (Frampton et al., 2013), as trees in river corridors, including alders, are particularly exposed to many alien pathogenic oomycetes (Černý et al., 2011; Milenković et al., 2018; Jung et al., 2019; Corcobado et al., 2023).
The age of a host plant is another important factor for the susceptibility to a pathogen. The thinner bark of young A. glutinosa shoots with smaller diameter may be more vulnerable to tissue colonization than mature bark tissues of older thicker shoots (Haque et al., 2015). This is consistent with the results of our study where we observed the first dying plants being those with the smallest collar diameter (ca. 4–6 mm). On the contrary, plants with thicker collars (>9 mm) survived until the end of the experiment.
Phytophthora plurivora produced lesion lengths of ca. 10–30 mm but induced no mortality. All inoculated seedlings healed the wounds with the callus tissue and did not show wilting or dieback symptoms. However, as a widely distributed pathogen, PLU was found quite aggressive to different host plants in numerous pathogenicity tests (Jung et al., 2003; Rytkönen et al., 2012; Henricot et al., 2014; Milenković et al., 2018; Oszako et al., 2018; Milanović et al., 2020; Ďurkovič et al., 2021). Several studies proved PLU to be pathogenic to alder seedlings, which is inconsistent with our results. Zamora-Ballesteros et al. (2017) reported in an underbark inoculation test on 1-year old A. glutinosa seedlings lesion lengths of 35–40 mm and a seedling survival probability of approximately 50% at 37 weeks p.i. (90% after 13 weeks). Similarly, Mrázková et al. (2013) observed 35–40 mm lesion length on 2-years old alder seedlings after 6 weeks p.i. In another underbark trial, Haque et al. (2014) found all inoculated plants wilted and died 3 months p.i.. In a zoospore inoculation test with excised A. glutinosa shoots, Jung and Nechwatal (2008) found PLU (under its former name P. citricola) causing within 3 weeks significantly longer lesions than PAA (123 vs. 72 mm). These contrasting results indicate that different genotypes of PLU show considerable differences in aggressiveness to A. glutinosa. In our study, despite having been constrained early by the formation of callus tissue the pathogen was successfully reisolated from all inoculated plants. Apparently, this PLU genotype has low virulence on A. glutinosa but has the ability to survive in dead tissue for quite a long time (13 weeks) which is probably related to the formation of oospores (Jung and Burgess, 2009). However, the pathogen would probably lose its viability and die after a certain time. This was demonstrated by Ďurkovič et al. (2021), who inoculated stems of 10-years old poplar trees under field conditions with P. cactorum (Lebert and Cohn) Schröt. and P. plurivora and found the wounds after 4 years completely healed with no presence of the pathogens.
Studies on Phytophthora-host interaction at elevated CO2 levels are limited and showed contrasting results. Oszako et al. (2016) did not find any effect of elevated CO2 concentration (800 ppm) on the root and shoot development of oak seedlings growing in non-infested soil or in soil infested with the oak-specific fine root pathogen P. quercina. In this study, a statistically significant negative correlation between the elevated CO2 level and the above-/below-ground biomass ratio of A. glutinosa seedlings was found for the control and for plants inoculated with the moderately aggressive PLU strain but not for plants inoculated with the aggressive PAA and PAU strains. Although the mortality rate did not differ significantly between ambient and elevated (830 ppm) CO2 levels, there was an effect of the CO2 levels on the extent of the lesions for PAU-inoculated plants. Thus, at the elevated CO2 level PAU caused a significantly smaller lesion area and width as well as a tendentially lower lesion length. Similarly, in a tomato trial, a tendency of increased tolerance to P. nicotianae Breda de Haan (referred to as P. parasitica) was found under elevated CO2 (Jwa and Walling, 2001). However, in other studies, Phytophthora pathogens generally displayed higher aggressiveness to host plants at elevated CO2. Tkaczyk et al. (2014) reported P. cactorum and P. plurivora causing more extensive fine root destructions of beech seedlings at elevated CO2 level compared to the ambient condition. Similar results with increased susceptibility of beech seedlings to P. plurivora (referred to as P. citricola) at elevated CO2 level were recorded by Fleischmann et al. (2010).
As the pathogen gradually colonizes the conductive tissues, the girdling extends, and the plant's response can be observed in both lesion development and physiological parameters. Many studies have shown that the common reactions after Phytophthora-induced bark infection are a gradual reduction in water uptake, the fast closure of stomata and in consequence a decrease in photosynthesis (Osswald et al., 2014). In our study, the lesions length reached their maximum in most of the inoculated plants 4 weeks p.i. Therefore, the most profound reactions were measured within this period −2 and 4 weeks post inoculation (p.i.). The biggest decrease of transpiration (Tr) was recorded in PAU 4 weeks p.i. when the amount of transpired water dropped to the half value (49%) of the control values (1.2 mmol m−2 s−1) at elevated CO2 level, and to 68% (1.0 mmol m−2 s−1) at ambient level. Similarly, net photosynthesis (Pn) reached significantly lower values in PAA- and PAU-inoculated plants 4 weeks p.i. compared to 2 weeks p.i. at regardless the CO2 levels. Generally, it would have been expected that Pn increases under elevated CO2 conditions as it occurred for control plants and also in many studies (e.g., Pritchard et al., 1999; Badiani et al., 2023). It seems that the influence of the CO2 conditions on Pn disappears under acute infections caused by aggressive pathogens. Surprisingly, no significant differences in Pn were recorded between control and inoculated plants at both CO2 levels. At ambient CO2 level, these results are consistent with Clemenz et al. (2008), who found no significant differences between control and inoculated plants in a trial with 3-years-old alders stem-inoculated with Phytophthora × alni during the 1st month after the inoculation. Only after 3 months were differences recorded, indicating the late effect of the pathogen on plant physiology.
The decrease of stomatal conductance (Gs) as a common physiological trait was observed across various Phytophthora and tree species (Gallego et al., 1999; Robin et al., 2001). In contrast, Gs remained relatively stable in our experiment, but PAA- and PAU-inoculated plants decreased their Gs by approx. 30% 4 weeks p.i. in comparison to 2 weeks p.i.. This trend was not observed in PLU-inoculated plants, as these plants showed very small lesion sizes and no mortality. Moreover, no effect of elevated CO2 on Gs was observed in any treatment. Our comparison of Pn and Gs trend 2 and 4 weeks p.i. revealed that Pn decreased with Gs simultaneously at ambient CO2 level. A similar observation was made by Fleischmann et al. (2005) who performed soil inoculation of beech seedlings with P. plurivora (referred to as P. citricola). As reported in many studies, plants close their stomata at elevated CO2 level due to surplus of CO2 in the atmosphere (e.g., Kupper et al., 2006). Nevertheless, in our study, elevated CO2 caused disbalance between Pn and Gs in PLU and PAA with lower Pn value and the same value of Gs.
Elevated CO2 also resulted in higher WUEinst values in all treatments 2 weeks p.i. as expected according to general trends (Running and Nemani, 1991). However, the positive influence of CO2 diminished over time and the later values were comparable between treatments. Similarly, Clemenz et al. (2008) reported that WUE of leaf gas exchange hardly differed between inoculation treatments and controls. On the contrary, another study with 1-year-old beech plants infected with P. plurivora showed that WUE data indicated that infected plants suffered from severe drought, even though a significant decrease in net assimilation and transpiration was not observed (Fleischmann et al., 2002).
Chlorophyll a fluorescence is a useful tool for evaluating the plant health status (Oxborough, 2004). Pfanz et al. (2015) measured bark chlorophyll fluorescence in alders 10 weeks after basal stem inoculation with Phytophthora × alni and revealed that Fv/Fm and DF/Fm′ of the cortex chlorenchyma decreased to almost zero, indicating tissue necrosis. Similarly, in other studies at ambient CO2 level, when Phytophthora soil inoculation was performed, differences were recorded in leaf chlorophyll fluorescence between control and inoculated plants (Angay et al., 2014; Dalio et al., 2017; Corcobado et al., 2022). Furthermore, Corcobado et al. (2022) observed differences in chlorophyl fluorescence of beech seedlings only 2 weeks p.i. but 3 weeks p.i. these differences disappeared. Similarly, at elevated CO2 level, Fleischmann et al. (2010) found electron quantum yield of PSII decreased only shortly before the first wilting symptoms occurred in inoculated dying plants. In contrast, our results did not reveal any difference between treatments regardless of the CO2 level. The discrepancy between our findings and those of Fleischmann et al. (2010) and Corcobado et al. (2022) might be influenced by the different type of applied inoculation methods. In soil infestation experiments with Phytophthora pathogens, root damage can be rapidly reflected in decreased foliage vitality, including decreasing performance of chlorophyll a. On the contrary, underbark inoculation leads primarily to necrosis of cortex and phloem tissue, resulting in limited assimilate transport (Osswald et al., 2014) that is minimally shown in chlorophyll fluorescence. Therefore, only when the pathogen starts to move deep into phloem and xylem tissue and the stem becomes completely girdled, chlorophyll a fluorescence would be possibly affected.
Plant responses to pathogen infection can be observed in changing levels of secondary metabolites. Levels of sugars may decrease notably, as reported by Corcobado et al. (2022) who found sugar pool decrease in beech roots in a soil infestation trial with different Phytophthora species, suggesting reduced phloem transport. Levels of mannitol may rise dramatically during plant infection by biotrophic or necrotrophic fungi, as mannitol has a multitude of functions in fungal metabolism (Calmes et al., 2013). In our study, at ambient CO2 level, total sugar content was lower in infected alders, but statistical significance was only found for mannitol, which showed increased levels in PAA and PAU-inoculated plants compared to the control. Similarly, Camisón et al. (2019) reported a temporary increase of sugar alcohols in chestnut clones resistant to P. cinnamomi during disease progression. In our study, plants with an advanced stage of dieback exhibited particularly high values of mannitol, which can be explained by the role of mannitol as an antioxidant agent in fungi and oomycetes that can suppress host defense responses by quenching the reactive oxygen species (Meena et al., 2015; Puig et al., 2018). Interestingly, in our study, an effect of elevated CO2 level on the concentrations of several sugars and phenolic compounds in the roots was found, although the differences to ambient CO2 were not statistically significant. The elevated CO2 level showed an inhibiting effect on the total sugars content, with glucose and fructose reaching only half of the concentrations measured at the ambient CO2 level. High variability in phenolic levels was recorded in all root samples tested in this study, regardless of the treatment. Generally, phenolic compounds level tends to rise in leaves in response to tissue damage, as demonstrated by other studies (e.g., Brown et al., 2018). In our study, PAA and PAU-inoculated plants showed a high variability of phenolic compounds in roots. Regarding elevated CO2 levels, a positive effect was recorded for several phenolic compounds in control and PLU-inoculated plants. Similar results have been shown at elevated CO2 by Roth et al. (1998). In general, the lack of differences in secondary metabolites between treatments was probably due to the low number of sampled plants which exhibited significantly different health status ranging from severe dieback to healthy-looking plants.
In conclusion, this study demonstrated that PAU can show similar aggressiveness to A. glutinosa as PAA. The results indicate that inoculation experiments should be performed over longer periods to observe for different Phytophthora species statistically significant differences in disease incidences and defense responses of inoculated plants. Statistically significant effects of elevated CO2 concentration on the disease symptoms of underbark-inoculated A. glutinosa plants, such as mortality, lesion development, plant biomass or chemical and physiological parameters were not recorded. On the contrary, PAU caused significantly larger lesions at ambient CO2 and, although not significant, a trend of smaller lesion area at elevated CO2 was also observed for PAA. Further experiments using soil infestation methods which simulate the natural infection process (Jung et al., 1996, 1999, 2003, 2018) and longer exposition to various CO2 levels to enable a significant effect on growth and above-ground biomass production of plants exposed to elevated CO2 level (Ainsworth and Long, 2005) and a potentially more pronounced effect of Phytophthora infections on above-ground plant growth are needed to clarify the effect of elevated CO2 on the Phytophthora root and collar rot disease of A. glutinosa.
Data availability statement
The original contributions presented in the study are included in the article/Supplementary material, further inquiries can be directed to the corresponding authors.
Author contributions
MM: Conceptualization, Formal analysis, Funding acquisition, Investigation, Methodology, Project administration, Resources, Validation, Visualization, Writing – original draft, Writing – review & editing. IT: Conceptualization, Formal analysis, Investigation, Writing – review & editing. TC: Conceptualization, Investigation, Writing – review & editing. ZN: Formal analysis, Investigation, Writing – review & editing. SM: Formal analysis, Writing – review & editing. JJ: Investigation, Writing – review & editing. VP: Investigation, Supervision, Writing – review & editing. JC: Data curation, Formal analysis, Writing – review & editing. SG: Formal analysis, Writing – review & editing. ON: Investigation, Writing – review & editing. VZ: Investigation, Writing – review & editing. AK: Formal analysis, Writing – review & editing. IM: Conceptualization, Investigation, Methodology, Supervision, Writing – review & editing. TJ: Conceptualization, Investigation, Writing – review & editing.
Funding
The author(s) declare that financial support was received for the research, authorship, and/or publication of this article. The study was supported by the project EVA4.0, No. CZ.02.1.01/0.0/0.0/16_019/0000803 financed by OP RDE and the European Regional Development Fund, the project Phytophthora Research Centre Reg. No. CZ.02.1.01/0.0/0.0/15_003/0000453.
Acknowledgments
We thank Johana Šindelářová, Adéla Juříková, and Barbora Dvořáková for their assistance and technical support during the experiment. We are also grateful to Marília Horta Jung for help with genetic analyses and Tomáš Kudláček for statistical consultations.
Conflict of interest
SG was employed by VSN International.
The remaining authors declare that the research was conducted in the absence of any commercial or financial relationships that could be construed as a potential conflict of interest.
Publisher's note
All claims expressed in this article are solely those of the authors and do not necessarily represent those of their affiliated organizations, or those of the publisher, the editors and the reviewers. Any product that may be evaluated in this article, or claim that may be made by its manufacturer, is not guaranteed or endorsed by the publisher.
Supplementary material
The Supplementary Material for this article can be found online at: https://www.frontiersin.org/articles/10.3389/ffgc.2024.1379791/full#supplementary-material
References
Abad, Z. G., Burgess, T. I., Bourret, T., Bensch, K., Cacciola, S., Scanu, B., et al. (2023). Phytophthora: taxonomic and phylogenetic revision of the genus. Stud. Mycol. 106, 259–348. doi: 10.3114/sim.2023.106.05
Aguayo, J., Adams, G. C., Halkett, F., Catal, M., Husson, C., Nagy, Z. Á., et al. (2013). Strong genetic differentiation between North American and European populations of Phytophthora alni subsp. uniformis. Phytopathology 103, 190–199. doi: 10.1094/PHYTO-05-12-0116-R
Ainsworth, E. A., and Long, S. P. (2005). What have we learned from 15 years of free-air CO2 enrichment (FACE)? A meta-analytic review of the responses of photosynthesis, canopy properties and plant production to rising CO2. New Phytol. 165, 351–372. doi: 10.1111/j.1469-8137.2004.01224.x
Angay, O., Fleischmann, F., Recht, S., Herrmann, S., Matyssek, R., Oßwald, W., et al. (2014). Sweets for the foe–effects of nonstructural carbohydrates on the susceptibility of Quercus robur against Phytophthora quercina. New Phytol. 203, 1282–1290. doi: 10.1111/nph.12876
Badiani, M., Raschi, A., Paolacci, A. R., and Miglietta, F. (2023). “Plants responses to elevated CO2; a perspective from natural CO2 springs,” in Environmental Pollution and Plant Responses, eds. S. B. Agrawal, and M. Agrawal (London: Routledge), 45–81. doi: 10.1201/9780203756935-4
Bazinet, Q., Tang, L., and Bede, J. C. (2022). Impact of future elevated carbon dioxide on C3 plant resistance to biotic stresses. MPMI 35, 527–539. doi: 10.1094/MPMI-07-21-0189-FI
Beakes, G. W., Thines, M., and Honda, D. (2015). Straminipile “fungi” – taxonomy. Encycl. Life Sci. 2015, 1–9. doi: 10.1002/9780470015902.a0001984
Belmecheri, S., and Lavergne, A. (2020). Compiled records of atmospheric CO2 concentrations and stable carbon isotopes to reconstruct climate and derive plant ecophysiological indices from tree rings. Dendrochronologia 63:125748. doi: 10.1016/j.dendro.2020.125748
Benjamini, Y., and Hochberg, Y. (1995). Controlling the false discovery rate: a practical and powerful approach to multiple testing. J. R. Stat. Soc. Series B 57, 289–300. doi: 10.1111/j.2517-6161.1995.tb02031.x
Bjelke, U., Boberg, J., Oliva, J., Tattersdill, K., and Mckie, B. G. (2016). Dieback of riparian alder caused by the Phytophthora alni complex: Projected consequences for stream ecosystems. Freshw. Biol. 61, 565–579. doi: 10.1111/fwb.12729
Brasier, C., Scanu, B., Cooke, D., and Jung, T. (2022). Phytophthora: an ancient, historic, biologically and structurally cohesive and evolutionarily successful generic concept in need of preservation. IMA Fungus 13:12. doi: 10.1186/s43008-022-00097-z
Brasier, C. M., Cooke, D. E. L., and Duncan, J. M. (1999). Origin of a new Phytophthora pathogen through interspecific hybridization. PNAS 96, 5878–5883. doi: 10.1073/pnas.96.10.5878
Brasier, C. M., and Kirk, S. A. (2001). Comparative aggressiveness of standard and variant hybrid alder Phytophthoras, Phytophthora cambivora and other Phytophthora species on bark of Alnus, Quercus and other woody hosts. Plant Pathol. 50, 218–229. doi: 10.1046/j.1365-3059.2001.00553.x
Brasier, C. M., Kirk, S. A., Delcan, J., Cooke, D. E. L., Jung, T., and Man In't Veld, W. A. (2004). Phytophthora alni sp. nov. and its variants: Designation of emerging heteroploid hybrid pathogens spreading on Alnus trees. Mycol. Res. 108, 1172–1184. doi: 10.1017/S0953756204001005
Brown, A. B., Smith, C. D., Johnson, E. F., et al. (2018). “Impact of insect herbivory on plant defense production,” in Plant defense: Biological control, eds. M. Schuman and M. Heil (Dordrecht: Springer), 123–145.
Butler, D. G., Cullis, B. R., Gilmour, A. R., Gogel, B. J., and Thompson, R. (2017). ASReml-R reference manual version 4. Hemel Hempstead, UK: VSN International Ltd.
Calmes, B., Guillemette, T., Teyssier, L., Siegler, B., Pign,é, S., Landreau, A., et al. (2013). Role of mannitol metabolism in the pathogenicity of the necrotrophic fungus Alternaria brassicicola. Front. Plant Sci. 4:131. doi: 10.3389/fpls.2013.00131
Camisón, Á., Martín, M. Á., Sánchez-Bel, P., Flors, V., Alcaide, F., Morcuende, D., et al. (2019). Hormone and secondary metabolite profiling in chestnut during susceptible and resistant interactions with Phytophthora cinnamomi. J. Plant Physiol. 241:153030. doi: 10.1016/j.jplph.2019.153030
Černý, K., and Strnadová, V. (2010). Phytophthora alder decline: Disease symptoms, causal agent and its distribution in the Czech Republic. Plant Prot. Sci. 46, 12–18. doi: 10.17221/43/2009-PPS
Černý, K., Tomšovský, M., Mrázková, M., and Strnadová, V. (2011). The present state of knowledge on Phytophthora spp. diversity in forest and ornamental woody plants in the Czech Republic. N. Z. J. For. Sci. 41S, S75–S82.
Chandelier, A., Husson, C., Druart, P., and Marçais, B. (2016). Assessment of inoculation methods for screening black alder resistance to Phytophthora × alni. Plant Pathol. 65, 441–450. doi: 10.1111/ppa.12418
Chen, Q., Bakhshi, M., Balci, Y., Broders, K. D., Cheewangkoon, R., Chen, S. F., et al. (2022). Genera of phytopathogenic fungi: GOPHY 4. Stud. Mycol. 101, 417–564. doi: 10.3114/sim.2022.101.06
Claessens, H. (2003). The alder populations of Europe. In: Phytophthora Disease of Alder in Europe, ed. J. Gibbs, C. Van Dijk, J. F. Webber (Edinburgh, UK: Forestry Commission Bulletin), 5–14.
Clemenz, C., Fleischmann, F., Häberle, K. H., Matyssek, R., and Oßwald, W. (2008). Photosynthetic and leaf water potential responses of Alnus glutinosa saplings to stem-base inoculation with Phytophthora alni subsp. alni. Tree Physiol. 28, 1703–1711. doi: 10.1093/treephys/28.11.1703
Corcobado, T., Cech, T. L., Daxer, A., Datková, H., Janoušek, J., Patra, S., et al. (2023). Phytophthora, Nothophytophthora and Halophytophthora diversity in rivers, streams and riparian alder ecosystems of Central Europe. Mycol. Prog. 22:50. doi: 10.1007/s11557-023-01898-1
Corcobado, T., Milenković, I., Saiz-Fernández, I., Kudláček, T., Plichta, R., Májek, T., et al. (2022). Metabolomic and Physiological Changes in Fagus sylvatica Seedlings Infected with Phytophthora plurivora and the A1 and A2 Mating Types of P. × cambivora. J. Fungi. 8:298. doi: 10.3390/jof8030298
Corcobado, T., Schwanda, K., Daxer, A., Hüttler, C., and Cech, T. (2017). Effects of co-inoculations of Alnus incana with Phytophthora alni complex and P. plurivora on disease development and mortality. 8th Meeting IUFRO Working Party 7.02.09 (Phytophthora in Forests and Natural Ecosystems), Sapa, Vietnam.
Dalio, R. J. D., Fleischmann, F., Chambery, A., Eichmann, R., Massola, N. S. Jr, Pascholati, S. F., et al. (2017). Immunodepletion of α-plurivorin effector leads to loss of virulence of Phytophthora plurivora towards Fagus sylvatica. Forest Pathol. 47:e12362. doi: 10.1111/efp.12362
Ďurkovič, J., Bubeníková, T., Gužmerová, A., Fleischer, P., Kurjak, D., Canová, I., et al. (2021). Effects of Phytophthora inoculations on photosynthetic behaviour and induced defence responses of plant volatiles in field-grown hybrid poplar tolerant to bark canker disease. J. Fungi 7:969. doi: 10.3390/jof7110969
Erwin, D. C., and Ribeiro, O. K. (1996). Phytophthora Diseases Worldwide. St. Paul, MN: APS Press, American Phytopathological Society.
Fleischmann, F., Koehl, J., Portz, R., Beltrame, A. B., and Oßwald, W. (2005). Physiological changes of Fagus sylvatica seedlings infected with Phytophthora citricola and the contribution of its elicitin “citricolin” to pathogenesis. Plant Biol. 7, 650–658. doi: 10.1055/s-2005-872891
Fleischmann, F., Raidl, S., and Oßwald, W. F. (2010). Changes in susceptibility of beech (Fagus sylvatica) seedlings towards Phytophthora citricola under the influence of elevated atmospheric CO2 and nitrogen fertilization. Environ. Pollut. 158, 1051–1060. doi: 10.1016/j.envpol.2009.10.004
Fleischmann, F., Schneider, D., Matyssek, R., and Oßwald, W. F. (2002). Investigations on net CO2 assimilation, transpiration and root growth of Fagus sylvatica infested with four different Phytophthora species. Plant Biol. 4, 144–152. doi: 10.1055/s-2002-25728
Frampton, J., Isik, F., and Benson, D. M. (2013). Genetic variation in resistance to Phytophthora cinnamomi in seedlings of two Turkish Abies species. Tree Genet. Gen. 9, 53–63. doi: 10.1007/s11295-012-0529-0
Gallego, F. J., Perez de Algaba, A., and Fernandez-Escobar, R. (1999). Etiology of oak decline in Spain. Eur. J. Forest Pathol. 29, 17–27. doi: 10.1046/j.1439-0329.1999.00128.x
Gibbs, J. (2003). “Management and control of Phytophthora disease of alder,” in Phytophthora Disease of Alder in Europe, ed. J. Gibbs, C. van Dijk, J. Webber (Edinburgh, UK: Forestry Commission Bulletin), 73–78.
Gibbs, J. N., Lipscombe, M. A., and Peace, A. J. (1999). The impact of Phytophthora disease on riparian populations of common alder (Alnus glutinosa) in southern Britain. Eur. J. Plant Pathol. 29, 39–50. doi: 10.1046/j.1439-0329.1999.00129.x
Grünwald, N. J., Garbelotto, M., Goss, E. M., Heungens, K., and Prospero, S. (2012). Emergence of the sudden oak death pathogen Phytophthora ramorum. Trends Microbiol. 20, 131–138. doi: 10.1016/j.tim.2011.12.006
Haque, M. M., Martínez-Álvarez, P., Lomba, J. M., Martín-García, J., and Diez, J. J. (2014). First report of Phytophthora plurivora causing collar rot on common alder in Spain. Plant Dis. 98:425. doi: 10.1094/PDIS-07-13-0784-PDN
Haque, M. M. U., and Diez, J. J. (2012). Susceptibility of common alder (Alnus glutinosa) seeds and seedlings to Phytophthora alni and other Phytophthora species. Forest Syst. 21, 313–322. doi: 10.5424/fs/2012212-02267
Haque, M. M. U., Martín-García, J., and Diez, J. J. (2015). Variation in pathogenicity among the three subspecies of Phytophthora alni on detached leaves, twigs and branches of Alnus glutinosa. For. Path. 45, 484–491. doi: 10.1111/efp.12198
Hardham, A. R., and Blackman, L. M. (2018). Phytophthora cinnamomi. Mol. Plant Pathol. 19, 260–285. doi: 10.1111/mpp.12568
Henricot, B., Pérez-Sierra, A., and Jung, T. (2014). Phytophthora pachypleura sp. nov., a new species causing root rot of Aucuba japonica and other ornamentals in the United Kingdom. Plant Pathol. 63, 1095–1109. doi: 10.1111/ppa.12194
Husson, C., Aguayo, J., Revellin, C., Frey, P., Ioos, R., and Marçais, B. (2015). Evidence for homoploid speciation in Phytophthora alni supports taxonomic reclassification in this species complex. Fungal Genet. Biol. 77, 12–21. doi: 10.1016/j.fgb.2015.02.013
Ioos, R., Andrieux, A., Marçais, B., and Frey, P. (2006). Genetic characterization of the natural hybrid species Phytophthora alni as inferred from nuclear and mitochondrial DNA analyses. Fungal Genet. Biol. 7, 511–529. doi: 10.1016/j.fgb.2006.02.006
IPCC (2001). Climate Change 2001: The scientific Basis. Contribution of Working Group I to the Third Assessment Report of the Intergovernmental Panel on Climate Change; IPCC: Cambridge, UK; New York, NY, USA.
Jung, T., Blaschke, H., and Neumann, P. (1996). Isolation, identification and pathogenicity of Phytophthora species from declining oak stands. Eur. J. For Pathol. 26, 253–272. doi: 10.1111/j.1439-0329.1996.tb00846.x
Jung, T., and Blaschke, M. (2004). Phytophthora root and collar rot of alders in Bavaria: distribution, modes of spread and possible management strategies. Plant Pathol. 53, 197–208. doi: 10.1111/j.0032-0862.2004.00957.x
Jung, T., and Blaschke, M. (2006). “Phytophthora dieback of alders in Bavaria: distribution, pathways and management strategies,” in Progress in Research on Phytophthora Diseases of Forest Trees, eds. C. M. Brasier, T. Jung, W. Osswald (Hampshire, UK: Forest Research, Farnham), 61–66.
Jung, T., and Burgess, T. I. (2009). Re-evaluation of Phytophthora citricola isolates from multiple woody hosts in Europe and North America reveals a new species, Phytophthora plurivora sp. nov. Persoonia 22, 95–110. doi: 10.3767/003158509X442612
Jung, T., Cooke, D. E. L., Blaschke, H., Duncan, J. M., and Osswald, W. (1999). Phytophthora quercina sp. nov., causing root rot of European oaks. Mycol. Res. 103, 785–798. doi: 10.1017/S0953756298007734
Jung, T., Horta Jung, M., Webber, J. F., Kageyama, K., Hieno, A., Masuya, H., et al. (2021). The destructive tree pathogen Phytophthora ramorum originates from the laurosilva forests of East Asia. J. Fungi 7:226. doi: 10.3390/jof7030226
Jung, T., La Spada, F., Pane, A., Aloi, F., Evoli, M., Horta Jung, M., Scanu, B., et al. (2019). Diversity and distribution of Phytophthora species in protected natural areas in Sicily. Forests 10:259. doi: 10.3390/f10030259
Jung, T., Milenković, I., Balci, Y., Janoušek, J., Kudláček, T., Nagy, Z. Á., et al. (2024). Worldwide forest surveys reveal forty-three new species in Phytophthora major Clade 2 with fundamental implications for the evolution and biogeography of the genus and global plant biosecurity. Stud. Mycol. 107, 251–388. doi: 10.3114/sim.2024.107.04
Jung, T., Milenković, I., Corcobado, T., Májek, T., Janoušek, J., Kudláček, T., et al. (2022). Extensive morphological and behavioural diversity among fourteen new and seven described species in Phytophthora Clade 10 and its evolutionary implications. Persoonia 49, 1–57. doi: 10.3767/persoonia.2022.49.01
Jung, T., and Nechwatal, J. (2008). Phytophthora gallica sp. nov., a new species from rhizosphere soil of declining oak and reed stands in France and Germany. Mycol. Res. 112, 1195–1205. doi: 10.1016/j.mycres.2008.04.007
Jung, T., Nechwatal, J., Cooke, D. E. L., Hartmann, G., Blaschke, M., Oßwald, W. F., et al. (2003). Phytophthora pseudosyringae sp. nov., a new species causing root and collar rot of deciduous tree species in Europe. Mycol. Res. 107, 772–789. doi: 10.1017/S0953756203008074
Jung, T., Orlikowski, L., Henricot, B., Abad-Campos, P., Aday, A. G., Aguín Casal, O., et al. (2016). Widespread Phytophthora infestations in European nurseries put forest, semi-natural and horticultural ecosystems at high risk of Phytophthora diseases. Forest Pathol. 46, 134–163. doi: 10.1111/efp.12239
Jung, T., Pérez-Sierra, A., Durán, A., Jung, M. H., Balci, Y., and Scanu, B. (2018). Canker and decline diseases caused by soil- and airborne Phytophthora species in forests and woodlands. Persoonia 40, 182–220. doi: 10.3767/persoonia.2018.40.08
Jung, T., Vettraino, A. M., Cech, T. L., and Vannini, A. (2013). “The impact of invasive Phytophthora species on European forests,” in Phytophthora: A global perspective, ed. K. Lamour (Wallingford, UK: CABI), 146–158. doi: 10.1079/9781780640938.0146
Jwa, N. S., and Walling, L. L. (2001). Influence of elevated CO2 concentration on disease development in tomato. New Phytol. 149, 509–518. doi: 10.1046/j.1469-8137.2001.00063.x
Kanoun-Boulé, M., Vasconcelos, T., Gaspar, J., Vieira, S., Dias-Ferreira, C., and Husson, C. (2016). Phytophthora × alni and Phytophthora lacustris associated with common alder decline in Central Portugal. For. Path. 46, 174–176. doi: 10.1111/efp.12273
Kazan, K. (2018). Plant-biotic interactions under elevated CO2: a molecular perspective. EEB 153, 249–261. doi: 10.1016/j.envexpbot.2018.06.005
Kroon, L. P. N. M., Bakker, F. T., Van Den Bosch, G. B. M., Bonants, P. J. M., and Flier, W. G. (2004). Phylogenetic analysis of Phytophthora species based on mitochondrial and nuclear DNA sequences. Fungal Genet. Biol. 41, 766–782. doi: 10.1016/j.fgb.2004.03.007
Kupper, P., Sellin, A., Klimánková, Z., Pokorný, R., and Puértolas, J. (2006). Water relations in Norway spruce trees growing at ambient and elevated CO2 concentrations. Biol. Plant. 50, 603–609. doi: 10.1007/s10535-006-0095-0
Madden, L. V., Hughes, G., and van den Bosch, F. (2007). The Study of Plant Disease Epidemics. St. Paul, MN: APS Press.
Májek, T., Schwanda, K., and Cech, T. L. (2019). Decline of alpine green alder (Alnus viridis) and relation to Phytophthora species, preliminary results. 9th Meeting of IUFRO Working Party 7.02.09 (Phytophthora in Forests and Natural Ecosystems), La Maddalena, Sardinia, Italy.
Marques Gomes, I., Neno, J., Jansson, R., Corcobado, T., Cech, T., Laurent, Y., et al. (2019). Responses of Alnus glutinosa populations to different inoculation methods of Phytophthora × alni. 9th Meeting of IUFRO Working Party 7.02.09 (Phytophthora in Forests and Natural Ecosystems), La Maddalena, Sardinia, Italy.
McElrone, A. J., Reid, C. D., Hoye, K. A., Hart, E., and Jackson, R. B. (2005). Elevated CO2 reduces disease incidence and severity of a red maple fungal pathogen via changes in host physiology and leaf chemistry. Glob. Chang. Biol. 11, 1828–1836. doi: 10.1111/j.1365-2486.2005.001015.x
Meena, M., Prasad, V., Zehra, A., Gupta, V. K., and Upadhyay, R. S. (2015). Mannitol metabolism during pathogenic fungal–host interactions under stressed conditions. Front. Microbiol. 6:1019. doi: 10.3389/fmicb.2015.01019
Milanović, S., Milenković, I., Dobrosavljević, J., Popović, M., Solla, A., Tomšovský, M., et al. (2020). Growth rates of Lymantria dispar larvae and Quercus robur seedlings at elevated CO2 concentration and Phytophthora plurivora infection. Forests 11, 1–14. doi: 10.3390/f11101059
Milenković, I., Keča, N., Karadžić, D., Radulović, Z., Nowakowska, J. A., Oszako, T., et al. (2018). Isolation and pathogenicity of Phytophthora species from poplar plantations in Serbia. Forests 9, 1–19. doi: 10.3390/f9060330
Moore, T. R., Matthews, H. D., Simmons, C., and Leduc, M. (2015). Quantifying changes in extreme weather events in response to warmer global temperature. Atmosphere-ocean 53, 412–425. doi: 10.1080/07055900.2015.1077099
Mrázková, M., Černý, K., Tomšovský, M., Strnadová, V., Gregorová, B., Holub, V., et al. (2013). Occurrence of Phytophthora multivora and Phytophthora plurivora in the Czech Republic. Plant Prot. Sci. 49, 155–164. doi: 10.17221/74/2012-PPS
Müller, M. (2021). Foes or friends: ABA and ethylene interaction under abiotic stress. Plants 10:448. doi: 10.3390/plants10030448
Nagy, Z. Á., Bakonyi, J., and Érsek, T. (2003). Standard and Swedish variant types of the hybrid alder Phytophthora attacking alder in Hungary. Pest Manag. Sci. 59, 484–492. doi: 10.1002/ps.681
Navarro, B. S., Sims, L., and Hansen, E. (2015). Pathogenicity to alder of Phytophthora species from riparian ecosystems in western Oregon. Forest Pathol. 45, 358–366. doi: 10.1111/efp.12175
Osswald, W., Fleischmann, F., Rigling, D., Coelho, A. C., Cravador, A., Diez, J., et al. (2014). Strategies of attack and defence in woody plant-Phytophthora interactions. For. Pathol. 44, 169–190. doi: 10.1111/efp.12096
Oszako, T., Sikora, K., Borys, M., Kubiak, K. A., and Tkaczyk, M. (2016). Phytophthora quercina infections in elevated CO2 concentrations. Folia For. Pol. A 58, 131–141. doi: 10.1515/ffp-2016-0015
Oszako T. Voitka D. Tkaczyk M. Keca N. Belbahri L. and. Nowakowska J. A. (2018). Assessment of interactions between defoliation and Phytophthora plurivora stem infections of birch seedlings. For. Chron. 94, 140–146. doi: 10.5558/tfc2018-021
Oxborough, K. (2004). Imaging of chlorophyll a fluorescence: theoretical and practical aspects of an emerging technique for the monitoring of photosynthetic performance. J. Exp. Bot. 55, 1195–1205. doi: 10.1093/jxb/erh145
Percy, K. E., Awmack, C. S., Lindroth, R. L., Kubiske, M. E., Kopper, B. J., Isebrands, J. G., et al. (2002). Altered performance of forest pests under atmospheres enriched by CO2 and O3. Nature 420, 403–407. doi: 10.1038/nature01028
Pfanz, H., Mombour, J., Wittmann, C., Fleischmann, F., and Oßwald, W. (2015). Chlorophyll fluorescence for visualizing the spatial and temporal spread of Phytophthora alni subsp. alni in alder bark tissue. Plant Pathol. 64, 467–477. doi: 10.1111/ppa.12256
Pritchard, S. G., Rogers, H. H., Prior, S. A., and Peterson, C. M. (1999). Elevated CO2 and plant structure: a review. Glob. Chang. Biol. 5, 807–837. doi: 10.1046/j.1365-2486.1999.00268.x
Puig, A. S., Ali, S., Strem, M., Sicher, R., Gutierrez, O. A., and Bailey, B. A. (2018). The differential influence of temperature on Phytophthora megakarya and Phytophthora palmivora pod lesion expansion, mycelia growth, gene expression, and metabolite profiles. Physiol. Mol. Plant Pathol. 102, 95–112. doi: 10.1016/j.pmpp.2017.12.002
R development CORE team (2021). R: A language and environment for statistical computing R Foundation for Statistical Computing. Vienna, Austria.
Redondo, M. A., Boberg, J., and Olsson, C. H. B. (2015). Winter conditions correlate with Phytophthora alni subspecies distribution in Southern Sweden. Phytopathol. 105, 1191–1197. doi: 10.1094/PHYTO-01-15-0020-R
Robin, C., Capron, G., and Desprez-Loustau, M. L. (2001). Root infection by Phytophthora cinnamomi in seedlings of three oak species. Plant Pathol. 50:708–716. doi: 10.1046/j.1365-3059.2001.00643.x
Romportl, D., Chumanová, E., Havrdová, L., Pešková, V., and Černý, K. (2016). Potential risk of occurrence of Phytophthora alni in forests of the Czech Republic. J. Maps 12, 280–284. doi: 10.1080/17445647.2016.1198996
Roth, S., Lindroth, R. L., Volin, J. C., and Kruger, E. L. (1998). Enriched atmospheric CO2 and defoliation: Effects on tree chemistry and insect performance. Glob. Chang. Biol. 4, 419–430. doi: 10.1046/j.1365-2486.1998.00164.x
Running, S. W., and Nemani, R. R. (1991). Regional hydrologic and carbon balance responses of forests resulting from potential climate change. Clim. Chan. 19, 349–368. doi: 10.1007/BF00151173
Rytkönen, A., Lilja, A., Vercauteren, A., Sirki,ä, S., Parikka, P., Soukainen, M., et al. (2012). Identity and potential pathogenicity of Phytophthora species found on symptomatic Rhododendron plants in a Finnish nursery. Can. J. Plant Pathol. 34, 255–267. doi: 10.1080/07060661.2012.686455
Santini, A., Barzanti, G. P., and Capretti, P. (2003). Susceptibility of some mesophilic hardwoods to alder Phytophthora. J. Phytopathol. 151, 406–410. doi: 10.1046/j.1439-0434.2003.00739.x
Schumacher, J., Sindy, L., Grundmann, B. M., and Roloff, A. (2006). New alder disease in Spreewald biosphere reserve – causes and incidental factors of an epidemic. Nachrichtenbl. Deut. Pflanzenschutzd. 58, 141–147.
Smith, F., and Luna, E. (2023). Elevated atmospheric carbon dioxide and plant immunity to fungal pathogens: do the risks outweigh the benefits? Biochem. J. 480, 1791–1804. doi: 10.1042/BCJ20230152
Solla, A., Pérez-Sierra, A., Corcobado, T., Haque, M. M., Diez, J. J., and Jung, T. (2010). Phytophthora alni on Alnus glutinosa reported for the first time in Spain. Plant Pathol. 59, 798–798. doi: 10.1111/j.1365-3059.2009.02254.x
Štěpánková, P., Černý, K., Strnadová, V., Hanáček, P., and Tomšovský, M. (2013). Identification of Phytophthora alni subspecies in riparian stands in the Czech Republic. Plant Prot. Sci. 49, S3–S10. doi: 10.17221/41/2013-PPS
Štochlová, P., Novotná, K., and Černý, K. (2016). Variation in Alnus glutinosa susceptibility to Phytophthora × alni infection and its geographic pattern in the Czech Republic. For. Pathol. 46, 3–10. doi: 10.1111/efp.12205
Streito, J.-C., Legrand, P.h., Tabary, F., and Jarnouen de Villartay, G. (2002). Phytophthora disease of alder (Alnus glutinosa) in France: investigations between 1995 and 1999. For. Pathol. 32, 179–191. doi: 10.1046/j.1439-0329.2002.00282.x
Thoirain, B., Husson, C., and Marçais, B. (2007). Risk factors for the Phytophthora-induced decline of alder in northeastern France. Phytopathology 97, 99–105. doi: 10.1094/PHYTO-97-0099
Tkaczyk, M., Sikora, K., Nowakowska, J. A., Kubiak, K., and Oszako, T. (2014). Effect of CO2 enhancement on beech (Fagus sylvatica L.) seedling root rot due to Phytophthora plurivora and Phytophthora cactorum. Folia For. Pol. A 56, 149–156. doi: 10.2478/ffp-2014-0016
Tkaczyk, M., Szmidla, H., and Sikora, K. (2023). Occurrence of Phytophthora species in the rhizosphere of dying black alder Alnus glutinosa in central and northeastern Poland. Sylwan 167:2023040. doi: 10.1111/efp.12800
Van Vuuren, D. P., Edmonds, J., Kainuma, M., Riahi, K., Thomson, A., Hibbard, K., et al. (2011). The representative concentration pathways: an overview. Clim. Change 109, 5–31. doi: 10.1007/s10584-011-0148-z
Zamora-Ballesteros, C., Haque, M. M. U., Diez, J. J., and Martín-García, J. (2017). Pathogenicity of Phytophthora alni complex and P. plurivora in Alnus glutinosa seedlings. For. Pathol. 47, 1–8. doi: 10.1111/efp.12299
Keywords: alder dieback, underbark inoculation, elevated CO2 concentration, sugars, phenolics, photosynthesis rate
Citation: Macháčová M, Tomášková I, Corcobado T, Nagy Z, Milanović S, Janoušek J, Pešková V, Čepl J, Gezan S, Nakládal O, Zumr V, Kalyniukova A, Milenković I and Jung T (2024) Response of Alnus glutinosa to Phytophthora bark infections at ambient and elevated CO2 levels. Front. For. Glob. Change 7:1379791. doi: 10.3389/ffgc.2024.1379791
Received: 31 January 2024; Accepted: 26 March 2024;
Published: 17 April 2024.
Edited by:
Milica Zlatkovic, University of Novi Sad, SerbiaReviewed by:
Bruno Scanu, University of Sassari, ItalyCourtney Leisner, Virginia Tech, United States
Mario Riolo, University of Catania, Italy
Copyright © 2024 Macháčová, Tomášková, Corcobado, Nagy, Milanović, Janoušek, Pešková, Čepl, Gezan, Nakládal, Zumr, Kalyniukova, Milenković and Jung. This is an open-access article distributed under the terms of the Creative Commons Attribution License (CC BY). The use, distribution or reproduction in other forums is permitted, provided the original author(s) and the copyright owner(s) are credited and that the original publication in this journal is cited, in accordance with accepted academic practice. No use, distribution or reproduction is permitted which does not comply with these terms.
*Correspondence: Markéta Macháčová, machacovam@fld.czu.cz; Thomas Jung, thomas.jung@mendelu.cz
†ORCID: Markéta Macháčová orcid.org/0000-0002-1476-834X
Ivana Tomášková orcid.org/0000-0001-6219-5980
Tamara Corcobado orcid.org/0000-0001-5762-4728
Zoltan Nagy orcid.org/0000-0002-8947-6448
Slobodan Milanović orcid.org/0000-0002-8260-999X
Vítězslava Pešková orcid.org/0000-0002-1990-6262
Jaroslav Čepl orcid.org/0000-0002-2057-3442
Salvador Gezan orcid.org/0000-0002-5025-2658
Oto Nakládal orcid.org/0000-0001-8427-3708
Václav Zumr orcid.org/0000-0002-9153-0597
Alina Kalyniukova orcid.org/0000-0003-2090-1634
Ivan Milenković orcid.org/0000-0003-2792-0221
Thomas Jung orcid.org/0000-0003-2034-0718