Corrigendum: A live fuel moisture climatology in California
 Jack R. Drucker
 Angel Farguell
 Craig B. Clements
  Adam K. Kochanski
- Wildfire Interdisciplinary Research Center, Department of Meteorology, San Jose State University, San Jose, CA, United States
A corrigendum on
A live fuel moisture climatology in California
by Drucker, J. R., Farguell, A., Clements, C. B., and Kochanski, A. K. (2023). Front. For. Glob. Change 6:1203536. doi: 10.3389/ffgc.2023.1203536
In the published article, there was an error in Figures 4, 5 as published. The plots originally appearing in Figure 4 should be interchanged with those in Figure 5, and vice versa. The corrected Figure 4 and its caption “Figure 4. The general (annual average) (black dashed line), maximum (green dashed line), and minimum (red dashed line) LFMC trends for the (A) Bay Area, (B) Central Coast, and (C) South Coast regions. The differences in the time ranges stem from the length of the data record which varies across the regions” and the corrected Figure 5 along with its caption “Figure 5. The general (annual average) (black dashed line), maximum (green dashed line), and minimum (red dashed line) LFMC trends for the (A) Klamath, (B) MODOC, and (C) Sierra Nevada regions. The differences in the time ranges stem from the length of the data record which varies across the regions”, appear below.
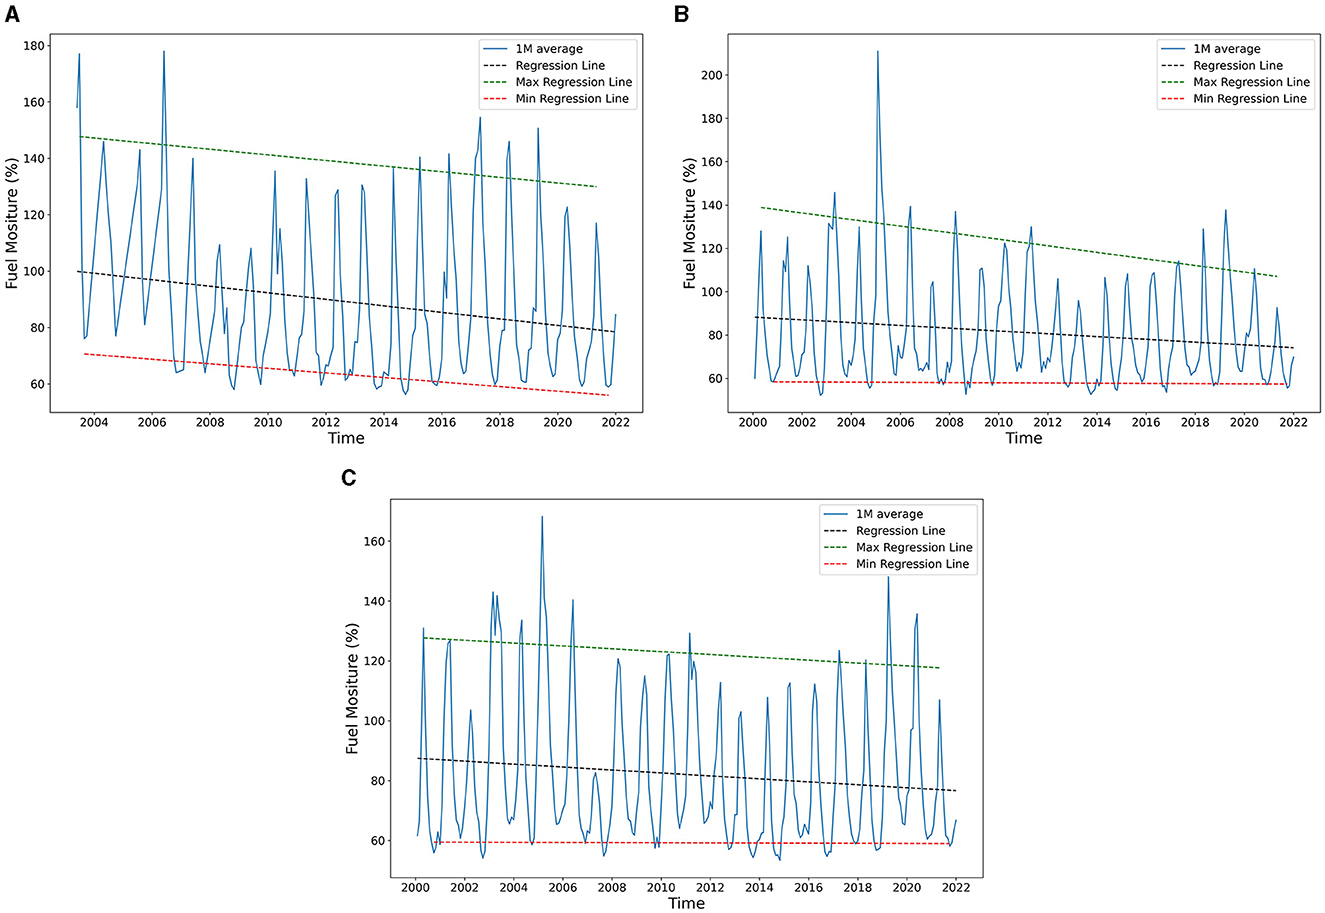
Figure 4. The general (annual average) (black dashed line), maximum (green dashed line), and minimum (red dashed line) LFMC trends for the (A) Bay Area, (B) Central Coast, and (C) South Coast regions. The differences in the time ranges stem from the length of the data record which varies across the regions.
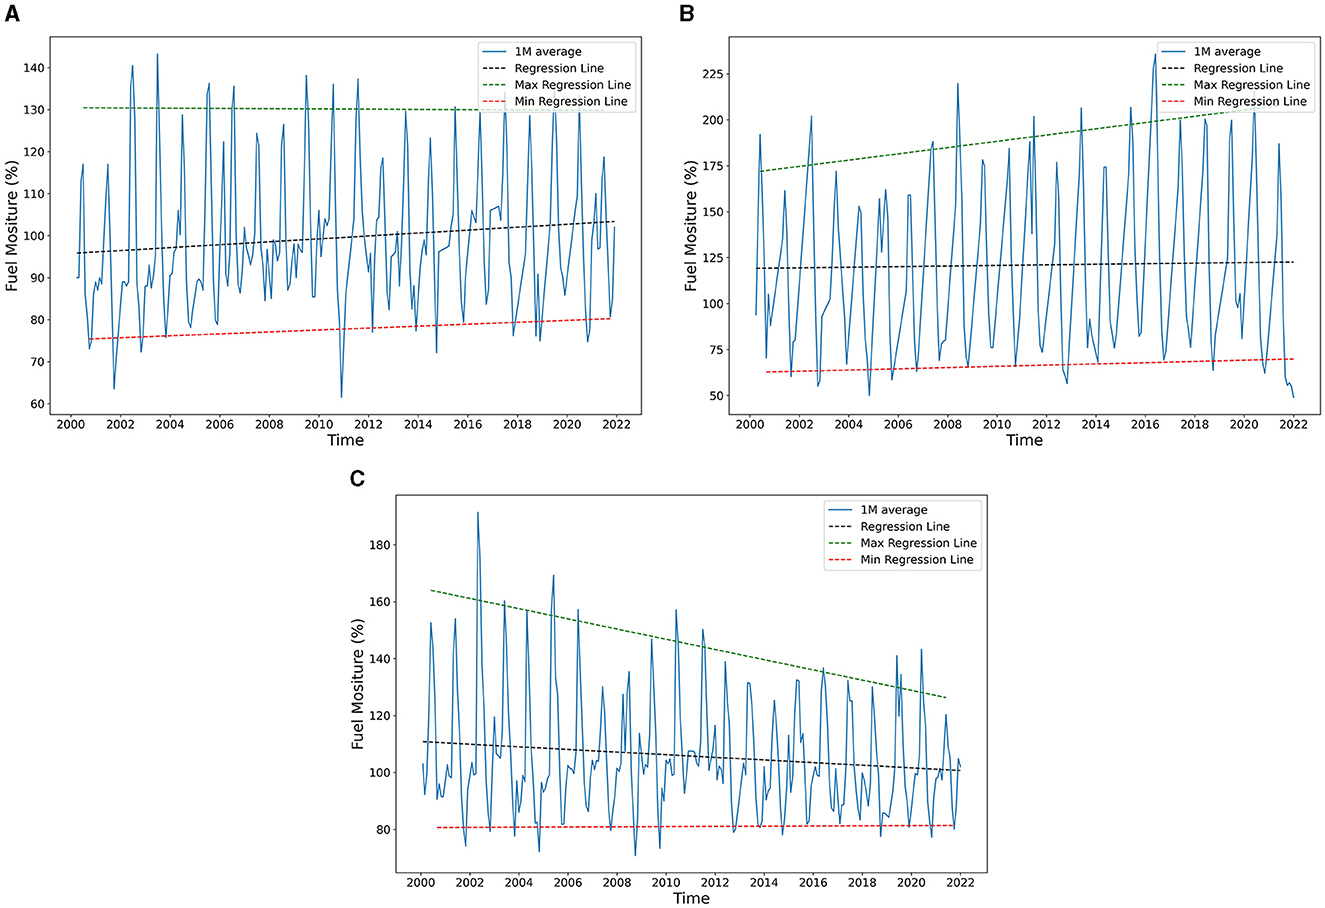
Figure 5. The general (annual average) (black dashed line), maximum (green dashed line), and minimum (red dashed line) LFMC trends for the (A) Klamath, (B) MODOC, and (C) Sierra Nevada regions. The differences in the time ranges stem from the length of the data record which varies across the regions.
In addition, there was an error in the Introduction, Paragraph 2. “Fuel Moisture Repository is divided into two categories” should be “FMC is divided into two categories”. The corrected paragraph is included below.
FMC is divided into two categories, dead fuel moisture content (DFMC), and live fuel moisture content (LFMC). Dead fuels are mainly affected by meteorological conditions, with their drying and moistening rates depending on the fuel size class corresponding to the time lag typically defined as 1 h, 10 h, 100 h, and 1,000 h for fuels in sizes ranging from less than 0.25 inch to more than 3 inches in diameter. While the DFMC can be calculated using meteorological parameters (van Wagner, 1987; Nelson, 2000; Mandel et al., 2012, Vejmelka et al., 2016), due to the more complex dynamics of live fuels, estimating their moisture content based on meteorological conditions alone is problematic. That is because live fuels are also affected by climate trends, plant physiology, soil moisture, and evapotranspiration (Pollet and Brown, 2007; Qi et al., 2012; Matthews, 2014). An example of this complexity can be seen when plants close their stomata to reduce moisture loss via the evapotranspiration process, they reduce their dependence on environmental conditions (van der Molen et al., 2011). The LFMC can vary, both spatially and temporally (Danson and Bowyer, 2004) differently than DFMC and be less dependent on short-term weather conditions (Viegas et al., 2001). The LFMC can be assessed by collecting fuel samples, computing their water content by subtracting the oven dry weight from the wet weight, and normalizing the computed water content by the dry mass. This procedure requires destructive sampling and is very labor intensive. That is why at most fuel moisture content of live fuels is sampled only biweekly or monthly. Also, since the drying process of the fuels takes 24 h, unlike dead fuels which may be sampled automatically by dead fuel moisture sensors reporting near-real time data to weather stations, live fuel moisture data are available at much lower frequency and with significant delay.
The authors apologize for these errors and state that this does not change the scientific conclusions of the article in any way. The original article has been updated.
Publisher's note
All claims expressed in this article are solely those of the authors and do not necessarily represent those of their affiliated organizations, or those of the publisher, the editors and the reviewers. Any product that may be evaluated in this article, or claim that may be made by its manufacturer, is not guaranteed or endorsed by the publisher.
Keywords: chaparral, drought, fire behavior, fuel moisture content, wildfire, California
Citation: Drucker JR, Farguell A, Clements CB and Kochanski AK (2024) Corrigendum: A live fuel moisture climatology in California. Front. For. Glob. Change 7:1418693. doi: 10.3389/ffgc.2024.1418693
Received: 16 April 2024; Accepted: 17 April 2024;
Published: 30 April 2024.
Approved by:
Frontiers Editorial Office, Frontiers Media SA, SwitzerlandCopyright © 2024 Drucker, Farguell, Clements and Kochanski. This is an open-access article distributed under the terms of the Creative Commons Attribution License (CC BY). The use, distribution or reproduction in other forums is permitted, provided the original author(s) and the copyright owner(s) are credited and that the original publication in this journal is cited, in accordance with accepted academic practice. No use, distribution or reproduction is permitted which does not comply with these terms.
*Correspondence: Adam K. Kochanski, adam.kochanski@sjsu.edu